Embed Size (px)
Citation preview


Assessment in 2014 was the basis of the sales surtax plan

Highlighted areas received NO funding from the sales surtax
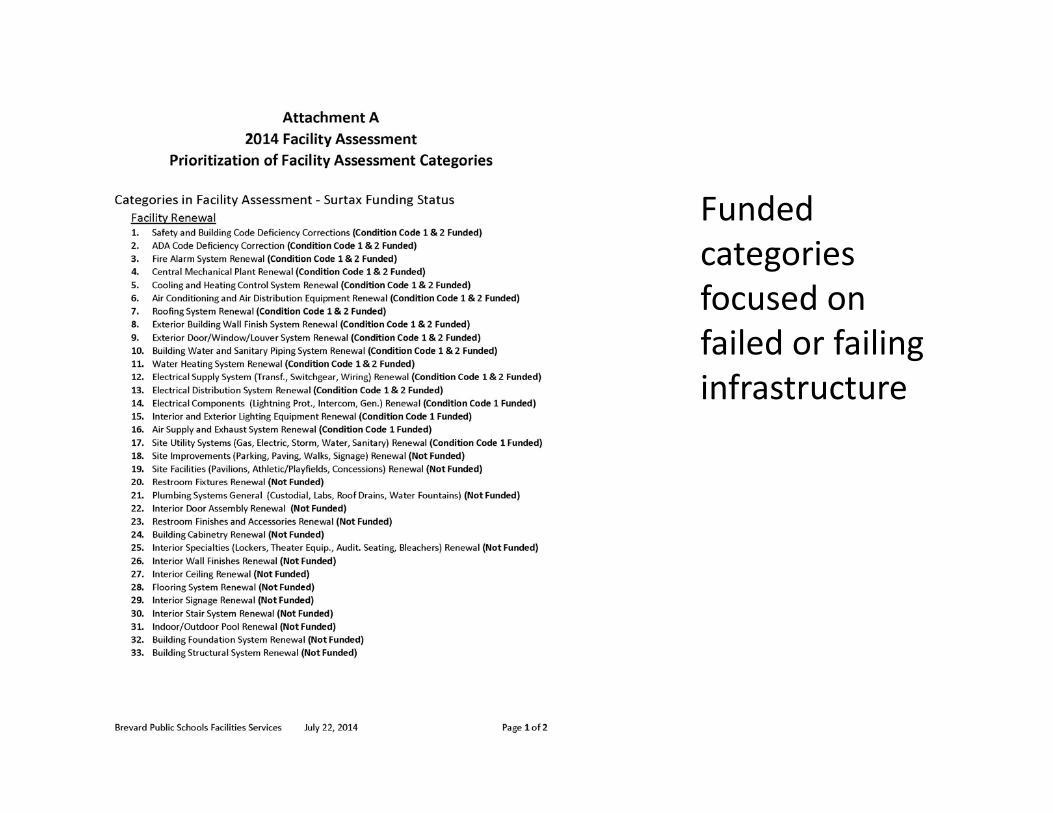
Funded categories focused on failed or failing infrastructure
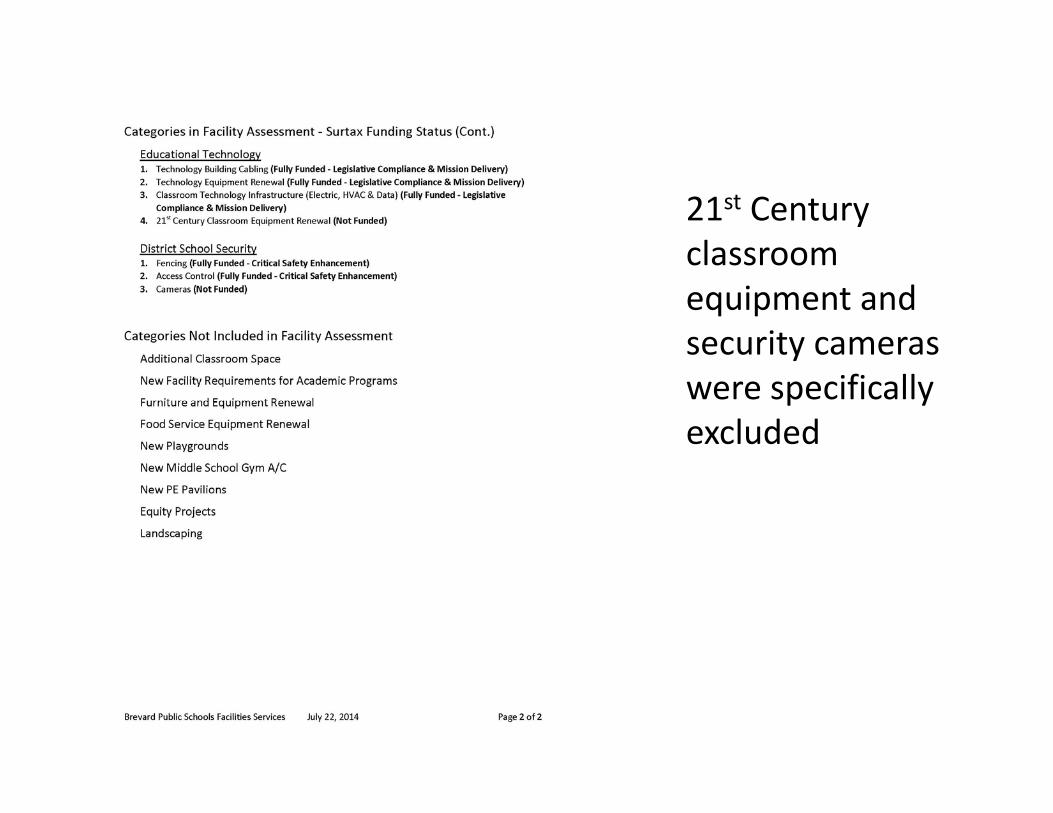
21st Century classroom equipment and security cameras were specifically excluded

Security framework changed after the referendum
Only about 26% of identified needs were funded

• The 2014 Sales Surtax Program made significant progress ‐ BUT
• Capital investment needs are ongoing not a point in time
• Two focal points –• Reduce backlog• Preventive not just reactive maintenance!

9

Why is This Important?• Connection to learning
• Facilities and educational technology matter to teaching and learning
• Improve reliability of building systems• Preserving our assets – changing the paradigm
• Fixing only failures is at the expense of preserving the good
• Replacing/repairing at failure significantly more expensive than preventive maintenance
• Investment in the community• Since 2015 – almost $200 million has been locally invested in construction
Approach - Overview• 2014 resources first, then renewal
• Some overlap, some differences• Data‐driven approach
• Security• Educational Technology• Facilities• Classrooms• Athletics• Playgrounds
• Prioritized safety, security, learning environment and asset preservation
Approach – Revenue• 2014 Sales Surtax
• Projecting about $67 million over the $198 million program target (about 90% of 2019 revenues) – through Feb. 2021
• Allocated $37 million through ICOC/School Board• $25 million – facility renewal• $2 million – educational technology• $10 million ‐ security
• About $30 million left to allocate• Considered this first in allocating to eligible work in each group• Ready to recommend $18 million in projects to ICOC in August• Remaining $12 million
• Buffer against revenue decline or increased project costs
• Additional resources may be available as all projects conclude• Estimating $3‐5 million• Planning smaller projects at schools with resources remaining
Review 2014 Sales Surtax Allocation PlanWorkshop Book – Page 2
Approach – Revenue
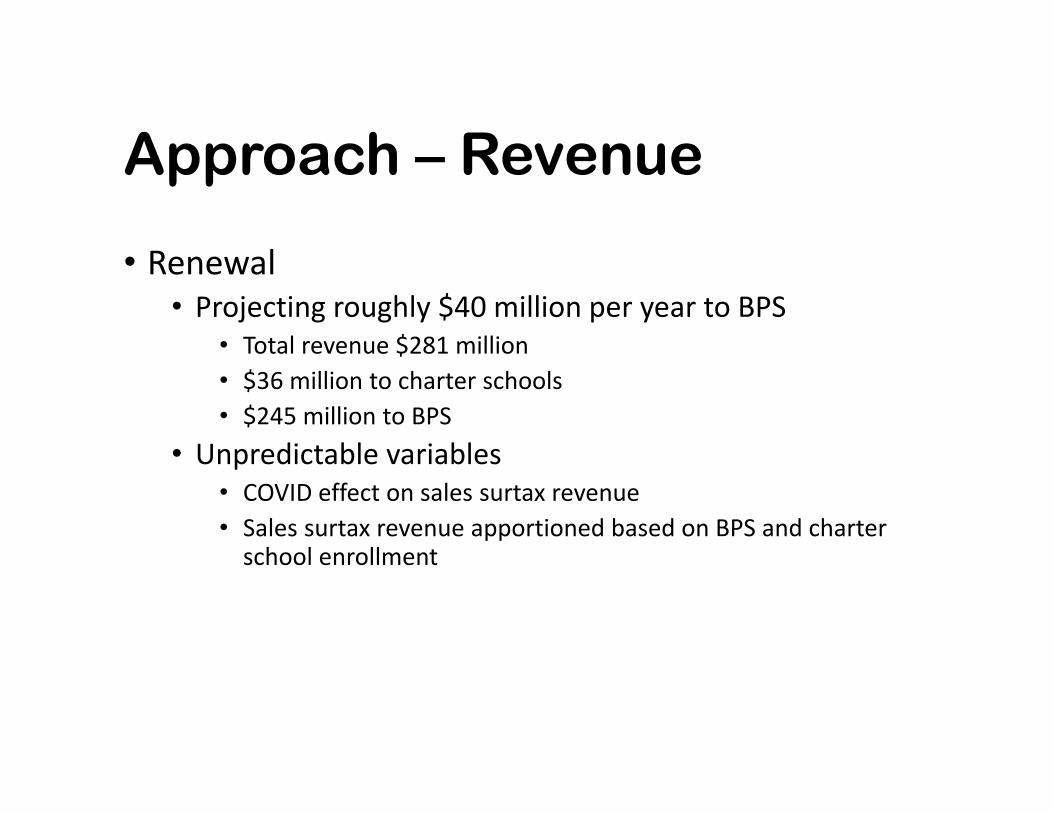
• Renewal• Projecting roughly $40 million per year to BPS
• Total revenue $281 million• $36 million to charter schools• $245 million to BPS
• Unpredictable variables• COVID effect on sales surtax revenue• Sales surtax revenue apportioned based on BPS and charter school enrollment

Review Sales Surtax Renewal Plan ProjectionsWorkshop Book – Page 3

Approach – Overview
• Plan based on $40 million per year revenue to BPS• Proposed program totals $221 million with $19 million unallocated
• Implementation planned by year• More revenue – move faster• Less revenue – move slower
• Design work can proceed to have shovel‐ready projects
• More elements can be funded with 2014 sales surtax if resources are available
Approach – Security
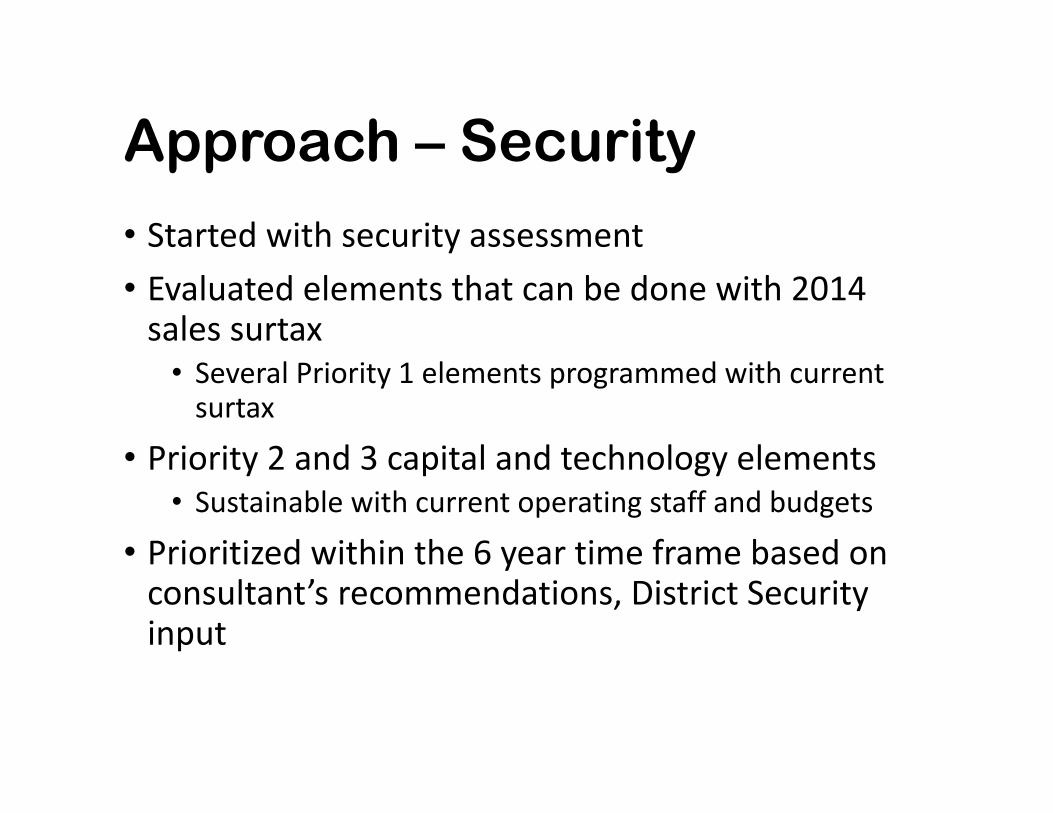
• Started with security assessment• Evaluated elements that can be done with 2014 sales surtax• Several Priority 1 elements programmed with current surtax
• Priority 2 and 3 capital and technology elements• Sustainable with current operating staff and budgets
• Prioritized within the 6 year time frame based on consultant’s recommendations, District Security input

Approach – Educational Technology
• Provided estimated targets to educational technology for current surtax and renewal
• Educational technology team provided recommended use of funds by school and a few District‐wide projects
Approach – Facilities
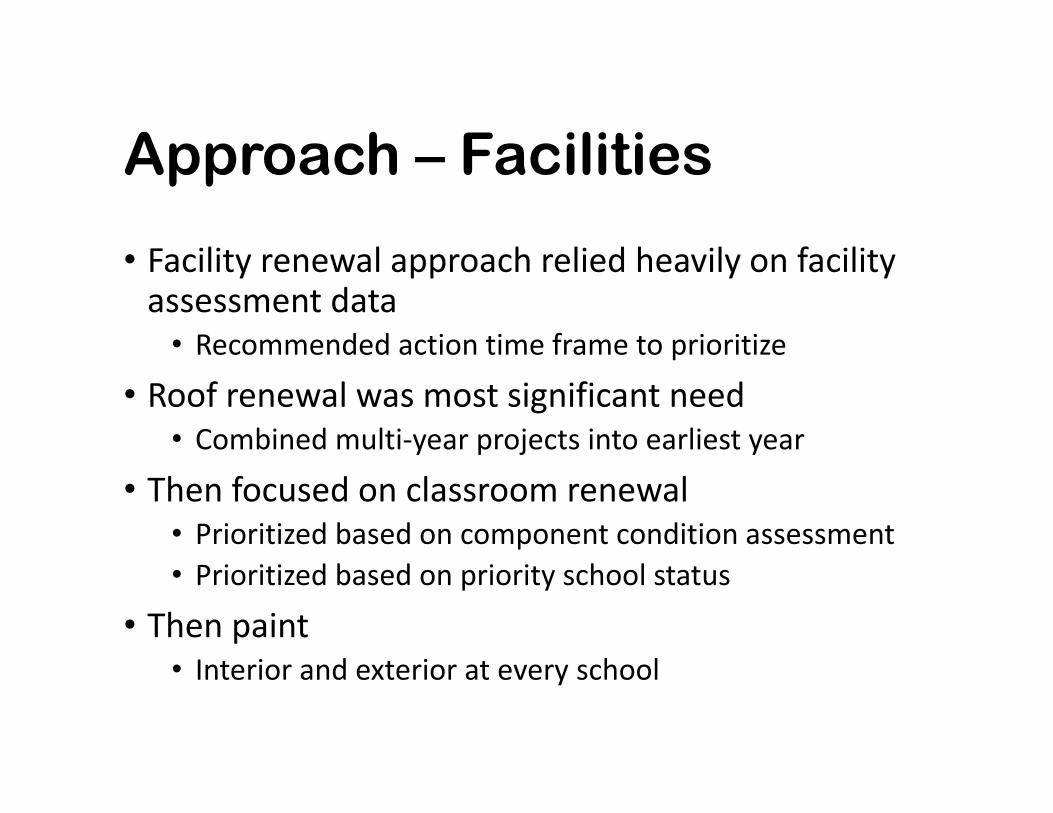
• Facility renewal approach relied heavily on facility assessment data• Recommended action time frame to prioritize
• Roof renewal was most significant need• Combined multi‐year projects into earliest year
• Then focused on classroom renewal• Prioritized based on component condition assessment• Prioritized based on priority school status
• Then paint• Interior and exterior at every school
Approach – Facilities
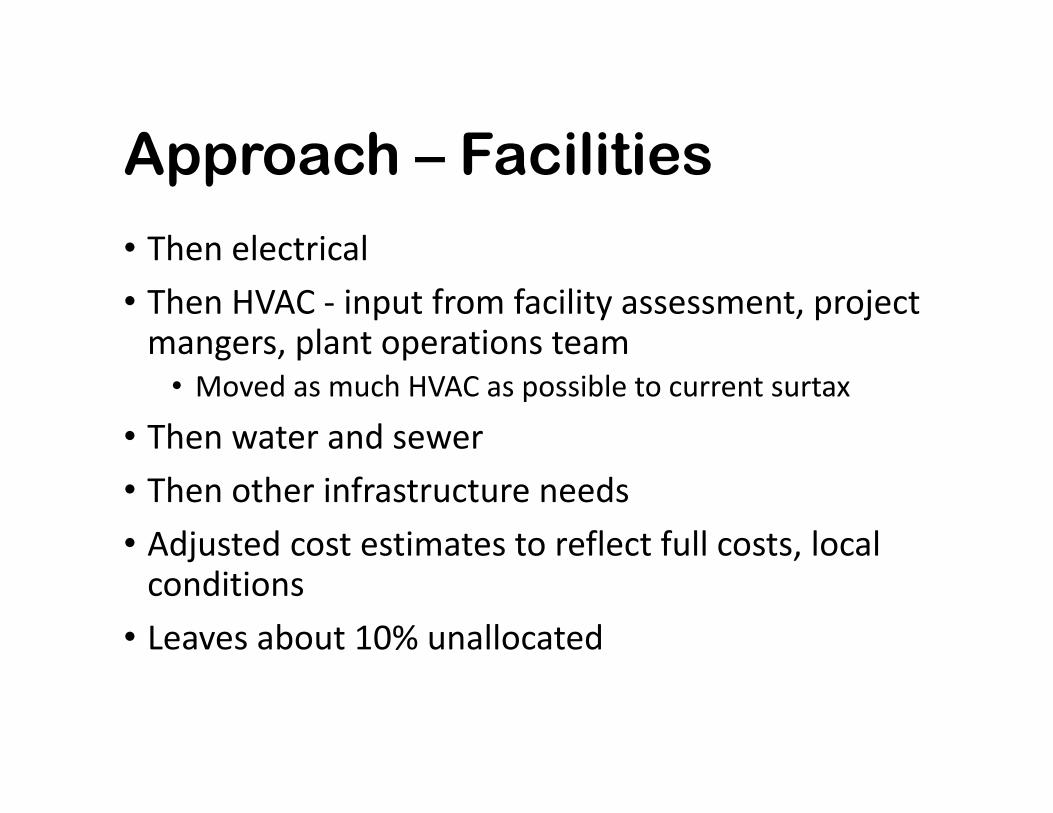
• Then electrical • Then HVAC ‐ input from facility assessment, project mangers, plant operations team• Moved as much HVAC as possible to current surtax
• Then water and sewer• Then other infrastructure needs• Adjusted cost estimates to reflect full costs, local conditions
• Leaves about 10% unallocated

Review Sales Surtax Renewal PlanFinancial Summary Summary by Group
Summarized by FacilityFacility Renewal Detail Workshop Book – Pages 4‐22

Recommended Allocation*
Roof Renewal 66,657,851$ 30.14%Educational Technology 34,823,768$ 15.75%Security 27,616,610$ 12.49%Classroom Renewal 23,419,221$ 10.59%Electrical Renewal 21,269,926$ 9.62%HVAC Renewal 16,056,717$ 7.26%Water and Sewer System Renewal 11,053,667$ 5.00%Paint ‐ Interior & Exterior 9,000,000$ 4.07%Athletic Facility Renewal 3,150,000$ 1.42%Playground Renewal 2,560,000$ 1.16%Building System Renewal 1,808,111$ 0.82%Structural Pavilion Renewal 1,275,000$ 0.58%Safety ‐ Gym Bleachers Renewal 1,120,000$ 0.51%Safety ‐ Stadium Bleachers 800,000$ 0.36%Auditorium Renewal 373,657$ 0.17%Pool Equipment Room Renewal 150,000$ 0.07%
Grand Total 221,134,527$ 100.00%
*Renewal Funds Only

Facility Assessment Summary
• Assessment reported direct costs
• Factored up to account for all project costs• Roof x 1.5• Electrical x 1.5• Plumbing x 3
• Some items – “study to evaluate” – does not reflect cost to fix
Discipline/Priority1 ‐ Currently Critical (1
Year)2 ‐ Potentially Critical
(2 Years)3 ‐ Necessary ‐ Not Yet
Critical (3 ‐ 5 Years)4 ‐ Recommended (6 ‐
11 Years)Grand Total
ADA Assessement Items 783,553$ 282,851$ 12,470$ 1,078,874$ Architectural 30,090,812$ 52,874,791$ 112,091,602$ 119,526,177$ 314,583,382$ Civil 1,047,955$ 1,977,359$ 10,580,274$ 6,562,697$ 20,168,285$ Communications 156,687$ 195,269$ 8,669,451$ 9,021,407$ Electrical 5,497,164$ 7,645,939$ 76,035,616$ 11,590,547$ 100,769,267$ Fire Protection 225,196$ 150,771$ 42,312$ 162,230$ 580,509$ Mechanical 7,463,029$ 1,913,053$ 27,962,300$ 22,589,012$ 59,927,394$ Plumbing 894,971$ 1,266,852$ 3,982,297$ 2,084,282$ 8,228,401$ Safety and Security 118,411$ 1,377,440$ 7,927,769$ 11,997,131$ 21,420,751$ Structural 678,664$ 2,625,764$ 1,828,179$ 318,037$ 5,450,643$
Grand Total 46,016,202$ 70,772,209$ 240,928,467$ 183,512,034$ 541,228,913$

Source ‐ State of Our Schools ‐ 21st Century School Fund; U.S. Green Building Council (USGBC), The Center for Green Schools; National Council on School Facilities (NCSF) ‐ 2016

Industry Standards*• Current Replacement Value (CRV) All Facilities –Over $2 Billion• 3% of CRV annual maintenance and operation
• $60 million• 2% of CRV annual facility renewal
• $40 million• 1% of CRV annual as needed alterations
• $20 million• 1% of CRV annual reduction of deferred maintenance
• $20 million
*Goal is to move closer to industry standards with time
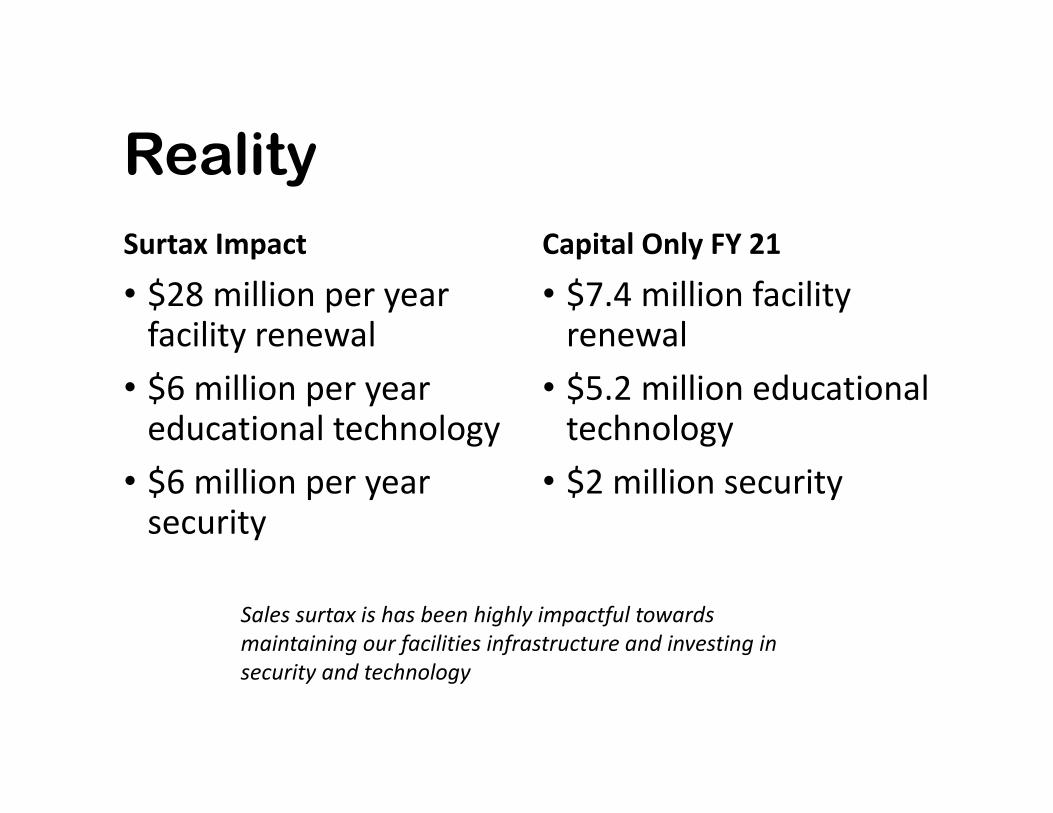
RealitySurtax Impact
• $28 million per year facility renewal
• $6 million per year educational technology
• $6 million per year security
Capital Only FY 21
• $7.4 million facility renewal
• $5.2 million educational technology
• $2 million security
Sales surtax is has been highly impactful towards maintaining our facilities infrastructure and investing in security and technology


DeLaura Science Lab

Kennedy Science Lab

Jackson Science Lab

Creel Cabinets
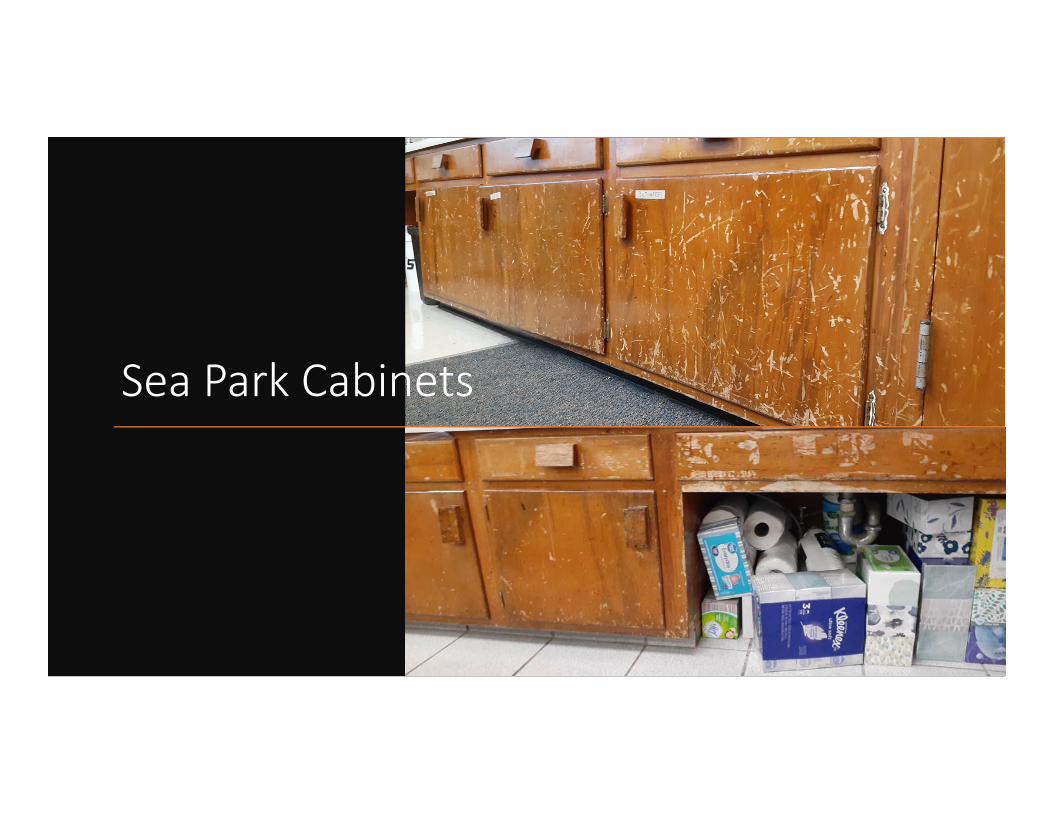
Sea Park Cabinets

Oak Park Doors

Palm Bay Magnet High
School Doors

Next Steps
• Board feedback on content of plan• ICOC review and feedback August 19
• Recommend allocation percentages for School Board Policy development (update or replace Policy 6180.02)
• Initiate Policy development/modification process• Procurement solicitations:
• Roof renewal design/design build projects• Security project
• Start planning & design for summer 2021 projects

Thank You!
39