Embed Size (px)
Citation preview
INTRODUCTION ..........................................................................................................................................................
TERMINOLOGY
METHODOLOGY & ASSUMPTIONS
KEY FINDINGS SUMMARY
BENCHMARKING: INDUSTRY SECTORS ..............................................................................................................
WORKPLACE TRENDS & CASE STUDIES ...............................................................................................................
APPENDIX ......................................................................................................................................................................
MASTER DATA
BENCHMARKING: PER INDUSTRY SECTOR
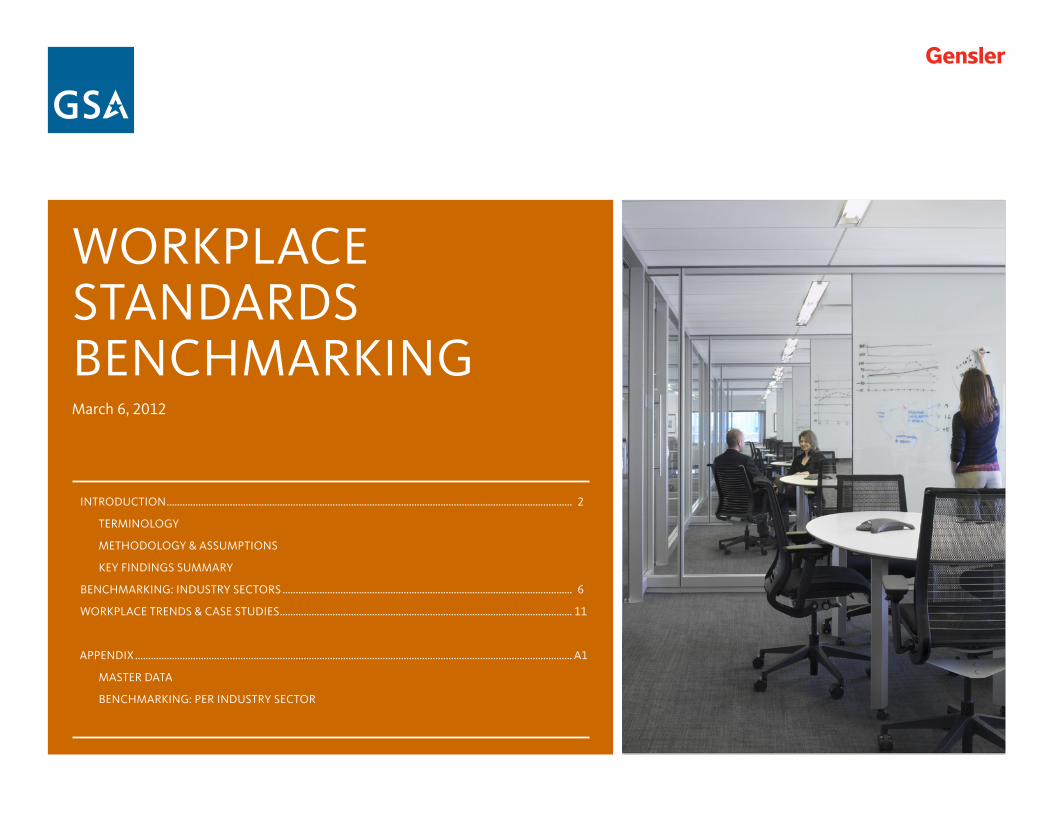
WORKPLACE STANDARDS BENCHMARKINGMarch 6, 2012
2
6
11
A1
Workplace Standards BenchmarkingMarch 2012 2
When the workplace revolution started 20 years ago, the office was still shaped by mid-century views of work. Today, the office is a reflection of contemporary trends, a mobile work style most of all.
- Fred Bernstein, “Work in Context”
The methods in which workplace standards are measured and benchmarked vary drastically across companies and industries. For example, the legal industry bases many of its benchmarking metrics on the number of attorneys rather than the overall personnel headcount at an office location. Similarly, biotechnology and science laboratories relate metrics to the number of scientists per office facility.
The purpose of this document is to bridge the gap across the various industry benchmarking metrics. By developing a consistent and uniform method for measuring workplace metrics, we are able to uncover the differences and similarities between industry benchmarks, understand how workplace standards and strategies affect space allocation and identify workplace trends.
In this study, we have collected the workplace standards, space programs, and sample floor plans from 38 different projects across eight different industry sectors: Architecture & Engineering (A/E), Biotechnology & Science, Call Centers, Finance, Law Enforcement, Legal, Social Services, and Technology.
The first portion of this report introduces the research methodology, assumptions, common terminology and summarizes the key takeaways. The second section analyzes workplace metrics across the different sectors to compare industry standards and highlight prevailing trends and insights. The final component of the report provides a brief overview of four common workplace trends accompanied with case study examples.
See the Appendix at the end of this document for more sector-specific information.
INTRODUCTION
ARCHITECTURE / ENGINEERING (A/E)Includes all architecture, construction, engineering and related services.
BIOTECHNOLOGY & SCIENCEBiotechnology, pharmaceutical, and related services. Case study samples represent both general administrative spaces and some laboratory functions.
CALL CENTERSContact, phone, or call centers focused on providing customer service.
FINANCEFinancial services related to investment banking and capital markets. Private wealth management and trading floors are not included.
LAW ENFORCEMENTPublic sector law enforcement agencies. Does not include spaces with detention facilities.
LEGALPublic and private sector law firms.
SOCIAL SERVICESPublic sector agencies providing health and social services.
TECHNOLOGYTechnology development companies, both
hardware and software oriented.
INDUSTRY SECTORS
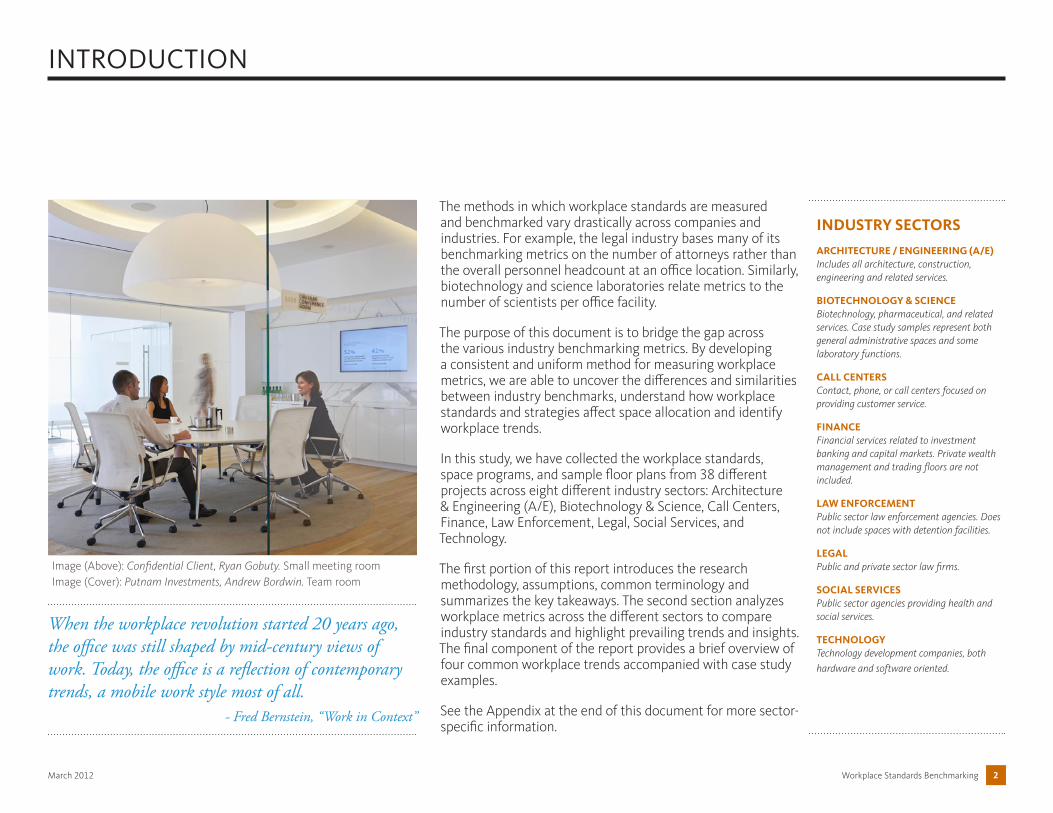
Image (Above): Confidential Client, Ryan Gobuty. Small meeting room Image (Cover): Putnam Investments, Andrew Bordwin. Team room
Workplace Standards BenchmarkingMarch 2012 3
CIRCULATION
All pathways connecting programmatic spaces, including offices, workstations, support spaces, entry and elevator lobbies, and egress locations.
DESK-SHARING
The practice of leveraging individual workspaces by reducing the total number of seats per assigned headcount. There are many different desk-sharing strategies, such as free-address, hoteling, and shared-owned settings.
FREE-ADDRESS
The practice of providing temporary seating to employees on a first-come, first-served basis. Free-address work settings do not need to be reserved through a formal reservation system.
HEADCOUNT (HC)
The total number of employees, including full-time, part-time, interns, and contractors, that work at a designated office location.
TERMINOLOGY
* Definitions per ANSI/BOMA 265.1 - 1996 Standard Method for Measuring Floor Area in Office Buildings
HOTELING
The practice of providing temporary seating to employees on an as-needed basis through a formal reservation system.
MOBILITY RATIO
The proportion of seats per headcount assigned to a specific facility location.
MOBILITY VS. TELEWORK
Mobility refers to an employee’s ability to work freely inside and outside the office. Mobility also encompasses all remote work that is functionally required for a job. Telework is a sub-set of Mobility in which an employee works specifically at home or at a satellite work location near the employee’s home.
NET SQUARE FEET (NSF)
The total area of workspaces (office and workstations), dedicated support (conference, supply, etc.) and shared support (entry lobby, shared floor support, break rooms, etc.). Does not include primary or secondary circulation, building
core, and common building support spaces. The NSF measures the area contained within the outline of each identified program space. Example: the Net Area (NSF) of an 8’ x 8’ workstation is 64 NSF.
ENCLOSED VS. OPEN
An Enclosed workspace generally refers to an office or shared-office setting in which the workspace is fully surrounded by full-height partitions. Open refers to workstations in an open plan environment with minimal partitions between work settings.
SPACE ALLOCATION RATE
The total usable area of an organization divided by the total number of personnel (includes all full-time and part-time employees, interns, and any contractors that occupy space. Personnel excludes contractors that service the space, such as janitors and security guards).
SPACE ALLOCATION RATIO
Proportion of space, measured in Net Square Feet (NSF), dedicated to offices, workstations, collaboration
space, general support, social support, and mission specific spaces.
SPACE TYPES
Offices - Includes all individual and shared workspaces that are fully enclosed.
Workstations - Includes all individual and shared workspaces that are not fully enclosed, such as cubicles, open workstations, and touchdown stations.
Collaboration - Incorporates all open and enclosed collaboration spaces, including training rooms, open meeting areas, focus rooms, huddle rooms/enclaves, and project rooms.
General Support - All common office support functions included in the Usable Square Feet (USF). Includes storage, supply, print and copy, receptions, mail rooms, libraries, lateral files and filing rooms, mother’s/wellness rooms, and server/ADP rooms.
Social Support - Includes all break and recreation areas, such as break rooms, coffee bars, common areas, informal seating, and game rooms.
Mission Specific - Specialized rooms to support core business functions, such as laboratories and secure evidence storage.
Excluded - Building core, primary and secondary circulation, and all major amenities, such as fitness facilities and cafeterias.
USABLE SQUARE FEET (USF)*
Area of a floor occupiable by a tenant area which is where a tenant normally houses personnel and/or furniture.
UTILIZATION RATE
The average usage of a space, often measured as a percentage of the total period that the space is available for use, such as the organization’s business hours. This term is often misconstrued as “Space Allocation Rate.”
The following is a list of common terminology that will be referenced throughout this document.
Workplace Standards BenchmarkingMarch 2012 4
METHODOLOGY & ASSUMPTIONS
DATA SOURCE
1) The data source for all case study companies and organizations have been compiled from space programs, test-fits, existing plans, and workplace guidelines.
2) To ensure that the findings generated from this report represent the most recent trends and standards, we have only selected projects that were completed between 2007 to 2011.
3) The data of this report is based on the metrics from (5) sample case study organizations per industry sector, with the exception of the Social Services industry sector, which included only (3) sample case studies.
ASSUMPTIONS
1) To account for the disparate scales of the projects included within this study, we have discounted all amenity type spaces from this report. Amenity spaces, such as full-scale cafeterias and fitness centers, are generally a provision that is based on the scale of a project and the site location.
2) Our Usable Square Feet (USF)calculations include any shared spaces that would normally be included in a tenant’s USF calculations at a pro-rata share. This includes such spaces as shared support areas, conference centers, training rooms, and other shared facilities that might not be directly within the immediate office area.
The research within this report is based on the following list of benchmarking metrics. In the body of the report, the metrics are expressed as industry averages. For sector-specific information, refer to the Appendix at the end of this document.
Space Allocation Rate: USF per total personnel - Total Usable Square Feet (USF) of the office space divided by the amount of total personnel working in the office, including full-time, part-time, contractors, interns and other temporary staff. Personnel excludes support staff that service the building and do not have a primary workspace.
Space Allocation Ratio- Proportion of office space allocated for the following classifications: offices, workstations, collaboration, general support, social support, and mission specific spaces. The space allocation calculations, measured in Net Square Feet (NSF), also incorporate any shared spaces that qualify under the listed classifications at a pro-rata share. Building core, primary and secondary circulation, and any major amenity spaces are excluded from this metric.
Enclosed to Open Ratio - Proportion of individual work settings that are enclosed (i.e. offices) versus open (i.e. cubicles and workstations).
Office Sizes- Average office standard sizes measured in Net Square Feet (NSF). All companies that do not have offices are voided from this metric.
Workstation Sizes- Predominant workstation standard size measured in Net Square Feet (NSF). If there is not a prevailing workstation standard size, an average is calculated based on the different workstation standards.
BENCHMARKING METRICS
Workplace Standards BenchmarkingMarch 2012 5
SUMMARY BENCHMARKING AVERAGES KEY FINDING #3Of all the case studies included in this report, Public Sector organizations have higher space standards than Private Sector companies in terms of average space allocation rate, office size, and workstation size. However, Public Sector organizations have explored higher levels of mobility. Public Sector organizations average 1 seat per every 1.23 personnel compared to the Private Sector average of 1 seat per every 1.01 personnel.
KEY FINDING #2More “We” space and less “Me” space. There is a correlation between the proportion of space that is dedicated to individually assigned spaces and spaces for collaboration. Companies and organizations in the Technology, Law Enforcement, and A/E sectors are reducing the amount of spaces for individuals in exchange for more spaces that promote employee interaction and collaboration.
The analysis of the standards and workplace allocation of eight industry sector case studies has revealed several universal and sector-specific insights.
The following key findings briefly summarize four prominent takeaways from the benchmarking exercise. For more sector-specific details, refer to the Appendix at the conclusion of this report.
KEY FINDINGS SUMMARY
KEY FINDING #1Workstation sizes and the ratio of enclosed offices to open workstations have the strongest correlation to space allocation rate efficiency. We have consistently found that the companies with smaller workstation standards and lower ratios of offices to workstations have the lowest space allocation rates.
KEY FINDING #4The case studies with workplace mobility programs have an estimated average space allocation rate savings of 35 USF per person. The average space savings is estimated by dividing the total USF by number of seats versus headcount assigned to a site. Organizations are leveraging underutilized workstations and/or offices to increase workspace utilization, reduce real estate waste, and create more energetic office environments.
TOTAL
192
1 : 1.09
1 : 4
142
53
Space Allocation Rate
Mobility Ratio*
Enclosed to Open Ratio
Office Size
Workstation Size
PUBLIC
201
1 : 1.23
1 : 4
151
61
PRIVATE
189
1 : 1.01
1 : 4
136
49
Image 1: Belkin, Nicholas Cope. Informal Collaboration Hub Image 2: Belkin, Nicholas Cope. Workstation Image 3: Deloitte, Timothy Soar. Touch-down Station Image 4: Confidential Company. Mobility Station
* Ratio of total number of seats to total headcount assigned to a site.
50 500100 150 200 250 300 350 400 450
Workplace Standards BenchmarkingMarch 2012 6
Biotech & Science
Law Enforcement
Mobility Program
Private Sector
Public Sector
Average
Range
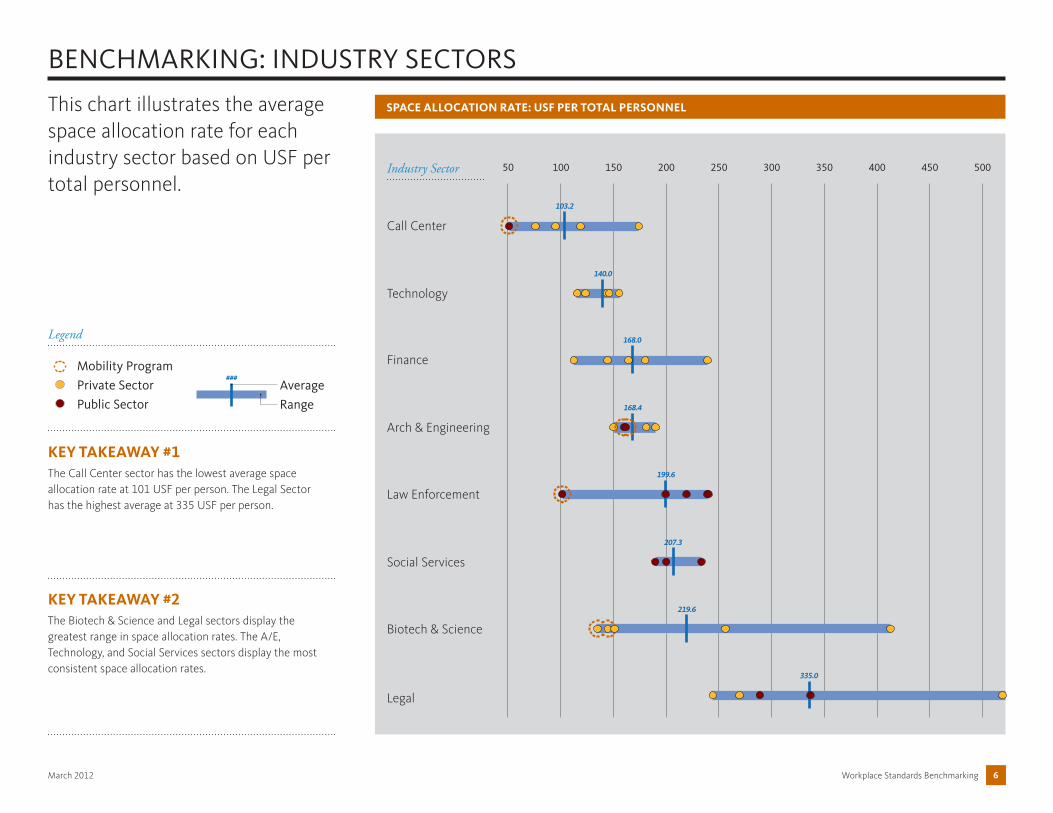
BENCHMARKING: INDUSTRY SECTORS
SPACE ALLOCATION RATE: USF PER TOTAL PERSONNELThis chart illustrates the average space allocation rate for each industry sector based on USF per total personnel.
Call Center
Legal
Technology
Finance
Arch & Engineering
Social Services
KEY TAKEAWAY #1The Call Center sector has the lowest average space allocation rate at 101 USF per person. The Legal Sector has the highest average at 335 USF per person.
KEY TAKEAWAY #2The Biotech & Science and Legal sectors display the greatest range in space allocation rates. The A/E, Technology, and Social Services sectors display the most consistent space allocation rates.
Legend
Industry Sector
103.2
140.0
168.0
###
168.4
199.6
207.3
219.6
335.0
Workplace Standards BenchmarkingMarch 2012 7
BENCHMARKING: INDUSTRY SECTORS
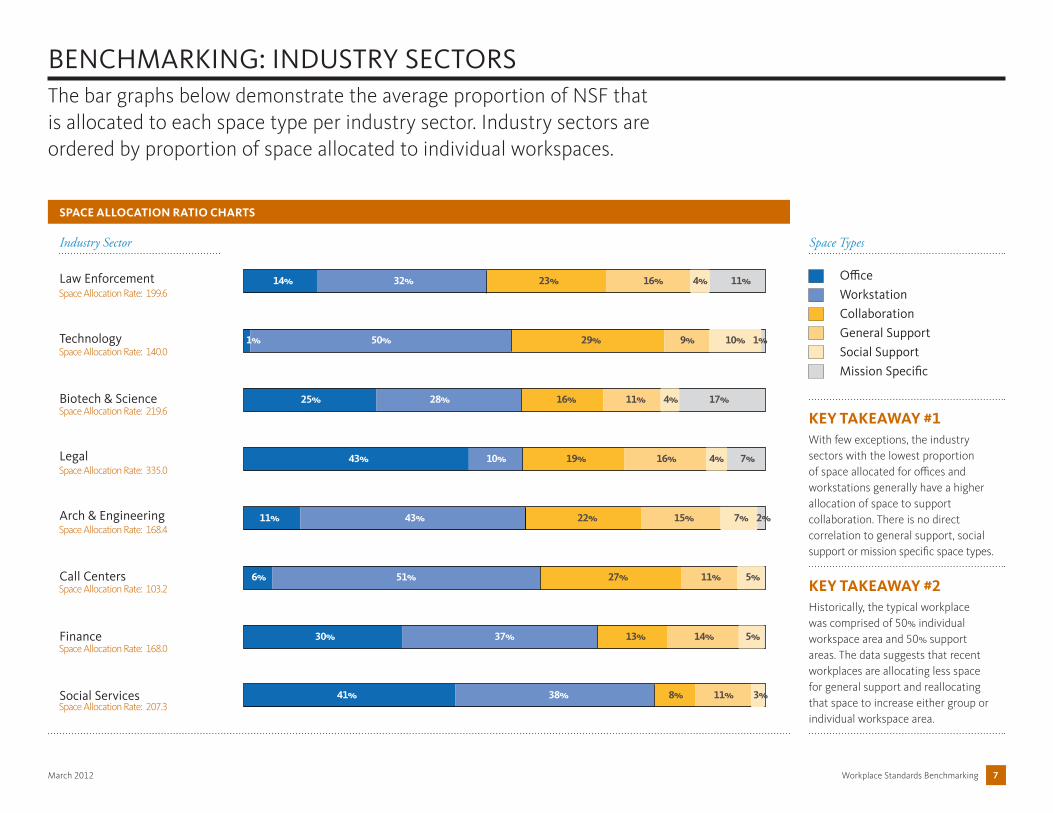
SPACE ALLOCATION RATIO CHARTS
The bar graphs below demonstrate the average proportion of NSF that is allocated to each space type per industry sector. Industry sectors are ordered by proportion of space allocated to individual workspaces.
KEY TAKEAWAY #1With few exceptions, the industry sectors with the lowest proportion of space allocated for offices and workstations generally have a higher allocation of space to support collaboration. There is no direct correlation to general support, social support or mission specific space types.
KEY TAKEAWAY #2Historically, the typical workplace was comprised of 50% individual workspace area and 50% support areas. The data suggests that recent workplaces are allocating less space for general support and reallocating that space to increase either group or individual workspace area.
Office
Workstation
Collaboration
General Support
Social Support
Mission Specific
Finance 30% 37% 13% 14% 5%
Social Services 41% 38% 8% 11% 3%
Law Enforcement 14% 32% 23% 16% 4% 11%
Technology 1% 50% 29% 9% 10% 1%
Biotech & Science 25% 28% 16% 11% 4% 17%
Legal 43% 10% 19% 16% 4% 7%
Arch & Engineering 11% 43% 22% 15% 7% 2%
Call Centers 6% 51% 27% 11% 5%
Industry Sector Space Types
Space Allocation Rate: 199.6
Space Allocation Rate: 140.0
Space Allocation Rate: 219.6
Space Allocation Rate: 335.0
Space Allocation Rate: 168.4
Space Allocation Rate: 103.2
Space Allocation Rate: 168.0
Space Allocation Rate: 207.3
Workplace Standards BenchmarkingMarch 2012 8
BENCHMARKING: INDUSTRY SECTORS
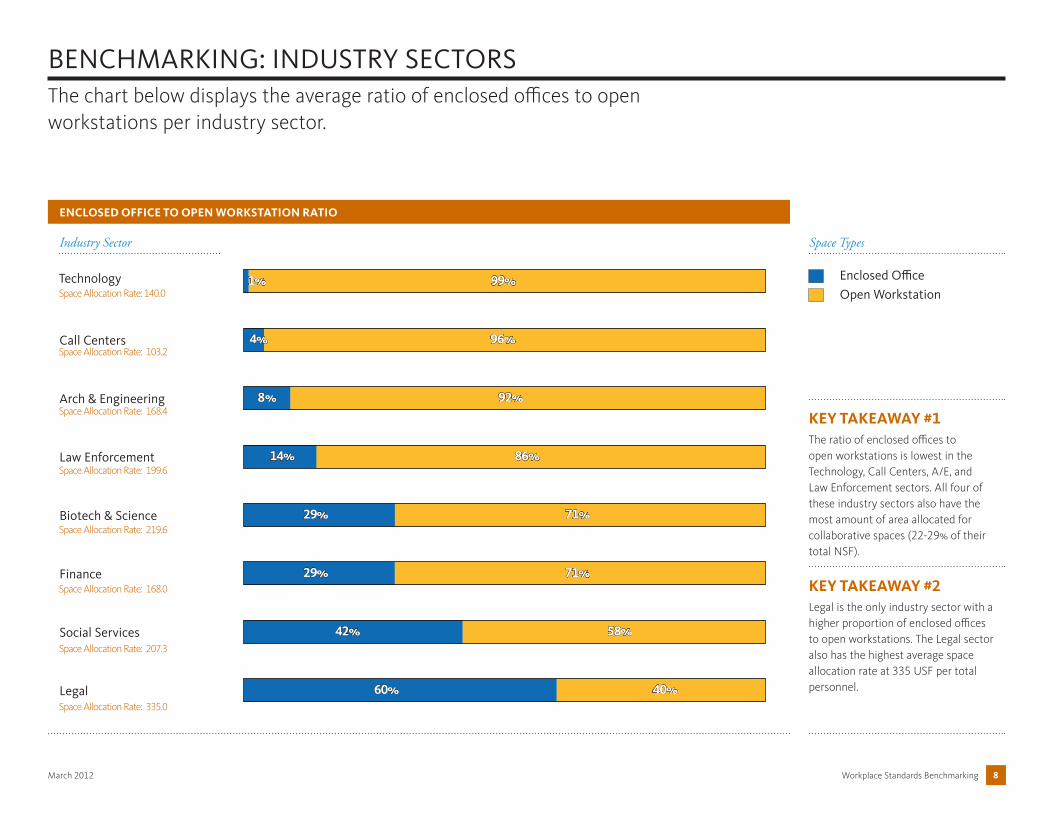
ENCLOSED OFFICE TO OPEN WORKSTATION RATIO
The chart below displays the average ratio of enclosed offices to open workstations per industry sector.
KEY TAKEAWAY #1The ratio of enclosed offices to open workstations is lowest in the Technology, Call Centers, A/E, and Law Enforcement sectors. All four of these industry sectors also have the most amount of area allocated for collaborative spaces (22-29% of their total NSF).
KEY TAKEAWAY #2Legal is the only industry sector with a higher proportion of enclosed offices to open workstations. The Legal sector also has the highest average space allocation rate at 335 USF per total personnel.
Technology 1% 99%
Call Centers 4% 96%
Arch & Engineering 8% 92%
Law Enforcement 14% 86%
Biotech & Science 29% 71%
Finance 29% 71%
Social Services 42% 58%
Legal 60% 40%
Enclosed Office
Open Workstation
Space TypesIndustry Sector
Space Allocation Rate: 140.0
Space Allocation Rate: 103.2
Space Allocation Rate: 168.4
Space Allocation Rate: 199.6
Space Allocation Rate: 219.6
Space Allocation Rate: 168.0
Space Allocation Rate: 207.3
Space Allocation Rate: 335.0
Workplace Standards BenchmarkingMarch 2012 9
140
112
BENCHMARKING: INDUSTRY SECTORS
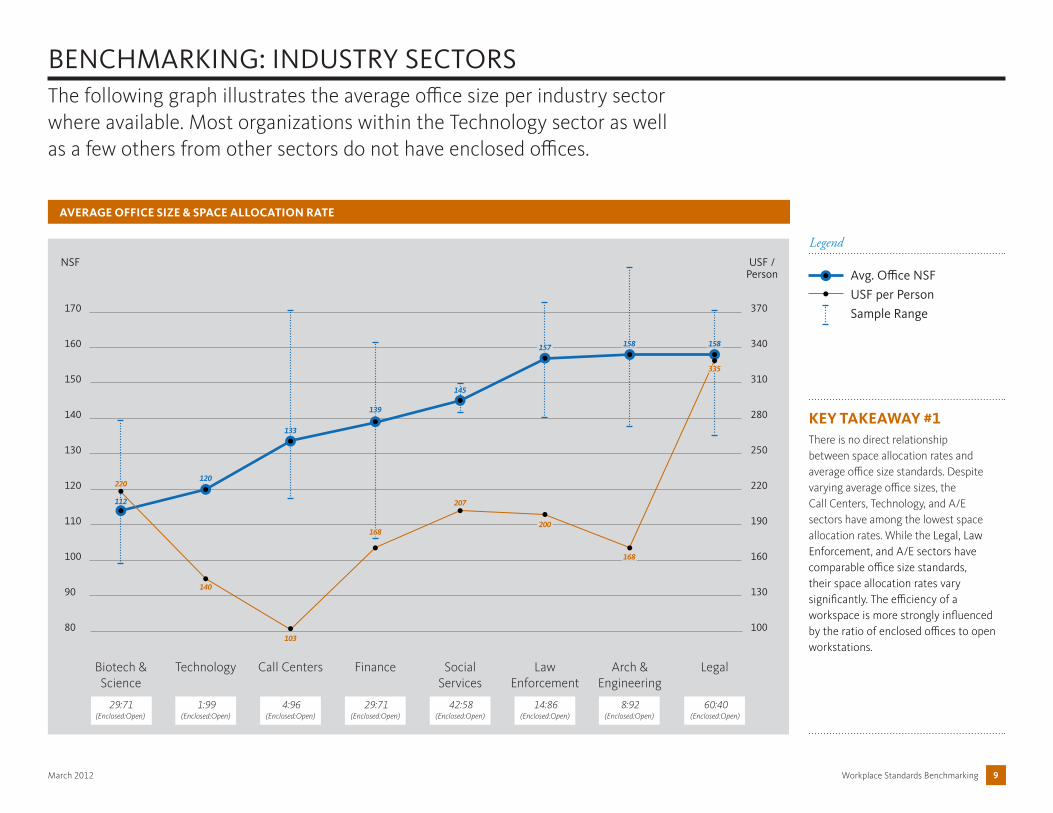
AVERAGE OFFICE SIZE & SPACE ALLOCATION RATE
The following graph illustrates the average office size per industry sector where available. Most organizations within the Technology sector as well as a few others from other sectors do not have enclosed offices.
KEY TAKEAWAY #1There is no direct relationship between space allocation rates and average office size standards. Despite varying average office sizes, the Call Centers, Technology, and A/E sectors have among the lowest space allocation rates. While the Legal, Law Enforcement, and A/E sectors have comparable office size standards, their space allocation rates vary significantly. The efficiency of a workspace is more strongly influenced by the ratio of enclosed offices to open workstations.
100
130
160
190
220
250
280
310
340
370
NSF USF /Person
TechnologyBiotech & Science
Call Centers Finance Social Services
Law Enforcement
Arch &Engineering
Legal
80
90
110
100
120
130
140
150
160
170
Avg. Office NSF
USF per Person
Sample Range
Legend
120
133
139
145
157 158 158
220
103
168
207
200
168
335
29:71(Enclosed:Open)
1:99(Enclosed:Open)
4:96(Enclosed:Open)
29:71(Enclosed:Open)
42:58(Enclosed:Open)
14:86(Enclosed:Open)
8:92(Enclosed:Open)
60:40(Enclosed:Open)
Workplace Standards BenchmarkingMarch 2012 10
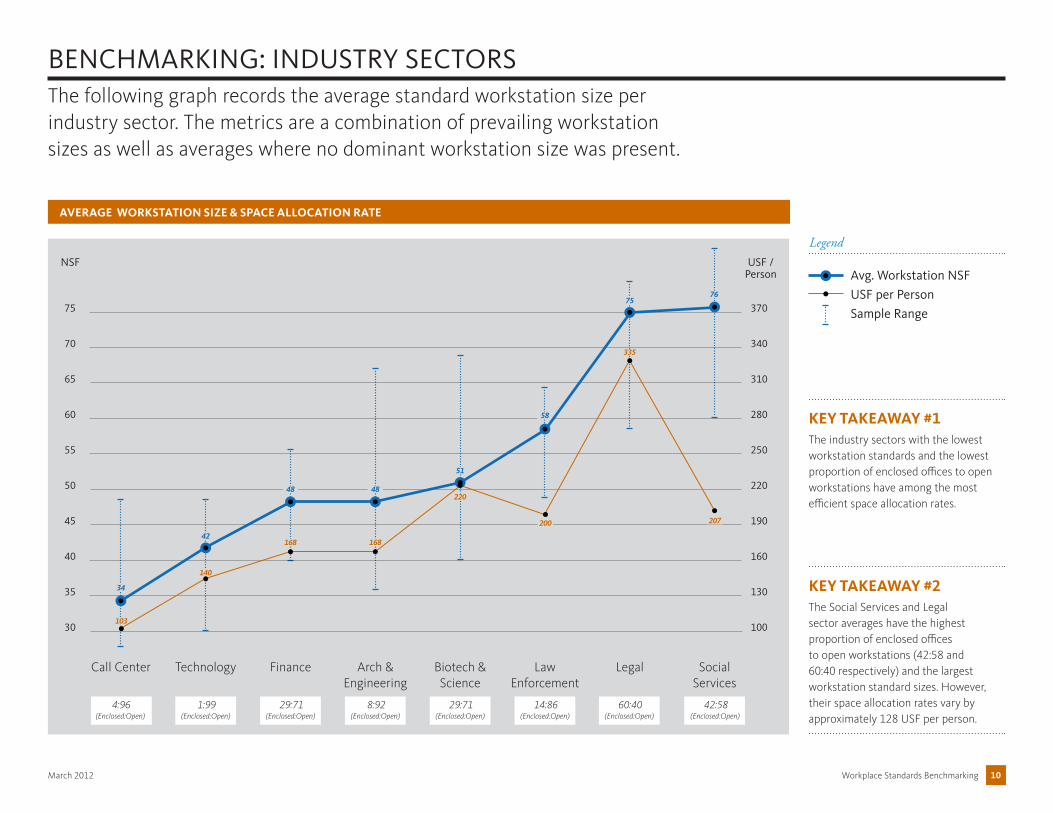
BENCHMARKING: INDUSTRY SECTORSThe following graph records the average standard workstation size per industry sector. The metrics are a combination of prevailing workstation sizes as well as averages where no dominant workstation size was present.
AVERAGE WORKSTATION SIZE & SPACE ALLOCATION RATE
KEY TAKEAWAY #1The industry sectors with the lowest workstation standards and the lowest proportion of enclosed offices to open workstations have among the most efficient space allocation rates.
KEY TAKEAWAY #2The Social Services and Legal sector averages have the highest proportion of enclosed offices to open workstations (42:58 and 60:40 respectively) and the largest workstation standard sizes. However, their space allocation rates vary by approximately 128 USF per person.
NSF USF /Person
Technology Finance Arch &Engineering
Biotech & Science
Law Enforcement
Legal Social Services
30
35
45
40
50
55
60
65
70
75
Call Center
100
130
160
190
220
250
280
310
340
370
Avg. Workstation NSF
USF per Person
Sample Range
Legend
34
42
48 48
51
58
7576
103
140
168 168
220
200
335
207
4:96(Enclosed:Open)
1:99(Enclosed:Open)
29:71(Enclosed:Open)
8:92(Enclosed:Open)
29:71(Enclosed:Open)
14:86(Enclosed:Open)
60:40(Enclosed:Open)
42:58(Enclosed:Open)

Workplace Standards BenchmarkingMarch 2012 11
MOBILITY ADOPTIONDocumenting the state of mobility
MOBILITY STRATEGY
Understand the implications of a mobility strategy through aligning space solutions with work patterns, processes, policies, and culture.
WORKPLACE TREND #1: HOTELING & FREE-ADDRESS
Across industry sectors, more employees are working in more locations outside the office, within the office, and from home. The purpose for coming into the office is becoming less focused on individual work and more about collaborating and interacting with others. As a result, companies are beginning to rethink both real estate and workplace strategies with four key objectives in mind: 1) increase employee performance by supporting mobile work patterns; 2) utilize space more efficiently and reduce real estate and occupancy costs; 3) reduce resource use and contribute to sustainability; 4) positively impact recruitment and retention by properly supporting diverse workstyles.
Facilities and workplace strategists have been exploring new methods of assigning space as a means to increase utilization and support the new ways in which employees are working. Rather than unilaterally assigning all employees to a dedicated workstation or office, many companies are adopting hoteling or free-address programs to repurpose previously assigned individual space to collaboration space, and, in some cases, significantly reducing overall real estate.
The hoteling concept is a system in which individual workspaces are shared among employees and reserved for use by an individual for a specific time period. Frequently, a corporate concierge is responsible for scheduling and equipping these spaces for use. However, the norm is transitioning to a virtual reservation system.
Similar to hoteling, the free-address workspaces are unassigned and can be used by any employee. Reservations are not required; spaces are available on a first-come, first-serve basis. Free-address is also commonly referred to as “just-in-time.”
Prior to adopting a hoteling or free-address program, an organization should develop and carefully consider the feasibility of a mobility strategy. There are many other factors that must be addressed to effectively implement a hoteling or free-address system, such as employee work patterns, current and projected mobility adoption levels, and the mobility readiness criteria, which covers such considerations as organizational culture, technology, work function, processes, policies, and protocols.
Image 1: Razorfish, David Joseph. Mobility Workstation Image 2: Metlife, Chris Leonard. Reservation Kiosk Image 3: Metlife, Chris Leonard. Touch-down Cafe
+
+
=
WORK PATTERNDefining how people work
MOBILITY READINESS CRITERIAAssessing the feasibility of mobility readiness
STEPS TO DEVELOP A MOBILITY STRATEGY
Workplace Standards BenchmarkingMarch 2012 12
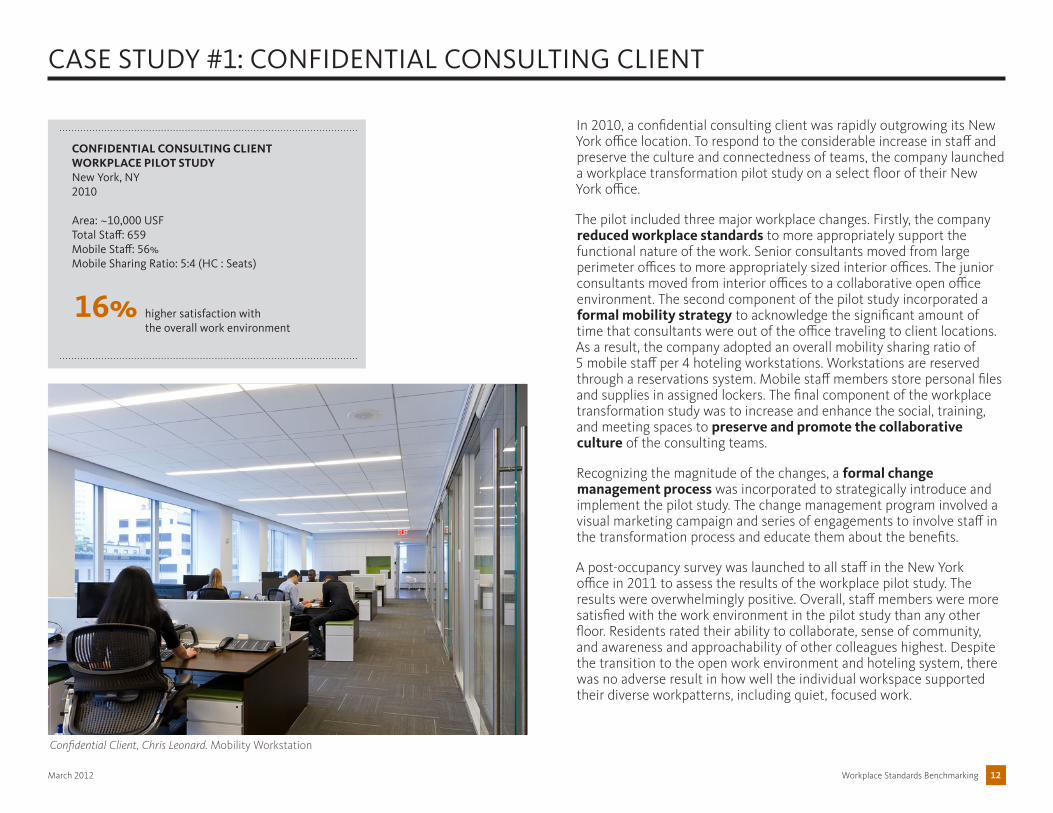
CASE STUDY #1: CONFIDENTIAL CONSULTING CLIENT
In 2010, a confidential consulting client was rapidly outgrowing its New York office location. To respond to the considerable increase in staff and preserve the culture and connectedness of teams, the company launched a workplace transformation pilot study on a select floor of their New York office.
The pilot included three major workplace changes. Firstly, the company reduced workplace standards to more appropriately support the functional nature of the work. Senior consultants moved from large perimeter offices to more appropriately sized interior offices. The junior consultants moved from interior offices to a collaborative open office environment. The second component of the pilot study incorporated a formal mobility strategy to acknowledge the significant amount of time that consultants were out of the office traveling to client locations. As a result, the company adopted an overall mobility sharing ratio of 5 mobile staff per 4 hoteling workstations. Workstations are reserved through a reservations system. Mobile staff members store personal files and supplies in assigned lockers. The final component of the workplace transformation study was to increase and enhance the social, training, and meeting spaces to preserve and promote the collaborative culture of the consulting teams.
Recognizing the magnitude of the changes, a formal change management process was incorporated to strategically introduce and implement the pilot study. The change management program involved a visual marketing campaign and series of engagements to involve staff in the transformation process and educate them about the benefits.
A post-occupancy survey was launched to all staff in the New York office in 2011 to assess the results of the workplace pilot study. The results were overwhelmingly positive. Overall, staff members were more satisfied with the work environment in the pilot study than any other floor. Residents rated their ability to collaborate, sense of community, and awareness and approachability of other colleagues highest. Despite the transition to the open work environment and hoteling system, there was no adverse result in how well the individual workspace supported their diverse workpatterns, including quiet, focused work.
CONFIDENTIAL CONSULTING CLIENTWORKPLACE PILOT STUDYNew York, NY2010
Area: ~10,000 USFTotal Staff: 659Mobile Staff: 56%Mobile Sharing Ratio: 5:4 (HC : Seats)
16% higher satisfaction withthe overall work environment
Confidential Client, Chris Leonard. Mobility Workstation
Workplace Standards BenchmarkingMarch 2012 13
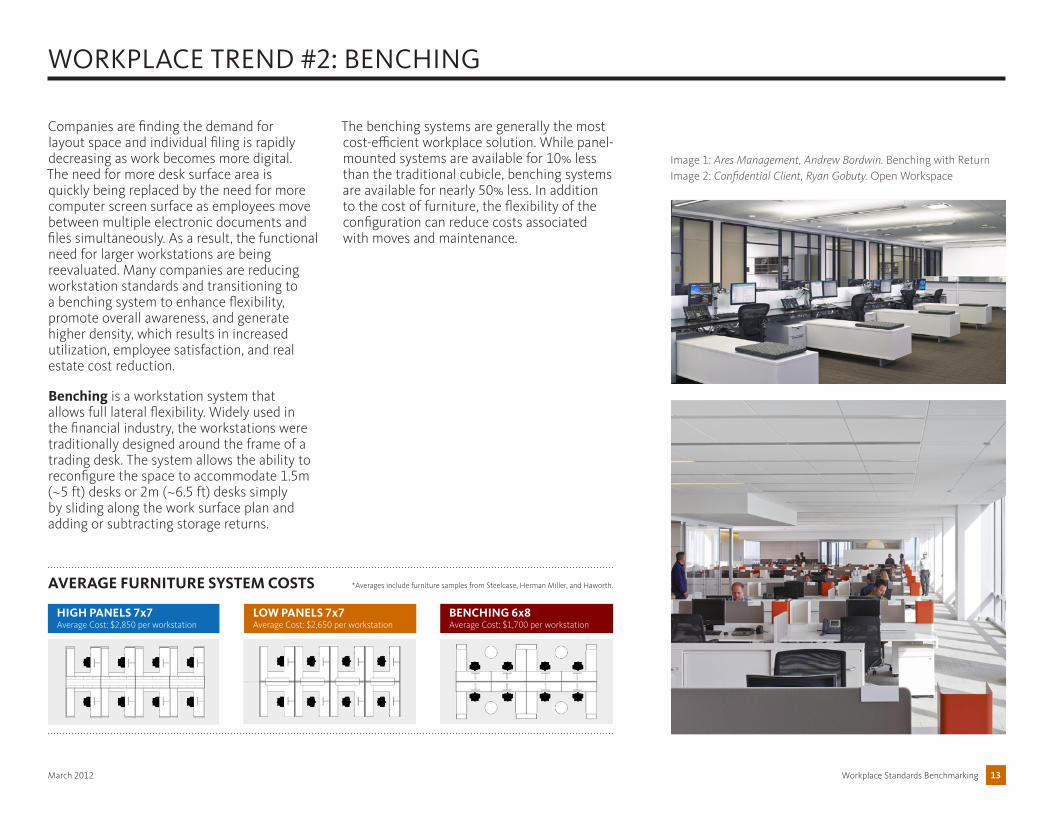
WORKPLACE TREND #2: BENCHING
Image 1: Ares Management, Andrew Bordwin. Benching with Return Image 2: Confidential Client, Ryan Gobuty. Open Workspace
BENCHING 6x8Average Cost: $1,700 per workstation
AVERAGE FURNITURE SYSTEM COSTS
LOW PANELS 7x7Average Cost: $2,650 per workstation
HIGH PANELS 7x7Average Cost: $2,850 per workstation
*Averages include furniture samples from Steelcase, Herman Miller, and Haworth.
Companies are finding the demand for layout space and individual filing is rapidly decreasing as work becomes more digital. The need for more desk surface area is quickly being replaced by the need for more computer screen surface as employees move between multiple electronic documents and files simultaneously. As a result, the functional need for larger workstations are being reevaluated. Many companies are reducing workstation standards and transitioning to a benching system to enhance flexibility, promote overall awareness, and generate higher density, which results in increased utilization, employee satisfaction, and real estate cost reduction.
Benching is a workstation system that allows full lateral flexibility. Widely used in the financial industry, the workstations were traditionally designed around the frame of a trading desk. The system allows the ability to reconfigure the space to accommodate 1.5m (~5 ft) desks or 2m (~6.5 ft) desks simply by sliding along the work surface plan and adding or subtracting storage returns.
The benching systems are generally the most cost-efficient workplace solution. While panel-mounted systems are available for 10% less than the traditional cubicle, benching systems are available for nearly 50% less. In addition to the cost of furniture, the flexibility of the configuration can reduce costs associated with moves and maintenance.
Workplace Standards BenchmarkingMarch 2012 14
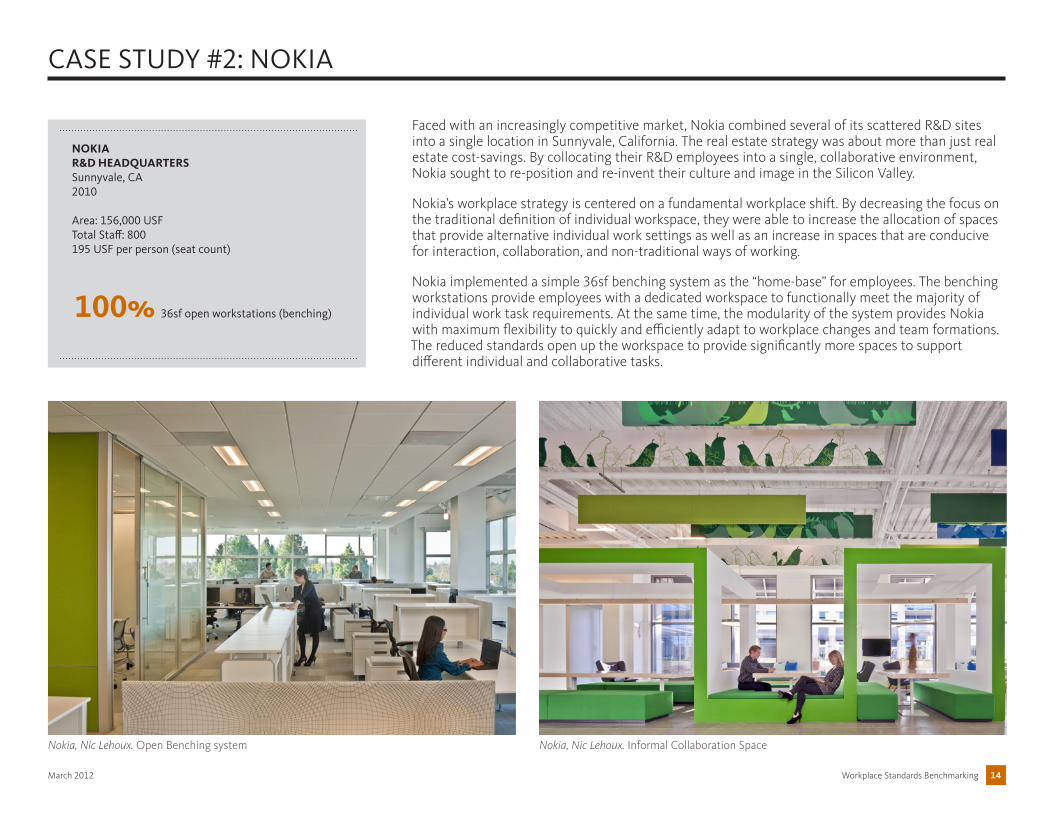
CASE STUDY #2: NOKIA
Faced with an increasingly competitive market, Nokia combined several of its scattered R&D sites into a single location in Sunnyvale, California. The real estate strategy was about more than just real estate cost-savings. By collocating their R&D employees into a single, collaborative environment, Nokia sought to re-position and re-invent their culture and image in the Silicon Valley.
Nokia’s workplace strategy is centered on a fundamental workplace shift. By decreasing the focus on the traditional definition of individual workspace, they were able to increase the allocation of spaces that provide alternative individual work settings as well as an increase in spaces that are conducive for interaction, collaboration, and non-traditional ways of working.
Nokia implemented a simple 36sf benching system as the “home-base” for employees. The benching workstations provide employees with a dedicated workspace to functionally meet the majority of individual work task requirements. At the same time, the modularity of the system provides Nokia with maximum flexibility to quickly and efficiently adapt to workplace changes and team formations. The reduced standards open up the workspace to provide significantly more spaces to support different individual and collaborative tasks.
LProjectCityDate
Project Stats....
NOKIAR&D HEADQUARTERSSunnyvale, CA2010
Area: 156,000 USFTotal Staff: 800195 USF per person (seat count)
100% 36sf open workstations (benching)
Nokia, Nic Lehoux. Open Benching system Nokia, Nic Lehoux. Informal Collaboration Space
Workplace Standards BenchmarkingMarch 2012 15
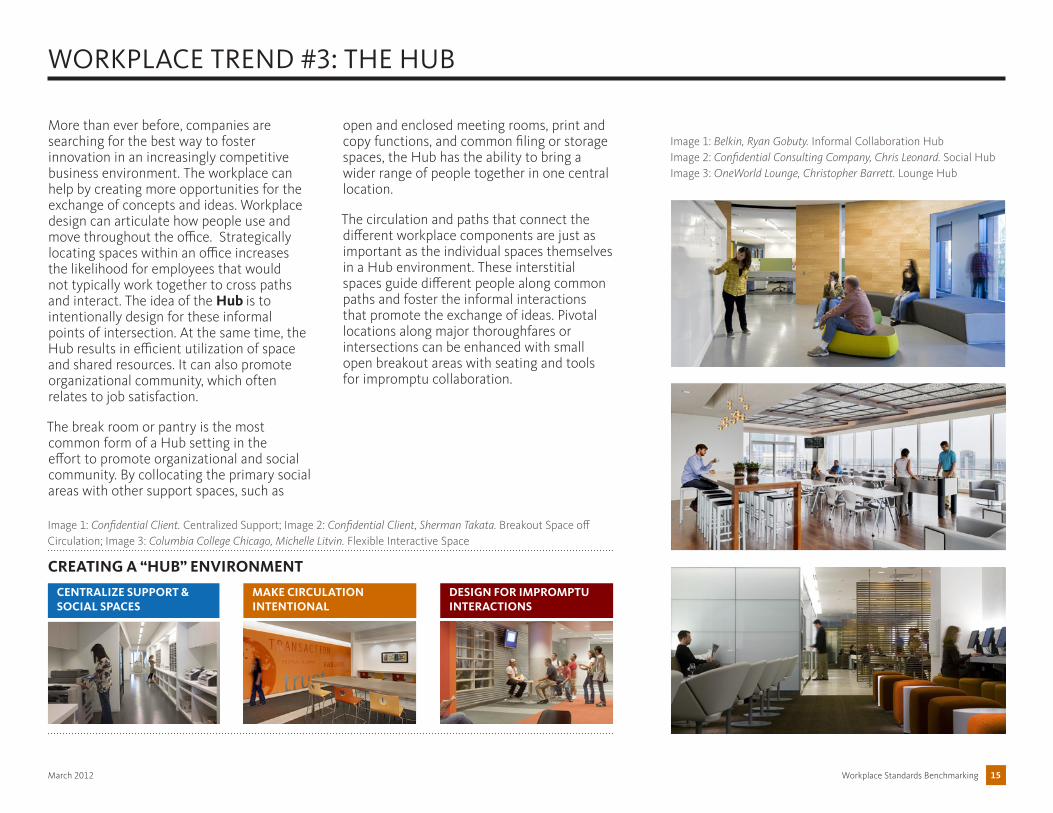
WORKPLACE TREND #3: THE HUB
More than ever before, companies are searching for the best way to foster innovation in an increasingly competitive business environment. The workplace can help by creating more opportunities for the exchange of concepts and ideas. Workplace design can articulate how people use and move throughout the office. Strategically locating spaces within an office increases the likelihood for employees that would not typically work together to cross paths and interact. The idea of the Hub is to intentionally design for these informal points of intersection. At the same time, the Hub results in efficient utilization of space and shared resources. It can also promote organizational community, which often relates to job satisfaction.
The break room or pantry is the most common form of a Hub setting in the effort to promote organizational and social community. By collocating the primary social areas with other support spaces, such as
open and enclosed meeting rooms, print and copy functions, and common filing or storage spaces, the Hub has the ability to bring a wider range of people together in one central location.
The circulation and paths that connect the different workplace components are just as important as the individual spaces themselves in a Hub environment. These interstitial spaces guide different people along common paths and foster the informal interactions that promote the exchange of ideas. Pivotal locations along major thoroughfares or intersections can be enhanced with small open breakout areas with seating and tools for impromptu collaboration.
Image 1: Belkin, Ryan Gobuty. Informal Collaboration Hub Image 2: Confidential Consulting Company, Chris Leonard. Social Hub Image 3: OneWorld Lounge, Christopher Barrett. Lounge Hub
Image 1: Confidential Client. Centralized Support; Image 2: Confidential Client, Sherman Takata. Breakout Space off Circulation; Image 3: Columbia College Chicago, Michelle Litvin. Flexible Interactive Space
CREATING A “HUB” ENVIRONMENT
CENTRALIZE SUPPORT & SOCIAL SPACES
MAKE CIRCULATION INTENTIONAL
DESIGN FOR IMPROMPTU INTERACTIONS
Workplace Standards BenchmarkingMarch 2012 16
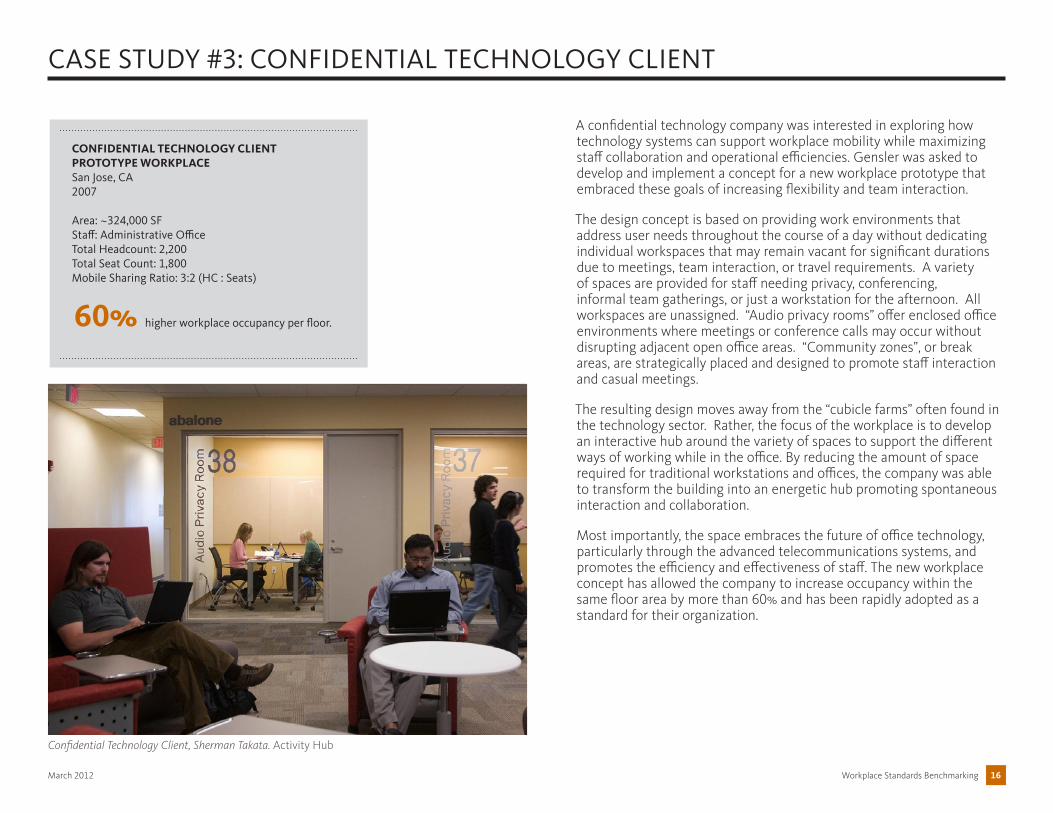
CASE STUDY #3: CONFIDENTIAL TECHNOLOGY CLIENT
A confidential technology company was interested in exploring how technology systems can support workplace mobility while maximizing staff collaboration and operational efficiencies. Gensler was asked to develop and implement a concept for a new workplace prototype that embraced these goals of increasing flexibility and team interaction.
The design concept is based on providing work environments that address user needs throughout the course of a day without dedicating individual workspaces that may remain vacant for significant durations due to meetings, team interaction, or travel requirements. A variety of spaces are provided for staff needing privacy, conferencing, informal team gatherings, or just a workstation for the afternoon. All workspaces are unassigned. “Audio privacy rooms” offer enclosed office environments where meetings or conference calls may occur without disrupting adjacent open office areas. “Community zones”, or break areas, are strategically placed and designed to promote staff interaction and casual meetings.
The resulting design moves away from the “cubicle farms” often found in the technology sector. Rather, the focus of the workplace is to develop an interactive hub around the variety of spaces to support the different ways of working while in the office. By reducing the amount of space required for traditional workstations and offices, the company was able to transform the building into an energetic hub promoting spontaneous interaction and collaboration.
Most importantly, the space embraces the future of office technology, particularly through the advanced telecommunications systems, and promotes the efficiency and effectiveness of staff. The new workplace concept has allowed the company to increase occupancy within the same floor area by more than 60% and has been rapidly adopted as a standard for their organization.
LProjectCityDate
Project Stats....
CONFIDENTIAL TECHNOLOGY CLIENTPROTOTYPE WORKPLACESan Jose, CA2007
Area: ~324,000 SFStaff: Administrative OfficeTotal Headcount: 2,200Total Seat Count: 1,800Mobile Sharing Ratio: 3:2 (HC : Seats)
60% higher workplace occupancy per floor.
Confidential Technology Client, Sherman Takata. Activity Hub
Workplace Standards BenchmarkingMarch 2012 17
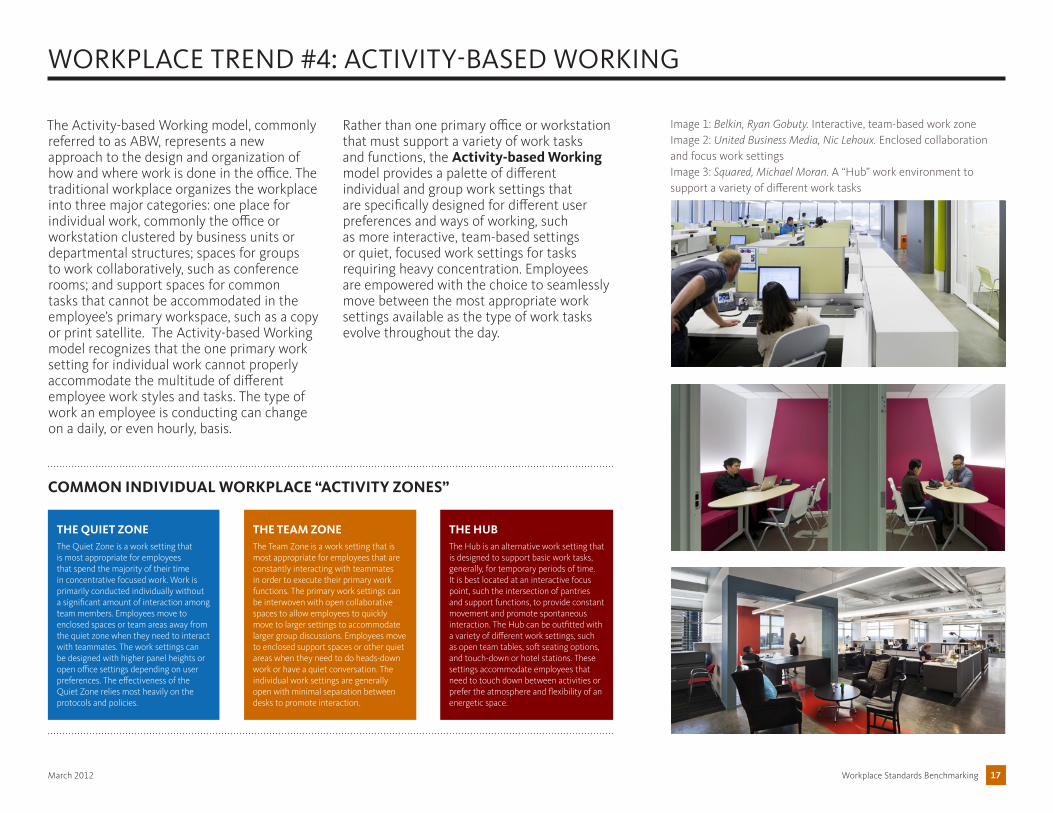
WORKPLACE TREND #4: ACTIVITY-BASED WORKING
The Activity-based Working model, commonly referred to as ABW, represents a new approach to the design and organization of how and where work is done in the office. The traditional workplace organizes the workplace into three major categories: one place for individual work, commonly the office or workstation clustered by business units or departmental structures; spaces for groups to work collaboratively, such as conference rooms; and support spaces for common tasks that cannot be accommodated in the employee’s primary workspace, such as a copy or print satellite. The Activity-based Working model recognizes that the one primary work setting for individual work cannot properly accommodate the multitude of different employee work styles and tasks. The type of work an employee is conducting can change on a daily, or even hourly, basis.
Rather than one primary office or workstation that must support a variety of work tasks and functions, the Activity-based Working model provides a palette of different individual and group work settings that are specifically designed for different user preferences and ways of working, such as more interactive, team-based settings or quiet, focused work settings for tasks requiring heavy concentration. Employees are empowered with the choice to seamlessly move between the most appropriate work settings available as the type of work tasks evolve throughout the day.
Image 1: Belkin, Ryan Gobuty. Interactive, team-based work zone Image 2: United Business Media, Nic Lehoux. Enclosed collaboration and focus work settings Image 3: Squared, Michael Moran. A “Hub” work environment to support a variety of different work tasks
COMMON INDIVIDUAL WORKPLACE “ACTIVITY ZONES”
THE HUBTHE TEAM ZONETHE QUIET ZONEThe Quiet Zone is a work setting that is most appropriate for employees that spend the majority of their time in concentrative focused work. Work is primarily conducted individually without a significant amount of interaction among team members. Employees move to enclosed spaces or team areas away from the quiet zone when they need to interact with teammates. The work settings can be designed with higher panel heights or open office settings depending on user preferences. The effectiveness of the Quiet Zone relies most heavily on the protocols and policies.
The Team Zone is a work setting that is most appropriate for employees that are constantly interacting with teammates in order to execute their primary work functions. The primary work settings can be interwoven with open collaborative spaces to allow employees to quickly move to larger settings to accommodate larger group discussions. Employees move to enclosed support spaces or other quiet areas when they need to do heads-down work or have a quiet conversation. The individual work settings are generally open with minimal separation between desks to promote interaction.
The Hub is an alternative work setting that is designed to support basic work tasks, generally, for temporary periods of time. It is best located at an interactive focus point, such the intersection of pantries and support functions, to provide constant movement and promote spontaneous interaction. The Hub can be outfitted with a variety of different work settings, such as open team tables, soft seating options, and touch-down or hotel stations. These settings accommodate employees that need to touch down between activities or prefer the atmosphere and flexibility of an energetic space.
Workplace Standards BenchmarkingMarch 2012 18
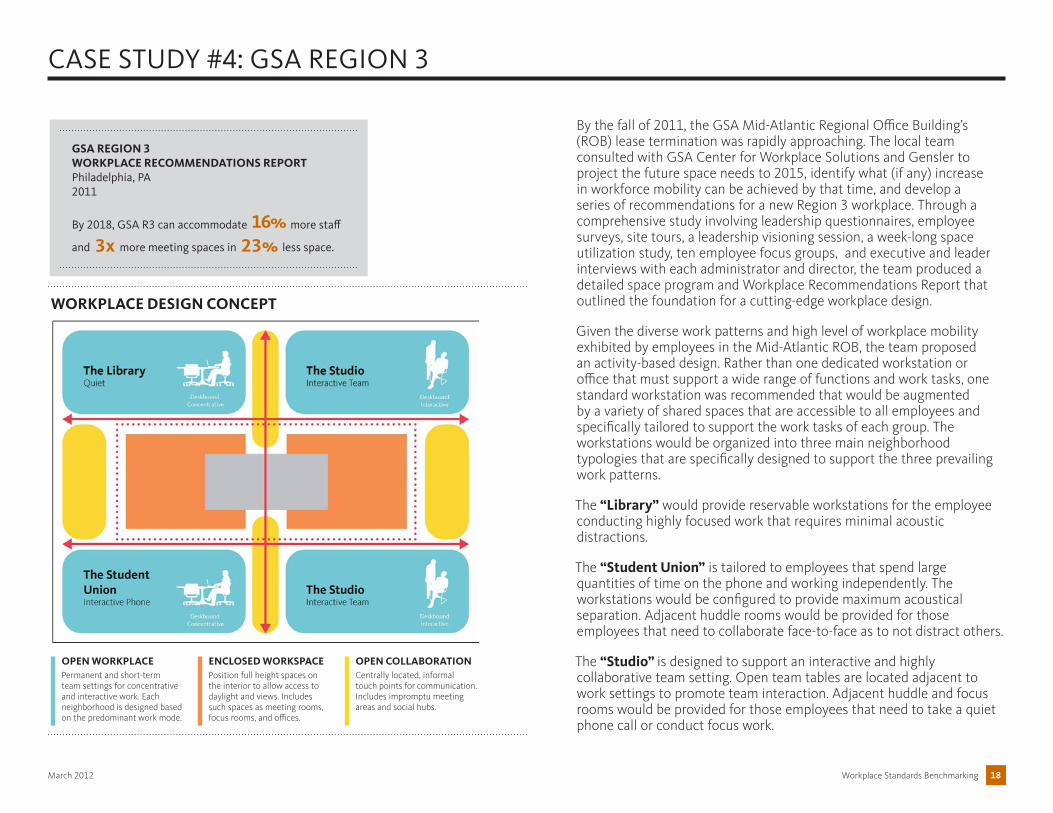
CASE STUDY #4: GSA REGION 3
By the fall of 2011, the GSA Mid-Atlantic Regional Office Building’s (ROB) lease termination was rapidly approaching. The local team consulted with GSA Center for Workplace Solutions and Gensler to project the future space needs to 2015, identify what (if any) increase in workforce mobility can be achieved by that time, and develop a series of recommendations for a new Region 3 workplace. Through a comprehensive study involving leadership questionnaires, employee surveys, site tours, a leadership visioning session, a week-long space utilization study, ten employee focus groups, and executive and leader interviews with each administrator and director, the team produced a detailed space program and Workplace Recommendations Report that outlined the foundation for a cutting-edge workplace design.
Given the diverse work patterns and high level of workplace mobility exhibited by employees in the Mid-Atlantic ROB, the team proposed an activity-based design. Rather than one dedicated workstation or office that must support a wide range of functions and work tasks, one standard workstation was recommended that would be augmented by a variety of shared spaces that are accessible to all employees and specifically tailored to support the work tasks of each group. The workstations would be organized into three main neighborhood typologies that are specifically designed to support the three prevailing work patterns.
The “Library” would provide reservable workstations for the employee conducting highly focused work that requires minimal acoustic distractions.
The “Student Union” is tailored to employees that spend large quantities of time on the phone and working independently. The workstations would be configured to provide maximum acoustical separation. Adjacent huddle rooms would be provided for those employees that need to collaborate face-to-face as to not distract others.
The “Studio” is designed to support an interactive and highly collaborative team setting. Open team tables are located adjacent to work settings to promote team interaction. Adjacent huddle and focus rooms would be provided for those employees that need to take a quiet phone call or conduct focus work.
OPEN WORKPLACEPermanent and short-term team settings for concentrative and interactive work. Each neighborhood is designed based on the predominant work mode.
ENCLOSED WORKSPACEPosition full height spaces on the interior to allow access to daylight and views. Includes such spaces as meeting rooms, focus rooms, and offices.
OPEN COLLABORATIONCentrally located, informal touch points for communication. Includes impromptu meeting areas and social hubs.
WORKPLACE DESIGN CONCEPT
GSA REGION 3 WORKPLACE RECOMMENDATIONS REPORTPhiladelphia, PA2011
By 2018, GSA R3 can accommodate more staff
and more meeting spaces in less space.
16% 3x 23%
Workplace Standards BenchmarkingMarch 2012 A1
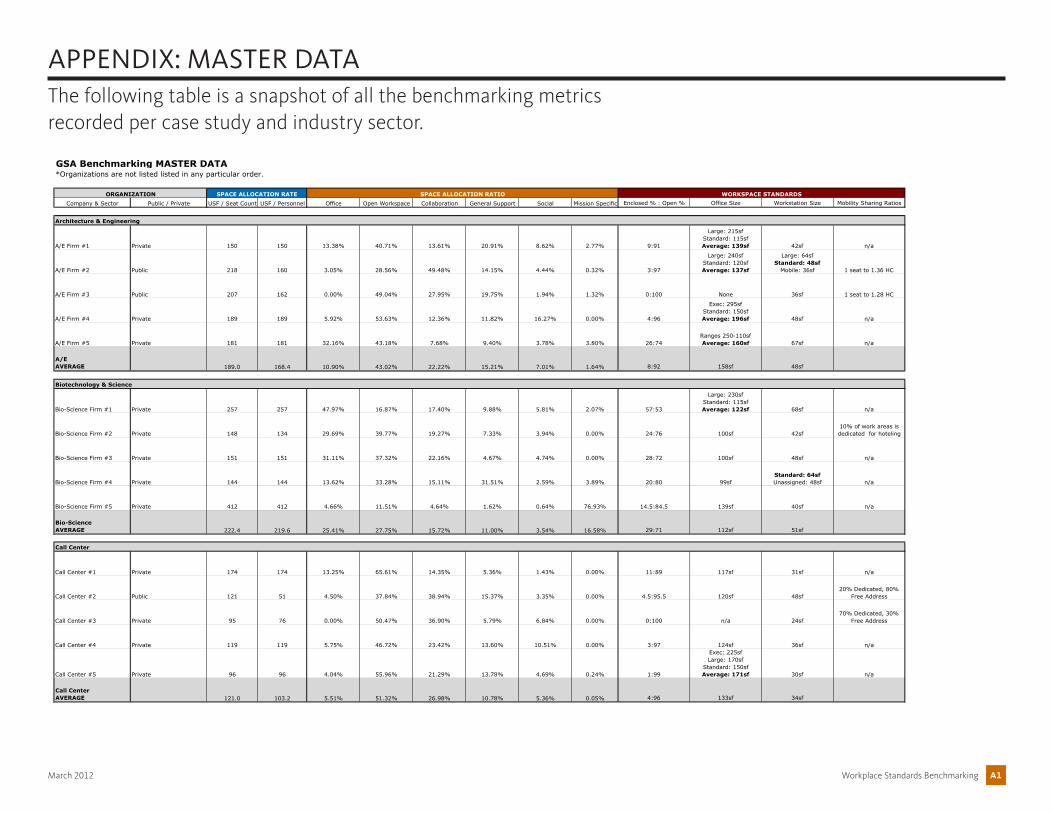
GSA Benchmarking MASTER DATA*Organizations are not listed listed in any particular order.
ORGANIZATION SPACE ALLOCATION RATE SPACE ALLOCATION RATIO WORKSPACE STANDARDSCompany & Sector Public / Private USF / Seat Count USF / Personnel Office Open Workspace Collaboration General Support Social Mission Specific Enclosed % : Open % Office Size Workstation Size Mobility Sharing Ratios
Architecture & Engineering
A/E Firm #1 Private 150 150 13.38% 40.71% 13.61% 20.91% 8.62% 2.77% 9:91
Large: 215sfStandard: 115sfAverage: 139sf 42sf n/a
A/E Firm #2 Public 218 160 3.05% 28.56% 49.48% 14.15% 4.44% 0.32% 3:97
Large: 240sfStandard: 120sfAverage: 137sf
Large: 64sfStandard: 48sf
Mobile: 36sf 1 seat to 1.36 HC
A/E Firm #3 Public 207 162 0.00% 49.04% 27.95% 19.75% 1.94% 1.32% 0:100 None 36sf 1 seat to 1.28 HC
A/E Firm #4 Private 189 189 5.92% 53.63% 12.36% 11.82% 16.27% 0.00% 4:96
Exec: 295sfStandard: 150sfAverage: 196sf 48sf n/a
A/E Firm #5 Private 181 181 32.16% 43.18% 7.68% 9.40% 3.78% 3.80% 26:74Ranges 250-110sfAverage: 160sf 67sf n/a
A/EAVERAGE 189.0 168.4 10.90% 43.02% 22.22% 15.21% 7.01% 1.64% 8:92 158sf 48sf
Biotechnology & Science
Bio-Science Firm #1 Private 257 257 47.97% 16.87% 17.40% 9.88% 5.81% 2.07% 57:53
Large: 230sfStandard: 115sfAverage: 122sf 68sf n/a
Bio-Science Firm #2 Private 148 134 29.69% 39.77% 19.27% 7.33% 3.94% 0.00% 24:76 100sf 42sf10% of work areas is dedicated for hoteling
Bio-Science Firm #3 Private 151 151 31.11% 37.32% 22.16% 4.67% 4.74% 0.00% 28:72 100sf 48sf n/a
Bio-Science Firm #4 Private 144 144 13.62% 33.28% 15.11% 31.51% 2.59% 3.89% 20:80 99sfStandard: 64sfUnassigned: 48sf n/a
Bio-Science Firm #5 Private 412 412 4.66% 11.51% 4.64% 1.62% 0.64% 76.93% 14.5:84.5 139sf 40sf n/a
Bio-ScienceAVERAGE 222.4 219.6 25.41% 27.75% 15.72% 11.00% 3.54% 16.58% 29:71 112sf 51sf
Call Center
Call Center #1 Private 174 174 13.25% 65.61% 14.35% 5.36% 1.43% 0.00% 11:89 117sf 31sf n/a
Call Center #2 Public 121 51 4.50% 37.84% 38.94% 15.37% 3.35% 0.00% 4.5:95.5 120sf 48sf20% Dedicated, 80%
Free Address
Call Center #3 Private 95 76 0.00% 50.47% 36.90% 5.79% 6.84% 0.00% 0:100 n/a 24sf70% Dedicated, 30%
Free Address
Call Center #4 Private 119 119 5.75% 46.72% 23.42% 13.60% 10.51% 0.00% 3:97 124sf 36sf n/a
Call Center #5 Private 96 96 4.04% 55.96% 21.29% 13.78% 4.69% 0.24% 1:99
Exec: 225sfLarge: 170sf
Standard: 150sfAverage: 171sf 30sf n/a
Call CenterAVERAGE 121.0 103.2 5.51% 51.32% 26.98% 10.78% 5.36% 0.05% 4:96 133sf 34sf
APPENDIX: MASTER DATAThe following table is a snapshot of all the benchmarking metrics recorded per case study and industry sector.
Workplace Standards BenchmarkingMarch 2012 A2
GSA Benchmarking MASTER DATA*Organizations are not listed listed in any particular order.
ORGANIZATION SPACE ALLOCATION RATE SPACE ALLOCATION RATIO WORKSPACE STANDARDSCompany & Sector Public / Private USF / Seat Count USF / Personnel Office Open Workspace Collaboration General Support Social Mission Specific Enclosed % : Open % Office Size Workstation Size Mobility Sharing Ratios
Finance
Finance Firm #1 Private 164 164 32.60% 25.60% 14.60% 17.90% 9.30% 0.00% 30:70
Perimeter: 180sfStandard: 90sf
Average: 106sf 40sf n/a
Finance Firm #2 Private 239 239 42.49% 23.93% 14.14% 14.84% 4.01% 0.59% 43:57
Large: 170sfStandard: 115sfAverage: 139sf 50sf n/a
Finance Firm #3 Private 112 112 21.95% 49.93% 12.04% 11.18% 4.90% 0.00% 37:63
Exec: 225sfLarge: 150sf
Standard: 115sfAverage: 147sf 42sf n/a
Finance Firm #4 Private 180 180 10.02% 47.99% 20.94% 15.53% 5.52% 0.00% 8:92 140sfLarge: 90sf
Standard: 54sf n/a
Finance Firm #5 Private 145 145 44.84% 39.23% 5.72% 8.69% 1.52% 0.00% 27:73
Exec: 250sfLarge: 200sf
Standard: 125sfAverage: 162sf 56sf n/a
FinanceAVERAGE 168.0 168.0 30.38% 37.34% 13.49% 13.63% 5.05% 0.12% 29:71 139sf 48sf None
Law Enforcement
Law Enforcement #1 Public 204 101 0.00% 30.56% 46.17% 18.26% 5.01% 0.00% 0:100 n/aStandard: 48sfRoaming: 36sf 1 seat to 2 HC
Law Enforcement #2 Public 239 199 18.34% 22.97% 17.67% 18.84% 4.99% 17.19% 21:79
Exec: 225sfStandard: 100sf - 150sf
Average: 140sf
Large: 80sf - 100sfStandard: 48-60sf
Average: 64sf n/a
Law Enforcement #3 Public 239 239 12.02% 29.22% 18.87% 16.41% 1.19% 22.29% 10:90
Large: 225sf-350sfStandard: 150sfAverage: 164sf
Large: 64sfStandard: 48sf n/a
Law Enforcement #4 Public 226 219 13.09% 40.54% 16.77% 14.31% 2.30% 12.99% 11:89
Exec: 400-300sfLarge: 200sf - 150sf
Standard: 100sfAverage: 173sf
Supervisory: 90sfStandard: 64sf n/a
Law Enforcement #5 Public 244 240 27.67% 38.54% 14.62% 13.14% 4.54% 1.49% 28:72
Exec: 300sfLarge: 225sf
Standard: 150sfAverage: 152sf 64sf n/a
Law EnforcementAVERAGE 230.4 199.6 14.22% 32.37% 22.82% 16.19% 3.61% 10.79% 14:86 157sf 58sf
Legal
Legal Firm #1 Public 288 288 47.34% 13.62% 14.06% 14.38% 2.22% 8.38% 43:57
Large: 200sf-225sfMedium: 180sfStandard:150sf
Average: 170sfLarge: 100sf
Standard: 80sf n/a
Legal Firm #2 Public 336 336 30.91% 10.26% 37.89% 17.18% 3.76% 0.00% 43:57
Exec: 250sfLarge: 200sf
Standard: 120sfAverage: 171sf
Standard: 64sfIntern: 36sf n/a
Legal Firm #3 Private 539 539 39.72% 4.51% 13.13% 20.79% 5.44% 16.41% 83:17
Large: 225sfPerimeter: 150sfStandard: 100sfAverage: 168sf 100sf n/a
Legal Firm #4 Private 269 269 50.91% 11.01% 15.53% 13.37% 4.27% 4.91% 69:31
Exec: 215sfPerimeter: 135sfStandard: 100sfAverage: 145sf 75sf n/a
Legal Firm #5 Private 243 243 46.88% 12.26% 16.41% 12.81% 4.19% 7.45% 62:38
Perimeter: 200sfStandard: 130sfAverage: 135sf
Large: 75sfStandard: 42sfAverage: 58sf n/a
LegalAVERAGE 335.0 335.0 43.15% 10.33% 19.40% 15.71% 3.98% 7.43% 60:40 158sf 75sf n/a
APPENDIX: MASTER DATAThe following table is a snapshot of all the benchmarking metrics recorded per case study and industry sector.
Workplace Standards BenchmarkingMarch 2012 A3
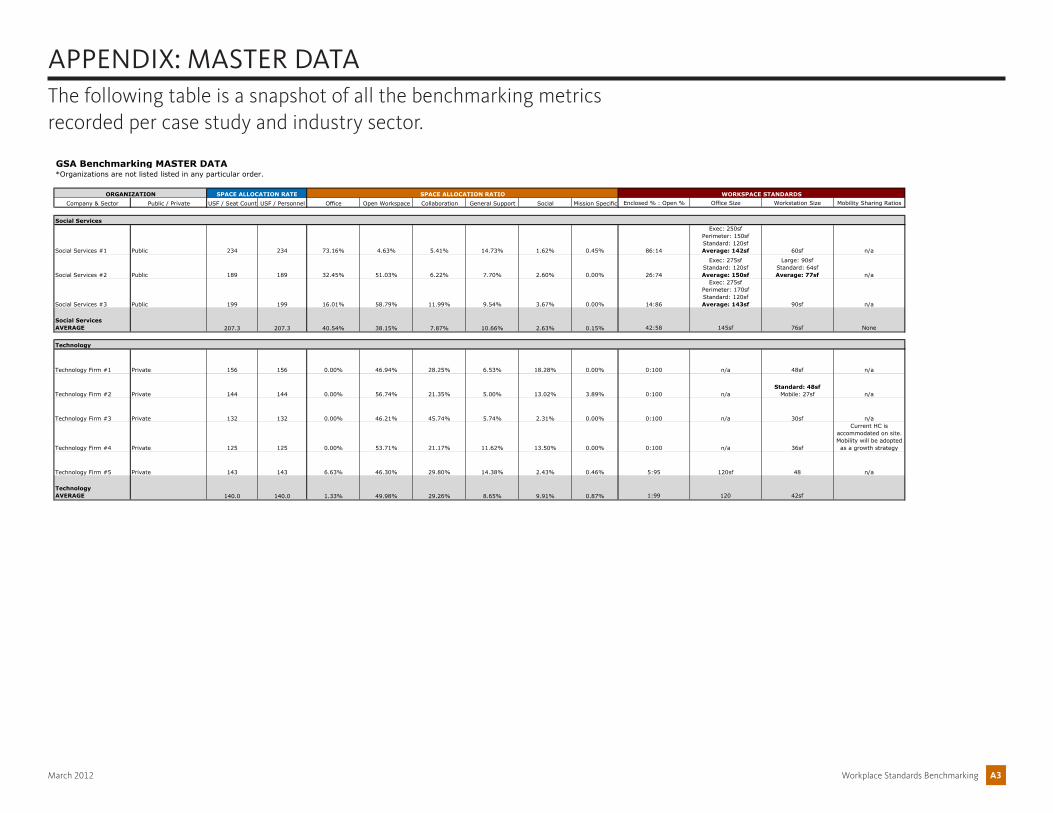
APPENDIX: MASTER DATA
GSA Benchmarking MASTER DATA*Organizations are not listed listed in any particular order.
ORGANIZATION SPACE ALLOCATION RATE SPACE ALLOCATION RATIO WORKSPACE STANDARDSCompany & Sector Public / Private USF / Seat Count USF / Personnel Office Open Workspace Collaboration General Support Social Mission Specific Enclosed % : Open % Office Size Workstation Size Mobility Sharing Ratios
Social Services
Social Services #1 Public 234 234 73.16% 4.63% 5.41% 14.73% 1.62% 0.45% 86:14
Exec: 250sfPerimeter: 150sfStandard: 120sfAverage: 142sf 60sf n/a
Social Services #2 Public 189 189 32.45% 51.03% 6.22% 7.70% 2.60% 0.00% 26:74
Exec: 275sfStandard: 120sfAverage: 150sf
Large: 90sfStandard: 64sfAverage: 77sf n/a
Social Services #3 Public 199 199 16.01% 58.79% 11.99% 9.54% 3.67% 0.00% 14:86
Exec: 275sfPerimeter: 170sfStandard: 120sfAverage: 143sf 90sf n/a
Social ServicesAVERAGE 207.3 207.3 40.54% 38.15% 7.87% 10.66% 2.63% 0.15% 42:58 145sf 76sf None
Technology
Technology Firm #1 Private 156 156 0.00% 46.94% 28.25% 6.53% 18.28% 0.00% 0:100 n/a 48sf n/a
Technology Firm #2 Private 144 144 0.00% 56.74% 21.35% 5.00% 13.02% 3.89% 0:100 n/aStandard: 48sf
Mobile: 27sf n/a
Technology Firm #3 Private 132 132 0.00% 46.21% 45.74% 5.74% 2.31% 0.00% 0:100 n/a 30sf n/a
Technology Firm #4 Private 125 125 0.00% 53.71% 21.17% 11.62% 13.50% 0.00% 0:100 n/a 36sf
Current HC is accommodated on site. Mobility will be adopted as a growth strategy
Technology Firm #5 Private 143 143 6.63% 46.30% 29.80% 14.38% 2.43% 0.46% 5:95 120sf 48 n/a
TechnologyAVERAGE 140.0 140.0 1.33% 49.98% 29.26% 8.65% 9.91% 0.87% 1:99 120 42sf
The following table is a snapshot of all the benchmarking metrics recorded per case study and industry sector.
Workplace Standards BenchmarkingMarch 2012 A4
140
150
170
160
180
190
200
210
220
230
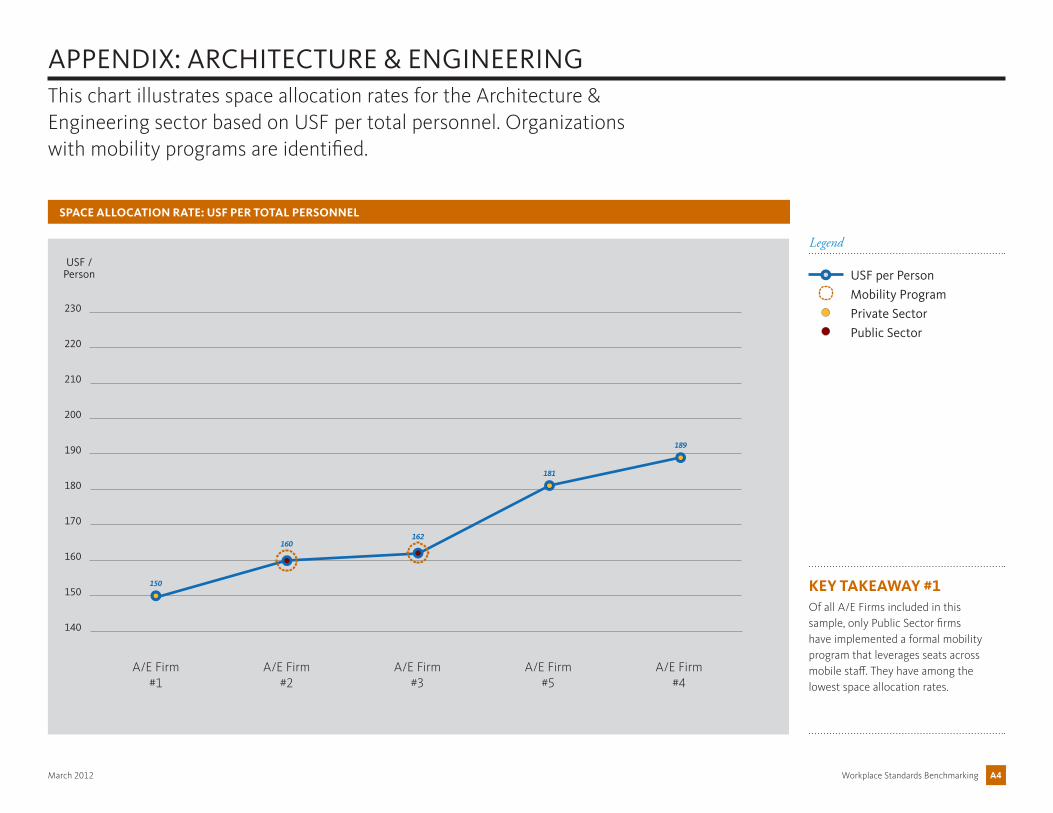
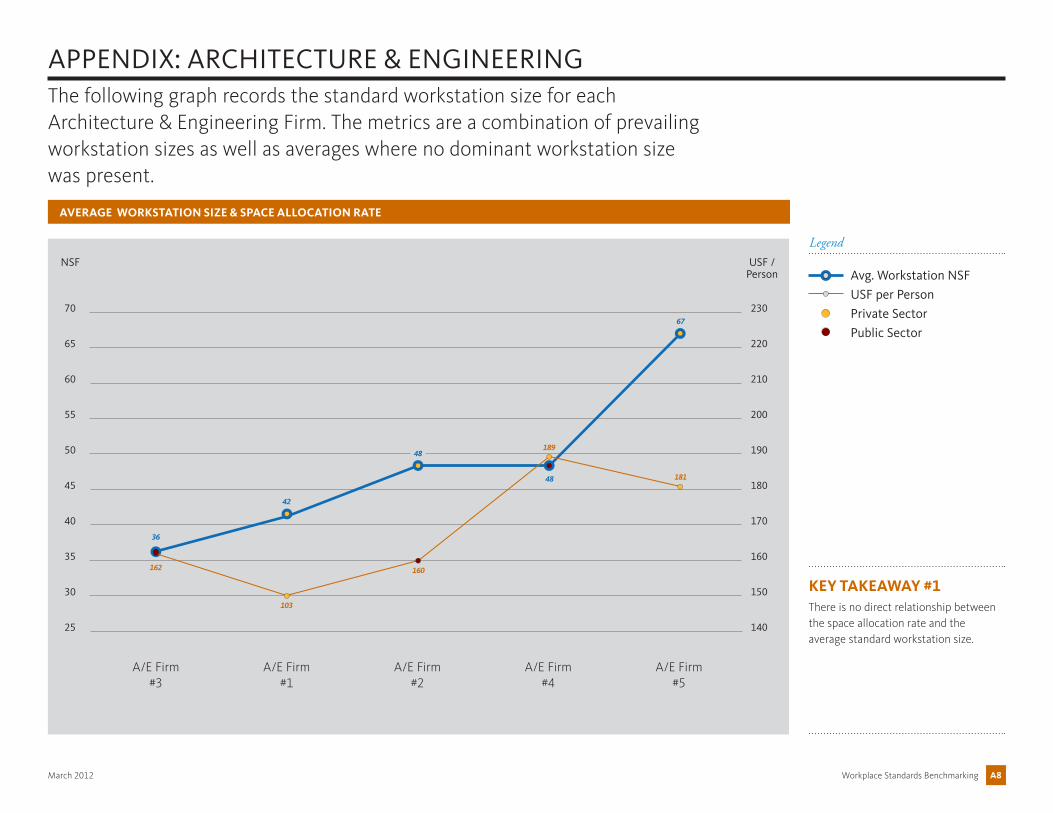
APPENDIX: ARCHITECTURE & ENGINEERING
SPACE ALLOCATION RATE: USF PER TOTAL PERSONNEL
This chart illustrates space allocation rates for the Architecture & Engineering sector based on USF per total personnel. Organizations with mobility programs are identified.
USF /Person
A/E Firm#2
A/E Firm#1
A/E Firm#3
A/E Firm#5
A/E Firm#4
KEY TAKEAWAY #1Of all A/E Firms included in this sample, only Public Sector firms have implemented a formal mobility program that leverages seats across mobile staff. They have among the lowest space allocation rates.
USF per Person
Mobility Program
Private Sector
Public Sector
Legend
150
160162
181
189
Workplace Standards BenchmarkingMarch 2012 A5
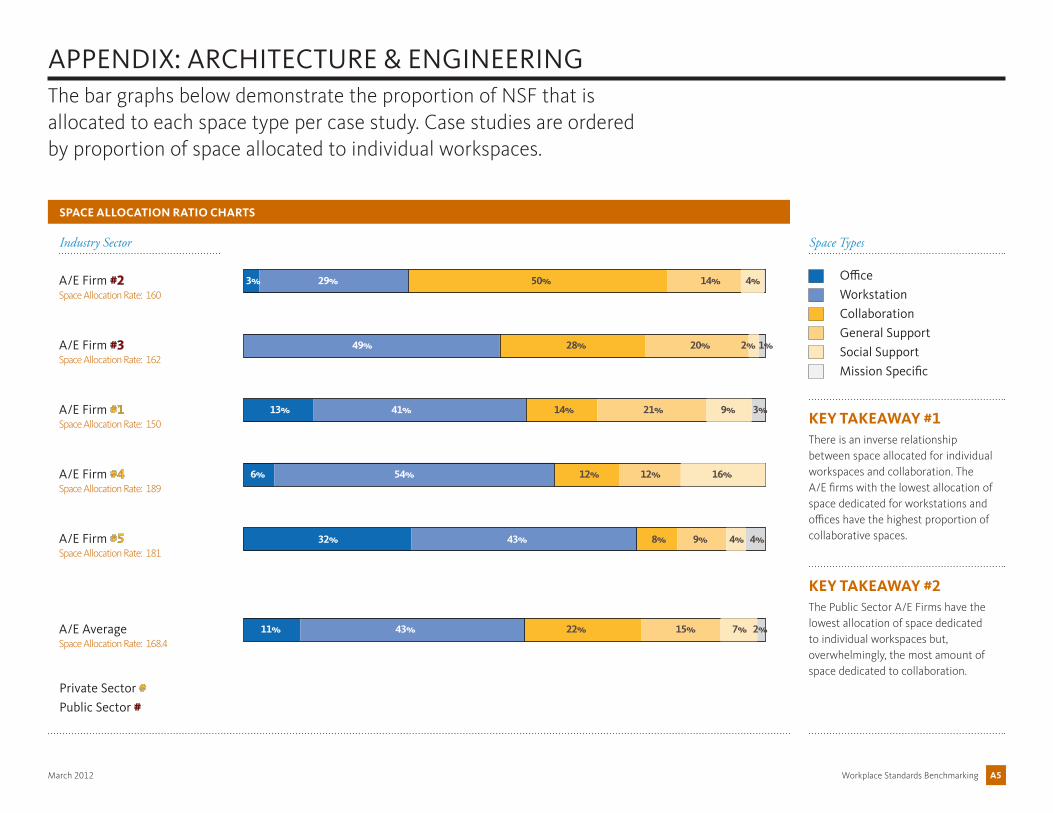
APPENDIX: ARCHITECTURE & ENGINEERING
SPACE ALLOCATION RATIO CHARTS
The bar graphs below demonstrate the proportion of NSF that is allocated to each space type per case study. Case studies are ordered by proportion of space allocated to individual workspaces.
KEY TAKEAWAY #1There is an inverse relationship between space allocated for individual workspaces and collaboration. The A/E firms with the lowest allocation of space dedicated for workstations and offices have the highest proportion of collaborative spaces.
KEY TAKEAWAY #2The Public Sector A/E Firms have the lowest allocation of space dedicated to individual workspaces but, overwhelmingly, the most amount of space dedicated to collaboration.
3% 29% 50% 14% 4%
6% 54% 12% 12% 16%
49% 28% 20% 2% 1%
13% 41% 14% 21% 9% 3%
32% 43% 8% 9% 4% 4%
11% 43% 22% 15% 7% 2%
Private Sector #Public Sector #
Office
Workstation
Collaboration
General Support
Social Support
Mission Specific
Space TypesIndustry Sector
A/E Firm #2
A/E Firm #3
A/E Firm #1
A/E Firm #5
A/E Firm #4
A/E Average
Space Allocation Rate: 160
Space Allocation Rate: 162
Space Allocation Rate: 150
Space Allocation Rate: 189
Space Allocation Rate: 181
Space Allocation Rate: 168.4
Workplace Standards BenchmarkingMarch 2012 A6
APPENDIX: ARCHITECTURE & ENGINEERING
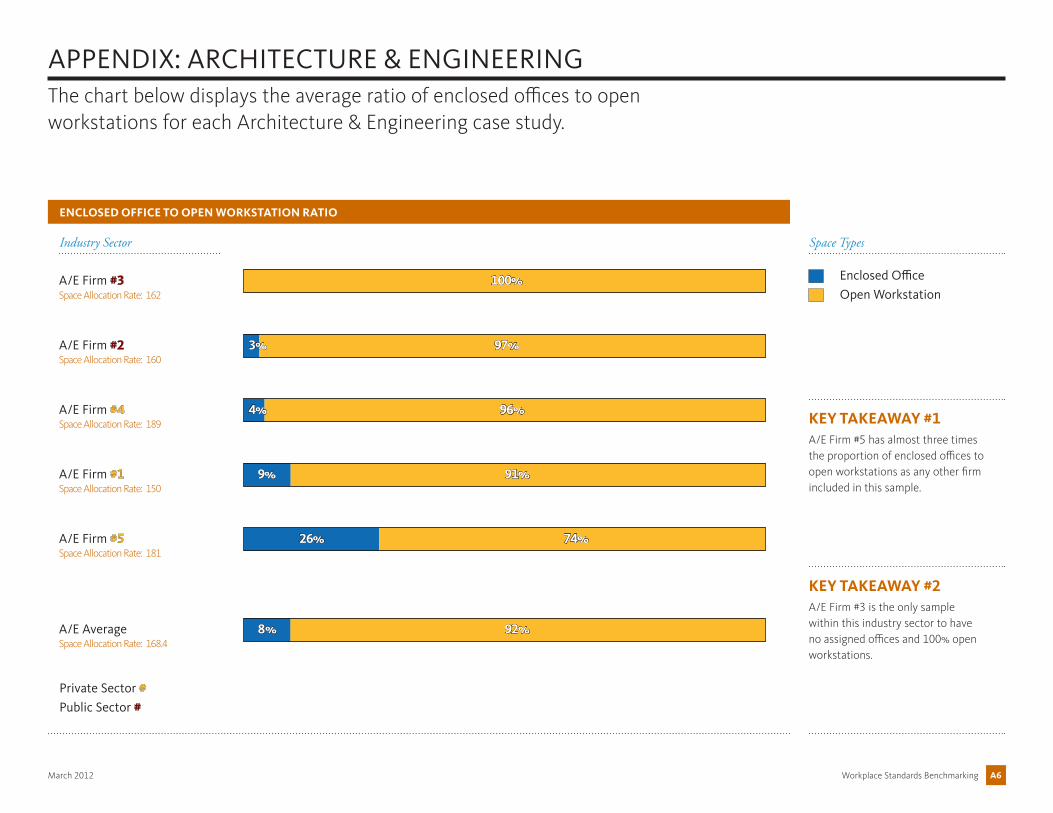
ENCLOSED OFFICE TO OPEN WORKSTATION RATIO
The chart below displays the average ratio of enclosed offices to open workstations for each Architecture & Engineering case study.
KEY TAKEAWAY #1A/E Firm #5 has almost three times the proportion of enclosed offices to open workstations as any other firm included in this sample.
KEY TAKEAWAY #2A/E Firm #3 is the only sample within this industry sector to have no assigned offices and 100% open workstations.
100%A/E Firm #3
3% 97%A/E Firm #2
4% 96%A/E Firm #4
26% 74%A/E Firm #5
9% 91%A/E Firm #1
8% 92%A/E Average
Enclosed Office
Open Workstation
Space TypesIndustry Sector
Private Sector #Public Sector #
Space Allocation Rate: 162
Space Allocation Rate: 160
Space Allocation Rate: 189
Space Allocation Rate: 150
Space Allocation Rate: 181
Space Allocation Rate: 168.4
Workplace Standards BenchmarkingMarch 2012 A7
APPENDIX: ARCHITECTURE & ENGINEERING
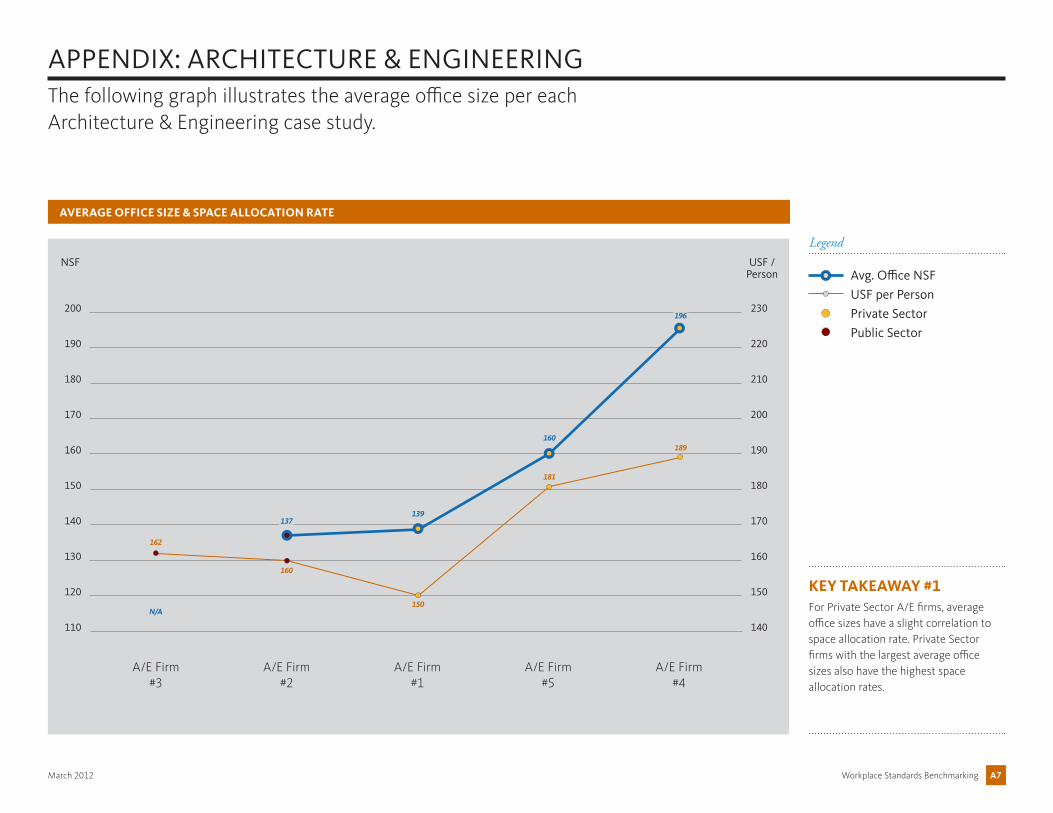
AVERAGE OFFICE SIZE & SPACE ALLOCATION RATE
The following graph illustrates the average office size per each Architecture & Engineering case study.
KEY TAKEAWAY #1For Private Sector A/E firms, average office sizes have a slight correlation to space allocation rate. Private Sector firms with the largest average office sizes also have the highest space allocation rates.
USF /Person
A/E Firm#2
A/E Firm#3
A/E Firm#1
A/E Firm#5
A/E Firm#4
NSF
140
150
160
170
180
190
200
210
220
230
110
120
140
130
150
160
170
180
190
200
Avg. Office NSF
USF per Person
Private Sector
Public Sector
Legend
N/A
162
137
160
139
150
160
181
196
189
Workplace Standards BenchmarkingMarch 2012 A8
48
APPENDIX: ARCHITECTURE & ENGINEERING
AVERAGE WORKSTATION SIZE & SPACE ALLOCATION RATE
KEY TAKEAWAY #1There is no direct relationship between the space allocation rate and the average standard workstation size.
NSF USF /Person
A/E Firm#1
A/E Firm#3
A/E Firm#2
A/E Firm#4
A/E Firm#5
25
30
40
35
45
50
55
60
65
70
140
150
160
170
180
190
200
210
220
230
Avg. Workstation NSF
USF per Person
Private Sector
Public Sector
Legend
The following graph records the standard workstation size for each Architecture & Engineering Firm. The metrics are a combination of prevailing workstation sizes as well as averages where no dominant workstation size was present.
36
162
42
103
48189
160
67
181
Workplace Standards BenchmarkingMarch 2012 A9
257
151
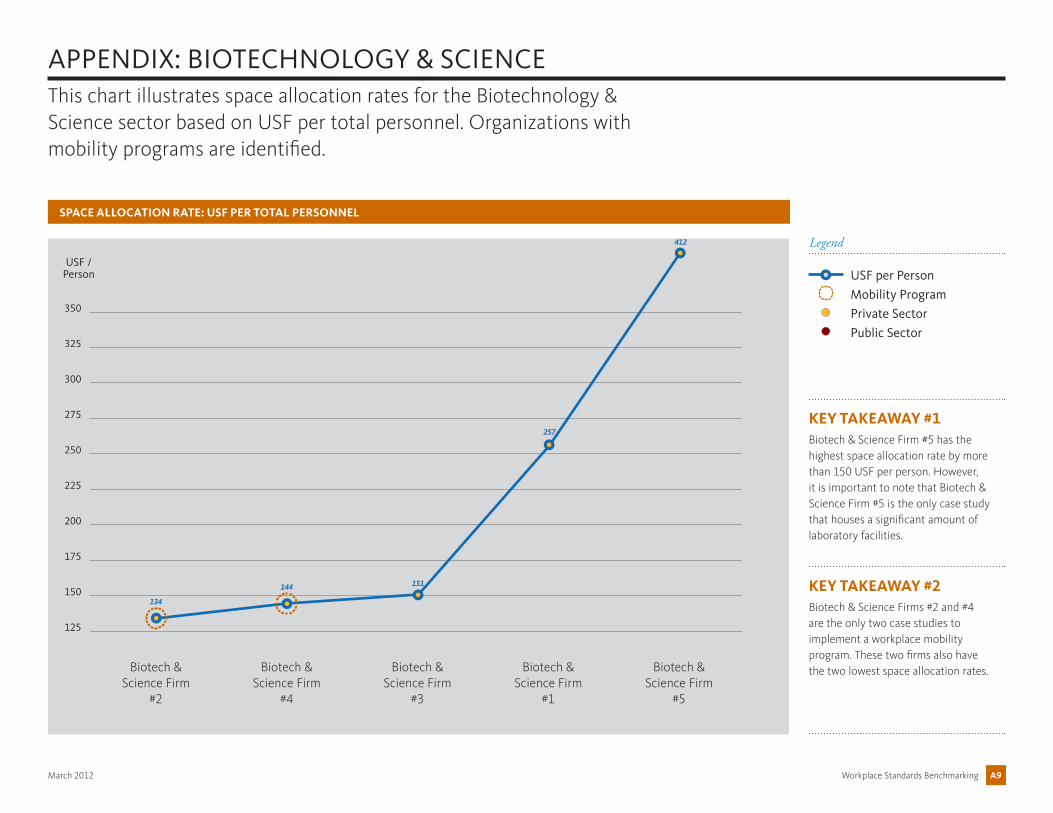
KEY TAKEAWAY #1Biotech & Science Firm #5 has the highest space allocation rate by more than 150 USF per person. However, it is important to note that Biotech & Science Firm #5 is the only case study that houses a significant amount of laboratory facilities.
APPENDIX: BIOTECHNOLOGY & SCIENCE
SPACE ALLOCATION RATE: USF PER TOTAL PERSONNEL
This chart illustrates space allocation rates for the Biotechnology & Science sector based on USF per total personnel. Organizations with mobility programs are identified.
125
USF /Person
150
200
175
225
250
275
300
325
350
Biotech & Science Firm
#4
Biotech & Science Firm
#2
Biotech & Science Firm
#3
Biotech & Science Firm
#1
Biotech & Science Firm
#5
KEY TAKEAWAY #2Biotech & Science Firms #2 and #4 are the only two case studies to implement a workplace mobility program. These two firms also have the two lowest space allocation rates.
USF per Person
Mobility Program
Private Sector
Public Sector
Legend
134
144
412
Workplace Standards BenchmarkingMarch 2012 A10
SPACE ALLOCATION RATIO CHARTS
The bar graphs below demonstrate the proportion of NSF that is allocated to each space type per case study. Case studies are ordered by proportion of space allocated to individual workspaces.
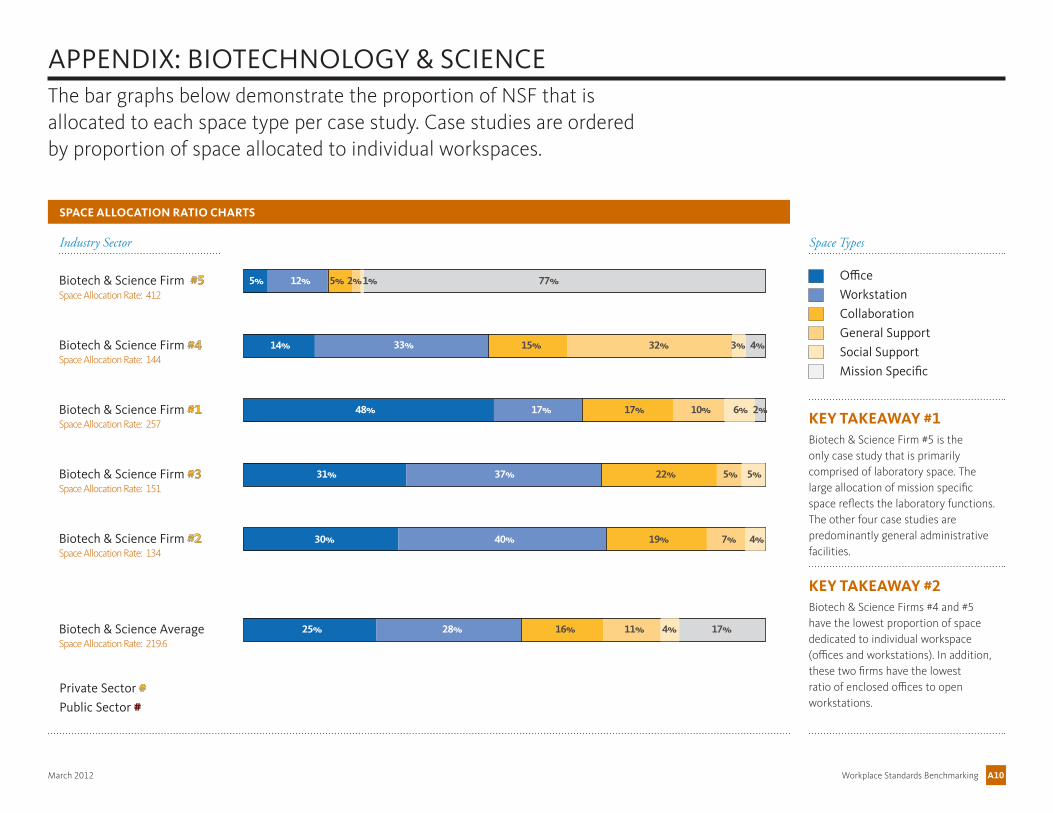
KEY TAKEAWAY #1Biotech & Science Firm #5 is the only case study that is primarily comprised of laboratory space. The large allocation of mission specific space reflects the laboratory functions. The other four case studies are predominantly general administrative facilities.
KEY TAKEAWAY #2Biotech & Science Firms #4 and #5 have the lowest proportion of space dedicated to individual workspace (offices and workstations). In addition, these two firms have the lowest ratio of enclosed offices to open workstations.
APPENDIX: BIOTECHNOLOGY & SCIENCE
31% 37% 22% 5% 5%
30% 40% 19% 7% 4%
5% 12% 5% 2%1% 77%
14% 33% 15% 32% 3% 4%
48% 17% 17% 10% 6% 2%
25% 28% 16% 11% 4% 17%
Office
Workstation
Collaboration
General Support
Social Support
Mission Specific
Space TypesIndustry Sector
Private Sector #Public Sector #
Biotech & Science Firm #5
Biotech & Science Firm #4
Biotech & Science Firm #1
Biotech & Science Firm #2
Biotech & Science Firm #3
Biotech & Science Average
Space Allocation Rate: 412
Space Allocation Rate: 144
Space Allocation Rate: 257
Space Allocation Rate: 151
Space Allocation Rate: 134
Space Allocation Rate: 219.6
Workplace Standards BenchmarkingMarch 2012 A11
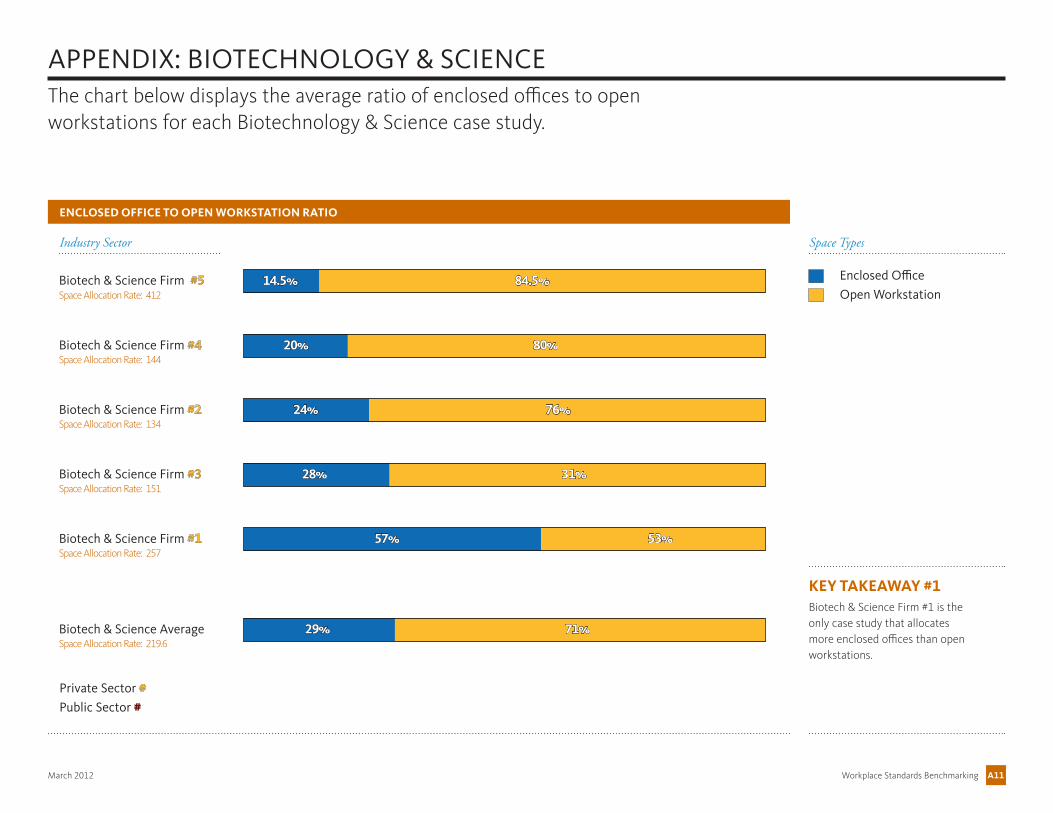
The chart below displays the average ratio of enclosed offices to open workstations for each Biotechnology & Science case study.
KEY TAKEAWAY #1Biotech & Science Firm #1 is the only case study that allocates more enclosed offices than open workstations.
14.5% 84.5%
20% 80%
24% 76%
28% 31%
57% 53%
APPENDIX: BIOTECHNOLOGY & SCIENCE
ENCLOSED OFFICE TO OPEN WORKSTATION RATIO
29% 71%
Enclosed Office
Open Workstation
Space TypesIndustry Sector
Private Sector #Public Sector #
Biotech & Science Firm #5
Biotech & Science Firm #4
Biotech & Science Firm #2
Biotech & Science Firm #1
Biotech & Science Firm #3
Biotech & Science Average
Space Allocation Rate: 412
Space Allocation Rate: 144
Space Allocation Rate: 134
Space Allocation Rate: 151
Space Allocation Rate: 257
Space Allocation Rate: 219.6
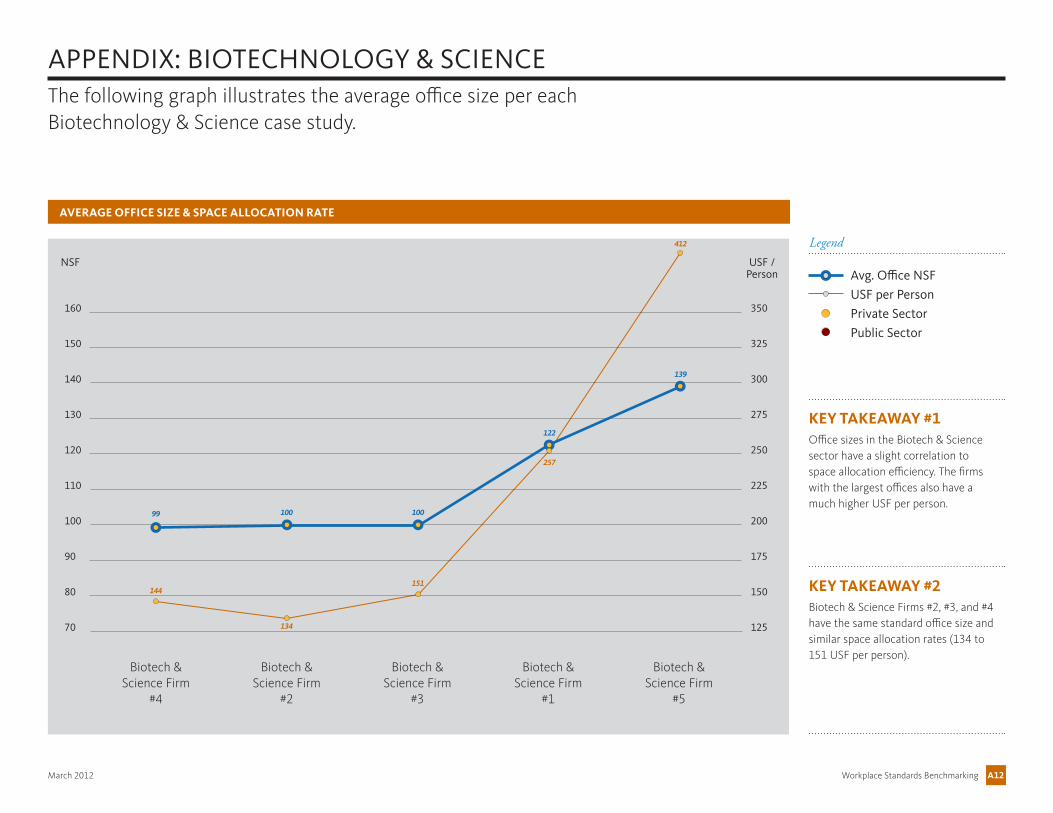
Workplace Standards BenchmarkingMarch 2012 A12
151
257
AVERAGE OFFICE SIZE & SPACE ALLOCATION RATE
The following graph illustrates the average office size per each Biotechnology & Science case study.
KEY TAKEAWAY #1Office sizes in the Biotech & Science sector have a slight correlation to space allocation efficiency. The firms with the largest offices also have a much higher USF per person.
KEY TAKEAWAY #2Biotech & Science Firms #2, #3, and #4 have the same standard office size and similar space allocation rates (134 to 151 USF per person).
USF /Person
Biotech & Science Firm
#2
Biotech & Science Firm
#4
Biotech & Science Firm
#3
Biotech & Science Firm
#1
Biotech & Science Firm
#5
NSF
APPENDIX: BIOTECHNOLOGY & SCIENCE
125
150
175
200
225
250
275
300
325
350
70
80
100
90
110
120
130
140
150
160
Avg. Office NSF
USF per Person
Private Sector
Public Sector
Legend
99
144
100
134
100
122
139
412
Workplace Standards BenchmarkingMarch 2012 A13
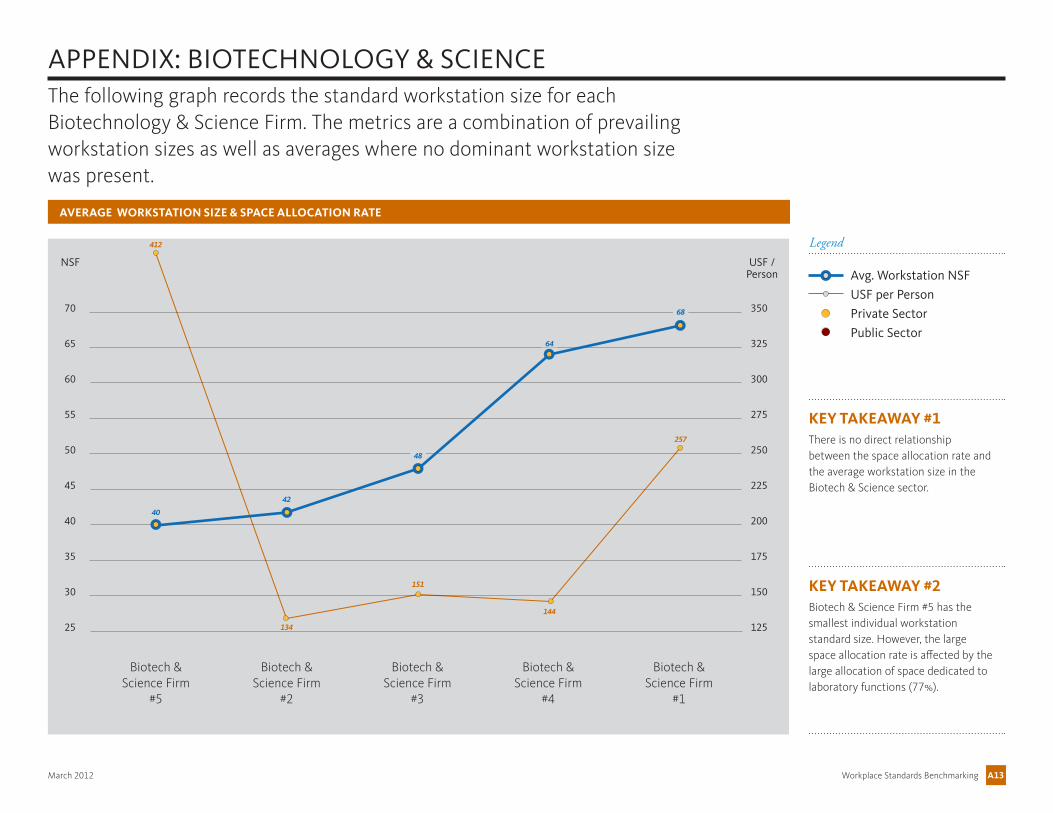
AVERAGE WORKSTATION SIZE & SPACE ALLOCATION RATE
KEY TAKEAWAY #1There is no direct relationship between the space allocation rate and the average workstation size in the Biotech & Science sector.
KEY TAKEAWAY #2Biotech & Science Firm #5 has the smallest individual workstation standard size. However, the large space allocation rate is affected by the large allocation of space dedicated to laboratory functions (77%).
NSF
Biotech & Science Firm
#2
Biotech & Science Firm
#5
Biotech & Science Firm
#3
Biotech & Science Firm
#4
Biotech & Science Firm
#1
The following graph records the standard workstation size for each Biotechnology & Science Firm. The metrics are a combination of prevailing workstation sizes as well as averages where no dominant workstation size was present.
APPENDIX: BIOTECHNOLOGY & SCIENCE
USF /Person
125
150
175
200
225
250
275
300
325
350
25
30
40
35
45
50
55
60
65
70
Avg. Workstation NSF
USF per Person
Private Sector
Public Sector
Legend
40
412
42
134
48
151
64
144
68
257
Workplace Standards BenchmarkingMarch 2012 A14
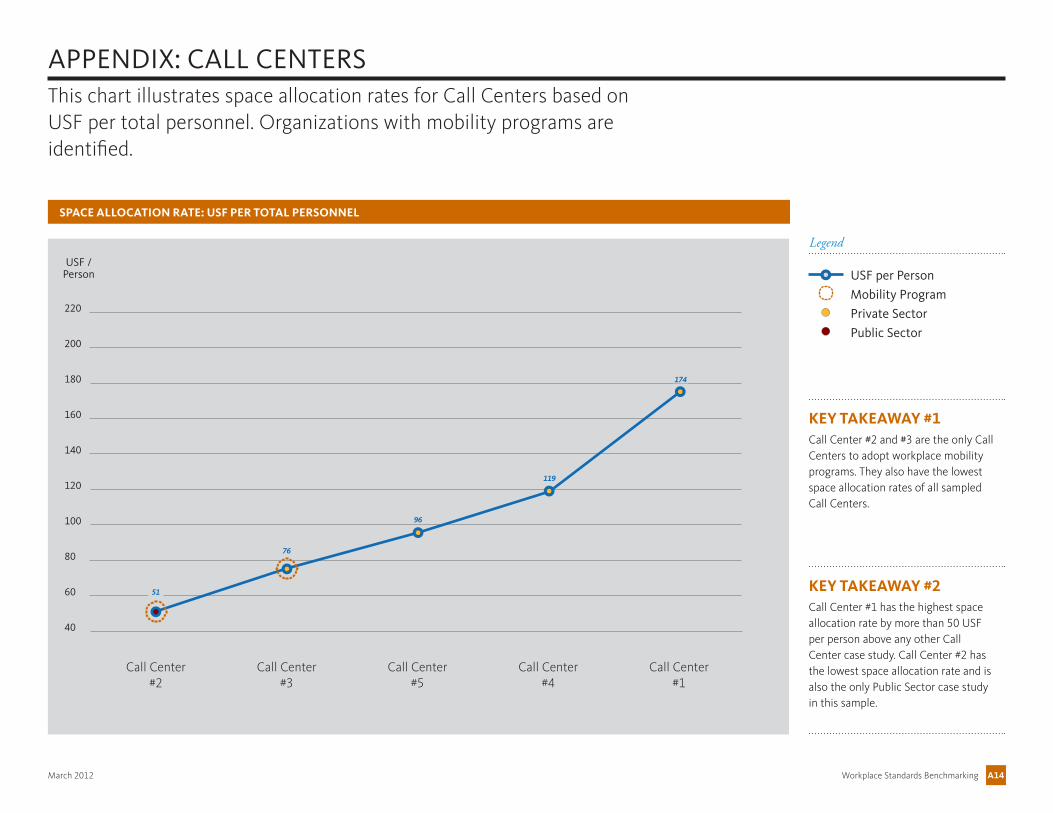
KEY TAKEAWAY #1Call Center #2 and #3 are the only Call Centers to adopt workplace mobility programs. They also have the lowest space allocation rates of all sampled Call Centers.
APPENDIX: CALL CENTERS
SPACE ALLOCATION RATE: USF PER TOTAL PERSONNEL
This chart illustrates space allocation rates for Call Centers based on USF per total personnel. Organizations with mobility programs are identified.
USF /Person
Call Center #3
Call Center #2
Call Center #5
Call Center #4
Call Center #1
KEY TAKEAWAY #2Call Center #1 has the highest space allocation rate by more than 50 USF per person above any other Call Center case study. Call Center #2 has the lowest space allocation rate and is also the only Public Sector case study in this sample.
40
60
100
80
120
140
160
180
200
220
USF per Person
Mobility Program
Private Sector
Public Sector
Legend
51
76
96
119
174
Workplace Standards BenchmarkingMarch 2012 A15
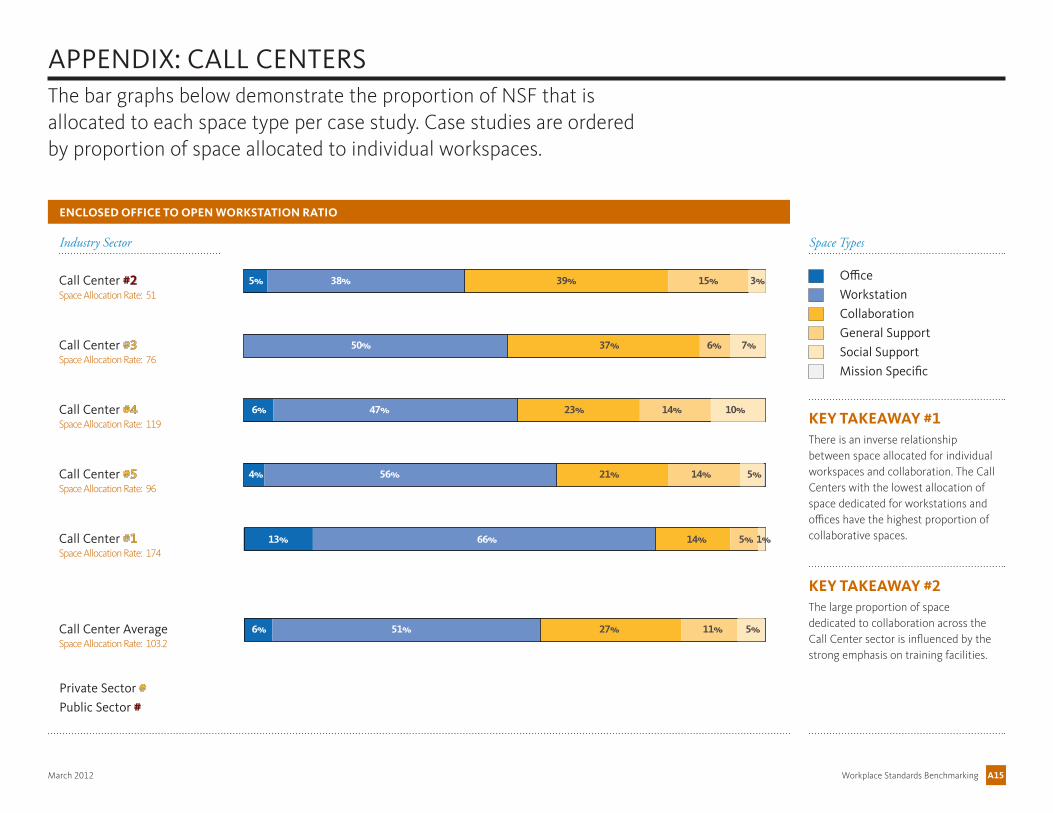
The bar graphs below demonstrate the proportion of NSF that is allocated to each space type per case study. Case studies are ordered by proportion of space allocated to individual workspaces.
KEY TAKEAWAY #1There is an inverse relationship between space allocated for individual workspaces and collaboration. The Call Centers with the lowest allocation of space dedicated for workstations and offices have the highest proportion of collaborative spaces.
KEY TAKEAWAY #2The large proportion of space dedicated to collaboration across the Call Center sector is influenced by the strong emphasis on training facilities.
APPENDIX: CALL CENTERS
ENCLOSED OFFICE TO OPEN WORKSTATION RATIO
5% 38% 39% 15% 3%
50% 37% 6% 7%
6% 47% 23% 14% 10%
4% 56% 21% 14% 5%
13% 66% 14% 5% 1%
6% 51% 27% 11% 5%
Office
Workstation
Collaboration
General Support
Social Support
Mission Specific
Space TypesIndustry Sector
Private Sector #Public Sector #
Call Center #2
Call Center #3
Call Center #4
Call Center #1
Call Center #5
Call Center Average
Space Allocation Rate: 51
Space Allocation Rate: 76
Space Allocation Rate: 119
Space Allocation Rate: 96
Space Allocation Rate: 174
Space Allocation Rate: 103.2
Workplace Standards BenchmarkingMarch 2012 A16
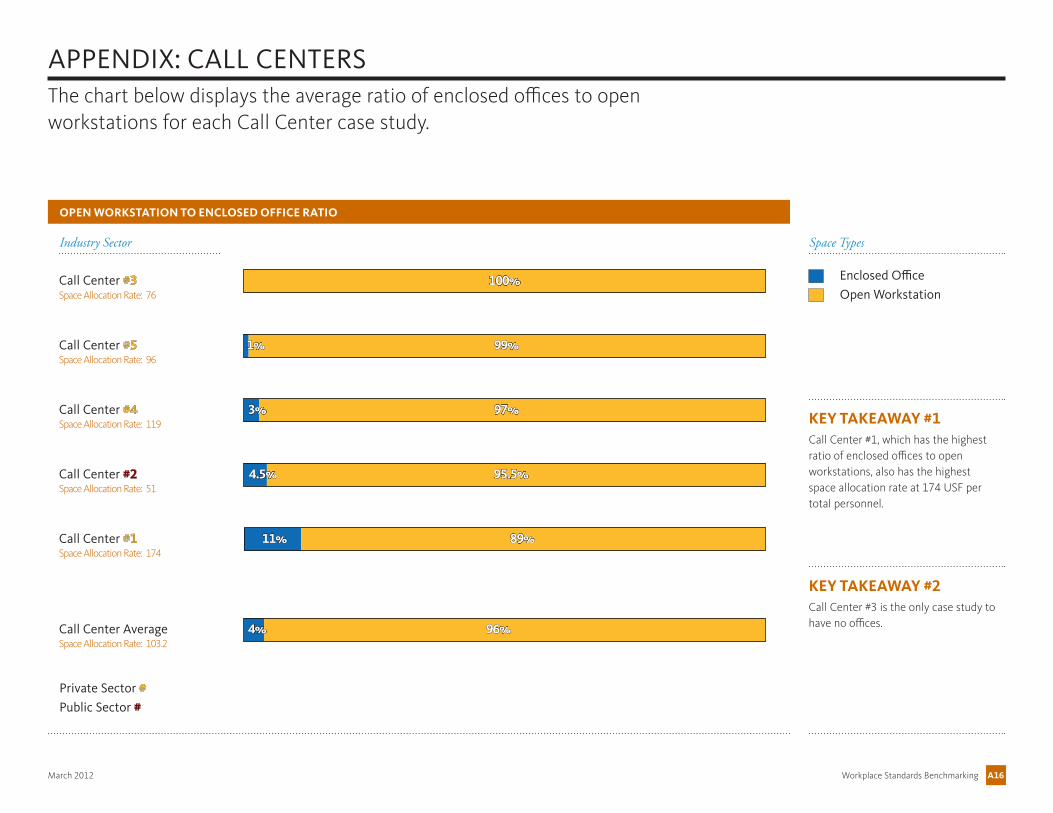
OPEN WORKSTATION TO ENCLOSED OFFICE RATIO
The chart below displays the average ratio of enclosed offices to open workstations for each Call Center case study.
KEY TAKEAWAY #1Call Center #1, which has the highest ratio of enclosed offices to open workstations, also has the highest space allocation rate at 174 USF per total personnel.
KEY TAKEAWAY #2Call Center #3 is the only case study to have no offices.
100%
1% 99%
3% 97%
4.5% 95.5%
11% 89%
APPENDIX: CALL CENTERS
4% 96%
Enclosed Office
Open Workstation
Space TypesIndustry Sector
Private Sector #Public Sector #
Call Center #3
Call Center #5
Call Center #4
Call Center #1
Call Center #2
Call Center Average
Space Allocation Rate: 76
Space Allocation Rate: 96
Space Allocation Rate: 119
Space Allocation Rate: 51
Space Allocation Rate: 174
Space Allocation Rate: 103.2
Workplace Standards BenchmarkingMarch 2012 A17
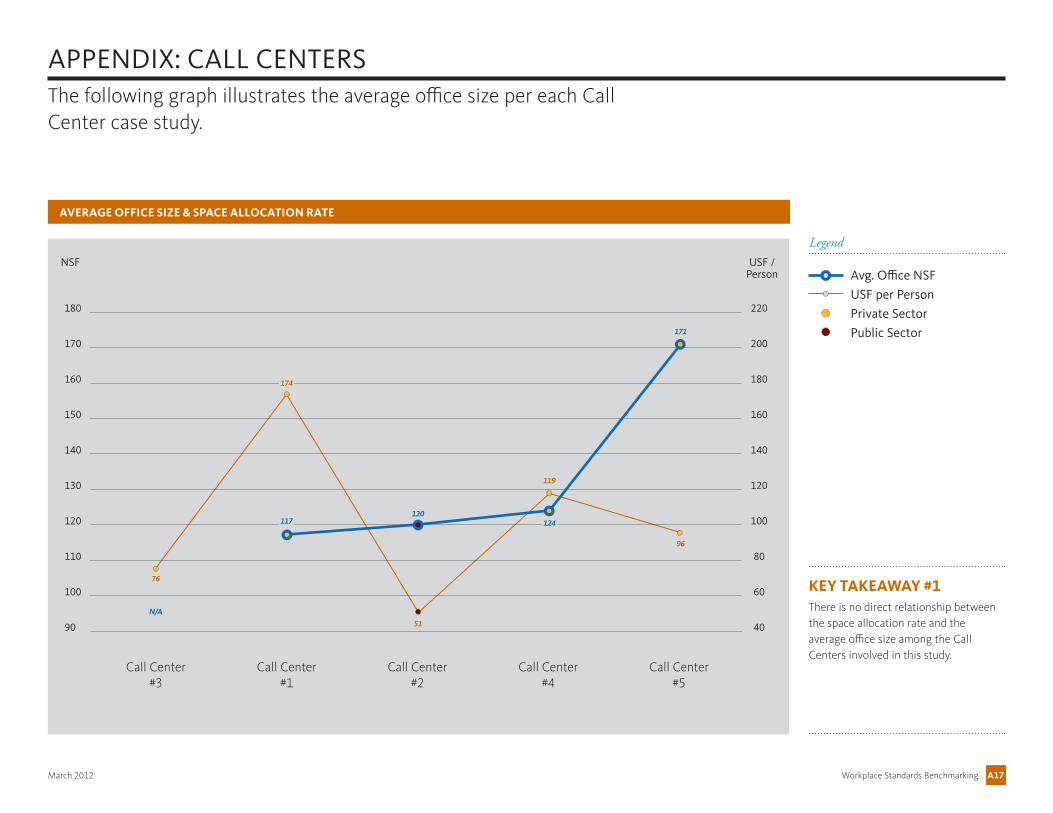
AVERAGE OFFICE SIZE & SPACE ALLOCATION RATE
The following graph illustrates the average office size per each Call Center case study.
KEY TAKEAWAY #1There is no direct relationship between the space allocation rate and the average office size among the Call Centers involved in this study.
USF /Person
Call Center #1
Call Center #3
Call Center #2
Call Center #4
Call Center #5
NSF
APPENDIX: CALL CENTERS
40
60
80
100
120
140
160
180
200
220
90
100
120
110
130
140
150
160
170
180
Avg. Office NSF
USF per Person
Private Sector
Public Sector
Legend
N/A
76
117
174
120
51
124
119
171
96
Workplace Standards BenchmarkingMarch 2012 A18
96
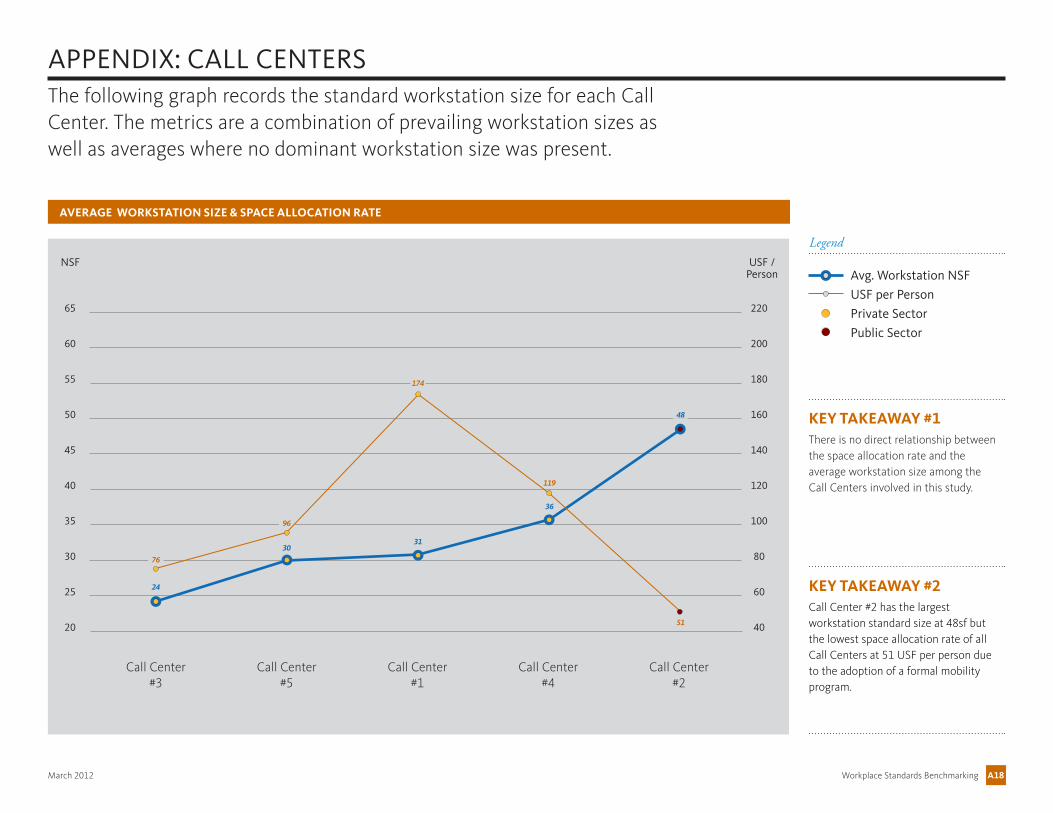
AVERAGE WORKSTATION SIZE & SPACE ALLOCATION RATE
KEY TAKEAWAY #1There is no direct relationship between the space allocation rate and the average workstation size among the Call Centers involved in this study.
KEY TAKEAWAY #2Call Center #2 has the largest workstation standard size at 48sf but the lowest space allocation rate of all Call Centers at 51 USF per person due to the adoption of a formal mobility program.
NSF
Call Center #5
Call Center #3
Call Center #1
Call Center #4
Call Center #2
The following graph records the standard workstation size for each Call Center. The metrics are a combination of prevailing workstation sizes as well as averages where no dominant workstation size was present.
APPENDIX: CALL CENTERS
USF /Person
40
60
80
100
120
140
160
180
200
220
20
25
35
30
40
45
50
55
60
65
Avg. Workstation NSF
USF per Person
Private Sector
Public Sector
Legend
24
76
3031
174
36
119
48
51

Workplace Standards BenchmarkingMarch 2012 A19
180
APPENDIX: FINANCE
SPACE ALLOCATION RATE: USF PER TOTAL PERSONNEL
This chart illustrates space allocation rates for the Finance sector based on USF per total personnel. Organizations with mobility programs are identified.
USF /Person
Finance Firm #5
Finance Firm #3
Finance Firm #1
Finance Firm #4
Finance Firm #2
KEY TAKEAWAY #1Finance Firm #3 has the lowest space allocation rate at 112 USF per person. Finance Firm #2 has the highest allocation rate at 239 USF per person.
100
115
145
130
160
175
190
205
220
235
USF per Person
Mobility Program
Private Sector
Public Sector
Legend
112
145
164
239
Workplace Standards BenchmarkingMarch 2012 A20
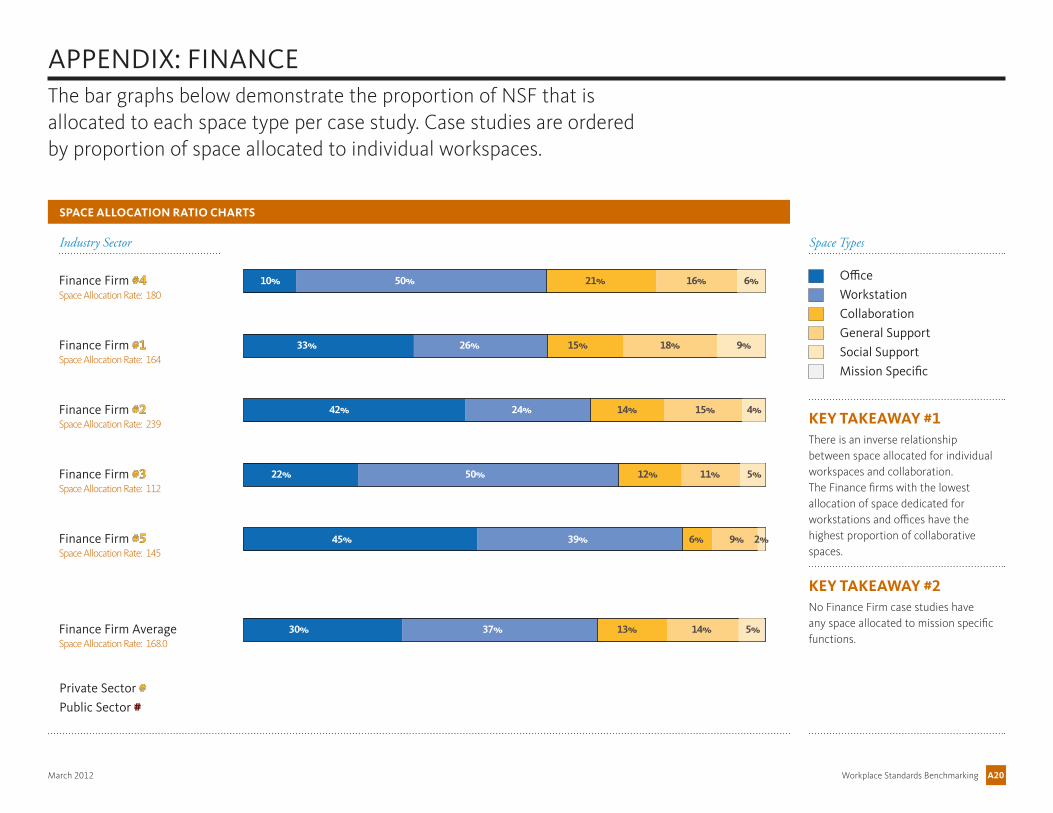
SPACE ALLOCATION RATIO CHARTS
The bar graphs below demonstrate the proportion of NSF that is allocated to each space type per case study. Case studies are ordered by proportion of space allocated to individual workspaces.
KEY TAKEAWAY #1There is an inverse relationship between space allocated for individual workspaces and collaboration. The Finance firms with the lowest allocation of space dedicated for workstations and offices have the highest proportion of collaborative spaces.
KEY TAKEAWAY #2No Finance Firm case studies have any space allocated to mission specific functions.
APPENDIX: FINANCE
10% 50% 21% 16% 6%
33% 26% 15% 18% 9%
42% 24% 14% 15% 4%
22% 50% 12% 11% 5%
45% 39% 6% 9% 2%
30% 37% 13% 14% 5%
Office
Workstation
Collaboration
General Support
Social Support
Mission Specific
Space TypesIndustry Sector
Private Sector #Public Sector #
Finance Firm #4
Finance Firm #1
Finance Firm #2
Finance Firm #5
Finance Firm #3
Finance Firm Average
Space Allocation Rate: 180
Space Allocation Rate: 164
Space Allocation Rate: 239
Space Allocation Rate: 112
Space Allocation Rate: 145
Space Allocation Rate: 168.0

Workplace Standards BenchmarkingMarch 2012 A21
29% 71%
The chart below displays the average ratio of enclosed offices to open workstations for each Finance case study.
KEY TAKEAWAY #1Finance Firm #4 has the lowest ratio of enclosed offices to open workstations. Finance Firm #2 has the highest.
8% 92%
27% 73%
30% 70%
37% 63%
43% 57%
APPENDIX: FINANCE
ENCLOSED OFFICE TO OPEN WORKSTATION RATIO
Enclosed Office
Open Workstation
Space TypesIndustry Sector
Private Sector #Public Sector #
Finance Firm #4
Finance Firm #5
Finance Firm #1
Finance Firm #2
Finance Firm #3
Finance Firm Average
Space Allocation Rate: 180
Space Allocation Rate: 145
Space Allocation Rate: 164
Space Allocation Rate: 112
Space Allocation Rate: 239
Space Allocation Rate: 168.0

Workplace Standards BenchmarkingMarch 2012 A22
180164
AVERAGE OFFICE SIZE & SPACE ALLOCATION RATE
The following graph illustrates the average office size per each Finance case study.
KEY TAKEAWAY #1There is no direct relationship between the space allocation rate and the average office size among the Finance Firms involved in this study.
USF /Person
Finance Firm #2
Finance Firm #1
Finance Firm #4
Finance Firm #3
Finance Firm #5
NSF
APPENDIX: FINANCE
80
90
110
100
120
130
140
150
160
170
100
115
130
145
160
175
190
205
120
235
Avg. Office NSF
USF per Person
Private Sector
Public Sector
Legend
106
139
239
140
147
112
162
145

Workplace Standards BenchmarkingMarch 2012 A23
AVERAGE WORKSTATION SIZE & SPACE ALLOCATION RATE
KEY TAKEAWAY #1There is no direct relationship between the space allocation rate and the average workstation size among the Finance Firms involved in this study.
NSF USF /Person
Finance Firm #3
Finance Firm #1
Finance Firm #2
Finance Firm #4
Finance Firm #5
The following graph records the standard workstation size for each Finance Firm. The metrics are a combination of prevailing workstation sizes as well as averages where no dominant workstation size was present.
APPENDIX: FINANCE
100
115
130
145
160
175
190
205
120
235
25
30
40
35
45
50
55
60
65
70
Avg. Workstation NSF
USF per Person
Private Sector
Public Sector
Legend
40
164
42
112
50
239
42
180
56
145
Workplace Standards BenchmarkingMarch 2012 A24
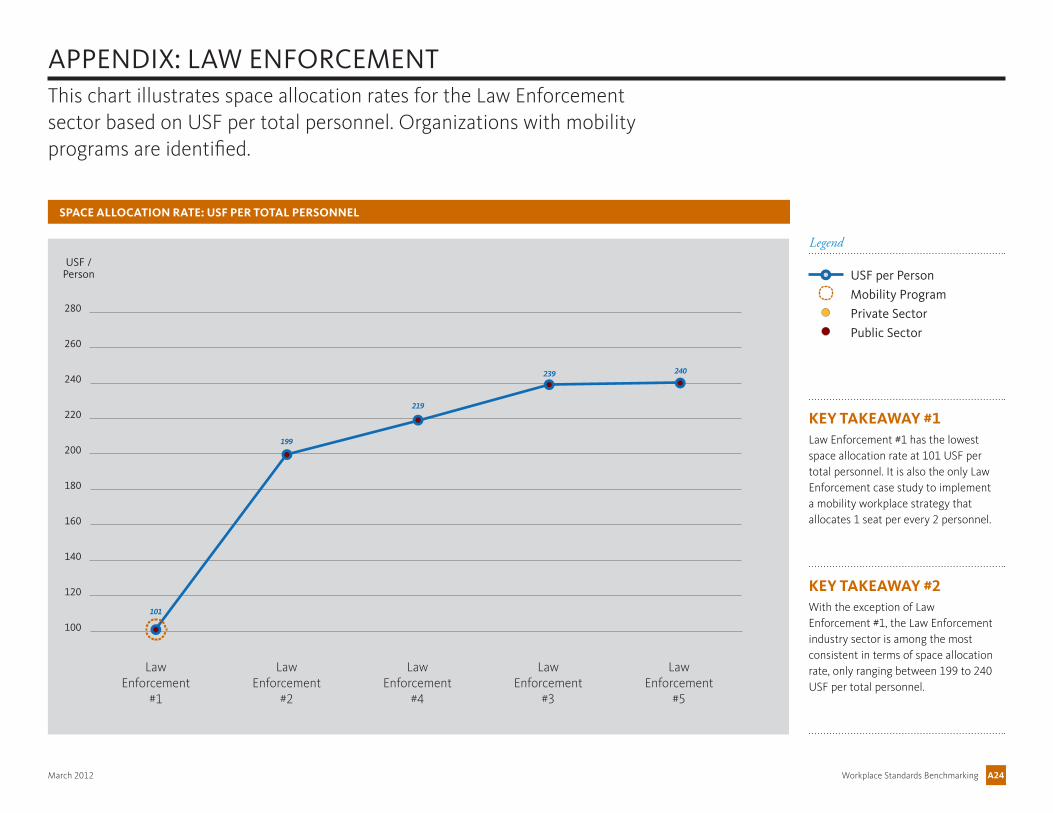
KEY TAKEAWAY #1Law Enforcement #1 has the lowest space allocation rate at 101 USF per total personnel. It is also the only Law Enforcement case study to implement a mobility workplace strategy that allocates 1 seat per every 2 personnel.
APPENDIX: LAW ENFORCEMENT
SPACE ALLOCATION RATE: USF PER TOTAL PERSONNEL
This chart illustrates space allocation rates for the Law Enforcement sector based on USF per total personnel. Organizations with mobility programs are identified.
USF /Person
Law Enforcement
#2
Law Enforcement
#1
Law Enforcement
#4
Law Enforcement
#3
Law Enforcement
#5
KEY TAKEAWAY #2With the exception of Law Enforcement #1, the Law Enforcement industry sector is among the most consistent in terms of space allocation rate, only ranging between 199 to 240 USF per total personnel.
100
120
160
140
180
200
220
240
260
280
USF per Person
Mobility Program
Private Sector
Public Sector
Legend
101
199
219
239 240

Workplace Standards BenchmarkingMarch 2012 A25
SPACE ALLOCATION RATIO CHARTS
The bar graphs below demonstrate the proportion of NSF that is allocated to each space type per case study. Case studies are ordered by proportion of space allocated to individual workspaces.
KEY TAKEAWAY #1There is an inverse relationship between space allocated for individual workspaces and collaboration. The case studies with the lowest allocation of space dedicated for workstations and offices have the highest proportion of collaborative spaces.
KEY TAKEAWAY #2Law Enforcement #1 has no mission specific functions because, unlike the other case studies, it primarily houses the general administrative function for a law enforcement organization.
APPENDIX: LAW ENFORCEMENT
31% 46% 18% 5%
12% 29% 16%19% 1% 17%
18% 23% 18% 19% 5% 22%
13% 41% 17% 14% 2% 13%
28% 39% 15% 13% 5% 1%
14% 32% 23% 16% 4% 11%
Office
Workstation
Collaboration
General Support
Social Support
Mission Specific
Space TypesIndustry Sector
Private Sector #Public Sector #
Law Enforcement #1
Law Enforcement #3
Law Enforcement #2
Law Enforcement #5
Law Enforcement #4
Law Enforcement Average
Space Allocation Rate: 101
Space Allocation Rate: 239
Space Allocation Rate: 199
Space Allocation Rate: 219
Space Allocation Rate: 240
Space Allocation Rate: 199.6
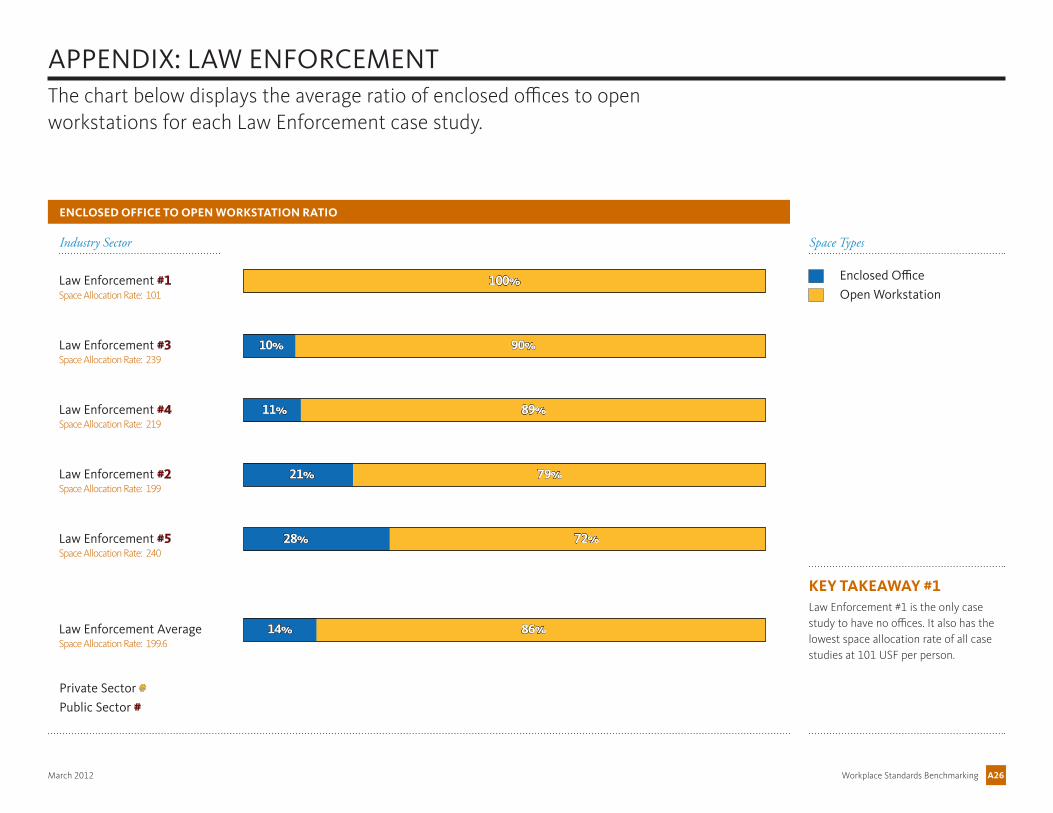
Workplace Standards BenchmarkingMarch 2012 A26
14% 86%
The chart below displays the average ratio of enclosed offices to open workstations for each Law Enforcement case study.
KEY TAKEAWAY #1Law Enforcement #1 is the only case study to have no offices. It also has the lowest space allocation rate of all case studies at 101 USF per person.
100%
10% 90%
11% 89%
21% 79%
28% 72%
APPENDIX: LAW ENFORCEMENT
ENCLOSED OFFICE TO OPEN WORKSTATION RATIO
Enclosed Office
Open Workstation
Space TypesIndustry Sector
Private Sector #Public Sector #
Law Enforcement #1
Law Enforcement #3
Law Enforcement #4
Law Enforcement #5
Law Enforcement #2
Law Enforcement Average
Space Allocation Rate: 101
Space Allocation Rate: 239
Space Allocation Rate: 219
Space Allocation Rate: 199
Space Allocation Rate: 240
Space Allocation Rate: 199.6
Workplace Standards BenchmarkingMarch 2012 A27
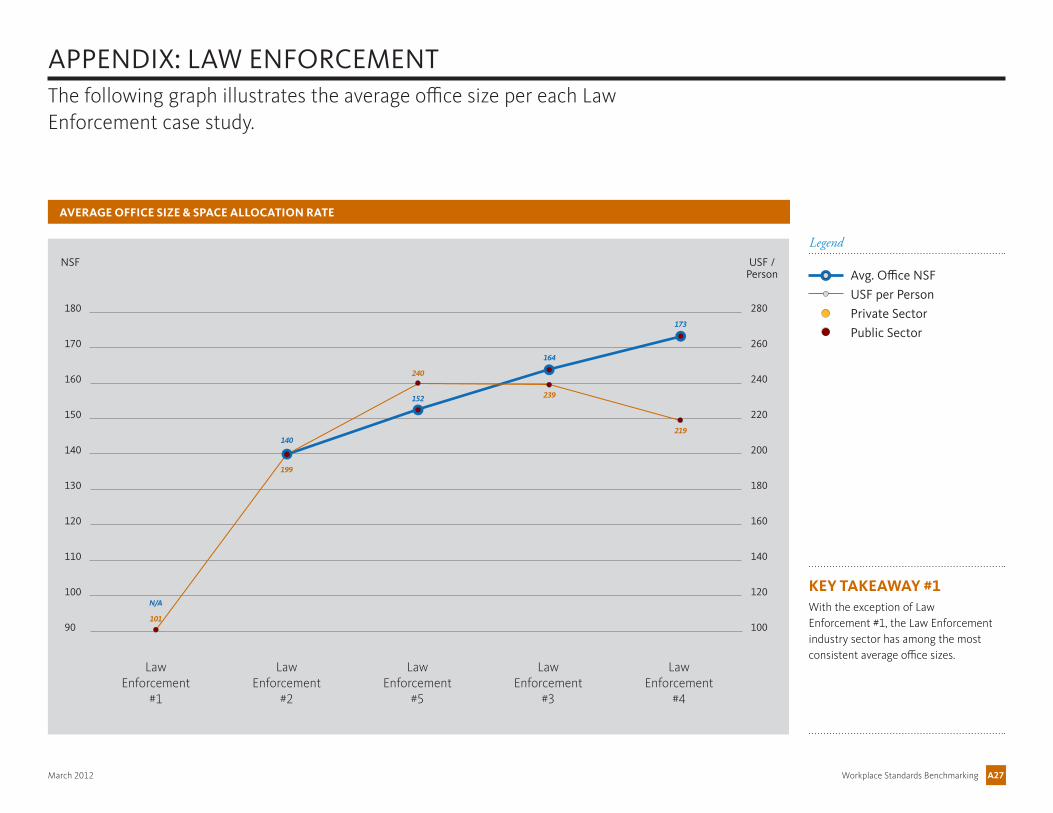
101
AVERAGE OFFICE SIZE & SPACE ALLOCATION RATE
The following graph illustrates the average office size per each Law Enforcement case study.
KEY TAKEAWAY #1With the exception of Law Enforcement #1, the Law Enforcement industry sector has among the most consistent average office sizes.
USF /Person
Law Enforcement
#2
Law Enforcement
#1
Law Enforcement
#5
Law Enforcement
#3
Law Enforcement
#4
NSF
APPENDIX: LAW ENFORCEMENT
90
100
120
110
130
140
150
160
170
180
100
120
140
160
180
200
220
240
260
280
N/A
Avg. Office NSF
USF per Person
Private Sector
Public Sector
Legend
140
152
164
173
199
240
239
219

Workplace Standards BenchmarkingMarch 2012 A28
AVERAGE WORKSTATION SIZE & SPACE ALLOCATION RATE
KEY TAKEAWAY #1The Law Enforcement industry sector has among the most consistent workstation standard sizes with only two variations included in this sample: 48 NSF and 64 NSF.
NSF USF /Person
Law Enforcement
#3
Law Enforcement
#1
Law Enforcement
#5
Law Enforcement
#2
Law Enforcement
#4
The following graph records the standard workstation size for each Law Enforcement organization. The metrics are a combination of prevailing workstation sizes as well as averages where no dominant workstation size was present.
APPENDIX: LAW ENFORCEMENT
100
120
140
160
180
200
220
240
260
280
25
30
40
35
45
50
55
60
65
70
Avg. Workstation NSF
USF per Person
Private Sector
Public Sector
Legend
48
101
48
239
64
240
64
199
64
219
Workplace Standards BenchmarkingMarch 2012 A29
336
240
270
330
300
360
390
420
450
480
510
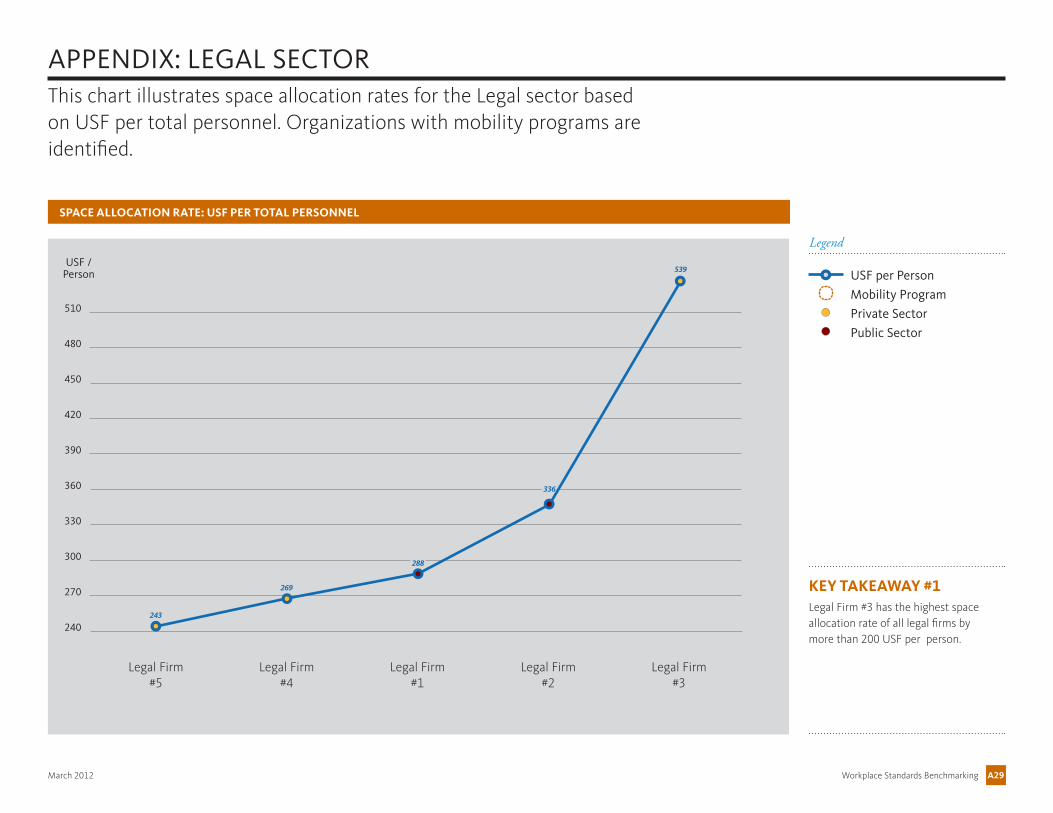
APPENDIX: LEGAL SECTOR
SPACE ALLOCATION RATE: USF PER TOTAL PERSONNEL
This chart illustrates space allocation rates for the Legal sector based on USF per total personnel. Organizations with mobility programs are identified.
USF /Person
Legal Firm #4
Legal Firm #5
Legal Firm #1
Legal Firm #2
Legal Firm #3
KEY TAKEAWAY #1Legal Firm #3 has the highest space allocation rate of all legal firms by more than 200 USF per person.
USF per Person
Mobility Program
Private Sector
Public Sector
Legend
243
269
288
539
Workplace Standards BenchmarkingMarch 2012 A30
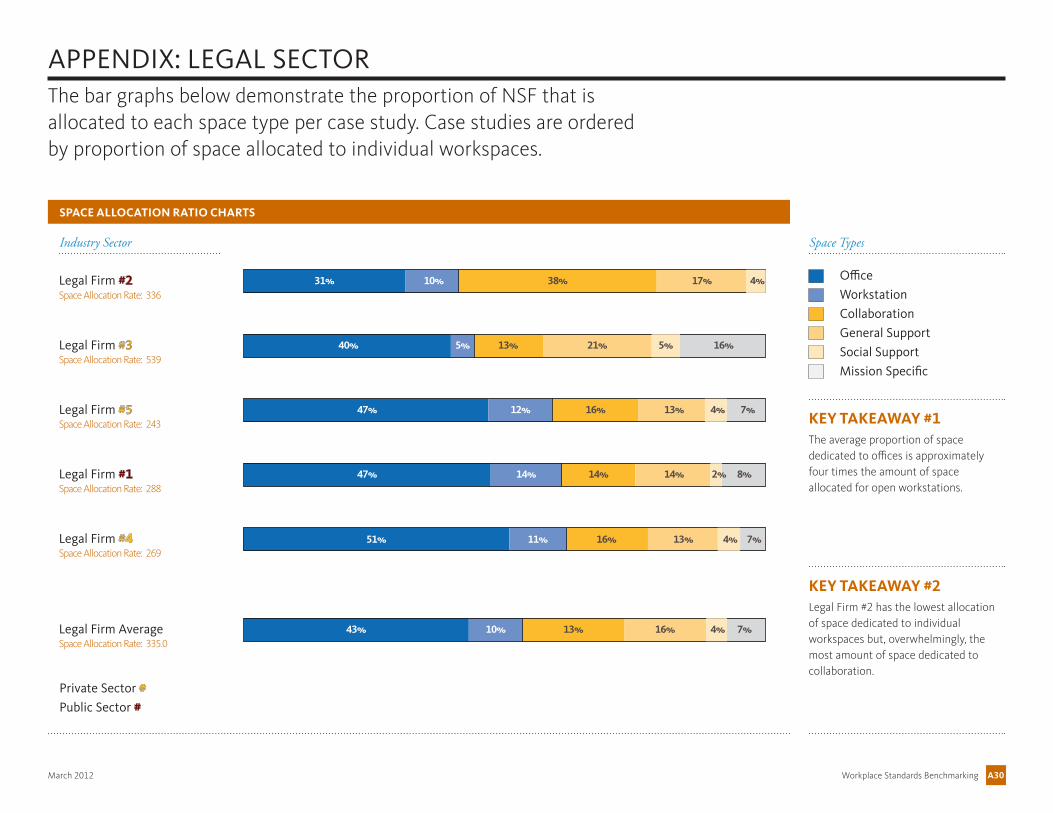
APPENDIX: LEGAL SECTOR
SPACE ALLOCATION RATIO CHARTS
The bar graphs below demonstrate the proportion of NSF that is allocated to each space type per case study. Case studies are ordered by proportion of space allocated to individual workspaces.
KEY TAKEAWAY #1The average proportion of space dedicated to offices is approximately four times the amount of space allocated for open workstations.
KEY TAKEAWAY #2Legal Firm #2 has the lowest allocation of space dedicated to individual workspaces but, overwhelmingly, the most amount of space dedicated to collaboration.
31% 10% 38% 17% 4%
40% 5% 13% 21% 5% 16%
47% 12% 16% 13% 4% 7%
47% 14% 14% 14% 2% 8%
51% 11% 16% 13% 4% 7%
43% 10% 13% 16% 4% 7%
Office
Workstation
Collaboration
General Support
Social Support
Mission Specific
Space TypesIndustry Sector
Private Sector #Public Sector #
Legal Firm #2
Legal Firm #3
Legal Firm #5
Legal Firm #4
Legal Firm #1
Legal Firm Average
Space Allocation Rate: 336
Space Allocation Rate: 539
Space Allocation Rate: 243
Space Allocation Rate: 288
Space Allocation Rate: 269
Space Allocation Rate: 335.0
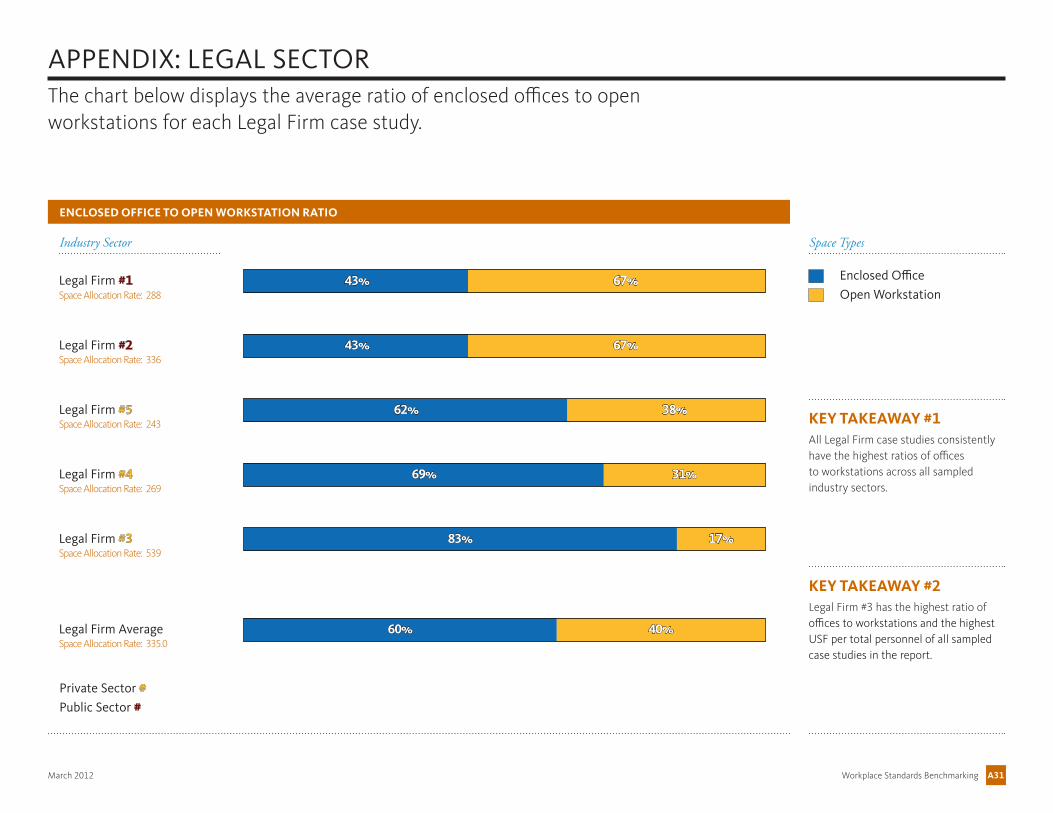
Workplace Standards BenchmarkingMarch 2012 A31
APPENDIX: LEGAL SECTORThe chart below displays the average ratio of enclosed offices to open workstations for each Legal Firm case study.
KEY TAKEAWAY #1All Legal Firm case studies consistently have the highest ratios of offices to workstations across all sampled industry sectors.
KEY TAKEAWAY #2Legal Firm #3 has the highest ratio of offices to workstations and the highest USF per total personnel of all sampled case studies in the report.
43% 67%
43% 67%
62% 38%
69% 31%
83% 17%
60% 40%
ENCLOSED OFFICE TO OPEN WORKSTATION RATIO
Enclosed Office
Open Workstation
Space TypesIndustry Sector
Private Sector #Public Sector #
Legal Firm #1
Legal Firm #2
Legal Firm #5
Legal Firm #3
Legal Firm #4
Legal Firm Average
Space Allocation Rate: 288
Space Allocation Rate: 336
Space Allocation Rate: 243
Space Allocation Rate: 269
Space Allocation Rate: 539
Space Allocation Rate: 335.0

Workplace Standards BenchmarkingMarch 2012 A32
APPENDIX: LEGAL SECTOR
AVERAGE OFFICE SIZE & SPACE ALLOCATION RATE
The following graph illustrates the average office size per each Legal case study.
KEY TAKEAWAY #1There is no direct relationship between the space allocation rate and the average office size among the Legal Firms involved in this study.
KEY TAKEAWAY #2The predominant average office sizes range between 135 NSF to 171 NSF. This metric is among the most consistent standards for the Legal sector case studies.
USF /Person
Legal Firm #4
Legal Firm #5
Legal Firm #3
Legal Firm #1
Legal Firm #2
NSF
220
250
280
310
340
370
400
430
460
490
90
100
120
110
130
140
150
160
170
180
Avg. Office NSF
USF per Person
Private Sector
Public Sector
Legend
135
243
145
269
168
539
170
288
171
336
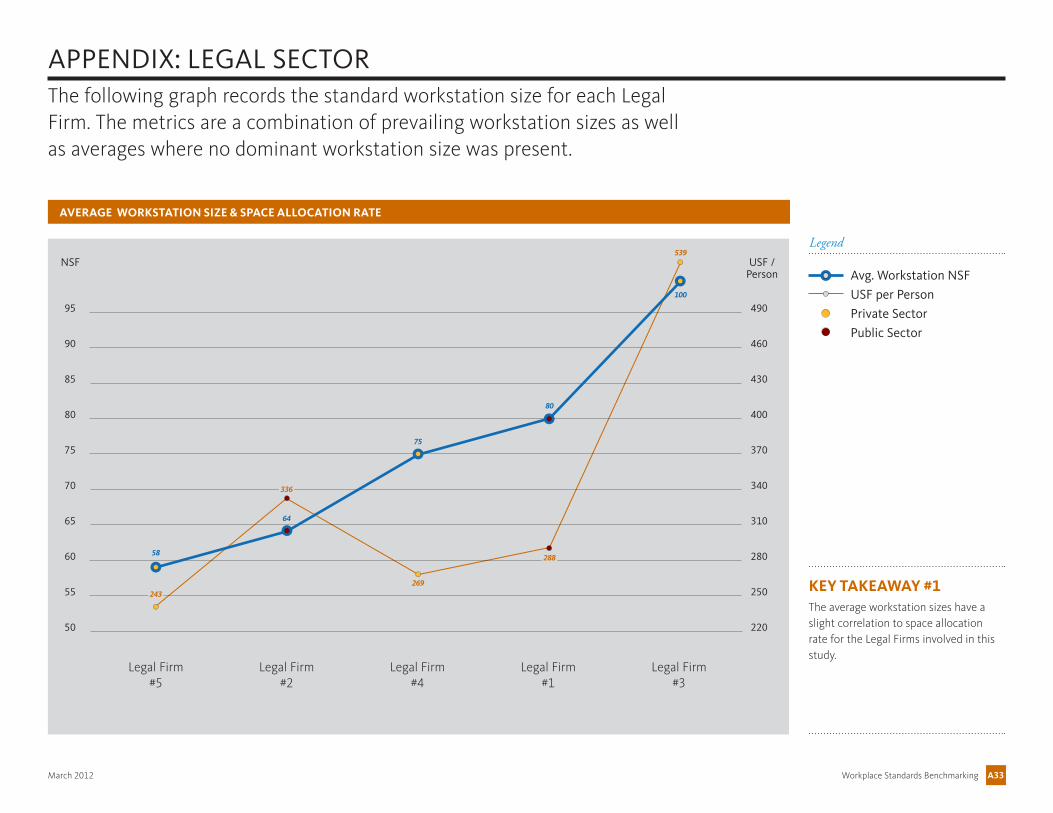
Workplace Standards BenchmarkingMarch 2012 A33
80
50
55
65
60
70
75
80
85
90
95
220
250
280
310
340
370
400
430
460
490
APPENDIX: LEGAL SECTOR
AVERAGE WORKSTATION SIZE & SPACE ALLOCATION RATE
KEY TAKEAWAY #1The average workstation sizes have a slight correlation to space allocation rate for the Legal Firms involved in this study.
NSF USF /Person
Legal Firm #2
Legal Firm #5
Legal Firm #4
Legal Firm #1
Legal Firm #3
The following graph records the standard workstation size for each Legal Firm. The metrics are a combination of prevailing workstation sizes as well as averages where no dominant workstation size was present.
Avg. Workstation NSF
USF per Person
Private Sector
Public Sector
Legend
58
243
64
336
75
269
288
100
539
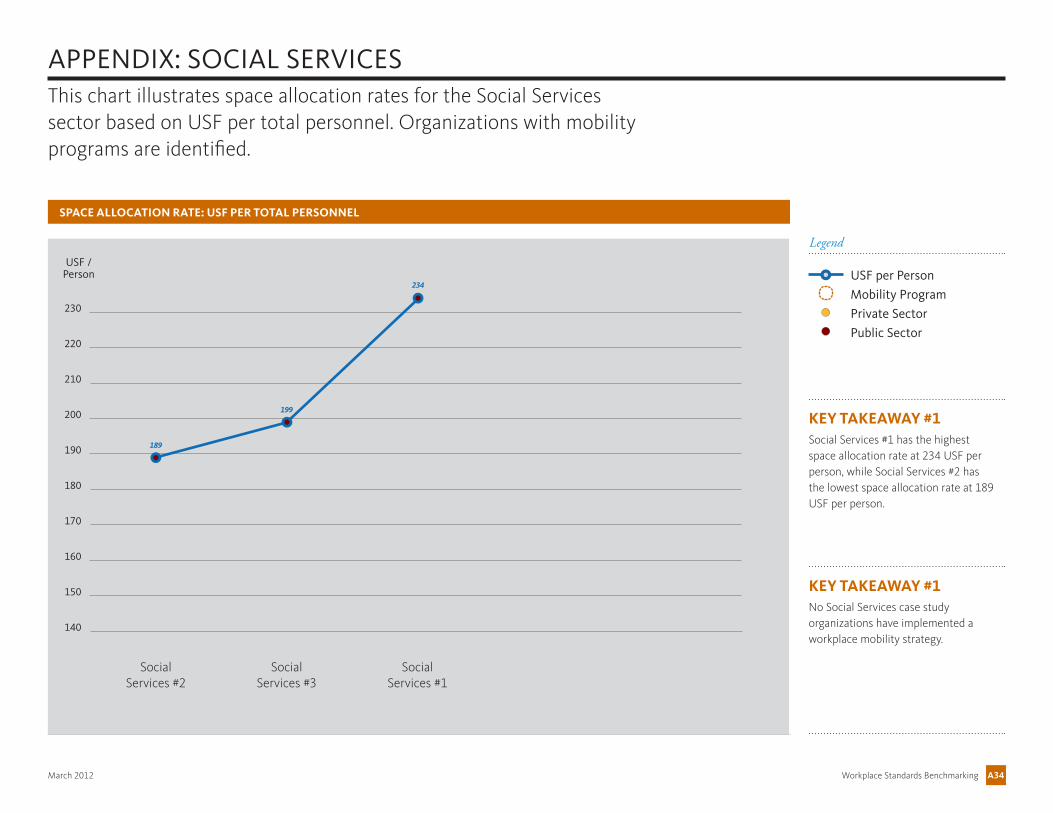
Workplace Standards BenchmarkingMarch 2012 A34
199KEY TAKEAWAY #1Social Services #1 has the highest space allocation rate at 234 USF per person, while Social Services #2 has the lowest space allocation rate at 189 USF per person.
APPENDIX: SOCIAL SERVICES
SPACE ALLOCATION RATE: USF PER TOTAL PERSONNEL
This chart illustrates space allocation rates for the Social Services sector based on USF per total personnel. Organizations with mobility programs are identified.
USF /Person
Social Services #3
Social Services #2
Social Services #1
KEY TAKEAWAY #1No Social Services case study organizations have implemented a workplace mobility strategy.
140
150
170
160
180
190
200
210
220
230
USF per Person
Mobility Program
Private Sector
Public Sector
Legend
189
234
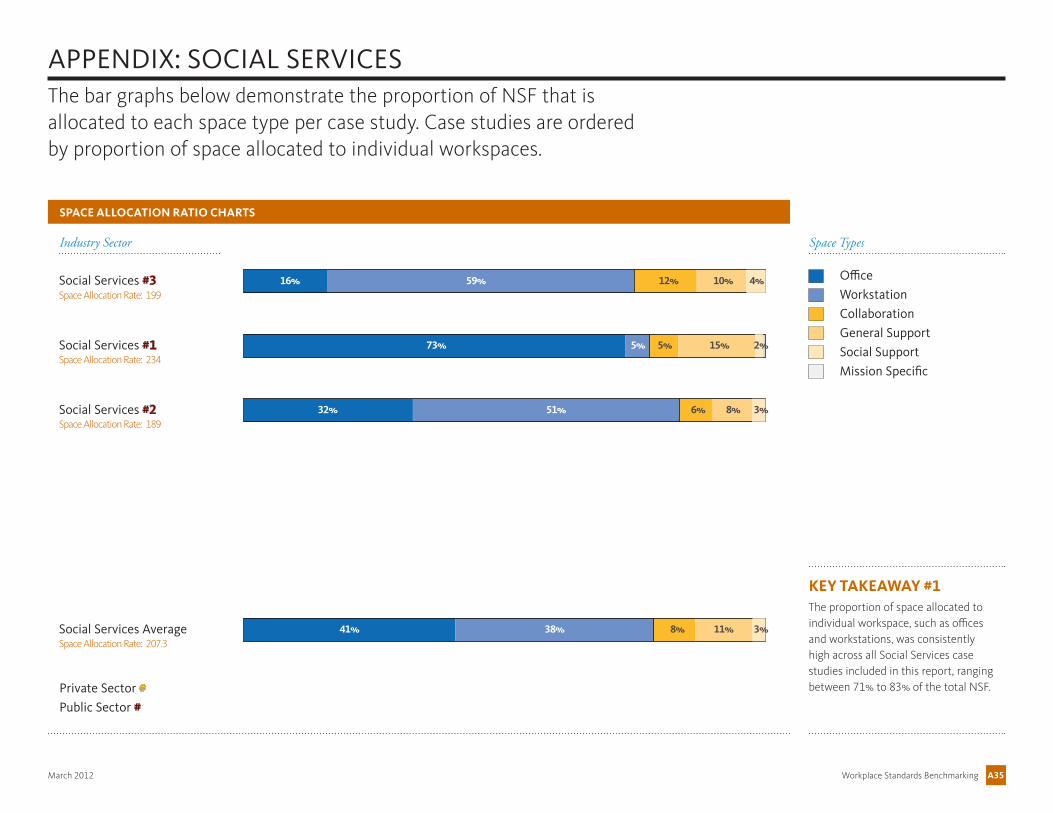
Workplace Standards BenchmarkingMarch 2012 A35
SPACE ALLOCATION RATIO CHARTS
The bar graphs below demonstrate the proportion of NSF that is allocated to each space type per case study. Case studies are ordered by proportion of space allocated to individual workspaces.
KEY TAKEAWAY #1The proportion of space allocated to individual workspace, such as offices and workstations, was consistently high across all Social Services case studies included in this report, ranging between 71% to 83% of the total NSF.
APPENDIX: SOCIAL SERVICES
16% 59% 12% 10% 4%
73% 5% 5% 15% 2%
32% 51% 6% 8% 3%
41% 38% 11% 3%8%
Office
Workstation
Collaboration
General Support
Social Support
Mission Specific
Space TypesIndustry Sector
Private Sector #Public Sector #
Social Services #3
Social Services #1
Social Services #2
Social Services Average
Space Allocation Rate: 199
Space Allocation Rate: 234
Space Allocation Rate: 189
Space Allocation Rate: 207.3
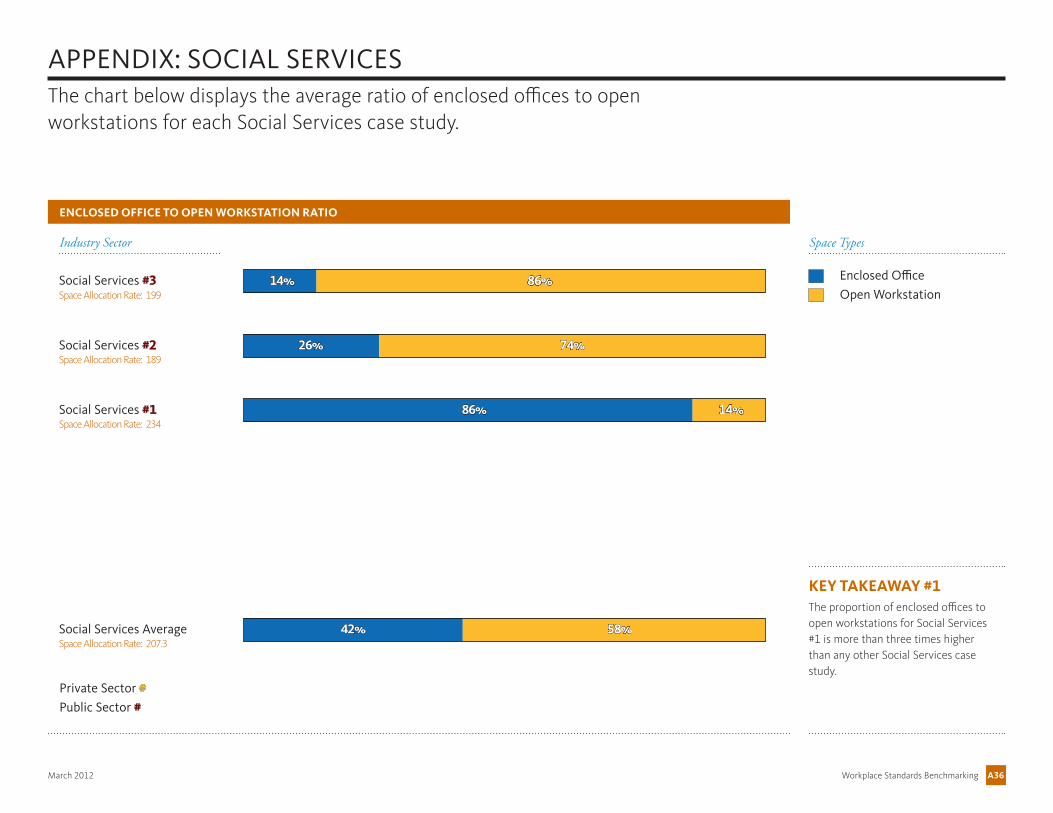
Workplace Standards BenchmarkingMarch 2012 A36
The chart below displays the average ratio of enclosed offices to open workstations for each Social Services case study.
KEY TAKEAWAY #1The proportion of enclosed offices to open workstations for Social Services #1 is more than three times higher than any other Social Services case study.
14% 86%
26% 74%
86% 14%
APPENDIX: SOCIAL SERVICES
ENCLOSED OFFICE TO OPEN WORKSTATION RATIO
42% 58%
Enclosed Office
Open Workstation
Space TypesIndustry Sector
Private Sector #Public Sector #
Social Services #3
Social Services #2
Social Services #1
Social Services Average
Space Allocation Rate: 199
Space Allocation Rate: 189
Space Allocation Rate: 234
Space Allocation Rate: 207.3
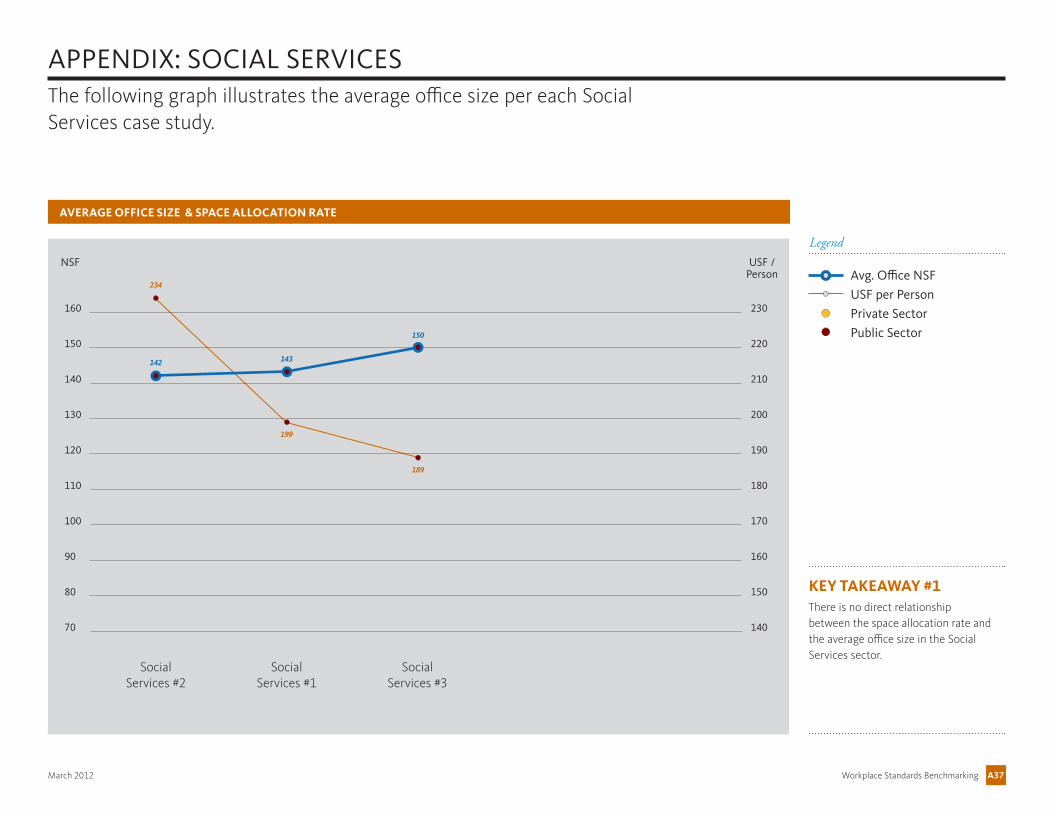
Workplace Standards BenchmarkingMarch 2012 A37
AVERAGE OFFICE SIZE & SPACE ALLOCATION RATE
The following graph illustrates the average office size per each Social Services case study.
KEY TAKEAWAY #1There is no direct relationship between the space allocation rate and the average office size in the Social Services sector.
USF /Person
Social Services #1
Social Services #2
Social Services #3
NSF
APPENDIX: SOCIAL SERVICES
70
80
100
90
110
120
130
140
150
160
140
150
160
170
180
190
200
210
220
230
Avg. Office NSF
USF per Person
Private Sector
Public Sector
Legend
142
234
143
199
150
189
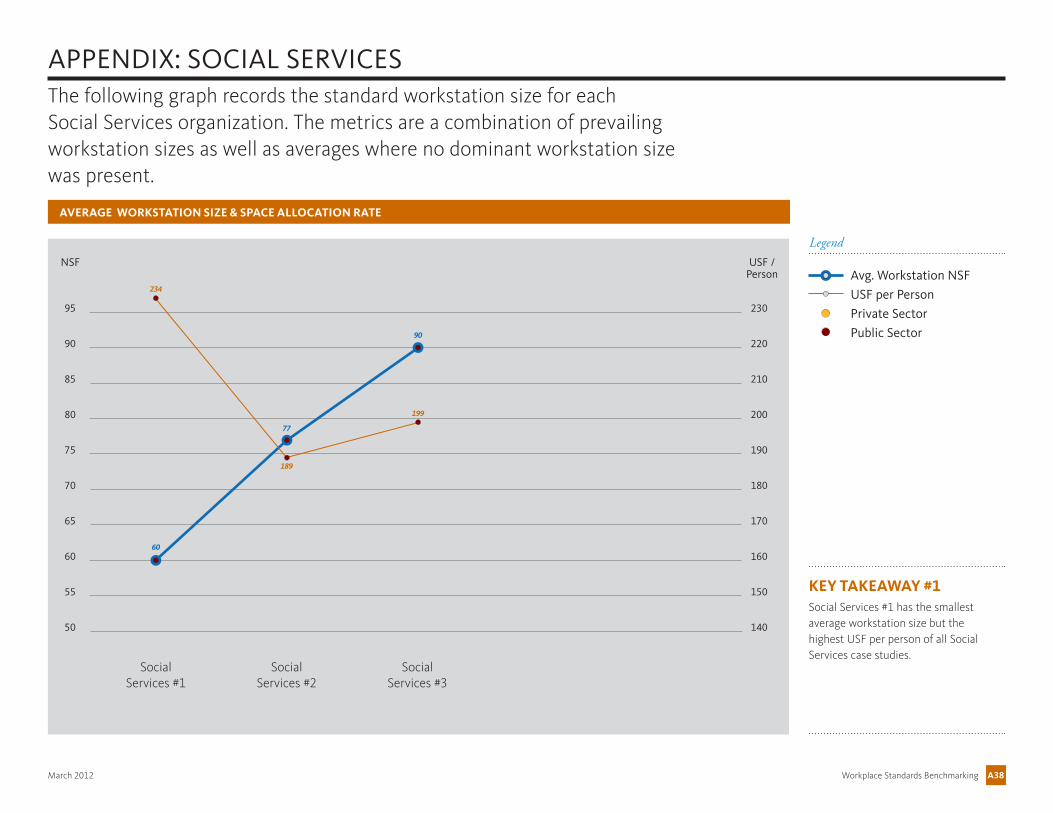
Workplace Standards BenchmarkingMarch 2012 A38
AVERAGE WORKSTATION SIZE & SPACE ALLOCATION RATE
KEY TAKEAWAY #1Social Services #1 has the smallest average workstation size but the highest USF per person of all Social Services case studies.
NSF USF /Person
Social Services #2
Social Services #1
Social Services #3
The following graph records the standard workstation size for each Social Services organization. The metrics are a combination of prevailing workstation sizes as well as averages where no dominant workstation size was present.
APPENDIX: SOCIAL SERVICES
50
55
65
60
70
75
80
85
90
95
140
150
160
170
180
190
200
210
220
230
Avg. Workstation NSF
USF per Person
Private Sector
Public Sector
Legend
60
234
77
189
90
199
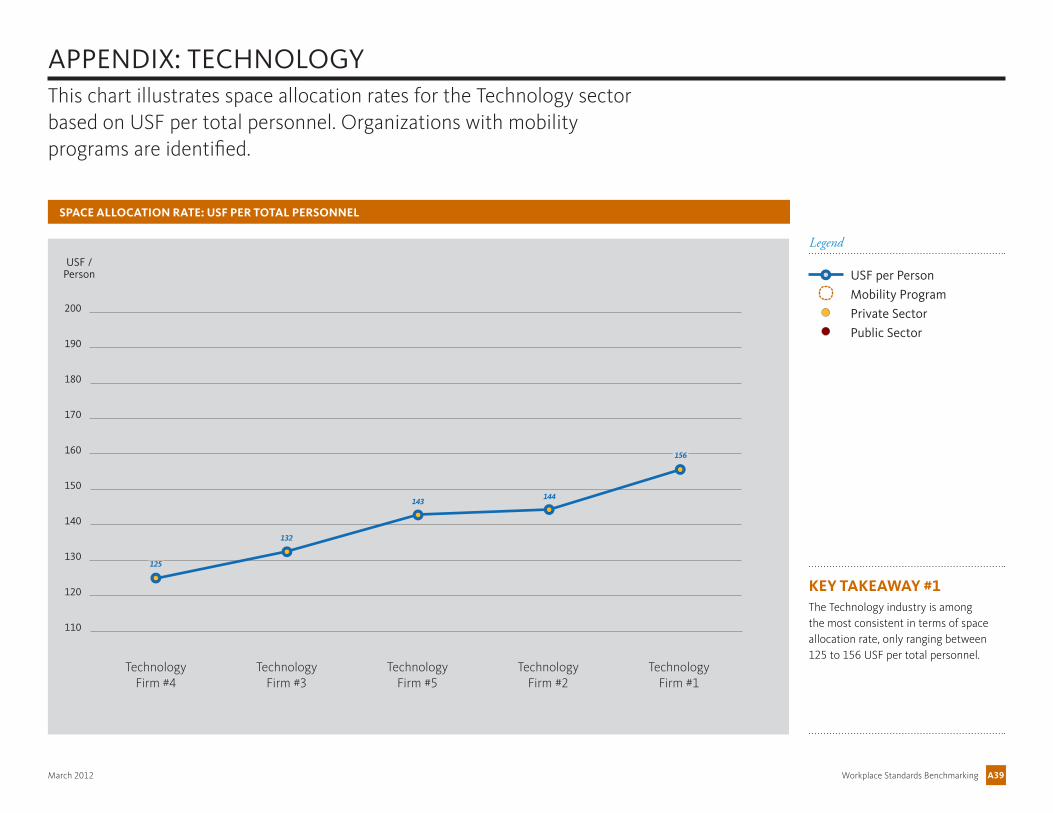
Workplace Standards BenchmarkingMarch 2012 A39
APPENDIX: TECHNOLOGY
SPACE ALLOCATION RATE: USF PER TOTAL PERSONNEL
This chart illustrates space allocation rates for the Technology sector based on USF per total personnel. Organizations with mobility programs are identified.
USF /Person
TechnologyFirm #3
Technology Firm #4
Technology Firm #5
Technology Firm #2
Technology Firm #1
KEY TAKEAWAY #1The Technology industry is among the most consistent in terms of space allocation rate, only ranging between 125 to 156 USF per total personnel.
110
120
140
130
150
160
170
180
190
200
USF per Person
Mobility Program
Private Sector
Public Sector
Legend
125
132
143144
156
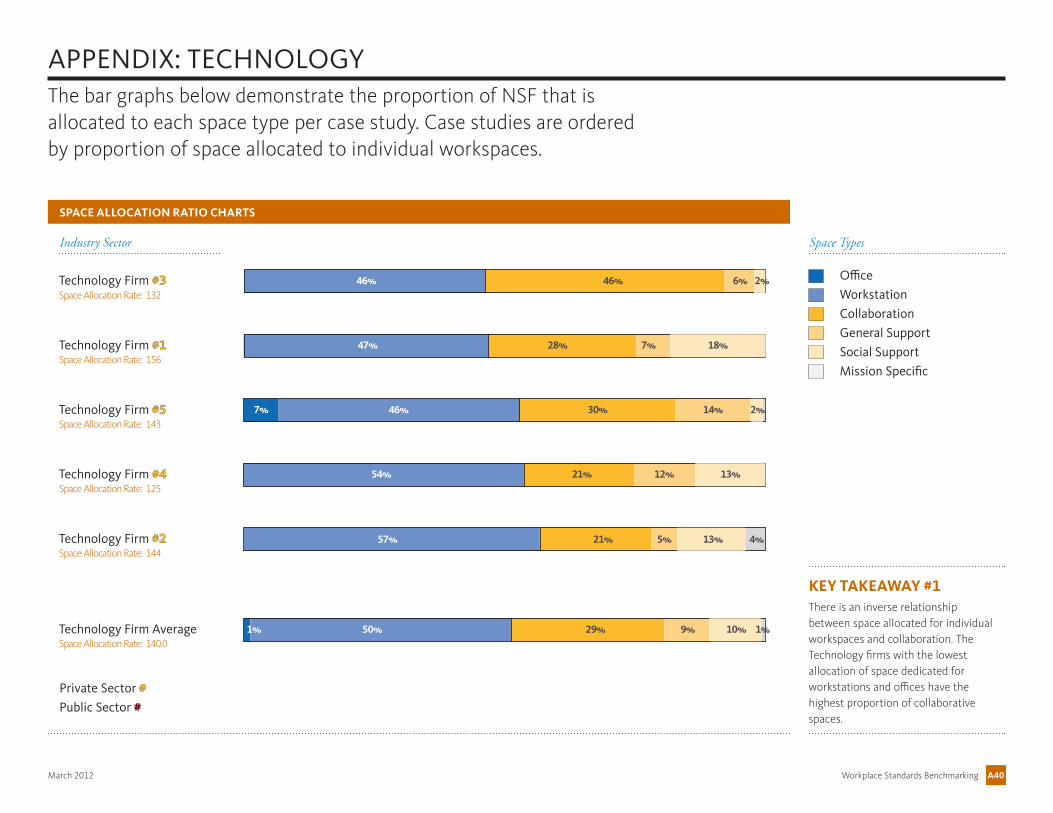
Workplace Standards BenchmarkingMarch 2012 A40
SPACE ALLOCATION RATIO CHARTS
The bar graphs below demonstrate the proportion of NSF that is allocated to each space type per case study. Case studies are ordered by proportion of space allocated to individual workspaces.
KEY TAKEAWAY #1There is an inverse relationship between space allocated for individual workspaces and collaboration. The Technology firms with the lowest allocation of space dedicated for workstations and offices have the highest proportion of collaborative spaces.
APPENDIX: TECHNOLOGY
46% 46% 6% 2%
47% 28% 7% 18%
7% 46% 30% 14% 2%
54% 21% 12% 13%
57% 21% 5% 13% 4%
1% 50% 29% 9% 10% 1%
Office
Workstation
Collaboration
General Support
Social Support
Mission Specific
Space TypesIndustry Sector
Private Sector #Public Sector #
Technology Firm #3
Technology Firm #1
Technology Firm #5
Technology Firm #2
Technology Firm #4
Technology Firm Average
Space Allocation Rate: 132
Space Allocation Rate: 156
Space Allocation Rate: 143
Space Allocation Rate: 125
Space Allocation Rate: 144
Space Allocation Rate: 140.0
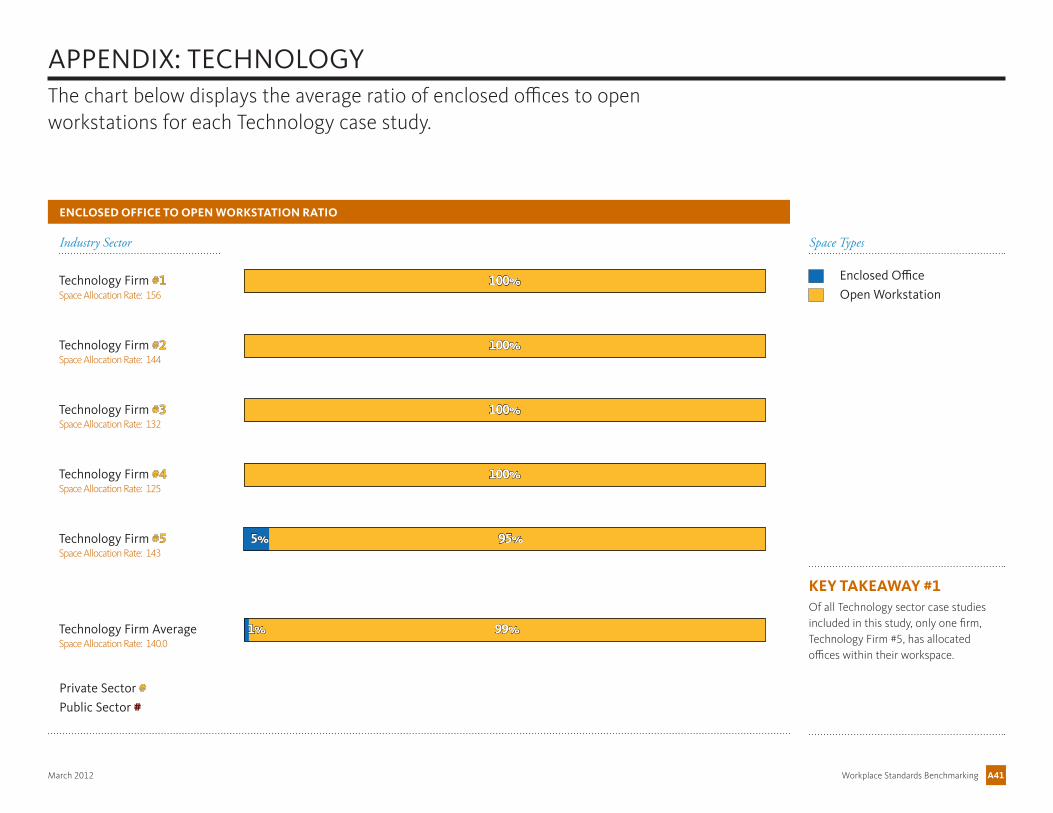
Workplace Standards BenchmarkingMarch 2012 A41
The chart below displays the average ratio of enclosed offices to open workstations for each Technology case study.
KEY TAKEAWAY #1Of all Technology sector case studies included in this study, only one firm, Technology Firm #5, has allocated offices within their workspace.
100%
100%
100%
100%
5% 95%
APPENDIX: TECHNOLOGY
ENCLOSED OFFICE TO OPEN WORKSTATION RATIO
1% 99%
Enclosed Office
Open Workstation
Space TypesIndustry Sector
Private Sector #Public Sector #
Technology Firm #1
Technology Firm #2
Technology Firm #3
Technology Firm #5
Technology Firm #4
Technology Firm Average
Space Allocation Rate: 156
Space Allocation Rate: 144
Space Allocation Rate: 132
Space Allocation Rate: 125
Space Allocation Rate: 143
Space Allocation Rate: 140.0
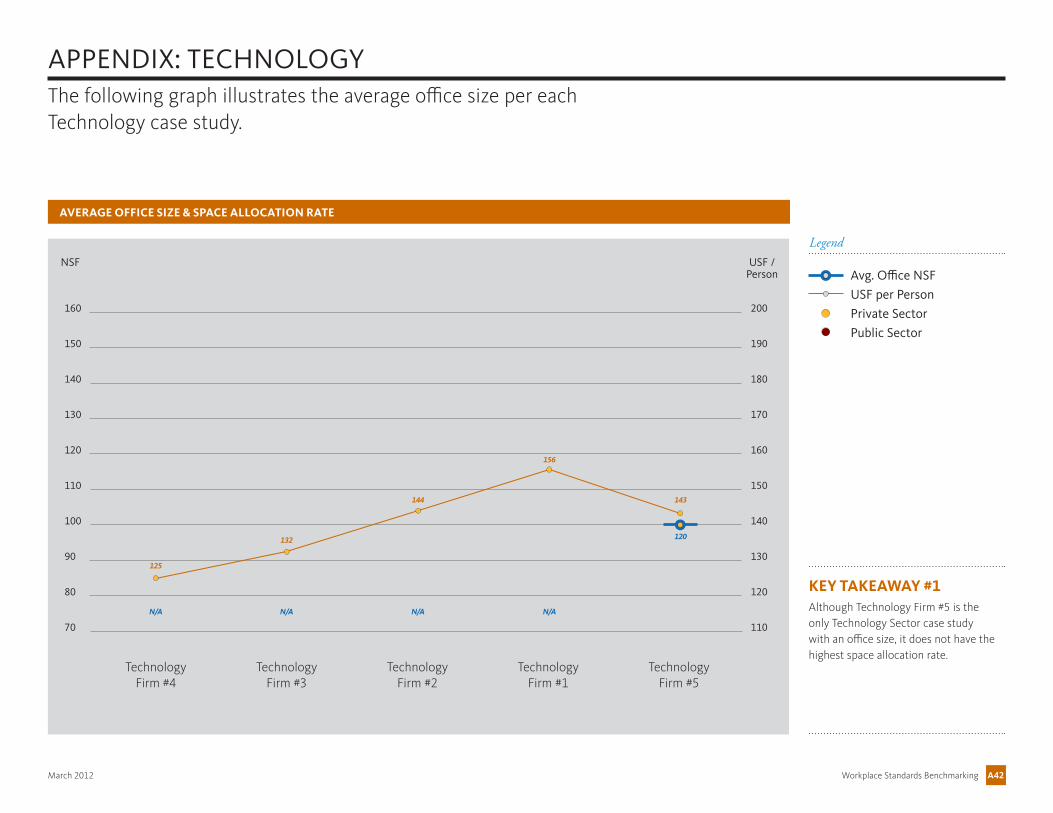
Workplace Standards BenchmarkingMarch 2012 A42
AVERAGE OFFICE SIZE & SPACE ALLOCATION RATE
The following graph illustrates the average office size per each Technology case study.
KEY TAKEAWAY #1Although Technology Firm #5 is the only Technology Sector case study with an office size, it does not have the highest space allocation rate.
USF /Person
TechnologyFirm #3
TechnologyFirm #4
Technology Firm #2
Technology Firm #1
Technology Firm #5
NSF
APPENDIX: TECHNOLOGY
70
80
100
90
110
120
130
140
150
160
110
120
130
140
150
160
170
180
190
200
Avg. Office NSF
USF per Person
Private Sector
Public Sector
Legend
N/A N/A N/A N/A
125
132
144
156
120
143
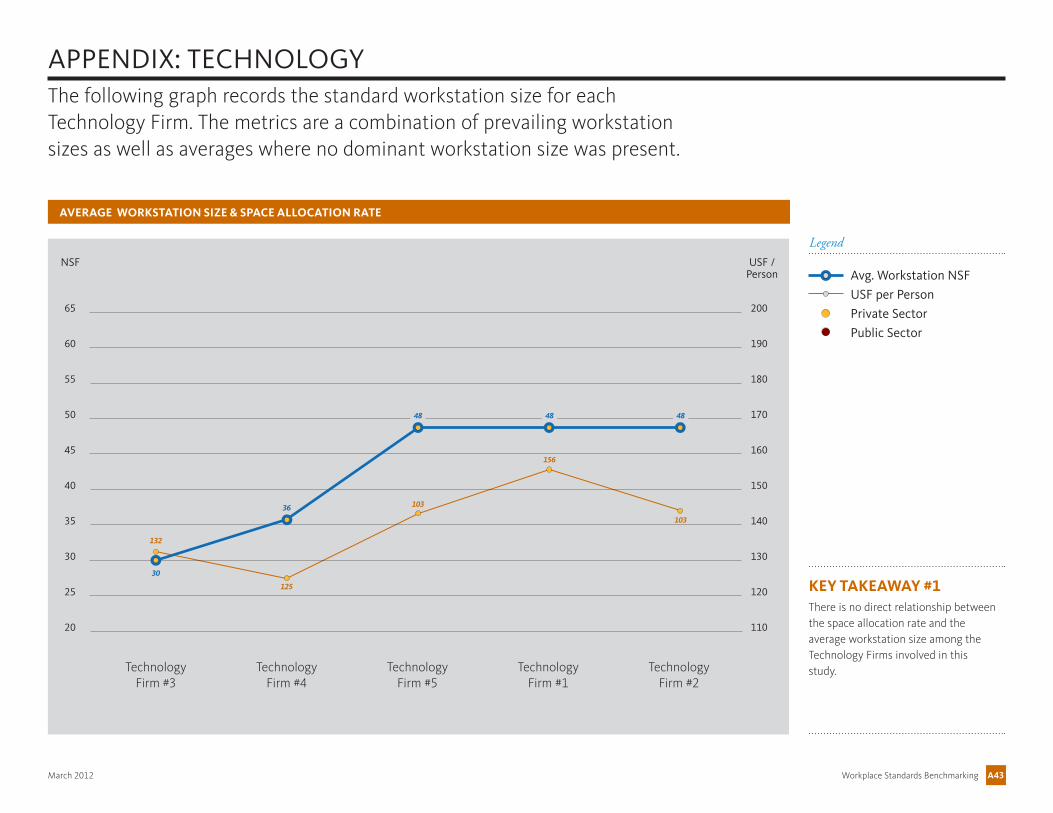
Workplace Standards BenchmarkingMarch 2012 A43
AVERAGE WORKSTATION SIZE & SPACE ALLOCATION RATE
KEY TAKEAWAY #1There is no direct relationship between the space allocation rate and the average workstation size among the Technology Firms involved in this study.
NSF USF /Person
Technology Firm #4
TechnologyFirm #3
Technology Firm #5
Technology Firm #1
Technology Firm #2
The following graph records the standard workstation size for each Technology Firm. The metrics are a combination of prevailing workstation sizes as well as averages where no dominant workstation size was present.
APPENDIX: TECHNOLOGY
110
120
130
140
150
160
170
180
190
200
20
25
35
30
40
45
50
55
60
65
Avg. Workstation NSF
USF per Person
Private Sector
Public Sector
Legend
30
132
36
125
48
103
48
156
48
103
Workplace Standards BenchmarkingMarch 2012
U.S. GENERAL SERVICES ADMINISTRATIONPUBLIC BUILDINGS SERVICE1800 F STREET, NWWASHINGTON, DC 20405
WWW.GSA.GOV