Embed Size (px)
Citation preview
August 2006
A REPORT TO THE UNITED STATES CONGRESS PURSUANT TO SECTION 1101
OF THE ENERGY POLICY ACT OF 2005
WORKFORCE TRENDS IN THE ELECTRIC UTILITY INDUSTRY

U.S. Department of Energy Workforce Trends in the Electric Utility Industry iii
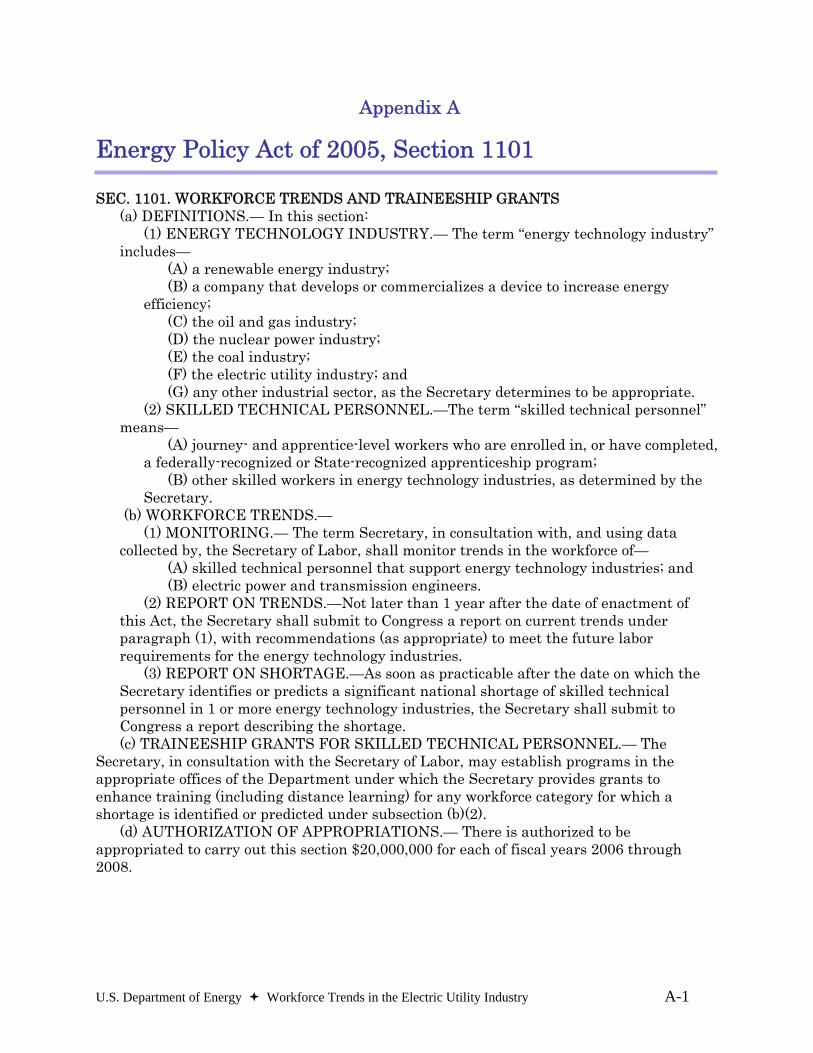
SEC. 1101. WORKFORCE TRENDS AND TRAINEESHIP GRANTS
*** (b) WORKFORCE TRENDS. – (1) MONITORING. – The Secretary, in consultation with, and using data collected by, the Secretary of Labor, shall monitor trends in the workforce of– (A) skilled technical personnel that support energy technology industries; and (B) electric power and transmission engineers. (2) REPORT ON TRENDS. – Not later than 1 year after the date of enactment of this Act, the Secretary shall submit to Congress a report on current trends under paragraph (1), with recommendations (as appropriate) to meet the future labor requirements for the energy technology industries. (3) REPORT ON SHORTAGE. – As soon as practicable after the date on which the Secretary identifies or predicts a significant national shortage of skilled technical personnel in 1 or more energy technology industries, the Secretary shall submit to Congress a report describing the shortage. ***
– Energy Policy Act of 2005, August 8, 2005

iv U.S. Department of Energy Workforce Trends in the Electric Utility Industry
U.S. Department of Energy Workforce Trends in the Electric Utility Industry v
Table of Contents Page
LIST OF FIGURES ................................................................................................................................ VII LIST OF TABLES ....................................................................................................................................IX EXECUTIVE SUMMARY ......................................................................................................................XI
1. INTRODUCTION.................................................................................................................................. 1
2. ELECTRICAL LINEWORKERS........................................................................................................ 2 2.1 CURRENT WORKFORCE.......................................................................................................... 2
2.1.1 DEFINING AND CHARACTERIZING ELECTRICAL LINEWORKERS ............................................ 2 2.1.2 EMPLOYMENT OF LINEWORKERS, 1991-2005 ........................................................................ 2 2.1.3 LINEWORKER WAGES............................................................................................................. 5
2.2 RETIREMENT PROJECTIONS................................................................................................. 5 2.3 LINEWORKER TRAINING........................................................................................................ 6
2.3.1 LINEWORKER DEVELOPMENT PROCESS ................................................................................. 6 2.3.2 LINEWORKER TRAINING PROGRAMS...................................................................................... 7 2.3.3 APPRENTICESHIPS................................................................................................................... 8
2.4 FUTURE WORKFORCE............................................................................................................. 8 2.4.1 PROJECTED DEMAND.............................................................................................................. 8 2.4.2 RETIREMENT IMPACT ANALYSIS............................................................................................ 9
3. ELECTRIC POWER AND TRANSMISSION ENGINEERS........................................................ 11 3.1 CURRENT WORKFORCE........................................................................................................ 11
3.1.1 DEFINING AND CHARACTERIZING ELECTRIC POWER ENGINEERS ....................................... 11 3.1.2 EMPLOYMENT OF POWER ENGINEERS.................................................................................. 11 3.1.3 POWER ENGINEER EARNINGS............................................................................................... 11
3.2 FUTURE WORKFORCE........................................................................................................... 13 3.2.1 ANNUAL DEMAND FOR POWER ENGINEERS......................................................................... 13 3.2.2 ANNUAL SUPPLY OF POWER ENGINEERING GRADUATES .................................................... 14 3.2.3 WORKFORCE ANALYSIS USING DEPARTMENT OF EDUCATION PROJECTIONS..................... 14 3.2.4 UNCERTAINTY OF ASSUMPTIONS ......................................................................................... 15
3.3 STATUS OF POWER ENGINEERING EDUCATION IN THE U.S. ................................... 15 3.3.1 APPLIED ENGINEERING VS. STRATEGIC LONG-TERM RESEARCH........................................ 15 3.3.2 FACULTY TRENDS ................................................................................................................ 16 3.3.3 FOREIGN ENROLLMENT........................................................................................................ 17
4. CONCLUSIONS AND RECOMMENDATIONS............................................................................. 20
5. REFERENCES..................................................................................................................................... 22 APPENDIX A — ENERGY POLICY ACT OF 2005, SECTION 1101............................................ A-1 APPENDIX B — LIST OF ACRONYMS ........................................................................................... B-1 APPENDIX C — RESEARCH METHODOLOGY / DATA SOURCES..........................................C-1 APPENDIX D — BLS PROJECTION METHODOLOGY ...............................................................D-1 APPENDIX E — LINEWORKER WORKFORCE ANALYSIS ASSUMPTIONS........................ E-1 APPENDIX F — POWER ENGINEERING WORKFORCE ANALYSIS ASSUMPTIONS........ F-1

vi U.S. Department of Energy Workforce Trends in the Electric Utility Industry
U.S. Department of Energy Workforce Trends in the Electric Utility Industry vii
List of Figures Figure Page
1 Utility Lineworker Employment Levels, 1991-2005 .................................................. 3
2 Non-Utility Lineworker Employment Levels, 1999-2005 .......................................... 4
3 Comparative Hourly Wages for Electrical Lineworkers ............................................. 5
4 Age Demographics at TVA......................................................................................... 6
5 Generic Lineworker Training Process......................................................................... 7
6 Lineworker Training Institutions, 1990-2005 ............................................................. 8
7 Lineworker Supply and Demand Projections.............................................................. 9
8 Forecast of Electrical Engineers Entering the Power Industry...................................14
9 EPRI’s Strategic vs. Applied R&D Funding, 1981-2004 ..........................................16
10 Average Power Engineering Faculty per Power Program......................................... 17
11 Power Engineering Enrollment – Graduate Programs .............................................. 18
12 High-Skill-Related Visas........................................................................................... 19

viii U.S. Department of Energy Workforce Trends in the Electric Utility Industry
U.S. Department of Energy Workforce Trends in the Electric Utility Industry ix
List of Tables Tables Page
1 Engineering Starting Salaries, 2005 .......................................................................... 12
2 Median Salaries of U.S. Electrical Engineers ........................................................... 12
3 Basic Employment Data for Power Engineers, 1994, 2004, and 2014 ..................... 13
4 Lineworkers vs. Power Engineers ............................................................................. 20

x U.S. Department of Energy Workforce Trends in the Electric Utility Industry
U.S. Department of Energy Workforce Trends in the Electric Utility Industry xi
Executive Summary Section 1101 of the U.S. Energy Policy Act of 2005 (EPACT)1 calls for a report on the current trends in the workforce of (A) skilled technical personnel that support energy technology industries, and (B) electric power and transmission engineers. It also requests that the Secretary make recommendations (as appropriate) to meet the future labor requirements.
Background
The aging of the American workforce has emerged as a critical issue facing American productivity in the 21st century. As the so-called “Baby Boomer Generation” reaches retirement eligibility, the impact will be felt across both the public and private sectors. These 78 million individuals born between 1946 and 1964 have accumulated a wealth of experience and knowledge, and represent 44% of America’s workforce. For electric utilities, whose service quality and reliability depends on maintaining an adequate, knowledgeable workforce, managing the upcoming retirement transition is a particular challenge.
Electrical Lineworkers
Electrical lineworkers represent the physical labor required to operate and maintain the electric grid. They erect poles and light or heavy-duty transmission towers, and install or repair cables or wires used to carry electricity from the power plant to the customer. In 2005, power line installers working for electrical utilities and outsourcing companies numbered 58,020. Demand is expected to outpace supply over the next decade. As a result, they are one of the highest paid professions in the United States that does not require a post secondary education, attributable perhaps to the hazards inherent to the job.
The percentage of the lineworker workforce expected to retire within the next five to ten years could approach 50% in some organizations.2 The loss of institutional knowledge is a critical concern, especially for a profession heavily dependent on mentoring and on the job training. Although the number of lineworker training institutions has grown considerably, analysis indicates a significant forecasted shortage in the availability of qualified candidates by as many as 10,000 lineworkers, or nearly 20% of the current workforce. This could eventually limit the nation’s ability to maintain and/or increase electricity supply, potentially impacting the economic and national security of the United States.
The electric industry is actively engaged in addressing the lineworker shortage – building awareness of the problem, encouraging training initiatives, and increasing interest in the lineworker profession. However, given the importance of the electricity sector to the economy and security, public-private partnerships may be warranted to promote the energy industry as a viable employment option, to develop strategies for encouraging retirement-eligible workers to remain employed in the industry, and to ensure adequate training and education opportunities to support the reliability and safety of the electricity grid.
1 Public Law 109-58, August 8, 2005. 2 Based on discussions with industry stakeholders (see Appendix C).
xii U.S. Department of Energy Workforce Trends in the Electric Utility Industry
Electric Power and Transmission Engineers
Electric power engineers traditionally focus on systems and devices for the conversion, delivery, and use of electrical energy. While the fundamental principles of power engineering have been around for a long while, the application of these principles, as well as our understanding of the electric system, continues to evolve. This enables technology enhancements that significantly improve the capability, performance, and reliability of the entire electricity system.
The electric power engineer is critical to this process. In 2004, there were 10,280 electrical engineers working in the electric power generation, transmission, and distribution industry. By 2014, the Bureau of Labor Statistics projects demand will grow to 11,113. The number of job openings resulting from employment growth and from the need to replace electrical engineers who transfer to other occupations or leave the labor force is currently expected to be in rough balance with the supply of graduates. Over time, however, this situation may not be sustainable, since statistics indicate that the primary producer of power engineering graduates, i.e. university programs, may be in jeopardy.
University-based power engineering education programs are essential to the supply of power engineering graduates to meet future needs. Yet, the restructuring of the electric utility industry, along with wider interest in newer electrical engineering fields such as microelectronics, computers, and communications, have eroded support for power engineering programs and associated long-term strategic research. In addition, recent data shows a decline in the number of power engineering faculty, exacerbating the problem.
Today, the power engineering education system in the United States is at a critical decision point. Without strong support for strategic research in power systems engineering and without qualified replacements for retiring faculty, the strength of our Nation’s university-based power engineering programs will wane, and along with them, the foundation for innovation in the power sector to meet our energy challenges in the 21st century.
Recommendations This report provides two recommendations to meet future labor requirements: foster math and science education and build interest in energy-related careers. Based on the time necessary to develop qualified personnel, these recommendations can not immediately produce meaningful results. However, they are part of a long-term solution to meeting the future energy workforce demands of the United States.
U.S. Department of Energy Workforce Trends in the Electric Utility Industry 1
WORKFORCE TRENDS IN THE ELECTRIC UTILITY INDUSTRY
1. Introduction Section 1101 of EPACT calls for a report on the current trends in the workforce of (A) skilled technical personnel that support energy technology industries; and (B) electric power and transmission engineers. It also requests that the Secretary of Energy make recommendations (as appropriate) to meet the future labor requirements.
This document is the report to Congress, examining one segment of the energy technology industries identified in Section 1101(a), specifically, “the electric utility industry.”3 The purpose of the report is not to produce precise estimates of workforce requirements. It is also not a rigorous analysis assessing the interdependencies across the various energy segments. Rather, the report uses existing data to focus on workforce trends associated with the electricity delivery industry, in particular, lineworkers and power engineers, and highlights areas where shortages are likely to occur.
The report is further organized as follows:
• Section 2 addresses electrical lineworkers. It provides a brief overview of the current workforce, examines the impact of projected retirements, and discusses the status of training institutions.
• Section 3 addresses electrical power and transmission engineers. It estimates the current workforce, identifies future demand projections, and analyzes the trends for power engineering education.
• Section 4 presents specific recommendations for meeting the future labor requirements.
• There are several appendices. The entire text of Section 1101 of EPACT is provided in Appendix A. Appendix B lists the acronyms used throughout the report. Appendix C summarizes the research methodology, while Appendix D discusses future employment projections. Appendix E documents the assumptions for the lineworker analysis. Appendix F outlines some additional analysis for power engineers using data from the Department of Education.
3 This report was prepared under the direction of the U.S. Department of Energy, Office of Electricity Delivery and Energy Reliability. Research support for the study was provided by McNeil Technologies, Inc., Energetics, Inc., and Oak Ridge National Laboratory.
2 U.S. Department of Energy Workforce Trends in the Electric Utility Industry
2. Electrical Lineworkers 2.1 Current Workforce
2.1.1 Defining and Characterizing Electrical Lineworkers
The electric utility lineworker is the “backbone” of the utility system. The profession represents the physical labor required to operate and maintain the electric grid. There are multiple job descriptions involved in this labor segment, including electrical technicians, lineworkers, and their first line supervisors. The term is generic for utility construction workers.
The Bureau of Labor Statistics (BLS) assigns the following Standard Occupation Code (SOC) to lineworkers with the following job definitions/responsibilities:
Soc Code 49-9051 Electrical Power-Line Installers and Repairers: Install or repair cables or wires used in electrical power or distribution systems. May erect poles and light or heavy-duty transmission towers. Exclude "Electrical and Electronics Repairers, Powerhouse, Substation, and Relay" (49-2095).
This occupation code is the basis of all subsequent analysis in this report using BLS data for electrical lineworkers.
In addition to being physically demanding, the lineworker’s job can be dangerous. Risks include electrocution, injury due to falls, and flash burns. They also respond during the worst weather or disasters, which often cause extensive damage to the electrical lines. The job has quality of life drawbacks such as working for extensive periods in the elements and an unpredictable work schedule, a virtual on call status, 24 hours a day, 7 days a week. Lineworkers spend extended periods traveling by truck to check power lines. However, according to OSHA data, the injury rate within this occupation is on par with other professions. This is a tribute to the high degree of professionalism and concern for safety and safety equipment that are integral to the profession.
The lineworker’s job has a strong public service aspect, and may be likened to that of a “first responder.” Indeed, in the event of natural disasters such as hurricanes or ice storms, lineworkers are critical in restoring the electric system - and hence community - to normalcy.
2.1.2 Employment of Lineworkers, 1991-2005
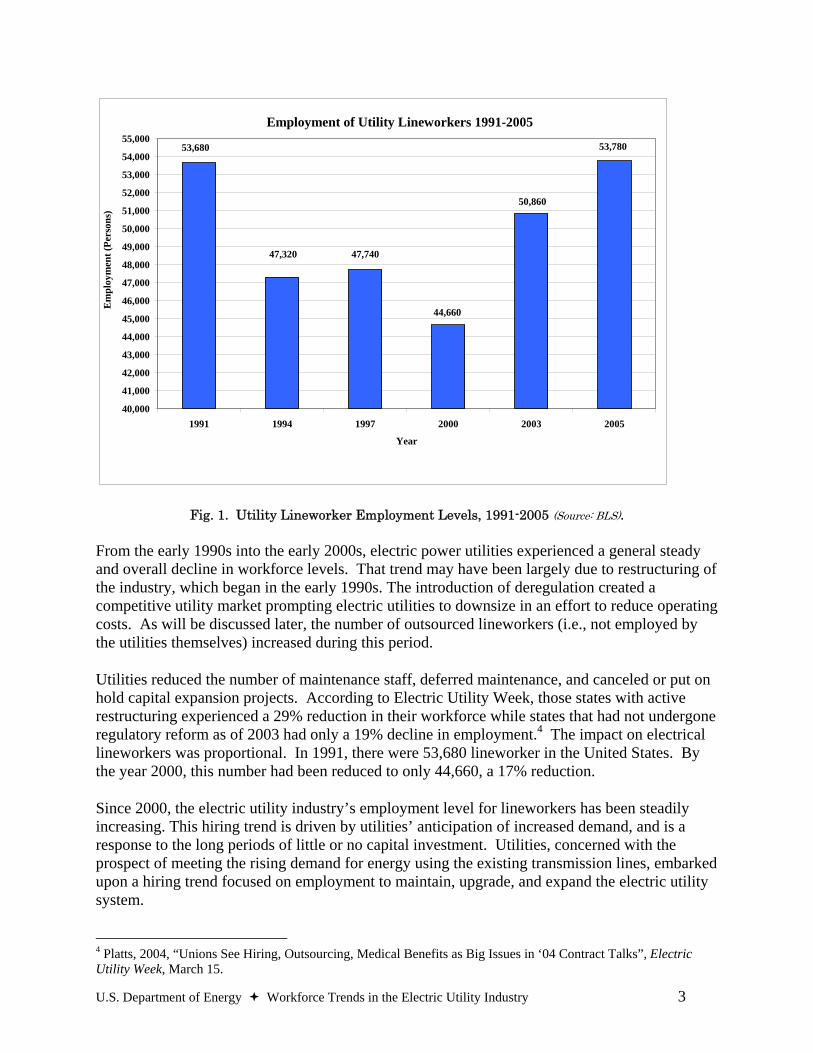
In 2005, power line installers working for electric utilities numbered 53,780, the highest employment level since 1991. According to BLS data, in 2005, power line installers represented over 13 % of the electrical generation transmission and distribution sub-group of the electric utilities industry. The employment figures for electrical lineworker have gradually increased, averaging a 1.6% increase from 1999 to 2005. Figure 1 illustrates the lineworker employment levels.
U.S. Department of Energy Workforce Trends in the Electric Utility Industry 3
Employment of Utility Lineworkers 1991-2005
53,680 53,780
50,860
44,660
47,74047,320
40,000
41,000
42,000
43,000
44,000
45,000
46,000
47,000
48,000
49,000
50,000
51,000
52,000
53,000
54,000
55,000
1991 1994 1997 2000 2003 2005
Year
Em
ploy
men
t (Pe
rson
s)
Fig. 1. Utility Lineworker Employment Levels, 1991-2005 (Source: BLS).
From the early 1990s into the early 2000s, electric power utilities experienced a general steady and overall decline in workforce levels. That trend may have been largely due to restructuring of the industry, which began in the early 1990s. The introduction of deregulation created a competitive utility market prompting electric utilities to downsize in an effort to reduce operating costs. As will be discussed later, the number of outsourced lineworkers (i.e., not employed by the utilities themselves) increased during this period.
Utilities reduced the number of maintenance staff, deferred maintenance, and canceled or put on hold capital expansion projects. According to Electric Utility Week, those states with active restructuring experienced a 29% reduction in their workforce while states that had not undergone regulatory reform as of 2003 had only a 19% decline in employment.4 The impact on electrical lineworkers was proportional. In 1991, there were 53,680 lineworker in the United States. By the year 2000, this number had been reduced to only 44,660, a 17% reduction.
Since 2000, the electric utility industry’s employment level for lineworkers has been steadily increasing. This hiring trend is driven by utilities’ anticipation of increased demand, and is a response to the long periods of little or no capital investment. Utilities, concerned with the prospect of meeting the rising demand for energy using the existing transmission lines, embarked upon a hiring trend focused on employment to maintain, upgrade, and expand the electric utility system.
4 Platts, 2004, “Unions See Hiring, Outsourcing, Medical Benefits as Big Issues in ‘04 Contract Talks”, Electric Utility Week, March 15.
4 U.S. Department of Energy Workforce Trends in the Electric Utility Industry
Additionally, the August 2003 blackout drew public attention to the fragile state of the grid. The North American Electric Reliability Council (NERC) expressed concerns that an unintended consequence of deregulation was that reliability had been negatively impacted. Subsequently, NERC and other relevant regulatory bodies began pressuring utilities to assure that they were meeting reliability standards. This supported a continuing rise in the hiring of lineworkers.
Non-Utility Lineworkers
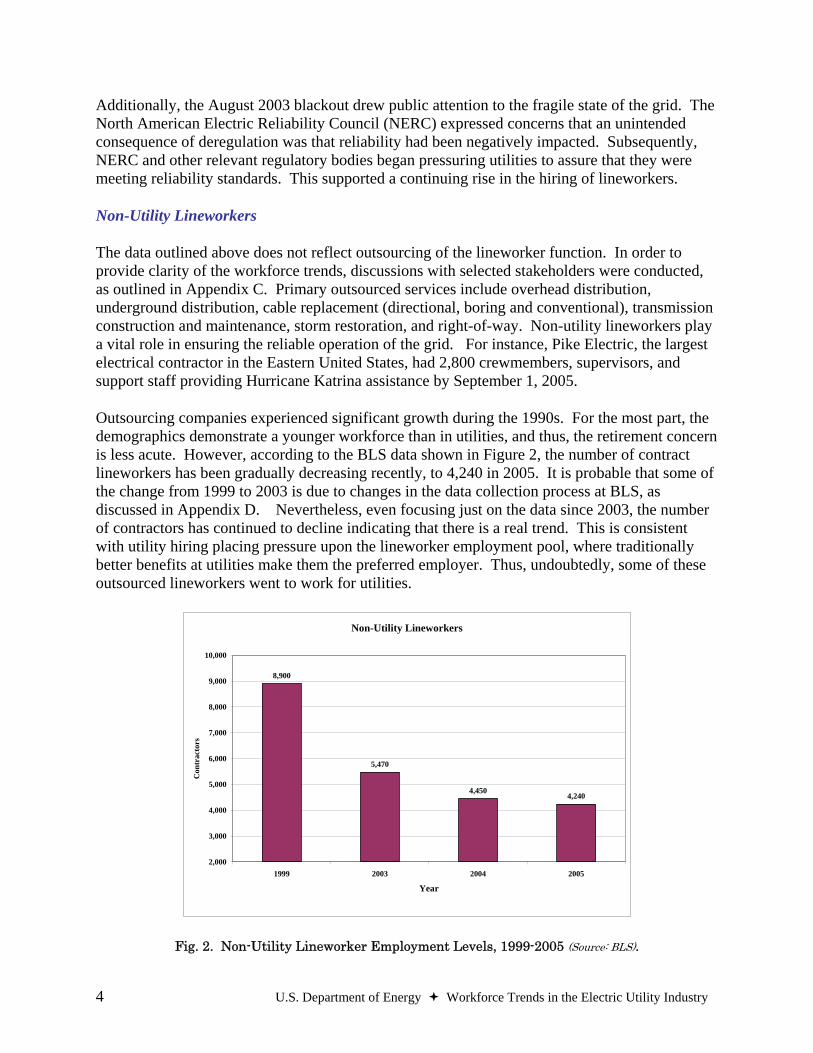
The data outlined above does not reflect outsourcing of the lineworker function. In order to provide clarity of the workforce trends, discussions with selected stakeholders were conducted, as outlined in Appendix C. Primary outsourced services include overhead distribution, underground distribution, cable replacement (directional, boring and conventional), transmission construction and maintenance, storm restoration, and right-of-way. Non-utility lineworkers play a vital role in ensuring the reliable operation of the grid. For instance, Pike Electric, the largest electrical contractor in the Eastern United States, had 2,800 crewmembers, supervisors, and support staff providing Hurricane Katrina assistance by September 1, 2005.
Outsourcing companies experienced significant growth during the 1990s. For the most part, the demographics demonstrate a younger workforce than in utilities, and thus, the retirement concern is less acute. However, according to the BLS data shown in Figure 2, the number of contract lineworkers has been gradually decreasing recently, to 4,240 in 2005. It is probable that some of the change from 1999 to 2003 is due to changes in the data collection process at BLS, as discussed in Appendix D. Nevertheless, even focusing just on the data since 2003, the number of contractors has continued to decline indicating that there is a real trend. This is consistent with utility hiring placing pressure upon the lineworker employment pool, where traditionally better benefits at utilities make them the preferred employer. Thus, undoubtedly, some of these outsourced lineworkers went to work for utilities.
Non-Utility Lineworkers
8,900
5,470
4,4504,240
2,000
3,000
4,000
5,000
6,000
7,000
8,000
9,000
10,000
1999 2003 2004 2005
Year
Con
trac
tors
Fig. 2. Non-Utility Lineworker Employment Levels, 1999-2005 (Source: BLS).
U.S. Department of Energy Workforce Trends in the Electric Utility Industry 5
2.1.3 Lineworker Wages
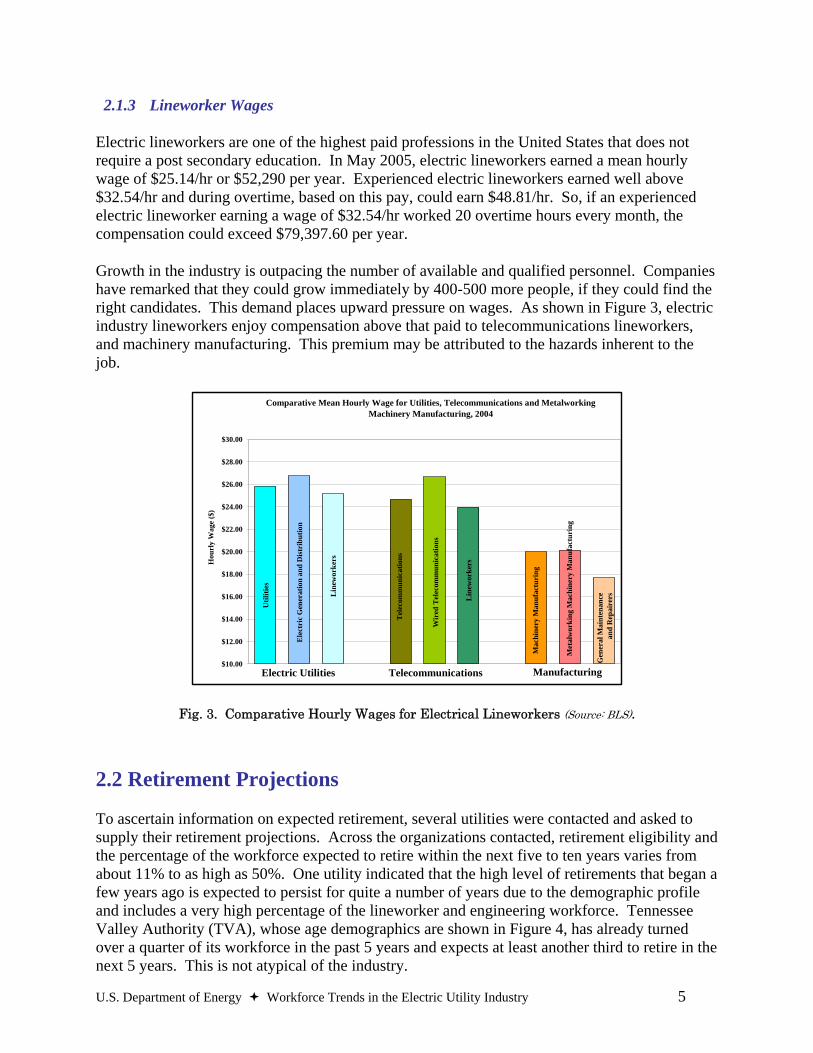
Electric lineworkers are one of the highest paid professions in the United States that does not require a post secondary education. In May 2005, electric lineworkers earned a mean hourly wage of $25.14/hr or $52,290 per year. Experienced electric lineworkers earned well above $32.54/hr and during overtime, based on this pay, could earn $48.81/hr. So, if an experienced electric lineworker earning a wage of $32.54/hr worked 20 overtime hours every month, the compensation could exceed $79,397.60 per year.
Growth in the industry is outpacing the number of available and qualified personnel. Companies have remarked that they could grow immediately by 400-500 more people, if they could find the right candidates. This demand places upward pressure on wages. As shown in Figure 3, electric industry lineworkers enjoy compensation above that paid to telecommunications lineworkers, and machinery manufacturing. This premium may be attributed to the hazards inherent to the job.
Comparative Mean Hourly Wage for Utilities, Telecommunications and Metalworking Machinery Manufacturing, 2004
Tel
ecom
mun
icat
ions
Wir
ed T
elec
omm
unic
atio
ns
Lin
ewor
kers
Mac
hine
ry M
anuf
actu
ring
Met
alw
orki
ng M
achi
nery
Man
ufac
turi
ng
Gen
eral
Mai
nten
ance
an
d R
epai
rersL
inew
orke
rs
Ele
ctri
c G
ener
atio
n an
d D
istr
ibut
ion
Util
ities
$10.00
$12.00
$14.00
$16.00
$18.00
$20.00
$22.00
$24.00
$26.00
$28.00
$30.00
Hou
rly
Wag
e ($
)
Fig. 3. Comparative Hourly Wages for Electrical Lineworkers (Source: BLS).
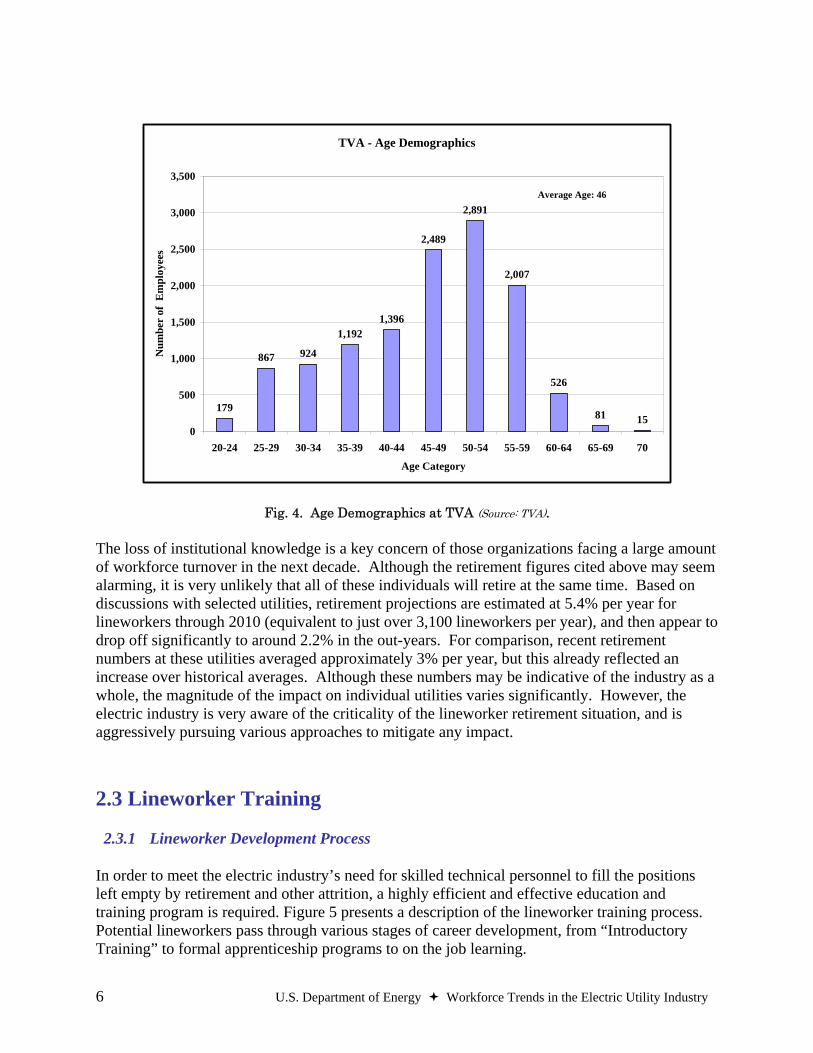
2.2 Retirement Projections To ascertain information on expected retirement, several utilities were contacted and asked to supply their retirement projections. Across the organizations contacted, retirement eligibility and the percentage of the workforce expected to retire within the next five to ten years varies from about 11% to as high as 50%. One utility indicated that the high level of retirements that began a few years ago is expected to persist for quite a number of years due to the demographic profile and includes a very high percentage of the lineworker and engineering workforce. Tennessee Valley Authority (TVA), whose age demographics are shown in Figure 4, has already turned over a quarter of its workforce in the past 5 years and expects at least another third to retire in the next 5 years. This is not atypical of the industry.
Electric Utilities Telecommunications Manufacturing
6 U.S. Department of Energy Workforce Trends in the Electric Utility Industry
TVA - Age Demographics
179
867 924
1,1921,396
2,489
2,891
2,007
526
81 150
500
1,000
1,500
2,000
2,500
3,000
3,500
20-24 25-29 30-34 35-39 40-44 45-49 50-54 55-59 60-64 65-69 70
Age Category
Num
ber
of E
mpl
oyee
s
Average Age: 46
Fig. 4. Age Demographics at TVA (Source: TVA).
The loss of institutional knowledge is a key concern of those organizations facing a large amount of workforce turnover in the next decade. Although the retirement figures cited above may seem alarming, it is very unlikely that all of these individuals will retire at the same time. Based on discussions with selected utilities, retirement projections are estimated at 5.4% per year for lineworkers through 2010 (equivalent to just over 3,100 lineworkers per year), and then appear to drop off significantly to around 2.2% in the out-years. For comparison, recent retirement numbers at these utilities averaged approximately 3% per year, but this already reflected an increase over historical averages. Although these numbers may be indicative of the industry as a whole, the magnitude of the impact on individual utilities varies significantly. However, the electric industry is very aware of the criticality of the lineworker retirement situation, and is aggressively pursuing various approaches to mitigate any impact.
2.3 Lineworker Training
2.3.1 Lineworker Development Process
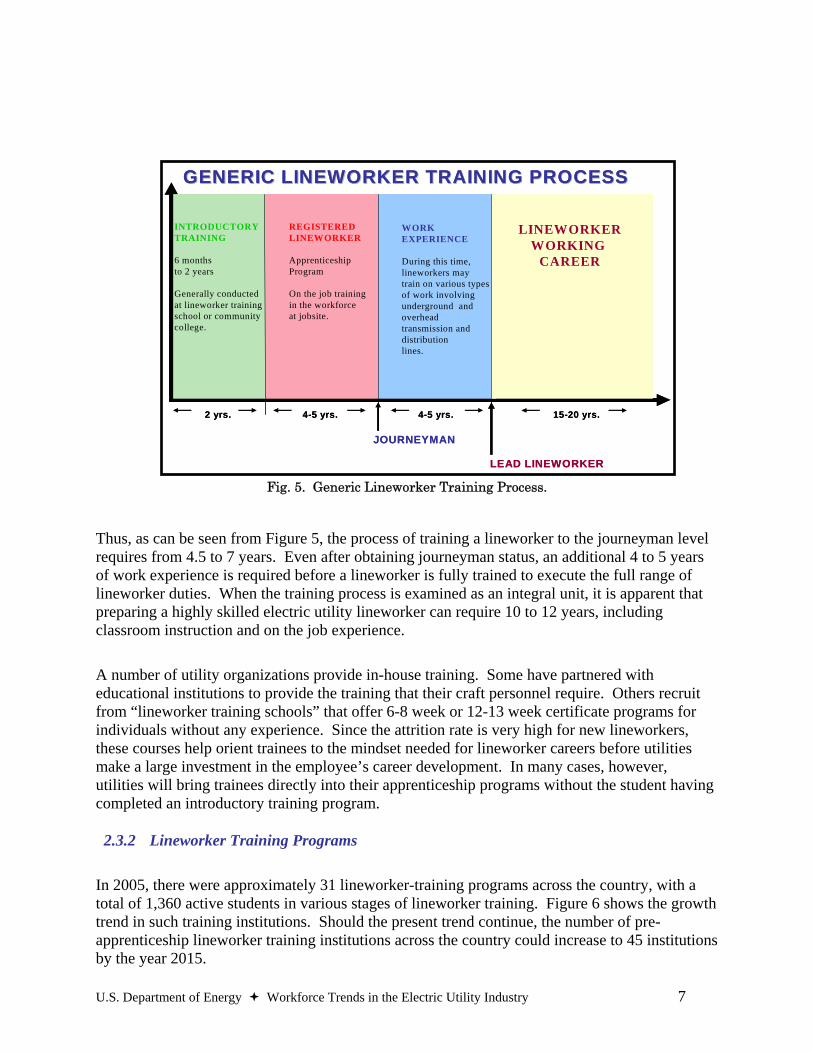
In order to meet the electric industry’s need for skilled technical personnel to fill the positions left empty by retirement and other attrition, a highly efficient and effective education and training program is required. Figure 5 presents a description of the lineworker training process. Potential lineworkers pass through various stages of career development, from “Introductory Training” to formal apprenticeship programs to on the job learning.
U.S. Department of Energy Workforce Trends in the Electric Utility Industry 7
INTRODUCTORY TRAINING
6 monthsto 2 years
Generally conducted at lineworker training school or community college.
REGISTERED LINEWORKER
Apprenticeship Program
On the job training in the workforce at jobsite.
WORK EXPERIENCE
During this time, lineworkers may train on various types of work involving underground and overhead transmission and distribution lines.
LINEWORKERWORKING
CAREER
JOURNEYMAN
LEAD LINEWORKER
2 yrs. 4-5 yrs. 4-5 yrs. 15-20 yrs.
GENERIC LINEWORKER TRAINING PROCESSGENERIC LINEWORKER TRAINING PROCESS
Fig. 5. Generic Lineworker Training Process.
Thus, as can be seen from Figure 5, the process of training a lineworker to the journeyman level requires from 4.5 to 7 years. Even after obtaining journeyman status, an additional 4 to 5 years of work experience is required before a lineworker is fully trained to execute the full range of lineworker duties. When the training process is examined as an integral unit, it is apparent that preparing a highly skilled electric utility lineworker can require 10 to 12 years, including classroom instruction and on the job experience.
A number of utility organizations provide in-house training. Some have partnered with educational institutions to provide the training that their craft personnel require. Others recruit from “lineworker training schools” that offer 6-8 week or 12-13 week certificate programs for individuals without any experience. Since the attrition rate is very high for new lineworkers, these courses help orient trainees to the mindset needed for lineworker careers before utilities make a large investment in the employee’s career development. In many cases, however, utilities will bring trainees directly into their apprenticeship programs without the student having completed an introductory training program.
2.3.2 Lineworker Training Programs
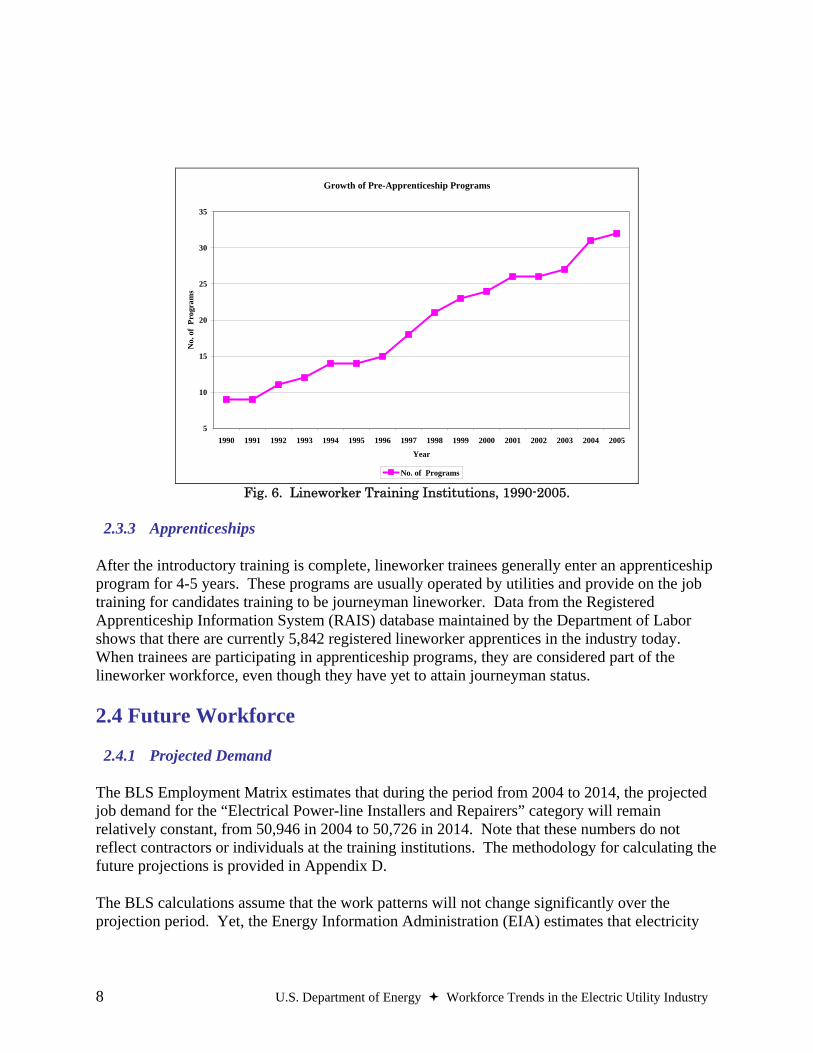
In 2005, there were approximately 31 lineworker-training programs across the country, with a total of 1,360 active students in various stages of lineworker training. Figure 6 shows the growth trend in such training institutions. Should the present trend continue, the number of pre-apprenticeship lineworker training institutions across the country could increase to 45 institutions by the year 2015.
8 U.S. Department of Energy Workforce Trends in the Electric Utility Industry
Growth of Pre-Apprenticeship Programs
5
10
15
20
25
30
35
1990 1991 1992 1993 1994 1995 1996 1997 1998 1999 2000 2001 2002 2003 2004 2005
Year
No.
of
Prog
ram
s
No. of Programs Fig. 6. Lineworker Training Institutions, 1990-2005.
2.3.3 Apprenticeships
After the introductory training is complete, lineworker trainees generally enter an apprenticeship program for 4-5 years. These programs are usually operated by utilities and provide on the job training for candidates training to be journeyman lineworker. Data from the Registered Apprenticeship Information System (RAIS) database maintained by the Department of Labor shows that there are currently 5,842 registered lineworker apprentices in the industry today. When trainees are participating in apprenticeship programs, they are considered part of the lineworker workforce, even though they have yet to attain journeyman status.
2.4 Future Workforce
2.4.1 Projected Demand
The BLS Employment Matrix estimates that during the period from 2004 to 2014, the projected job demand for the “Electrical Power-line Installers and Repairers” category will remain relatively constant, from 50,946 in 2004 to 50,726 in 2014. Note that these numbers do not reflect contractors or individuals at the training institutions. The methodology for calculating the future projections is provided in Appendix D.
The BLS calculations assume that the work patterns will not change significantly over the projection period. Yet, the Energy Information Administration (EIA) estimates that electricity
U.S. Department of Energy Workforce Trends in the Electric Utility Industry 9
demand will grow by approximately 17% between 2005 and 2015.5 Thus, it seems likely that the demand for lineworkers would grow as well, albeit slightly, during this period, unless significantly improved productivity could be achieved. In recent years 2003-2005, the growth rate of the demand for lineworkers was 1.5% per year. In addition, BLS projects that output in electric power generation, transmission, and distribution (a function of productivity) will increase at an average rate of 1.5% between 2004 and 2014.
2.4.2 Retirement Impact Analysis
In order to achieve an understanding of the impact that pending retirements will have on the lineworker workforce, projections were made based upon actual data from selected utilities, and used as representative percentages of the broader utility industries. Discussion with representatives from these organizations indicated that it is likely that the profiles for these organizations do reflect overall trends in the industry.
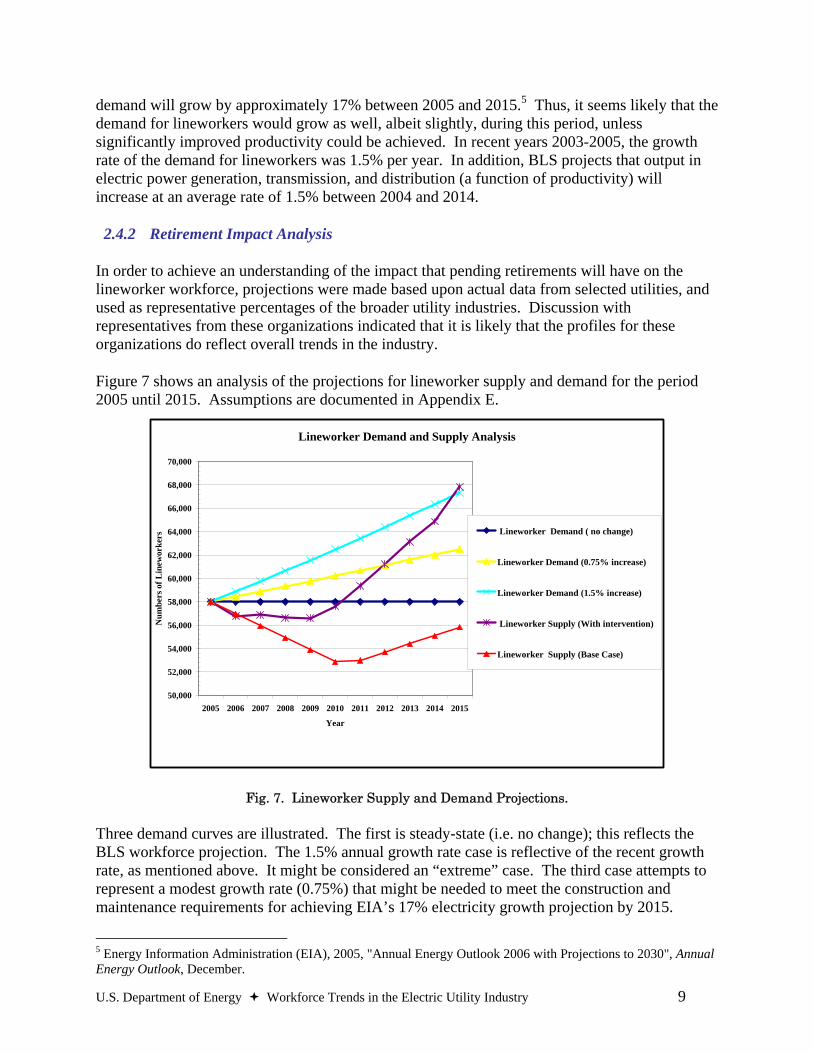
Figure 7 shows an analysis of the projections for lineworker supply and demand for the period 2005 until 2015. Assumptions are documented in Appendix E.
Lineworker Demand and Supply Analysis
50,000
52,000
54,000
56,000
58,000
60,000
62,000
64,000
66,000
68,000
70,000
2005 2006 2007 2008 2009 2010 2011 2012 2013 2014 2015
Year
Num
bers
of L
inew
orke
rs Lineworker Demand ( no change)
Lineworker Demand (0.75% increase)
Lineworker Demand (1.5% increase)
Lineworker Supply (With intervention)
Lineworker Supply (Base Case)
Fig. 7. Lineworker Supply and Demand Projections.
Three demand curves are illustrated. The first is steady-state (i.e. no change); this reflects the BLS workforce projection. The 1.5% annual growth rate case is reflective of the recent growth rate, as mentioned above. It might be considered an “extreme” case. The third case attempts to represent a modest growth rate (0.75%) that might be needed to meet the construction and maintenance requirements for achieving EIA’s 17% electricity growth projection by 2015.
5 Energy Information Administration (EIA), 2005, "Annual Energy Outlook 2006 with Projections to 2030", Annual Energy Outlook, December.
10 U.S. Department of Energy Workforce Trends in the Electric Utility Industry
Two supply cases are also presented. The base case represents the apprenticeship, training program, and retirement numbers remaining consistent with the current situation (i.e., 1,360 students actively enrolled at training institutions; 5,842 registered lineworker apprentices working in the industry; and approximately 5.4% annual retirement rate for the next five years). The intervention case models an increase in enrollment at the training programs and apprenticeships, as well as a reduction in the attrition rates. In addition, some projected retirements are “delayed” by a year.
As shown, the base case indicates a shortage in lineworkers, most acute around 2010. Despite the growth in training institutions, retirements outpace the supply of new lineworkers. Even with the subsequent growth of supply in the out-years, the loss of historical knowledge (and perhaps productivity due to the more inexperienced workforce) might by itself have a detrimental effect on the reliability and security of the grid. For instance, a shortfall in lineworkers would create longer restoration times after a disruption.
Aging workforce strategies can become an asset to organizations. Aggressive intervention, through training, workforce retention, and phased retirements, could help mitigate any consequences. Thus, the electric industry is being proactive in addressing the lineworker shortage by building awareness, encouraging training initiatives, and increasing interest in the lineworker profession at an early age.
A major obstacle is still the time period that it takes to properly train qualified lineworkers. Addressing the situation as early as possible may help the nation to maintain and/or increase electricity supply. This can be accomplished through strong public-private partnerships to promote the energy industry as a viable employment option, to develop strategies for encouraging retirement-eligible workers to remain employed in the industry, and to ensure adequate training and education opportunities. Also, developing and using technology to increase productivity and fostering knowledge transfer may be beneficial.
U.S. Department of Energy Workforce Trends in the Electric Utility Industry 11
3. Electric Power and Transmission Engineers 3.1 Current Workforce
3.1.1 Defining and Characterizing Electric Power Engineers
The electric power engineer traditionally focuses on systems and devices for the conversion, delivery, and use of electrical energy. Often, electric power engineering is considered a concentration within the electrical engineering profession. Specific subject areas include electromechanics, which includes magnetic and electric energy conversion methods and devices; large-scale power systems, which includes the analysis, operations, economics and control of electrical energy networks; and power electronic techniques for energy control, which includes design and operating methods for power semiconductor circuits and systems. Power engineering programs also include economics, business, and communications topics so students are knowledgeable about the business side of the power industry, as well as the technical side.
While the fundamental principles of power engineering have been around for a long time, the application of these principles, as well as our understanding of the electric system, continues to evolve. Communications and controls is one area that has changed dramatically over time. The growth in information technologies, along with our ability to monitor grid conditions in near real-time, has allowed us to better understand the intricate operation of the grid, and resulted in a re-examination of the fundamental principles upon which grid technologies are designed, installed, and operated. In addition, new discoveries enable technology enhancements that significantly improve the capability, performance, and reliability of the entire electricity system, which is integral to the economic and national security of the United States.
3.1.2 Employment of Power Engineers
In 2004, there were 10,280 electrical engineers working in the electric power generation, transmission and distribution (T&D) industry. Although there are power engineers working outside the electric utility industry, it is impossible to identify these individuals within the general electrical engineering category. Thus, all subsequent analysis on power engineers will only consider the industrial category identified above.
3.1.3 Power Engineer Earnings
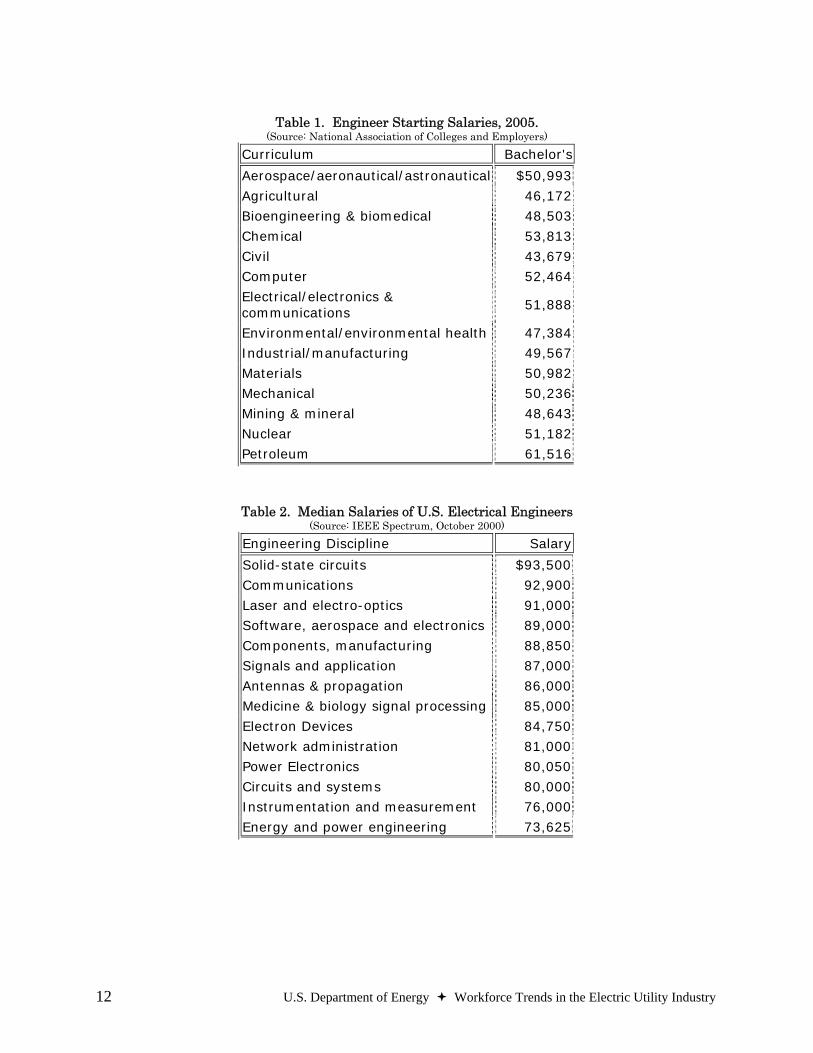
Earnings for engineers vary significantly by specialty, industry, and education. For instance, according to surveys by the IEEE-USA, Table 2 shows salaries for engineers working in the power and energy markets are behind other fields that employ electrical engineers.6 Even so, as a group, engineers earn some of the highest average starting salaries among those holding bachelor’s degrees. Table 1 shows average starting salary offers for engineers, according to a 2005 survey by the National Association of Colleges and Employers.
6 Chowdhury, B., 2000, “Power Education at the Crossroads,” IEEE Spectrum, October.
12 U.S. Department of Energy Workforce Trends in the Electric Utility Industry
Table 1. Engineer Starting Salaries, 2005.
(Source: National Association of Colleges and Employers) Curriculum Bachelor's
Aerospace/aeronautical/astronautical $50,993
Agricultural 46,172
Bioengineering & biomedical 48,503
Chemical 53,813
Civil 43,679
Computer 52,464
Electrical/electronics & communications
51,888
Environmental/environmental health 47,384
Industrial/manufacturing 49,567
Materials 50,982
Mechanical 50,236
Mining & mineral 48,643
Nuclear 51,182
Petroleum 61,516
Table 2. Median Salaries of U.S. Electrical Engineers (Source: IEEE Spectrum, October 2000)
Engineering Discipline Salary
Solid-state circuits $93,500
Communications 92,900
Laser and electro-optics 91,000
Software, aerospace and electronics 89,000
Components, manufacturing 88,850
Signals and application 87,000
Antennas & propagation 86,000
Medicine & biology signal processing 85,000
Electron Devices 84,750
Network administration 81,000
Power Electronics 80,050
Circuits and systems 80,000
Instrumentation and measurement 76,000
Energy and power engineering 73,625
U.S. Department of Energy Workforce Trends in the Electric Utility Industry 13
3.2 Future Workforce
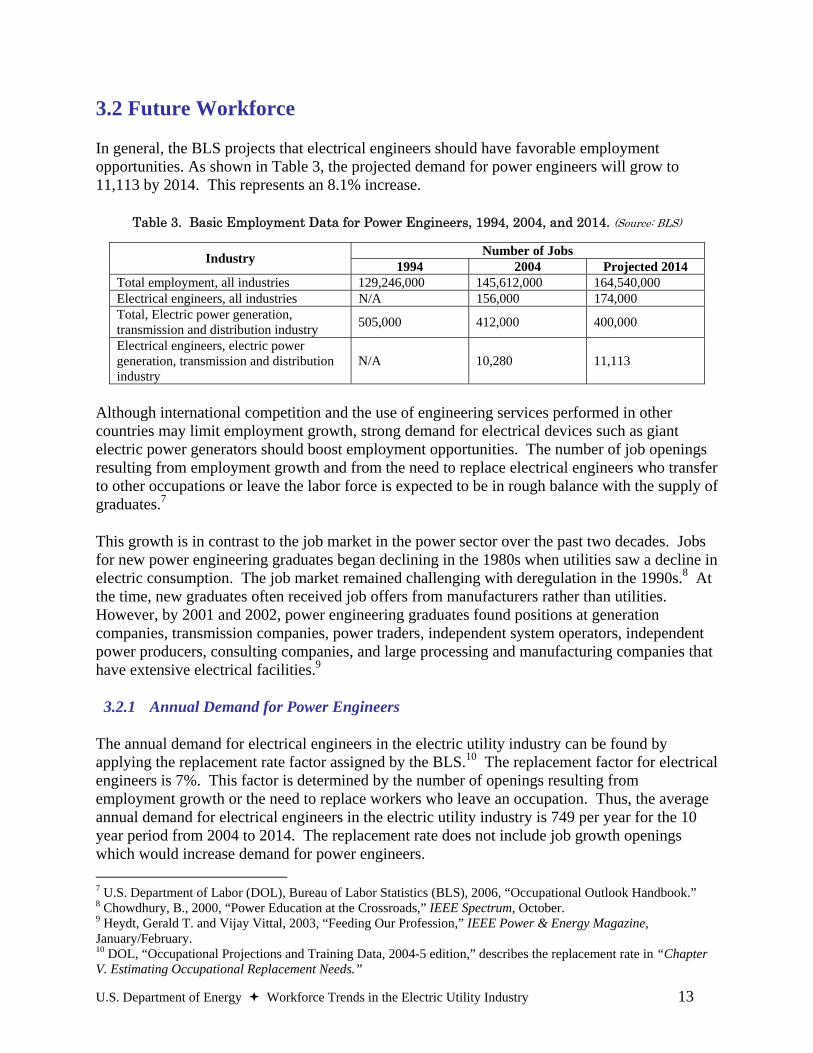
In general, the BLS projects that electrical engineers should have favorable employment opportunities. As shown in Table 3, the projected demand for power engineers will grow to 11,113 by 2014. This represents an 8.1% increase.
Table 3. Basic Employment Data for Power Engineers, 1994, 2004, and 2014. (Source: BLS)
Number of Jobs Industry 1994 2004 Projected 2014 Total employment, all industries 129,246,000 145,612,000 164,540,000 Electrical engineers, all industries N/A 156,000 174,000 Total, Electric power generation, transmission and distribution industry 505,000 412,000 400,000
Electrical engineers, electric power generation, transmission and distribution industry
N/A 10,280 11,113
Although international competition and the use of engineering services performed in other countries may limit employment growth, strong demand for electrical devices such as giant electric power generators should boost employment opportunities. The number of job openings resulting from employment growth and from the need to replace electrical engineers who transfer to other occupations or leave the labor force is expected to be in rough balance with the supply of graduates.7
This growth is in contrast to the job market in the power sector over the past two decades. Jobs for new power engineering graduates began declining in the 1980s when utilities saw a decline in electric consumption. The job market remained challenging with deregulation in the 1990s.8 At the time, new graduates often received job offers from manufacturers rather than utilities. However, by 2001 and 2002, power engineering graduates found positions at generation companies, transmission companies, power traders, independent system operators, independent power producers, consulting companies, and large processing and manufacturing companies that have extensive electrical facilities.9
3.2.1 Annual Demand for Power Engineers
The annual demand for electrical engineers in the electric utility industry can be found by applying the replacement rate factor assigned by the BLS.10 The replacement factor for electrical engineers is 7%. This factor is determined by the number of openings resulting from employment growth or the need to replace workers who leave an occupation. Thus, the average annual demand for electrical engineers in the electric utility industry is 749 per year for the 10 year period from 2004 to 2014. The replacement rate does not include job growth openings which would increase demand for power engineers. 7 U.S. Department of Labor (DOL), Bureau of Labor Statistics (BLS), 2006, “Occupational Outlook Handbook.” 8 Chowdhury, B., 2000, “Power Education at the Crossroads,” IEEE Spectrum, October. 9 Heydt, Gerald T. and Vijay Vittal, 2003, “Feeding Our Profession,” IEEE Power & Energy Magazine, January/February. 10 DOL, “Occupational Projections and Training Data, 2004-5 edition,” describes the replacement rate in “Chapter V. Estimating Occupational Replacement Needs.”
14 U.S. Department of Energy Workforce Trends in the Electric Utility Industry
Electrical Engineer Graduates Entering the Power Industry, and Projected Annual Demand
500
600
700
800
900
1989
1991
1993
1995
1997
1999
2001
2003
2005
2007
2009
2011
2013
Ann
ual D
eman
d
Supply Demand
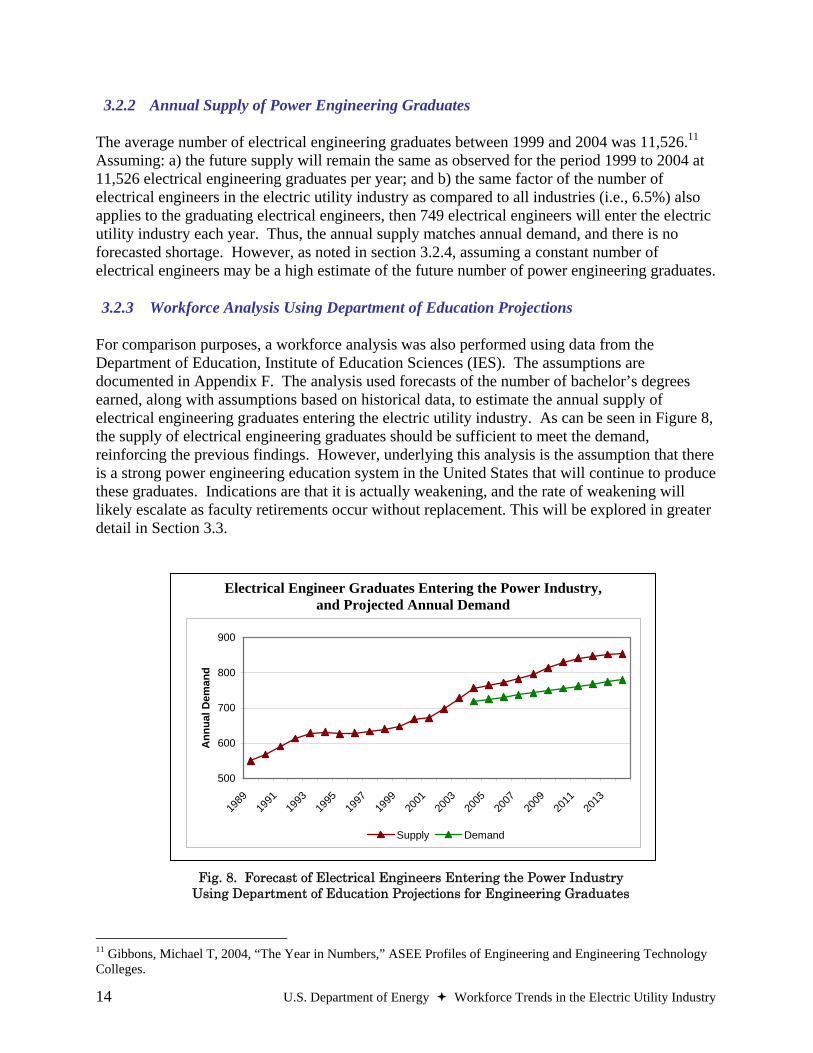
3.2.2 Annual Supply of Power Engineering Graduates
The average number of electrical engineering graduates between 1999 and 2004 was 11,526.11 Assuming: a) the future supply will remain the same as observed for the period 1999 to 2004 at 11,526 electrical engineering graduates per year; and b) the same factor of the number of electrical engineers in the electric utility industry as compared to all industries (i.e., 6.5%) also applies to the graduating electrical engineers, then 749 electrical engineers will enter the electric utility industry each year. Thus, the annual supply matches annual demand, and there is no forecasted shortage. However, as noted in section 3.2.4, assuming a constant number of electrical engineers may be a high estimate of the future number of power engineering graduates.
3.2.3 Workforce Analysis Using Department of Education Projections
For comparison purposes, a workforce analysis was also performed using data from the Department of Education, Institute of Education Sciences (IES). The assumptions are documented in Appendix F. The analysis used forecasts of the number of bachelor’s degrees earned, along with assumptions based on historical data, to estimate the annual supply of electrical engineering graduates entering the electric utility industry. As can be seen in Figure 8, the supply of electrical engineering graduates should be sufficient to meet the demand, reinforcing the previous findings. However, underlying this analysis is the assumption that there is a strong power engineering education system in the United States that will continue to produce these graduates. Indications are that it is actually weakening, and the rate of weakening will likely escalate as faculty retirements occur without replacement. This will be explored in greater detail in Section 3.3.
Fig. 8. Forecast of Electrical Engineers Entering the Power Industry
Using Department of Education Projections for Engineering Graduates
11 Gibbons, Michael T, 2004, “The Year in Numbers,” ASEE Profiles of Engineering and Engineering Technology Colleges.

U.S. Department of Energy Workforce Trends in the Electric Utility Industry 15
3.2.4 Uncertainty of Assumptions There is significant uncertainty associated with the assumptions. For instance, the percentage of power engineering graduates of the total electrical engineering graduates is likely overestimated. Over the past decades, there has been a decline in the United States of the number of students considering power engineering careers, while in many countries outside of the United States, the power engineering profession enjoys more prestige and thus, experiences higher enrollment levels.12 In the 1970s, power concentration represented approximately 10.5% of undergraduate electrical engineering students in the United States, with international figures being higher. Over time, enrollments dropped, and by 2001, that percentage dropped almost in half to 5.9%.13
If we assume that future enrollment approximates the factor stated for 2001 (i.e., 5.9%), then 680 electrical engineers will enter the electric utility industry each year. In this scenario, there will be a slight shortage of power engineers since annual supply is less than annual demand. However, with the inflow of other engineering disciplines into the power sector and the growth of other training options, this shortage is relatively small and not projected to significantly impact the industry.
3.3 Status of Power Engineering Programs in the United States
Power engineering education programs are essential to the supply of power engineering graduates needed to meet future demands. Yet, over the past two decades, the number of power engineering programs at universities has declined. Top-tier research schools have eliminated power engineering concentrations from their electrical engineering programs. This decision influenced other universities to do the same. Without strong support for strategic research in power systems and without qualified replacements for retiring faculty, the strength of the university-based power engineering education programs could erode.
3.3.1 Applied Engineering versus Strategic Long-Term Research
University curriculums are heavily influenced by industry needs and hiring rates, as well as the availability of research funding. In response to low interest in power engineering, some universities eliminated power engineering programs from their curriculum. Many of those programs that remained adjusted the curriculum to respond to the changing utility market. The focus shifted to developing applied skills rather than fostering a deeper understanding of power systems theory. Students are trained on how to use tools and technologies to complete work assignments, but few students emerge with the ability to develop the tools themselves. Without a balanced approach, there can be little advancement in developing new technologies or modernizing the grid beyond current solutions.
Power engineering programs receive funding for research from all levels of government, research institutes, and members of the utility industry. However, industry funding, e.g., the
12 Chowdhury, B., 2000, “Power Education at the Crossroads,” IEEE Spectrum, October. 13 Heydt, Gerald T. and Vijay Vittal, 2003, “Feeding Our Professions,” IEEE Power & Energy Magazine, January/February.
16 U.S. Department of Energy Workforce Trends in the Electric Utility Industry
Strategic vs. Applied R&D Funding
$0
$100
$200
$300
$400
$500
$600
$700
1981 1983 1985 1987 1989 1991 1993 1995 1997 1999 2001 2003
Millions of d
ollars (U
S)
Applied R&DStrategic R&D
EPRI R&D Funding
2004 budget of $272 million (trough)
1994 budget of$595 million (peak)
Applied R&DStrategic R&D
EPRI R&D Funding
2004 budget of $272 million (trough)
1994 budget of$595 million (peak)
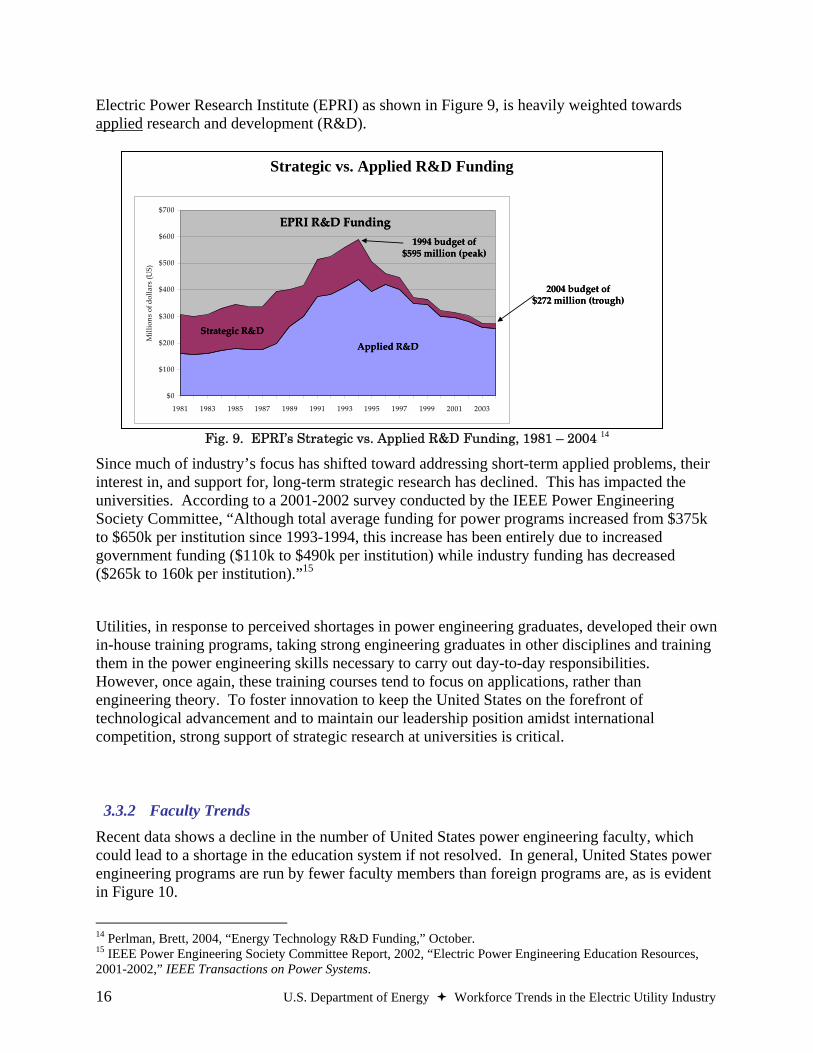
Electric Power Research Institute (EPRI) as shown in Figure 9, is heavily weighted towards applied research and development (R&D).
Fig. 9. EPRI’s Strategic vs. Applied R&D Funding, 1981 – 2004 14
Since much of industry’s focus has shifted toward addressing short-term applied problems, their interest in, and support for, long-term strategic research has declined. This has impacted the universities. According to a 2001-2002 survey conducted by the IEEE Power Engineering Society Committee, “Although total average funding for power programs increased from $375k to $650k per institution since 1993-1994, this increase has been entirely due to increased government funding ($110k to $490k per institution) while industry funding has decreased ($265k to 160k per institution).”15
Utilities, in response to perceived shortages in power engineering graduates, developed their own in-house training programs, taking strong engineering graduates in other disciplines and training them in the power engineering skills necessary to carry out day-to-day responsibilities. However, once again, these training courses tend to focus on applications, rather than engineering theory. To foster innovation to keep the United States on the forefront of technological advancement and to maintain our leadership position amidst international competition, strong support of strategic research at universities is critical.
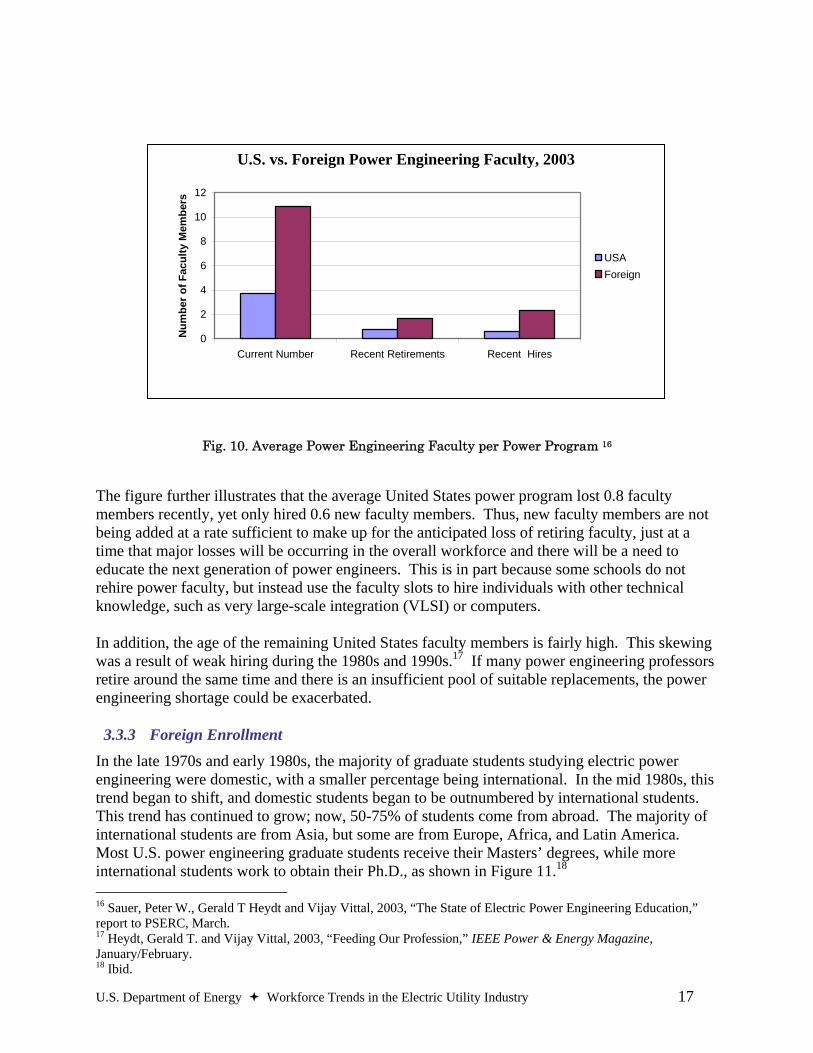
3.3.2 Faculty Trends Recent data shows a decline in the number of United States power engineering faculty, which could lead to a shortage in the education system if not resolved. In general, United States power engineering programs are run by fewer faculty members than foreign programs are, as is evident in Figure 10.
14 Perlman, Brett, 2004, “Energy Technology R&D Funding,” October. 15 IEEE Power Engineering Society Committee Report, 2002, “Electric Power Engineering Education Resources, 2001-2002,” IEEE Transactions on Power Systems.
U.S. Department of Energy Workforce Trends in the Electric Utility Industry 17
U.S. vs. Foreign Power Engineering Faculty, 2003
0
2
4
6
8
10
12
Current Number Recent Retirements Recent Hires
Num
ber o
f Fac
ulty
Mem
bers
USAForeign
Fig. 10. Average Power Engineering Faculty per Power Program 16
The figure further illustrates that the average United States power program lost 0.8 faculty members recently, yet only hired 0.6 new faculty members. Thus, new faculty members are not being added at a rate sufficient to make up for the anticipated loss of retiring faculty, just at a time that major losses will be occurring in the overall workforce and there will be a need to educate the next generation of power engineers. This is in part because some schools do not rehire power faculty, but instead use the faculty slots to hire individuals with other technical knowledge, such as very large-scale integration (VLSI) or computers. In addition, the age of the remaining United States faculty members is fairly high. This skewing was a result of weak hiring during the 1980s and 1990s.17 If many power engineering professors retire around the same time and there is an insufficient pool of suitable replacements, the power engineering shortage could be exacerbated.
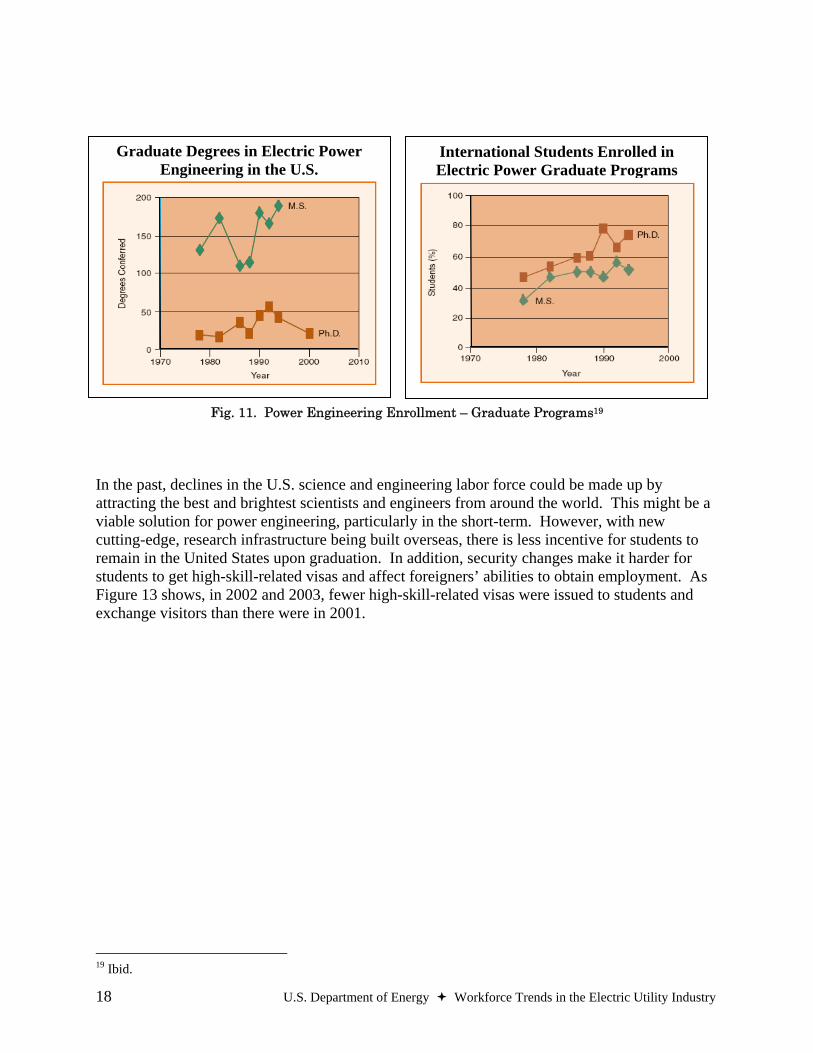
3.3.3 Foreign Enrollment In the late 1970s and early 1980s, the majority of graduate students studying electric power engineering were domestic, with a smaller percentage being international. In the mid 1980s, this trend began to shift, and domestic students began to be outnumbered by international students. This trend has continued to grow; now, 50-75% of students come from abroad. The majority of international students are from Asia, but some are from Europe, Africa, and Latin America. Most U.S. power engineering graduate students receive their Masters’ degrees, while more international students work to obtain their Ph.D., as shown in Figure 11.18 16 Sauer, Peter W., Gerald T Heydt and Vijay Vittal, 2003, “The State of Electric Power Engineering Education,” report to PSERC, March. 17 Heydt, Gerald T. and Vijay Vittal, 2003, “Feeding Our Profession,” IEEE Power & Energy Magazine, January/February. 18 Ibid.
18 U.S. Department of Energy Workforce Trends in the Electric Utility Industry
International Students Enrolled in Electric Power Graduate Programs
Graduate Degrees in Electric Power Engineering in the U.S.
International Students Enrolled in Electric Power Graduate Programs
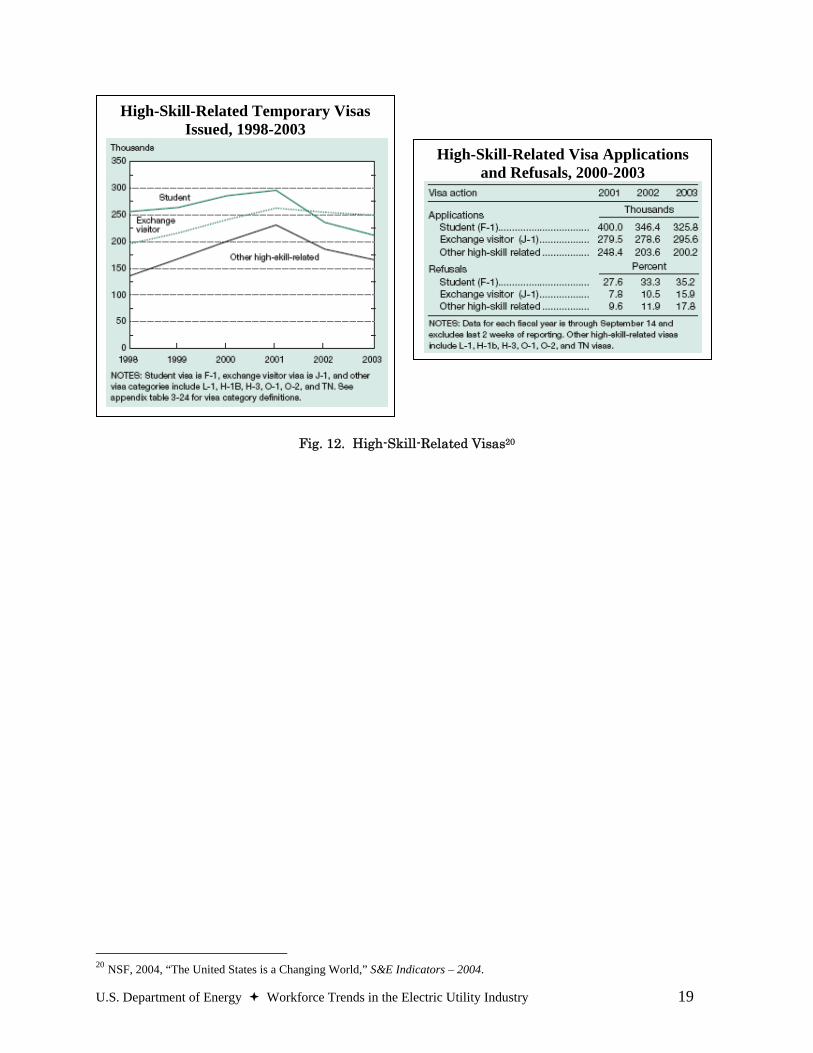
Fig. 11. Power Engineering Enrollment – Graduate Programs19 In the past, declines in the U.S. science and engineering labor force could be made up by attracting the best and brightest scientists and engineers from around the world. This might be a viable solution for power engineering, particularly in the short-term. However, with new cutting-edge, research infrastructure being built overseas, there is less incentive for students to remain in the United States upon graduation. In addition, security changes make it harder for students to get high-skill-related visas and affect foreigners’ abilities to obtain employment. As Figure 13 shows, in 2002 and 2003, fewer high-skill-related visas were issued to students and exchange visitors than there were in 2001.
19 Ibid.
U.S. Department of Energy Workforce Trends in the Electric Utility Industry 19
Fig. 12. High-Skill-Related Visas20
20 NSF, 2004, “The United States is a Changing World,” S&E Indicators – 2004.
High-Skill-Related Temporary Visas Issued, 1998-2003
High-Skill-Related Visa Applications and Refusals, 2000-2003
20 U.S. Department of Energy Workforce Trends in the Electric Utility Industry
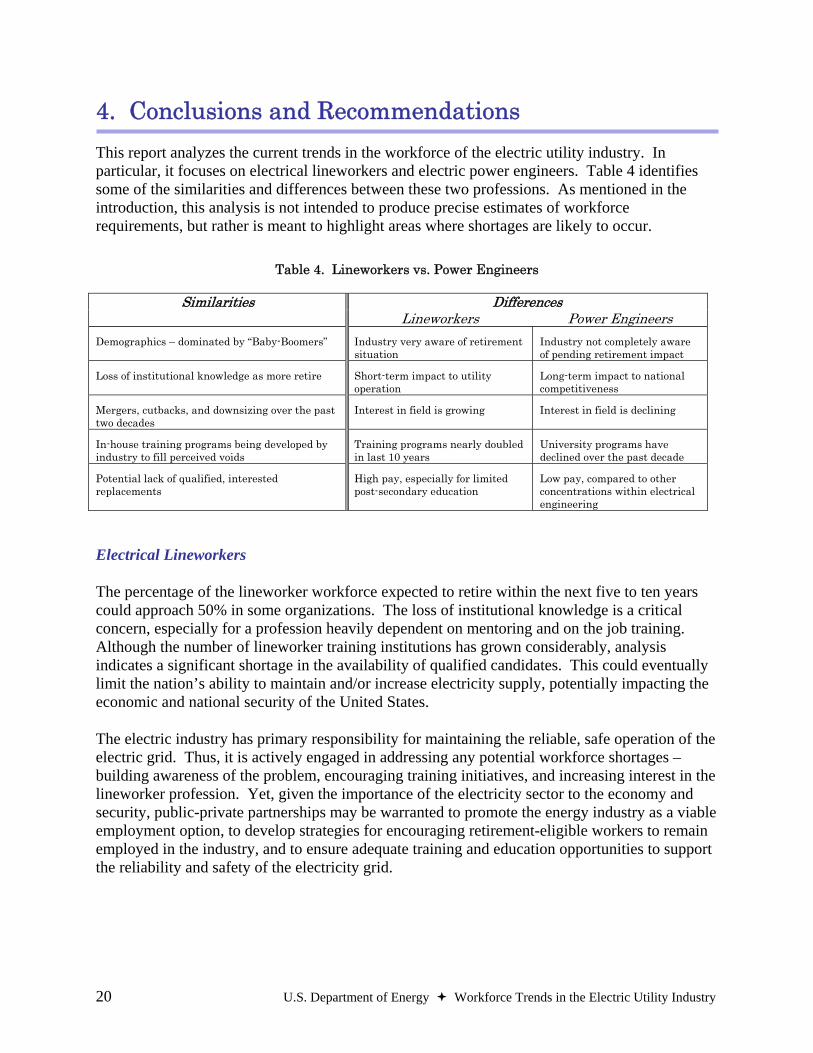
4. Conclusions and Recommendations This report analyzes the current trends in the workforce of the electric utility industry. In particular, it focuses on electrical lineworkers and electric power engineers. Table 4 identifies some of the similarities and differences between these two professions. As mentioned in the introduction, this analysis is not intended to produce precise estimates of workforce requirements, but rather is meant to highlight areas where shortages are likely to occur.
Table 4. Lineworkers vs. Power Engineers
Differences Similarities
Lineworkers Power Engineers Demographics – dominated by “Baby-Boomers” Industry very aware of retirement
situation Industry not completely aware of pending retirement impact
Loss of institutional knowledge as more retire Short-term impact to utility operation
Long-term impact to national competitiveness
Mergers, cutbacks, and downsizing over the past two decades
Interest in field is growing Interest in field is declining
In-house training programs being developed by industry to fill perceived voids
Training programs nearly doubled in last 10 years
University programs have declined over the past decade
Potential lack of qualified, interested replacements
High pay, especially for limited post-secondary education
Low pay, compared to other concentrations within electrical engineering
Electrical Lineworkers
The percentage of the lineworker workforce expected to retire within the next five to ten years could approach 50% in some organizations. The loss of institutional knowledge is a critical concern, especially for a profession heavily dependent on mentoring and on the job training. Although the number of lineworker training institutions has grown considerably, analysis indicates a significant shortage in the availability of qualified candidates. This could eventually limit the nation’s ability to maintain and/or increase electricity supply, potentially impacting the economic and national security of the United States.
The electric industry has primary responsibility for maintaining the reliable, safe operation of the electric grid. Thus, it is actively engaged in addressing any potential workforce shortages – building awareness of the problem, encouraging training initiatives, and increasing interest in the lineworker profession. Yet, given the importance of the electricity sector to the economy and security, public-private partnerships may be warranted to promote the energy industry as a viable employment option, to develop strategies for encouraging retirement-eligible workers to remain employed in the industry, and to ensure adequate training and education opportunities to support the reliability and safety of the electricity grid.

U.S. Department of Energy Workforce Trends in the Electric Utility Industry 21
Electric Power and Transmission Engineers
The number of job openings resulting from employment growth and from the need to replace electrical engineers who transfer to other occupations or leave the labor force is expected to be in rough balance with the supply of power engineering graduates. However, this situation is not sustainable without the existence of power engineering education programs to supply the graduates, and statistics indicate that these university programs are in jeopardy.
Despite industry’s apparent ability to meet short-term workforce demand on the applications side, the decline in support for basic power systems research and education is of concern. It is an engine for innovation, exploration, and ingenuity, and is necessary for sustaining scientific advancement to maintain our competitive position in the world. In addition, due to the reticence in the electric industry, incremental decisions usually last 30-40 years, requiring a broader, long-term perspective. Thus, public-private partnerships should be considered to keep America’s power research capabilities strong and secure.
Recommendations
EPACT directed the Secretary of Energy to offer recommendations (as appropriate) to meet the future labor requirements. Based on the time necessary to develop qualified personnel, many of these recommendations can not immediately produce meaningful results. However, they are part of a long-term solution to meeting the future energy workforce demands of the United States.
Fostering Math and Science Education One concern with the low interest in certain science and technology programs at the university level, such as power engineering, is the lack of preparation for such programs while students are in high school, or even grade school. Students need the right combination of math, physics, and chemistry in order to pursue engineering in college. A system of education through the secondary level that equips each new generation of Americans with the educational foundation for future study is essential. This principle is consistent with President Bush’s American Competitiveness Initiative.
Building Interest in Energy-related Careers There is a perception among some students that energy-related fields are obsolete and old fashioned. However, there are significant opportunities for creativity and innovation to meet the challenges of the 21st century. In addition, not all these positions require advanced degrees, so individuals of varying educational backgrounds can find rewarding jobs and build successful careers. Federal agencies, such as the Department of Energy and the Department of Labor, could work with the private sector to communicate what the energy industry is about and to build awareness for the careers of tomorrow.
22 U.S. Department of Energy Workforce Trends in the Electric Utility Industry
5. References Accreditation Board for Engineering and Technology (ABET), 2006, “Accredited Engineering Programs.” Available at http://www.abet.org/accrediteac.asp Anderson, J., 1999, “Making Sense of Mergers and Acquisitions” The Electricity Journal 12(7). American Public Power Association (APPA), 2005, “Work Force Planning for Public Power Utilities: Ensuring Resources to Meet Projected Needs.” Available at http://www.appanet.org/files/PDFs/WorkForcePlanningforPublicPowerUtilities.pdf Ashworth, Michael J., 2006, “Preserving Knowledge Legacies: Workforce Aging, Turnover, and Human Resource Issues in the U.S. Electric Power Industry” International Journal of Human Resource Management. Bridgers, Mark and Heather Johnson, 2005, “An Aging Workforce” Electric Perspectives September/October. Brown, Matthew H. and Richard P. Sedano, 2004, Electricity Transmission: A Primer, June. Burr, Michael, 2004, “The Talent Bubble” Public Utilities Fortnightly February. Chowdhury, B., 2000, “Power Education at the Crossroads” IEEE Spectrum October. Colorado School of Mines, 2006, “Advanced Control of Energy and Power Systems.” Available at http://www.mines.edu/research/ord/CentersPDF/ACEPS~FY02.pdf Economic History Services, 2006, “What was the Inflation Rate like Then?” Available at http://eh.net/hmit/inflation/inflationq.php Electric Utility Week; Unions See Hiring, Outsourcing, Medical Benefits as Big Issues in ‘04 Contract Talks; March 15 2004 Energy Information Administration (EIA), 1999, “The Changing Structure of the Electric Power Industry 1999: Mergers and Other Corporate Combinations” December. Available at http://www.eia.doe.gov/cneaf/electricity/corp_str/chapter1.html Energy Information Administration (EIA), 2005, "Annual Energy Outlook 2006 with Projections to 2030" Annual Energy Outlook December. Available at http://www.eia.doe.gov/oiaf/aeo/pdf/aeotab_8.pdf. Gibbons, Michael T., 2004, “The Year in Numbers,” ASEE Profiles of Engineering and Engineering Technology Colleges. Heydt, Gerald T. and Vijay Vittal, 2003, “Feeding Our Profession” IEEE Power & Energy Magazine January/February.
U.S. Department of Energy Workforce Trends in the Electric Utility Industry 23
Institute of Electrical and Electronics Engineers (IEEE) Power Engineering Society Committee, 2002, “Electric Power Engineering Education Resources, 2001-2002” report to IEEE Transactions on Power Systems. Available at http://powerlearn.ee.iastate.edu/survey/pdf/resources01-02.pdf Karady, George G. and G.T. Heydt, 2000, “Increasing Student Interest and Comprehension in Power Engineering Education at the Graduate and Undergraduate Levels” report to Institute of Electrical and Electronics Engineers (IEEE) November. Karady, George, G.T. Heydt, P. Crossley, Manfred Michel, Hugh Rudnick, and Shinichi Iwamoto, 1999, “Review of Electric Power Engineering Education Worldwide” paper presented at the Institute of Electrical and Electronics Engineers (IEEE) Power Engineering Society Summer Meeting, 2: 906-915. Niederjohn, M. Scott, 2003, “Regulatory Reform and Labor Outcomes in the U.S. Electricity Sector” Monthly Labor Review May. National Science Foundation (NSF), 2004, “The United States is a Changing World” S&E Indicators. Perlman, Brett, 2004, “Energy Technology R&D Funding,” October. Available at http://eent1.tamu.edu/txeef/presentations/2/4.pdf. Platts, 2000, “Dayton P&L Hikes Linemen Pay $2/Hour in Apparent Move to Stem Defections” Electric Utility Week October 23. Platts, 2004, “Unions See Hiring, Outsourcing, Medical Benefits as Big Issues in ‘04 Contract Talks”, Electric Utility Week March 15. Power Systems Engineering Research Center (PSERC), 2006, “About PSERC.” Available at http://www.pserc.wisc.edu/about.htm Ray, Dennis and Bill Snyder, 2005, “Strategies to Address the Problem of Exiting Expertise in the Electric Power Industry” paper presented at the Institute of Electrical and Electronics Engineers (IEEE) Hawaii International Conference on System Sciences, Symposium on Electric Power Systems Reliability, January 4-8. Reder, Wanda, 2004, “Managing the Aging Workforce With Technology and Process Improvement” presented at the Edison Electric Institute (EEI) Fall Conference, Minneapolis, Minnesota. Sauer, Peter W., Gerald T. Heydt and Vijay Vittal, 2003, “The State of Electric Power Engineering Education” report to Power Systems Engineering Research Center (PSERC), March. U.S.-Canada Power System Outage Task Force, 2004, “Final Report on the August 14, 2003 Blackout in the United States and Canada: Causes and Recommendations” April.
24 U.S. Department of Energy Workforce Trends in the Electric Utility Industry
U.S. Census Bureau, 2006, “Statistical Abstract of the United States: 2000; No.14. Resident Population Projections by Sex and Age: 2000 to 2050.” Available at http://www.census.gov/prod/2001pubs/statab/sec01.pdf U.S. Department of Education, Institute of Education Sciences, 2004, “Trends in Educational Equity of Girls and Women: 2004” NCES 2005–016. Available at http://nces.ed.gov/pubs2005/2005016.pdf U.S. Department of Education, Institute of Education Sciences, 2005, “Projection of Education Statistics to 2014” NCES 2005–074, September. Available at http://nces.ed.gov/pubs2005/2005074.pdf; U.S. Department of Education, Institute of Education Sciences Trends in Educational Equity of Girls and Women: 2004, NCES 2005–016. http://nces.ed.gov/pubs2005/2005016.pdf U.S. Department of Education, Institute of Education Sciences, 2005, “Projection of Education Statistics to 2014” NCES 2005–074, September. Available at http://nces.ed.gov/pubs2005/2005074.pdf U.S. Department of Labor (DOL), Bureau of Labor Statistics (BLS), 2006, “BLS Handbook of Methods – Chapter 13: Economic Growth and Employment Projections.” Available at http://www.bls.gov/emp/empmth01.htm (updated December 2005). U.S. Department of Labor (DOL), Bureau of Labor Statistics (BLS), 2006, “Industry-Occupation Employment Matrix, 2004 and projected 2014.” Available at http://data.bls.gov/oep/servlet/oep.nioem.servlet.ActionServlet?Action=empior&MultipleSelect=XXXXXX&Sort=ws_emp_b&StartItem=0&Resort=No&ResortButton=No&Base=2004&Proj=2014&SingleSelect=221100&Type=Industry&Number=10 U.S. Department of Labor (DOL), Bureau of Labor Statistics (BLS), 2006, “Occupational Outlook Handbook.” Available at http://www.bls.gov/oco/ocos027.htm
U.S. Department of Energy Workforce Trends in the Electric Utility Industry A-1
Appendix A
Energy Policy Act of 2005, Section 1101
SEC. 1101. WORKFORCE TRENDS AND TRAINEESHIP GRANTS (a) DEFINITIONS.— In this section:
(1) ENERGY TECHNOLOGY INDUSTRY.— The term “energy technology industry” includes—
(A) a renewable energy industry; (B) a company that develops or commercializes a device to increase energy
efficiency; (C) the oil and gas industry; (D) the nuclear power industry; (E) the coal industry; (F) the electric utility industry; and (G) any other industrial sector, as the Secretary determines to be appropriate.
(2) SKILLED TECHNICAL PERSONNEL.—The term “skilled technical personnel” means—
(A) journey- and apprentice-level workers who are enrolled in, or have completed, a federally-recognized or State-recognized apprenticeship program;
(B) other skilled workers in energy technology industries, as determined by the Secretary.
(b) WORKFORCE TRENDS.— (1) MONITORING.— The term Secretary, in consultation with, and using data
collected by, the Secretary of Labor, shall monitor trends in the workforce of— (A) skilled technical personnel that support energy technology industries; and (B) electric power and transmission engineers.
(2) REPORT ON TRENDS.—Not later than 1 year after the date of enactment of this Act, the Secretary shall submit to Congress a report on current trends under paragraph (1), with recommendations (as appropriate) to meet the future labor requirements for the energy technology industries.
(3) REPORT ON SHORTAGE.—As soon as practicable after the date on which the Secretary identifies or predicts a significant national shortage of skilled technical personnel in 1 or more energy technology industries, the Secretary shall submit to Congress a report describing the shortage. (c) TRAINEESHIP GRANTS FOR SKILLED TECHNICAL PERSONNEL.— The
Secretary, in consultation with the Secretary of Labor, may establish programs in the appropriate offices of the Department under which the Secretary provides grants to enhance training (including distance learning) for any workforce category for which a shortage is identified or predicted under subsection (b)(2).
(d) AUTHORIZATION OF APPROPRIATIONS.— There is authorized to be appropriated to carry out this section $20,000,000 for each of fiscal years 2006 through 2008.

A-2 U.S. Department of Energy Workforce Trends in the Electric Utility Industry
U.S. Department of Energy Workforce Trends in the Electric Utility Industry B-1
Appendix B
List of Acronyms ABET Accreditation Board of Engineering and Technology APPA American Public Power Association BLS Bureau of Labor Statistics CPS Current Population Survey DOE Department of Energy DOL Department of Labor EIA Energy Information Administration EPACT U.S. Energy Policy Act of 2005 EPRI Electric Power Research Institute GDP Gross Domestic Product IEEE Institute of Electrical and Electronics Engineers IES Institute of Education Services NAICS North American Industry Classification System NERC North American Electric Reliability Council NSF National Science Foundation OES Occupational Employment Statistics OSHA Occupational Safety and Health Administration PSERC Power Systems Engineering Research Center R&D Research and Development RAIS Registered Apprenticeship Information system SOC Standard Occupation Code T&D Transmission and Distribution TVA Tennessee Valley Authority VLSI Very Large-Scale Integration

B-2 U.S. Department of Energy Workforce Trends in the Electric Utility Industry

U.S. Department of Energy Workforce Trends in the Electric Utility Industry C-1
Appendix C
Research Methodology / Data Sources The methodology used to study the workforce trends within the electric utility industry involved examining available historical data and future employment projections on lineworkers and power engineers, conducting interviews with electric utilities and other industry stakeholders, and contacting learning institutions to ascertain the number of individuals in the pipeline. The analysis timeframe was constrained to a 25 year window, 1990-2015. This allowed for a retrospective, as well as a prospective view.
Data from Bureau of Labor Statistics (BLS) – The BLS compiles data on all U.S. labor categories. Using various sampling techniques, BLS is able to estimate the number of workers comprising any particular job category. Using BLS data, historical and current worker profiles were developed.
Interviews with Electric Utilities and Other Stakeholders – In order to gain an enhanced view of the workforce trends that might not be captured by the BLS data, interviews with selected utilities were conducted. These interviews focused on gathering current information on retirement profiles across the industry. They also identified the challenges with retaining and recruiting employees across the Nation.
Discussions with Learning Institutions – To obtain a deeper understanding of current training capacity across the country, interviews were conducted with training institutions that offer lineworker-training programs. Career centers at various universities were contacted regarding engineering enrollment levels.
Other Data Sources – In addition to DOL, data was extracted from other federal sources, including DOE’s Energy Information Administration (EIA). Researchers also examined reports published by organizations such as the Institute of Electrical and Electronics Engineers (IEEE), the American Public Power Association (APPA), the National Science Foundation (NSF), and the Power Systems Engineering Research Center (PSERC). Articles were garnered from journals such as Public Utilities Fortnightly, Electric Utility Week, Electric Perspectives, Monthly Labor Review, and IEEE Power and Energy Magazine.

C-2 U.S. Department of Energy Workforce Trends in the Electric Utility Industry
U.S. Department of Energy Workforce Trends in the Electric Utility Industry D-1
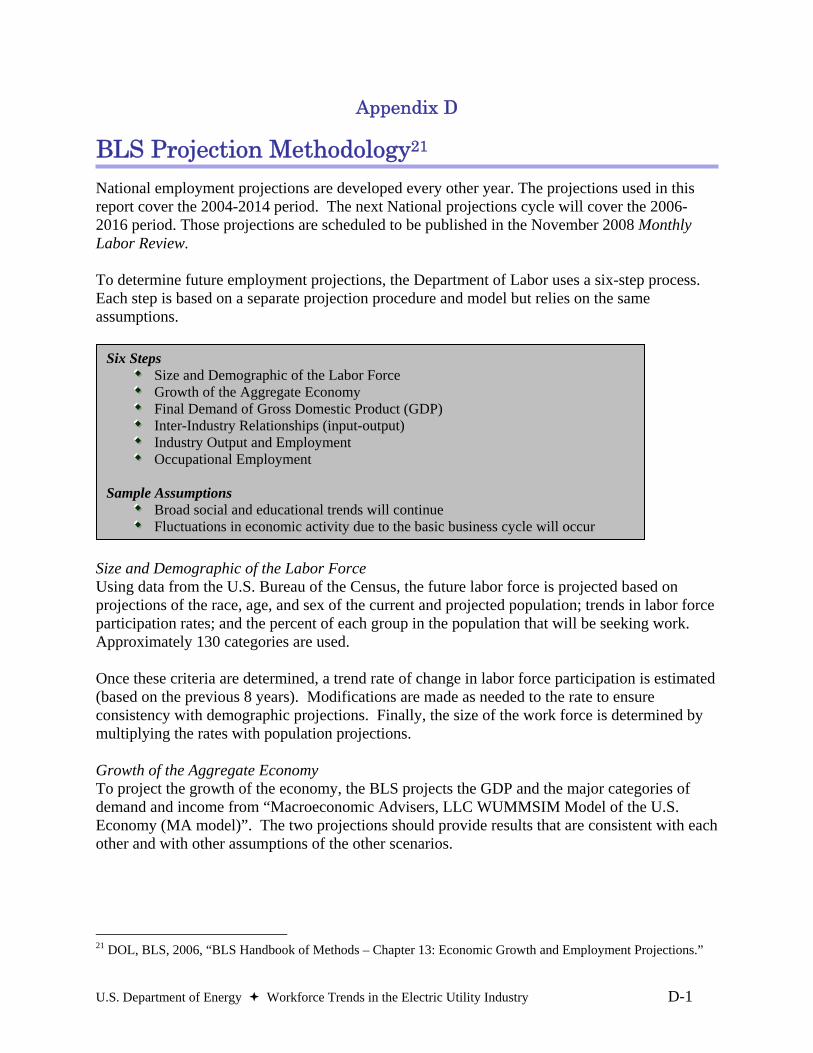
Appendix D
BLS Projection Methodology21 National employment projections are developed every other year. The projections used in this report cover the 2004-2014 period. The next National projections cycle will cover the 2006-2016 period. Those projections are scheduled to be published in the November 2008 Monthly Labor Review. To determine future employment projections, the Department of Labor uses a six-step process. Each step is based on a separate projection procedure and model but relies on the same assumptions.
Size and Demographic of the Labor Force Using data from the U.S. Bureau of the Census, the future labor force is projected based on projections of the race, age, and sex of the current and projected population; trends in labor force participation rates; and the percent of each group in the population that will be seeking work. Approximately 130 categories are used. Once these criteria are determined, a trend rate of change in labor force participation is estimated (based on the previous 8 years). Modifications are made as needed to the rate to ensure consistency with demographic projections. Finally, the size of the work force is determined by multiplying the rates with population projections. Growth of the Aggregate Economy To project the growth of the economy, the BLS projects the GDP and the major categories of demand and income from “Macroeconomic Advisers, LLC WUMMSIM Model of the U.S. Economy (MA model)”. The two projections should provide results that are consistent with each other and with other assumptions of the other scenarios.
21 DOL, BLS, 2006, “BLS Handbook of Methods – Chapter 13: Economic Growth and Employment Projections.”
Six Steps Size and Demographic of the Labor Force Growth of the Aggregate Economy Final Demand of Gross Domestic Product (GDP) Inter-Industry Relationships (input-output) Industry Output and Employment Occupational Employment
Sample Assumptions
Broad social and educational trends will continue Fluctuations in economic activity due to the basic business cycle will occur
D-2 U.S. Department of Energy Workforce Trends in the Electric Utility Industry
Final Demand of Gross Domestic Product To determine the final demand of GDP, the economy is broken into 180 sectors. A forecast of the final expenditures for each of the commodity sector in the input-output table is produced. Input-Output Tables To produce the GDP, an estimate of the flow of goods and services in the economy required is first used. Since GDP reflects only final sales, intermediate inputs must be determined. The input-output tables are then used to derive an estimate at the industry level of employment and capital necessary to produce a given level of GDP. Industry Employment The demand for wage and salary is projected using an equation that relates an industry’s labor demand to its output, its wage relative to its output price, and a time trend. The annual average weekly wage and salary hours per job are then estimated as a function of time and the unemployment rate. The projection of average hours is then used to convert the projection of wage and salary hours into jobs. Occupational Employment Occupational employment projections are based on an industry occupation matrix that shows the distribution of employees over 250 industries and 500 detailed occupations. Staffing patterns are based on data collected from State employment security agencies. Once projected staffing patterns are created, they are used to allocate each industry’s projected employment to detailed occupations. SOURCES OF BLS DATA The 2004-2014 National Industry-Occupation Employment Matrix was developed by the BLS as part of its ongoing Occupational Employment Projections Program. Data from the matrix underlies information on occupational employment growth presented in the Occupational Outlook Handbook and Career Guide to Industries. The 2004 matrix was developed primarily from the Occupational Employment Statistics (OES) survey, the Current Employment Statistics (CES) survey, and the Current Population Survey (CPS). OCCUPATIONAL AND INDUSTRY CLASSIFICATION SYSTEMS In January 2003, the Current Population Survey (CPS or "household" survey) adopted the 2002 Census occupational and industry classification systems, which are derived, respectively, from the 2000 Standard Occupational Classification (SOC) and the 2002 North American Industry Classification System (NAICS). These systems replaced the 1990 Census occupational and industry classifications. The introduction of the 2002 Census occupational and industry classification systems created a complete break in comparability with existing data series at all levels of occupation and industry aggregation. Hence, any comparisons of data on the different classifications are not possible without major adjustments.

U.S. Department of Energy Workforce Trends in the Electric Utility Industry E-1
Appendix E
Lineworker Workforce Analysis Assumptions This list of assumptions is the basis upon which the lineworker supply and demand analysis was conducted. General
All time based projections are made on the basis of linear extrapolation. All training program retention rates represent long-term averages over the analysis period. The workforce includes apprentices, contractors, and journeymen, but not pre-apprentices.
Retirements
The retirement profiles provided by the sampled utilities are consistent with retirement profiles across the industry.
Percentages are taken on the basis of a fixed employment pool versus augmenting or decrementing over time.
Retirement delays are of one-year duration. All line worker attrition is due to retirement.
Pre-Apprenticeship Training Institutions
Standard training program is 2 years in length One half of the program graduates per year Matriculating pre-apprenticeship graduates are fully absorbed by the private sector electrical
contractors. Apprenticeship Programs
Standard program is 4 years in length One quarter of the program graduates per year All matriculating apprentices are absorbed by the utility industry
Contractors
Contractor labor pool comes uniquely from the pool of matriculating pre-apprenticeship students.
Base Case Intervention Case Apprenticeship Growth Rate 0% 5% Apprenticeship Retention Rate 90% 90% Pre-Apprenticeship Growth Rate 0% 5% Pre-Apprenticeship Retention Rate 85% 85% Percent of delayed retirements 0% 10%

E-2 U.S. Department of Energy Workforce Trends in the Electric Utility Industry

U.S. Department of Energy Workforce Trends in the Electric Utility Industry F-1
Appendix F
Power Engineering Workforce Analysis Assumptions22 Based on extrapolations of data from the Department of Education, Institute of Education Sciences (IES), between 2004 and 2014, there will be a 17% increase in the number of earned bachelor’s degrees. Projections of bachelor's degrees are based on projections of college-age populations and college enrollment, by sex, attendance status, level enrolled by student, and type of institution, as well as disposable income per capita and unemployment rates. By the year 2014, the IES projects that more than 60% of bachelor degrees will be earned by women. Men will be awarded 633,000 degrees, while 949,000 will be awarded to women.
22 The analysis shown in Appendix F is based on extrapolations of data from reports released by the U.S. Department of Education, National Center for Education Statistics. There is considerable uncertainty and volatility in the information. Therefore, this analysis must not be assumed to produce precise estimates of workforce requirements, but rather should be used only to indicate overall trends.
Actual and Projected Bachelor’s Degrees Earned: 1989-2014
0.0
0.2
0.4
0.6
0.8
1.0
1.2
1.4
1.6
1.8
1989
1991
1993
1995
1997
1999
2001
2003
2005
2007
2009
2011
2013
Bac
helo
r's D
egre
es E
arne
d (M
illio
ns)
Total Men Women
Source: U.S. Department of Education, Institute of Education Sciences, Projections of Education Statistics to 2014, NCES 2005–074, September 2005. http://nces.ed.gov/pubs2005/2005074.pdf
Actual Projected
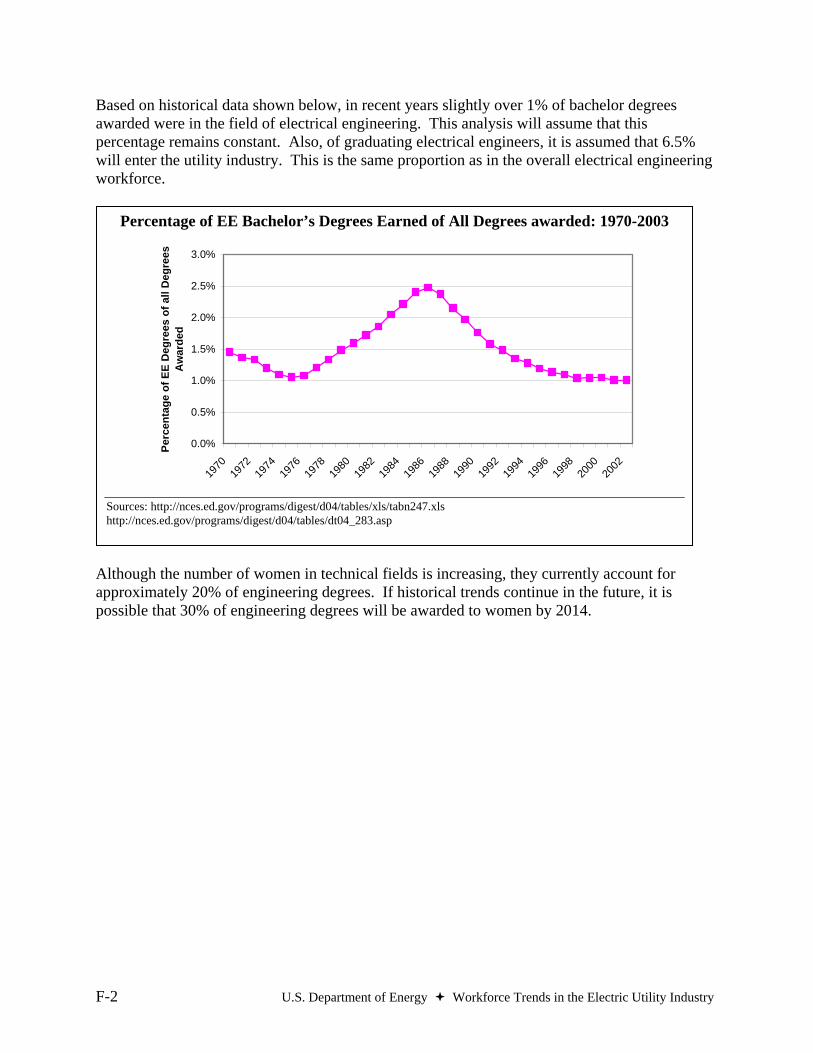
F-2 U.S. Department of Energy Workforce Trends in the Electric Utility Industry
Based on historical data shown below, in recent years slightly over 1% of bachelor degrees awarded were in the field of electrical engineering. This analysis will assume that this percentage remains constant. Also, of graduating electrical engineers, it is assumed that 6.5% will enter the utility industry. This is the same proportion as in the overall electrical engineering workforce.
Although the number of women in technical fields is increasing, they currently account for approximately 20% of engineering degrees. If historical trends continue in the future, it is possible that 30% of engineering degrees will be awarded to women by 2014.
Percentage of EE Bachelor’s Degrees Earned of All Degrees awarded: 1970-2003
0.0%
0.5%
1.0%
1.5%
2.0%
2.5%
3.0%
1970
1972
1974
1976
1978
1980
1982
1984
1986
1988
1990
1992
1994
1996
1998
2000
2002
Perc
enta
ge o
f EE
Deg
rees
of a
ll D
egre
es
Aw
arde
d
Sources: http://nces.ed.gov/programs/digest/d04/tables/xls/tabn247.xls http://nces.ed.gov/programs/digest/d04/tables/dt04_283.asp
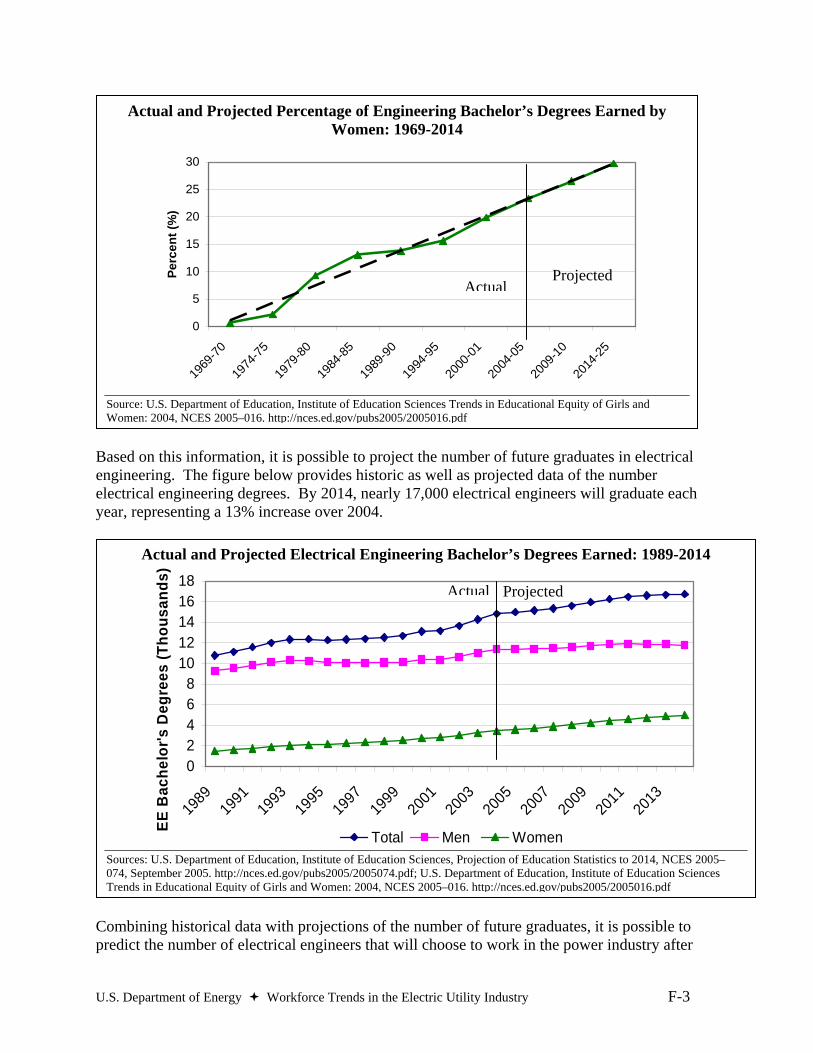
U.S. Department of Energy Workforce Trends in the Electric Utility Industry F-3
Based on this information, it is possible to project the number of future graduates in electrical engineering. The figure below provides historic as well as projected data of the number electrical engineering degrees. By 2014, nearly 17,000 electrical engineers will graduate each year, representing a 13% increase over 2004.
Combining historical data with projections of the number of future graduates, it is possible to predict the number of electrical engineers that will choose to work in the power industry after
Actual and Projected Electrical Engineering Bachelor’s Degrees Earned: 1989-2014
02468
1012141618
1989
1991
1993
1995
1997
1999
2001
2003
2005
2007
2009
2011
2013
EE B
ache
lor's
Deg
rees
(Tho
usan
ds)
Total Men Women Sources: U.S. Department of Education, Institute of Education Sciences, Projection of Education Statistics to 2014, NCES 2005–074, September 2005. http://nces.ed.gov/pubs2005/2005074.pdf; U.S. Department of Education, Institute of Education Sciences Trends in Educational Equity of Girls and Women: 2004, NCES 2005–016. http://nces.ed.gov/pubs2005/2005016.pdf
Actual and Projected Percentage of Engineering Bachelor’s Degrees Earned by Women: 1969-2014
0
5
10
15
20
25
30
1969
-70
1974
-75
1979
-80
1984
-85
1989
-90
1994
-95
2000
-01
2004
-05
2009
-10
2014
-25
Perc
ent (
%)
Source: U.S. Department of Education, Institute of Education Sciences Trends in Educational Equity of Girls and Women: 2004, NCES 2005–016. http://nces.ed.gov/pubs2005/2005016.pdf
Actual
Projected Actual
Projected
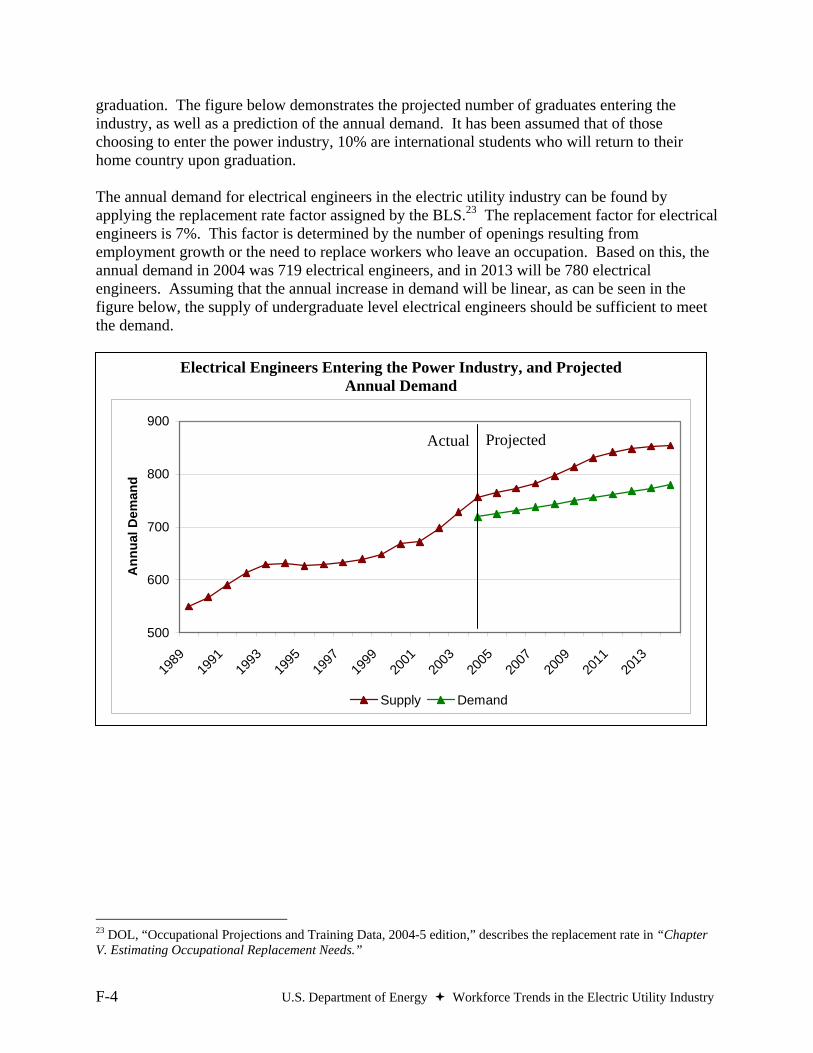
F-4 U.S. Department of Energy Workforce Trends in the Electric Utility Industry
graduation. The figure below demonstrates the projected number of graduates entering the industry, as well as a prediction of the annual demand. It has been assumed that of those choosing to enter the power industry, 10% are international students who will return to their home country upon graduation. The annual demand for electrical engineers in the electric utility industry can be found by applying the replacement rate factor assigned by the BLS.23 The replacement factor for electrical engineers is 7%. This factor is determined by the number of openings resulting from employment growth or the need to replace workers who leave an occupation. Based on this, the annual demand in 2004 was 719 electrical engineers, and in 2013 will be 780 electrical engineers. Assuming that the annual increase in demand will be linear, as can be seen in the figure below, the supply of undergraduate level electrical engineers should be sufficient to meet the demand.
23 DOL, “Occupational Projections and Training Data, 2004-5 edition,” describes the replacement rate in “Chapter V. Estimating Occupational Replacement Needs.”
Electrical Engineers Entering the Power Industry, and Projected Annual Demand
500
600
700
800
900
1989
1991
1993
1995
1997
1999
2001
2003
2005
2007
2009
2011
2013
Ann
ual D
eman
d
Supply Demand
Projected Actual