Embed Size (px)
Citation preview
Workflow for Finding Bypassed Reserves in Mature Assets
Real Time Integration of Simulation , Seismic Interpretation, and Geophysics
Best Answers Possible Simulation matches dynamics Geology matches statics and dynamics
Integration of Seismic, Geoscience and Reservoir Simulation Almost Never Applied
Not Practical Work flow in each disciplines historically takes
months to years Answers needed in weeks to months to add
value
A good answer on time is better than a perfect answer too late
Reality Today
Data Analysis System Requirements Easy to Use Windows Based Mapping/Simulation
Packages
Designed for all engineers Not just the expert
Easy integration of geology Apprentice mapping package
Interpretations for simulator in hours
User friendly simulation analysis system Merlin - easy to use windows based pre / post
processor Quick results
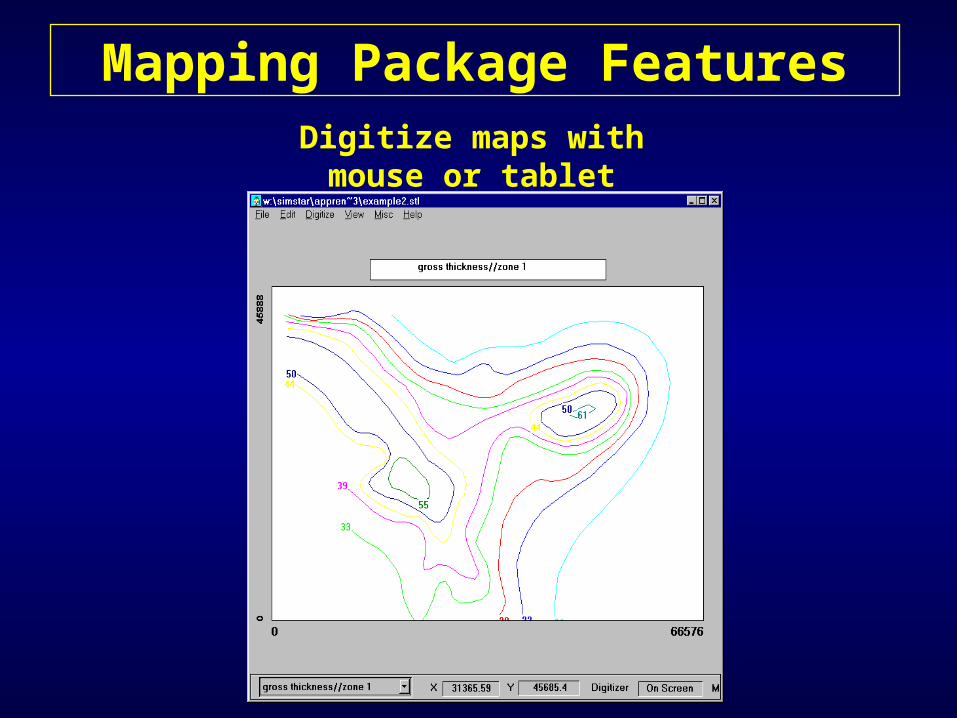
Mapping Package FeaturesDigitize maps with mouse or
tablet

Import wizard to import maps from other programs
Mapping Package Features
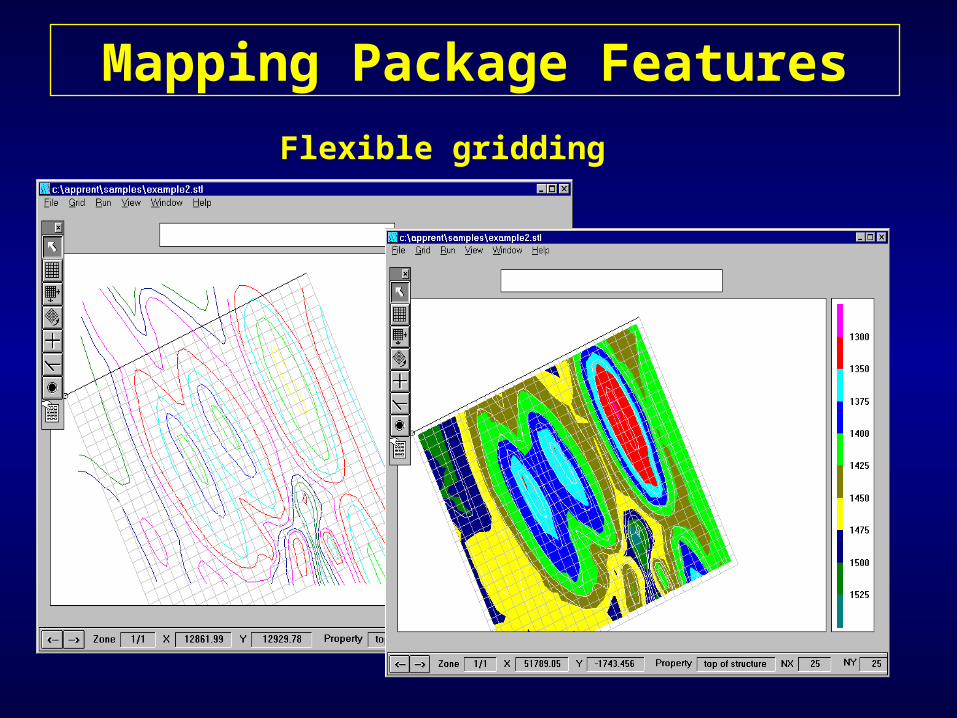
Flexible gridding
Mapping Package Features

Data Analysis System Features
PVT/Kr correlations
Waterflood pattern models in minutes

Place horizontal and vertical well trajectories with the mouse
Data Analysis System Features

Data Analysis System Features
Contour maps and cross sections
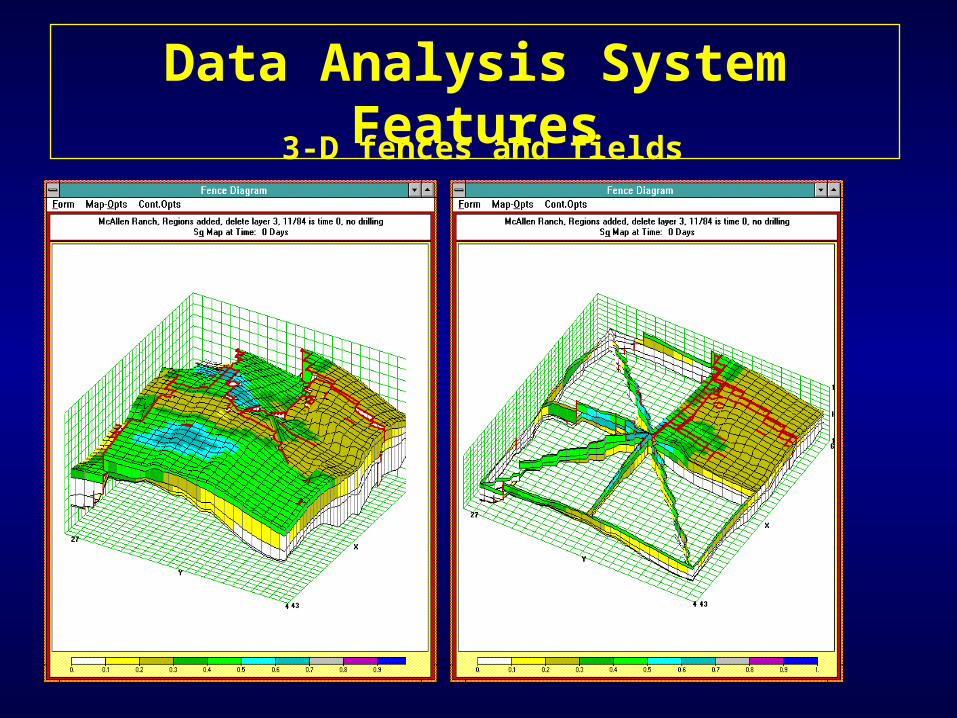
Data Analysis System Features
3-D fences and fields

Data Analysis System FeaturesTernary colors

Evaluation of Mature Asset with Quantitative 3-D Seismic
Gemini Solutions, Inc..

Objective:
in partnership with Energy Outpostassess drilling prospects for the Mature Gulf Of Mexico Prospect

Introduction:
5 major sands investigated: Sand 1, Sand 2, Sand 3,Sand 4, Sand 5
Highly faulted and compartmentalized environment:a total of 52 reservoirs/fault blocks
24 reservoirs/fault blocks with production historyand 29 wells/completions
A total of 64 independent reservoirs/fault blocksinitialized and simulated to arrive at final results.

Introduction (cont.):
Reservoir models initialized on the basis of:
- structure, gross thickness, net thickness, and porosity maps developed by Energy Outpost
- available reservoir data from property/prospects files (PVT, well test, completion data, etc.)
- assumption of relative permeability, and permeability
All sands simulated on identical 53x46x3 variable size grid

Introduction (cont.):
Reservoir history match performed for every fault blockwith production history, within the focus area.
Reservoir history match results resolved with EnergyOutpost interpretations (iterative process of model definition and enhancement).
Final models used to approximate hydrocarbons in placefor prospect areas, and to approximate recovery.

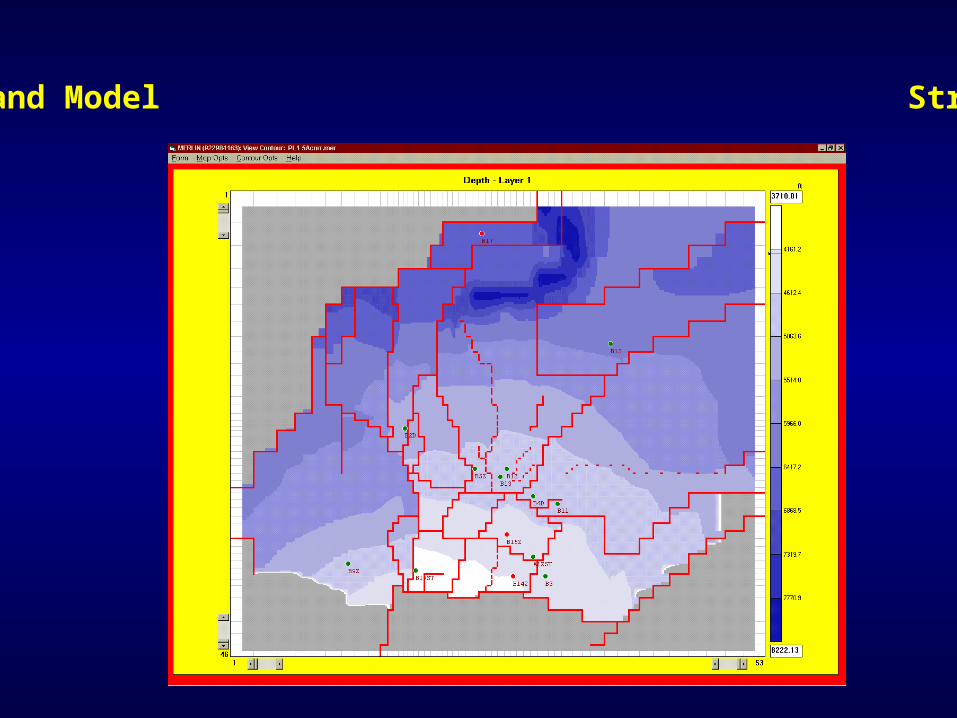
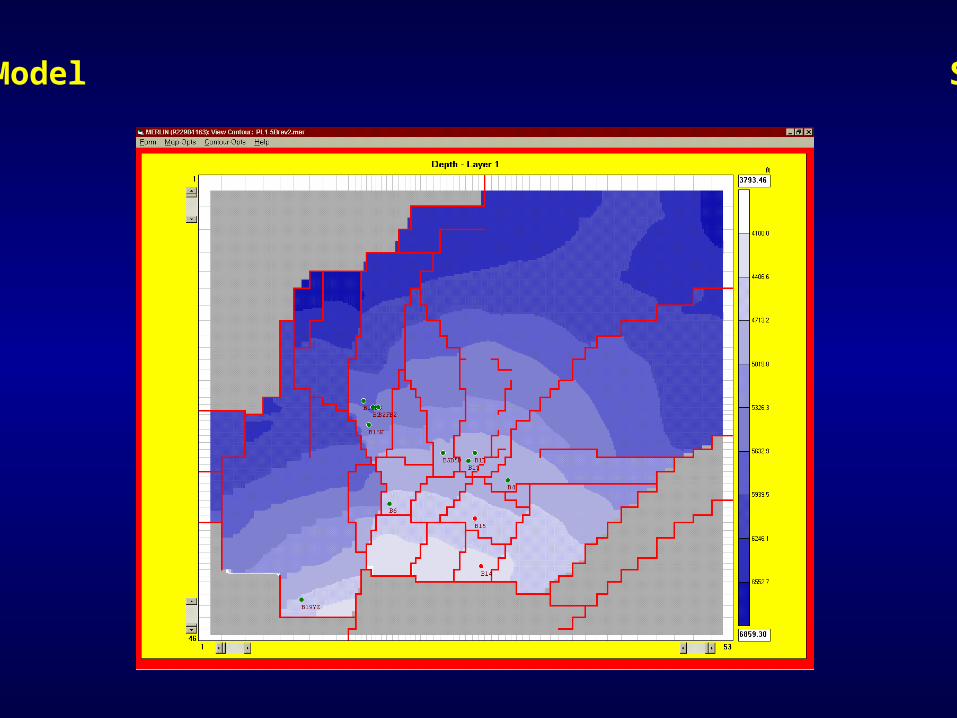
Sand 1 Sand Model Structure Map

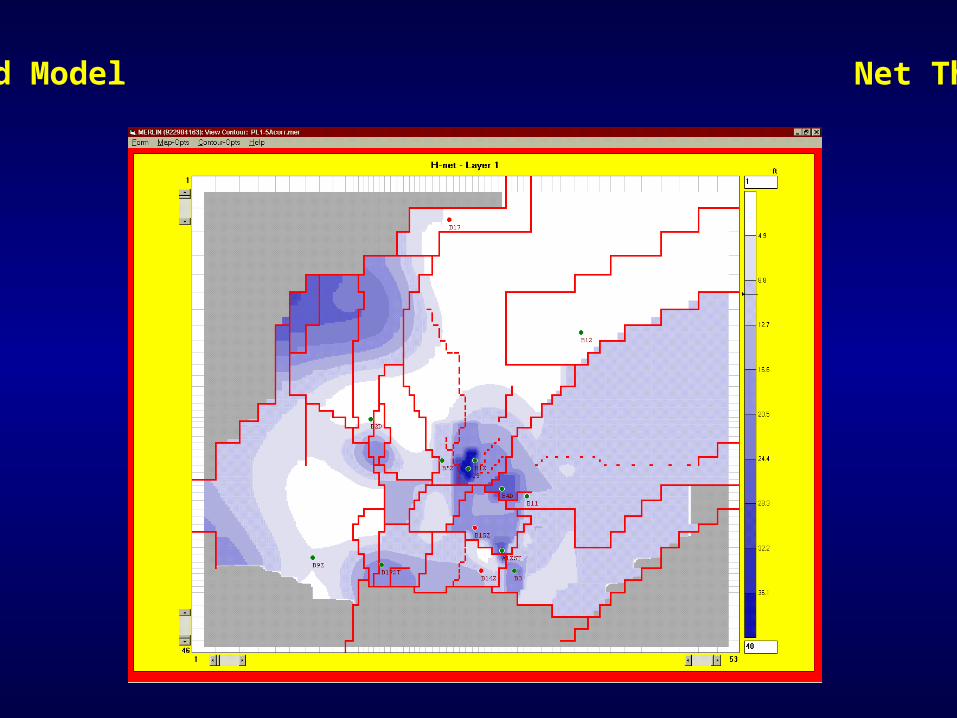
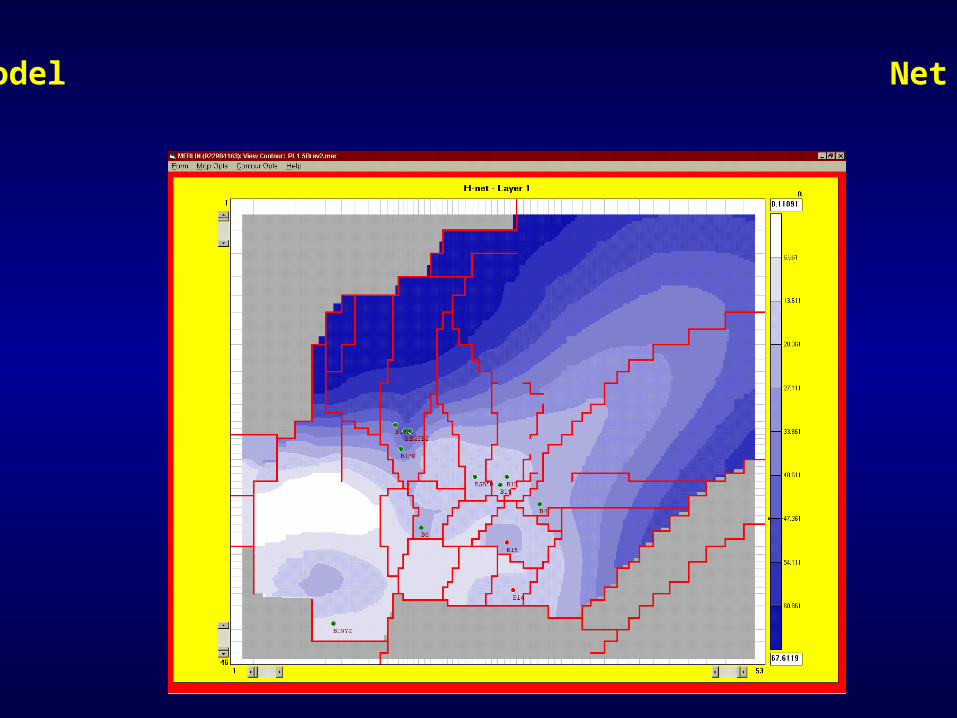
Sand 1 Sand Model Net Thickness Map
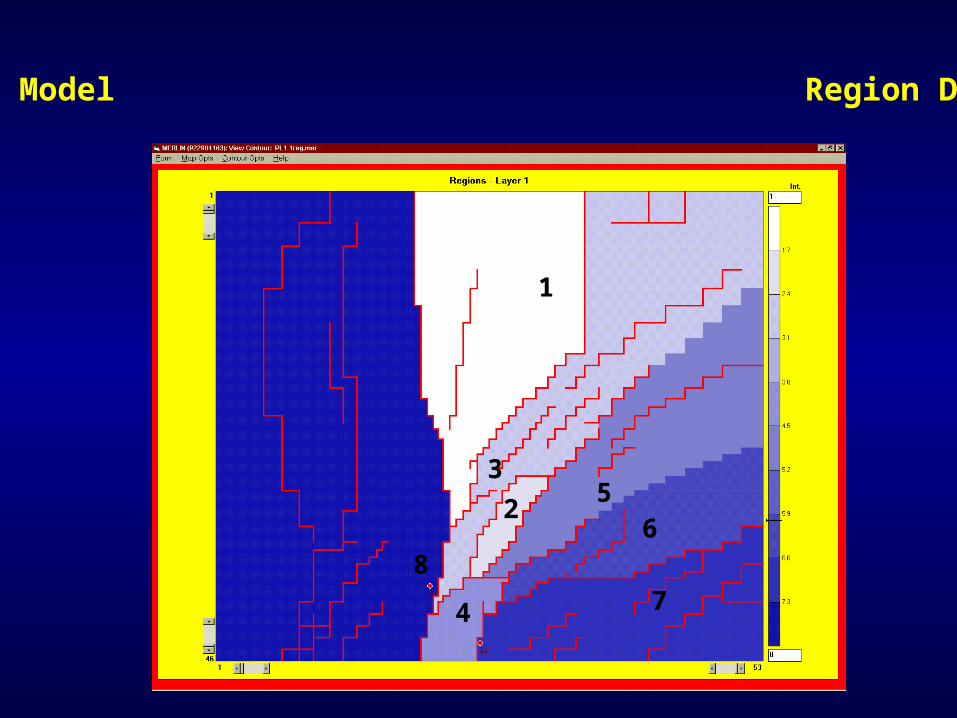
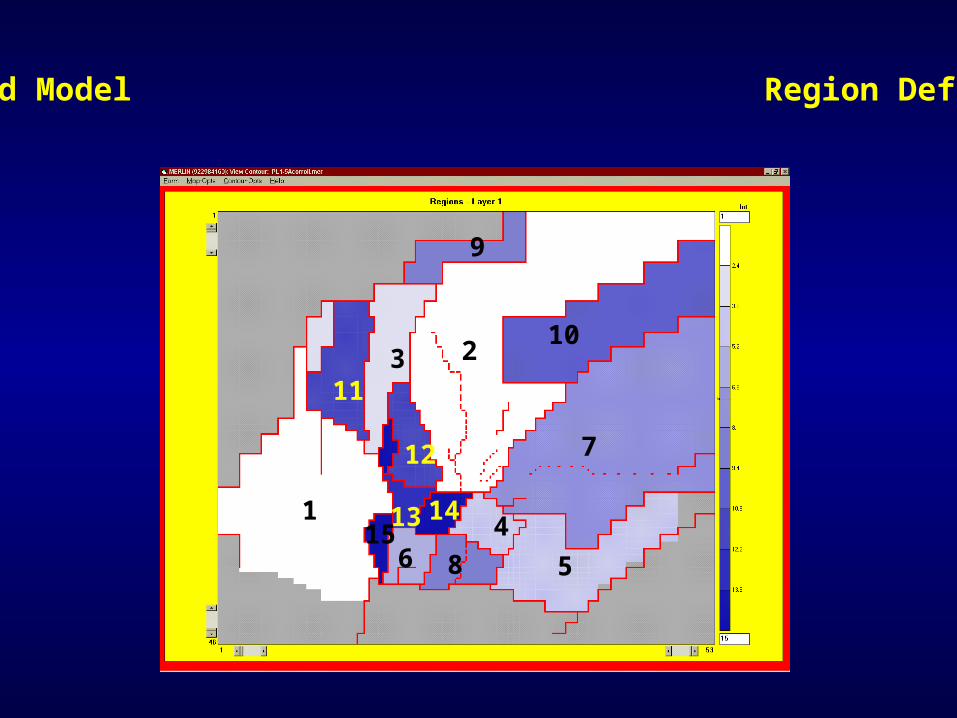
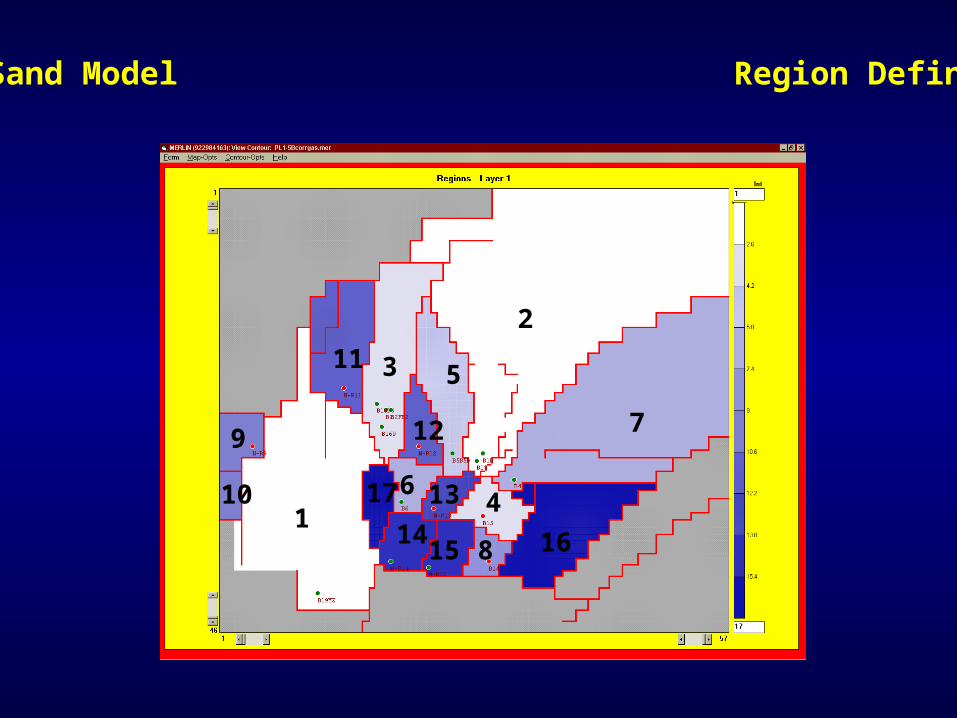
Sand 1 Sand Model Region Definition Map
1
2
3
4
56
78
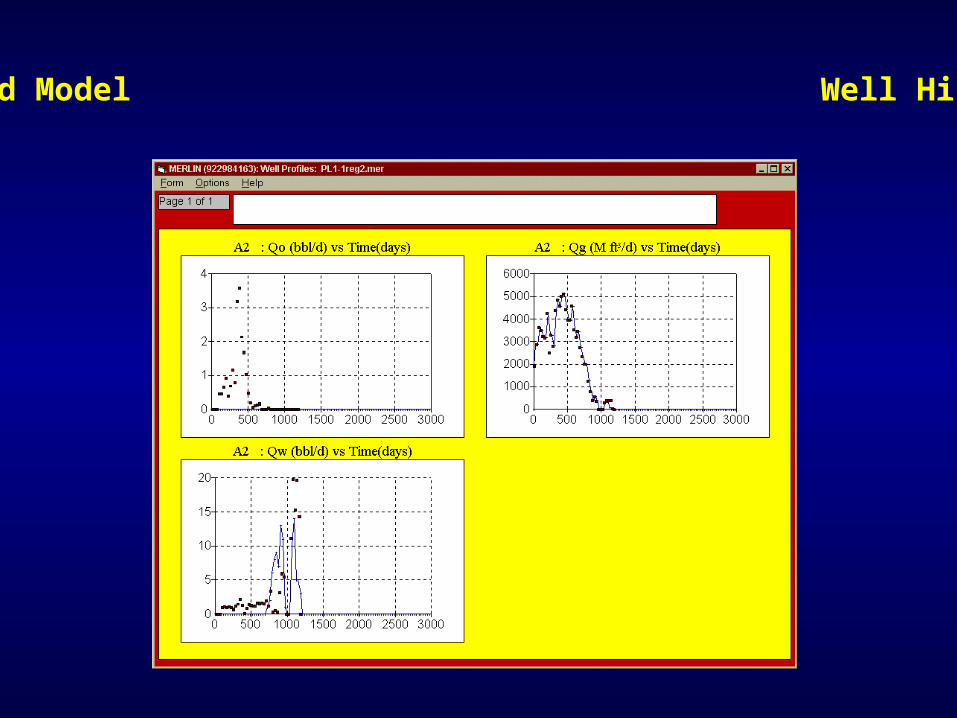
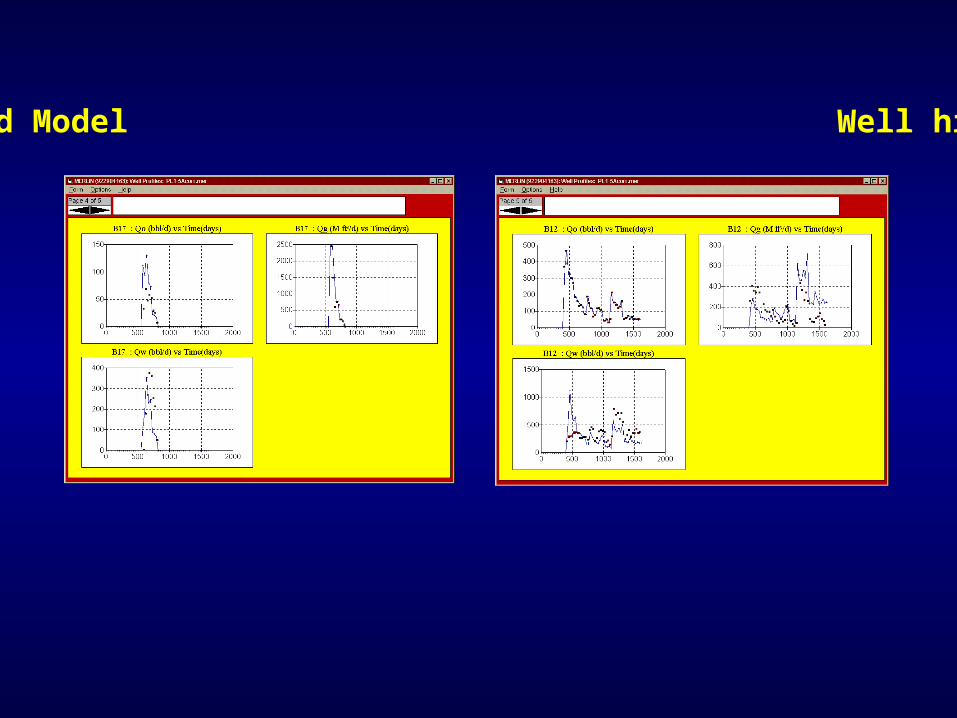
Sand 1 Sand Model Well History Match

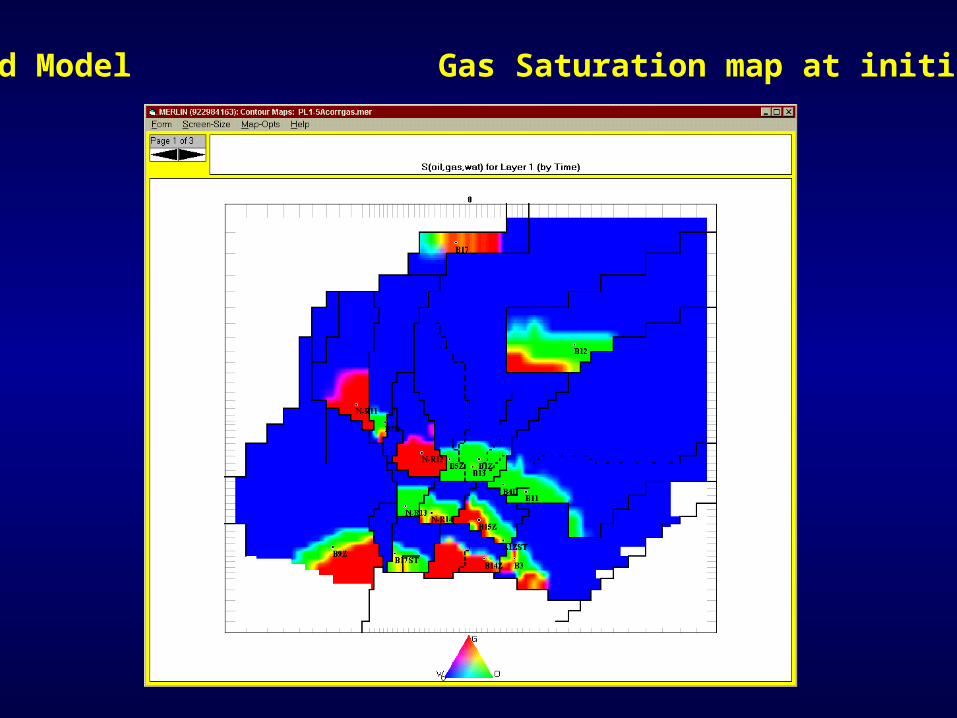
Sand 1 Sand Model Saturation map at initialization

Sand 1 Sand Model Results of modeling
1
2
3
4
5
6
78
Region InitializationData
OOIP,MMstb
OGIP, Bscf Cum. OilProduction,
Mstb
Cum. GasProduction
MMscf
ProductionPeriod,
daysDeveloped
7 Field data 0 3.27 - 2954 -Total
Developed0 3.27
Prospects1 WOC 0.17 0.07 95 49 8813 GWC 0 2.38 0 1834 6385 GWC 0 3.19 0 2573 8816 GWC 0 2.56 0 1974 547
TotalProspects
0.16 8.20 95 6430 -
6.4 BCF reserves in
compartments 3, 5, 6
Sand 2 Sand Model Structure Map
Sand 2 Sand Model Net Thickness Map
Sand 2 Sand Model Region Definition Map
1
23
4
56
7
8
9
10
11
12
13 1415
Sand 2 Sand Model Well history match

Sand 2 Sand Model Oil Saturation map at initialization
Simulation Identified
Leaking Faults
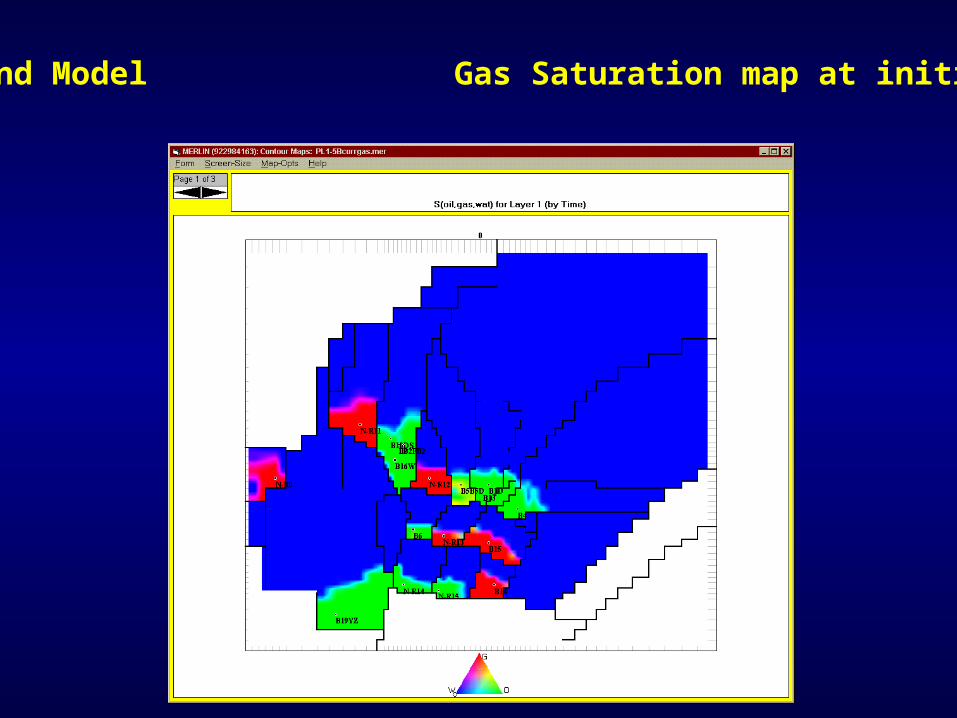
Sand 2 Sand Model Gas Saturation map at initialization

Sand 2 Sand Model Results of modeling
1
23
4
56
7
8
9
1011
12131415
Region InitializationData
OOIP,MMstb
OGIP, Bscf Cum. OilProduction,
Mstb
Cum. GasProduction
MMscf
ProductionPeriod,
daysDeveloped
1 Field data 0.41 1.90 51 124 -2 Field data 4.08 2.50 1194 724 -3 Field data 0.08 0.09 22 40 -4 Field data 1.45 2.44 291 807 -5 Field data 0.51 0.56 171 415 -6 Field data 1.02 0.80 197 198 -7 Field data 2.49 1.49 1119 656 -8 Field data 0.23 2.37 7 1483 -9 Field data 0.18 0.33 16 259 -
10(1-5X) Field data 0.58 0.54 162 265 -Total
Developed11.03 13.02
ProspectsWOC
Initialized11 WOC 0.50 0.30 291 251 79012 WOC 0.78 0.47 234 364 160013 WOC 0.28 0.17 86 130 608
Total WOCinitialized
1.56 0.93 611 745 -
ProspectsGWC
Initialized11 GWC 0 0.75 0 703 18212 GWC 0 1.18 0 1013 243
Total GWCinitialized
0 1.93 0 1716 -
ProspectsInitialized
ByReference
14 Region 13 0.81 0.48 161 296 45614 Region 4 0.48 0.41 92 342 273
3.1 BCF reserves in 4
compartments
Sand 3 Sand Model Structure Map
Sand 3 Sand Model Net Thickness Map
Sand 3 Sand Model Region Definition Map
1
2
3
4
5
6
7
8
9
10
11
12
13
1415 16
17

Sand 3 Sand Model Oil Saturation map at initialization
Sand 3 Sand Model Gas Saturation map at initialization
Sand 3 Sand Model Results of modeling
1
23
4
5
6
7
8
9
10
11
12
1314 15 16
17
Region InitializationData
OOIP,MMstb
OGIP, Bscf Cum. OilProduction,
Mstb
Cum. GasProduction
MMscf
ProductionPeriod,
daysDeveloped
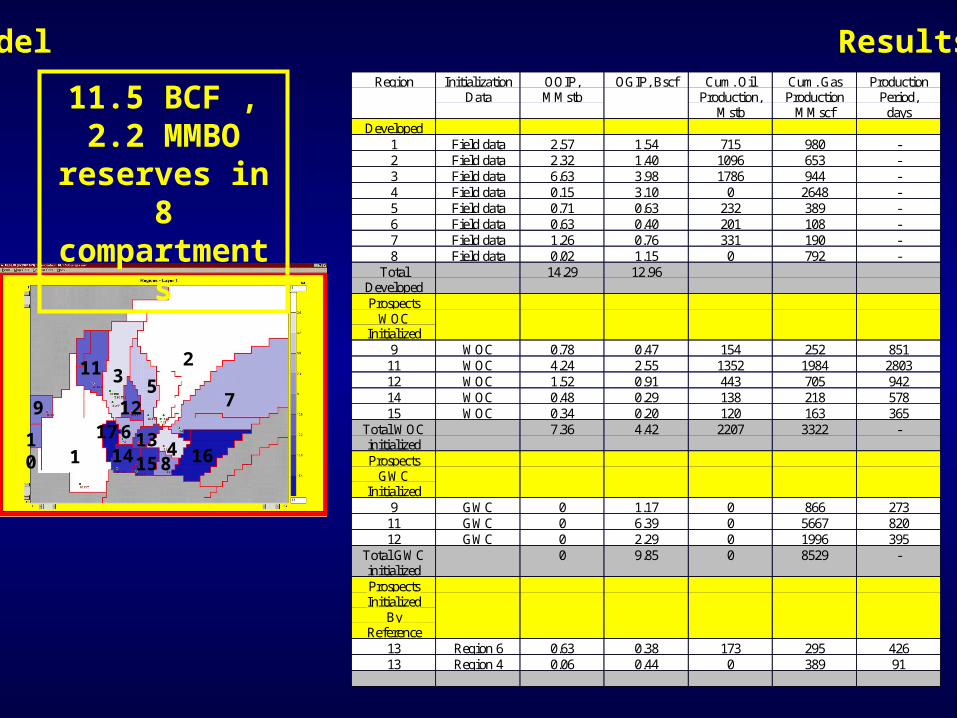
1 Field data 2.57 1.54 715 980 -2 Field data 2.32 1.40 1096 653 -3 Field data 6.63 3.98 1786 944 -4 Field data 0.15 3.10 0 2648 -5 Field data 0.71 0.63 232 389 -6 Field data 0.63 0.40 201 108 -7 Field data 1.26 0.76 331 190 -8 Field data 0.02 1.15 0 792 -
TotalDeveloped
14.29 12.96
ProspectsWOC
Initialized9 WOC 0.78 0.47 154 252 851
11 WOC 4.24 2.55 1352 1984 280312 WOC 1.52 0.91 443 705 94214 WOC 0.48 0.29 138 218 57815 WOC 0.34 0.20 120 163 365
Total WOCinitialized
7.36 4.42 2207 3322 -
ProspectsGWC
Initialized9 GWC 0 1.17 0 866 273
11 GWC 0 6.39 0 5667 82012 GWC 0 2.29 0 1996 395
Total GWCinitialized
0 9.85 0 8529 -
ProspectsInitialized
ByReference
13 Region 6 0.63 0.38 173 295 42613 Region 4 0.06 0.44 0 389 91
11.5 BCF , 2.2 MMBO reserves
in 8 compartments
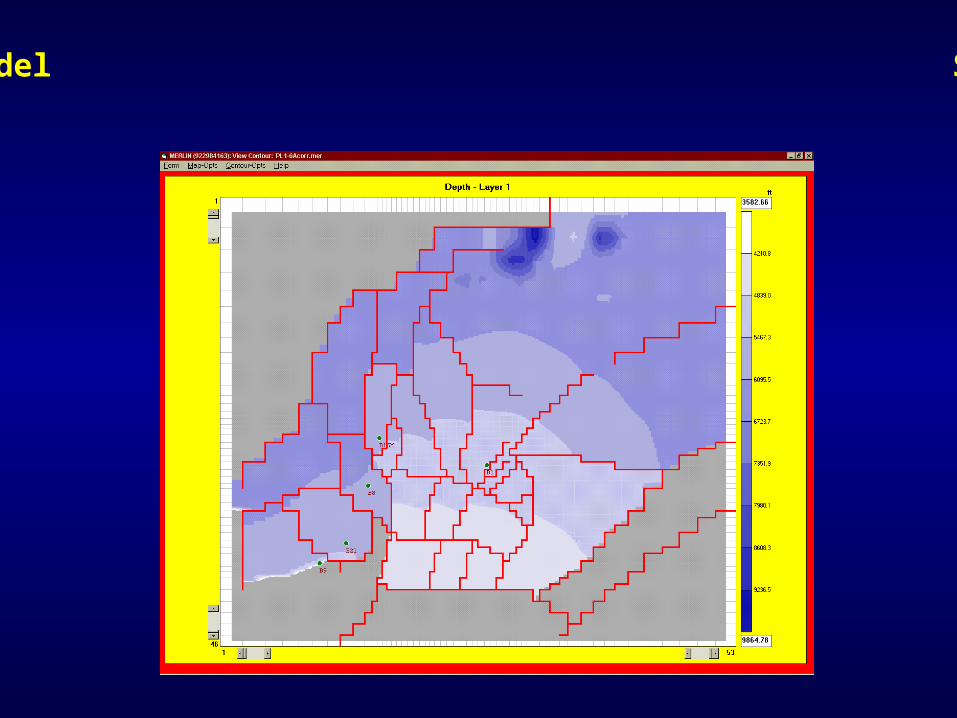
Sand 4 Sand Model Structure Map

Sand 4 Sand Model Net Thickness Map

Sand 4 Sand Model Region Definition Map
1
2
3
4
5
6
7
8
9
1011 12
13 14 15
16
17
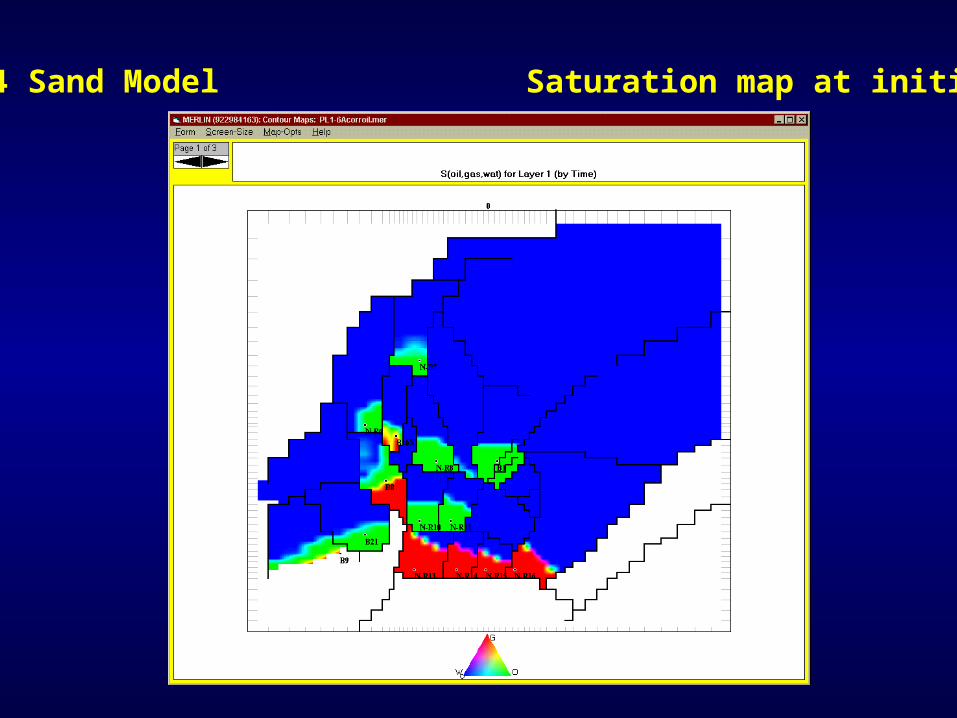
Sand 4 Sand Model Saturation map at initialization

Sand 4 Sand Model Saturation map at initialization

Sand 4 Sand ModelResults of modeling
1
2
3
4
5
6
7
8 9
10 11 12
13 1415
1617
Region InitializationData
OOIP,MMstb
OGIP, Bscf Cum. OilProduction,
Mstb
Cum. GasProduction
MMscf
ProductionPeriod,
daysDeveloped
1 Field data 0.80 1.04 295 562 -2 Field data 2.20 1.98 353 304 -3 Field data 0.09 0.12 10 23 -4 Field data 0.99 1.50 371 857 -5 Field data 2.15 1.94 772 545 -
TotalDeveloped
6.23 6.58
ProspectsWOC
Initialized6 WOC 0.43 0.39 243 345 14297 WOC 0.48 0.43 127 323 6698 WOC 0.27 0.25 98 212 578
10 WOC 0.08 0.07 21 56 12216 WOC 0.07 1.01 0 903 213
Total WOCinitialized
1.33 2.15 489 1839 -
ProspectsGWC
Initialized6 GWC 0 0.76 0 860 2737 GWC 0 0.84 0 817 2438 GWC 0 0.48 0 430 91
Total GWCinitialized
0 2.08 0 2107 -
ProspectsInitialized
ByReference
9 Region 2 0.01 0.01 - - -11 Region 10 0.23 0.21 60 169 33413 Region 16 0.01 0.46 0 414 12214 Region 16 0.01 0.52 0 453 12215 Region 16 0.02 0.64 0 559 122
TotalInitialized
ByReference
0.28 1.84 60 1595 -
3.8 BCF , 1.33 MMBO reserves
in 5 compartments
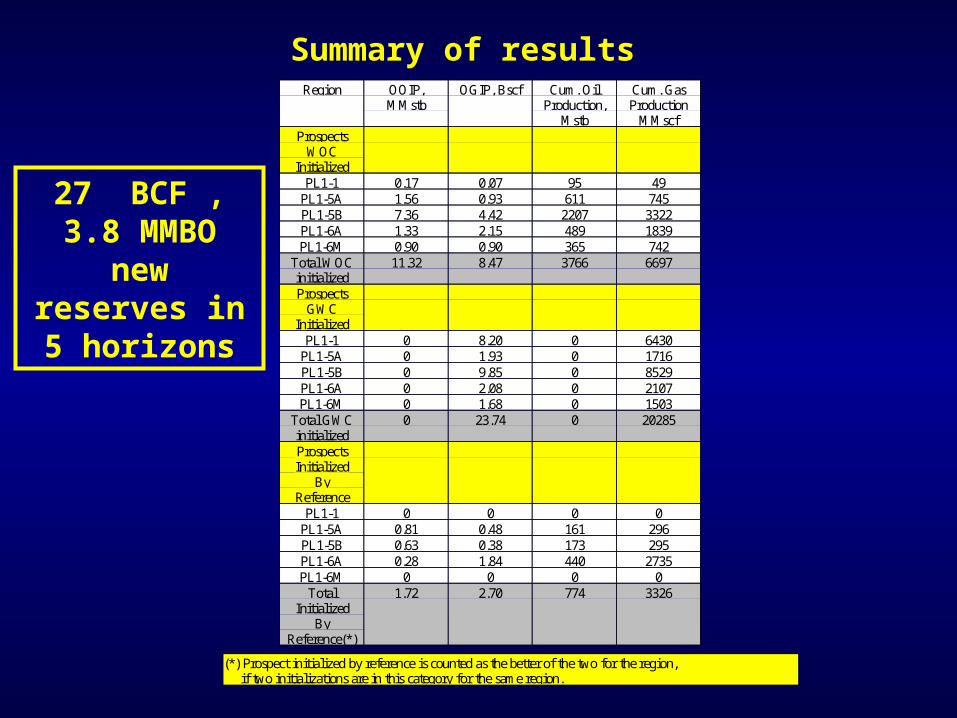
Summary of resultsRegion OOIP,
MMstbOGIP, Bscf Cum. Oil
Production,Mstb
Cum. GasProduction
MMscfProspects
WOCInitialized
PL1-1 0.17 0.07 95 49PL1-5A 1.56 0.93 611 745PL1-5B 7.36 4.42 2207 3322PL1-6A 1.33 2.15 489 1839PL1-6M 0.90 0.90 365 742
Total WOCinitialized
11.32 8.47 3766 6697
ProspectsGWC
InitializedPL1-1 0 8.20 0 6430
PL1-5A 0 1.93 0 1716PL1-5B 0 9.85 0 8529PL1-6A 0 2.08 0 2107PL1-6M 0 1.68 0 1503
Total GWCinitialized
0 23.74 0 20285
ProspectsInitialized
ByReference
PL1-1 0 0 0 0PL1-5A 0.81 0.48 161 296PL1-5B 0.63 0.38 173 295PL1-6A 0.28 1.84 440 2735PL1-6M 0 0 0 0
TotalInitialized
ByReference(*)
1.72 2.70 774 3326
(*) Prospect initialized by reference is counted as the better of the two for the region, if two initializations are in this category for the same region.
27 BCF , 3.8 MMBO new reserves in 5
horizons

Conclusions:
1. Integration of quick simulation and geoscience interpretations allowed significant new reserves to be identified in a mature asset approaching the economic limit
• Neither discipline could have identified all of these reserves
• 64 fault compartments
* history matched multiple times only in weeks
• Maps generated quickly
* days to weeks – not months to years