Embed Size (px)
Citation preview

2.6 billion people do not use improved sanitation
Although 1.3 billion people have gained access • to improved sanitation since 1990, the world is likely to miss the MDG sanitation target by a billion people.
Open defecation rates have decreased from • 25% in 1990 to 17% in 2008. Worldwide, 1.1 billion people practise open defecation, a decline of 167 million since 1990.
With only 45% of the rural population using • improved sanitation, rural areas lag far behind urban areas, where the rate is 76%.
Seven out of ten people without improved • sanitation live in rural areas, but the number of people in urban areas without improved sanitation is increasing because of rapid growth in urban populations.
WITH ONLY FIVE YEARS TO GO UNTIL THE MDG TARGET DATE
884 million people do not use an improved source of drinking-water
The world is on track to meet the MDG • drinking-water target. In developing regions, 84% of the population uses an improved source of drinking-water.
In urban areas the use of improved sources • of drinking-water has been maintained at 96% since 2000, with over 1 billion more people now using such a source than in 1990. However, this increase is barely keeping up with urban population growth.
The number of people living in rural areas who • do not use an improved source of drinking-water is over five times the number living in urban areas.
Worldwide, 37% of people not using an • improved source of drinking-water live in Sub-Saharan Africa.
World Health OrganizationAvenue Appia 201211 Geneva 27, Switzerland
United Nation Children’s Fund3 UN PlazaNew York, NY 10017 USA
For more information, please visit: www.wssinfo.org
Flash_Cover_OMS-JMP-vecto-20100507.indd 1 22/07/10 8:43:10
5 5
ANNEX C GLOBAL AND REGIONAL DRINKING-WATER LADDERS: URBAN AND RURAL
© World Health Organization and UNICEF 2010
All rights reserved. Publications of the World Health Organization can be obtained from WHO Press, World Health Organization, 20 Avenue Appia, 1211 Geneva 27, Switzerland (tel: +41 22 791 3264; fax: +41 22 791 4857; email: [email protected]).
The World Health Organization and UNICEF welcome requests for permission to reproduce or translate their publications — whether for sale or for noncommercial distribution. Applications and enquiries should be addressed to WHO, Office of Publications, at the above address (fax: +41 22 791 4806; email: [email protected]) or to UNICEF, Division of Communication, 3 United Nations Plaza, New York 10017, United States of America (fax: +1 212 303 7985; e-mail: [email protected]).
The designations employed and the presentation of the material in this publication do not imply the expression of any opinion whatsoever on the part of the World Health Organization or UNICEF concerning the legal status of any country, territory, city or area or of its authorities, or concerning the delimitation of its frontiers or boundaries. Dotted lines on maps represent approximate border lines for which there may not yet be full agreement.
The mention of specific companies or of certain manufacturers’ products does not imply that they are endorsed or recommended by the World Health Organization or UNICEF in preference to others of a similar nature that are not mentioned. Errors and omissions excepted, the names of proprietary products are distinguished by initial capital letters.
The World Health Organization and UNICEF do not warrant that the information contained in this publication is complete and correct and shall not be liable for any damages incurred as a result of its use. Printed in France
Design: www.paprika-annecy.com
Photo credit: Cover: iStockphoto/Klaas Lingbeek-van Kranen, WaterAid/Abir Abdullah, WaterAid/Juthika Howlader; pIV: fotolia/TMAX; p3: Rifat Hossain; pp4-5: iStockphoto/Claudia Dewald; p10: iStockphoto/Anantha Vardhan; p11: WaterAid/Abir Abdullah; pp14-15: iStockphoto/Britta Kasholm-Tengve; pp20-21: iStockphoto/Raido Väljamaa; p24: iStockphoto/Gabriela Schaufelberger; pp26-27: iStockphoto/Christoph Achenbach; p29: WHO; p30: iStockphoto/Sean Warren; pp32-33: iStockphoto/Tjui Tjioe; p35: fotolia/Garrett Hoffman; p37: iStockphoto/Bart Coenders; Back cover: Thierry Helsens.
WHO Library Cataloguing-in-Publication Data
Progress on Sanitation and Drinking-water: 2010 Update.
1. Drinking-water supply. 2. Sanitation. 3. Millennium Development Goals. 4. MDG monitoring. 5. Open defecation.
I. WHO/UNICEF Joint Monitoring Programme for Water Supply and Sanitation. ISBN 978 92 4 156395 6 (NLM classification: WA 670)
Figure C Urban and rural proportion of the population using a piped water connection, other improved drinking-water sources or an unimproved source, by MDG region, in 1990 and 2008
4335
4048
17 17
4 5
32
42
6453
71 73
22 21
7
2131
39
45
40
24
80 79
15 17
5 4
2734
37
44
36
22
5551
36 44
9 11
60
72
3117
9 56
102
8796
44
18
14
9
42
73
8 8
5140
4152
37
19
57
65
616
4 43 3
93 93
3022
1517
5561
6 5
84
8691
2213
45
19
33
68
3 2
4335
4048
17 17
4 5
32
42
6453
71 73
22 21
7
2131
39
45
40
24
80 79
15 17
5 4
2734
37
44
36
22
5551
36 44
9 11
60
72
3117
9 56
102
8796
44
18
14
9
42
73
8 8
5140
4152
37
19
57
65
616
4 43 3
93 93
3022
1517
5561
6 5
84
8691
2213
45
19
33
68
3 2
Unimproved Other improved Piped into dwelling, plot or yard
Flash_Cover_OMS-JMP-vecto-20100507.indd 55 22/07/10 8:43:16
contents

contents
IntroductIon........................................................................................................................................2
StatuS and progreSS towardS the mdg target
Billions.without.improved.sanitation.............................................................................................................6Millions.without.improved.sources.of .drinking-water.....................................................................................7Sanitation:.world.off .track.for.MDG.target....................................................................................................8Drinking-water:.world.on.track.for.MDG.target..............................................................................................9Sanitation.ladder:.global.and.regional.trends..............................................................................................12Drinking-water.ladder:.global.and.regional.trends........................................................................................13
urban-rural dISparItIeS
Sanitation:.urban-rural.disparities................................................................................................................16Drinking-water:.urban-rural.disparities.........................................................................................................18
a cloSer look at the ladderS
Open.defecation............................................................................................................................................22Shared.and.unimproved.sanitation.facilities...................................................................................................23Piped.water.on.premises.and.other.improved.sources.of .drinking-water.........................................................25
addItIonal perSpectIveS
Time.to.collect.drinking-water.........................................................................................................................28Collection.of .drinking-water:.gender.disparities...............................................................................................29Socioeconomic.disparities:.Sub-Saharan.Africa................................................................................................30
Jmp method
JMP.method.explained.....................................................................................................................................34
StatIStIcal table
Progress.on.sanitation.and.drinking-water:.country.estimates.for.1990,.2000.and.2008....................................38Progress.on.sanitation.and.drinking-water:.regional.and.global.estimates.for.1990,.2000.and.2008...................52
annexeS
Annex.A..Millennium.Development.Goals:.regional.groupings...............................................................................53Annex.B..Global.and.regional.sanitation.ladders:.urban.and.rural.........................................................................54Annex.C..Global.and.regional.drinking-water.ladders:.urban.and.rural..................................................................55
Progress on sanitation and drinking-Water 2010 uPdate2
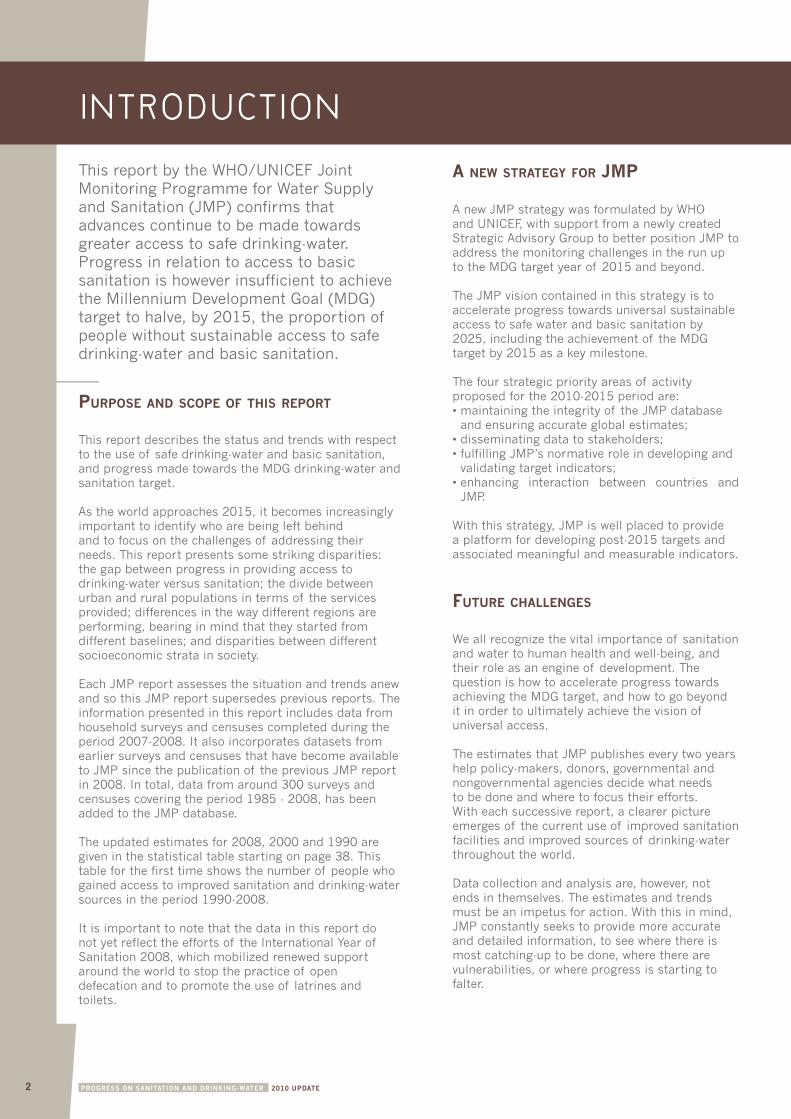
a new Strategy for Jmp
A.new.JMP.strategy.was.formulated.by.WHO.and.UNICEF,.with.support.from.a.newly.created.Strategic.Advisory.Group.to.better.position.JMP.to.address.the.monitoring.challenges.in.the.run.up.to.the.MDG.target.year.of .2015.and.beyond..
The.JMP.vision.contained.in.this.strategy.is.to.accelerate.progress.towards.universal.sustainable.access.to.safe.water.and.basic.sanitation.by.2025,.including.the.achievement.of .the.MDG.target.by.2015.as.a.key.milestone.
The.four.strategic.priority.areas.of .activity.proposed.for.the.2010-2015.period.are:•..maintaining.the.integrity.of .the.JMP.database.and.ensuring.accurate.global.estimates;•..disseminating.data.to.stakeholders;•..fulfilling.JMP’s.normative.role.in.developing.and.validating.target.indicators;•..enhancing. interaction. between. countries. and.JMP.
With.this.strategy,.JMP.is.well.placed.to.provide.a.platform.for.developing.post-2015.targets.and.associated.meaningful.and.measurable.indicators.
future challengeS
We.all.recognize.the.vital.importance.of .sanitation.and.water.to.human.health.and.well-being,.and.their.role.as.an.engine.of .development..The.question.is.how.to.accelerate.progress.towards.achieving.the.MDG.target,.and.how.to.go.beyond.it.in.order.to.ultimately.achieve.the.vision.of .universal.access.
The.estimates.that.JMP.publishes.every.two.years.help.policy-makers,.donors,.governmental.and.nongovernmental.agencies.decide.what.needs.to.be.done.and.where.to.focus.their.efforts..With.each.successive.report,.a.clearer.picture.emerges.of .the.current.use.of .improved.sanitation.facilities.and.improved.sources.of .drinking-water.throughout.the.world..
Data.collection.and.analysis.are,.however,.not.ends.in.themselves..The.estimates.and.trends.must.be.an.impetus.for.action..With.this.in.mind,.JMP.constantly.seeks.to.provide.more.accurate.and.detailed.information,.to.see.where.there.is.most.catching-up.to.be.done,.where.there.are.vulnerabilities,.or.where.progress.is.starting.to.falter.
This.report.by.the.WHO/UNICEF.Joint.Monitoring.Programme.for.Water.Supply.and.Sanitation.(JMP).confirms.that.advances.continue.to.be.made.towards.greater.access.to.safe.drinking-water..Progress.in.relation.to.access.to.basic.sanitation.is.however.insufficient.to.achieve.the.Millennium.Development.Goal.(MDG).target.to.halve,.by.2015,.the.proportion.of .people.without.sustainable.access.to.safe.drinking-water.and.basic.sanitation.
purpoSe and Scope of thIS report
This.report.describes.the.status.and.trends.with.respect.to.the.use.of .safe.drinking-water.and.basic.sanitation,.and.progress.made.towards.the.MDG.drinking-water.and.sanitation.target.
As.the.world.approaches.2015,.it.becomes.increasingly.important.to.identify.who.are.being.left.behind.and.to.focus.on.the.challenges.of .addressing.their.needs..This.report.presents.some.striking.disparities:.the.gap.between.progress.in.providing.access.to.drinking-water.versus.sanitation;.the.divide.between.urban.and.rural.populations.in.terms.of .the.services.provided;.differences.in.the.way.different.regions.are.performing,.bearing.in.mind.that.they.started.from.different.baselines;.and.disparities.between.different.socioeconomic.strata.in.society..
Each.JMP.report.assesses.the.situation.and.trends.anew.and.so.this.JMP.report.supersedes.previous.reports..The.information.presented.in.this.report.includes.data.from.household.surveys.and.censuses.completed.during.the.period.2007-2008..It.also.incorporates.datasets.from.earlier.surveys.and.censuses.that.have.become.available.to.JMP.since.the.publication.of .the.previous.JMP.report.in.2008..In.total,.data.from.around.300.surveys.and.censuses.covering.the.period.1985.-.2008,.has.been.added.to.the.JMP.database.
The.updated.estimates.for.2008,.2000.and.1990.are.given.in.the.statistical.table.starting.on.page.38..This.table.for.the.first.time.shows.the.number.of .people.who.gained.access.to.improved.sanitation.and.drinking-water.sources.in.the.period.1990-2008.
It.is.important.to.note.that.the.data.in.this.report.do.not.yet.reflect.the.efforts.of .the.International.Year.of .Sanitation.2008,.which.mobilized.renewed.support.around.the.world.to.stop.the.practice.of .opendefecation.and.to.promote.the.use.of .latrines.and.toilets.
introduction
3
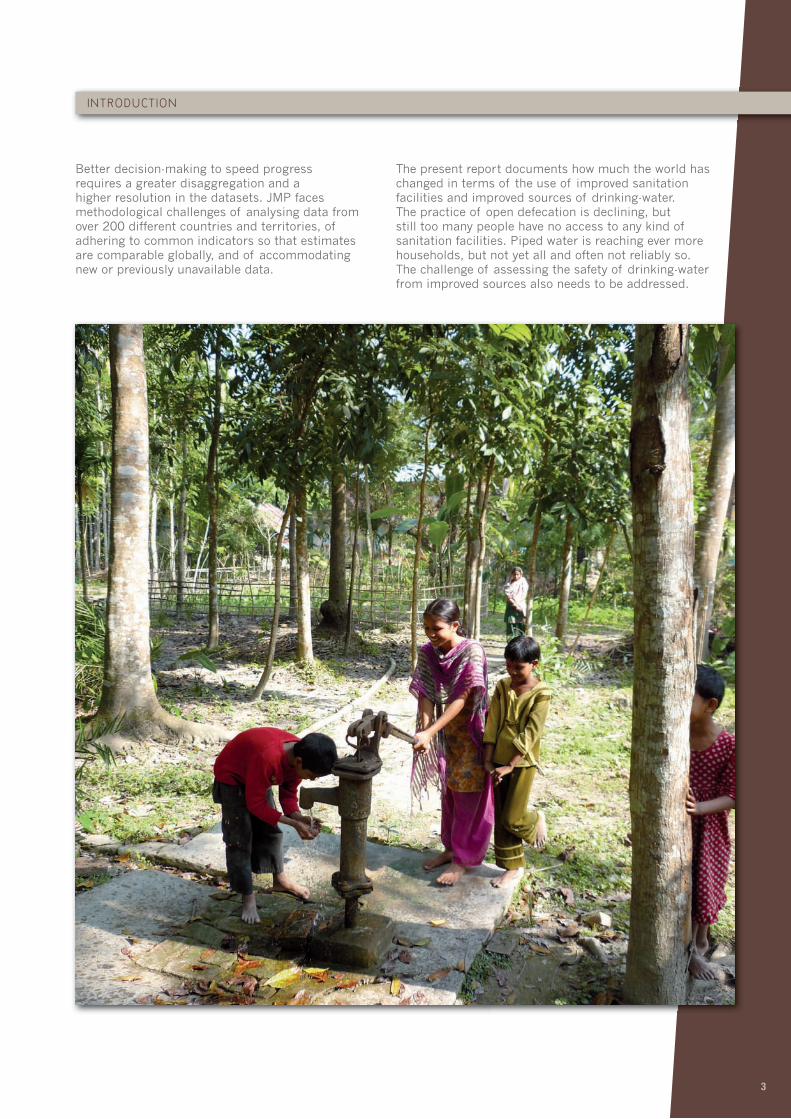
The.present.report.documents.how.much.the.world.has.changed.in.terms.of .the.use.of .improved.sanitation.facilities.and.improved.sources.of .drinking-water..The.practice.of .open.defecation.is.declining,.but.still.too.many.people.have.no.access.to.any.kind.of .sanitation.facilities..Piped.water.is.reaching.ever.more.households,.but.not.yet.all.and.often.not.reliably.so..The.challenge.of .assessing.the.safety.of .drinking-water.from.improved.sources.also.needs.to.be.addressed..
Better.decision-making.to.speed.progress.requires.a.greater.disaggregation.and.a.higher.resolution.in.the.datasets..JMP.faces.methodological.challenges.of .analysing.data.from.over.200.different.countries.and.territories,.of .adhering.to.common.indicators.so.that.estimates.are.comparable.globally,.and.of .accommodating.new.or.previously.unavailable.data.
introductionintroduction