Embed Size (px)
Citation preview
Bulletin of Electrical Engineering and Informatics
Vol. 9, No. 4, August 2020, pp. 1345~1356
ISSN: 2302-9285, DOI: 10.11591/eei.v9i4.1994 1345
Journal homepage: http://beei.org
Wireless sensor network for monitoring irrigation
using XBee Pro S2C
Gita Indah Hapsari, Giva Andriana Mutiara, Luky Rohendi, Aldy Mulia
Department of Applied Sciences, Universitas Telkom, Indonesia
Article Info ABSTRACT
Article history:
Received Aug 28, 2019
Revised Oct 28, 2019
Accepted Dec 10, 2019
Monitoring irrigation is still the problem of agriculture in Indonesia. During
the dry season, the farming fields drought while in the rainy season, floods
happened. Since the farm-fields located far from the urban area, it requires
an automatic tool for monitoring the availability of water that can help
the farmer to monitor the farm-field. Wireless sensor network is an appropriate
technology used to overcome problems related to the monitoring system.
This research is using a water level sensor, pump, Arduino Nano, and XBee
Pro S2C in each monitoring node. The system designed within two modules,
an automation irrigation module and a monitoring module, which is connected
with the communication configuration of master-slaves between Xbee Pro
S2C at each node. The system examined several scenarios in order to test
the performance. Based on the testing result, all the performance parameters
can be adequately delivered to the user and appropriated with the real
condition in the farm field. The delay between nodes only takes 5-10 seconds.
Keywords:
Agriculture
Automation irrigation
Farming fields
Monitoring
Wireless sensor network
This is an open access article under the CC BY-SA license.
Corresponding Author:
Giva Andriana Mutiara,
Department of Applied Sciences,
Universitas Telkom,
Telekomunikasi Street, Bandung, West Java, Indonesia.
Email: [email protected]
1. INTRODUCTION
Agriculture is one of the sectors that has become the Indonesian government’s program to produce an optimal agricultural product. The economic sector based on agriculture can be gained to have significant revenue. Rice is one of the main agricultural in Indonesia and the primary food for most Indonesian people. The Badan Pusat Statistic (BPS) as Central Statistic Agency highlighted that the level of Indonesian imports rice had reached 1.197 million tons or 6.4 trillion rupiahs from January to November. This number increased by 47% compared to last year’s period of 569.62 thousand tons of rice. This phenomenon shows that the need for rice in Indonesia is very high, but farming rice is not able to meet the needs. The obstacle that often occurs is crop failure [1].
One of the factors that can determine the failure or success of the harvest is a well-organized regulation of irrigation. Irrigation is a regulation of the distribution or drainage of the water according to certain systems for rice fields or farmings. Rice fields must get sufficient irrigation. Lack of irrigation in the dry season or excess irrigation in the rainy season can obstruct the quality of rice growth and caused crop failure. To produce good quality crops, the farmers must supervise the irrigation system all day long. If the rice fields drought, the farmers must drain water into their fields. Usually, the water is obtained from a wellspring and flowed into the fields. If the water is flooding, the farmers drain water from their fields to water drainage. All of the water’s monitoring in the rice field is still done manually by the farmers.
Several studies have been developed to improve the irrigation process to become more efficient and effective. The smart irrigation conducted using Raspberry Pi to control the soil moisture only for one
ISSN: 2302-9285
Bulletin of Electr Eng & Inf, Vol. 9, No. 4, August 2020 : 1345 – 1356
1346
node [2]. Another automated for smart irrigation also performed in one node, but the system can control soil moisture, temperature, and humidity [3, 4]. Chikankar et al. conducted an automatic irrigation system to control temperature, soil moisture, and air humidity using ZigBee, but unfortunately, the system is not equipped with a monitoring system [5-7]. The irrigation module monitoring conducted to control the soil, humidity, and temperature and monitoring system for blueberries field using PLC and WSN [8]. Another smart irrigation also conducted using a cloud server and Internet of Things, which is control the humidity, soil moisture, and water level. Still, unfortunately, the research did not mention specifically the type of fields that will be applied by their smart irrigation [9-11]. LoRa (long range) technology applied as the newest technology used in the agriculture field and has been used to control irrigation for the greenhouse case [12-14].
Wiranto is one of the researchers in Indonesia who made a wireless-based irrigation system. In his research, information about the water level is transmitted wirelessly through radio frequency communication and sent the information via SMS to the user [15] or GPRS module [16]. We also have researched irrigation automation. The prototype has a notification feature using SMS. The system not only performed irrigation automation but also provides parameter information of water pH levels and controls the water pump through SMS [1]. In this study, we develop the previous system that approached the real conditions by conducting irrigation automation, which can reach a wide area of rice fields using wireless sensor network (WSN) [17, 18]. This research contributes to propose a method of monitoring irrigation. In the domain of WSN implementation, this research contributes to XBee implementation as a communication channel between nodes. Referring to the research conducted by Sani et al. he used the monitoring and control system on the aeroponic farming system, we also developed this research by providing rice irrigation monitoring features. The wireless communication system uses a WSN that applied to each work-point as a supervised point. This research uses the divided of a wireless communication system between client and server into several work-points as adopted from the research conducted by Simon et al. [19]. The configurations will be used a lot of clients and one server. The integrated application for automatic [20] and IoT-based also implemented to monitoring irrigation [21].
Jia Uddin et al. researched by proposing independent energy resources on irrigation automation systems. The source of energy comes from the sun by using solar cells as an electricity source to control the overall irrigation automation system [22, 23]. This concept will be inserted into this research since the located of the rice field is far from the urban area, and the system should be enough supply energy to operate. Thus, the use of an independent energy source can overcome the problem of difficulty in getting energy and will apply as a replaced battery from previous research conducted by Zulhani et al. [24].
Based on all these literature studies, the developed technology in the irrigation automation system for the rice field has features as follows; 1) Automation of irrigation, which has a function by regulating the activation of filling and emptying pumps in paddy fields based on the water level, wirelessly. 2) Monitoring, the monitoring system performs the supervised water level parameters in the rice field area. This supervised monitoring gives information about the filling or emptying water on the rice fields, the availability of water at the water spring, and also the information of the energy sources. 3) Energy availability, the function of an independent energy source using solar energy.
2. RESEARCH METHOD AND PROPOSED SYSTEM
The research method for this study is using the prototype model. Begin with determining
the requirement of the system; the number of the module consist of hardware and software can be decided to
construct a prototype. Those modules then integrated into a monitoring system. After building the prototype,
the system will be examined in several scenarios to measure the toughness of the system and then to draw
the conclusion from the result and analysis.
The design of the automation system and the monitoring of rice field irrigation consists of two
modules, the first module is a rice field automation module as automation irrigation, and the second module
is the rice field monitoring module. Automation irrigation field module is a module that functions to detect
water levels in rice fields, activate the pump for setting rice field irrigation based on water-level, load
the power supply through the solar cell and send data of water level, also charging status of power supply to
the system. While the rice-field module monitoring is a module that functions to receive all parameters data
sent by the rice field automation module, including water level data, charging status, and power supply,
all these parameters are displayed on a desktop-based monitoring application.
2.1. Rice field automation module
Rice Field Automation Module is the irrigation module designed which has three work-points in
the system. The work-points are sensing-point, discharge-point, and load-point. The sensing-point is a point
that detects water levels in rice fields. This sensing point consists of Arduino Nano components, XBee-PRO
S2C, water sensor, and power supply. The discharge point is the place where the point at irrigation water
disposal is carried out when the water in the field exceeds the normal level. This discharge-point consists

Bulletin of Electr Eng & Inf ISSN: 2302-9285
Wireless sensor network for monitoring irrigation using XBee Pro S2C (Gita Indah Hapsari)
1347
of Arduino Nano, XBee Pro S2C, current sensor, voltage sensor, and power. Meanwhile, the load-point
is the part that performs loading water to fill the paddy fields by activating the pump. This section consists
of Arduino nano, XBee Pro S2C, water sensor, and power supply.
Figure 1 shows the design communication system utilizes XBee S2 Pro as a communication module
between work-points. The water sensor uses to detect water levels and activate a loading or emptying pump.
The electricity source is used comes from the solar cell, which is stored in the battery and converted into AC
using a 500-watt inverter. In Figure 2, the position of each work-point is showing. The load-point is in
a water spring that functions to drain water from the water spring to the rice fields, whereas the discharge-point
is installed in the rice field, which is responsible for removing water from the rice fields. The sensing-point is
in the middle of the rice field, which has functions to detect the rice field water level.
Figure 1. Design communication system
Figure 2. Design configuration of work-point
The configuration of the XBee communication module at each work-point is listing in Table 1. In this
table, the configuration is explained and described. Figure 3 shows the configuration of the communication
points between sensing-point, load-point, and discharge points. The communication system configuration in
this research formed a simple mesh. The discharge-point acts as a coordinator who manages data
communication between sensing-points, load-point, and monitoring. The sensing-point will transmit
ISSN: 2302-9285
Bulletin of Electr Eng & Inf, Vol. 9, No. 4, August 2020 : 1345 – 1356
1348
the water status to the discharge-point forwarding the data to the load-point. The data received will be
processed later to determine the activation of the water pump.
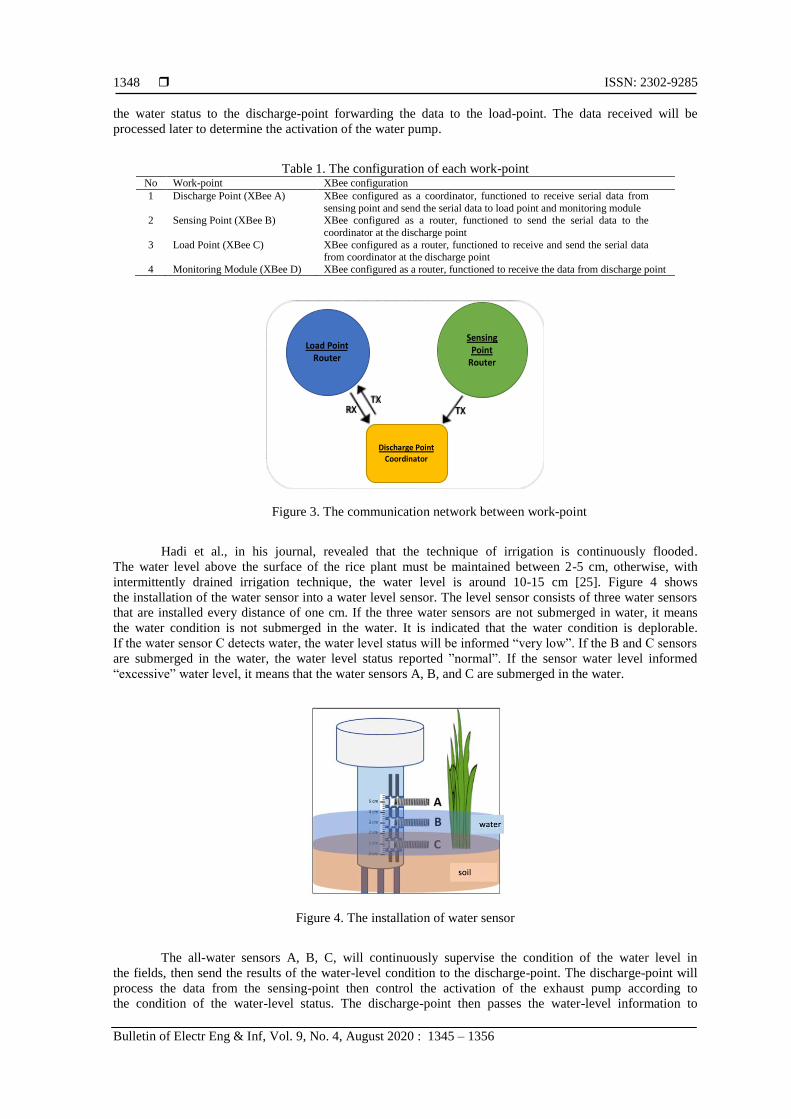
Table 1. The configuration of each work-point No Work-point XBee configuration
1 Discharge Point (XBee A) XBee configured as a coordinator, functioned to receive serial data from
sensing point and send the serial data to load point and monitoring module 2 Sensing Point (XBee B) XBee configured as a router, functioned to send the serial data to the
coordinator at the discharge point
3 Load Point (XBee C) XBee configured as a router, functioned to receive and send the serial data from coordinator at the discharge point
4 Monitoring Module (XBee D) XBee configured as a router, functioned to receive the data from discharge point
Figure 3. The communication network between work-point
Hadi et al., in his journal, revealed that the technique of irrigation is continuously flooded.
The water level above the surface of the rice plant must be maintained between 2-5 cm, otherwise, with
intermittently drained irrigation technique, the water level is around 10-15 cm [25]. Figure 4 shows
the installation of the water sensor into a water level sensor. The level sensor consists of three water sensors
that are installed every distance of one cm. If the three water sensors are not submerged in water, it means
the water condition is not submerged in the water. It is indicated that the water condition is deplorable.
If the water sensor C detects water, the water level status will be informed “very low”. If the B and C sensors
are submerged in the water, the water level status reported ”normal”. If the sensor water level informed
“excessive” water level, it means that the water sensors A, B, and C are submerged in the water.
Figure 4. The installation of water sensor
The all-water sensors A, B, C, will continuously supervise the condition of the water level in
the fields, then send the results of the water-level condition to the discharge-point. The discharge-point will
process the data from the sensing-point then control the activation of the exhaust pump according to
the condition of the water-level status. The discharge-point then passes the water-level information to
Load PointRouter
Sensing Point
Router
Discharge Point
Coordinator
TXTX
RX

Bulletin of Electr Eng & Inf ISSN: 2302-9285
Wireless sensor network for monitoring irrigation using XBee Pro S2C (Gita Indah Hapsari)
1349
the load-point. Based on the status of the water-level, the control of the activation of the charging pump
is arranged. At the load-point, there is also a level-sensor, which also consists of three water-sensors.
The function of the level-sensor at the load-point is to find out the availability of water at the water spring
source. At the load-point, there is also a current-sensor that is used to detect the damage of the pump.
The load-point will sends the information to the monitoring system.
The prototype of the sensing-point, discharge-point, and load-point prototype is showing in
Figure 5 In the sensing-point prototype, the components stored in a container in the form of pipes measuring
4 inches in diameter with the covering holes on the top and bottom of the pipe. Three water-sensors installed
on a supporting pipe measuring 3 inches in diameter. The main components of this circuit are Arduino Nano,
current-sensors, and water-sensors. The discharge-point function is to control the exhaust pump based on
water-level condition data in the paddy fields. Besides that, the discharge-point also has the functions as
the coordinator in charge of managing the communication between supervised points. At the discharge-point,
there is a voltage sensor to monitor the voltage on the battery, while the current-sensor is used to ensure
the discharge pump works when the relay condition is connected.
The components at the discharge points are Arduino Nano, Xbee-PRO S2C, relay module, power
bank, current-sensors, voltage-sensors, and water pump. The cantilever is a crutch that made of a pipe to hold
the discharge-point prototype. The prototype of the load-point is the part that placed at the water spring
source. This load-point has functions to control the charging pump based on water-level data sent by the
discharge-point. At this point, there is installed one water-sensor that functions to detect the availability
of a water source, and a current-sensor to make sure the pump works when the active relay.
Then, the information will be sent to the discharge-point. The main components of this circuit are Arduino
Nano, channel relay module, current-sensor, and water-sensor.
(a) (b) (c)
Figure 5. The installation of the prototype at each point, (a) Sensing-point,
(b) Discharge-point, (c) Load-point
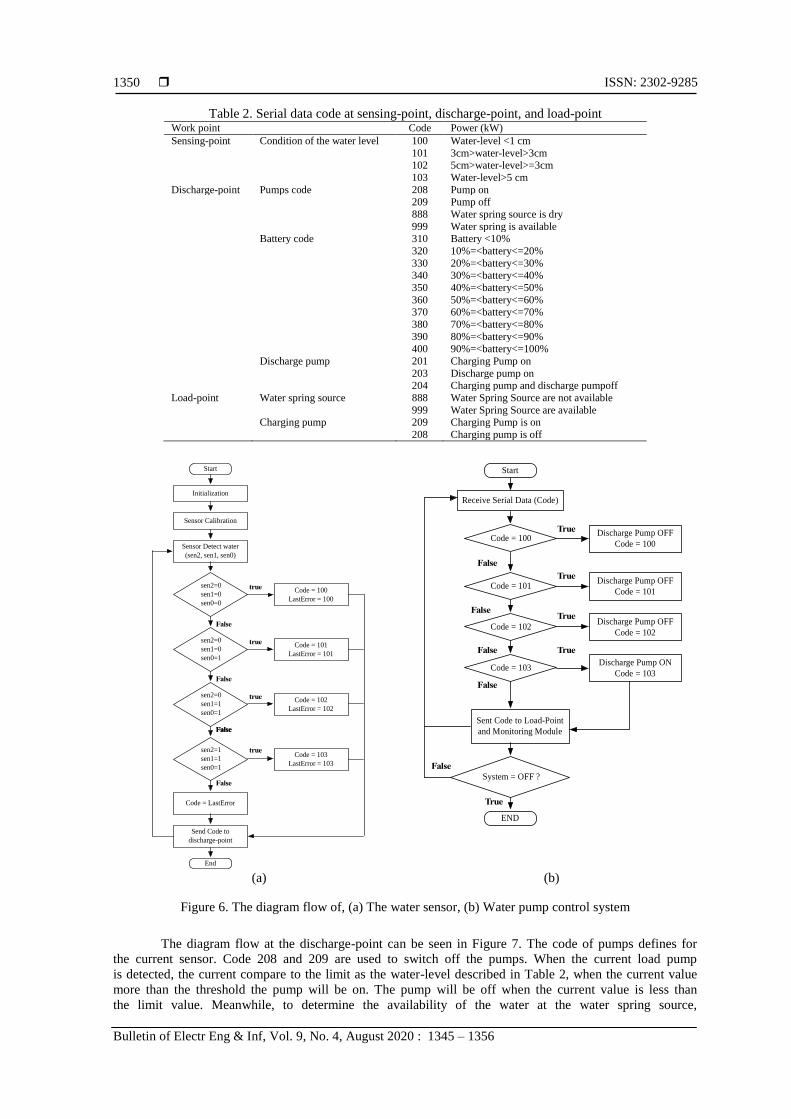
Table 2 describes the code of the sensing-point, discharge-point, and load point based on the water-level.
This code represents the condition of the water-level with a measurement of one until five cm of the water-level
to the discharge-point. The serial data code then applied in the diagram flow shows in Figure 6. Meanwhile,
different from the serial data code at the sensing point, the serial code at the discharge-point is more
complicated. This is because there are many things that require to be controlled at the discharge-point such as
water-level, pumps, water spring sources, and the availability of the battery. The serial data code at the load-point
determined the information about the availability of the water spring source and also defined the charging
pump, whether it is on or off.
Figure 6. shows the flow diagram of the sensing-point based on the code in Table 2. As we can see
in the flowchart, the system checks the condition of each water-sensor and encodes it. The code that
represents the water-level condition then sent to the discharge-point. The three water sensor is defined as
sen0, sen1, and sen2. The use of the combined code shown in diagram flow of the water pump control system
shown the flowchart of the water pump control system. At the discharge-point, there is a water pump that
is controlled based on the code of the water-level in Table 2 at sensing-point.
Power Bank
4 inches pipe
Xbee Pro S2C
Arduino Nano
3 inches Pipe
Water sensor
Cantilever
Power Bank
4 inches pipe
Xbee Pro S2C
Arduino Nano
3 inches Pipe
Voltage sensor
Cantilever
Current sensor
Relay Module
Pump
Pump Cantilever30 cm
20 cm
Power Bank
4 inches pipe
Xbee Pro S2C
Arduino Nano
3 inches Pipe
Water sensor
Cantilever
Current sensor
Relay Module
Pump
Pump Cantilever30 cm
Power Bank
4 inches pipe
Xbee Pro S2C
Arduino Nano
3 inches Pipe
Water sensor
Cantilever
Power Bank
4 inches pipe
Xbee Pro S2C
Arduino Nano
3 inches Pipe
Voltage sensor
Cantilever
Current sensor
Relay Module
Pump
Pump Cantilever30 cm
20 cm
Power Bank
4 inches pipe
Xbee Pro S2C
Arduino Nano
3 inches Pipe
Water sensor
Cantilever
Current sensor
Relay Module
Pump
Pump Cantilever30 cm
ISSN: 2302-9285
Bulletin of Electr Eng & Inf, Vol. 9, No. 4, August 2020 : 1345 – 1356
1350
Table 2. Serial data code at sensing-point, discharge-point, and load-point Work point Code Power (kW)
Sensing-point Condition of the water level 100 Water-level <1 cm
101 3cm>water-level>3cm 102 5cm>water-level>=3cm
103 Water-level>5 cm
Discharge-point Pumps code 208 Pump on 209 Pump off
888 Water spring source is dry
999 Water spring is available Battery code 310 Battery <10%
320 10%=<battery<=20%
330 20%=<battery<=30% 340 30%=<battery<=40%
350 40%=<battery<=50%
360 50%=<battery<=60% 370 60%=<battery<=70%
380 70%=<battery<=80%
390 80%=<battery<=90%
400 90%=<battery<=100%
Discharge pump 201 Charging Pump on
203 Discharge pump on 204 Charging pump and discharge pumpoff
Load-point Water spring source 888 Water Spring Source are not available
999 Water Spring Source are available Charging pump 209 Charging Pump is on
208 Charging pump is off
(a) (b)
Figure 6. The diagram flow of, (a) The water sensor, (b) Water pump control system
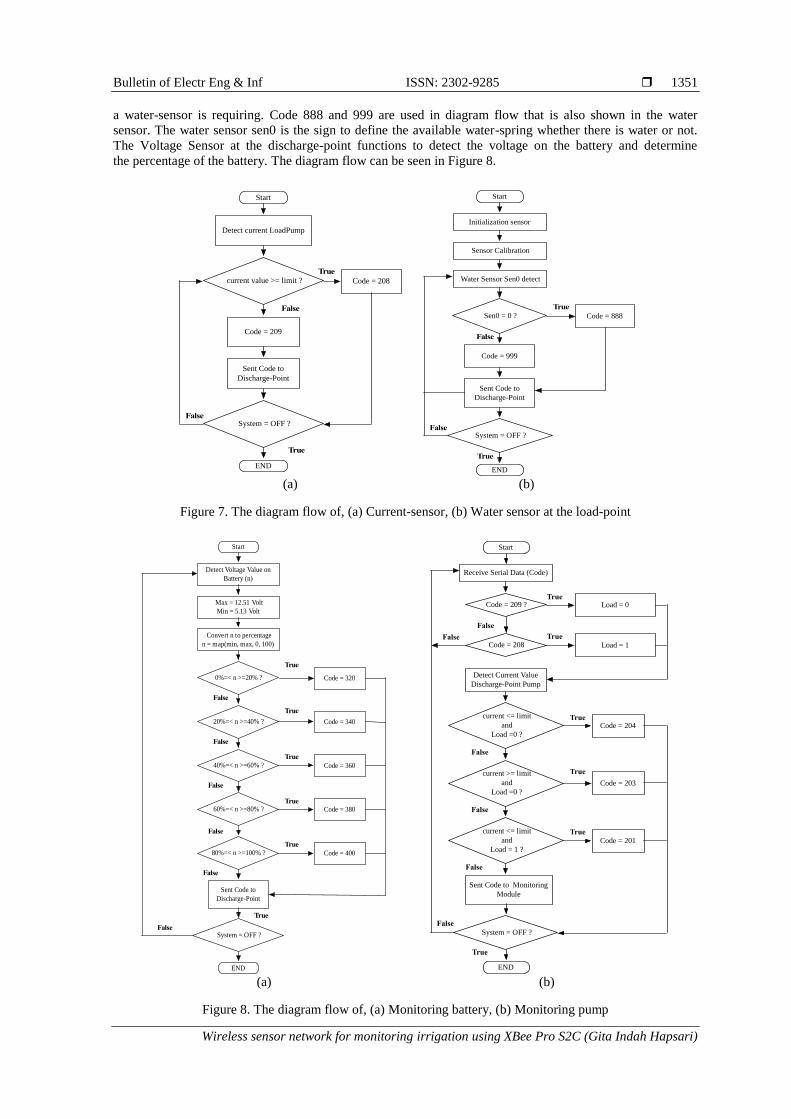
The diagram flow at the discharge-point can be seen in Figure 7. The code of pumps defines for
the current sensor. Code 208 and 209 are used to switch off the pumps. When the current load pump
is detected, the current compare to the limit as the water-level described in Table 2, when the current value
more than the threshold the pump will be on. The pump will be off when the current value is less than
the limit value. Meanwhile, to determine the availability of the water at the water spring source,
Start
Receive Serial Data (Code)
False
Discharge Pump OFF
Code = 100
Sent Code to Load-Point
and Monitoring Module
True
System = OFF ?
END
True
False
Code = 100
Code = 101
Code = 102
Code = 103
False
False
False
True
True
True
Discharge Pump OFF
Code = 101
Discharge Pump OFF
Code = 102
Discharge Pump ON
Code = 103
Start
Initialization
Sensor Calibration
Sensor Detect water
(sen2, sen1, sen0)
sen2=0
sen1=0
sen0=0
sen2=0
sen1=0
sen0=1
sen2=0
sen1=1
sen0=1
sen2=1
sen1=1
sen0=1
Code = LastError
Send Code to
discharge-point
Code = 100
LastError = 100
Code = 101
LastError = 101
Code = 102
LastError = 102
Code = 103
LastError = 103
End
true
true
true
true
False
False
False
False
False
Start
Receive Serial Data (Code)
False
Discharge Pump OFF
Code = 100
Sent Code to Load-Point
and Monitoring Module
True
System = OFF ?
END
True
False
Code = 100
Code = 101
Code = 102
Code = 103
False
False
False
True
True
True
Discharge Pump OFF
Code = 101
Discharge Pump OFF
Code = 102
Discharge Pump ON
Code = 103
Start
Initialization
Sensor Calibration
Sensor Detect water
(sen2, sen1, sen0)
sen2=0
sen1=0
sen0=0
sen2=0
sen1=0
sen0=1
sen2=0
sen1=1
sen0=1
sen2=1
sen1=1
sen0=1
Code = LastError
Send Code to
discharge-point
Code = 100
LastError = 100
Code = 101
LastError = 101
Code = 102
LastError = 102
Code = 103
LastError = 103
End
true
true
true
true
False
False
False
False
False
Bulletin of Electr Eng & Inf ISSN: 2302-9285
Wireless sensor network for monitoring irrigation using XBee Pro S2C (Gita Indah Hapsari)
1351
a water-sensor is requiring. Code 888 and 999 are used in diagram flow that is also shown in the water
sensor. The water sensor sen0 is the sign to define the available water-spring whether there is water or not.
The Voltage Sensor at the discharge-point functions to detect the voltage on the battery and determine
the percentage of the battery. The diagram flow can be seen in Figure 8.
(a) (b)
Figure 7. The diagram flow of, (a) Current-sensor, (b) Water sensor at the load-point
(a) (b)
Figure 8. The diagram flow of, (a) Monitoring battery, (b) Monitoring pump
Start
Detect current LoadPump
current value >= limit ?
False
Code = 209
Sent Code to
Discharge-Point
True
Code = 208
System = OFF ?
END
False
True
Start
Initialization sensor
Sen0 = 0 ?
False
Code = 999
Sent Code to
Discharge-Point
True
Code = 888
System = OFF ?
END
Sensor Calibration
Water Sensor Sen0 detect
True
False
Start
Detect Voltage Value on
Battery (n)
0%=< n >=20% ?
False
Sent Code to
Discharge-Point
True
Code = 320
System = OFF ?
END
Max = 12.51 Volt
Min = 5.13 Volt
Convert n to percentage
n = map(min, max, 0, 100)
False
40%=< n >=60% ?
20%=< n >=40% ?
60%=< n >=80% ?
80%=< n >=100% ?
True
False
False
False
False
Code = 340
Code = 360
Code = 380
Code = 400
True
True
True
True
Start
Receive Serial Data (Code)
False
Load = 0
Sent Code to Monitoring
Module
True
System = OFF ?
END
True
False
Kode = 209 ?
Kode = 208
current <= limit
and
Load =0 ?
False
False
False
True
True
True
Load = 1
Code = 204
Detect Current Value
Discharge-Point Pump
current >= limit
and
Load =0 ?
current <= limit
and
Load = 1 ?
False
Code = 203
Code = 201True
Start
Receive Serial Data (Code)
False
Load = 0
Sent Code to Monitoring
Module
True
System = OFF ?
END
True
False
Code = 209 ?
Code = 208
current <= limit
and
Load =0 ?
False
False
False
True
True
True
Load = 1
Code = 204
Detect Current Value
Discharge-Point Pump
current >= limit
and
Load =0 ?
current <= limit
and
Load = 1 ?
False
Code = 203
Code = 201True

ISSN: 2302-9285
Bulletin of Electr Eng & Inf, Vol. 9, No. 4, August 2020 : 1345 – 1356
1352
The battery is set on 12.51 as the maximum value and 5.13 as the minimum value. Those values
then will be converted in the form of the percentage. Then, the value will be divided into ten conditions
which are represented the level of capacity of the battery from 10% until 100% as shown in Table 2.
In Figure 8 the flowchart is defined into five levels of capacity of the battery cell with raised 20% per level.
At the discharge-point, there is a current-sensor that functions to detect the pump, whether it is active or not.
If the pump is not operating due to damage, it can be known through the current detected value,
and the information can be sent into the monitoring point. When the serial data determined code equal with
209 or 208, the current value will be compared with the limit that has been defined in Table 2. When the load
is equal to zero, whether the current limit is defined more than or less than the limit, it is considered that
the system is doing the charging and discharging the water. When the current value is less than the limit
value, and the load is equal to one, it means that all the pump is off.
2.2. Paddy field monitoring module
Figure 9 shows the relationship between the automation and monitoring module. The monitoring
module consists of XBee, Arduino Nano, Buzzer, and Desktop PC. The information conveyed in this
monitoring module includes water-level information, pump activation, loading, and discharging status,
the availability of resources, and the availability of the water sources. All the information sent from
the automation module at the discharge-point into the monitoring module.
The monitoring system uses a desktop application. With this application, farmers can monitor the rice
field irrigation using personal computer, remotely. The working system based on monitoring is in Figure 10
where the received code of the water level will be checked and translated in a certain condition and then
displayed on the application. The monitoring system displays monitoring water level, monitoring pump, and also
energy. The monitoring system also can supervise the availability of water spring and control the water sensor.
Figure 9. The topology of monitoring module system
.
Figure 10. The diagram flow of monitoring module

Bulletin of Electr Eng & Inf ISSN: 2302-9285
Wireless sensor network for monitoring irrigation using XBee Pro S2C (Gita Indah Hapsari)
1353
3. TESTING, RESULTS, AND ANALYSIS
There are several test scenarios applied to test the system performance, the energy of battery life
testing, the irrigation system testing, and the monitoring system testing.
3.1. Energy of battery life testing
This testing purpose to examine the life of the battery that used to performed the system running in
the field. This system uses two batteries of 12 Volts with 100Ah of each. The batteries are connected in
a parallel way to the 500 W inverter. The battery is measured in full voltage of 12.13 V. The testing is
conducted by measuring the electric current of the water pump, which is connecting in the series way
between the pump cable and the current sensor, as shown in Figure 11. The result describes in Table 3.
The battery testing is carried out about 144 minutes and stated that the longer the battery voltage decreases
with the load that comes from the pump and laptop charger. The test results can be graphically illustrated in
Figure 12. In Figure 12 shown a graph of battery life with a load of one water pump 38 Watts. The battery is
able to activate it for 5 hours 52 minutes.
Figure 11. Testing battery scenarios
Table 3. Testing battery
Time Minutes V (Volt) I (mA)
12.17 0 11.53 41.84
13.38 81 11.16 41.84
13.54 97 10.95 41.84 14.41 144 10.62 41.84
Figure 12. Graph of battery life
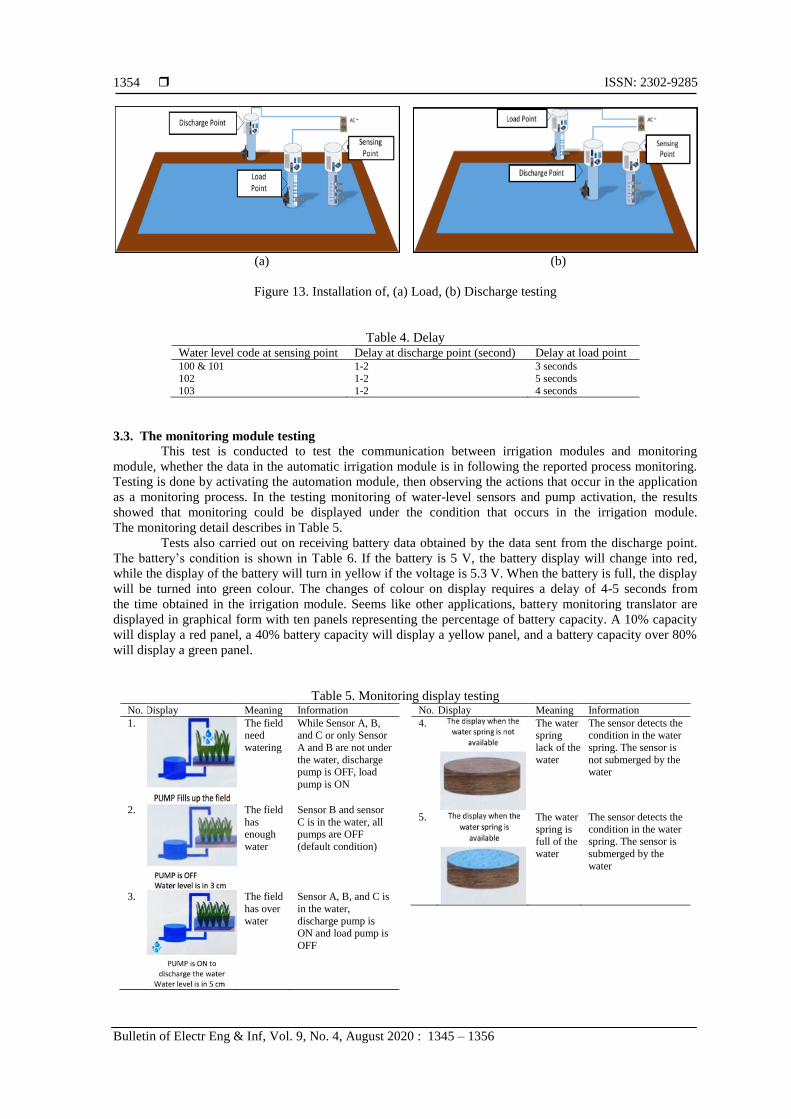
3.2. Irrigation testing system
This testing aims to examine the irrigation system based on the water level from the sensing point to
the discharge point and load point to activate the pump. The test was carried out in the ponds field, measuring
9x8 m with the water level between 10 cm until 15 cm. The testing in the area is carried out alternately
between the discharge point and load point. The test result shows the activation of the pump at the discharge
point, and load point works properly with the detection of the designed water level. If the water soaks only
the fields and is detected only up to sensor C, the pump will be active until the water reached sensor B.
However, if the water reaches up to sensor A (excess water) it will activate the drain pump. The detail test
result is showing in Figure 13.
When the system is working, there is a delay that occurs in the communication process between
the input that comes from the sensing point and the output in the load point and discharge point. Delay occurs
when the XBee coordinator acts as the sender and router as the recipient. In a one-way test between
the coordinator and router, the delay is around 4-5 seconds. Otherwise, if the coordinator acts as a receiver
(Rx) and router (Rx), the delay obtained is less than one second. The resulting test based on delay can be seen
in Table 4.
ISSN: 2302-9285
Bulletin of Electr Eng & Inf, Vol. 9, No. 4, August 2020 : 1345 – 1356
1354
(a) (b)
Figure 13. Installation of, (a) Load, (b) Discharge testing
Table 4. Delay Water level code at sensing point Delay at discharge point (second) Delay at load point 100 & 101 1-2 3 seconds
102 1-2 5 seconds
103 1-2 4 seconds
3.3. The monitoring module testing This test is conducted to test the communication between irrigation modules and monitoring
module, whether the data in the automatic irrigation module is in following the reported process monitoring.
Testing is done by activating the automation module, then observing the actions that occur in the application
as a monitoring process. In the testing monitoring of water-level sensors and pump activation, the results
showed that monitoring could be displayed under the condition that occurs in the irrigation module.
The monitoring detail describes in Table 5.
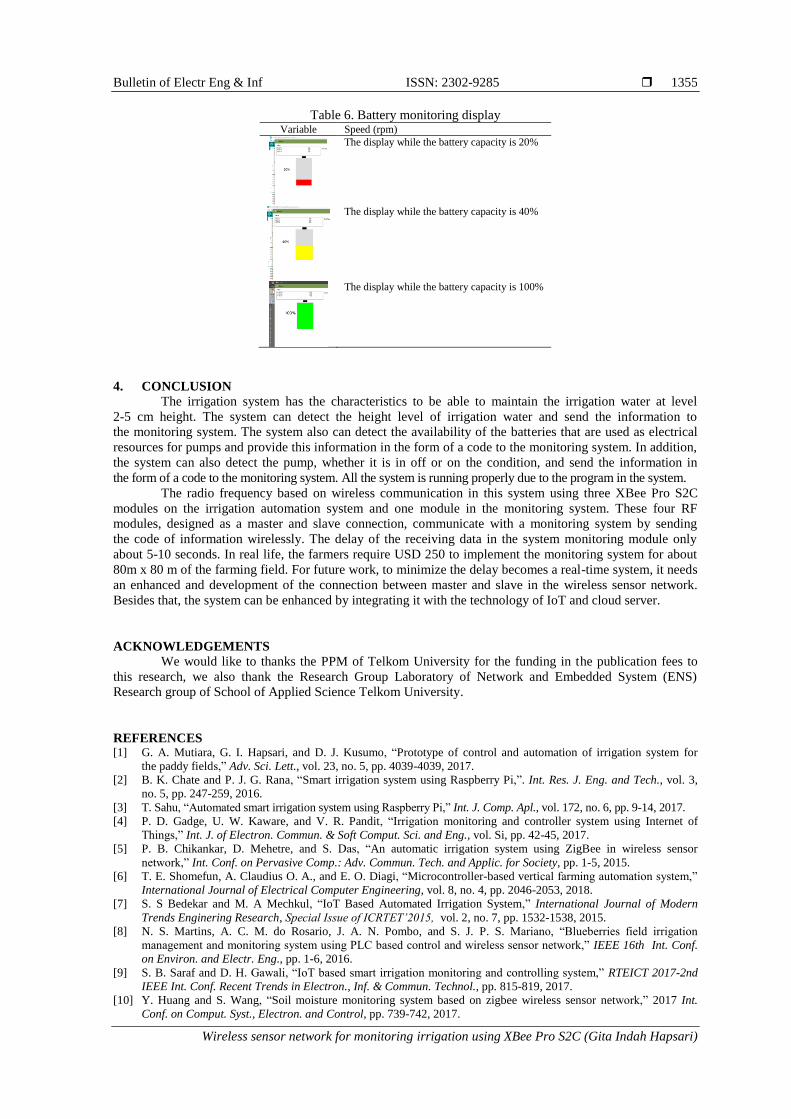
Tests also carried out on receiving battery data obtained by the data sent from the discharge point.
The battery’s condition is shown in Table 6. If the battery is 5 V, the battery display will change into red,
while the display of the battery will turn in yellow if the voltage is 5.3 V. When the battery is full, the display
will be turned into green colour. The changes of colour on display requires a delay of 4-5 seconds from
the time obtained in the irrigation module. Seems like other applications, battery monitoring translator are
displayed in graphical form with ten panels representing the percentage of battery capacity. A 10% capacity
will display a red panel, a 40% battery capacity will display a yellow panel, and a battery capacity over 80%
will display a green panel.
Table 5. Monitoring display testing No. Display Meaning Information
1.
The field need
watering
While Sensor A, B, and C or only Sensor
A and B are not under
the water, discharge pump is OFF, load
pump is ON
2.
The field
has enough
water
Sensor B and sensor
C is in the water, all pumps are OFF
(default condition)
3.
The field
has over
water
Sensor A, B, and C is
in the water,
discharge pump is ON and load pump is
OFF
No. Display Meaning Information
4.
The water spring
lack of the
water
The sensor detects the condition in the water
spring. The sensor is
not submerged by the water
5.
The water
spring is full of the
water
The sensor detects the
condition in the water spring. The sensor is
submerged by the
water
Bulletin of Electr Eng & Inf ISSN: 2302-9285
Wireless sensor network for monitoring irrigation using XBee Pro S2C (Gita Indah Hapsari)
1355
Table 6. Battery monitoring display Variable Speed (rpm)
The display while the battery capacity is 20%
The display while the battery capacity is 40%
The display while the battery capacity is 100%
4. CONCLUSION
The irrigation system has the characteristics to be able to maintain the irrigation water at level
2-5 cm height. The system can detect the height level of irrigation water and send the information to
the monitoring system. The system also can detect the availability of the batteries that are used as electrical
resources for pumps and provide this information in the form of a code to the monitoring system. In addition,
the system can also detect the pump, whether it is in off or on the condition, and send the information in
the form of a code to the monitoring system. All the system is running properly due to the program in the system.
The radio frequency based on wireless communication in this system using three XBee Pro S2C
modules on the irrigation automation system and one module in the monitoring system. These four RF
modules, designed as a master and slave connection, communicate with a monitoring system by sending
the code of information wirelessly. The delay of the receiving data in the system monitoring module only
about 5-10 seconds. In real life, the farmers require USD 250 to implement the monitoring system for about
80m x 80 m of the farming field. For future work, to minimize the delay becomes a real-time system, it needs
an enhanced and development of the connection between master and slave in the wireless sensor network.
Besides that, the system can be enhanced by integrating it with the technology of IoT and cloud server.
ACKNOWLEDGEMENTS We would like to thanks the PPM of Telkom University for the funding in the publication fees to
this research, we also thank the Research Group Laboratory of Network and Embedded System (ENS)
Research group of School of Applied Science Telkom University.
REFERENCES [1] G. A. Mutiara, G. I. Hapsari, and D. J. Kusumo, “Prototype of control and automation of irrigation system for
the paddy fields,” Adv. Sci. Lett., vol. 23, no. 5, pp. 4039-4039, 2017.
[2] B. K. Chate and P. J. G. Rana, “Smart irrigation system using Raspberry Pi,”. Int. Res. J. Eng. and Tech., vol. 3,
no. 5, pp. 247-259, 2016.
[3] T. Sahu, “Automated smart irrigation system using Raspberry Pi,” Int. J. Comp. Apl., vol. 172, no. 6, pp. 9-14, 2017.
[4] P. D. Gadge, U. W. Kaware, and V. R. Pandit, “Irrigation monitoring and controller system using Internet of
Things,” Int. J. of Electron. Commun. & Soft Comput. Sci. and Eng., vol. Si, pp. 42-45, 2017.
[5] P. B. Chikankar, D. Mehetre, and S. Das, “An automatic irrigation system using ZigBee in wireless sensor
network,” Int. Conf. on Pervasive Comp.: Adv. Commun. Tech. and Applic. for Society, pp. 1-5, 2015.
[6] T. E. Shomefun, A. Claudius O. A., and E. O. Diagi, “Microcontroller-based vertical farming automation system,”
International Journal of Electrical Computer Engineering, vol. 8, no. 4, pp. 2046-2053, 2018.
[7] S. S Bedekar and M. A Mechkul, “IoT Based Automated Irrigation System,” International Journal of Modern
Trends Enginering Research, Special Issue of ICRTET’2015, vol. 2, no. 7, pp. 1532-1538, 2015.
[8] N. S. Martins, A. C. M. do Rosario, J. A. N. Pombo, and S. J. P. S. Mariano, “Blueberries field irrigation
management and monitoring system using PLC based control and wireless sensor network,” IEEE 16th Int. Conf.
on Environ. and Electr. Eng., pp. 1-6, 2016.
[9] S. B. Saraf and D. H. Gawali, “IoT based smart irrigation monitoring and controlling system,” RTEICT 2017-2nd
IEEE Int. Conf. Recent Trends in Electron., Inf. & Commun. Technol., pp. 815-819, 2017.
[10] Y. Huang and S. Wang, “Soil moisture monitoring system based on zigbee wireless sensor network,” 2017 Int.
Conf. on Comput. Syst., Electron. and Control, pp. 739-742, 2017.

ISSN: 2302-9285
Bulletin of Electr Eng & Inf, Vol. 9, No. 4, August 2020 : 1345 – 1356
1356
[11] M. NagaGeetha and N. V. K. Ramesh, “An efficient IoT based smart irrigation system and plant diseases
detection : A review,” Int. J. of Eng. & Technol., vol. 7, no. 2.7, pp. 661-664, 2018.
[12] D. C. Trinh, T. C. Truvant, and T. D. Bui, “Design of automatic irrigation system for greenhouse based on LoRa
technology,” 2018 Int. Conf. on Advanced Technologies for Communications (ATC), pp. 72-77, 2018.
[13] M. Usmonov and F. Gregoretti, “Design and implementation of a LoRa based wireless control for drip irrigation
systems,” 2017 2nd Int.Conf. on Robotics and Automation Engineering, pp. 248-253, 2017.
[14] N. A. B. Nisa, K. Priyadharshini, K. Priyadharshini, and R. N. Devi, “Agriculture irrigation water demand
forecasting using lora technology,” Int. Res. J. of Eng. and Technol., vol 6, no 3, pp. 3050-3052, 2019.
[15] Wiranto, B. I. Setiawan, and S. K. Saptomo, “Wireless automatic control irrigation system,” Jurnal Irigasi, vol. 9, no. 2,
pp. 108-114, 2014.
[16] J. Gutiérrez, J. F. Villa-Medina, A. Nieto-Garibay, and M. Á. Porta-Gandara, “Automated irrigation system based
on wireless sensor network and GPRS module,” IEEE Trans. on Instru. and Measur., pp. 166-176, 2014.
[17] H. M. Jawad, R. Nordin, S. K. Gharghan, A. M. Jawad, and M. Ismail, “Energy-efficient wireless sensor networks
for precision agriculture: A review,” Sensors, vol. 7, no. 8, pp. 1-45, 2017.
[18] T. Savić and M. Radonjic, “WSN architecture for smart irrigation system,” 2018 23rd Int. Sci.-Professional Conf.
on Inf. Technol., pp. 1-4, 2018.
[19] M. I. Sani, S. Siregar, A. P. Kurniawan, R. Jauhari, and .C. N. Mandalahi, “Web-based monitoring and control
system for aeroponics growing chamber,” Int. Conf. on Cont., Elect., Renew. Ener. and Comm., pp. 162-168, 2016.
[20] A. N. Afif, F. Noviyanto, Sunardi, S. A. Akbar, and E. Aribowo, “Integrated application for automatic schedule-
based distribution and monitoring of irrigation by applying the waterfall model process,” Bulletin of Electrical
Engineering and Informatics, vol. 9, no 1, pp. 420-426, 2020.
[21] F. Kamaruddin, N. N. N. Abd Malik, N. A. Murad, and N. Mu’azzah, “IoT-based intelligent irrigation management
and monitoring system using arduino,” TELKOMNIKA Telecommunication Computing Electronics and Control,
vol. 17, no. 5, pp. 2378-2388, 2019.
[22] J. Uddin, S. M. T. Reza, Q. Newaz, J. Uddin, T. Islam, and J-M. Kim, “Automated irrigation system using solar
power,” 7th International Conference on Electrical and Computer Engineering, pp. 228-231, 2012.
[23] W. Li, “Design of wireless water-saving irrigation system based on solar energy,” Int. Conf. on Control Autom. and
Syst. Eng., pp. 1-4, 2011.
[24] Z. Rasin, H. Hamzah, and Mohd S. Mohd Aras, “Application and evaluation of high power zigbee based wireless sensor
network in water irrigation control monitoring system,” IEEE Symp. on Ind. Electr. Appl., vol. 2, pp. 548-551, 2009.
[25] A. Hadi, K. Inubushi, and K. Yagi, “Effect of water management on greenhouse gas emissions and microbial
properties of paddy soils in Japan and Indonesia,” Paddy and Water Environ., vol. 8, no. 4, pp. 319-324, 2010.
BIOGRAPHIES OF AUTHORS
Gita Indah Hapsari, she is a master who graduated from Bandung Institute of Technology in
2013. Now, she is a lecturer at Telkom University, majoring in Computer Technology of
Applied Sciences Department. She is Active in Network and Embedded System Research Group
focused on Augmented Reality, Biomedical Engineering, and Embedded System.
Giva Andriana Mutiara, she is a master who graduated from Bandung Institute of Technology
in 2005. Now, she is a lecturer at Telkom University majoring, in Computer Technology of
Applied Sciences Department. Active in Network and Embedded System Research Group
focused on Remote Sensing, Wireless Sensor Network, and Embedded System. She is an
undergraduate student in Universiti Teknikal Malaysia Melaka and focused the research on
the energy efficiency of WSN application.
Luky Rohendi, He is a diploma who graduated from Telkom University majoring in Computer
Engineering, now he is a content developer at Telkom Corporate University. Active in creating
digital learning (video learning & e-learning html 5 based)
Aldy Mulia, He is a diploma who graduated from Telkom University, majoring in Computer
engineering. He is active in electronics of defense section in the gunery firing range and data
link.