Embed Size (px)
Citation preview

166 IEEE TRANSACTIONS ON INSTRUMENTATION AND MEASUREMENT, VOL. 63, NO. 1, JANUARY 2014
Automated Irrigation System Using a WirelessSensor Network and GPRS Module
Joaquín Gutiérrez, Juan Francisco Villa-Medina, Alejandra Nieto-Garibay, and Miguel Ángel Porta-Gándara
Abstract— An automated irrigation system was developed tooptimize water use for agricultural crops. The system has adistributed wireless network of soil-moisture and temperaturesensors placed in the root zone of the plants. In addition, agateway unit handles sensor information, triggers actuators,and transmits data to a web application. An algorithm wasdeveloped with threshold values of temperature and soil moisturethat was programmed into a microcontroller-based gateway tocontrol water quantity. The system was powered by photovoltaicpanels and had a duplex communication link based on acellular-Internet interface that allowed for data inspection andirrigation scheduling to be programmed through a web page. Theautomated system was tested in a sage crop field for 136 days andwater savings of up to 90% compared with traditional irrigationpractices of the agricultural zone were achieved. Three replicasof the automated system have been used successfully in otherplaces for 18 months. Because of its energy autonomy and lowcost, the system has the potential to be useful in water limitedgeographically isolated areas.
Index Terms— Automation, cellular networks, Internet,irrigation, measurement, water resources, wireless sensornetworks (WSNs).
I. INTRODUCTION
AGRICULTURE uses 85% of available freshwater reso-urces worldwide, and this percentage will continue to be
dominant in water consumption because of population growthand increased food demand. There is an urgent need to createstrategies based on science and technology for sustainableuse of water, including technical, agronomic, managerial, andinstitutional improvements [1].
There are many systems to achieve water savings in variouscrops, from basic ones to more technologically advanced ones.For instance, in one system plant water status was monitoredand irrigation scheduled based on canopy temperature distribu-tion of the plant, which was acquired with thermal imaging [2].In addition, other systems have been developed to scheduleirrigation of crops and optimize water use by means of a cropwater stress index (CWSI) [3]. The empirical CWSI was firstdefined over 30 years ago [4]. This index was later calculated
Manuscript received January 30, 2013; revised April 15, 2013; acceptedMay 19, 2013. Date of publication August 19, 2013; date of current versionDecember 5, 2013. This work was supported by SAGARPA-CONACYT underGrant 2009-126183. The Associate Editor coordinating the review process wasDr. Subhas Mukhopadhyay.
The authors are with the Engineering Group, Centro de Investi-gaciones Biológicas del Noroeste, La Paz 23090, Mexico (e-mail:[email protected]; [email protected]; [email protected];[email protected]).
Color versions of one or more of the figures in this paper are availableonline at http://ieeexplore.ieee.org.
Digital Object Identifier 10.1109/TIM.2013.2276487
using measurements of infrared canopy temperatures, ambientair temperatures, and atmospheric vapor pressure deficit valuesto determine when to irrigate broccoli using drip irrigation [5].Irrigation systems can also be automated through informationon volumetric water content of soil, using dielectric moisturesensors to control actuators and save water, instead of a pre-determined irrigation schedule at a particular time of the dayand with a specific duration. An irrigation controller is usedto open a solenoid valve and apply watering to bedding plants(impatiens, petunia, salvia, and vinca) when the volumetricwater content of the substrate drops below a set point [6].
Other authors have reported the use of remote canopy tem-perature to automate cotton crop irrigation using infrared ther-mometers. Through a timed temperature threshold, automaticirrigation was triggered once canopy temperatures exceededthe threshold for certain time accumulated per day. Automaticirrigation scheduling consistently has shown to be valuablein optimizing cotton yields and water use efficiency withrespect to manual irrigation based on direct soil water mea-surements [7].
An alternative parameter to determine crop irrigation needsis estimating plant evapotranspiration (ET). ET is affectedby weather parameters, including solar radiation, temperature,relative humidity, wind speed, and crop factors, such as stageof growth, variety and plant density, management elements,soil properties, pest, and disease control [8]. Systems based onET have been developed that allow water savings of up to 42%on time-based irrigation schedule [9]. In Florida, automatedswitching tensiometers have been used in combination withET calculated from historic weather data to control automaticirrigation schemes for papaya plants instead of using fixedscheduled ones. Soil water status and ET-based irrigationmethods resulted in more sustainable practices compared withset schedule irrigation because of the lower water volumesapplied [10].
An electromagnetic sensor to measure soil moisture wasthe basis for developing an irrigation system at a savings of53% of water compared with irrigation by sprinklers in anarea of 1000 m2 of pasture [11]. A reduction in water useunder scheduled systems also have been achieved, using soilsensor and an evaporimeter, which allowed for the adjustmentof irrigation to the daily fluctuations in weather or volumetricsubstrate moisture content [12].
A system developed for malting barley cultivations in largeareas of land allowed for the optimizing of irrigation throughdecision support software and its integration with an in-field wireless sensor network (WSN) driving an irrigation
0018-9456 © 2013 IEEE

GUTIÉRREZ et al.: AUTOMATED IRRIGATION SYSTEM USING A WSN AND GPRS MODULE 167
machine converted to make sprinkler nozzles controllable.The network consisted of five sensing stations and a weatherstation. Each of the sensing stations contained a data loggerwith two soil water reflectometers, a soil temperature sensor,and Bluetooth communication. Using the network informationand the irrigation machine positions through a differentialGPS, the software controlled the sprinkler with applicationof the appropriate amount of water [13]. Software dedicatedto sprinkler control has been variously discussed [14].
A data acquisition system was deployed for monitoringcrop conditions by means of soil moisture and soil, air, andcanopy temperature measurement in cropped fields. Data weredownloaded using a handheld computer connected via a serialport for analysis and storage [15]. Another system used toachieve the effectiveness of water management was developedbased on a WSN and a weather station for Internet monitoringof drainage water using distributed passive capillary wick-typelysimeters. Water flux leached below the root zone under anirrigated cropping system was measured [16]. There are hybridarchitectures, wireless modules are located inside the green-house where great flexibility is required, and wired modulesare used in the outside area as actuator controllers [17].
The development of WSNs based on microcontrollers andcommunication technologies can improve the current meth-ods of monitoring to support the response appropriately inreal time for a wide range of applications [18], consideringthe requirements of the deployed area, such as terrestrial,underground, underwater, multimedia, and mobile [19]. Theseapplications involve military operations in scenarios of bat-tlefield, urban combat, and force protection, with tasks ofpresence, intrusion, ranging, imaging, detection of chemical,toxic material, biological, radiological, nuclear, and explo-sive [20], [21]. In addition, sensor networks have been usedin health care purposes for monitoring, alerting, assistance,and actuating with security and privacy to support real-timedata transmission [22]. Vital sign monitoring, such as ECG,heart rate, body temperature, has been integrated in hospitalsand homes through wearable or e-textile providing reportsand alerts to personal in case of emergency and tracking thelocation of patients within the hospital limits [23]. WSNs havebeen used to remote monitor healthcare of dependent people attheir homes through several biomedical sensors such as ECG,blood pressure, body temperature [24], and body motion [25].
Home applications comprised wireless embedded sensorsand actuators that enable monitoring and control. For comfortand efficient energy management, household devices have beencontrolled through sensors that monitor parameters such astemperature, humidity, light, and presence, avoiding waste ofenergy [26]. Sensor networks have been used for security pur-poses, based on several sensors such as smoke detectors, gassensors, and motion sensors, to detect possible risk situationsthat trigger appropriate actions in response, such as send analert to a remote center through wireless communication [27].
In industrial environments, WSNs have been installed toprovide real-time data acquisition for inventory management,to equipment monitoring for control with appropriate actions,reducing human errors and preventing manufacturing down-time [28], [29]. For example, industrial WSN have been imple-
mented to motor fault diagnosis [30] and for the monitoringof the temperature-sensitive products during their distributionhas been proposed [31]. In addition, there are wireless systemsfor structural identification under environmental an operationalparameters, such as load in bridges [32].
In environmental applications, sensor networks have beenused to monitor a variety of environmental parameters orconditions in marine, soil, and atmospheric contexts [33].Environmental parameters, including humidity, pressure, tem-perature, soil water content, and radiation with different spatialand temporal resolution and for event detection such as disastermonitoring, pollution conditions, floods, forest fire, and debrisflow is continuously monitored [34]–[36]. Applications inagriculture have been used to provide data for appropriatemanagement, such as monitoring of environmental condi-tions like weather, soil moisture content, soil temperature,soil fertility, mineral content, and weed disease detection,monitoring leaf temperature, moisture content, and monitoringgrowth of the crop, automated irrigation facility and storageof agricultural products [37]–[39].
Various commercial WSNs exist, ranging from limited andlow-resolution devices with sensors and embedded proces-sors to complete and expensive acquisition systems that sup-port diverse sensors and include several communication fea-tures [40]. Recent advances in microelectronics and wirelesstechnologies created low-cost and low-power components,which are important issues especially for such systems suchas WSN [41]. Power management has been addressed inboth hardware and software with new electronic designsand operation techniques. The selection of a microprocessorbecomes important in power aware design. Modern CMOSand micro-electro-mechanical systems (MEMS) technologiesallowed manufacturers to produce on average every three yearsa enhance generation of circuits by integrating sensors, signalconditioning, signal processing, digital output options, com-munications, and power supply units [42], [43]. For example,the parallel combination of a battery and a supercapacitor hasbeen used to extend the runtime of low-power wireless sensornodes [44].
Energy harvesting mechanisms have been employed, incases where it is difficult for changing or recharging batteries,hence this strategy has involved combining it with efficientpower management algorithms to optimize battery lifetime.Power harvesting is a complementary approach that dependson ambient energy sources, including environmental vibration,human power, thermal, solar, and wind that can be convertedinto useable electrical energy [45]–[47]. On the other hand,several strategies have been implemented to reduce power con-sumption, such as power-aware protocols, resource and taskmanagement, communication, topology control and routing,models based on events, and congestion control mechanismto balance the load, prevent packet drops, and avoid networkdeadlock using a combination of predeployed group keys thatallow the dynamic creation of high security subnetworks andoptimizes energy efficiency of sensor networks [48], [49].For instance, energy-saving strategies have been achievedthrough scheduling [50], [51], sleep or wake up schemes,and adaptive radio frequency (RF) in nodes, and choosing

168 IEEE TRANSACTIONS ON INSTRUMENTATION AND MEASUREMENT, VOL. 63, NO. 1, JANUARY 2014
a network configuration [52]. There are also algorithms tomaximize the network coverage ratio with a predefined balancethe energy consumption in the whole WSN [53], to reduceboth the transmission and the computational loads at thenode level [54], and to estimate online the optimal samplingfrequencies for sensors [55].
In a wireless node, the radio modem is the major powerconsuming component; recently, wireless standards have beenestablished with medium access control protocols to providemultitask support, data delivery, and energy efficiency per-formance [56], such as the standards for wireless local areanetwork, IEEE 802.11b (WiFi) [57] and wireless personalarea network (WPAN), IEEE 802.15.1 (Bluetooth) [58], IEEE802.15.3 (UWB) [59], and IEEE 802.15.4 (ZigBee) [60], andthose open wireless communication standards for Internet pro-tocol version 6 (IPv6) over low-power wireless personal areanetworks 6LoWPAN [61], [62], wireless highway addressableremote transducer WirelessHART [63], and ISA100.11a [64]developed by the International Society of Automation.
In this paper, the development of the deployment of anautomated irrigation system based on microcontrollers andwireless communication at experimental scale within ruralareas is presented. The aim of the implementation was todemonstrate that the automatic irrigation can be used to reducewater use. The implementation is a photovoltaic poweredautomated irrigation system that consists of a distributedwireless network of soil moisture and temperature sensorsdeployed in plant root zones. Each sensor node involved asoil-moisture probe, a temperature probe, a microcontrollerfor data acquisition, and a radio transceiver; the sensor mea-surements are transmitted to a microcontroller-based receiver.This gateway permits the automated activation of irrigationwhen the threshold values of soil moisture and temperatureare reached. Communication between the sensor nodes andthe data receiver is via the Zigbee protocol [65], [66] underthe IEEE 802.15.4 WPAN. This receiver unit also has a duplexcommunication link based on a cellular-Internet interface,using general packet radio service (GPRS) protocol, which is apacket-oriented mobile data service used in 2G and 3G cellularglobal system for mobile communications (GSM). The Internetconnection allows the data inspection in real time on a website,where the soil-moisture and temperature levels are graphicallydisplayed through an application interface and stored in adatabase server. This access also enables direct programmingof scheduled irrigation schemes and trigger values in thereceiver according the crop growth and season management.Because of its energy autonomy and low cost, the system haspotential use for organic crops, which are mainly located ingeographically isolated areas where the energy grid is far away.
II. AUTOMATED IRRIGATION SYSTEM
The automated irrigation system hereby reported, consistedof two components (Fig. 1), wireless sensor units (WSUs) anda wireless information unit (WIU), linked by radio transceiversthat allowed the transfer of soil moisture and temperaturedata, implementing a WSN that uses ZigBee technology. TheWIU has also a GPRS module to transmit the data to a web
Fig. 1. Configuration of the automated irrigation system. WSUs and a WIU,based on microcontroller, ZigBee, and GPRS technologies.
Fig. 2. WSU. (a) Electronic component PCB. (b) Radio modem ZigBee.(c) Temperature sensor. (d) Moisture sensor. (e) Rechargeable batteries.(f) Photovoltaic cell. (g) Polyvinyl chloride container.
server via the public mobile network. The information canbe remotely monitored online through a graphical applicationthrough Internet access devices.
A. Wireless Sensor Unit
A WSU is comprised of a RF transceiver, sensors, amicrocontroller, and power sources. Several WSUs can bedeployed in-field to configure a distributed sensor networkfor the automated irrigation system. Each unit is based onthe microcontroller PIC24FJ64GB004 (Microchip Technolo-gies, Chandler, AZ) that controls the radio modem XBeePro S2 (Digi International, Eden Prairie, MN) and processesinformation from the soil-moisture sensor VH400 (Vegetronix,Sandy, UT), and the temperature sensor DS1822 (MaximIntegrated, San Jose, CA). These components are poweredby rechargeable AA 2000-mAh Ni-MH CycleEnergy batteries(SONY, Australia). The charge is maintained by a photovoltaicpanel MPT4.8-75 (PowerFilm Solar, Ames, IN) to achievefull energy autonomy. The microcontroller, radio modem,rechargeable batteries, and electronic components were encap-sulated in a waterproof Polyvinyl chloride (PVC) container(Fig. 2). These components were selected to minimize thepower consumption for the proposed application.

GUTIÉRREZ et al.: AUTOMATED IRRIGATION SYSTEM USING A WSN AND GPRS MODULE 169
Start
Request date and time
ConnectionWIU Get date/time
INT-RTCC?
Enable Voltage
Regulator
Package/Send data to WIU
Measure:MoistureTemperatureVoltage
Sleep Mode
Yes
Disenable Voltage
Regulator
Fig. 3. Algorithm of wireless sensor unit (WSU) for monitoring the soil-moisture and temperature.
1) Single-Chip PIC24FJ64GB004: A 16-bit microcontrollerwith 44-pins and nanoWatt XLP technology that operatesin a range 2.0 to 3.6 V at 8 MHz with internal oscillator.It has up to 25 digital input/output ports, 13-, 10-bit analog-to-digital converters (ADC), two serial peripheral interfacemodules, two I2C, two UART, 5 16-bit timers, 64 KB ofprogram memory, 8 KB of SRAM, and hardware real-timeclock/calendar (RTCC). The microcontroller is well suited forthis remote application, because of its low-power operatingcurrent, which is 175 µA at 2.5 V at 8 MHz and 0.5 µA forstandby current in sleep mode including the RTCC.
The microcontroller was programmed in C compiler 4.12(Custom Computer Services, Waukesha, WI) with the appro-priate algorithm (Fig. 3) for monitoring the soil-moisture probethrough an analog-to-digital port and the soil-temperatureprobe through another digital port, implemented in 1-Wirecommunication protocol. A battery voltage monitor is includedthrough a high-impedance voltage divider coupled to ananalog-to-digital port. The data are packed with the cor-responding identifier, date, and time to be transmitted viaXBee radio modem using a RS-232 protocol through twodigital ports configured as transmitter (TX) and receiver (RX),respectively. After sending data, the microcontroller is set insleep mode for certain period according to the sensor samplingrate desired, whereas the internal RTCC is running. Thisoperation mode allows energy savings. When the WSU islaunched for first time, the algorithm also inquires the WIU,
Fig. 4. Communication frames between a WSU and the WIU.
the date and time to program the RTCC, and periodicallyupdates it for synchronization.
2) ZigBee Modules: ZigBee (over IEEE 802.15.4) technol-ogy is based on short range WSN and it was selected for thisbattery-operated sensor network because of its low cost, lowpower consumption, and greater useful range in comparisonwith other wireless technologies like Bluetooth (over IEEE802.15.1), UWB (over IEEE 802.15.3), and Wi-Fi (over IEEE802.11) [67]. The ZigBee devices operate in industrial, scien-tific, and medical 2.4-GHz radio band and allow the operationin a so-called mesh networking architecture, which can bedifferentiated into three categories: 1) coordinator; 2) router;and 3) end device.
From a wide range of commercial ZigBee devices, theXBee-PRO S2 is an appropriate original equipment manufac-turer module to establish communication between a WSU andthe WIU because of its long-range operation and reliability ofthe sensor networking architecture. The XBee-PRO S2 is a RFmodem with integrated chip antenna, 20-pins, and 13 generalpurpose input/output (GPIO) ports available of which four areADC. It can operate up to a distance of 1500 m in outdoorline-of-sight with 170 mA of TX peak current and 45 mA forRX current at 3.3 V and power-down current of 3.5 µA.
The XBee radio modem of each WSU is powered at 3.3 Vthrough a voltage regulator ADP122AUJZ-3.3-R7 (AnalogDevices, Norwood, MA) and interfaced to the host microcon-troller through its serial port, a logic-level asynchronous serial,and voltage compatible UART configured at 9600 baud rate,no - parity, 1 - start bit, 1 - stop bit, 8 - data bits.
The WSUs were configured such as end devices to deploya networking topology point-to-point based on a coordinatorthat was implemented by the XBee radio modem of the WIU.An end device has the following characteristics: 1) it must joina ZigBee PAN before it can transmit or receive data; 2) cannotallow devices to join the network; 3) must always transmit andreceive RF data through its parent; 4) cannot route data; and5) can enter low power modes to conserve power and can bebattery powered. The least significant byte of the unique 64-bitaddress is used to label the information of the soil moistureand temperature for each WSU in the network. This byte isregistered in the WIU as the identifier (ID) associated to eachWSU. As shown in the sample frames to request date/time,receive date/time, and send data packaged to the WIU (Fig. 4).
3) Soil Sensor Array: The sensor array consists of two soilsensors, including moisture and temperature that are inserted inthe root zone of the plants. The VH400 probe was selected to

170 IEEE TRANSACTIONS ON INSTRUMENTATION AND MEASUREMENT, VOL. 63, NO. 1, JANUARY 2014
estimate the soil moisture because of low power consumption(<7 mA) and low cost. The probe measures the dielectricconstant of the soil using transmission line techniques at80 MHz, which is insensitive to water salinity, and providesan output range between 0 and 3.0 V, which is proportional tothe volumetric water content (VWC) according to a calibrationcurve provided by the manufacturer. The sensor was poweredat 3.3 V and monitored by the microcontroller through an ADCport.
Soil temperature measurements were made through the dig-ital thermometer DS1822. The sensor converts temperature toa 12-bit digital word and is stored in 2-B temperature registers,corresponding to increments of 0.0625 °C. The temperature isrequired through a reading command and transmitted using1-Wire bus protocol implemented in the microcontrollerthrough one digital port. The thermometer has ±2.0 °Caccuracy over −10 °C to +85 °C temperature range and aunique 64-bit serial number. The sensor is a 3-pin single-chipand TO92 package that was embedded in a metal capsule andsealed in a waterproof PVC cylindrical container.
To calibrate the soil moisture, several samples were preparedwith 1 kg of dry soil from the crop area. Its composition wasloamy sand with 80% sand separate, 4.5% clay separate, and15.6% silt separate. The soil water holding capacity was of20.7% VWC corresponding to measured output voltages of1.45 V. The temperature sensors were calibrated through areference mercury thermometer CT40, with 0.1 °C divisionsand a range from −1 °C to 51 °C. The thermometer and thetemperature sensors were placed in an insulated flask filledwith mineral oil at 10 °C and 40 °C.
4) Photovoltaic Cell: To maintain the charge of the WSUbatteries, a solar panel MPT4.8-75 was employed. Each solarpanel delivers 50 mA at 4.8 V, which is sufficient energyto maintain the voltage of the three rechargeable batteries.A MSS1P2U Schottky diode (Vishay, Shelton, CT) is usedto prevent the solar module and to drain the battery whenis in the dark. The solar panel is encapsulated in a 3-mmclear polyester film with dimensions of 94 mm × 75 mm.This flexible panel was mounted on a PVC prismatic base(100 mm × 80 mm × 3.17 mm) that is fastened in the upperpart of a PVC pole allowing for the correct alignment of thephotovoltaic panel to the sun. The stick is 50 cm of lengthand 12.5 mm of diameter; the lower end of the pole had a tipend to be buried.
B. Wireless Information Unit
The soil moisture and temperature data from each WSU arereceived, identified, recorded, and analyzed in the WIU. TheWIU consists of a master microcontroller PIC24FJ64GB004,an XBee radio modem, a GPRS module MTSMC-G2-SP(MultiTech Systems, Mounds View, MN), an RS-232 inter-face MAX3235E (Maxim Integrated, San Jose, CA), twoelectronic relays, two 12 V dc 1100 GPH Livewell pumps(Rule-Industries, Gloucester, MA) for driving the water of thetanks, and a deep cycle 12 V at 100-Ah rechargeable batteryL-24M/DC-140 (LTH, Mexico), which is recharged by a solarpanel KC130TM of 12 V at 130 W (Kyocera, Scottsdale, AZ)
Fig. 5. WIU. (a) Electronic component PCB. (b) Master microcontroller.(c) Solid state memory. (d) Optical isolators. (e) RS-232 interface. (f) Pushbutton. (g) Output cables to pumps. (h) Supply cable from charge controller.(i) PCV box.
through a PWM charge controller SCI-120 (Syscom, Mexico).All the WIU electronic components were encapsulated in awaterproof PVC box as shown in Figs. 5 and 6. The WIU canbe located up to 1500-m line-of-sight from the WSUs placedin the field.
1) Master Microcontroller: The functionality of the WIU isbased on the microcontroller, which is programmed to performdiverse tasks, as is shown in Fig. 7. The first task of theprogram is to download from a web server the date and timethrough the GPRS module. The WIU is ready to transmitvia XBee the date and time for each WSU once powered.Then, the microcontroller receives the information packagetransmitted by each WSU that conform the WSN.
These data are processed by the algorithm that first identifiesthe least significant byte of a unique 64-bit address encap-sulated in the package received. Second, the soil moistureand temperature data are compared with programmed valuesof minimum soil moisture and maximum soil temperatureto activate the irrigation pumps for a desired period. Third,the algorithm also records a log file with the data in a solidstate memory 24FC1025 (Microchip Technologies, Chandler,AZ) with a capacity of 128 kB. Each log is 12-B long,including soil moisture and temperature, the battery voltage,the WSU ID, the date, and time generated by the internalRTCC. If irrigation is provided, the program also stores aregister with the duration of irrigation, the date, and time.Finally, these data and a greenhouse ID are also transmitted

GUTIÉRREZ et al.: AUTOMATED IRRIGATION SYSTEM USING A WSN AND GPRS MODULE 171
Fig. 6. Inside view of the WIU. (a) Radio modem ZigBee. (b) GPRS module.(c) SIM card. (d) GPRS PCB antenna. (e) Pumps relays.
Fig. 7. Algorithm of the master microcontroller in the WIU for the automatedirrigation system.
at each predefined time to a web server through HTTP via theGPRS module to be deployed on the Internet web applicationin real time.
When the server receives a request for the web page, itinserts each data to the corresponding field in the database.
This link is bidirectional and permits to change the thresholdvalues through the website interface; scheduled watering orremote watering can be performed.
The WIU has also a push button to perform manual irriga-tion for a programmed period and a LED to indicate when theinformation package is received. All the WIU processes canbe monitored through the RS-232 port.
The WIU includes a function that synchronizes the WSUsat noon for monitoring the status of each WSU. In the casethat all WSUs are lost, the system goes automatically to adefault irrigation schedule mode. Besides this action, an emailis sent to alert the system administrator.
2) GPRS Module: The MTSMC-G2-SP is a cellular modemembedded in a 64-pins universal socket that offers standards-based quad-band GSM/GPRS Class 10 performance. ThisGPRS modem includes an embedded transmission controlprotocol/Internet protocol stack to bring Internet connectivity,a UFL antenna connector and subscriber identity module(SIM) socket. The module is capable of transfer speeds upto 115.2 K b/s and can be interfaced directly to a UARTor microcontroller using AT commands. It also includes anonboard LED to display network status.
The GPRS was powered to 5 V regulated by UA7805 (TexasInstruments, Dallas, TX) and operated at 9600 Bd through aserial port of the master microcontroller and connected to aPCB antenna. The power consumption is 0.56 W at 5 V.
In each connection, the microcontroller sends AT commandsto the GPRS module; it inquires the received signal strengthindication, which must be greater than −89 dBm to guaranteea good connection. In addition, it establishes the communica-tion with the URL of the web server to upload and downloaddata. If the received signal strength is poor, then all data arestored into the solid-state memory of the WIU and the systemtry to establish the connection each hour.
3) Watering Module: The irrigation is performed by con-trolling the two pumps through 40-A electromagnetic relaysconnected with the microcontroller via two optical isolatorsCPC1004N (Clare, Beverly. MA). The pumps have a powerconsumption of 48 W each and were fed by a 5000-l watertank.
Four different irrigation actions (IA) are implemented in theWIU algorithm:
1) fixed duration for manual irrigation with the push button;2) scheduled date and time irrigations through the web page
for any desired time;3) automated irrigation with a fixed duration, if at least one
soil moisture sensor value of the WSN drops below theprogrammed threshold level;
4) automated irrigation with a fixed duration, if at least onesoil temperature sensor value of the WSN exceeds theprogrammed threshold level.
C. Web Application
Graphical user interface software was developed for real-time monitoring and programming of irrigation based onsoil moisture and temperature data. The software applicationpermits the user to visualize graphically the data from eachWSU online using any device with Internet (Fig. 8).
Besides the soil-moisture and temperature graphs, the webapplication displays the total water consumption and the kindof the IA.
The web application also enabled the user direct program-ming of scheduled irrigation schemes and adjusting the triggervalues in the WIU according to the crop species and seasonmanagement. All the information is stored in a database. Theweb application for monitoring and programming was codedin C# language of Microsoft Visual Studio 2010. The databasewas implemented in SQL Server 2005.

172 IEEE TRANSACTIONS ON INSTRUMENTATION AND MEASUREMENT, VOL. 63, NO. 1, JANUARY 2014
Fig. 8. Web application of the automated irrigation system to remotelysupervise the soil moisture and temperature of each WSU and change thethreshold values and the scheduled irrigation.
Fig. 9. Greenhouse for organic sage production with WSUs located arbitrarilyin different cultivation beds. (a) WSU-55 on bed 2. (b) WSU-56 on bed 12.(c) WSU-57 on bed 23. WSU-54 was on bed 1.
III. IRRIGATION SYSTEM OPERATION
The system was tested in a 2400-m2 greenhouse, locatednear San Jose del Cabo, Baja California Sur (BCS), Mexico(23° 10.841’ N, 109° 43.630’ W) for organic sage (Salviaofficinalis) production. The greenhouse had 56 productionbeds covered with plastic. Each bed was 14-m long andhad two black polyethylene tubes with drip hole spac-ing of 0.2 m. The automated irrigation system was usedto irrigate only 600 m2, which corresponded to 14 beds;whereas, the remaining 42 beds were irrigated by humansupervision to compare water consumption with the tra-ditional irrigation practices in this production place. FourWSUs labeled by the last significant byte of the unique64-bit address (WSU-54, 55, 56, and 57) were located in thegreenhouse at arbitrary points (Fig. 9).
The WSU-57 unit was used to measure the soil moisture andtemperature in the area (bed 23) where the traditional irrigationpractices were employed. The other three units (WSU-54,55, and 56) were located in beds 1, 2, and 12 to operatethe automated irrigation system with their corresponding soilmoisture and temperature sensors situated at a depth of 10 cm
Fig. 10. Gathered data of the WSUs, in the web application of the automatedirrigation system: soil temperatures, soil moisture, and water supplied (verticalbars indicate automated and scheduled irrigation).
in the root zone of the plants. These three units alloweddata redundancy to ensure irrigation control. The algorithmconsidered the values from the WSU-54, 55, and 56, if onereached the threshold values the automated irrigation wasperformed.
The pumping rate provided 10 ml/min/drip hole, which wasmeasured in the automated irrigation zone in six different dripholes.
In accordance with the organic producer’s experience, aminimum value of 5% VWC for the soil was established asthe moisture threshold level and 30 °C as the temperaturethreshold level for the automated irrigation modes (IA-3 andIA-4, respectively). Initially, the scheduled irrigation (IA-2)of 35 min/week was used during the first six weeks. Afterthat, the scheduled irrigation was set at 35 min three timesper week. Sage cultivation finalized after 136 days.
During the cultivation, several automated irrigation periodswere carried out by the system because of the soil-moisture(IA-3) or temperature (IA-4) levels, regardless of the scheduledirrigation (IA-2). All data were uploaded each hour to theweb server for remote supervision. For instance, data offive days are shown (Fig. 10). The first graph shows soiltemperatures. The vertical bars indicate automated irrigationperiods triggered by temperature when soil temperature wasabove the threshold value (30 °C). The second graph showssoil moistures that were above the threshold value (5.0%VWC), and thus the automated irrigation was not triggeredby soil moisture. Finally, the last graph shows the total waterused by the sage with the corresponding scheduled irrigationvertical bars for the IA-2. The dots denote the automated andscheduled irrigation.
Automated irrigation triggered by soil moisture for fourdays are shown in Fig. 11; when the soil moisture value fellbelow the threshold level of 5.0% VWC, the irrigation systemwas activated for 35 min according to IA-3, whereas the soiltemperature remained below the threshold level. Similarly,Fig. 12 shows automated irrigation triggered by soil temper-ature; when the temperature was above 30 °C, the irrigationsystem was activated for 5 min according to IA-4, whereasthe soil moisture remained above the threshold level.

GUTIÉRREZ et al.: AUTOMATED IRRIGATION SYSTEM USING A WSN AND GPRS MODULE 173
Fig. 11. Automated irrigation (vertical bars) triggered by the soil moisturethreshold ≤ 5% VWC.
Fig. 12. Automated irrigation (vertical bars) triggered by the soil temperaturethreshold ≥30 °C.
10
15
20
25
30
Tem
pera
ture
(°C
)
5
10
15
20
VWC
(%)
5
10
15
20
20 40 60 80 100 120 1400
100
200
300
400
Day
Wat
er (m
3 )
ab
c
d
Fig. 13. Daily mean soil temperature (a: traditional; b: automated), dailymean soil moisture (c: traditional; d: automated), and accumulated waterirrigation volumes (dotted line: traditional; solid line: automated) over theentire sage cropping season.
Water consumption with the organic producers’ traditionalirrigation procedure consisted of watering with a 2” electricalpump during 5 h three times per week for the whole cultivationperiod. Under this scheme the volume flow rate measured onsite was 10 ml/min/per drip hole, giving a total of 174 l/driphole, whilst the automated irrigation system used 14 l/driphole. In the entire greenhouse, the sage plants presented similarfresh biomass regardless of the irrigation procedure during thewhole production period. The average biomass per cut was110 pounds for the traditional irrigation system correspondingto 42 production beds and 30 pounds for the automatedirrigation system corresponding to 14 beds.
The automated system was tested in the greenhouse for136 days (Fig. 13). Daily mean soil moisture and temperatureare shown, as well as the accumulated water used for bothsystems. Both mean temperatures presented similar behaviorfor the production period, except for the last 30 days, wherethe soil temperature for the traditional irrigation practice
Fig. 14. Automated irrigation systems for the experimental production of:sage (top left), thyme (top right), origanum (bottom left), and basil (bottomright) in San Jose del Cabo, Los Arados, El Pescadero, and El Comitan,respectively.
0 5 10 15 20 25 30 350
50
100
150
200
250
Cur
rent
(mA
)
Time (s)
(4.47 μA)Sleep
Fig. 15. WSU current consumption in monitoring and sleep modes.
(curve a) was lower than the automated irrigation (curve b).The daily mean VWC for the traditional irrigation practice(curve c) was almost constant >16%, whereas that for theautomated irrigation (curve d) was below 10%. In addition, theaccumulated water used are shown corresponding to 14 bedsfor each irrigation system. The total water requirement was341 m3 for the traditional one and 29 m3 for the automatedone. Then, the automated irrigation used ∼90% less water withrespect to the traditional irrigation practice.
Another three automated irrigation systems (Fig. 14) havebeen tested along 18 months in other places in BCS, Mexico:El Pescadero (23° 21.866’ N, 110° 10.099’ W), El Comitan-CIBNOR (24° 7.933’ N, 110° 25.416’ W), and Los Ara-dos (24° 47.1’ N, 111° 11.133’ W). In these three places,programmed irrigations (IA-2) were compared with trig-gered irrigations (IA-3 and IA-4), water savings ∼60% wereobtained.
For cases such as Los Arados, it was found that the signalreceiving strength was too low and the Internet connectioncould not be established, hence in this case all data were storedinto the solid state memory of the WIU.
Power consumption of a WSU was measured throughcurrent oscilloscope (UNI-T UT81B) in the monitoring andsleep operational modes (Fig. 15). Each hour, the soil-moisture
174 IEEE TRANSACTIONS ON INSTRUMENTATION AND MEASUREMENT, VOL. 63, NO. 1, JANUARY 2014
01 02 03 04 05 06 07 08 09 10 11 12 13 14 15 16 17 18 19 203.5
3.75
4
4.25
4.5
Day
Volta
ge (V
)
Without solar panel
With solar panel
Fig. 16. Battery charge–discharge cycle of a wireless sensor unit (WSU).
01 02 03 04 05 06 07 08 09 10 11 12 13 14 15 16 17 18 19 200
100
200
300
400
500
600
700
800
Day
Sola
r rad
iatio
n (W
/m2 )
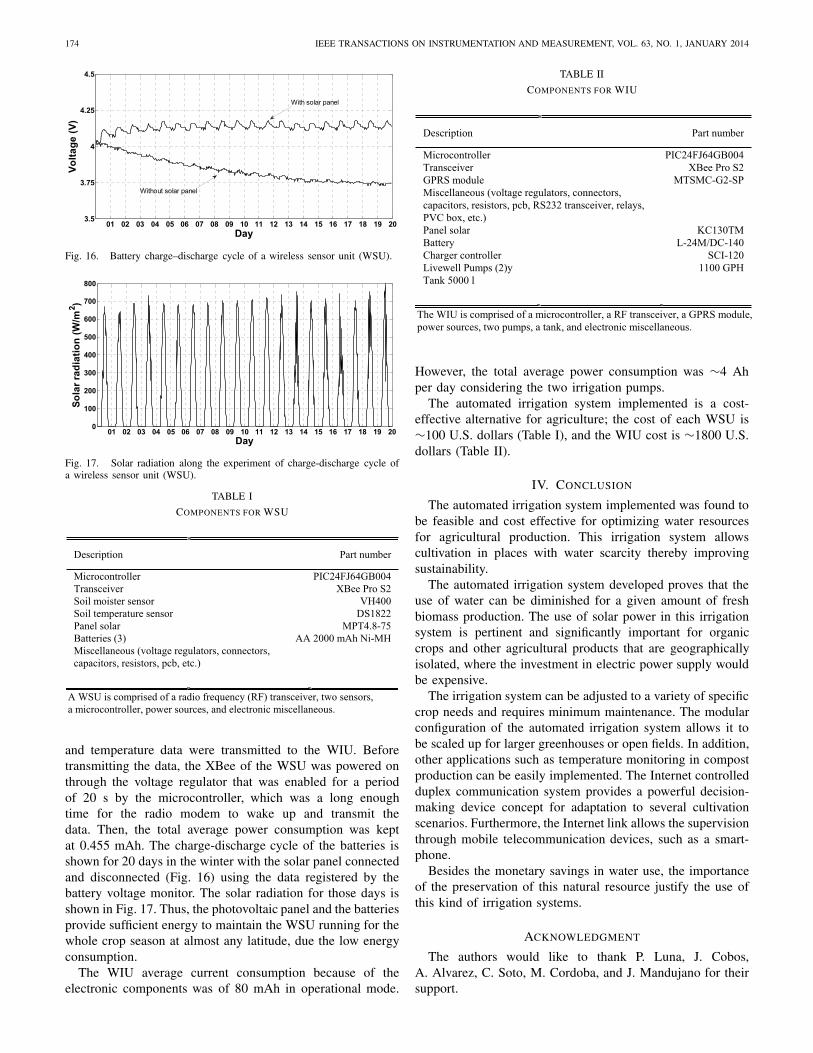
Fig. 17. Solar radiation along the experiment of charge-discharge cycle ofa wireless sensor unit (WSU).
TABLE I
COMPONENTS FOR WSU
and temperature data were transmitted to the WIU. Beforetransmitting the data, the XBee of the WSU was powered onthrough the voltage regulator that was enabled for a periodof 20 s by the microcontroller, which was a long enoughtime for the radio modem to wake up and transmit thedata. Then, the total average power consumption was keptat 0.455 mAh. The charge-discharge cycle of the batteries isshown for 20 days in the winter with the solar panel connectedand disconnected (Fig. 16) using the data registered by thebattery voltage monitor. The solar radiation for those days isshown in Fig. 17. Thus, the photovoltaic panel and the batteriesprovide sufficient energy to maintain the WSU running for thewhole crop season at almost any latitude, due the low energyconsumption.
The WIU average current consumption because of theelectronic components was of 80 mAh in operational mode.
TABLE II
COMPONENTS FOR WIU
However, the total average power consumption was ∼4 Ahper day considering the two irrigation pumps.
The automated irrigation system implemented is a cost-effective alternative for agriculture; the cost of each WSU is∼100 U.S. dollars (Table I), and the WIU cost is ∼1800 U.S.dollars (Table II).
IV. CONCLUSION
The automated irrigation system implemented was found tobe feasible and cost effective for optimizing water resourcesfor agricultural production. This irrigation system allowscultivation in places with water scarcity thereby improvingsustainability.
The automated irrigation system developed proves that theuse of water can be diminished for a given amount of freshbiomass production. The use of solar power in this irrigationsystem is pertinent and significantly important for organiccrops and other agricultural products that are geographicallyisolated, where the investment in electric power supply wouldbe expensive.
The irrigation system can be adjusted to a variety of specificcrop needs and requires minimum maintenance. The modularconfiguration of the automated irrigation system allows it tobe scaled up for larger greenhouses or open fields. In addition,other applications such as temperature monitoring in compostproduction can be easily implemented. The Internet controlledduplex communication system provides a powerful decision-making device concept for adaptation to several cultivationscenarios. Furthermore, the Internet link allows the supervisionthrough mobile telecommunication devices, such as a smart-phone.
Besides the monetary savings in water use, the importanceof the preservation of this natural resource justify the use ofthis kind of irrigation systems.
ACKNOWLEDGMENT
The authors would like to thank P. Luna, J. Cobos,A. Alvarez, C. Soto, M. Cordoba, and J. Mandujano for theirsupport.

GUTIÉRREZ et al.: AUTOMATED IRRIGATION SYSTEM USING A WSN AND GPRS MODULE 175
REFERENCES
[1] W. A. Jury and H. J. Vaux, “The emerging global water crisis: Managingscarcity and conflict between water users,” Adv. Agronomy, vol. 95,pp. 1–76, Sep. 2007.
[2] X. Wang, W. Yang, A. Wheaton, N. Cooley, and B. Moran, “Efficientregistration of optical and IR images for automatic plant water stressassessment,” Comput. Electron. Agricult., vol. 74, no. 2, pp. 230–237,Nov. 2010.
[3] G. Yuan, Y. Luo, X. Sun, and D. Tang, “Evaluation of a crop waterstress index for detecting water stress in winter wheat in the North ChinaPlain,” Agricult. Water Manag., vol. 64, no. 1, pp. 29–40, Jan. 2004.
[4] S. B. Idso, R. D. Jackson, P. J. Pinter, Jr., R. J. Reginato, andJ. L. Hatfield, “Normalizing the stress-degree-day parameter for environ-mental variability,” Agricult. Meteorol., vol. 24, pp. 45–55, Jan. 1981.
[5] Y. Erdem, L. Arin, T. Erdem, S. Polat, M. Deveci, H. Okursoy, andH. T. Gültas, “Crop water stress index for assessing irrigation schedulingof drip irrigated broccoli (Brassica oleracea L. var. italica),” Agricult.Water Manag., vol. 98, no. 1, pp. 148–156, Dec. 2010.
[6] K. S. Nemali and M. W. Van Iersel, “An automated system for con-trolling drought stress and irrigation in potted plants,” Sci. Horticult.,vol. 110, no. 3, pp. 292–297, Nov. 2006.
[7] S. A. O’Shaughnessy and S. R. Evett, “Canopy temperature based sys-tem effectively schedules and controls center pivot irrigation of cotton,”Agricult. Water Manag., vol. 97, no. 9, pp. 1310–1316, Apr. 2010.
[8] R. G. Allen, L. S. Pereira, D. Raes, and M. Smith, CropEvapotranspiration-Guidelines for Computing Crop WaterRequirements—FAO Irrigation and Drainage Paper 56. Rome, Italy:FAO, 1998.
[9] S. L. Davis and M. D. Dukes, “Irrigation scheduling performance byevapotranspiration-based controllers,” Agricult. Water Manag., vol. 98,no. 1, pp. 19–28, Dec. 2010.
[10] K. W. Migliaccio, B. Schaffer, J. H. Crane, and F. S. Davies, “Plantresponse to evapotranspiration and soil water sensor irrigation schedul-ing methods for papaya production in south Florida,” Agricult. WaterManag., vol. 97, no. 10, pp. 1452–1460, Oct. 2010.
[11] J. M. Blonquist, Jr., S. B. Jones, and D. A. Robinson, “Precise irrigationscheduling for turfgrass using a subsurface electromagnetic soil moisturesensor,” Agricult. Water Manag., vol. 84, nos. 1–2, pp. 153–165,Jul. 2006.
[12] O. M. Grant, M. J. Davies, H. Longbottom, and C. J. Atkinson,“Irrigation scheduling and irrigation systems: Optimising irrigation effi-ciency for container ornamental shrubs,” Irrigation Sci., vol. 27, no. 2,pp. 139–153, Jan. 2009.
[13] Y. Kim, R. G. Evans, and W. M. Iversen, “Remote sensing and control ofan irrigation system using a distributed wireless sensor network,” IEEETrans. Instrum. Meas., vol. 57, no. 7, pp. 1379–1387, Jul. 2008.
[14] Y. Kim and R. G. Evans, “Software design for wireless sensor-basedsite-specific irrigation,” Comput. Electron. Agricult., vol. 66, no. 2,pp. 159–165, May 2009.
[15] D. K. Fisher and H. A. Kebede, “A low-cost microcontroller-basedsystem to monitor crop temperature and water status,” Comput. Electron.Agricult., vol. 74, no. 1, pp. 168–173, Oct. 2010.
[16] Y. Kim, J. D. Jabro, and R. G. Evans, “Wireless lysimeters for real-time online soil water monitoring,” Irrigation Sci., vol. 29, no. 5,pp. 423–430, Sep. 2011.
[17] O. Mirabella and M. Brischetto, “A hybrid wired/wireless networkinginfrastructure for greenhouse management,” IEEE Trans. Instrum. Meas.,vol. 60, no. 2, pp. 398–407, Feb. 2011.
[18] I. F. Akyildiz, W. Su, Y. Sankarasubramaniam, and E. Cayirci, “A surveyon sensor networks,” IEEE Commun. Mag., vol. 40, no. 8, pp. 104–112,Aug. 2002.
[19] J. Yick, B. Mukherjee, and D. Ghosal, “Wireless sensor network survey,”Comput. Netw., vol. 52, no. 12, pp. 2292–2330, Aug. 2008.
[20] M. Winkler, K.-D. Tuchs, K. Hughes, and G. Barclay, “Theoretical andpractical aspects of military wireless sensor networks,” J. Telecommun.Inf. Technol., vol. 2, pp. 37–45, Apr./Jun. 2008.
[21] M. P. Durisic, Z. Tafa, G. Dimic, and V. Milutinovic, “A survey ofmilitary applications of wireless sensor networks,” in Proc. MECO,Jun. 2012, pp. 196–199.
[22] M. C. Rodríguez-Sánchez, S. Borromeo, and J. A. Hernández-Tamames,“Wireless sensor networks for conservation and monitoring culturalassets,” IEEE Sensors J., vol. 11, no. 6, pp. 1382–1389, Jun. 2011.
[23] G. López, V. Custodio, and J. I. Moreno, “LOBIN: E-textile andwireless-sensor-network-based platform for healthcare monitoring infuture hospital environments,” IEEE Trans. Inf. Technol. Biomed.,vol. 14, no. 6, pp. 1446–1458, Nov. 2010.
[24] J. M. Corchado, J. Bajo, D. I. Tapia, and A. Abraham, “Usingheterogeneous wireless sensor networks in a telemonitoring systemfor healthcare,” IEEE Trans. Inf. Technol. Biomed., vol. 14, no. 2,pp. 234–240, Mar. 2010.
[25] G. X. Lee, K. S. Low, and T. Taher, “Unrestrained measurement ofarm motion based on a wearable wireless sensor network,” IEEE Trans.Instrum. Meas., vol. 59, no. 5, pp. 1309–1317, May 2010.
[26] D.-M. Han and J.-H. Lim, “Smart home energy management systemusing IEEE 802.15.4 and ZigBee,” IEEE Trans. Consum. Electron.,vol. 56, no. 3, pp. 1403–1410, Aug. 2010.
[27] C. Gomez and J. Paradells, “Wireless home automation networks: Asurvey of architectures and technologies,” IEEE Commun. Mag., vol. 48,no. 6, pp. 92–101, Jun. 2010.
[28] M. Bertocco, G. Gamba, A. Sona, and S. Vitturi, “Experimental charac-terization of wireless sensor networks for industrial applications,” IEEETrans. Instrum. Meas., vol. 57, no. 8, pp. 1537–1546, Aug. 2008.
[29] V. C. Gungor and G. P. Hancke, “Industrial wireless sensor networks:Challenges, design principles, and technical approaches,” IEEE Trans.Ind. Electron., vol. 56, no. 10, pp. 4258–4265, Oct. 2009.
[30] L. Hou and N. W. Bergmann, “Novel industrial wireless sensor networksfor machine condition monitoring and fault diagnosis,” IEEE Trans.Instrum. Meas., vol. 61, no. 10, pp. 2787–2798, Oct. 2012.
[31] A. Carullo, S. Corbellini, M. Parvis, and A. Vallan, “A wireless sen-sor network for cold-chain monitoring,” IEEE Trans. Instrum. Meas.,vol. 58, no. 5, pp. 1405–1411, May 2009.
[32] A. Araujo, J. Garcia-Palacios, J. Blesa, F. Tirado, E. Romero,A. Samartin, and O. Nieto-Taladriz, “Wireless measurement systemfor structural health monitoring with high time-synchronization accu-racy,” IEEE Trans. Instrum. Meas., vol. 61, no. 3, pp. 801–810,Mar. 2012.
[33] P. Corke, T. Wark, R. Jurdak, H. Wen, P. Valencia, and D. Moore,“Environmental wireless sensor networks,” Proc. IEEE, vol. 98, no. 11,pp. 1903–1917, Nov. 2010.
[34] L. M. Oliveira and J. J. Rodrigues, “Wireless sensor networks: A surveyon environmental monitoring,” J. Commun., vol. 6, no. 2, pp. 143–151,Apr. 2011.
[35] H.-C. Lee, Y.-M. Fang, B.-J. Lee, and C.-T. King, “The tube: Arapidly deployable wireless sensor platform for supervising pollutionof emergency work,” IEEE Trans. Instrum. Meas., vol. 61, no. 10,pp. 2776–2786, Oct. 2012.
[36] H.-C. Lee, A. Banerjee, Y.-M. Fang, B.-J. Lee, and C.-T. King, “Designof a multifunctional wireless sensor for in-situ monitoring of debrisflows,” IEEE Trans. Instrum. Meas., vol. 59, no. 11, pp. 2958–2967,Nov. 2010.
[37] N. Wang, N. Zhang, and M. Wang, “Wireless sensors in agriculture andfood industry—Recent development and future perspective,” Comput.Electron. Agricult., vol. 50, no. 1, pp. 1–14, Jan. 2006.
[38] D. D. Chaudhary, S. P. Nayse, and L. M. Waghmare, “Application ofwireless sensor networks for green house parameters control in precisionagriculture,” Int. J. Wireless Mobile Netw., vol. 3, no. 1, pp. 140–149,Feb. 2011.
[39] P. Mariño, F. P. Fontan, M. A. Dominguez, and S. Otero, “An experi-mental ad-hoc WSN for the instrumentation of biological models,” IEEETrans. Instrum. Meas., vol. 59, no. 11, pp. 2936–2948, Nov. 2010.
[40] M. Johnson, M. Healy, P. van de Ven, M. J. Hayes, J. Nelson, T. Newe,and E. Lewis, “A comparative review of wireless sensor network motetechnologies,” in Proc. IEEE Sensors, Oct. 2009, pp. 1439–1442.
[41] J. S. Lee, Y. W. Su, and C. C. Shen, “A comparative study of wirelessprotocols: Bluetooth, UWB, ZigBee, and Wi-Fi,” in Proc. IEEE 33rdAnnu. Conf. IECON, Nov. 2007, pp. 46–51.
[42] M. R. Frankowiak, R. I. Grosvenor, and P. W. Prickett, “A reviewof the evolution of microcontroller-based machine and process mon-itoring,” Int. J. Mach. Tool Manuf., vol. 45, nos. 4–5, pp. 573–582,Apr. 2005.
[43] C. Kompis and P. Sureka, “Power management technologies to enableremote and wireless sensing,” ESP KTN, Teddington, U.K., Tech. Rep.,May 2010.
[44] M. T. Penella and M. Gasulla, “Runtime extension of low-power wirelesssensor nodes using hybrid-storage units,” IEEE Trans. Instrum. Meas.,vol. 59, no. 4, pp. 857–865, Apr. 2010.
[45] W. K. G. Seah, Z. A. Eu, and H.-P. Tan, “Wireless sensor networkspowered by ambient energy harvesting (WSN-HEAP)—Survey andchallenges,” in Proc. 1st Int. Conf. Wireless VITAE, May 2009, pp. 1–5.
[46] Y. K. Tan and S. K. Panda, “Self-autonomous wireless sensor nodeswith wind energy harvesting for remote sensing of wind-driven wildfirespread,” IEEE Trans. Instrum. Meas., vol. 60, no. 4, pp. 1367–1377,Apr. 2011.

176 IEEE TRANSACTIONS ON INSTRUMENTATION AND MEASUREMENT, VOL. 63, NO. 1, JANUARY 2014
[47] E. Sardini and M. Serpelloni, “Self-powered wireless sensor for air tem-perature and velocity measurements with energy harvesting capability,”IEEE Trans. Instrum. Meas., vol. 60, no. 5, pp. 1838–1844, May 2011.
[48] I. Marin, E. Arceredillo, A. Zuloaga, and J. Arias,“Wireless sensor networks: A survey on ultra-low power-aware design,” in Proc. WASET, vol. 8. Oct. 2005,pp. 1–6.
[49] S. Kolli and M. Zawodniok, “Energy-efficient multi-key security schemefor wireless sensor network,” in Proc. IEEE 34th Conf. LCN, Oct. 2009,pp. 937–944.
[50] J. Lin, W. Xiao, F. L. Lewis, and L. Xie, “Energy-efficient distributedadaptive multisensor scheduling for target tracking in wireless sensornetworks,” IEEE Trans. Instrum. Meas., vol. 58, no. 6, pp. 1886–1896,Jun. 2009.
[51] P. Györke and B. Pataki, “Energy-aware measurement scheduling inWSNs used in AAL applications,” IEEE Trans. Instrum. Meas., vol. 62,no. 5, pp. 1318–1325, May 2013.
[52] R. Yan, H. Sun, and Y. Qian, “Energy-aware sensor node design with itsapplication in wireless sensor networks,” IEEE Trans. Instrum. Meas.,vol. 62, no. 5, pp. 1183–1191, May 2013.
[53] Q. Wang, W. Yan, and Y. Shen, “N-person card game approach forsolving SET K-COVER problem in wireless sensor networks,” IEEETrans. Instrum. Meas., vol. 61, no. 5, pp. 1522–1535, May 2012.
[54] F. Pianegiani, M. Hu, A. Boni, and D. Petri, “Energy-efficient signalclassification in ad hoc wireless sensor networks,” IEEE Trans. Instrum.Meas., vol. 57, no. 1, pp. 190–196, Jan. 2008.
[55] C. Alippi, G. Anastasi, D. Francesco, and M. Roveri, “An adaptivesampling algorithm for effective energy management in wireless sensornetworks with energy-hungry sensors,” IEEE Trans. Instrum. Meas.,vol. 59, no. 2, pp. 335–344, Feb. 2010.
[56] P. Suriyachai, U. Roedig, and A. Scott, “A survey of MAC protocolsfor mission-critical applications in wireless sensor networks,” Commun.Surveys Tuts., vol. 14, no. 2, pp. 240–264, Apr./Jun. 2012.
[57] Wireless Medium Access Control (MAC) and Physical Layer (PHY)Specifications: Higher-Speed Physical Layer Extension in the 2.4 GHzBand, IEEE Standard 802.11b, 1999.
[58] Wireless Medium Access Control (MAC) and Physical Layer(PHY) Specifications for Wireless Personal Area Networks (WPANs),IEEE Standard 802.15.1, 2002.
[59] Wireless Medium Access Control (MAC) and Physical Layer (PHY)Specifications: High Rate Wireless Personal Area Networks (WPANs),IEEE Standard 802.15.3, 2003.
[60] Wireless Medium Access Control (MAC) and Physical Layer(PHY) Specifications for Low-Rate Wireless Personal Area Networks(LR-WPANs), IEEE Standard 802.15.4, 2003.
[61] Request for Comments (RFC) 4944-Transmission of IPv6 Packets overIEEE 802.15.4 Networks, Internet Eng. Task Force, Orlando, FL, USA,2007.
[62] J. E. Higuera and J. Polo, “IEEE 1451 standard in 6LoWPAN sensor net-works using a compact physical-layer transducer electronic datasheet,”IEEE Trans. Instrum. Meas., vol. 60, no. 8, pp. 2751–2758, Aug. 2011.
[63] Industrial Communication Network-Fieldbus Specifications-WirelessHART Communication Network and Communication Profile,Edition 1.0, Standard IEC/PAS 62591, 2009.
[64] Wireless Systems for Industrial Automation: Process Control and RelatedApplications, Standard ISA-100.11a-2009, 2009.
[65] P. Baronti, P. Pillai, V. W. C. Chook, S. Chessa, A. Gotta, and Y. F. Hu,“Wireless sensor networks: A survey on the state of the art and the802.15.4 and ZigBee standards,” Comput. Commun., vol. 30, no. 7, pp.1655–1695, May 2007.
[66] W. Guo, W. M. Healy, and Z. MengChu, “Impacts of 2.4-GHz ISMband interference on IEEE 802.15.4 wireless sensor network reliabilityin buildings,” IEEE Trans. Instrum. Meas., vol. 61, no. 9, pp. 2533–2544,Sep. 2012.
[67] N. Baker, “ZigBee and Bluetooth strengths and weaknesses for industrialapplications,” Comput. Control Eng. J., vol. 16, no. 2, pp. 20–25,Apr./May 2005.
Joaquín Gutiérrez received the Ph.D. degree inartificial intelligence from the Instituto Tecnológicoy de Estudios Superiores de Monterrey, Monterrey,México, in 2004.
He is a Researcher with the Centro de Investiga-ciones Biológicas del Noroeste, S.C., La Paz, BCS,México. His current research interests include thedevelopment and experimental validation of roboticsystems for biological research applications.
Juan Francisco Villa-Medina received the B.T.degree in computational engineering from InstitutoTecnológico de La Paz, México, in 2008.
He is a Technician with the Centro de Investiga-ciones Biológicas del Noroeste, S.C., La Paz, BCS,Mexico. His current research interests include thedevelopment of engineering systems.
Alejandra Nieto-Garibay received the Ph.D. degreein biology with a major in ecology from the CentroUniversitario de Ciencias Biológicas y Agropecuar-ias, Universidad de Guadalajara, Guadalajara, Méx-ico, in 2006.
She is a Researcher with the Centro de Inves-tigaciones Biológicas del Noroeste, S.C., La Paz,BCS, México, in the Agriculture Program. Her cur-rent research interests include the development andexperimental validation of agricultural technology insemi-arid environment.
Miguel Ángel Porta-Gándara received the Ph.D.degree in engineering from the Universidad NacionalAutónoma de México, México City, México, in1997.
He is a Researcher with the Centro de Investiga-ciones Biológicas del Noroeste, S.C., La Paz, BCS,Mexico. His current research interests include thedevelopment of engineering systems for biologicalresearch applications.