Embed Size (px)
Citation preview
Compiled by WS/FCS Department of Research & Evaluation i May 2015
WINSTON-SALEM/FORSYTH COUNTY SCHOOLS
LEA COMPREHENSIVE NEEDS ASSESSMENT 2013-2014
Compiled by the WS/FCS Research and Evaluation Department May 2015
Compiled by WS/FCS Department of Research & Evaluation ii February 2015
TABLE OF CONTENTS
Heading Page 1. Introduction ......................................................................................................................................................................... 1 2. Student and Community Demographics ............................................................................................................................. 3
3. WS/FC Community Demographics ......................................................................................................................... 3 4. WS/FCS Student Demographics ............................................................................................................................. 8 4. Attendance/Discipline ....................................................................................................................................................... 11 5. Student Achievement & Growth ........................................................................................................................................ 15 6. Perceptions of School ....................................................................................................................................................... 59 7. Professional Capacity ....................................................................................................................................................... 65 8. School Processes/Instructional Practices ......................................................................................................................... 71 9. Parent & Community Involvement .................................................................................................................................... 74 10. Broad Site Visit ................................................................................................................................................................. 76 11. Summary of LEA Findings ................................................................................................................................................ 77

Compiled by WS/FCS Department of Research & Evaluation iii February 2015
LIST OF FIGURES
Figure Page 1. Educational Attainment in 2010 .......................................................................................................................................... 4 2. Population By Racial Group in 2010 ................................................................................................................................... 4 3. Hispanic Population 2000-2010 .......................................................................................................................................... 5 4. Minority Population Change: 2000-2010 ............................................................................................................................ 5 5. Unemployment Rates Over Time for January of Each Year 2005-2014 ............................................................................. 6 6. Estimated Median Household Income 2000-2012 .............................................................................................................. 7 7. Children Living in Poverty 2002-2012 ................................................................................................................................. 7 8. WS/FCS Enrollment By Race/Ethnicity Over Time 2004-2015 ........................................................................................... 9 9. WS/FCS Elementary School Student Mobility Over Time: 2003-2013 ............................................................................. 10 10. WS/FCS Middle School Student Mobility Over Time: 2003-2013 ..................................................................................... 10 11. 4-Year Cohort Graduation Rate Over Time: 2007-2014 ................................................................................................... 11 12. Dropout Rate Over Time: 2006-2013 ................................................................................................................................ 12 13. Race/Ethnicity for Dropout Population vs. District High School Enrollment for 2012-2013 .............................................. 14 14. Graduation Rates By Subgroup: 2014 .............................................................................................................................. 15 15. Elementary Reading EOG Proficiencies (GLP) by Title I Status 2013-2014 .................................................................... 17 16. Middle Reading EOG Proficiencies (GLP) by Title I Status 2013-2014 ............................................................................ 17 17. Elementary Math EOG Proficiencies (GLP) by Title I Status 2013-2014 .......................................................................... 18 18. Middle Math EOG Proficiencies by Title I Status 2013-2014 ............................................................................................ 18 19. Science EOG Proficiencies by Title I Status 2013-2014 ................................................................................................... 19 20. High School EOC Proficiencies by Title I Status 2013-2014 ............................................................................................ 19 21. High School Indicators by Title I Status: 2013-2014 ......................................................................................................... 20 22. EVAAS Growth Status by Title I Status: 2013-2014 ......................................................................................................... 21 23. EVAAS School Composites by Title I Status: 2010-2014 ................................................................................................. 22 24. Federal and State AMO Targets: 2013-2014 .................................................................................................................... 23 25. WS/FCS DIBELS at Kindergarten Entrance Over Time: 2009-2014 ................................................................................ 24 26. WS/FCS DIBELS Kindergarten Gains Over Time: 2009-2014 ......................................................................................... 25
Compiled by WS/FCS Department of Research & Evaluation iv February 2015
27. WS/FCS DIBELS First Grade Gains Over Time: 2009-2014 ............................................................................................ 26 28. WS/FCS DIBELS Second Grade Gains Over Time: 2009-2014 ....................................................................................... 27 29. WS/FCS TRC Gains Over Time: 2013-2014 .................................................................................................................... 28 30. WS/FCS EVAAS School Composites By Level: 2011-2014 ............................................................................................. 29 31. WS/FCS EVAAS Elementary Reading Composites 2013-2014 ....................................................................................... 30 32. WS/FCS EVAAS Middle Reading Composites 2013-2014 ............................................................................................... 31 33. WS/FCS EVAAS Elementary Math Composites 2013-2014 ............................................................................................. 32 34. WS/FCS EVAAS Middle Math Composites 2013-2014 .................................................................................................... 33 35. WS/FCS EVAAS Elementary & Middle Science Composites 2013-2014 ......................................................................... 34 36. WS/FCS EVAAS EOC Composites 2013-2014 ................................................................................................................ 35 37. WS/FCS EVAAS ACT Composites 2013-2014 Part A ...................................................................................................... 36 38. WS/FCS EVAAS ACT Composites 2013-2014 Part B ...................................................................................................... 36 39. Racial/Ethnic Subgroup Achievement Gaps for Elementary Reading (GLP): 2009-2014 ................................................ 38 40. Subgroup Achievement Gaps for Elementary Math (GLP): 2009-2014 ............................................................................ 38 41. Racial/Ethnic Subgroup Achievement Gaps for Middle Math (GLP): 2009-2014 ............................................................. 39 42. Subgroup Achievement Gaps for Middle Reading (GLP): 2009-2014 .............................................................................. 39 43. Racial/Ethnic Subgroup Achievement Gaps for Algebra I: 2008-2014 ............................................................................. 40 44. Racial/Ethnic Subgroup Achievement Gaps for Biology: 2008-2014 ................................................................................ 41 45. Racial/Ethnic Subgroup Achievement Gaps for English I: 2008-2014 .............................................................................. 41 46. Subgroup Achievement Gaps for Algebra I: 2008-2014 ................................................................................................... 42 47. Grades 3-5 Reading Proficiency by Ethnicity and LEP Status for 2012-2013 & 2013-2014 ............................................. 43 48. Grades 6-8 Math Proficiency by Ethnicity and LEP Status for 2012-2013 & 2013-2014 .................................................. 44 49. Elementary Math Proficiency by Ethnicity, LEP, and FRL Status for 2013-2014 .............................................................. 45 50. English II Proficiency by Ethnicity, LEP and FRL Status for 2013-2014 ........................................................................... 45 51. Middle School Reading Proficiency by Ethnicity, LEP and FRL Status for 2013-2014 ..................................................... 46 52. Elementary Science Proficiency by Ethnicity, LEP, and Title I Status for Economically-Disadvantaged (FRL) Students for 2013-2014 .............................................................................................. 47 53. Elementary & Middle Reading Goal Summaries 2013-2014 ............................................................................................ 48 54. Elementary & Middle Math Goal Summaries 2013-2014 .................................................................................................. 49

Compiled by WS/FCS Department of Research & Evaluation v February 2015
55. Elementary Math Goal Summaries 2013-2014 ................................................................................................................. 50 56. Middle Math Goal Summaries 2013-2014 ....................................................................................................................... 50 57. Elementary & Middle Physical Science Goal Summaries 2013-2014 ............................................................................... 51 58. Elementary & Middle Earth Science Goal Summaries 2013-2014 ................................................................................... 52 59. Elementary & Middle Life Science Goal Summaries 2013-2014 ...................................................................................... 52 60. Biology Goal Summaries 2013-2014 ................................................................................................................................ 53 61. English II Goal Summaries 2013-2014 ............................................................................................................................. 54 62. Math I Goal Summaries 2013-2014 Part A ....................................................................................................................... 55 63. Math I Goal Summaries 2013-2014 Part B ....................................................................................................................... 55 64. Average Scores on ACT: 2014 ......................................................................................................................................... 56 65. ACT College Readiness: 2014 .......................................................................................................................................... 57 66. Mean ACT Composite Scores by Racial/Ethnic Subgroups: 2014 ................................................................................... 58 67. ACT College Readiness by Racial/Ethnic Group: 2014 .................................................................................................... 58 68. WS/FCS Student Survey Responses over Time (2005 to 2014):
I feel safe at this school ..................................................................................................................................................... 59 69. WS/FCS Student Survey Responses over Time (2005 to 2014): Harassment and Bullying Problem at My School ................................................................................................................. 60 70. WS/FCS Student Survey Responses Over Time (2005 to 2014):
Adults Treat Students with Respect .................................................................................................................................... 61 71. WS/FCS Student Survey Responses Over Time (2005 to 2014): I Feel Like I am Part of This School ..................................................................................................................................... 62 72. NC Teacher Working Conditions Survey Key Indicators: 2014 ........................................................................................ 63 73. NC Educator Evaluation System Ratings of 3,506 WS/FCS Teachers: 2013 .................................................................. 66 74. EVAAS Teacher Effectiveness Ratings Over Two Years: 2013 to 2014 .......................................................................... 67 75. NC Educator Evaluation System Ratings of 181 WS/FCS School Leaders: 2013 ........................................................... 69 76. EVAAS Growth Over Time for Petree Elementary: 2007-2014 ........................................................................................ 72 77. EVAAS Growth Over Time for John F. Kennedy High: 2007-2014 ................................................................................... 72 78. EVAAS Growth Over Time for Forest Park Elementary: 2007-2014 ................................................................................ 73 79. WS/FCS Title I Parent Survey Results: 2014 Part A ........................................................................................................ 75 80. WS/FCS Title I Parent Survey Results: 2014 Part B ........................................................................................................ 75
Compiled by WS/FCS Department of Research & Evaluation vi February 2015
LIST OF TABLES
Table Page 1. WS/FCS DIBELS NEXT by Cohort at End of Year ............................................................................................................ 27 2. Teacher Working Conditions (TWC) Survey Construct Indicator Worksheet: 2014 .......................................................... 64 3. Teacher Turnover Rates: 2012-2013 .................................................................................................................................. 65 4. Average Number of National Board Certified Teachers Per School: 2012-2013 ................................................................ 65 5. Patterns of Teacher Effectiveness by Level and Subject: 2013-2014 ................................................................................ 68 6. Rankings of Professional Development Needs Based on Spring 2014 Survey of Teachers and Principals ................................................................................................................................................. 70
Compiled by WS/FCS Department of Research & Evaluation 1 May 2015
WINSTON-SALEM/FORSYTH COUNTY SCHOOLS LEA COMPREHENSIVE NEEDS ASSESSMENT
2013-2014
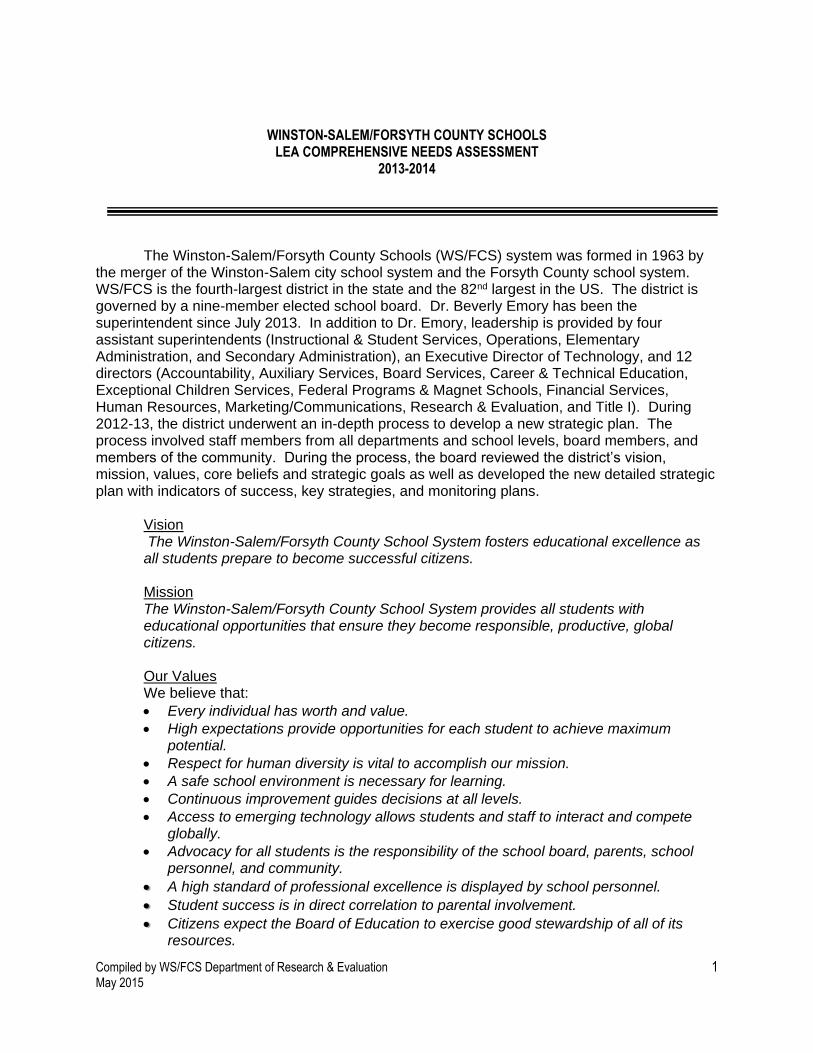
The Winston-Salem/Forsyth County Schools (WS/FCS) system was formed in 1963 by the merger of the Winston-Salem city school system and the Forsyth County school system. WS/FCS is the fourth-largest district in the state and the 82nd largest in the US. The district is governed by a nine-member elected school board. Dr. Beverly Emory has been the superintendent since July 2013. In addition to Dr. Emory, leadership is provided by four assistant superintendents (Instructional & Student Services, Operations, Elementary Administration, and Secondary Administration), an Executive Director of Technology, and 12 directors (Accountability, Auxiliary Services, Board Services, Career & Technical Education, Exceptional Children Services, Federal Programs & Magnet Schools, Financial Services, Human Resources, Marketing/Communications, Research & Evaluation, and Title I). During 2012-13, the district underwent an in-depth process to develop a new strategic plan. The process involved staff members from all departments and school levels, board members, and members of the community. During the process, the board reviewed the district’s vision, mission, values, core beliefs and strategic goals as well as developed the new detailed strategic plan with indicators of success, key strategies, and monitoring plans.
Vision The Winston-Salem/Forsyth County School System fosters educational excellence as all students prepare to become successful citizens. Mission The Winston-Salem/Forsyth County School System provides all students with educational opportunities that ensure they become responsible, productive, global citizens.
Our Values We believe that:
Every individual has worth and value.
High expectations provide opportunities for each student to achieve maximum potential.
Respect for human diversity is vital to accomplish our mission.
A safe school environment is necessary for learning.
Continuous improvement guides decisions at all levels.
Access to emerging technology allows students and staff to interact and compete globally.
Advocacy for all students is the responsibility of the school board, parents, school personnel, and community.
A high standard of professional excellence is displayed by school personnel.
Student success is in direct correlation to parental involvement.
Citizens expect the Board of Education to exercise good stewardship of all of its resources.
Compiled by WS/FCS Department of Research & Evaluation 2 February 2015
Core Beliefs
Educate -- All children have the capacity to grow, learn, and flourish.
Engage -- The most effective education engages the students and their families, schools, and the community.
Invest -- Quality education is worth the investment.
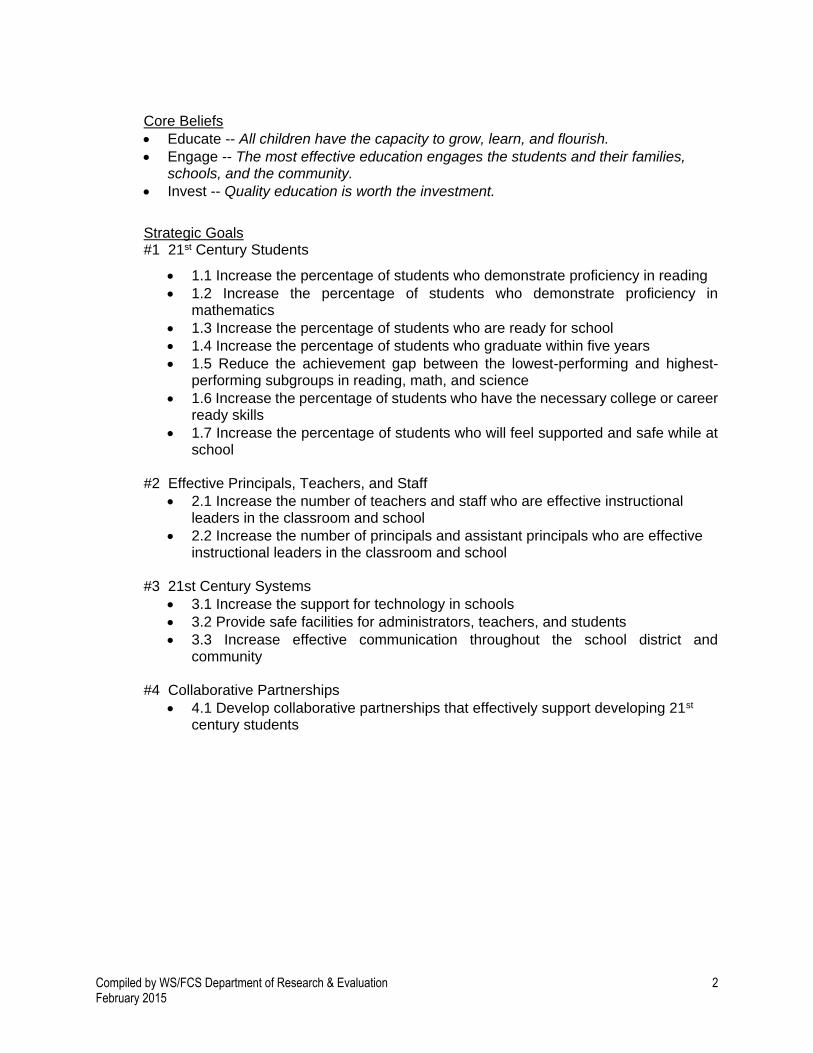
Strategic Goals #1 21st Century Students
1.1 Increase the percentage of students who demonstrate proficiency in reading
1.2 Increase the percentage of students who demonstrate proficiency in mathematics
1.3 Increase the percentage of students who are ready for school
1.4 Increase the percentage of students who graduate within five years
1.5 Reduce the achievement gap between the lowest-performing and highest-performing subgroups in reading, math, and science
1.6 Increase the percentage of students who have the necessary college or career ready skills
1.7 Increase the percentage of students who will feel supported and safe while at school
#2 Effective Principals, Teachers, and Staff
2.1 Increase the number of teachers and staff who are effective instructional leaders in the classroom and school
2.2 Increase the number of principals and assistant principals who are effective instructional leaders in the classroom and school
#3 21st Century Systems
3.1 Increase the support for technology in schools
3.2 Provide safe facilities for administrators, teachers, and students
3.3 Increase effective communication throughout the school district and community
#4 Collaborative Partnerships
4.1 Develop collaborative partnerships that effectively support developing 21st century students
Compiled by WS/FCS Department of Research & Evaluation 3 February 2015
Student and Community Demographics WS/FC Community Demographics Forsyth County is located in the Piedmont region of the northwestern area of North Carolina. According to 2012 census estimates, the county has a population of over 358,000, a 2% increase from 2010 census figures. About two-thirds of the county population lives in the largest city of Winston-Salem (2012 estimate is over 234,000). Winston-Salem is the fifth largest city in North Carolina behind Charlotte, Raleigh, Greensboro, and Durham. Kernersville is the largest suburban area in Forsyth County with a town population of over 23,000. The town of Salem was first settled during the colonial period in 1753 by Moravians immigrating south. A short distance away, the town of Winston was established in 1849 as the county seat of the newly formed Forsyth County. The two municipalities merged as Winston-Salem in 1913 and last year celebrated their centennial anniversary. Over the years, Winston-Salem has been known for its manufacturing of tobacco (notably RJ Reynolds, Inc.) and hosiery products (Hanes Brands, Inc.), its financial institutions (corporate headquarters of BB&T and former corporate headquarters of Wachovia Bank), and donuts (home of Krispy Kreme). It is also known for its arts community, having organized the first Arts Council in the US in the 1950s and spearheading the national movement for community arts councils. The city is home to the nationally-recognized UNC School of the Arts, a public performing arts high school and college. In addition, there are several other higher education institutions within the city that serve as resources for district schools and students. Winston-Salem State University (WSSU) with an enrollment of 6,163 is a historically-black public university founded in 1892. WSSU has been ranked among the top public comprehensive colleges in the South. Salem College, founded for women in 1772, is the 13th oldest college in the United States. While a small school, with an enrollment of 1,100, the college provides opportunities for WS/FCS personnel to earn Masters degrees in teaching and education. Forsyth Technical Community College, with an enrollment of over 13,000, serves the county and surrounding area with over 200 programs offered in 9 locations. Finally, Wake Forest University, a small school of about 7,400 students, is considered a major research institution and among the top 25 universities in the nation. In addition to its undergraduate program, Wake Forest has graduate schools in Business, Law, Divinity, and Medicine. The Wake Forest Baptist Medical Center is the largest employer in the county. Perhaps due to having multiple institutions of higher learning within Forsyth County, the educational level in the county is slightly higher than that in the state of North Carolina and the US overall. Over 31% of Forsyth County residents have a Bachelor’s degree or higher compared to 26% for the state and 28% for the US. Conversely, slightly fewer people in Forsyth County (13%) have less than a high school diploma compared to the state (15%) and the nation (14%) [see Figure 1].
According to the 2010 census data, Forsyth County has a higher percentage of minorities (41%) than either North Carolina (35%) or the United States (36%) (see Figure 2). The Hispanic population in Forsyth County, similar to the state of North Carolina, doubled in the decade from 2000 to 2010, outpacing the increase seen in the US as a whole (see Figure 3). About 12% of the current population in Forsyth County is Hispanic. Likewise, the minority population growth in Forsyth County is 1.5 times the increase in North Carolina and the United States as a whole (see Figure 4).

Compiled by WS/FCS Department of Research & Evaluation 4 February 2015
Figure 1. Educational Attainment in 2010
Figure 2. Population By Racial Group in 2010
0
10
20
30
40
50
60
70
80
90
100
United States North Carolina Forsyth County
Perc
en
t o
f A
du
lts ≥
25 y
ears
< HS Grad HS Grad Some college BA or higher
0
10
20
30
40
50
60
70
80
90
100
United States North Carolina Forsyth County
Perc
en
t o
f P
op
ula
tio
n
White Black Multi Other
*Data Retrieved from 2012 US Census Report
*Data Retrieved from 2012 US Census Report

Compiled by WS/FCS Department of Research & Evaluation 5 February 2015
Figure 3. Hispanic Population: 2000-2010
Figure 4. Minority Population Change: 2000-2010
0
2
4
6
8
10
12
14
16
18
20
2000 2010 2000 2010 2000 2010
United States North Carolina Forsyth County
Perc
en
t o
f P
op
ula
tio
n
0
10
20
30
40
50
60
70
80
90
100
2000 2010 2000 2010 2000 2010
United States North Carolina Forsyth County
Perc
en
t o
f P
op
ula
tio
n
Non-Hispanic White Minority
*Data Retrieved from 2012 US Census Report
*Data Retrieved from 2012 US Census Report

Compiled by WS/FCS Department of Research & Evaluation 6 February 2015
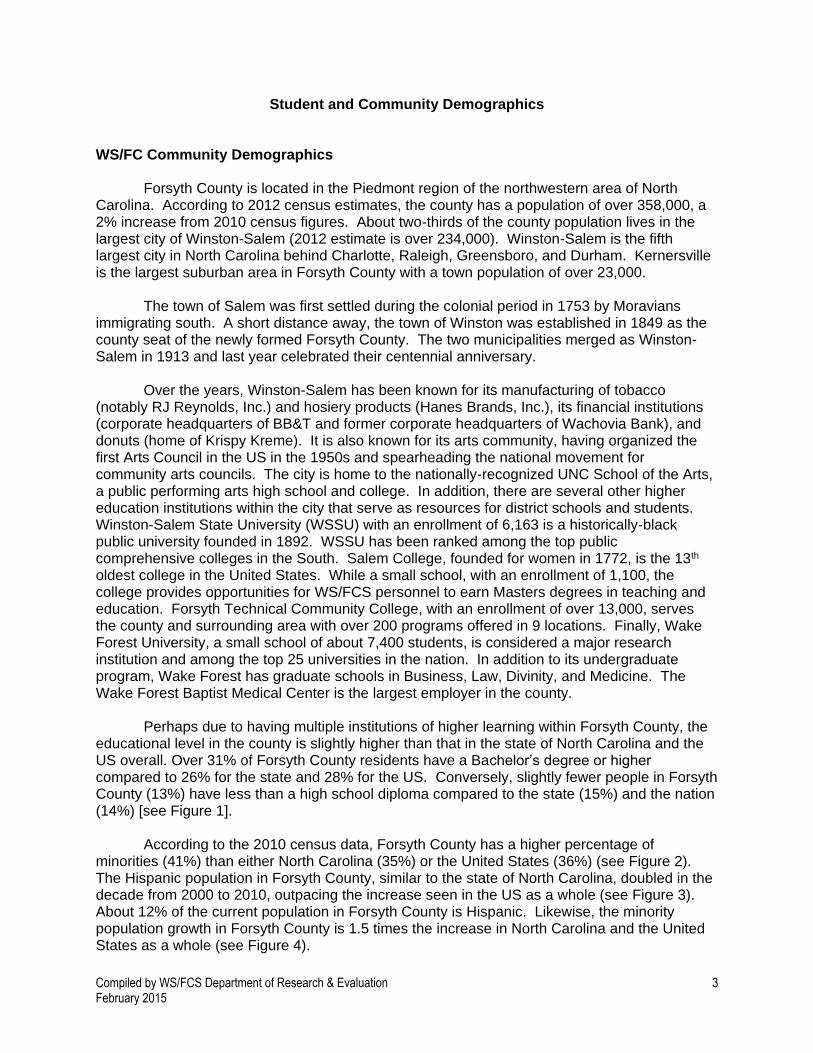
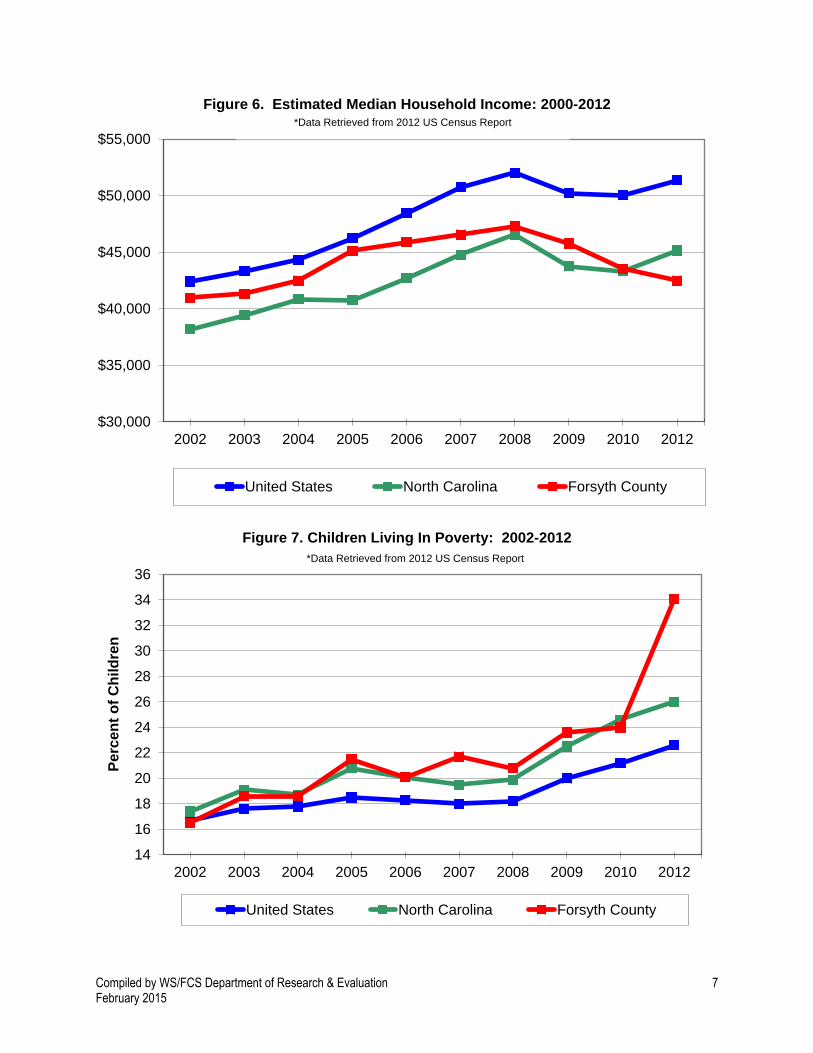
Economic indicators for Forsyth County reflect the downturn in the economy experienced across the nation. Employment is down and unemployment up (see Figure 5), but the situation is improving. The unemployment rates in Forsyth County closely mirror the rates in the US and NC. Unemployment peaked in 2010 and has been slowly decreasing since, having dropped 5 percentage points since the 2010 peak and is now just 1.5 points higher than January 2008. The consequences of our high unemployment over the past few years are reflected in a drop in median household income (see Figure 6) and a rise in children living in poverty (see Figure 7).
Figure 5. Unemployment Rates Over Time for January of Each Year 2005-2014
0
2
4
6
8
10
12
14
16
2005 2006 2007 2008 2009 2010 2011 2012 2013 2014
Perc
en
t o
f L
ab
or
Fo
rce
United States North Carolina Forsyth County
*Data Retrieved from 2012 US Census Report
Compiled by WS/FCS Department of Research & Evaluation 7 February 2015
Figure 6. Estimated Median Household Income: 2000-2012
Figure 7. Children Living In Poverty: 2002-2012
$30,000
$35,000
$40,000
$45,000
$50,000
$55,000
2002 2003 2004 2005 2006 2007 2008 2009 2010 2012
United States North Carolina Forsyth County
14
16
18
20
22
24
26
28
30
32
34
36
2002 2003 2004 2005 2006 2007 2008 2009 2010 2012
Perc
en
t o
f C
hil
dre
n
United States North Carolina Forsyth County
*Data Retrieved from 2012 US Census Report
*Data Retrieved from 2012 US Census Report
Compiled by WS/FCS Department of Research & Evaluation 8 February 2015
While Forsyth County is experiencing difficult economic times, the community still has a multitude of resources that assist the school district financially and with human capital. For example, the United Way has led the effort to improve graduation rates in the district with its Graduating Our Future initiative which involves Big Brothers/Big Sisters, Catholic Social Services, Crosby Scholars Community Partnership, Imprints for Families, Mediation Services, Old Hickory Council of the Boy Scouts of America, The Salvation Army, Tarheel Triad Girl Scouts, YMCA of Northwest North Carolina, and YWCA of Greater Winston-Salem. For the past several years, the Community Education Collaborative (CEC) partnered with the district to support graduation efforts such as Graduate. It pays. Big Brothers/Big Sisters has provided mentors for repeat ninth graders while Communities in Schools has worked with tenth and eleventh graders who have failed two or more courses. The Winston-Salem Chamber of Commerce has coordinated the Senior Academy Program which provides mentors for high school seniors in jeopardy of dropping out, to encourage graduation and higher education/career planning. The W-S Chamber also recruited about 300 volunteers to improve the literacy skills of K-2nd grade students in 16 Title 1 schools. The Women’s Leadership Council of the United Way has been involved in large-scale tutoring efforts at several schools. Local higher education institutions (Forsyth Technical Community College, Salem College, UNC-Greensboro, Wake Forest University, Winston-Salem State University) have partnered with the district on a variety of projects in literacy, math, science, STEM (Science, Technology, Engineering, and Math), arts education, language education, etc. Additional community agencies such as the Arts Council, Forsyth County Department of Public Health, Forsyth Education Partnership, Forsyth Futures, Hispanic Interaction, Kate B. Reynolds Charitable Trust, Northwest Child Development Council, Wake Forest University School of Medicine, and the YMCA have collaborated with the district and individual schools on a number of different initiatives. In the past year, led by the United Way and Forsyth Futures, the community has formed Forsyth Promise which, in turn, has organized the Forsyth County Cradle to Career Partnership. This partnership has selected two areas of focus for its initial efforts: early childhood literacy and high school graduation. These efforts will directly and indirectly positively impact students in our school system. Finally, the community has provided the district with 1,700 business partners contributing over $1.6 million in goods and services to support to the schools and over 13,250 volunteers providing 434,031 volunteer hours during the 2013-14 school year. WS/FCS Student Demographics
WS/FCS serves approximately 54,064 students in grades K-12 with an additional 1,100 children served in pre-K programs. The district has a total of 81 schools: 44 elementary schools, one K-8 school, 15 middle schools, 15 high schools, four schools serving grades 6-12 plus a hospital/ homebound education center. The district also has a Career Center which serves as an extension of the regular high school program offering 34 AP courses, 37 career/technical education courses, and 24 other special courses. Exceptional Children (EC), also referred to as Students With Disabilities (SWD), represent 12% of the WS/FCS K-12 student population. Of the 6,417 identified students, 930 (14.5%) are in a separate setting. Clearly, the majority of our EC students are served through inclusion.
WS/FCS employs about 7,600 people, including about 4,000 classroom and part-time
teachers. Students are also served by about 420 bus drivers, 575 food-service workers, 300 housekeepers, and a network of administrators, principals, guidance counselors, psychologists, social workers and other staff. A number of schools in the district will be participants in major funding initiatives during the upcoming academic year. For 2014-2015, 45 schools (28 elementary and 17 secondary) will have school-wide Title I programs. Two of these Title I
Compiled by WS/FCS Department of Research & Evaluation 9 February 2015
schools, Cook Elementary and Forest Park Elementary, are recipients of School Improvement Grants (SIG) from the state of North Carolina; Forest Park is completing the third and final year of its SIG grant while Cook is finishing its first year as a SIG school . Eight Title I schools have been targeted with Race to the Top funding for the past 3 years; the funding ends this summer (2014). STAR3 (School Transformation by Actively Recruiting, Rewarding, and Retaining), another major initiative, will continue through the 2014-15 academic year: 15 Title I schools (12 elementary / 3 middle) are participating in this 5-year Teacher Incentive Fund federal grant. In addition, 18 schools in the district have magnet programs focusing on areas such as STEM, IB, multiple intelligences, career academies, visual and performing arts, international studies, dual language immersion, and college prep.
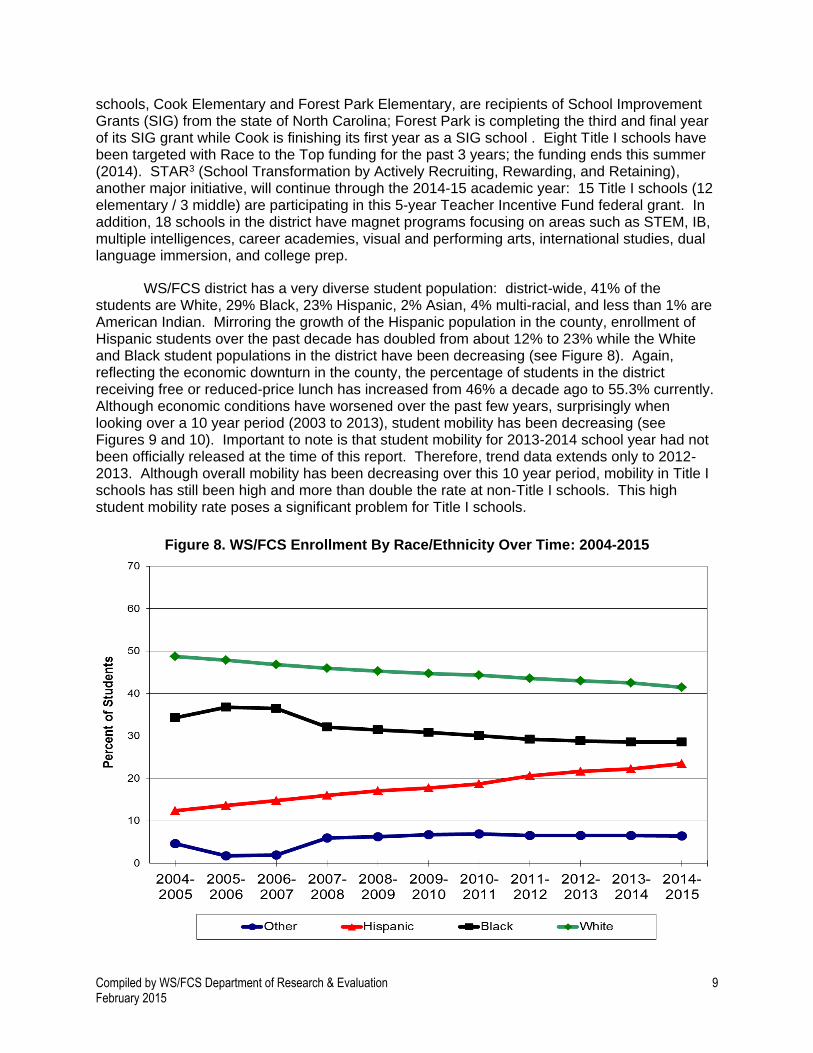
WS/FCS district has a very diverse student population: district-wide, 41% of the students are White, 29% Black, 23% Hispanic, 2% Asian, 4% multi-racial, and less than 1% are American Indian. Mirroring the growth of the Hispanic population in the county, enrollment of Hispanic students over the past decade has doubled from about 12% to 23% while the White and Black student populations in the district have been decreasing (see Figure 8). Again, reflecting the economic downturn in the county, the percentage of students in the district receiving free or reduced-price lunch has increased from 46% a decade ago to 55.3% currently. Although economic conditions have worsened over the past few years, surprisingly when looking over a 10 year period (2003 to 2013), student mobility has been decreasing (see Figures 9 and 10). Important to note is that student mobility for 2013-2014 school year had not been officially released at the time of this report. Therefore, trend data extends only to 2012-2013. Although overall mobility has been decreasing over this 10 year period, mobility in Title I schools has still been high and more than double the rate at non-Title I schools. This high student mobility rate poses a significant problem for Title I schools.
Figure 8. WS/FCS Enrollment By Race/Ethnicity Over Time: 2004-2015

Compiled by WS/FCS Department of Research & Evaluation 10 February 2015
Figure 9. WS/FCS Elementary School Student Mobility Over Time: 2003-2013
Figure 10. WS/FCS Middle School Student Mobility Over Time:2003-2013
0
5
10
15
20
25
30
35
40
45
50
2003-2004
2004-2005
2005-2006
2006-2007
2007-2008
2008-2009
2009-2010
2010-2011
2011-2012
2012-2013
Stu
de
nt
Mo
bil
ity R
ate
Title I Schools Non Title I Schools
0
5
10
15
20
25
30
35
40
45
50
2003-2004
2004-2005
2005-2006
2006-2007
2007-2008
2008-2009
2009-2010
2010-2011
2011-2012
2012-2013
Stu
de
nt
Mo
bil
ity R
ate
Title I Schools Non Title I Schools
Compiled by WS/FCS Department of Research & Evaluation 11 February 2015
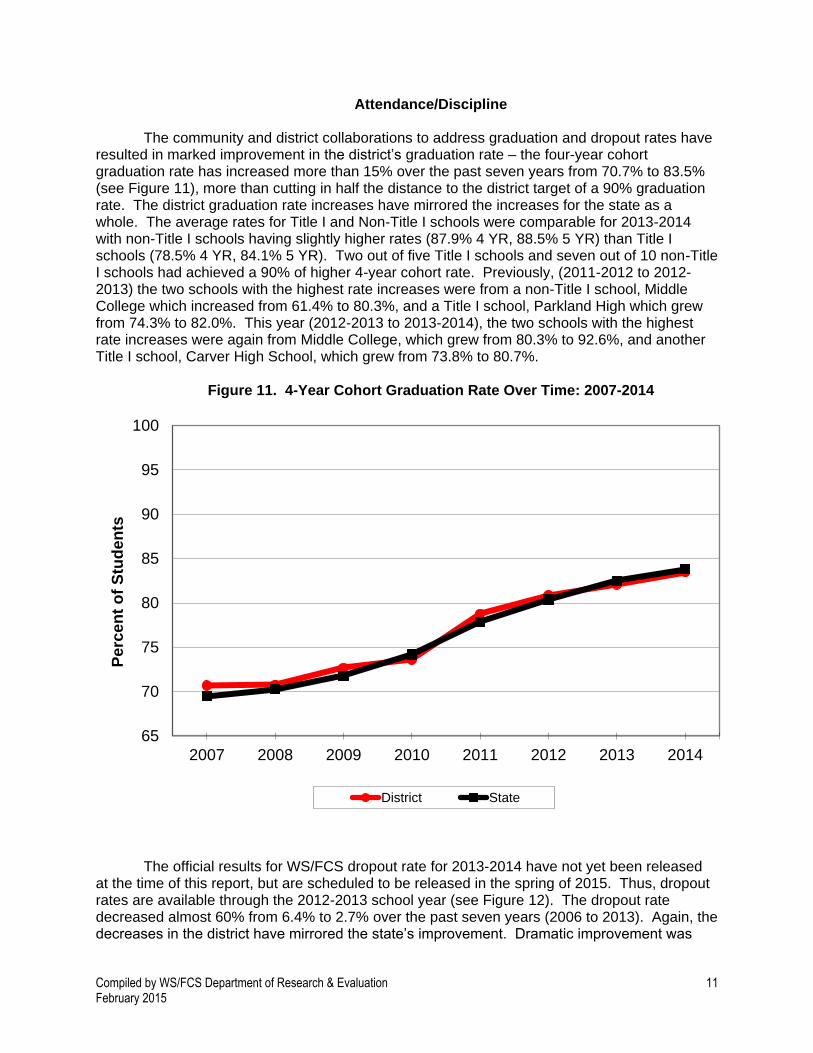
Attendance/Discipline The community and district collaborations to address graduation and dropout rates have
resulted in marked improvement in the district’s graduation rate – the four-year cohort graduation rate has increased more than 15% over the past seven years from 70.7% to 83.5% (see Figure 11), more than cutting in half the distance to the district target of a 90% graduation rate. The district graduation rate increases have mirrored the increases for the state as a whole. The average rates for Title I and Non-Title I schools were comparable for 2013-2014 with non-Title I schools having slightly higher rates (87.9% 4 YR, 88.5% 5 YR) than Title I schools (78.5% 4 YR, 84.1% 5 YR). Two out of five Title I schools and seven out of 10 non-Title I schools had achieved a 90% of higher 4-year cohort rate. Previously, (2011-2012 to 2012-2013) the two schools with the highest rate increases were from a non-Title I school, Middle College which increased from 61.4% to 80.3%, and a Title I school, Parkland High which grew from 74.3% to 82.0%. This year (2012-2013 to 2013-2014), the two schools with the highest rate increases were again from Middle College, which grew from 80.3% to 92.6%, and another Title I school, Carver High School, which grew from 73.8% to 80.7%.
Figure 11. 4-Year Cohort Graduation Rate Over Time: 2007-2014
The official results for WS/FCS dropout rate for 2013-2014 have not yet been released
at the time of this report, but are scheduled to be released in the spring of 2015. Thus, dropout rates are available through the 2012-2013 school year (see Figure 12). The dropout rate decreased almost 60% from 6.4% to 2.7% over the past seven years (2006 to 2013). Again, the decreases in the district have mirrored the state’s improvement. Dramatic improvement was
65
70
75
80
85
90
95
100
2007 2008 2009 2010 2011 2012 2013 2014
Perc
en
t o
f S
tud
en
ts
District State

Compiled by WS/FCS Department of Research & Evaluation 12 February 2015
made over two school years (2011-2013) in two schools, one Title I and one non-Title I. Carver High, a Title I school, decreased its dropout rate by over 40% from 10.46% in 2011-2012 to 5.84% in 2012-2013. The Middle College experienced a 95% decrease from 25.56% in 2011-2012 to 1.19% in 2012-2013.
Figure 12. Dropout Rate Over Time: 2006-2013
Several district-wide efforts have simultaneously positively impacted the graduation and dropout rates. Graduate. It Pays (GIP), a community collaboration created to support the success of every student, incorporates three mentoring programs that serve identified struggling students in grades 9-12. Through the WS Chamber of Commerce, adult mentors assist seniors who are in danger of not graduating “on-time”. Communities in Schools pairs college seniors majoring in Social Work with struggling high school juniors and sophomores. Finally, Big Brothers/Big Sisters provides adult mentors for students who are repeating the ninth grade.
An effort begun in 2012-2013 that had an impact on the dropout rate was TRACS (Technology Reaching All Children Systematically), an Early Warning Tracking system developed by the Office of Dropout Prevention and the Technology Department within WS/FCS. Using known indicators, TRACS automatically generated a list of K-12 students who were considered at risk of becoming off-track to graduate with their cohort. This list of students was provided to schools on a weekly basis throughout the academic year. However, with the change from NCWise to Power School, the TRACS system was not compatible. The Research and Evaluation team revamped the program so that it could use Power School data. Currently, the Research and Evaluation team provides schools with a similar list quarterly throughout the academic school year. Important to note is that the TRACS system was based on national predictors of high school dropout while the new system is based on WS/FCS district-level data.
0
1
2
3
4
5
6
7
8
9
10
2006-2007 2007-2008 2008-2009 2009-2010 2010-2011 2011-2012 2012-2013
Perc
en
t o
f S
tud
en
ts
District State

Compiled by WS/FCS Department of Research & Evaluation 13 February 2015
Another effort begun in 2012-2013 that had an impact on the dropout rate was FACE (Forsyth Academy for Continuing Education), a joint venture by the Student Services Office of Dropout Prevention and Alternative Education. FACE, created to actively recruit dropouts to return to school and complete graduation requirements, included personalized education and career planning combined with strong academic support, differentiated instruction, a positive learning environment with staff mentor relationships, flexible scheduling, with day courses offered at their home school and evening courses offered at the Career Center, online, and within a blended model.
The WS/FCS Office of Dropout Prevention, Intervention and Recovery worked closely with the Forsyth Middle College to address their dropout problem. During 2012-2013, the Middle College implemented an in-house mentoring program that paired a faculty or staff member with each senior. The Research and Evaluation department conducted a full scale evaluation in 2013-2014 of the program and found that 24 students graduated as a result of FACE, 11 were on track to graduate in 2015, and 27 dropped out of FACE or did not complete the graduation requirements.
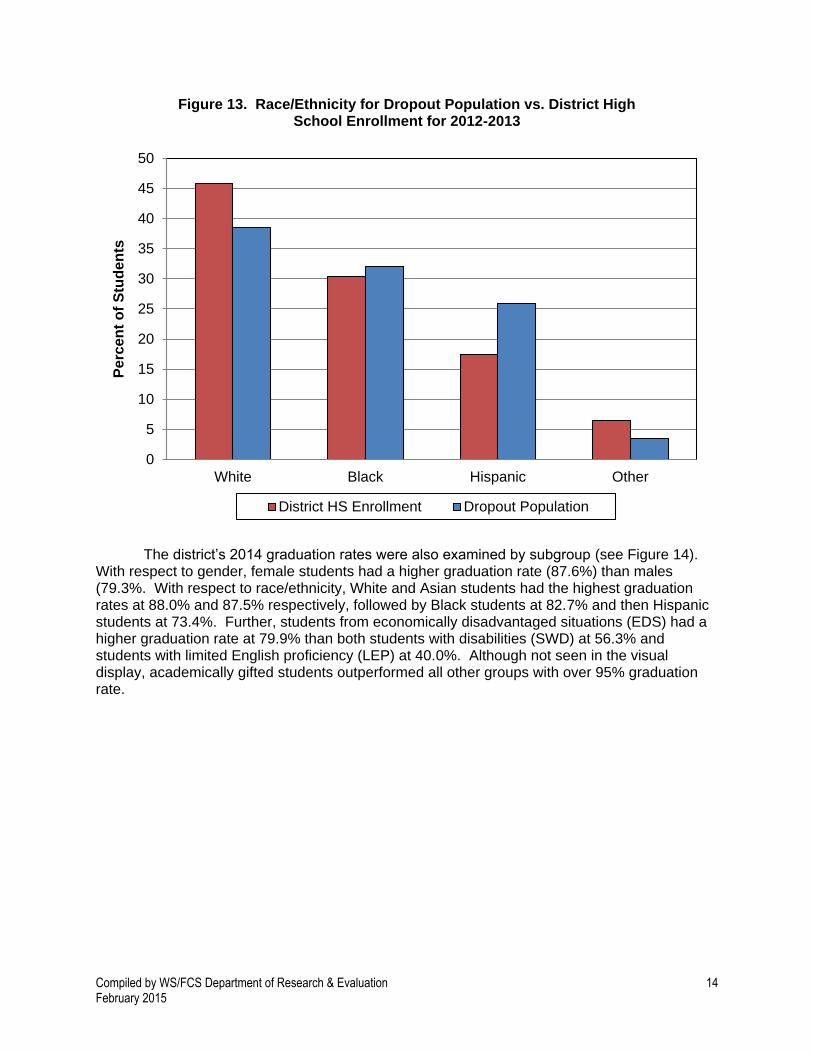
As mentioned previously, official dropout rates for 2013-2014 were not available at the time this report was generated, but are scheduled to be released in the spring of 2015. However, when viewing the previous year’s (2012-2013) district dropout data, racial/ethnic gaps were apparent. The proportion of each racial/ethnic group among the district’s 2013 dropout population was compared with the proportion in the district’s 2013 high school student population as a whole. The analysis revealed that White students were under-represented in the dropout population, that Black students were slightly over-represented, and that Hispanic students were very over-represented. For example, Hispanic students represented 26% of the dropout population but only 17% of all high school students. Conversely, white students comprised 46% of all high school students but only 38% of all dropouts (see Figure 13). With all racial/ethnic groups, males had higher dropout rates than females. Male rates were double female rates for Black and Hispanic students: Black Male dropout rate was 21.2% compared to 10.9% for Black Females; Hispanic Male dropout rate was 17.5% versus Hispanic Female rate of 8.4%.
Compiled by WS/FCS Department of Research & Evaluation 14 February 2015
Figure 13. Race/Ethnicity for Dropout Population vs. District High School Enrollment for 2012-2013
The district’s 2014 graduation rates were also examined by subgroup (see Figure 14). With respect to gender, female students had a higher graduation rate (87.6%) than males (79.3%. With respect to race/ethnicity, White and Asian students had the highest graduation rates at 88.0% and 87.5% respectively, followed by Black students at 82.7% and then Hispanic students at 73.4%. Further, students from economically disadvantaged situations (EDS) had a higher graduation rate at 79.9% than both students with disabilities (SWD) at 56.3% and students with limited English proficiency (LEP) at 40.0%. Although not seen in the visual display, academically gifted students outperformed all other groups with over 95% graduation rate.
0
5
10
15
20
25
30
35
40
45
50
White Black Hispanic Other
Perc
en
t o
f S
tud
en
ts
District HS Enrollment Dropout Population

Compiled by WS/FCS Department of Research & Evaluation 15 February 2015
Figure 14. Graduation Rates By Subgroup: 2014
Student Achievement and Growth
The new North Carolina READY Accountability Model combines measures of student performance and measures of student growth. Every school receives an EVAAS School Accountability Growth Status indicating that they have Exceeded Expected Growth, Met Expected Growth, or Not Met Expected Growth. All schools also receive a Performance Composite based on percent of End-of-Grade (EOG) and End-of-Course (EOC) tests scored at the proficient level. Elementary schools administer reading and math EOGs in Grades 3-5 and a science EOG in Grade 5. Likewise, middle schools administer reading and math EOGs in Grades 6-8 and a science EOG in Grade 8; middle schools also administer a Math I EOC. High school students take EOCs in Math I, Biology, and English II. In addition, there are additional READY indicators for high schools:
ACT College Readiness - % of Grade 11 students taking the ACT who meet the UNC System minimum admission requirement of a composite score of 17;
Math Course Rigor - % of graduates who successfully complete Math III (Algebra II or Integrated Mathematics III);
ACT WorkKeys - % of graduates who are Career and Technical Education concentrators who earn a Silver Certificate or higher;
4-Year Cohort Graduation Rate - % of students who entered high school four (4) years prior and who graduated within four (4) years; and
0
10
20
30
40
50
60
70
80
90
100
Male Female Asian Black Hispanic White EDS LEP SWD
Perc
en
t o
f S
tud
en
ts

Compiled by WS/FCS Department of Research & Evaluation 16 February 2015
5-Year Cohort Graduation Rate - % of students who entered high school five (5) years prior and who graduated within five (5) years. In the academic year 2012-2013, the state of North Carolina began implementation of
the new Common Core curriculum in reading and math and new state curriculums in science and social studies. All new EOG and EOC assessments were developed and administered to students. In October of 2013, the state board adopted college and career readiness Academic Achievement Standards and Academic Achievement descriptors for the EOGs and EOCs. In March of 2014, the board adopted a new five-level achievement scale that replaced the four-level scale in an effort to have more definitive discrimination for student achievement reporting. The new scale reports the percentage of students who are grade level proficient (GLP) and the percentage who are college and career ready (CCR). The GLP measure includes students who score at or above Level 3 and demonstrate at least sufficient command of the material. The CCR measure includes students who scored at Level 4 and 5 only. These students demonstrate solid command of the material and are considered college and career ready. Students at Level 3 could be college and career ready with additional support. With the introduction of these new rigorous cut scores for proficiency, as expected, percentages of students who were proficient in various assessments were much lower than in previous years.
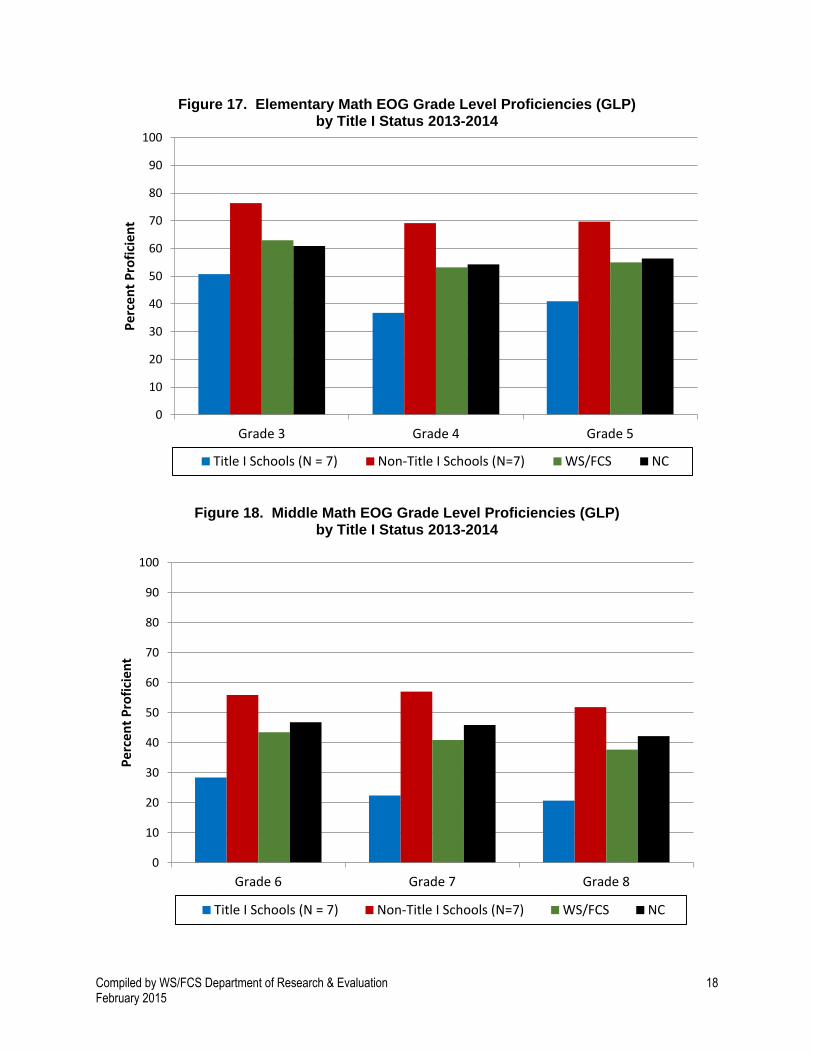
When comparing GLP performance composites, the district (53.4) performed
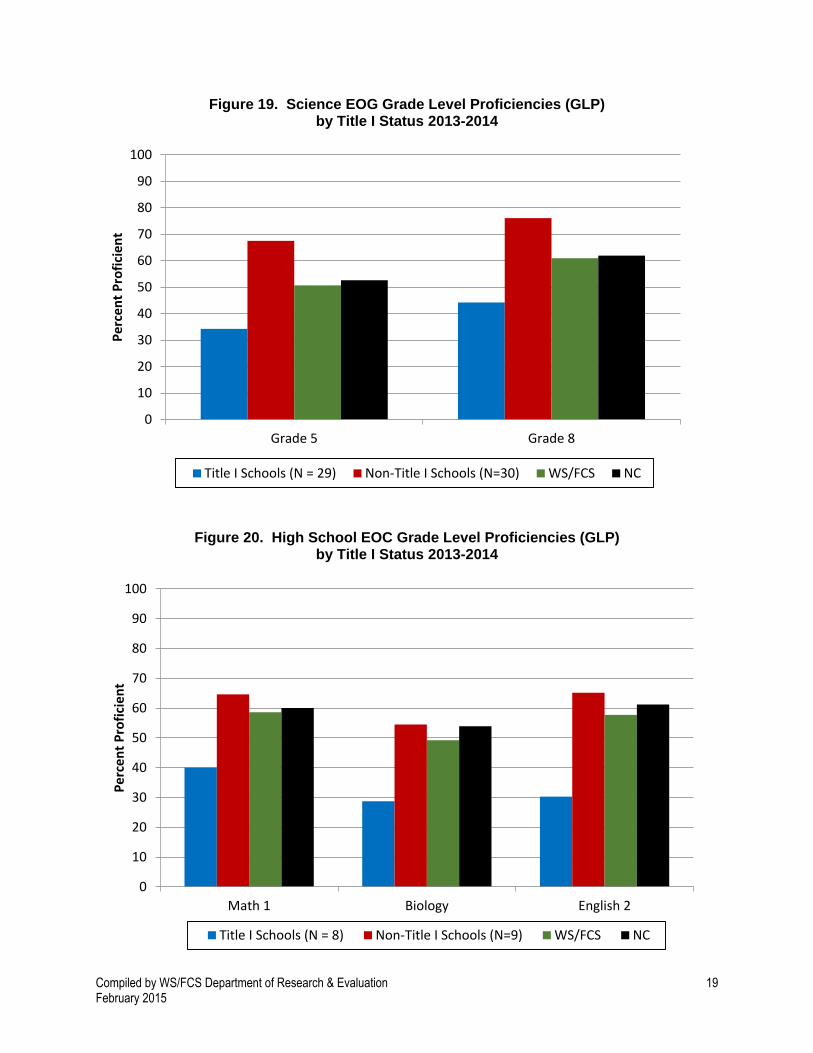
comparable to the state (56.3). The same can be said when comparing the CCR composites for the district (44.1) to the state (46.2). The contrast between Title I and non-Title I schools was stark: Title I schools’ average Performance Composite was 35.3 compared to non-Title I schools’ average Performance Composite of 66.2, almost double that of Title I schools. This proficiency gap between Title I and non-Title I schools can be seen in reading (see Figures 15 and 16), math (see Figures 17 and 18), science EOGs (see Figure 19), and in EOCs (see Figure 20). The district as a whole performed at a comparable level to the state as a whole in all subjects and grades.

Compiled by WS/FCS Department of Research & Evaluation 17 February 2015
Figure 15. Elementary Reading EOG Grade Level Proficiencies (GLP) by Title I Status 2013-2014
Figure 16. Middle Reading EOG Grade Level Proficiencies (GLP) by Title I Status 2013-2014
0
10
20
30
40
50
60
70
80
90
100
Grade 3 Grade 4 Grade 5
Pe
rce
nt
Pro
fici
en
t
Title I Schools (N = 22) Non-Title I Schools (N=22) WS/FCS NC
0
10
20
30
40
50
60
70
80
90
100
Grade 6 Grade 7 Grade 8
Pe
rce
nt
Pro
fici
en
t
Title I Schools (N = 7) Non-Title I Schools (N=7) WS/FCS NC
Compiled by WS/FCS Department of Research & Evaluation 18 February 2015
Figure 17. Elementary Math EOG Grade Level Proficiencies (GLP) by Title I Status 2013-2014
Figure 18. Middle Math EOG Grade Level Proficiencies (GLP) by Title I Status 2013-2014
0
10
20
30
40
50
60
70
80
90
100
Grade 3 Grade 4 Grade 5
Pe
rce
nt
Pro
fici
en
t
Title I Schools (N = 7) Non-Title I Schools (N=7) WS/FCS NC
0
10
20
30
40
50
60
70
80
90
100
Grade 6 Grade 7 Grade 8
Pe
rce
nt
Pro
fici
en
t
Title I Schools (N = 7) Non-Title I Schools (N=7) WS/FCS NC
Compiled by WS/FCS Department of Research & Evaluation 19 February 2015
Figure 19. Science EOG Grade Level Proficiencies (GLP) by Title I Status 2013-2014
Figure 20. High School EOC Grade Level Proficiencies (GLP)
by Title I Status 2013-2014
0
10
20
30
40
50
60
70
80
90
100
Grade 5 Grade 8
Pe
rce
nt
Pro
fici
en
t
Title I Schools (N = 29) Non-Title I Schools (N=30) WS/FCS NC
0
10
20
30
40
50
60
70
80
90
100
Math 1 Biology English 2
Pe
rce
nt
Pro
fici
en
t
Title I Schools (N = 8) Non-Title I Schools (N=9) WS/FCS NC
Compiled by WS/FCS Department of Research & Evaluation 20 February 2015
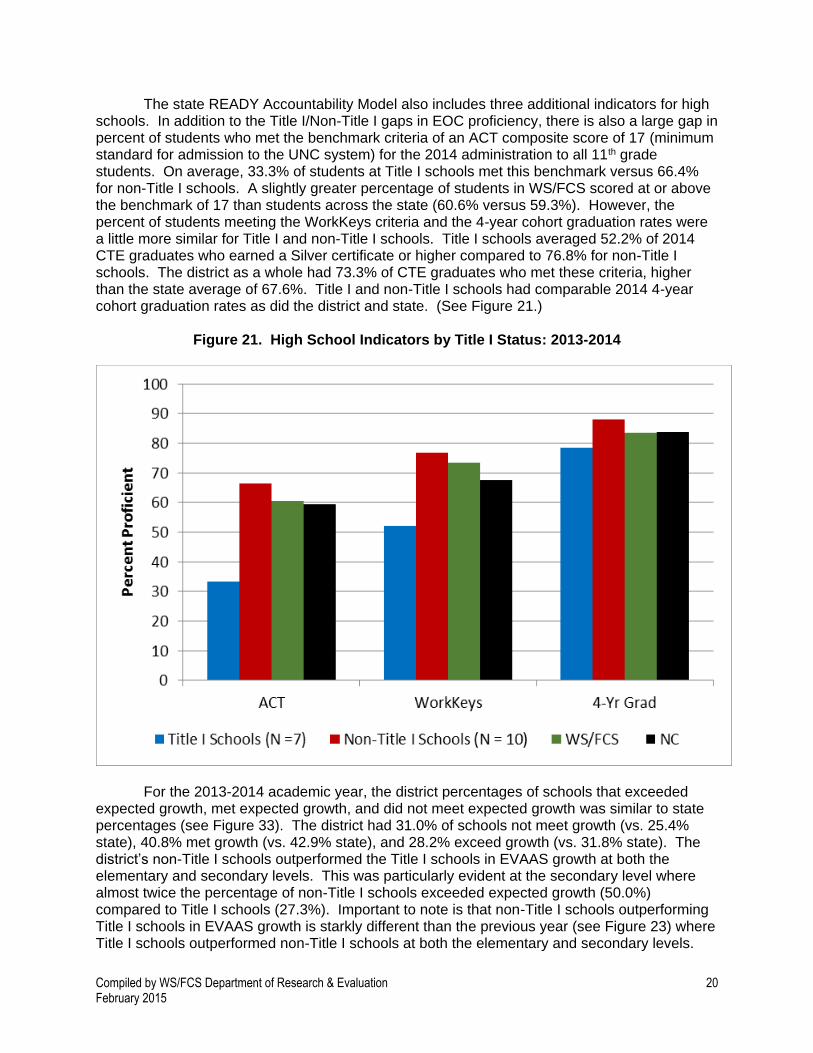
The state READY Accountability Model also includes three additional indicators for high schools. In addition to the Title I/Non-Title I gaps in EOC proficiency, there is also a large gap in percent of students who met the benchmark criteria of an ACT composite score of 17 (minimum standard for admission to the UNC system) for the 2014 administration to all 11th grade students. On average, 33.3% of students at Title I schools met this benchmark versus 66.4% for non-Title I schools. A slightly greater percentage of students in WS/FCS scored at or above the benchmark of 17 than students across the state (60.6% versus 59.3%). However, the percent of students meeting the WorkKeys criteria and the 4-year cohort graduation rates were a little more similar for Title I and non-Title I schools. Title I schools averaged 52.2% of 2014 CTE graduates who earned a Silver certificate or higher compared to 76.8% for non-Title I schools. The district as a whole had 73.3% of CTE graduates who met these criteria, higher than the state average of 67.6%. Title I and non-Title I schools had comparable 2014 4-year cohort graduation rates as did the district and state. (See Figure 21.)
Figure 21. High School Indicators by Title I Status: 2013-2014
For the 2013-2014 academic year, the district percentages of schools that exceeded expected growth, met expected growth, and did not meet expected growth was similar to state percentages (see Figure 33). The district had 31.0% of schools not meet growth (vs. 25.4% state), 40.8% met growth (vs. 42.9% state), and 28.2% exceed growth (vs. 31.8% state). The district’s non-Title I schools outperformed the Title I schools in EVAAS growth at both the elementary and secondary levels. This was particularly evident at the secondary level where almost twice the percentage of non-Title I schools exceeded expected growth (50.0%) compared to Title I schools (27.3%). Important to note is that non-Title I schools outperforming Title I schools in EVAAS growth is starkly different than the previous year (see Figure 23) where Title I schools outperformed non-Title I schools at both the elementary and secondary levels.

Compiled by WS/FCS Department of Research & Evaluation 21 February 2015
For example, in 2012-2013, more than twice the percentage of Title I schools exceeded expected growth (46.2%) compared to non-Title I schools (20.0%) at the secondary level. Figure 30 displays EVAAS growth trend results since 2010 and shows growth was a little better for non-Title I than Title I schools over time.
Figure 22. EVAAS Growth Status by Title I Status: 2013-2014
0%
10%
20%
30%
40%
50%
60%
70%
80%
90%
100%
Title I Non-Title I Title I Non-Title I Title I Non-Title I WS/FCS NC
Elementary Secondary All Schools
Pe
rce
nt
of
Sc
ho
ols
Not Met Met Exceeds

Compiled by WS/FCS Department of Research & Evaluation 22 February 2015
Figure 23. EVAAS School Composites by Title I Status: 2010-2014
The new READY accountability model also includes revisions to the old NCLB1
requirements; North Carolina was granted an ESEA waiver by the US Department of Education. The NC ESEA waiver changed the former Annual Yearly Progress (AYP) targets to Annual Measurable Objectives (AMOs); there are now both Annual Measurable Objectives (AMOs). AMOs are a series of performance targets that must be met on designated assessments; targets are set on participation (for assessments) and proficiency standards (for assessments and other indicators). With the ESEA waiver, North Carolina reports AMOs in reading (English Language Arts/Reading), mathematics, science, current year EOC participation, ACT, ACT WorkKeys, Passing Math III, and Cohort Graduation Rate. In previous years, AMO targets were reported by federal and state targets met. For 2013-2014, the state reported federal and state targets together.
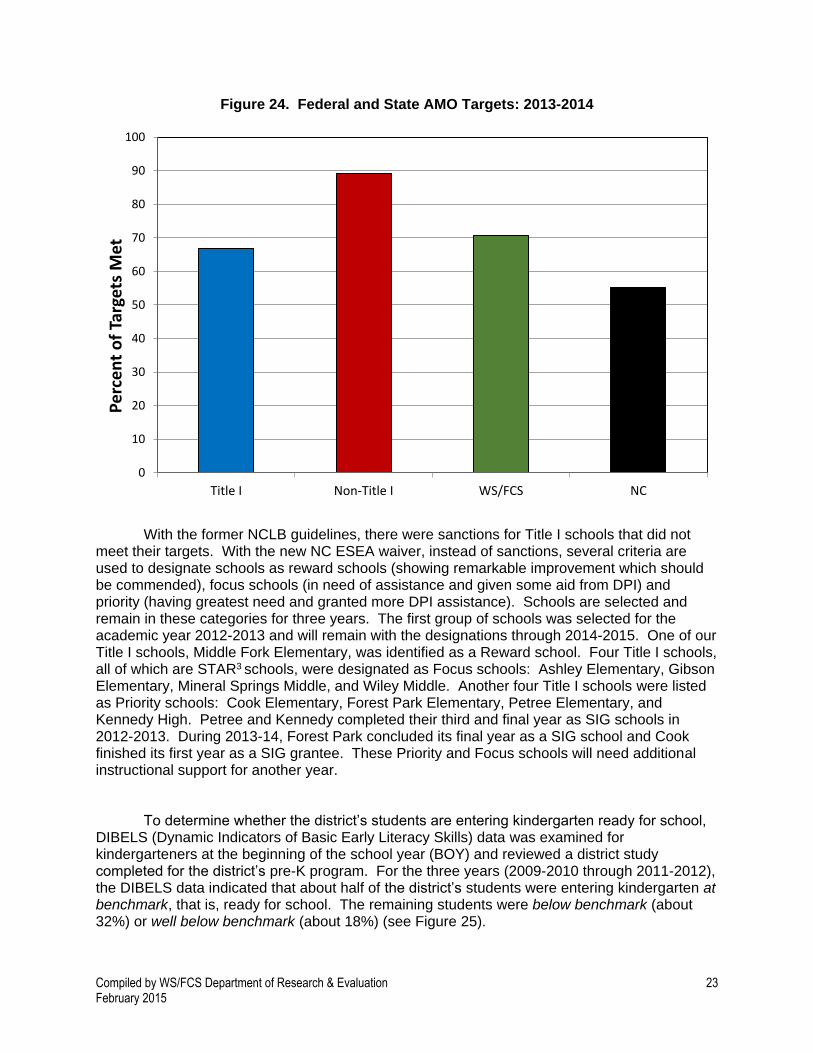
For the academic year 2013-2014, the district met 71% of the 188 AMO targets, higher
than the state of North Carolina which met 55% of it 210 targets. Within the district, 18 schools (24%) met 100% of their targets. All but one of the 18 schools which met 100% of their AMO targets were non-Title I schools. As can be seen in Figure 24, non-Title I schools are meeting more of their AMO targets than Title I schools
1 No Child Left Behind (NCLB) refers to the requirements added to the ESEA (Elementary and Secondary
Education Act) legislation by the George W. Bush administration; the ESEA legislation is the federal law which
authorized Title I.
0
10
20
30
40
50
60
70
80
90
100
District(N=75)
Non-Title I
(N=45)
Title I(N=30)
District(N=72)
Non-Title I
(N=45)
Title I(N=27)
District(N=70)
Title I(N=34)
Non-Title I
(N=36)
District(N=71)
Title I(N=34)
Non-Title I
(N=37)
2010-2011 2011-2012 2012-2013 2013-2014
Does Not Meet Meets Exceeds
Compiled by WS/FCS Department of Research & Evaluation 23 February 2015
Figure 24. Federal and State AMO Targets: 2013-2014
With the former NCLB guidelines, there were sanctions for Title I schools that did not meet their targets. With the new NC ESEA waiver, instead of sanctions, several criteria are used to designate schools as reward schools (showing remarkable improvement which should be commended), focus schools (in need of assistance and given some aid from DPI) and priority (having greatest need and granted more DPI assistance). Schools are selected and remain in these categories for three years. The first group of schools was selected for the academic year 2012-2013 and will remain with the designations through 2014-2015. One of our Title I schools, Middle Fork Elementary, was identified as a Reward school. Four Title I schools, all of which are STAR3 schools, were designated as Focus schools: Ashley Elementary, Gibson Elementary, Mineral Springs Middle, and Wiley Middle. Another four Title I schools were listed as Priority schools: Cook Elementary, Forest Park Elementary, Petree Elementary, and Kennedy High. Petree and Kennedy completed their third and final year as SIG schools in 2012-2013. During 2013-14, Forest Park concluded its final year as a SIG school and Cook finished its first year as a SIG grantee. These Priority and Focus schools will need additional instructional support for another year.
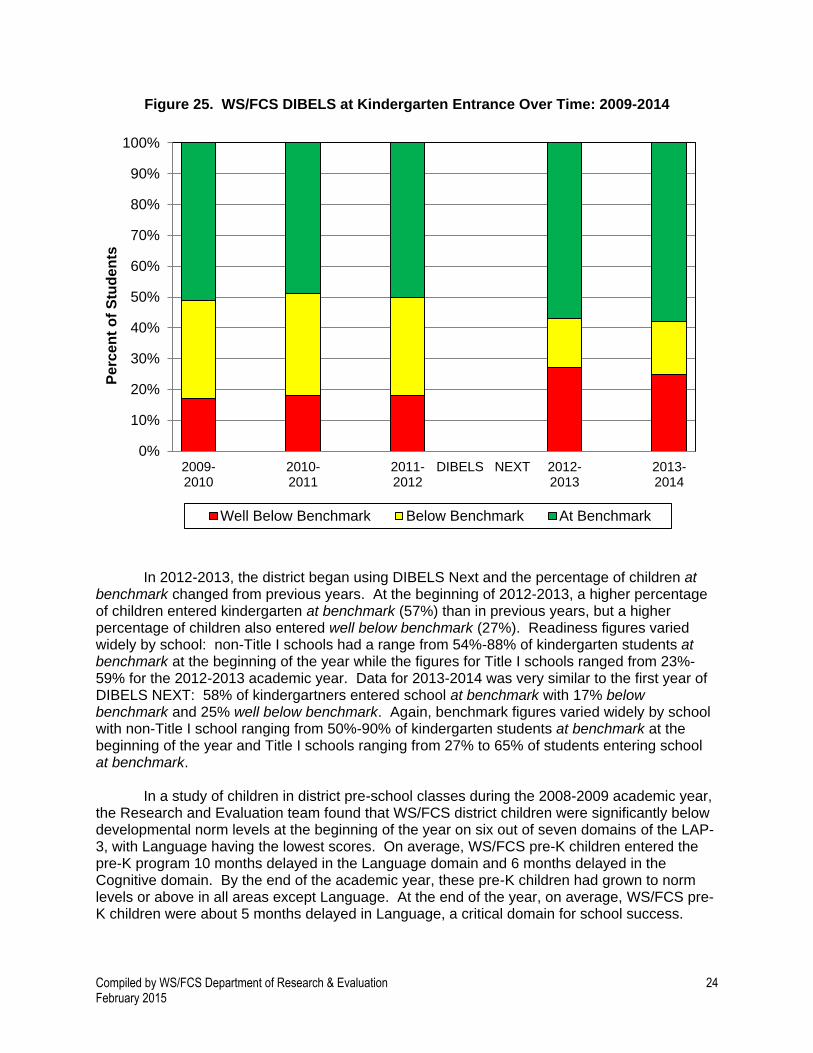
To determine whether the district’s students are entering kindergarten ready for school, DIBELS (Dynamic Indicators of Basic Early Literacy Skills) data was examined for kindergarteners at the beginning of the school year (BOY) and reviewed a district study completed for the district’s pre-K program. For the three years (2009-2010 through 2011-2012), the DIBELS data indicated that about half of the district’s students were entering kindergarten at benchmark, that is, ready for school. The remaining students were below benchmark (about 32%) or well below benchmark (about 18%) (see Figure 25).
0
10
20
30
40
50
60
70
80
90
100
Title I Non-Title I WS/FCS NC
Pe
rce
nt
of
Targ
ets
Met
Compiled by WS/FCS Department of Research & Evaluation 24 February 2015
Figure 25. WS/FCS DIBELS at Kindergarten Entrance Over Time: 2009-2014
In 2012-2013, the district began using DIBELS Next and the percentage of children at
benchmark changed from previous years. At the beginning of 2012-2013, a higher percentage of children entered kindergarten at benchmark (57%) than in previous years, but a higher percentage of children also entered well below benchmark (27%). Readiness figures varied widely by school: non-Title I schools had a range from 54%-88% of kindergarten students at benchmark at the beginning of the year while the figures for Title I schools ranged from 23%-59% for the 2012-2013 academic year. Data for 2013-2014 was very similar to the first year of DIBELS NEXT: 58% of kindergartners entered school at benchmark with 17% below benchmark and 25% well below benchmark. Again, benchmark figures varied widely by school with non-Title I school ranging from 50%-90% of kindergarten students at benchmark at the beginning of the year and Title I schools ranging from 27% to 65% of students entering school at benchmark. In a study of children in district pre-school classes during the 2008-2009 academic year, the Research and Evaluation team found that WS/FCS district children were significantly below developmental norm levels at the beginning of the year on six out of seven domains of the LAP-3, with Language having the lowest scores. On average, WS/FCS pre-K children entered the pre-K program 10 months delayed in the Language domain and 6 months delayed in the Cognitive domain. By the end of the academic year, these pre-K children had grown to norm levels or above in all areas except Language. At the end of the year, on average, WS/FCS pre-K children were about 5 months delayed in Language, a critical domain for school success.
0%
10%
20%
30%
40%
50%
60%
70%
80%
90%
100%
2009-2010
2010-2011
2011-2012
DIBELS NEXT 2012-2013
2013-2014
Perc
en
t o
f S
tud
en
ts
Well Below Benchmark Below Benchmark At Benchmark
Compiled by WS/FCS Department of Research & Evaluation 25 February 2015
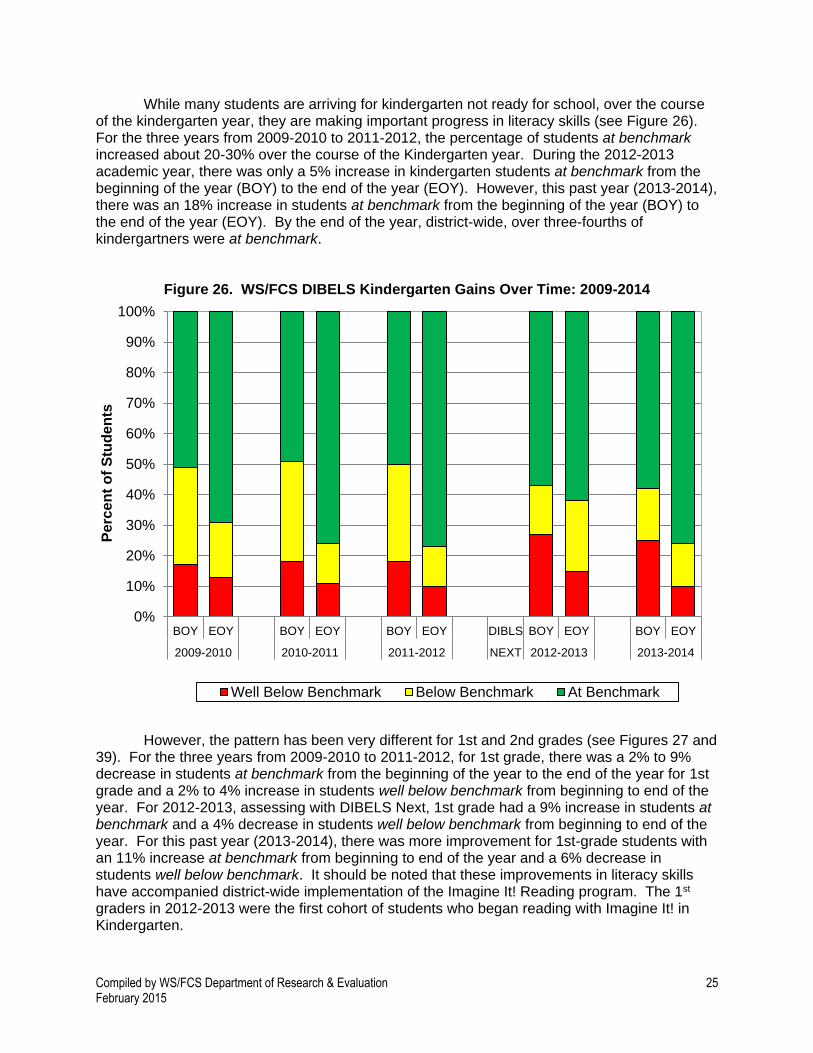
While many students are arriving for kindergarten not ready for school, over the course of the kindergarten year, they are making important progress in literacy skills (see Figure 26). For the three years from 2009-2010 to 2011-2012, the percentage of students at benchmark increased about 20-30% over the course of the Kindergarten year. During the 2012-2013 academic year, there was only a 5% increase in kindergarten students at benchmark from the beginning of the year (BOY) to the end of the year (EOY). However, this past year (2013-2014), there was an 18% increase in students at benchmark from the beginning of the year (BOY) to the end of the year (EOY). By the end of the year, district-wide, over three-fourths of kindergartners were at benchmark.
Figure 26. WS/FCS DIBELS Kindergarten Gains Over Time: 2009-2014
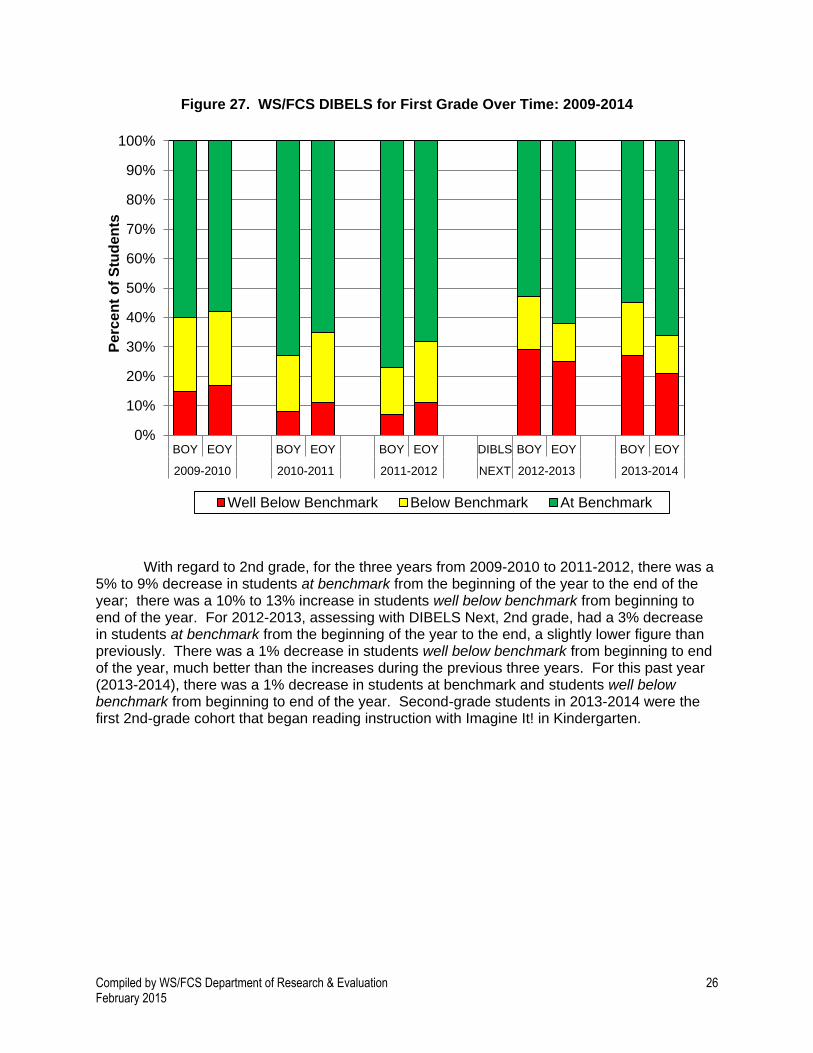
However, the pattern has been very different for 1st and 2nd grades (see Figures 27 and 39). For the three years from 2009-2010 to 2011-2012, for 1st grade, there was a 2% to 9% decrease in students at benchmark from the beginning of the year to the end of the year for 1st grade and a 2% to 4% increase in students well below benchmark from beginning to end of the year. For 2012-2013, assessing with DIBELS Next, 1st grade had a 9% increase in students at benchmark and a 4% decrease in students well below benchmark from beginning to end of the year. For this past year (2013-2014), there was more improvement for 1st-grade students with an 11% increase at benchmark from beginning to end of the year and a 6% decrease in students well below benchmark. It should be noted that these improvements in literacy skills have accompanied district-wide implementation of the Imagine It! Reading program. The 1st graders in 2012-2013 were the first cohort of students who began reading with Imagine It! in Kindergarten.
0%
10%
20%
30%
40%
50%
60%
70%
80%
90%
100%
BOY EOY BOY EOY BOY EOY DIBLS BOY EOY BOY EOY
2009-2010 2010-2011 2011-2012 NEXT 2012-2013 2013-2014
Perc
en
t o
f S
tud
en
ts
Well Below Benchmark Below Benchmark At Benchmark
Compiled by WS/FCS Department of Research & Evaluation 26 February 2015
Figure 27. WS/FCS DIBELS for First Grade Over Time: 2009-2014
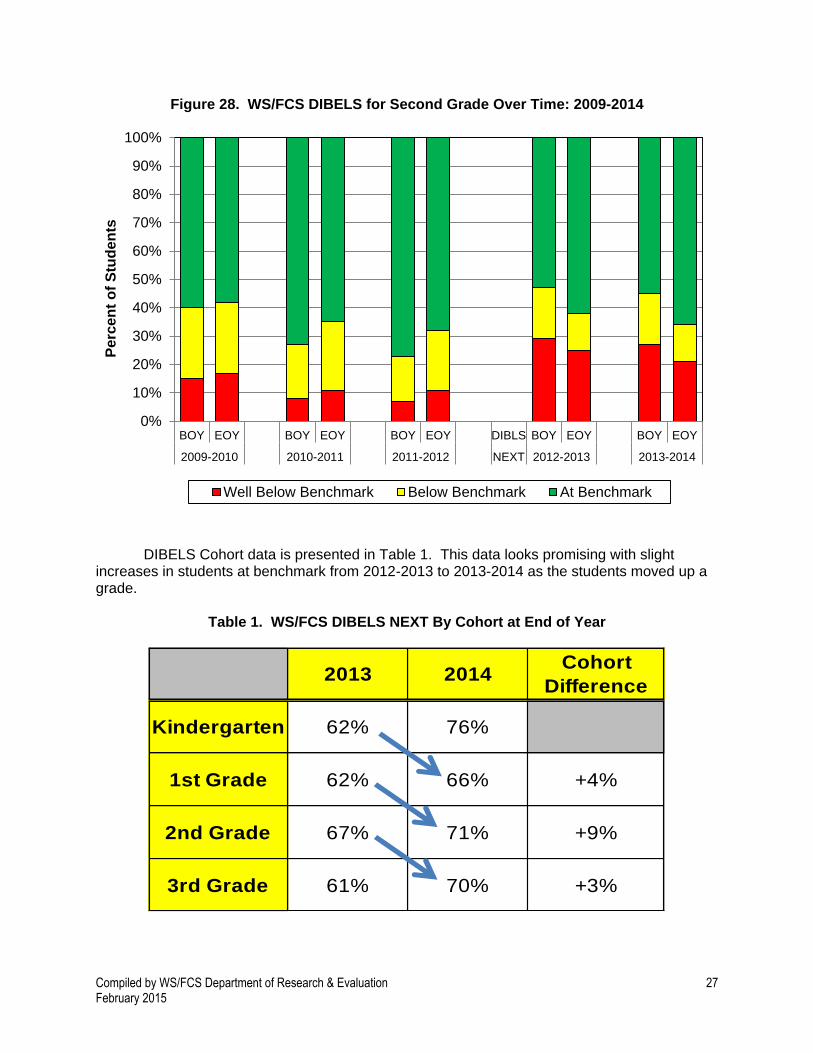
With regard to 2nd grade, for the three years from 2009-2010 to 2011-2012, there was a
5% to 9% decrease in students at benchmark from the beginning of the year to the end of the year; there was a 10% to 13% increase in students well below benchmark from beginning to end of the year. For 2012-2013, assessing with DIBELS Next, 2nd grade, had a 3% decrease in students at benchmark from the beginning of the year to the end, a slightly lower figure than previously. There was a 1% decrease in students well below benchmark from beginning to end of the year, much better than the increases during the previous three years. For this past year (2013-2014), there was a 1% decrease in students at benchmark and students well below benchmark from beginning to end of the year. Second-grade students in 2013-2014 were the first 2nd-grade cohort that began reading instruction with Imagine It! in Kindergarten.
0%
10%
20%
30%
40%
50%
60%
70%
80%
90%
100%
BOY EOY BOY EOY BOY EOY DIBLS BOY EOY BOY EOY
2009-2010 2010-2011 2011-2012 NEXT 2012-2013 2013-2014
Perc
en
t o
f S
tud
en
ts
Well Below Benchmark Below Benchmark At Benchmark
Compiled by WS/FCS Department of Research & Evaluation 27 February 2015
Figure 28. WS/FCS DIBELS for Second Grade Over Time: 2009-2014
DIBELS Cohort data is presented in Table 1. This data looks promising with slight increases in students at benchmark from 2012-2013 to 2013-2014 as the students moved up a grade.
Table 1. WS/FCS DIBELS NEXT By Cohort at End of Year
0%
10%
20%
30%
40%
50%
60%
70%
80%
90%
100%
BOY EOY BOY EOY BOY EOY DIBLS BOY EOY BOY EOY
2009-2010 2010-2011 2011-2012 NEXT 2012-2013 2013-2014
Perc
en
t o
f S
tud
en
ts
Well Below Benchmark Below Benchmark At Benchmark
2013 2014Cohort
Difference
Kindergarten 62% 76%
1st Grade 62% 66% +4%
2nd Grade 67% 71% +9%
3rd Grade 61% 70% +3%

Compiled by WS/FCS Department of Research & Evaluation 28 February 2015
In addition to DIBELS Next, during 2013-2014 teachers began administering the TRC (Text Reading Comprehension) assessment, which involves oral and/or written responses to text to assess both reading skill and comprehension. As can be seen in Figure 29, striking gains were made in kindergarten: increasing from 3% above proficient at the beginning of the year to 45% above proficient at the end of the year and decreasing the percentage of students far below proficient from 45% to 26%. Third grade also demonstrated positive growth: from beginning of the year to the end of the year, there was an increase from 41% to 56% in students who were either proficient or above proficient while there was a decrease from 48% to 31% in students who were far below proficient. For 1st grade, there was little change across the academic year, except for a move of students from above proficient to proficient. With 2nd grade, there was an increase over the year in percentage of students who were either proficient or above proficient from 42% to 57% but no change in percentage of students were well below proficient.
Figure 29. WS/FCS TRC Gains Over Time: 2013-2014
To further examine the development of early literacy skills and reading in the district, subscales of the DIBELS NEXT assessments conducted during 2013-2014 were examined. For Kindergarten, the greatest gain was in First Sound Fluency (FSF), followed by Phoneme Segmentation Fluency (PSF); there was little change in Nonsense Word Fluency - Correct Letter Sounds (NWF-CLS). For 1st grade, there was little improvement in Oral Reading Fluency (DORF) either fluency or accuracy. With Nonsense Word Fluency (NWF), both Correct Letter Sounds (CLS) and Whole Words Read (WWR), more students were well below benchmark at the end of the year than at the beginning. For 2nd grade, there was little change in any of the three Oral Reading Fluency measures – fluency, accuracy, or retell. Some improvement in
0%
10%
20%
30%
40%
50%
60%
70%
80%
90%
100%
BOY EOY BOY EOY BOY EOY BOY EOY
Kindergarten 1st Grade 2nd Grade 3rd Grade
Perc
en
t o
f S
tud
en
ts
Far Below Proficient Below Proficient Proficient Above Proficient

Compiled by WS/FCS Department of Research & Evaluation 29 February 2015
accuracy in Oral Reading Fluency was seen in 3rd grade; however, there was little change in retell fluency and a decrease in fluency rate. In 2011-2012, half of the schools in the district had a campus composite that did not meet expected growth. For the first year of Common Core implementation, 2012-2013, EVAAS growth in the district was much improved over the previous year. This was true for the district as a whole and for both Non-Title I and Title I schools. For 2012-2013, the rate was cut to only 30% of district schools not meeting expected growth. For 2013-2014, the rate was consistent with the previous year as about 31% of schools did not meet expected growth. However, this varied by level. For high schools over the last three years (2011-2013), 50% of the campus composites were in the red (did not meet expected growth). For middle schools over the last three years, there has been more variation in the percentage of schools in red. From 2011 -2012 there was a drop from 73.3% to 31.3% and then in 2012-2013 there was a rise from 31.3% to 43.8% of schools in red. For elementary schools, there has consistently been a decline as the percentage of schools in red decreased from 43.9% to 23.8% from 2011-2012 and then decreased again from 23.8% to 21.4% from 2012-2013 to 2013-2014. (See Figure 30.)
Figure 30. WS/FCS EVAAS School Composites By Level: 2011-2014
We further examined EVAAS growth by subject and grade. At the elementary level, reading in Grade 4 for the district went from did not meet expected growth in 2011-2012 to met expected growth in 2012-2013 and back to did not meet expected growth in 2013-2014. For fifth grade, reading in the district met expected growth for both previous school years and
0%
10%
20%
30%
40%
50%
60%
70%
80%
90%
100%
Elem(N=41)
Middle(N=15)
High(N=16)
Elem(N=42)
Middle(N=16)
High(N=12)
Elem(N=42)
Middle(N=16)
High(N=12)
2011-2012 2012-2013 2013-2014
Pe
rce
nt
of
Sch
oo
ls
Does Not Meet Meets Exceeds
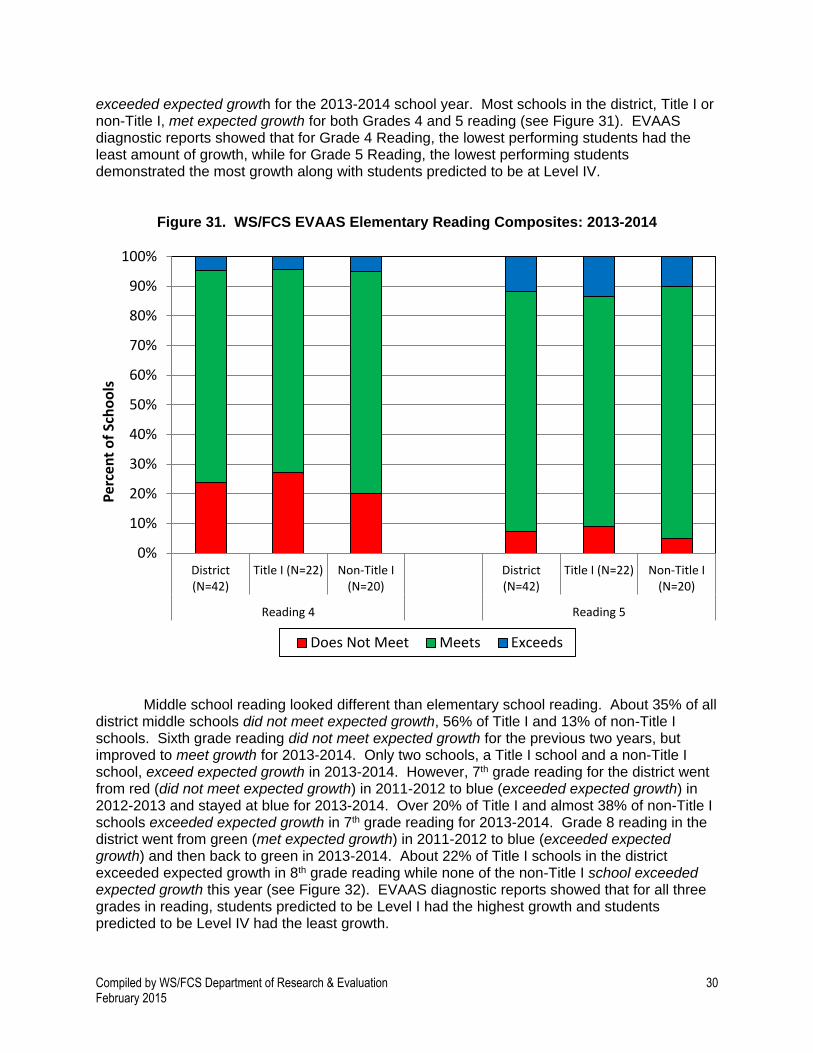
Compiled by WS/FCS Department of Research & Evaluation 30 February 2015
exceeded expected growth for the 2013-2014 school year. Most schools in the district, Title I or non-Title I, met expected growth for both Grades 4 and 5 reading (see Figure 31). EVAAS diagnostic reports showed that for Grade 4 Reading, the lowest performing students had the least amount of growth, while for Grade 5 Reading, the lowest performing students demonstrated the most growth along with students predicted to be at Level IV.
Figure 31. WS/FCS EVAAS Elementary Reading Composites: 2013-2014
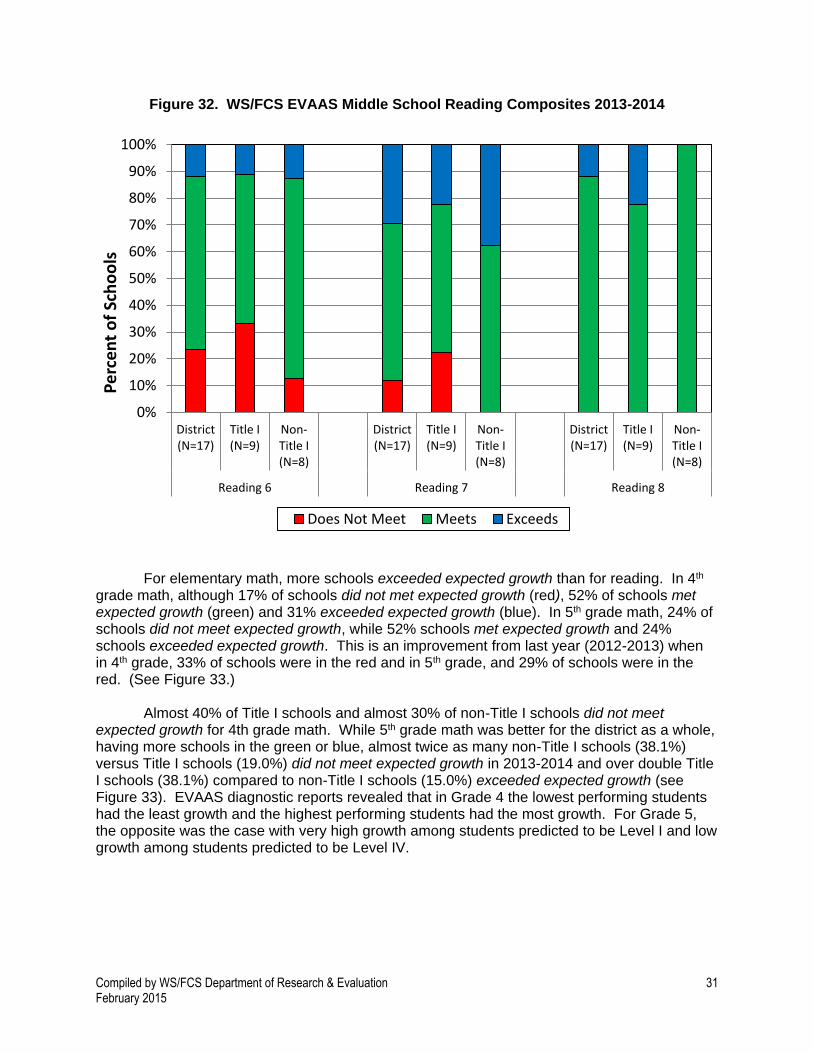
Middle school reading looked different than elementary school reading. About 35% of all
district middle schools did not meet expected growth, 56% of Title I and 13% of non-Title I schools. Sixth grade reading did not meet expected growth for the previous two years, but improved to meet growth for 2013-2014. Only two schools, a Title I school and a non-Title I school, exceed expected growth in 2013-2014. However, 7th grade reading for the district went from red (did not meet expected growth) in 2011-2012 to blue (exceeded expected growth) in 2012-2013 and stayed at blue for 2013-2014. Over 20% of Title I and almost 38% of non-Title I schools exceeded expected growth in 7th grade reading for 2013-2014. Grade 8 reading in the district went from green (met expected growth) in 2011-2012 to blue (exceeded expected growth) and then back to green in 2013-2014. About 22% of Title I schools in the district exceeded expected growth in 8th grade reading while none of the non-Title I school exceeded expected growth this year (see Figure 32). EVAAS diagnostic reports showed that for all three grades in reading, students predicted to be Level I had the highest growth and students predicted to be Level IV had the least growth.
0%
10%
20%
30%
40%
50%
60%
70%
80%
90%
100%
District(N=42)
Title I (N=22) Non-Title I(N=20)
District(N=42)
Title I (N=22) Non-Title I(N=20)
Reading 4 Reading 5
Pe
rce
nt
of
Sch
oo
ls
Does Not Meet Meets Exceeds
Compiled by WS/FCS Department of Research & Evaluation 31 February 2015
Figure 32. WS/FCS EVAAS Middle School Reading Composites 2013-2014
For elementary math, more schools exceeded expected growth than for reading. In 4th
grade math, although 17% of schools did not met expected growth (red), 52% of schools met expected growth (green) and 31% exceeded expected growth (blue). In 5th grade math, 24% of schools did not meet expected growth, while 52% schools met expected growth and 24% schools exceeded expected growth. This is an improvement from last year (2012-2013) when in 4th grade, 33% of schools were in the red and in 5th grade, and 29% of schools were in the red. (See Figure 33.)
Almost 40% of Title I schools and almost 30% of non-Title I schools did not meet expected growth for 4th grade math. While 5th grade math was better for the district as a whole, having more schools in the green or blue, almost twice as many non-Title I schools (38.1%) versus Title I schools (19.0%) did not meet expected growth in 2013-2014 and over double Title I schools (38.1%) compared to non-Title I schools (15.0%) exceeded expected growth (see Figure 33). EVAAS diagnostic reports revealed that in Grade 4 the lowest performing students had the least growth and the highest performing students had the most growth. For Grade 5, the opposite was the case with very high growth among students predicted to be Level I and low growth among students predicted to be Level IV.
0%
10%
20%
30%
40%
50%
60%
70%
80%
90%
100%
District(N=17)
Title I(N=9)
Non-Title I(N=8)
District(N=17)
Title I(N=9)
Non-Title I(N=8)
District(N=17)
Title I(N=9)
Non-Title I(N=8)
Reading 6 Reading 7 Reading 8
Pe
rce
nt
of
Sch
oo
ls
Does Not Meet Meets Exceeds
Compiled by WS/FCS Department of Research & Evaluation 32 February 2015
Figure 33. WS/FCS EVAAS Elementary Math Composites 2013-2014
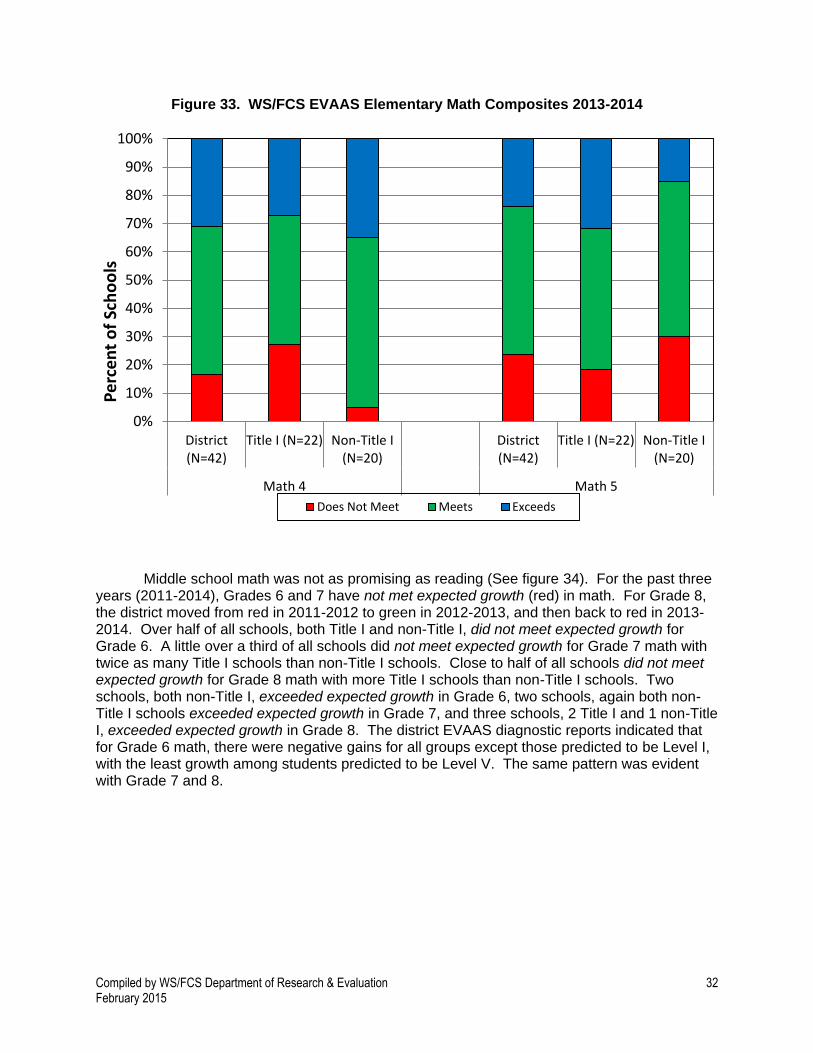
Middle school math was not as promising as reading (See figure 34). For the past three years (2011-2014), Grades 6 and 7 have not met expected growth (red) in math. For Grade 8, the district moved from red in 2011-2012 to green in 2012-2013, and then back to red in 2013-2014. Over half of all schools, both Title I and non-Title I, did not meet expected growth for Grade 6. A little over a third of all schools did not meet expected growth for Grade 7 math with twice as many Title I schools than non-Title I schools. Close to half of all schools did not meet expected growth for Grade 8 math with more Title I schools than non-Title I schools. Two schools, both non-Title I, exceeded expected growth in Grade 6, two schools, again both non-Title I schools exceeded expected growth in Grade 7, and three schools, 2 Title I and 1 non-Title I, exceeded expected growth in Grade 8. The district EVAAS diagnostic reports indicated that for Grade 6 math, there were negative gains for all groups except those predicted to be Level I, with the least growth among students predicted to be Level V. The same pattern was evident with Grade 7 and 8.
0%
10%
20%
30%
40%
50%
60%
70%
80%
90%
100%
District(N=42)
Title I (N=22) Non-Title I(N=20)
District(N=42)
Title I (N=22) Non-Title I(N=20)
Math 4 Math 5
Pe
rce
nt
of
Sch
oo
ls
Does Not Meet Meets Exceeds

Compiled by WS/FCS Department of Research & Evaluation 33 February 2015
Figure 34. WS/FCS EVAAS Middle School Math Composites 2013-2014
For 5th grade science (see Figure 35), the district had over 25% of elementary schools not meet expected growth, about a third met expected growth, and over 40% exceed expected growth. Title I schools had similar percentages of schools in each category with 31.8% not meeting expected growth, 36.4% meeting expected growth, and 31.8% exceeding expected growth . Non-title I schools had fewer schools not meeting expected growth (20.0%) and meeting expected growth (30.0%), and more schools exceeding expected growth (50.0%) when compared to Title I schools. The EVAAS diagnostic report showed negative gains for both the lowest and highest performing students and the most gains for students predicted to be at Level 3 and 4.
For 8th grade science (see Figure 35), the district had over 11% of elementary schools
not meet expected growth, almost half met expected growth, and over 40% exceed expected growth. Title I schools had over 20% of schools not met expected growth, over 40% met expected growth, and over 30% exceed expected growth. All non-Title I schools either met (50.0%) or exceeded expected growth (50.0%). The EVAAS diagnostic report showed positive gains for both the lowest and highest performing students and the most gains for students predicted to be Level 4.
0%
10%
20%
30%
40%
50%
60%
70%
80%
90%
100%
District(N=17)
Title I(N=9)
Non-Title I(N=8)
District(N=17)
Title I(N=9)
Non-Title I(N=8)
District(N=17)
Title I(N=9)
Non-Title I(N=8)
Math 6 Math 7 Math 8
Pe
rce
nt
of
Sch
oo
ls
Does Not Meet Meets Exceeds

Compiled by WS/FCS Department of Research & Evaluation 34 February 2015
Figure 35. WS/FCS EVAAS Elementary & Middle Science Composites 2013-2014
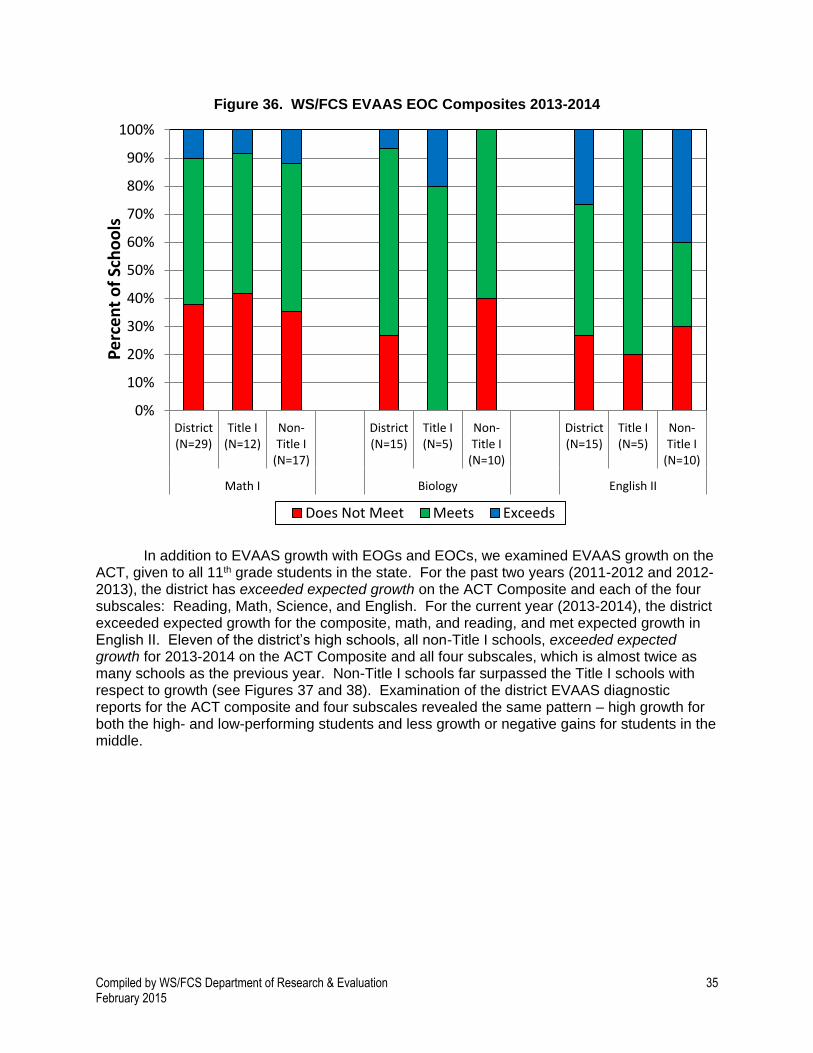
With high school courses (see Figure 36), Title I schools demonstrated greater growth in Biology, similar growth in Math I as non-Title I schools, and less growth in English II. The district met expected growth in Biology this year (2013-2014) for the first time since 2011-2012. Similarly, while having not met expected growth for the previous year, the district met expected growth for the 2013-2014 school year for English II. However, the opposite was true for Math I; while the district had met expected growth for the previous two school years, they did not meet expected growth for the 2013-2014 school year. For Math I, about 38% of all schools, Title I and non-Title I, did not meet expected growth in for 2012-2013. Those percentages were higher than Biology (26.7%) and English II (26.7%) district percentages. Specifically, 41.7% of Title I schools and 35.3% of non-Title I schools did not met growth in Math I, 20.0% of Title I and 30.0% of non-Title I schools did not meet growth in English II, and 40.0% of non-Title I schools did not meet growth in Biology. All Title I schools met expected growth in Biology. Analysis of EVAAS diagnostic reports revealed that for Math I, only students predicted to be Level I showed growth with students predicted to be Level II demonstrating lowest negative gains. For Biology, only students predicted to be Level IV showed growth with students at Level I showing the lowest negative growth. For English II, students at Level I showed the most negative gains while students at Level IV showed the most positive gains.
0%
10%
20%
30%
40%
50%
60%
70%
80%
90%
100%
District(N=42)
Title I(N=22)
Non-Title I(N=20)
District(N=17)
Title I (N=9) Non-Title I(N=8)
Science 5 Science 8
Pe
rce
nt
of
Sch
oo
ls
Does Not Meet Meets Exceeds
Compiled by WS/FCS Department of Research & Evaluation 35 February 2015
Figure 36. WS/FCS EVAAS EOC Composites 2013-2014
In addition to EVAAS growth with EOGs and EOCs, we examined EVAAS growth on the ACT, given to all 11th grade students in the state. For the past two years (2011-2012 and 2012-2013), the district has exceeded expected growth on the ACT Composite and each of the four subscales: Reading, Math, Science, and English. For the current year (2013-2014), the district exceeded expected growth for the composite, math, and reading, and met expected growth in English II. Eleven of the district’s high schools, all non-Title I schools, exceeded expected growth for 2013-2014 on the ACT Composite and all four subscales, which is almost twice as many schools as the previous year. Non-Title I schools far surpassed the Title I schools with respect to growth (see Figures 37 and 38). Examination of the district EVAAS diagnostic reports for the ACT composite and four subscales revealed the same pattern – high growth for both the high- and low-performing students and less growth or negative gains for students in the middle.
0%
10%
20%
30%
40%
50%
60%
70%
80%
90%
100%
District(N=29)
Title I(N=12)
Non-Title I
(N=17)
District(N=15)
Title I(N=5)
Non-Title I
(N=10)
District(N=15)
Title I(N=5)
Non-Title I
(N=10)
Math I Biology English II
Pe
rce
nt
of
Sch
oo
ls
Does Not Meet Meets Exceeds
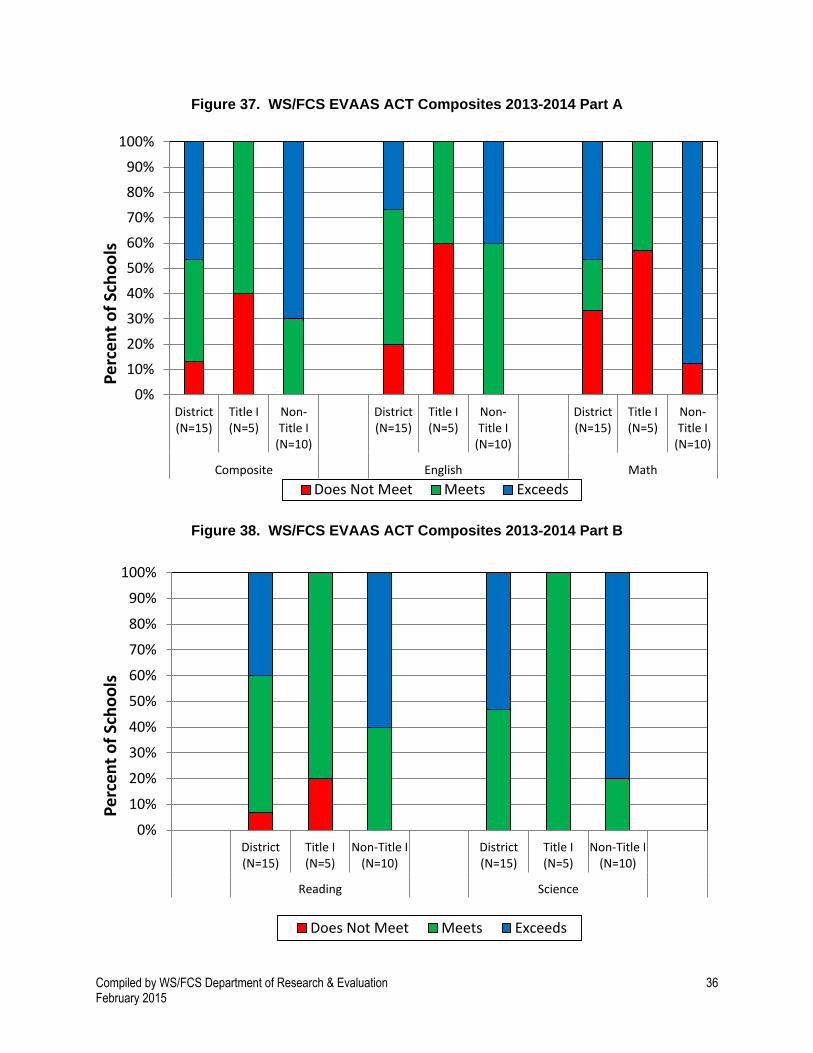
Compiled by WS/FCS Department of Research & Evaluation 36 February 2015
Figure 37. WS/FCS EVAAS ACT Composites 2013-2014 Part A
Figure 38. WS/FCS EVAAS ACT Composites 2013-2014 Part B
0%
10%
20%
30%
40%
50%
60%
70%
80%
90%
100%
District(N=15)
Title I(N=5)
Non-Title I
(N=10)
District(N=15)
Title I(N=5)
Non-Title I
(N=10)
District(N=15)
Title I(N=5)
Non-Title I
(N=10)
Composite English Math
Pe
rce
nt
of
Sch
oo
ls
Does Not Meet Meets Exceeds
0%
10%
20%
30%
40%
50%
60%
70%
80%
90%
100%
District(N=15)
Title I(N=5)
Non-Title I(N=10)
District(N=15)
Title I(N=5)
Non-Title I(N=10)
Reading Science
Pe
rce
nt
of
Sch
oo
ls
Does Not Meet Meets Exceeds

Compiled by WS/FCS Department of Research & Evaluation 37 February 2015
Achievement gaps were explored over the previous six years in elementary and middle reading, math, and science and in high school Algebra 1, English 1, and Biology. Gaps in graduation and dropout rates were also examined. These gaps were explored by major racial/ethnic subgroups (Native American, Asian, Black, Hispanic, White, and Multiracial), by the other ESEA subgroups (Limited English Proficiency, Economically Disadvantaged, and Students With Disabilities), and by the combination of race/ethnicity and economic disadvantage (free-reduced lunch). Important to note is the change in curriculum and standards implemented in 2012-2013, which led to all new assessments. Therefore, although Figures 48-55 display achievement over a longer period of time, achievement gaps are only discussed within the context of a two-year period (2012-2014).
In elementary reading in 2013-2014, Asian and white students performed the highest,
followed by multiracial, black, and Hispanic students respectively (see Figure 39). The gap between the highest performing group (Asian) and lowest performing group (Hispanic) was 42.8 percentage points in 2013, and the gap between the highest (White) and lowest performing groups (Hispanic) was 44 percentage points in 2014. The findings were similar for elementary math except Asian students performed highest while black students performed the lowest. The gap stayed constant at 48 percentage points in both 2013 and 2014 between the highest performing students (Asian) and lowest performing students (black). Asian students outperformed white students by 8.2 percentage points, and Hispanic students outperformed black students by 8.5 percentage points.
In elementary reading, between school years 2012-2013 and 2013-2014, the
achievement gap was reduced by half of a percentage point for students from economically disadvantaged situations (EDS), but grew by 3.1 percentage points for students classified as Limited English proficiency (LEP) and 4.4 percentage points for students with disabilities. In elementary math between school years 2012-2013 and 2013-2014, the achievement gap stayed constant for students from EDS, was reduced by 2 percentage points for students with LEP, but grew by 2.1 percentage points for students with disabilities (Figure 40). In middle school reading in 2013-2014, the patterns were similar to those found in elementary reading. Asian and white students performed the highest, followed by multiracial, black, and Hispanic students respectively. The gap between the highest performing group (Asian in 2013 and white in 2014) and lowest (Hispanic) was narrowed slightly from 2013 to 2014 by 2.1 percentage points. In middle school math (see Figure 41), the patterns were once again similar to those found in elementary math with Asian students performing highest, followed by white, multiracial, Hispanic, and black students respectively. The gap was narrowed by 4.0 percentage points between the highest performing students (Asian) and lowest performing students (black) between 2012-201313 and 2013-2014.
In middle school reading, between school years 2012-2013 and 2013-2014, the achievement gap grew slightly by 0.7 percentage points for students from economically disadvantaged situations (EDS), grew by 2.1 percentage points for students with disabilities, and grew substantially by 8.3 percentage points for students classified as LEP (Figure 42). In middle school math between school years 2012-2013 and 2013-2014, the achievement gap grew for students in EDS (2.8 percentage point), grew for students with LEP (6.0 percentage point), and grew for students with disabilities (6.0 percentage points).
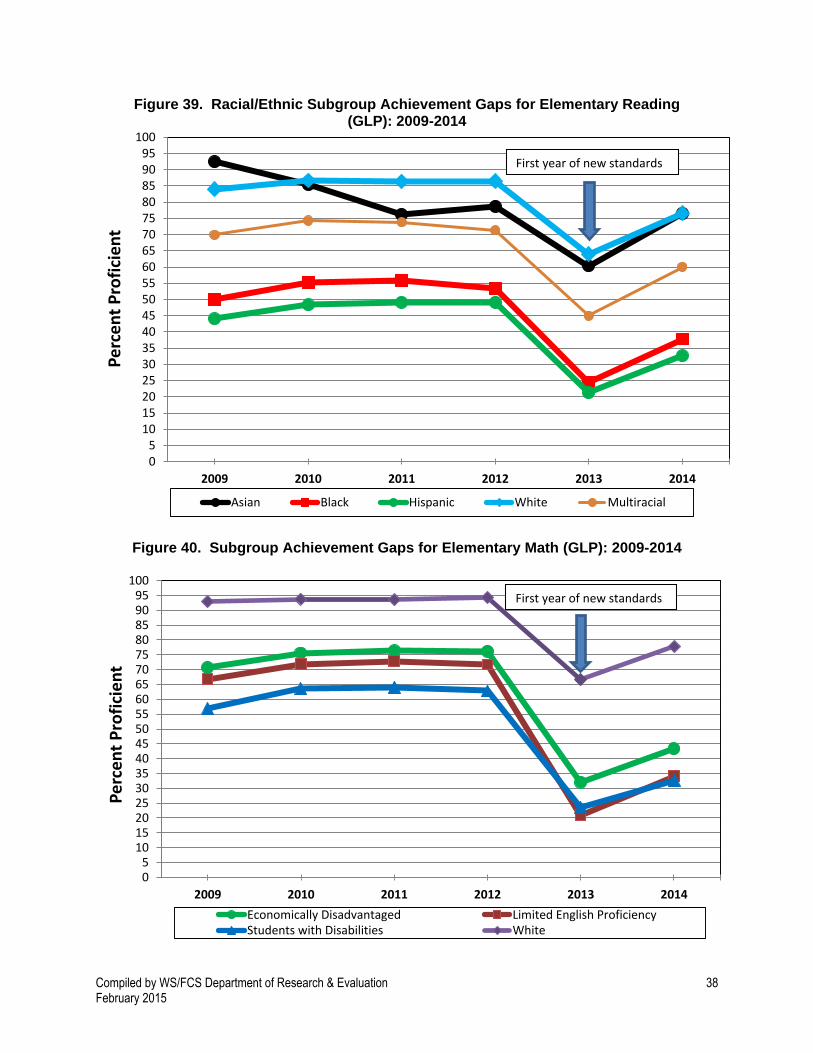
Compiled by WS/FCS Department of Research & Evaluation 38 February 2015
Figure 39. Racial/Ethnic Subgroup Achievement Gaps for Elementary Reading (GLP): 2009-2014
Figure 40. Subgroup Achievement Gaps for Elementary Math (GLP): 2009-2014
05
101520253035404550556065707580859095
100
2009 2010 2011 2012 2013 2014
Pe
rce
nt
Pro
fici
en
t
Asian Black Hispanic White Multiracial
First year of new standards
05
101520253035404550556065707580859095
100
2009 2010 2011 2012 2013 2014
Pe
rce
nt
Pro
fici
en
t
Economically Disadvantaged Limited English ProficiencyStudents with Disabilities White
First year of new standards

Compiled by WS/FCS Department of Research & Evaluation 39 February 2015
Figure 41. Racial/Ethnic Subgroup Achievement Gaps for Middle Math (GLP): 2009-2014
Figure 42: Subgroup Achievement Gaps for Middle Reading (GLP): 2009-2014
05
101520253035404550556065707580859095
100
2009 2010 2011 2012 2013 2014
Pe
rce
nt
Pro
fici
en
t
Asian Black Hispanic White Multiracial
First year of new standards
05
101520253035404550556065707580859095
100
2009 2010 2011 2012 2013 2014
Pe
rce
nt
Pro
fici
en
t
Economically Disadvantaged Limited English Proficiency
Students with Disabilities White
First year of new standards
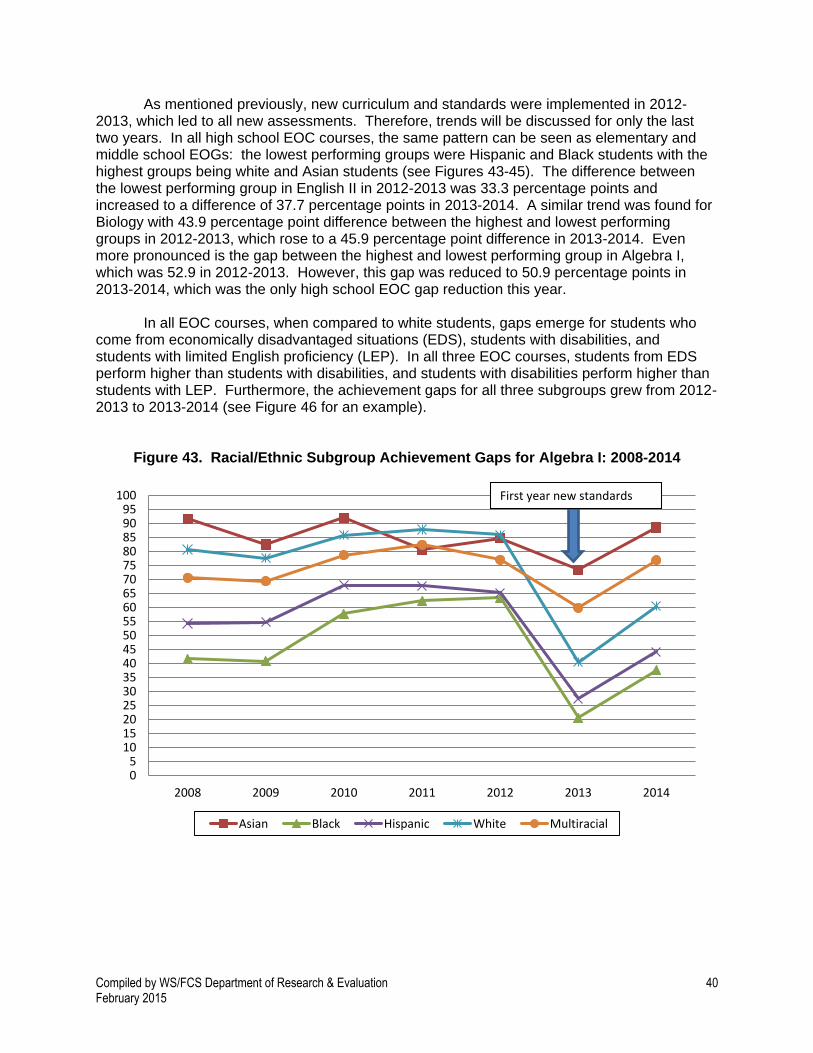
Compiled by WS/FCS Department of Research & Evaluation 40 February 2015
As mentioned previously, new curriculum and standards were implemented in 2012-2013, which led to all new assessments. Therefore, trends will be discussed for only the last two years. In all high school EOC courses, the same pattern can be seen as elementary and middle school EOGs: the lowest performing groups were Hispanic and Black students with the highest groups being white and Asian students (see Figures 43-45). The difference between the lowest performing group in English II in 2012-2013 was 33.3 percentage points and increased to a difference of 37.7 percentage points in 2013-2014. A similar trend was found for Biology with 43.9 percentage point difference between the highest and lowest performing groups in 2012-2013, which rose to a 45.9 percentage point difference in 2013-2014. Even more pronounced is the gap between the highest and lowest performing group in Algebra I, which was 52.9 in 2012-2013. However, this gap was reduced to 50.9 percentage points in 2013-2014, which was the only high school EOC gap reduction this year.
In all EOC courses, when compared to white students, gaps emerge for students who
come from economically disadvantaged situations (EDS), students with disabilities, and students with limited English proficiency (LEP). In all three EOC courses, students from EDS perform higher than students with disabilities, and students with disabilities perform higher than students with LEP. Furthermore, the achievement gaps for all three subgroups grew from 2012-2013 to 2013-2014 (see Figure 46 for an example).
Figure 43. Racial/Ethnic Subgroup Achievement Gaps for Algebra I: 2008-2014
05
101520253035404550556065707580859095
100
2008 2009 2010 2011 2012 2013 2014
Asian Black Hispanic White Multiracial
First year new standards
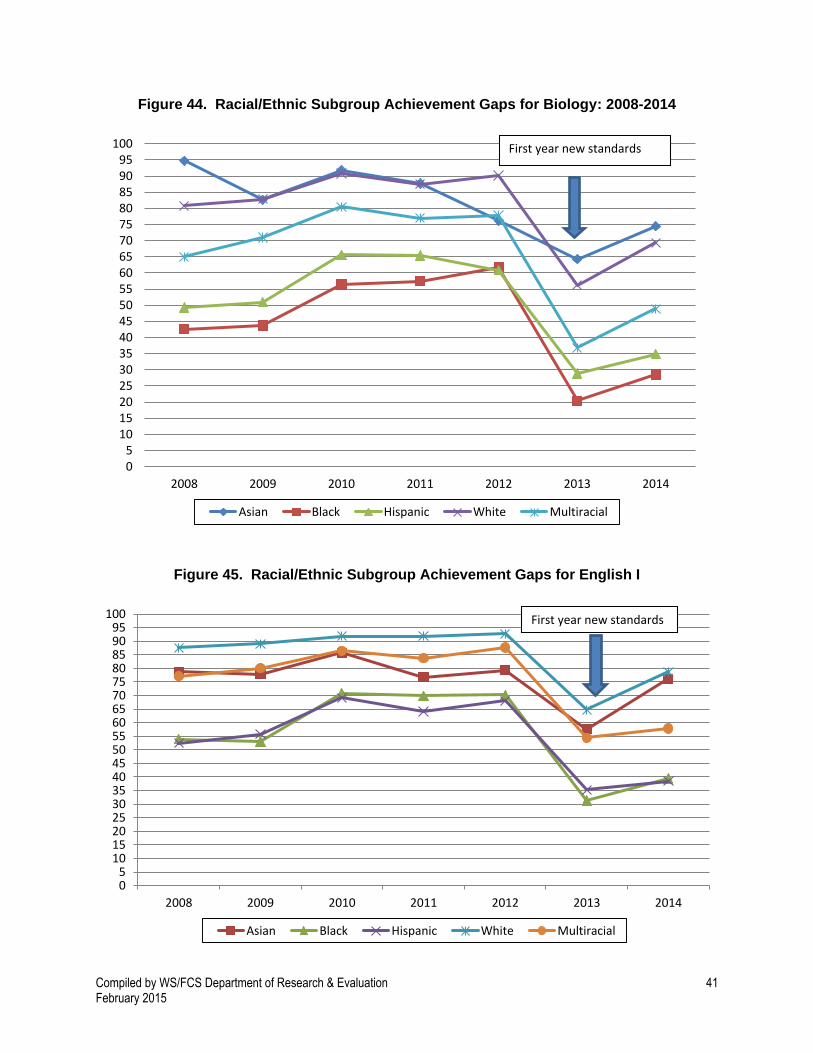
Compiled by WS/FCS Department of Research & Evaluation 41 February 2015
Figure 44. Racial/Ethnic Subgroup Achievement Gaps for Biology: 2008-2014
Figure 45. Racial/Ethnic Subgroup Achievement Gaps for English I
05
101520253035404550556065707580859095
100
2008 2009 2010 2011 2012 2013 2014
Asian Black Hispanic White Multiracial
First year new standards
05
101520253035404550556065707580859095
100
2008 2009 2010 2011 2012 2013 2014
Asian Black Hispanic White Multiracial
First year new standards

Compiled by WS/FCS Department of Research & Evaluation 42 February 2015
Figure 46. Subgroup Achievement Gaps for Algebra I
Achievement gaps for 2012-2013 and 2013-2014 by racial/ethnic subgroups, LEP status, Free-Reduced Lunch status, and attendance at Title I schools were also analyzed. As can be seen in Figures 55 and 56, examining gaps by racial/ethnic groups alone without accounting for the LEP status of Hispanic students yields a very different picture. For example, with middle school reading, of the three major racial/ethnic groups, Hispanic students had the lowest proficiency, followed by Black students, and then White students. The gap between White students and Hispanic students was 43 percentage points in 2013 and 2014. However, when LEP status was taken into account (see Figure 47), the gap between White students and Hispanic/Not LEP students was cut to 28 percentage points in 2013 and 32 percentage points in 2014.
05
101520253035404550556065707580859095
100
2008 2009 2010 2011 2012 2013 2014
Economically Disadvantaged Limited English Proficiency
Students with Disabilities
First year new standards

Compiled by WS/FCS Department of Research & Evaluation 43 February 2015
Figure 47. Grades 3-5 Reading Proficiency By Ethnicity and LEP Status For 2012-2013 and 2013-2014
Even in the case where Hispanic students were performing better than Black students as
in Middle Math (see Figure 48), the gap between White students and Hispanic/Not LEP students (22 percentage points in 2013 and 26 in 2014) was cut by a third gap as compared to White students and all Hispanic students (32 percentage points in 2013 and 35 in 2014). Of course, the gap between White students and Hispanic/LEP students was extremely large: in elementary school reading, this gap was 56 percentage points in 2013 and 55 in 2014; for middle math, this gap was 48 percentage points in both 2013 and 2014.
0
10
20
30
40
50
60
70
80
90
100
White Black Hispanic Hispanic/NotLEP
Hispanic/LEP
Pe
rce
nt
Pro
fic
ien
t
2013 Reading 3-5 2014 Reading 3-5
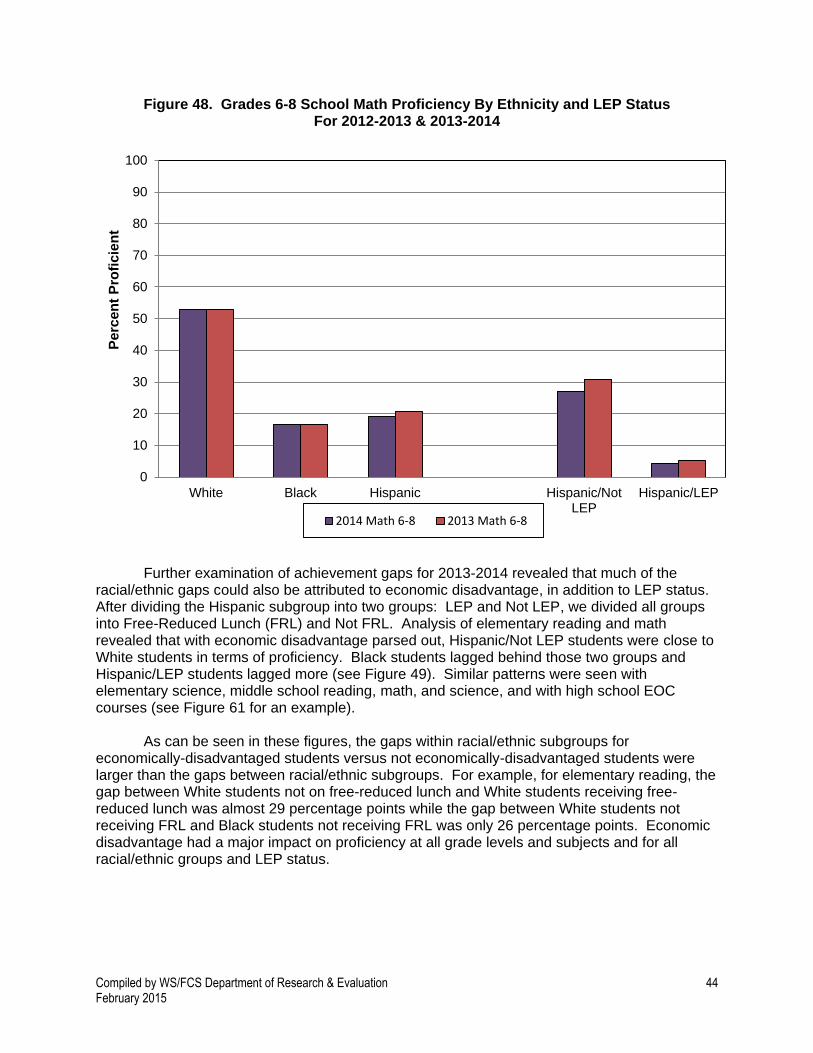
Compiled by WS/FCS Department of Research & Evaluation 44 February 2015
Figure 48. Grades 6-8 School Math Proficiency By Ethnicity and LEP Status For 2012-2013 & 2013-2014
Further examination of achievement gaps for 2013-2014 revealed that much of the racial/ethnic gaps could also be attributed to economic disadvantage, in addition to LEP status. After dividing the Hispanic subgroup into two groups: LEP and Not LEP, we divided all groups into Free-Reduced Lunch (FRL) and Not FRL. Analysis of elementary reading and math revealed that with economic disadvantage parsed out, Hispanic/Not LEP students were close to White students in terms of proficiency. Black students lagged behind those two groups and Hispanic/LEP students lagged more (see Figure 49). Similar patterns were seen with elementary science, middle school reading, math, and science, and with high school EOC courses (see Figure 61 for an example). As can be seen in these figures, the gaps within racial/ethnic subgroups for economically-disadvantaged students versus not economically-disadvantaged students were larger than the gaps between racial/ethnic subgroups. For example, for elementary reading, the gap between White students not on free-reduced lunch and White students receiving free-reduced lunch was almost 29 percentage points while the gap between White students not receiving FRL and Black students not receiving FRL was only 26 percentage points. Economic disadvantage had a major impact on proficiency at all grade levels and subjects and for all racial/ethnic groups and LEP status.
0
10
20
30
40
50
60
70
80
90
100
White Black Hispanic Hispanic/NotLEP
Hispanic/LEP
Pe
rcen
t P
rofi
cie
nt
2014 Math 6-8 2013 Math 6-8
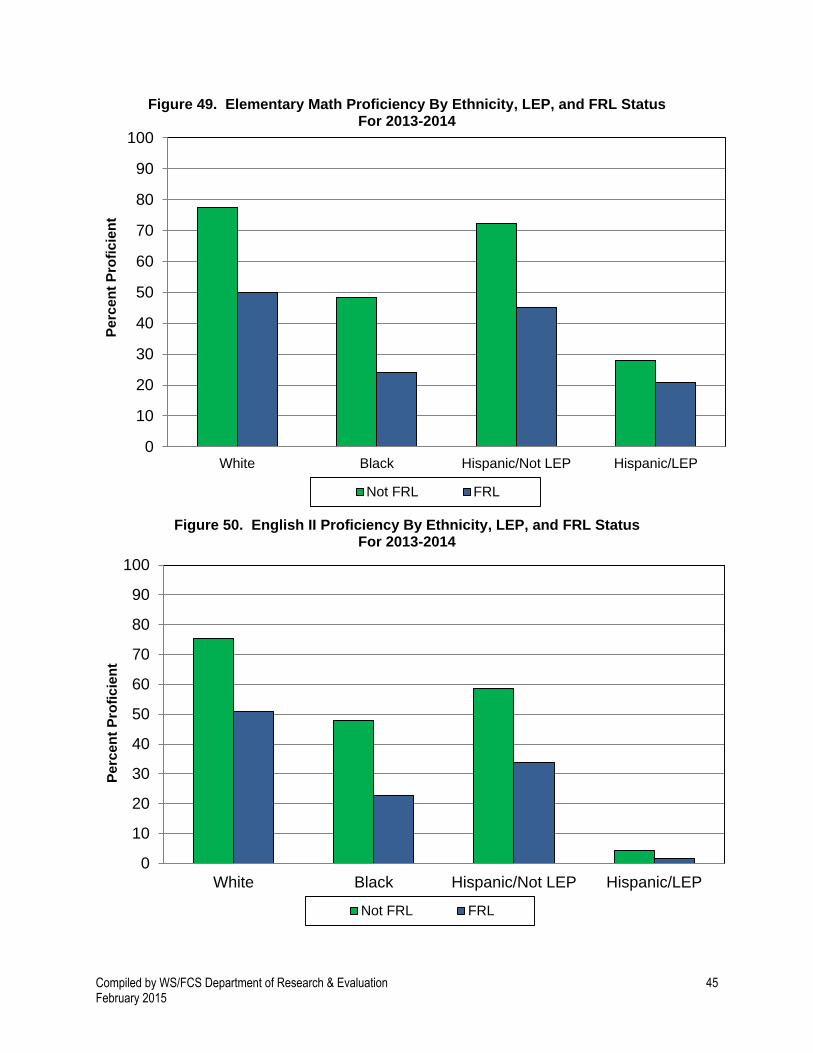
Compiled by WS/FCS Department of Research & Evaluation 45 February 2015
Figure 49. Elementary Math Proficiency By Ethnicity, LEP, and FRL Status For 2013-2014
Figure 50. English II Proficiency By Ethnicity, LEP, and FRL Status
For 2013-2014
0
10
20
30
40
50
60
70
80
90
100
White Black Hispanic/Not LEP Hispanic/LEP
Pe
rcen
t P
rofi
cie
nt
Not FRL FRL
0
10
20
30
40
50
60
70
80
90
100
White Black Hispanic/Not LEP Hispanic/LEP
Perc
en
t P
rofi
cie
nt
Not FRL FRL
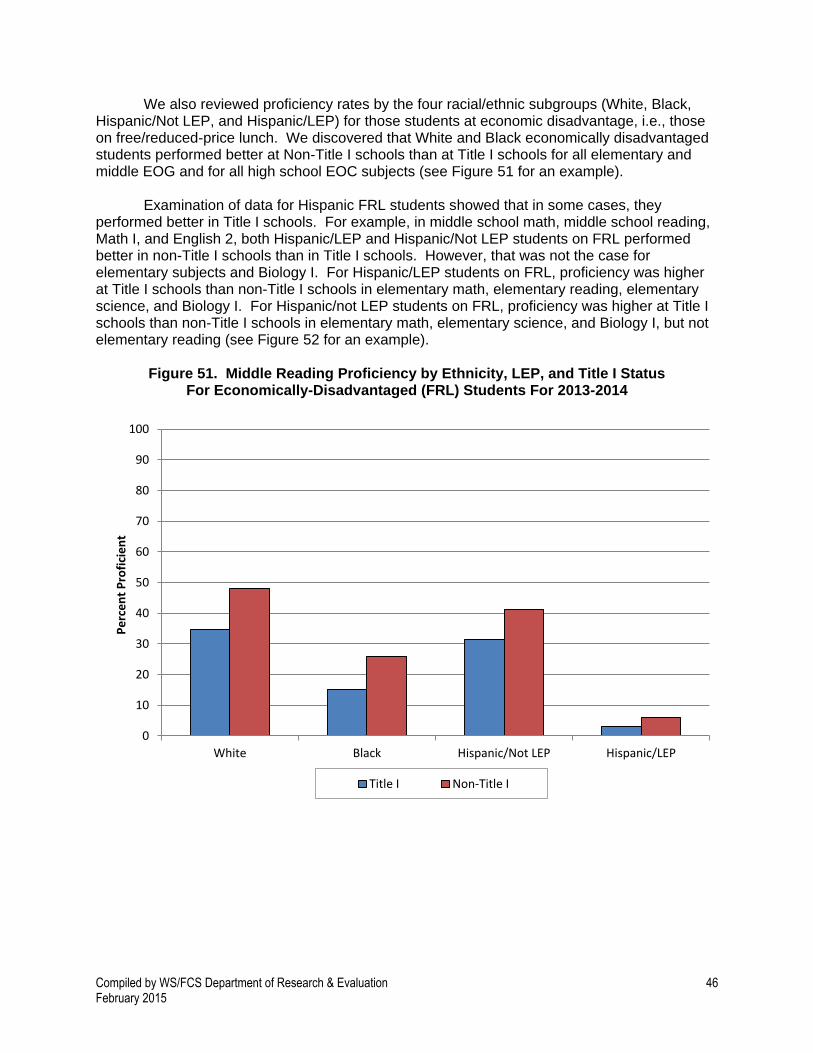
Compiled by WS/FCS Department of Research & Evaluation 46 February 2015
We also reviewed proficiency rates by the four racial/ethnic subgroups (White, Black, Hispanic/Not LEP, and Hispanic/LEP) for those students at economic disadvantage, i.e., those on free/reduced-price lunch. We discovered that White and Black economically disadvantaged students performed better at Non-Title I schools than at Title I schools for all elementary and middle EOG and for all high school EOC subjects (see Figure 51 for an example).
Examination of data for Hispanic FRL students showed that in some cases, they
performed better in Title I schools. For example, in middle school math, middle school reading, Math I, and English 2, both Hispanic/LEP and Hispanic/Not LEP students on FRL performed better in non-Title I schools than in Title I schools. However, that was not the case for elementary subjects and Biology I. For Hispanic/LEP students on FRL, proficiency was higher at Title I schools than non-Title I schools in elementary math, elementary reading, elementary science, and Biology I. For Hispanic/not LEP students on FRL, proficiency was higher at Title I schools than non-Title I schools in elementary math, elementary science, and Biology I, but not elementary reading (see Figure 52 for an example).
Figure 51. Middle Reading Proficiency by Ethnicity, LEP, and Title I Status
For Economically-Disadvantaged (FRL) Students For 2013-2014
0
10
20
30
40
50
60
70
80
90
100
White Black Hispanic/Not LEP Hispanic/LEP
Pe
rce
nt
Pro
fici
en
t
Title I Non-Title I

Compiled by WS/FCS Department of Research & Evaluation 47 February 2015
Figure 52. Elementary Science Proficiency by Ethnicity, LEP, and Title I Status for Economically-Disadvantaged Students for 2013-2014
It should be noted that the gaps within racial/ethnic subgroups between Title I and non-
Title I schools was much smaller than the gaps between those on free-reduced lunch and those not on free-reduced lunch. For example, in elementary reading, the gap for FRL White students at Title I versus non-Title I schools was 12 percentage points compared to the gap between White FRL students and White not-FRL students was 30 percentage points. Likewise, the gap for Hispanic/Not LEP students on FRL between Title I and non-Title I schools was only 3.1 percentage points for elementary reading; yet the gap between Hispanic/Not LEP students on FRL and Hispanic/Not LEP students not on FRL for elementary reading was 37.1 percentage points.
When looking at reading goal summary data for 2013-2014, it was apparent that with the exception of Grade 7, all grades performed slightly better with language than with literature or informational text (see Figure 53). While Grade 3 performed near or better than the state mean in each reading domain, Grade 6 had the lowest percentage of proficient students.
0
10
20
30
40
50
60
70
White Black Hispanic/Not LEP Hispanic/LEP
Pe
rce
nt
Pro
fici
en
t
Title I Non-Title I
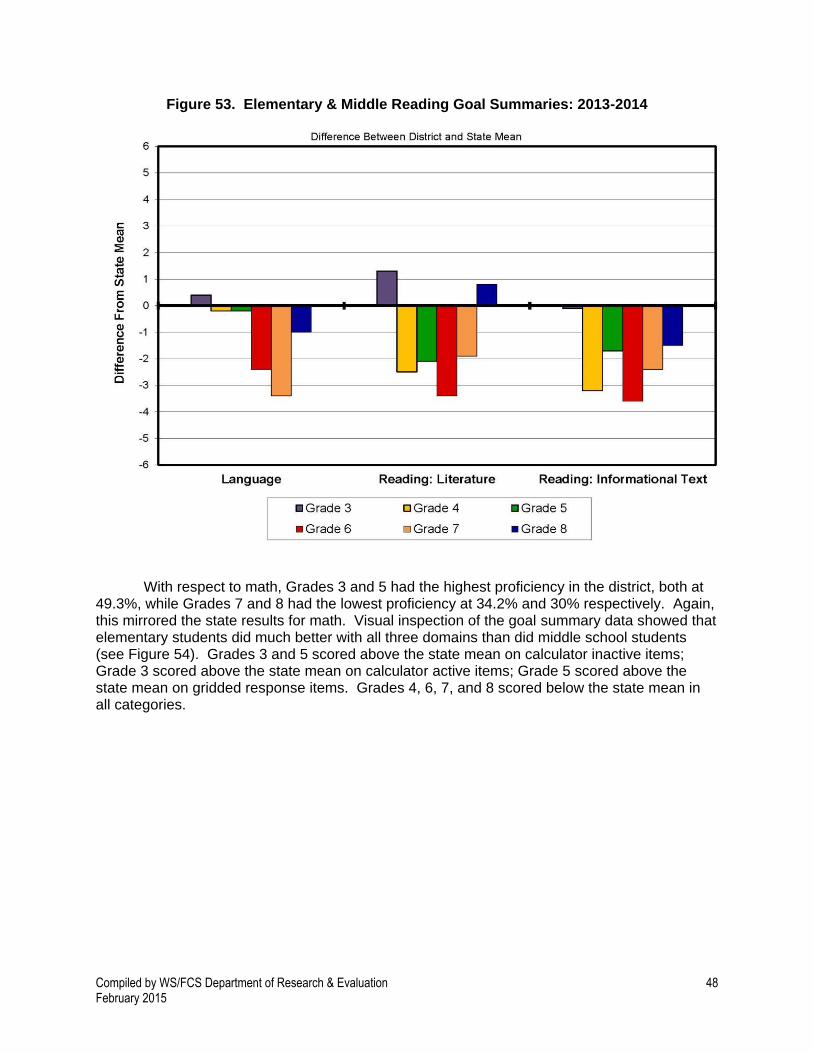
Compiled by WS/FCS Department of Research & Evaluation 48 February 2015
Figure 53. Elementary & Middle Reading Goal Summaries: 2013-2014
With respect to math, Grades 3 and 5 had the highest proficiency in the district, both at 49.3%, while Grades 7 and 8 had the lowest proficiency at 34.2% and 30% respectively. Again, this mirrored the state results for math. Visual inspection of the goal summary data showed that elementary students did much better with all three domains than did middle school students (see Figure 54). Grades 3 and 5 scored above the state mean on calculator inactive items; Grade 3 scored above the state mean on calculator active items; Grade 5 scored above the state mean on gridded response items. Grades 4, 6, 7, and 8 scored below the state mean in all categories.

Compiled by WS/FCS Department of Research & Evaluation 49 February 2015
Figure 54. Elementary & Middle Math Goal Summaries: 2013-2014
Looking across grade levels in elementary math, WS/FCS students performed fairly well in the goal area of Measurement & Data and Geometry, but did not perform as well in the goal area of Numbers & Operations in Base 10 (see Figure 55). Grade 3 performed best in Measurement & Data followed by Operations and Algebraic Thinking and performed least well in Numbers & Operations-Fractions, followed by Geometry. Grade 4 performed best in the goal area of Geometry followed by Operations & Algebraic Thinking and least well in the area of Numbers and Operations in Base 10. Grade 5 performed best at Measurement & Data followed by Operations & Algebraic Thinking and least well at Numbers & Operations in Base 10.
Looking across grade levels in middle school math, WS/FCS students performed below the state mean in all domains (see Figure 56). However, Grade 6 students performed close to the state mean in two of their five goal areas: Geometry and Statistics & Probability. Their lowest performance was in Expressions & Equations followed by Ratios & Proportional Relationships. Grade 7 students performed close to the state mean in Statistics & Probability but lower in all other goal areas. Grade 8 students performed close to the state mean in the area of Functions, but lower in all other goal areas and particularly low in The Number System.

Compiled by WS/FCS Department of Research & Evaluation 50 February 2015
Figure 55. Elementary Math Goal Summaries: 2013-2014
Figure 56. Middle Math Goal Summaries: 2013-2014
-6
-5
-4
-3
-2
-1
0
1
2
3
4
5
6
Ratios &Proportional
Relationships
The NumberSystem
Expressionsand Equations
Geometry Statistics &Probability
Functions
Dif
fere
nc
e F
rom
Sta
te M
ea
n
Grade 6 Grade 7 Grade 8

Compiled by WS/FCS Department of Research & Evaluation 51 February 2015
With respect to science, Grade 8 had a higher proficiency at 60.9% than did Grade 5 at 50.7%. The state had similar percentages (61.9% and 52.6%, respectively). Examination of goal summaries indicated that overall Grades 5 and 8 did better in the area of Earth Science than in either Physical Science or Life Science. Within Physical Science goals, students in Grade 5 performed above the state mean in the goal areas of Forces & Motion and Matter: Properties & Change. The lowest goal area for fifth grade students was Energy: Conservation & Transfer. In Life Science, fifth graders performed best in Structures & Functions of Living Organisms and Evolution & Genetics and least in Ecosystems. (See Figures 57-59.) Looking across science domains, fifth graders were in most need of improvement in the goal area of Energy: Conservation & Transfer within the Physical Science domain. At the middle school level, eighth grade students performed fairly well across all sciences when compared to the state means, performing best in Earth Science. Within Physical Science goals, they performed slightly better within the domain of Energy: Conservation & Transfer than Matter: Properties & Change. Within the domain of Life Sciences, eighth graders performed best in Molecular Biology and Structures & Functions of Living Organisms and least in Ecosystems. Looking across science domains, eighth graders were in most need of improvement in the goal area of Matter: Properties & Change within the Physical Science domain and Ecosystems within the domain of Life Sciences.
Figure 57. Elementary & Middle Physical Science Goal Summaries: 2013-2014

Compiled by WS/FCS Department of Research & Evaluation 52 February 2015
Figure 58. Elementary & Middle Earth Science Goal Summaries: 2013-2014
Figure 59. Elementary & Middle Life Science Goal Summaries: 2013-2014
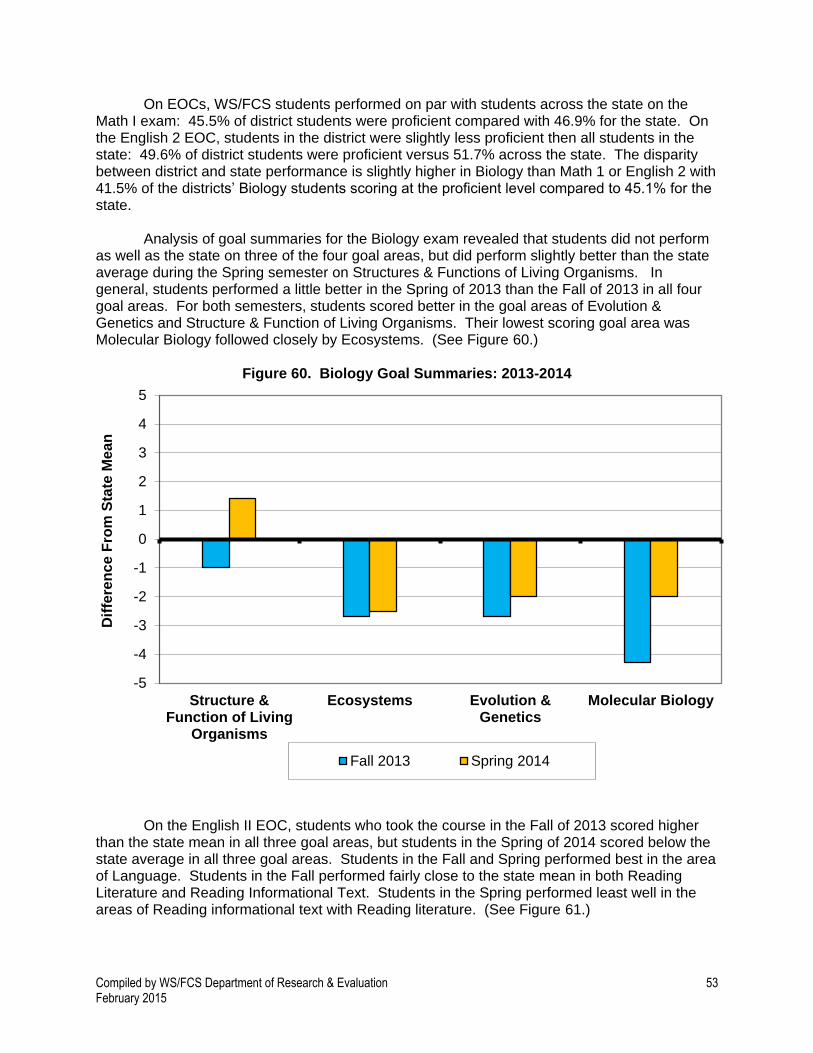
Compiled by WS/FCS Department of Research & Evaluation 53 February 2015
On EOCs, WS/FCS students performed on par with students across the state on the Math I exam: 45.5% of district students were proficient compared with 46.9% for the state. On the English 2 EOC, students in the district were slightly less proficient then all students in the state: 49.6% of district students were proficient versus 51.7% across the state. The disparity between district and state performance is slightly higher in Biology than Math 1 or English 2 with 41.5% of the districts’ Biology students scoring at the proficient level compared to 45.1% for the state. Analysis of goal summaries for the Biology exam revealed that students did not perform as well as the state on three of the four goal areas, but did perform slightly better than the state average during the Spring semester on Structures & Functions of Living Organisms. In general, students performed a little better in the Spring of 2013 than the Fall of 2013 in all four goal areas. For both semesters, students scored better in the goal areas of Evolution & Genetics and Structure & Function of Living Organisms. Their lowest scoring goal area was Molecular Biology followed closely by Ecosystems. (See Figure 60.)
Figure 60. Biology Goal Summaries: 2013-2014
On the English II EOC, students who took the course in the Fall of 2013 scored higher than the state mean in all three goal areas, but students in the Spring of 2014 scored below the state average in all three goal areas. Students in the Fall and Spring performed best in the area of Language. Students in the Fall performed fairly close to the state mean in both Reading Literature and Reading Informational Text. Students in the Spring performed least well in the areas of Reading informational text with Reading literature. (See Figure 61.)
-5
-4
-3
-2
-1
0
1
2
3
4
5
Structure &Function of Living
Organisms
Ecosystems Evolution &Genetics
Molecular Biology
Dif
fere
nc
e F
rom
Sta
te M
ea
n
Fall 2013 Spring 2014
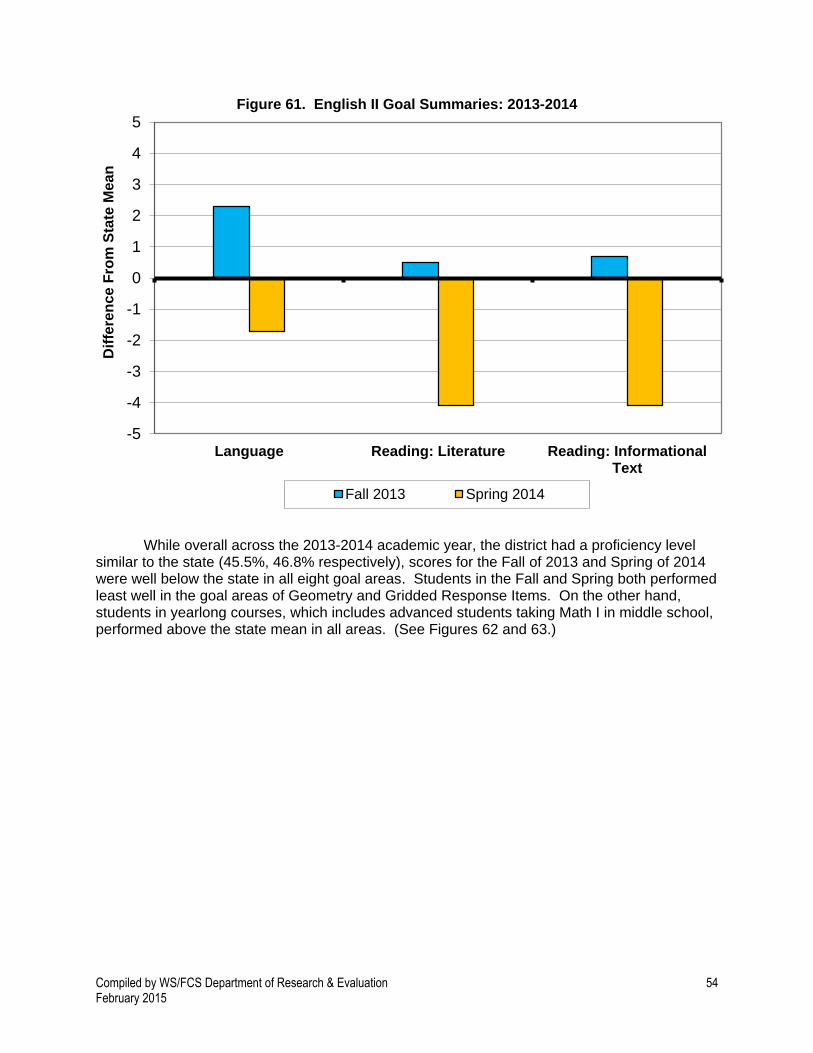
Compiled by WS/FCS Department of Research & Evaluation 54 February 2015
Figure 61. English II Goal Summaries: 2013-2014
While overall across the 2013-2014 academic year, the district had a proficiency level similar to the state (45.5%, 46.8% respectively), scores for the Fall of 2013 and Spring of 2014 were well below the state in all eight goal areas. Students in the Fall and Spring both performed least well in the goal areas of Geometry and Gridded Response Items. On the other hand, students in yearlong courses, which includes advanced students taking Math I in middle school, performed above the state mean in all areas. (See Figures 62 and 63.)
-5
-4
-3
-2
-1
0
1
2
3
4
5
Language Reading: Literature Reading: InformationalText
Dif
fere
nce F
rom
Sta
te M
ean
Fall 2013 Spring 2014

Compiled by WS/FCS Department of Research & Evaluation 55 February 2015
Figure 62. Math I Goal Summaries 2013-2014: Part A
Figure 63. Math I Goal Summaries 2013-2014: Part B
-14
-12
-10
-8
-6
-4
-2
0
2
4
6
8
10
12
14
Calculator Inactive Gridded Response Items Calculator Active
Dif
fere
nce F
rom
Sta
te M
ean
Yearlong Fall 2013 Spring 2014
-14
-12
-10
-8
-6
-4
-2
0
2
4
6
8
10
12
14
Algebra Functions Geometry Number &Quantity
Statistics &Probability
Dif
fere
nce F
rom
Sta
te M
ean
Yearlong Fall 2013 Spring 2014

Compiled by WS/FCS Department of Research & Evaluation 56 February 2015
All 11th grade students in the state of North Carolina took the ACT in the spring of 2014. The ACT provides scores on four major tests (English, Math, Reading, Science) and a composite score. Scores on each of the four tests and the composite can range from 1 to 36. Students in the WS/FCS district had average scores on the composite and each of the four tests that ranged from 17.1 to 19.6 and were slightly higher than the state averages (see Figure 63). The national composite average of 21 was much higher than our district’s composite average of 18.9 and the state’s composite average of 18.5. WS/FCS students scored highest in Math (mean = 19.6); next highest average score was for Science (mean = 28.6), followed by Reading (mean = 18.9). The lowest area for students in the district was English with a mean of 17.1. When examining data over time, all average scores in 2013 were higher than the scores in 2012 with English demonstrating the greatest gain (from 16.7 in 2012 to 17.4 in 2013). Most scores in 2014 were either consistent or slightly higher than the scores in 2013 with the exception of English, which in 2014 dropped slightly from average of 17.4 to 17.1. To determine college readiness, ACT provides benchmark scores for each test. Each subtest has a benchmark ranging from 18 to 23. Scores at or above the benchmark suggest success in entry-level courses in that area; for example, scores at or above the benchmark in math are predictive of success in college algebra. In 2012, less than half of our students met the benchmark for any of the four tests and only 16% met the benchmarks in all four areas. The highest area for the district was English, with 41% of our students meeting the benchmark for college readiness. For 2013, again English was the area in which our students were most prepared for college with 46% of our students meeting the benchmark. Our next highest areas was Reading with 37% meeting the benchmark, followed by Math with 35% at or above the benchmark. Less than 20% of district students were at benchmark in Science. For 2014, similar results indicated English was once again the area in which WSFCS students were most prepared with 43.4% meeting benchmark. Our next areas were Math with 32.8%, Reading with 32.0%, and Writing with 31.6% of students meeting benchmark. Although the area with the fewest students meeting benchmark was science again this year, 28.6% met benchmark in 2014, which is an improvement from 2013 (See Figure 64.)
Figure 64. Average Scores on ACT: 2014
17.1
19.6
18.9
19.3
18.9
17
19.2
18.7
18.6
18.5
0 5 10 15 20 25
English
Math
Reading
Science
Composite
Average ScoreDistrict State
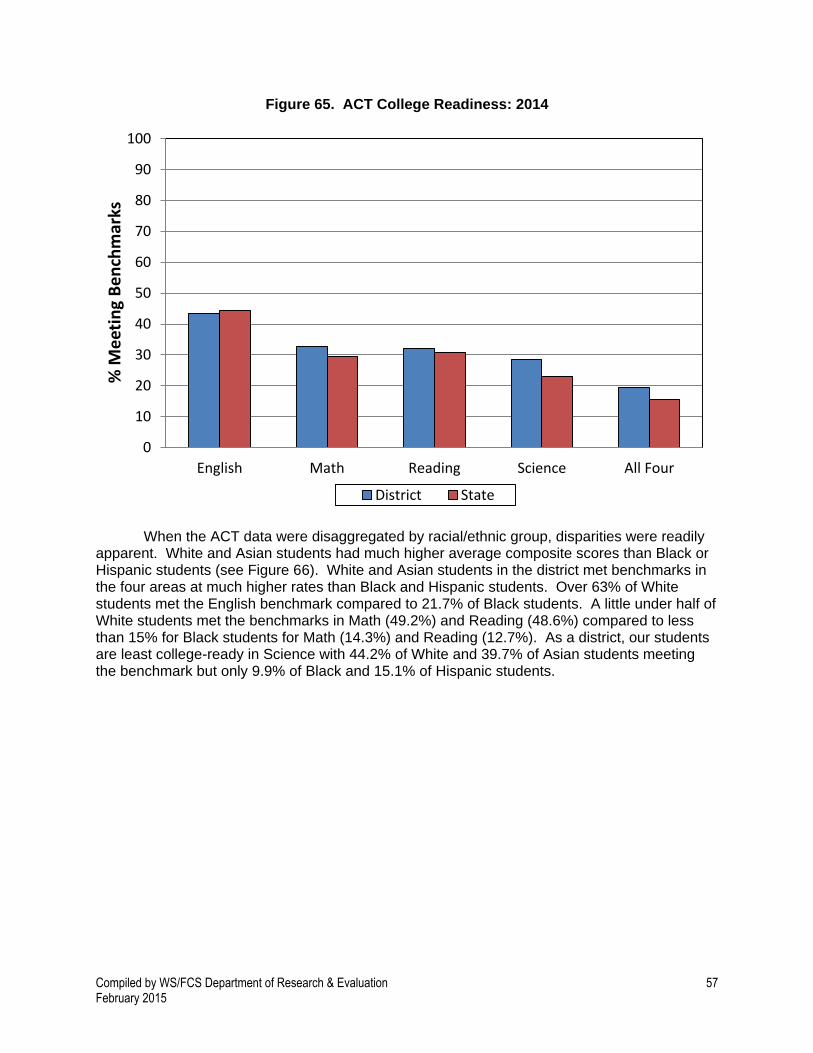
Compiled by WS/FCS Department of Research & Evaluation 57 February 2015
Figure 65. ACT College Readiness: 2014
When the ACT data were disaggregated by racial/ethnic group, disparities were readily apparent. White and Asian students had much higher average composite scores than Black or Hispanic students (see Figure 66). White and Asian students in the district met benchmarks in the four areas at much higher rates than Black and Hispanic students. Over 63% of White students met the English benchmark compared to 21.7% of Black students. A little under half of White students met the benchmarks in Math (49.2%) and Reading (48.6%) compared to less than 15% for Black students for Math (14.3%) and Reading (12.7%). As a district, our students are least college-ready in Science with 44.2% of White and 39.7% of Asian students meeting the benchmark but only 9.9% of Black and 15.1% of Hispanic students.
0
10
20
30
40
50
60
70
80
90
100
English Math Reading Science All Four
% M
eet
ing
Be
nch
mar
ks
District State
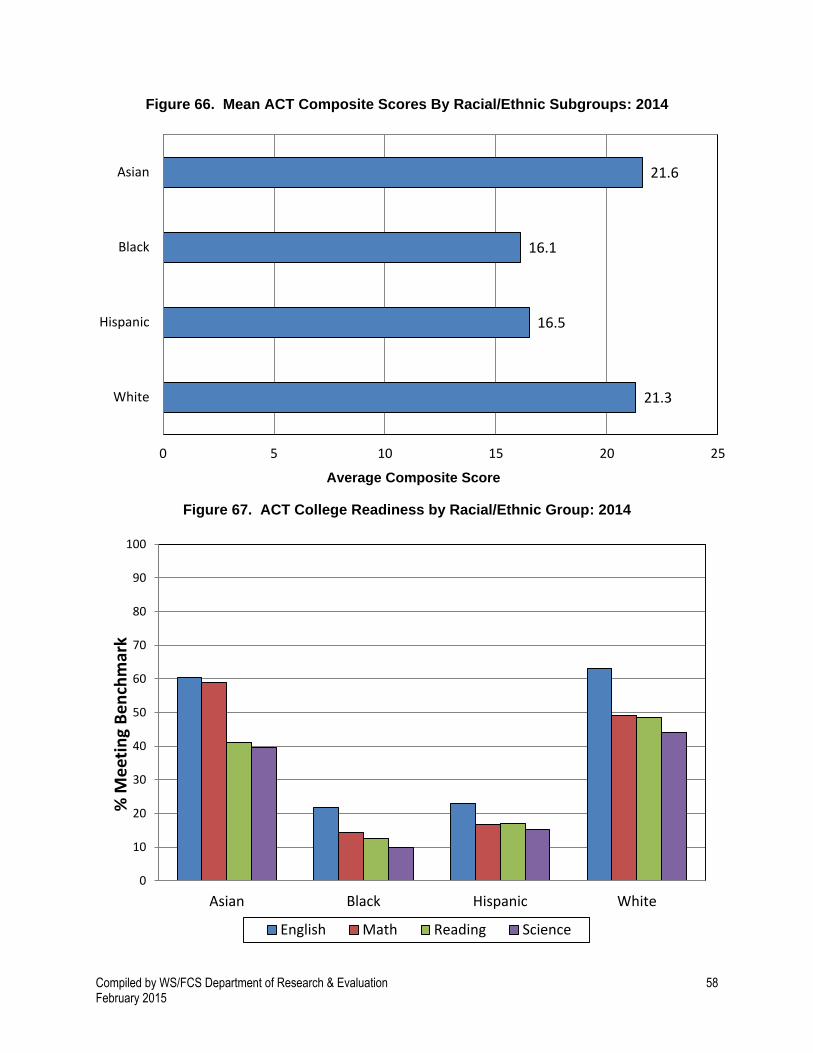
Compiled by WS/FCS Department of Research & Evaluation 58 February 2015
Figure 66. Mean ACT Composite Scores By Racial/Ethnic Subgroups: 2014
Figure 67. ACT College Readiness by Racial/Ethnic Group: 2014
21.6
16.1
16.5
21.3
0 5 10 15 20 25
Asian
Black
Hispanic
White
Average Composite Score
0
10
20
30
40
50
60
70
80
90
100
Asian Black Hispanic White
% M
eet
ing
Be
nch
mar
k
English Math Reading Science
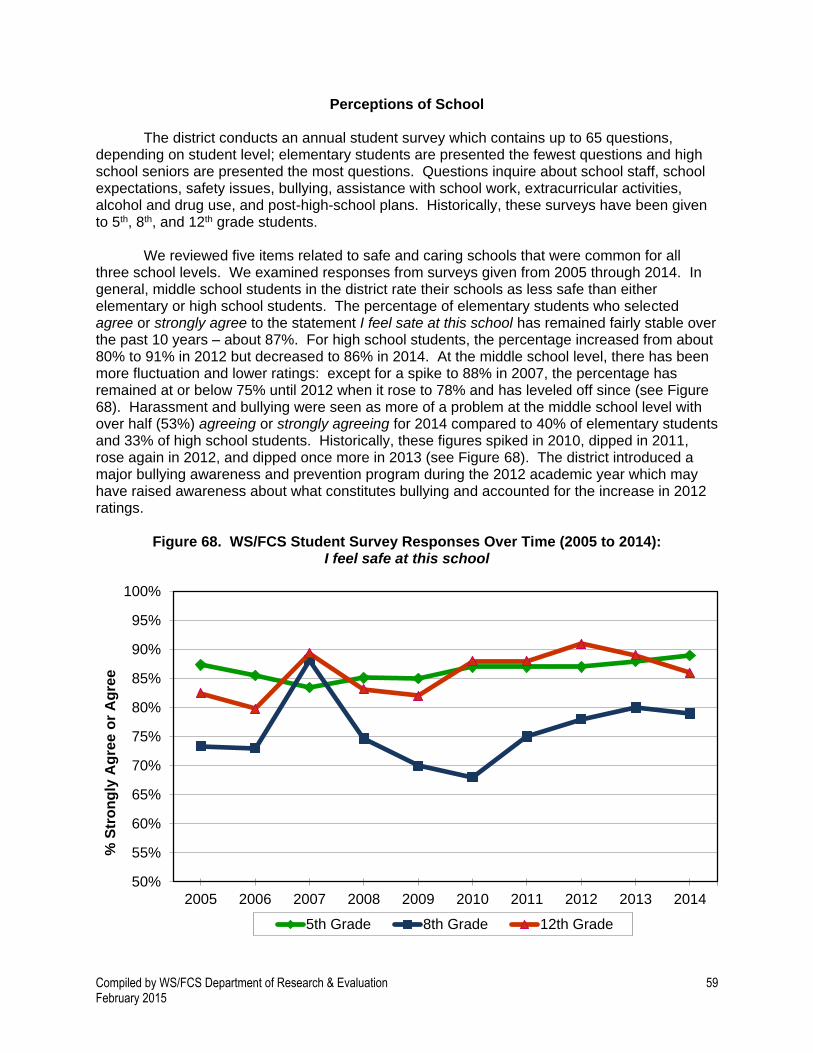
Compiled by WS/FCS Department of Research & Evaluation 59 February 2015
Perceptions of School
The district conducts an annual student survey which contains up to 65 questions, depending on student level; elementary students are presented the fewest questions and high school seniors are presented the most questions. Questions inquire about school staff, school expectations, safety issues, bullying, assistance with school work, extracurricular activities, alcohol and drug use, and post-high-school plans. Historically, these surveys have been given to 5th, 8th, and 12th grade students.
We reviewed five items related to safe and caring schools that were common for all three school levels. We examined responses from surveys given from 2005 through 2014. In general, middle school students in the district rate their schools as less safe than either elementary or high school students. The percentage of elementary students who selected agree or strongly agree to the statement I feel sate at this school has remained fairly stable over the past 10 years – about 87%. For high school students, the percentage increased from about 80% to 91% in 2012 but decreased to 86% in 2014. At the middle school level, there has been more fluctuation and lower ratings: except for a spike to 88% in 2007, the percentage has remained at or below 75% until 2012 when it rose to 78% and has leveled off since (see Figure 68). Harassment and bullying were seen as more of a problem at the middle school level with over half (53%) agreeing or strongly agreeing for 2014 compared to 40% of elementary students and 33% of high school students. Historically, these figures spiked in 2010, dipped in 2011, rose again in 2012, and dipped once more in 2013 (see Figure 68). The district introduced a major bullying awareness and prevention program during the 2012 academic year which may have raised awareness about what constitutes bullying and accounted for the increase in 2012 ratings.
Figure 68. WS/FCS Student Survey Responses Over Time (2005 to 2014): I feel safe at this school
50%
55%
60%
65%
70%
75%
80%
85%
90%
95%
100%
2005 2006 2007 2008 2009 2010 2011 2012 2013 2014
% S
tro
ng
ly A
gre
e o
r A
gre
e
5th Grade 8th Grade 12th Grade
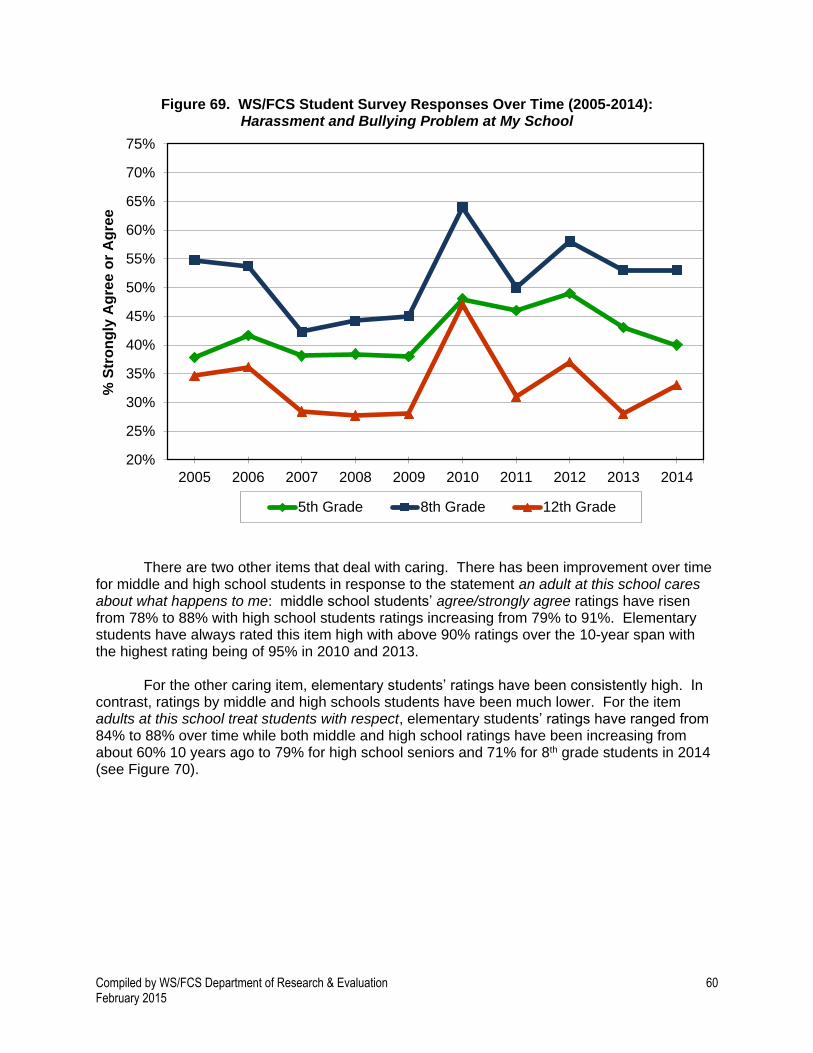
Compiled by WS/FCS Department of Research & Evaluation 60 February 2015
Figure 69. WS/FCS Student Survey Responses Over Time (2005-2014): Harassment and Bullying Problem at My School
There are two other items that deal with caring. There has been improvement over time for middle and high school students in response to the statement an adult at this school cares about what happens to me: middle school students’ agree/strongly agree ratings have risen from 78% to 88% with high school students ratings increasing from 79% to 91%. Elementary students have always rated this item high with above 90% ratings over the 10-year span with the highest rating being of 95% in 2010 and 2013.
For the other caring item, elementary students’ ratings have been consistently high. In contrast, ratings by middle and high schools students have been much lower. For the item adults at this school treat students with respect, elementary students’ ratings have ranged from 84% to 88% over time while both middle and high school ratings have been increasing from about 60% 10 years ago to 79% for high school seniors and 71% for 8th grade students in 2014 (see Figure 70).
20%
25%
30%
35%
40%
45%
50%
55%
60%
65%
70%
75%
2005 2006 2007 2008 2009 2010 2011 2012 2013 2014
% S
tro
ng
ly A
gre
e o
r A
gre
e
5th Grade 8th Grade 12th Grade
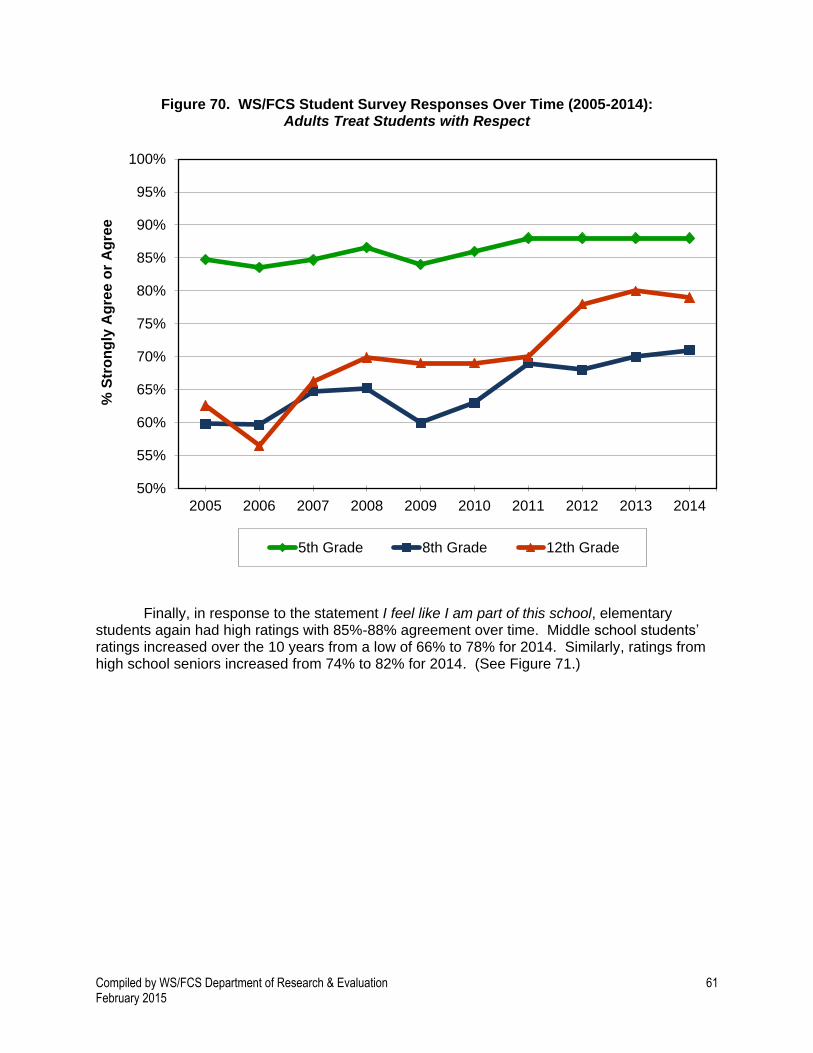
Compiled by WS/FCS Department of Research & Evaluation 61 February 2015
Figure 70. WS/FCS Student Survey Responses Over Time (2005-2014): Adults Treat Students with Respect
Finally, in response to the statement I feel like I am part of this school, elementary students again had high ratings with 85%-88% agreement over time. Middle school students’ ratings increased over the 10 years from a low of 66% to 78% for 2014. Similarly, ratings from high school seniors increased from 74% to 82% for 2014. (See Figure 71.)
50%
55%
60%
65%
70%
75%
80%
85%
90%
95%
100%
2005 2006 2007 2008 2009 2010 2011 2012 2013 2014
% S
tro
ng
ly A
gre
e o
r A
gre
e
5th Grade 8th Grade 12th Grade

Compiled by WS/FCS Department of Research & Evaluation 62 February 2015
Figure 71. WS/FCS Student Survey Responses Over Time (2005-2014):: I Feel Like I am Part of This School
Research has demonstrated that teachers’ perceptions of certain working conditions
influence schools’ ability to improve student performance, as well as the ability to retain teachers. The North Carolina Teacher Working Conditions (TWC) Survey was conducted statewide in the spring of 2014. The response rate for teachers in the WS/FCS district was 85%, slightly lower than the statewide response rate of 89%. Teachers rated their school on eight domains: time, facilities and resources, community support and involvement, managing student conduct, teacher leadership, school leadership, professional development, and instructional practices and support.
For both the district and the state, Time was the lowest rated domain for teachers. An
examination of key indicators and overall items indicated that perceptions of Forsyth County teachers were approximately equivalent to teachers statewide (within two percentage points) for the domains of Facilities and Resources, Professional Development, and Instructional Practices along with the overall question of the school being a good place to work and a question about utilizing the TWC survey results (see Figure 72 and Table 2).
For the domains of Community Support, Managing Student Conduct, and Teacher
Leadership, WS/FCS ratings were slightly lower than ratings across the state (two to three percentage points different). The greatest areas of difference from the state were the domains of Time and School Leadership, with 4 and 4.5 percentage points lower than the state, respectively. Both of those areas saw improvement from 2012 TWC ratings. The key indicator
50%
55%
60%
65%
70%
75%
80%
85%
90%
95%
100%
2005 2006 2007 2008 2009 2010 2011 2012 2013 2014
% S
tro
ng
ly A
gre
e o
r A
gre
e
5th Grade 8th Grade 12th Grade
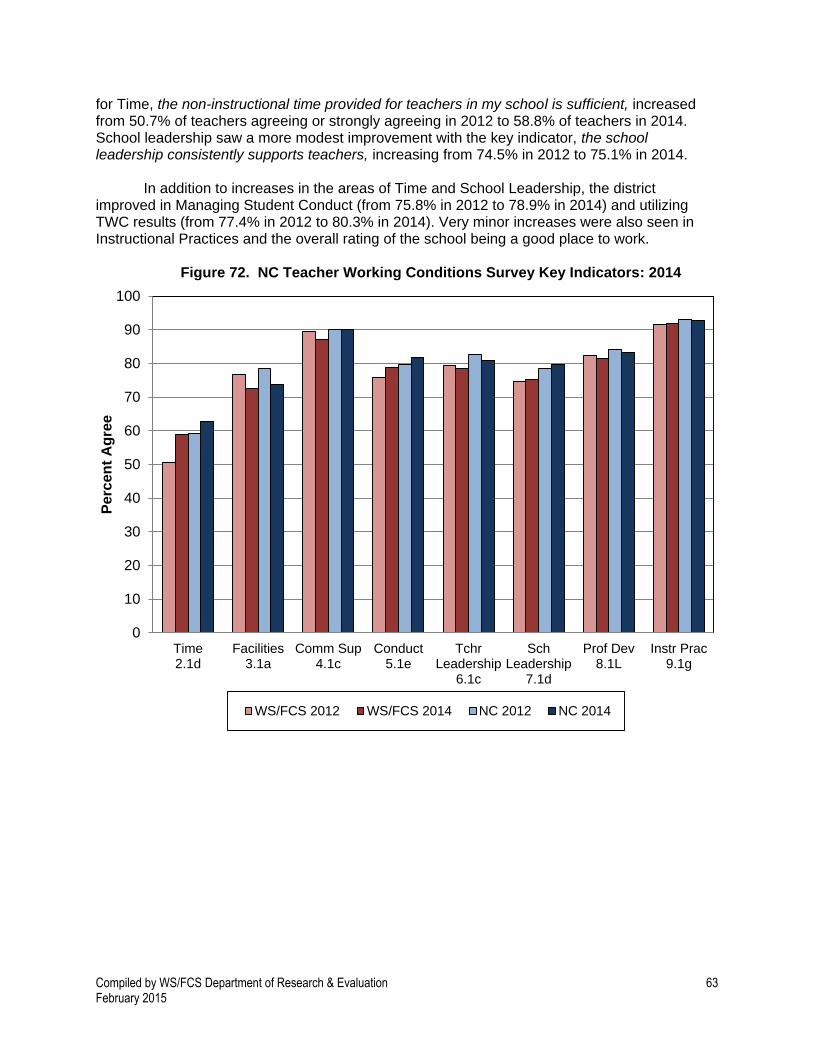
Compiled by WS/FCS Department of Research & Evaluation 63 February 2015
for Time, the non-instructional time provided for teachers in my school is sufficient, increased from 50.7% of teachers agreeing or strongly agreeing in 2012 to 58.8% of teachers in 2014. School leadership saw a more modest improvement with the key indicator, the school leadership consistently supports teachers, increasing from 74.5% in 2012 to 75.1% in 2014.
In addition to increases in the areas of Time and School Leadership, the district
improved in Managing Student Conduct (from 75.8% in 2012 to 78.9% in 2014) and utilizing TWC results (from 77.4% in 2012 to 80.3% in 2014). Very minor increases were also seen in Instructional Practices and the overall rating of the school being a good place to work.
Figure 72. NC Teacher Working Conditions Survey Key Indicators: 2014
0
10
20
30
40
50
60
70
80
90
100
Time2.1d
Facilities3.1a
Comm Sup4.1c
Conduct5.1e
TchrLeadership
6.1c
SchLeadership
7.1d
Prof Dev8.1L
Instr Prac9.1g
Perc
en
t A
gre
e
WS/FCS 2012 WS/FCS 2014 NC 2012 NC 2014

Compiled by WS/FCS Department of Research & Evaluation 64 February 2015
Table 2. Teacher Working Conditions (TWC) Survey Construct Indicator Worksheet: 2014
Question District (D) State (St) Priority
TIME 2.1d: The Non-Instructional time provided for
teachers in my school is sufficient.
2014 58.8 62.8
2012 50.7 D-St
2014-2012 + 8.1 -4.0
Question District (D) State (St) Priority
FACILITIES AND RESOURCES 3.1a: Teachers
have sufficient access to appropriate instructional
materials.
2014 72.7 73.6
2012 76.6 D-St
2014-2012 -3.9 -0.9
Question District (D) State (St) Priority
COMMUNITY SUPPORT 4.1c: This school does a
good job of encouraging parent/guardian involvement.
2014 87.1 90.0
2012 89.5 D-St
2014-2012 -2.4 -2.9
Question District (D) State (St) Priority
MANAGING STUDENT CONDUCT 5.1e: School
administrators support teachers' efforts to maintain
discipline in the classroom.
2014 78.9 81.9
2012 75.8 D-St
2014-2012 +3.1 -3.0
Question District (D) State (St) Priority
TEACHER LEADERSHIP 6.1c: Teachers are relied
upon to make decisions about educational issues.
2014 78.4 81.0
2012 79.4 D-St
2014-2012 -1.0 -2.6
Question District (D) State (St) Priority
SCHOOL LEADERSHIP 7.1d: The school leadership
consistently supports teachers.
2014 75.1 79.6
2012 74.5 D-St
2014-2012 +0.6 -4.5
Question District (D) State (St) Priority
PROFESSIONAL DEVELOPMENT 8.1l:
Professional development enhances teachers’ ability to
implement instructional strategies that meet diverse
student needs.
2014 81.5 83.3
2012 82.3 D-St
2014-2012
-1.3
-1.8
Question District (D) State (St) Priority
INSTRUCTIONAL PRACTICES 9.1g: Teachers are
encouraged to try new things to improve instruction.
2014 92.0 92.9
2012 91.6 D-St
2014-2012 +0.4 -0.9
Question District (D) State (St) Priority
OVERALL 10.6: Overall, my school is a good place to
work and learn.
2014 84.0 85.1
2012 83.9 D-St
2014-2012 +0.1 -1.1
Question District (D) State (St) Priority
OVERALL 10.7: At this school, we utilize the results
from the 2012 NC TWC Survey as a tool for school
improvement.
2014 80.3 81.2
2012 77.4 D-St
2014-2012 +2.9 -0.9

Compiled by WS/FCS Department of Research & Evaluation 65 February 2015
Professional Capacity
The WS/FCS district employs about 4,000 teachers and 81 principals. Data for 2013-2014 has not yet been released. Therefore, when looking at data from 2012-2013, on average, teachers in the district had 13.7 years of experience with Title I teachers having less experience (average = 12.6 years) than teachers in non-Title I schools (average = 14.7 years). Teacher turnover rates varied slightly by school level but in general, our district had very similar turnover rates to the state (see Table 3). However, turnover rates in Title I schools were higher than non-Title I schools at all levels.
Table 3. Teacher Turnover Rates: 2012-2013
School Level State of NC WS/FCS Title I Non-Title I
Elementary 13% 12% 14% 9%
Middle 16% 15% 17% 15%
High 16% 13% 20% 15%
The disparity between Title I and non-Title I schools was even more apparent with
National Board Certification (see Table 4). The district had, on average, five teachers with National Board Certification per elementary and middle school and 11 per high school; those numbers were comparable to the statewide averages. Title I elementary and middle schools averaged one to two fewer NBC teachers per school than non-Title schools. But at the high school level, the average number of National Board Certified teachers in non-Title I schools (14) far outpaced the average number in Title I schools (5) by almost three to one.
Table 4. Average Number of National Board Certified Teachers Per School: 2012-2013
School Level State of NC WS/FCS Title I Non-Title I
Elementary 6 5 4 6
Middle 6 5 4 5
High 10 11 5 14
As a group, the district’s principals were more experienced than principals across the state: only 25% of the district’s principals had less than 4 years of experience compared to 43% for the state as a whole. However, over the past 5 years, the experience level of our principals has decreased: In 2007-2008, 31% of the district’s principals had more than 10 years of experience compared to 17% in 2012-2013. WS/FCS principals had more education with 34% holding a degree beyond the master’s compared to 21% statewide. Our principal turnover rate (8%) was comparable to the state rate (10%).

Compiled by WS/FCS Department of Research & Evaluation 66 February 2015
The new North Carolina Educator Evaluation System for teachers includes six standards. Standard 6 is based on growth models from EVAAS. The other standards are assessed through observations by school administrators. Those five standards are as follows:
1. Teachers demonstrate leadership. 2. Teachers establish a respectful environment for a diverse population of students. 3. Teachers know the content they teach. 4. Teachers facilitate learning for their students. 5. Teachers reflect on their practice.
Each standard has a rubric with five levels: not demonstrated, developing, proficient, accomplished, and distinguished. District-level data for 2012-2013 (see Figure 73) indicated that, as a whole, WS/FCS teachers were performing highest on Standard #1 (Teachers demonstrate leadership), closely followed by Standard #2 (Teachers establish a respectful environment for a diverse population of students) and Standard #4 (Teachers facilitate learning for their students). The district’s teachers needed the most improvement on Standard #5 (Teachers reflect on their practice) and Standard #3 (Teachers know the content they teach). Data was not available for the 2014-2015 school year at the time of this report.
Figure 73. 2013 NC Educator Evaluation System Ratings of 3,506 WS/FCS Teachers
0%
10%
20%
30%
40%
50%
60%
70%
80%
90%
100%
#1 Leadership #2 Diversity #3 Content #4 Learning #5 Reflection
Pe
rce
nt
of
Te
ac
he
rs
Teacher Standards
Not Demonstrated Developing Proficient Accomplished Distinguished
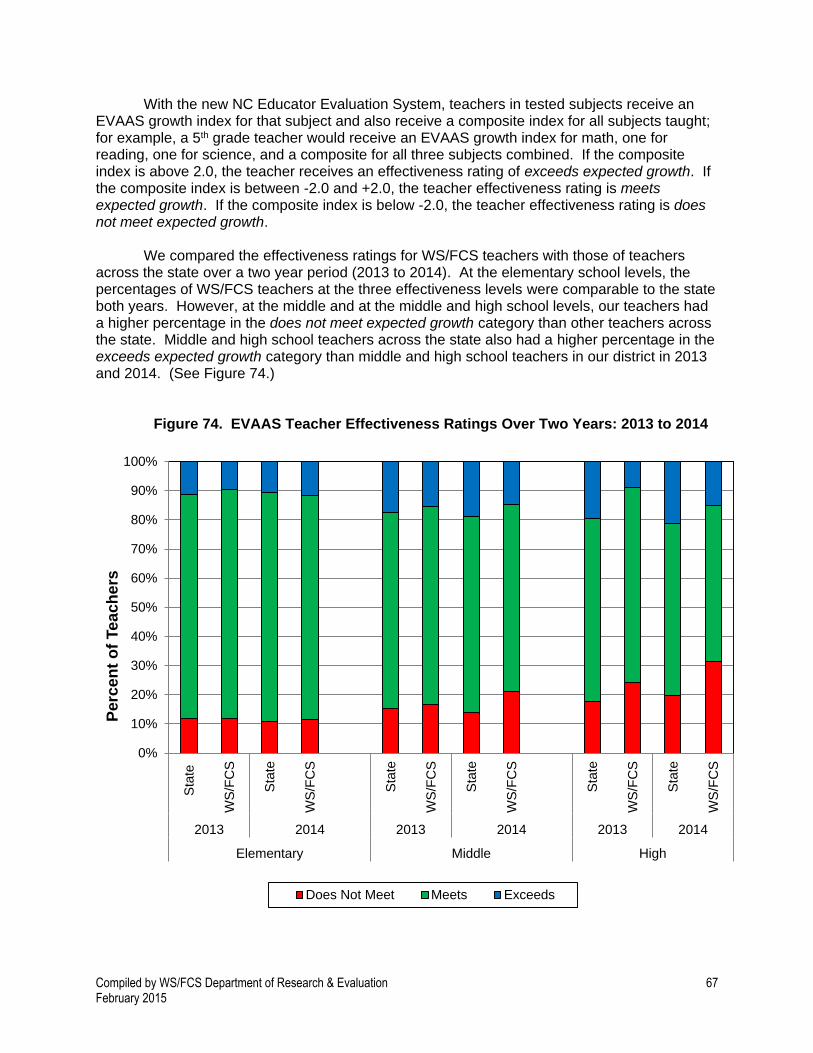
Compiled by WS/FCS Department of Research & Evaluation 67 February 2015
With the new NC Educator Evaluation System, teachers in tested subjects receive an EVAAS growth index for that subject and also receive a composite index for all subjects taught; for example, a 5th grade teacher would receive an EVAAS growth index for math, one for reading, one for science, and a composite for all three subjects combined. If the composite index is above 2.0, the teacher receives an effectiveness rating of exceeds expected growth. If the composite index is between -2.0 and +2.0, the teacher effectiveness rating is meets expected growth. If the composite index is below -2.0, the teacher effectiveness rating is does not meet expected growth.
We compared the effectiveness ratings for WS/FCS teachers with those of teachers
across the state over a two year period (2013 to 2014). At the elementary school levels, the percentages of WS/FCS teachers at the three effectiveness levels were comparable to the state both years. However, at the middle and at the middle and high school levels, our teachers had a higher percentage in the does not meet expected growth category than other teachers across the state. Middle and high school teachers across the state also had a higher percentage in the exceeds expected growth category than middle and high school teachers in our district in 2013 and 2014. (See Figure 74.)
Figure 74. EVAAS Teacher Effectiveness Ratings Over Two Years: 2013 to 2014
0%
10%
20%
30%
40%
50%
60%
70%
80%
90%
100%
Sta
te
WS
/FC
S
Sta
te
WS
/FC
S
Sta
te
WS
/FC
S
Sta
te
WS
/FC
S
Sta
te
WS
/FC
S
Sta
te
WS
/FC
S
2013 2014 2013 2014 2013 2014
Elementary Middle High
Perc
en
t o
f Teach
ers
Does Not Meet Meets Exceeds
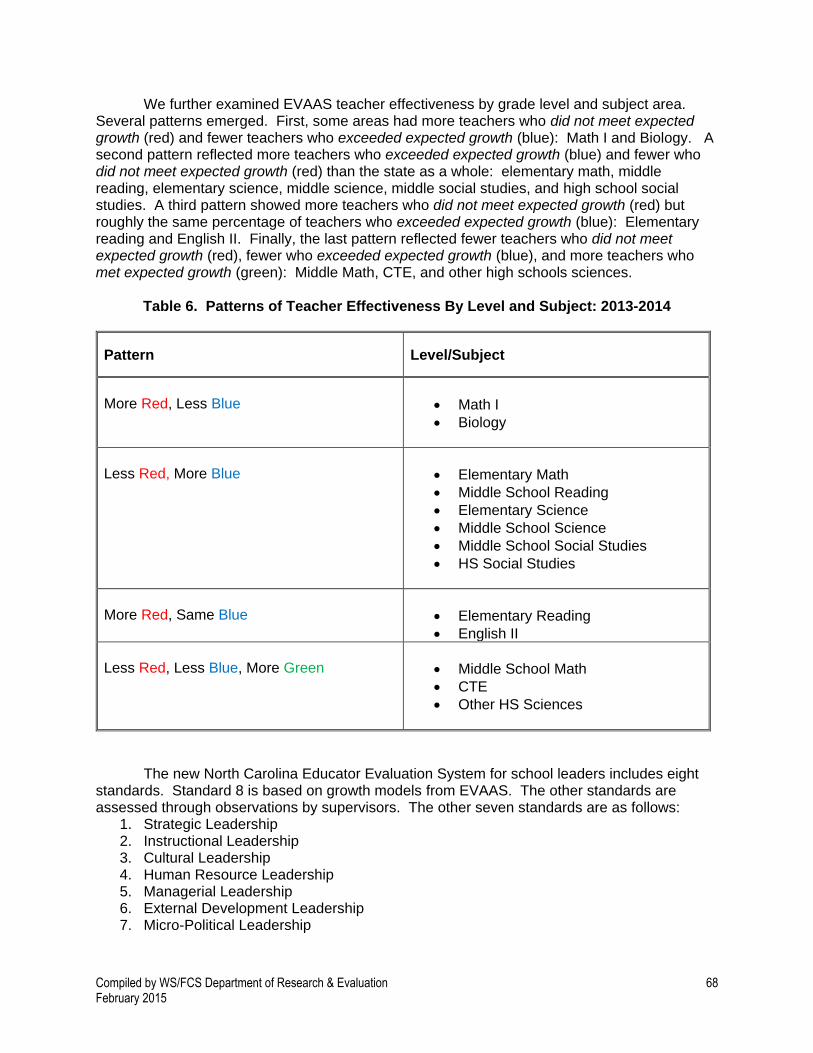
Compiled by WS/FCS Department of Research & Evaluation 68 February 2015
We further examined EVAAS teacher effectiveness by grade level and subject area. Several patterns emerged. First, some areas had more teachers who did not meet expected growth (red) and fewer teachers who exceeded expected growth (blue): Math I and Biology. A second pattern reflected more teachers who exceeded expected growth (blue) and fewer who did not meet expected growth (red) than the state as a whole: elementary math, middle reading, elementary science, middle science, middle social studies, and high school social studies. A third pattern showed more teachers who did not meet expected growth (red) but roughly the same percentage of teachers who exceeded expected growth (blue): Elementary reading and English II. Finally, the last pattern reflected fewer teachers who did not meet expected growth (red), fewer who exceeded expected growth (blue), and more teachers who met expected growth (green): Middle Math, CTE, and other high schools sciences.
Table 6. Patterns of Teacher Effectiveness By Level and Subject: 2013-2014
Pattern Level/Subject
More Red, Less Blue
Math I
Biology
Less Red, More Blue
Elementary Math
Middle School Reading
Elementary Science
Middle School Science
Middle School Social Studies
HS Social Studies
More Red, Same Blue
Elementary Reading
English II
Less Red, Less Blue, More Green
Middle School Math
CTE
Other HS Sciences
The new North Carolina Educator Evaluation System for school leaders includes eight
standards. Standard 8 is based on growth models from EVAAS. The other standards are assessed through observations by supervisors. The other seven standards are as follows:
1. Strategic Leadership 2. Instructional Leadership 3. Cultural Leadership 4. Human Resource Leadership 5. Managerial Leadership 6. External Development Leadership 7. Micro-Political Leadership
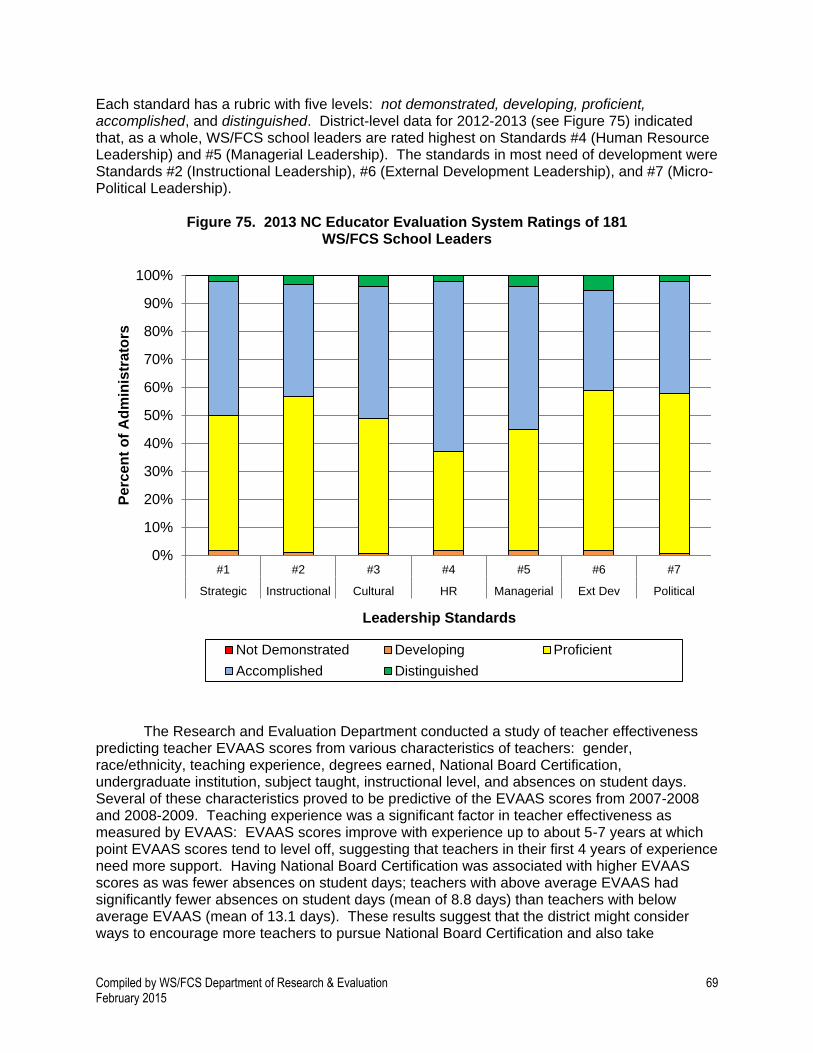
Compiled by WS/FCS Department of Research & Evaluation 69 February 2015
Each standard has a rubric with five levels: not demonstrated, developing, proficient, accomplished, and distinguished. District-level data for 2012-2013 (see Figure 75) indicated that, as a whole, WS/FCS school leaders are rated highest on Standards #4 (Human Resource Leadership) and #5 (Managerial Leadership). The standards in most need of development were Standards #2 (Instructional Leadership), #6 (External Development Leadership), and #7 (Micro-Political Leadership).
Figure 75. 2013 NC Educator Evaluation System Ratings of 181 WS/FCS School Leaders
The Research and Evaluation Department conducted a study of teacher effectiveness predicting teacher EVAAS scores from various characteristics of teachers: gender, race/ethnicity, teaching experience, degrees earned, National Board Certification, undergraduate institution, subject taught, instructional level, and absences on student days. Several of these characteristics proved to be predictive of the EVAAS scores from 2007-2008 and 2008-2009. Teaching experience was a significant factor in teacher effectiveness as measured by EVAAS: EVAAS scores improve with experience up to about 5-7 years at which point EVAAS scores tend to level off, suggesting that teachers in their first 4 years of experience need more support. Having National Board Certification was associated with higher EVAAS scores as was fewer absences on student days; teachers with above average EVAAS had significantly fewer absences on student days (mean of 8.8 days) than teachers with below average EVAAS (mean of 13.1 days). These results suggest that the district might consider ways to encourage more teachers to pursue National Board Certification and also take
0%
10%
20%
30%
40%
50%
60%
70%
80%
90%
100%
#1 #2 #3 #4 #5 #6 #7
Strategic Instructional Cultural HR Managerial Ext Dev Political
Pe
rce
nt
of
Ad
min
istr
ato
rs
Leadership Standards
Not Demonstrated Developing Proficient
Accomplished Distinguished
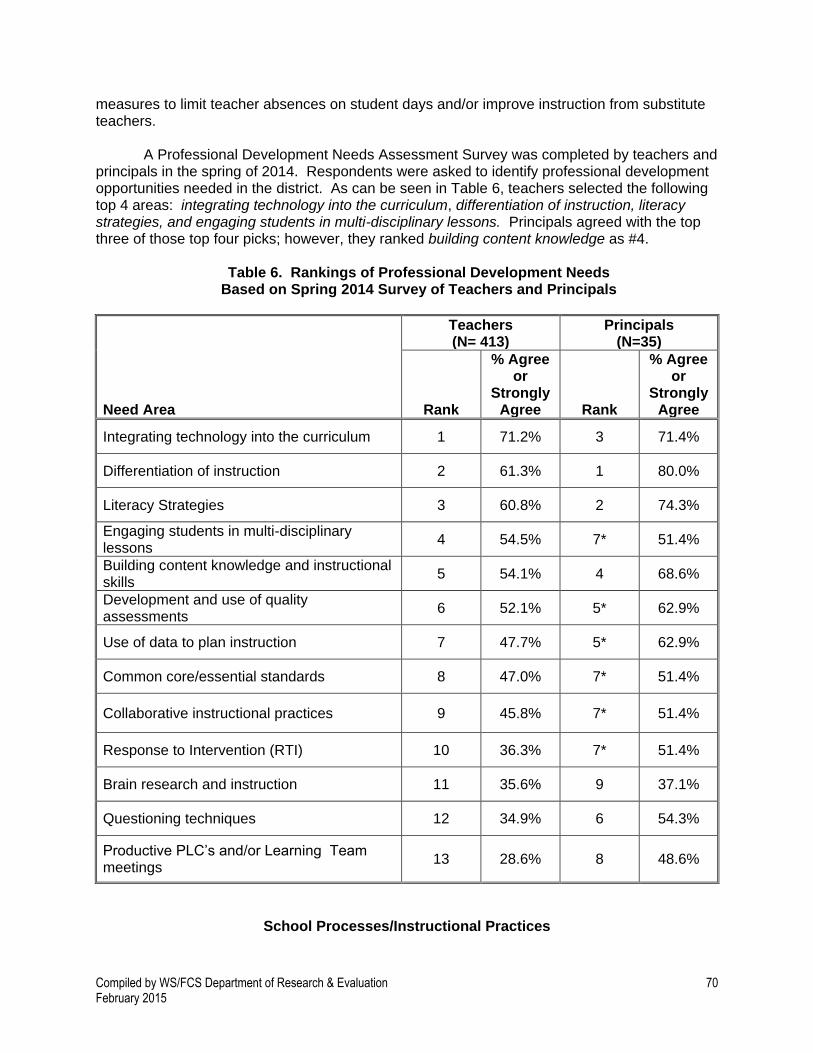
Compiled by WS/FCS Department of Research & Evaluation 70 February 2015
measures to limit teacher absences on student days and/or improve instruction from substitute teachers.
A Professional Development Needs Assessment Survey was completed by teachers and principals in the spring of 2014. Respondents were asked to identify professional development opportunities needed in the district. As can be seen in Table 6, teachers selected the following top 4 areas: integrating technology into the curriculum, differentiation of instruction, literacy strategies, and engaging students in multi-disciplinary lessons. Principals agreed with the top three of those top four picks; however, they ranked building content knowledge as #4.
Table 6. Rankings of Professional Development Needs
Based on Spring 2014 Survey of Teachers and Principals
Need Area
Teachers (N= 413)
Principals (N=35)
Rank
% Agree or
Strongly Agree
Rank
% Agree or
Strongly Agree
Integrating technology into the curriculum 1 71.2% 3 71.4%
Differentiation of instruction 2 61.3% 1 80.0%
Literacy Strategies 3 60.8% 2 74.3%
Engaging students in multi-disciplinary lessons
4 54.5% 7* 51.4%
Building content knowledge and instructional skills
5 54.1% 4 68.6%
Development and use of quality assessments
6 52.1% 5* 62.9%
Use of data to plan instruction 7 47.7% 5* 62.9%
Common core/essential standards 8 47.0% 7* 51.4%
Collaborative instructional practices 9 45.8% 7* 51.4%
Response to Intervention (RTI) 10 36.3% 7* 51.4%
Brain research and instruction 11 35.6% 9 37.1%
Questioning techniques 12 34.9% 6 54.3%
Productive PLC’s and/or Learning Team meetings
13 28.6% 8 48.6%
School Processes/Instructional Practices
Compiled by WS/FCS Department of Research & Evaluation 71 February 2015
Beginning with the academic year 2010-2011, two district schools, John F. Kennedy High School and Petree Elementary, were awarded three-year School Improvement Grants (SIG) from the state of North Carolina. Both grants involved removing the principal. In addition, at Petree staff had to re-apply for their jobs and no more than half could be re-hired. In 2010-2011, both schools had EVAAS campus composite indices above zero for the first time during their first year of the SIG grants: Kennedy’s composite index of +0.86 in 2010-2011 was almost 1.0 standard error above the mean; Petree had a composite index of +1.69, almost to the 2.0 cutoff to be considered exceeding expected growth. Petree slipped during their second year (2011-2012) of the grant with a composite index of -0.10 as did Kennedy with a composite index of -2.90. Petree continued to slip during the third and final year (2012-2013) of the grant with a composite index of -1.92 while Kennedy climbed from the red to the blue (exceeds expected growth) with a composite index of +4.49. When looking at EVAAS scores in 2013-2014, Petree had climbed back with an EVAAS composite of +1.43, but Kennedy dropped with an EVAAS composite score of -0.02, which placed both schools in the green (meets expected growth). See Figures 76 and 77. Forest Park Elementary was awarded a three-year SIG grant starting in 2011-2012. EVAAS campus composite indices over the years prior to the grant vacillated, mostly below the state mean of 0. The first year of the grant, their EVAAS campus composite index was +5.6, well above the cutoff for exceeded expected growth and the highest index of any district elementary school. Forest Park’s EVAAS campus composite for the second year of the grant (2012-2013) was lower but still in the exceeded expected growth range at +2.01. For 2013-2014, Forest Park slipped back down to the green (meets expected growth) with a composite of +0.66. See Figure 78.
Figure 76. EVAAS Growth Over Time for Petree Elementary: 2007-2014

Compiled by WS/FCS Department of Research & Evaluation 72 February 2015
Figure 77. EVAAS Growth Over Time for John F. Kennedy High School: 2007-2014
Figure 78. EVAAS Growth Over Time for Forest Park Elementary School: 2007-2014
-7
-6
-5
-4
-3
-2
-1
0
1
2
3
4
5
6
7
2007-2008 2008-2009 2009-2010 2010-2011 2011-2012 2012-2013 2013-2014
Cam
pu
s C
om
po
sit
e
SIG Grant Year #1
-14
-12
-10
-8
-6
-4
-2
0
2
4
6
8
2007-2008 2008-2009 2009-2010 2010-2011 2011-2012 2012-2013 2013-2014
Cam
pu
s C
om
po
sit
e
SIG Grant Year #1
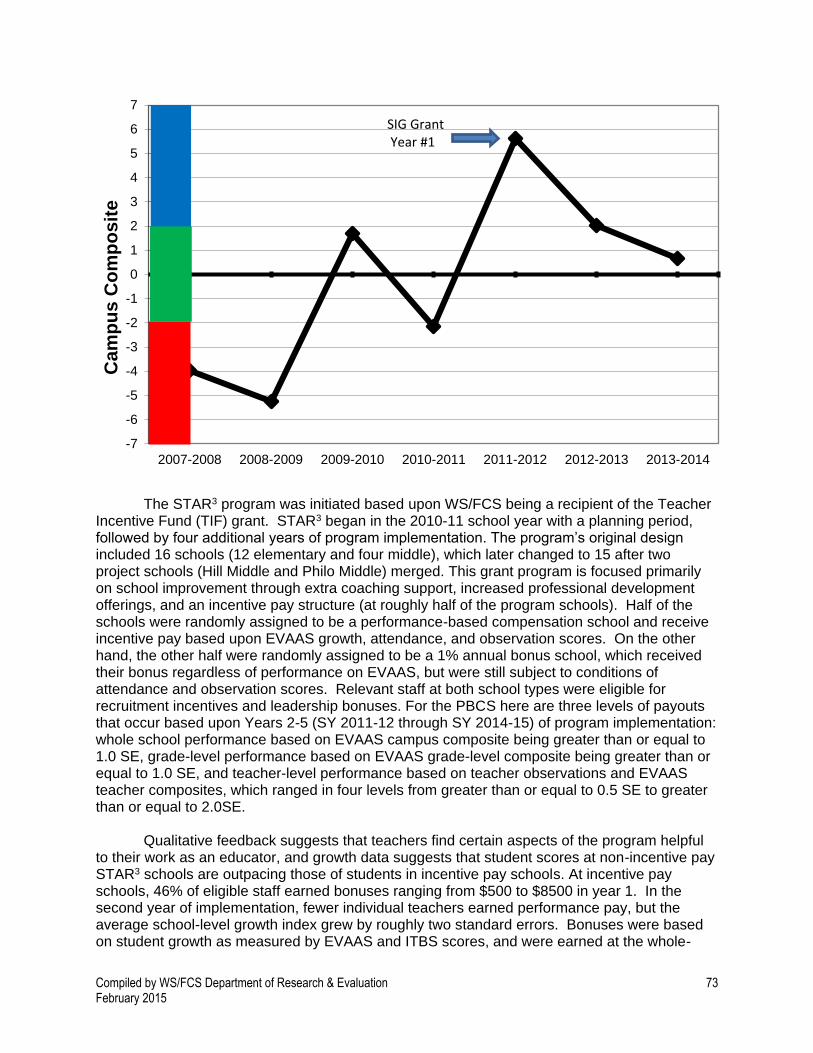
Compiled by WS/FCS Department of Research & Evaluation 73 February 2015
The STAR3 program was initiated based upon WS/FCS being a recipient of the Teacher Incentive Fund (TIF) grant. STAR3 began in the 2010-11 school year with a planning period, followed by four additional years of program implementation. The program’s original design included 16 schools (12 elementary and four middle), which later changed to 15 after two project schools (Hill Middle and Philo Middle) merged. This grant program is focused primarily on school improvement through extra coaching support, increased professional development offerings, and an incentive pay structure (at roughly half of the program schools). Half of the schools were randomly assigned to be a performance-based compensation school and receive incentive pay based upon EVAAS growth, attendance, and observation scores. On the other hand, the other half were randomly assigned to be a 1% annual bonus school, which received their bonus regardless of performance on EVAAS, but were still subject to conditions of attendance and observation scores. Relevant staff at both school types were eligible for recruitment incentives and leadership bonuses. For the PBCS here are three levels of payouts that occur based upon Years 2-5 (SY 2011-12 through SY 2014-15) of program implementation: whole school performance based on EVAAS campus composite being greater than or equal to 1.0 SE, grade-level performance based on EVAAS grade-level composite being greater than or equal to 1.0 SE, and teacher-level performance based on teacher observations and EVAAS teacher composites, which ranged in four levels from greater than or equal to 0.5 SE to greater than or equal to 2.0SE.
Qualitative feedback suggests that teachers find certain aspects of the program helpful to their work as an educator, and growth data suggests that student scores at non-incentive pay STAR3 schools are outpacing those of students in incentive pay schools. At incentive pay schools, 46% of eligible staff earned bonuses ranging from $500 to $8500 in year 1. In the second year of implementation, fewer individual teachers earned performance pay, but the average school-level growth index grew by roughly two standard errors. Bonuses were based on student growth as measured by EVAAS and ITBS scores, and were earned at the whole-
-7
-6
-5
-4
-3
-2
-1
0
1
2
3
4
5
6
7
2007-2008 2008-2009 2009-2010 2010-2011 2011-2012 2012-2013 2013-2014
Cam
pu
s C
om
po
sit
eSIG Grant Year #1
Compiled by WS/FCS Department of Research & Evaluation 74 February 2015
school, grade level, and individual levels. Growth in STAR3 schools, as measured by EVAAS, has been comparable over the life of the grant to that of other, non-STAR3 Title I schools.
Parent & Community Involvement In April 2014, the WS/FCS Title I Parent Involvement Program Specialist shared a sample parent survey with Title I schools and gave them the option of using that survey or creating one of their own. Schools were also given the option of sending in their completed surveys to the district Research and Evaluation Department for data entry and analysis. Of the 22 Title I elementary schools in the district, 17 (77%) sent their completed surveys for analysis; 16 of these schools used the district sample. In total, they were 2,127 surveys from parents of these elementary schools; school survey counts ranged from 47 to 306, averaging 125 per school. Of the 15 Title I secondary schools, eight (53%) sent their surveys for analysis by the Research and Evaluation Department; six of the seven schools used the district sample survey. The secondary schools’ survey counts totaled 414 and ranged from 18 to 92, averaging 52 per school. All schools received an individual report of their results including a tabular summary, graphical presentations, and content analysis of parent comments. We compiled district results from the surveys of the 23 schools using the district sample survey. The district sample survey consisted of 10 yes/no questions. The results from these surveys (see Figures 79 and 80) showed that for all 10 questions, there were higher percentages of yes responses at elementary schools than secondary schools. The two highest rated items for both elementary and secondary schools were received progress reports for your child and received information in a language you could understand with over 90% of both groups responding yes to these two items. The next two highest percentages (over 90% for elementary schools and 70-80% for secondary schools) were for communication methods were effective and parent meetings and activities were helpful. Most parents (88% of elementary and 68% of secondary) had received information about the schools’ Title I programs. Likewise, most (82% elementary; 65% secondary) felt that parent meetings were held at a convenient time although fewer had attended any parent meetings (70% elementary; 51% secondary). Many parents had been contacted by their child’s teacher (86% elementary; 61% secondary) and quite a few had been asked to review or give input on the parent/child/school compact (72% elementary; 51% secondary). About two-thirds (64%) of elementary parents but only a third (30%) of secondary parents had observed or visited their child in class.

Compiled by WS/FCS Department of Research & Evaluation 75 February 2015
Figure 79. WS/FCS Title I Parent Survey Results: 2014 Part A
Figure 80. WS/FCS Title I Parent Survey Results: 2014 Part B
0 10 20 30 40 50 60 70 80 90 100
Received info about school's Title I program
Observed/visited child in class
Attended meetings/parent sessions atschool
Meetings held at convenient time
Meetings/activities helpful to you
Percent Responded Yes
Elementary (N = 1,989)
Secondary (N = 322)
0 10 20 30 40 50 60 70 80 90 100
Contacted by child's teacher
Received progress report
Communication methods effective
Asked to review/give input P/S/SchCompact
Info received in language understand
Percent Responded Yes
Elementary (N = 1,989)
Secondary (N = 322)
Compiled by WS/FCS Department of Research & Evaluation 76 February 2015
Broad Site Visit
In the spring of 2013, the WS/FCS district was invited to apply for a diagnostic site visit from the Broad Foundation. Given that long-time Superintendent Dr. Donald Martin was retiring at the end of June and new Superintendent Dr. Beverly Emory was arriving at the beginning of July, this seemed an opportune time for an external organization to provide an in-depth assessment of our district to supplement Dr. Emory’s own internal assessment. A team within the district drafted a proposal for the site visit and the district was offered this opportunity. After reviewing multitudes of documents from the district, the Broad Foundation’s team visited the district in the Fall of 2013. They observed programs at a number of schools, talked with teachers, staff, administrators, and parents from schools, and interviewed persons from all departments within the Central Office. The visiting team identified several strengths in the district: dedication of teachers, sound financial practices, development of a strategic plan, the organizational culture and climate, and the use of performance data for improvement. In their report to the district, the Foundation made a number of recommendations for improvement:
1. Develop a new iteration of the strategic plan that has fewer areas of focus and a stronger theory of action.
2. Provide more in-depth professional development, exemplars, and well- organized
resources such as lesson plans and assessments, to help teachers and leaders
understand and implement curriculum and instructional practices aligned with the
Common Core State Standards.
3. Develop a vision for instructional effectiveness and a professional development
plan that helps educators develop skills for implementation..
4. Develop approaches to college and career readiness at the middle and elementary
levels.
5. Consider adopting a common collaborative learning model.
6. Improve the data warehouse system.
7. Take steps to replicate the work being done in the STAR3 schools.
8. Return the role of the curriculum coordinator to its original function.
9 . Improve the hiring process.

Compiled by WS/FCS Department of Research & Evaluation 77 February 2015
Summary of LEA Findings
The school district has strengths in several domains as well as areas in need of improvement. The district has much cooperation and collaboration with community agencies and groups, especially with the district’s graduation efforts. School and community collaboration has helped the district increase graduation rates and lower dropout rates overtime. The district has moved from a primarily self-contained model to more inclusion for exceptional children. The district has received major federal and state funding in the past few years through Race to the Top (RttT), Teacher Incentive Fund (our STAR3 initiative), and School Improvement Grants (SIG). In addition, our district has a fairly experienced teacher work force and low teacher turnover. Our principals are more experienced and more educated than principals across the state. Teachers’ perceptions of working conditions at their schools are fairly similar to teachers statewide. Results from the 2014 Teacher Working Conditions (TWC) Survey demonstrated improvement over 2012 results in the domains of Time and Managing Student Conduct.
For 2013-2014, the second year of the new Common Core Standards and North Carolina Essential Standards, the district’s Performance Composite was a few points below the state composite. With the exception of third grade math, EOG and EOC proficiencies were just below the state for every grade and subject. For the past five years, DIBELS data has remained positive for Kindergarten. For the past two years (2012-2013 and 2013-2014), we have seen more positive growth in literacy skills for first and second grades as well. Average composite and subtest scores for the ACT administration with all 11th grade students were slightly higher for our district than for the whole state; likewise, students in our district met college-ready benchmarks at higher rates than the state as a whole. The distribution of EVAAS growth statuses for district schools matched the distribution for the state as a whole. The district met 71% of its state AMO targets, comparable to the state which met 55% of its AMO targets. There has been improvement over the past few years in some items on the district’s student survey. At the middle and high school levels, more students feel that adults treat students with respect and more students state that they feel like I am part of this school. Results from Title I parent surveys were quite positive with over 90% of parents at the elementary level and 70-80% of parents from secondary schools viewing communication methods effective and parent meetings and activities helpful. Student ratings of safety have been improving but still need to be addressed at the middle-school level, as does the issue of harassment and bullying. Over half of 8th grade students in 2013-2014 felt that harassment and bullying were a problem at their school. Only 70% of students in 8th grade, compared to about 90% of 5th graders and 80% of seniors, felt that adults at this school treat students with respect. In addition to school climate issues at middle school, the district has other areas in need of improvement. WS/FCS has been impacted by the population shift within the community to a greater Hispanic presence and by the economic downturn in the area. The increase in percentage of Hispanic students presents great challenges in the area of language development and reading. In addition, the expansion of free-reduced lunch to larger numbers of students impacts resources available to families and to schools. Despite the rising poverty in the district, student mobility rates, especially within Title I schools, have been decreasing overtime, and we hope to see that same decrease when 2013-2014 student mobility rates are released.
Students in the district are arriving in kindergarten under-prepared for school, particularly in the area of language development which is crucial for literacy and success in school. Some

Compiled by WS/FCS Department of Research & Evaluation 78 February 2015
progress is being made in literacy skills in the early grades. EOG and EOC assessments show that WS/FCS students are proficient at rates comparable to the state. However, based on our ACT test scores, by the 11th grade, many of our students are not college-ready. However, progress has been made in Science from 2012-2013 in which less than 20% of students were college-ready, to 2013-2014 in which 28.6% are college ready. Further, there were great disparities in college readiness among racial/ethnic groups with only 10% of Black students and 15% of Hispanic students college-ready in Science compared to 40% of Asian students and over 44% of White students. There was a large gap in percentage of students at Title I schools versus non-Title I schools meeting the state ACT benchmark criteria for the new READY Accountability Model. On average only 32% of students at Title I schools met this criteria versus 67% of students at non-Title I schools. There was a marked drop in district EVAAS campus composites from 2010-2011 to 2011-2012. In 2011-2012, half of the district’s schools did not meet expected growth, compared to 28% in 2010-2011. Almost three-fourths of middle school composites did not meet expected growth in 2011-2012. Composites for Title I schools were comparable to non-Title I school for both years. However, there was much improvement in this area for 2012-2013 with district EVAAS campus composite distributions matching the state distributions. Moreover, for 2012-2013, Title I schools had better EVAAS campus composites than non-Title I schools at both the elementary and secondary levels. However, in 2013-2014, non-Title I schools had better EVAAS campus composites than Title I schools, and 50% of Title I and over 25% of non-Title I secondary schools did not meet expected growth. Improvement in this area is necessary to help to close achievement gaps, which were very apparent in 2013-2014 EOG/EOC proficiency data. The disparity between Title I and non-Title I schools was similar across all grades and subjects. The average Performance Composite (GLP) for non-Title I schools was 53.4 compared to 35.3 for Title I schools. Racial/ethnic achievement gaps on EOG/EOC proficiencies have been apparent in the district for years, although we were beginning to see a narrowing over time. For 2012-2013, with all new assessments and standards, we could only legitimately examine data for that year. Large gaps existed between White students and Black and Hispanic/LEP students; Hispanic/Not LEP students had much smaller gaps with White students than the other two groups. Within each racial/ethnic group, there were large gaps between students who were not economically-disadvantaged and those who were. For 2013-2014, we could only make comparisons from the previous year when the standards were the same. However, findings for 2013-2014 were similar to the previous year with large gaps between White students and Black and Hispanic/LEP students. Hispanic/Not LEP students once again had smaller gaps with White students than the other two groups, and large gaps were once again found between students on FRL and students who were on FRL. Like teachers across the state, our teachers do not feel that they have enough instructional and non-instructional time. We did see improvement in this domain in 2014 compared to 2012 but it was still the lowest rated area on the Teacher Working Conditions Survey. On our 2014 district professional development needs survey, teachers and principals agreed that teachers need more development in the area of integrating technology into the curriculum, differentiation of instruction, literacy strategies, and building content knowledge and instructional skills. Principals also felt that teachers need more training in building content knowledge and instructional skills.
Compiled by WS/FCS Department of Research & Evaluation 79 February 2015
Although data is not available for 2013-2014, when examining 2012-2013 data, we found that our educator work force is doing well according to the new NC Educator Evaluation System ratings, we have very few teachers and principals rated as distinguished in any area. The standard with lowest ratings and therefore most in need of improvement for teachers is Standard #3, Teachers know the content they teach, followed closely by Standard #5, Teachers reflect on their practice. For principals, there were three standards that were most in need of improvement: Standard #2, Instructional Leadership; Standard #6, External Development Leadership; and Standard #7, Micro-Political Leadership. In addition, at the high school level, there is a discrepancy in the number of teachers with National Board Certification between Title I schools and non-Title I schools with non-Title I schools averaging 14 teachers with National Board Certification versus 5 for Title I schools. There is also greater teacher turnover at Title I schools compared to non-Title I schools. The district has made some significant strides yet still has many areas in need of improvement. The Broad diagnostic site visit and subsequent recommendations laid out a path to begin addressing district needs. The district has already begun efforts in the areas of a common collaborative learning model and re-structuring the role of curriculum coordinators, both of which should have positive impacts on student learning.