Embed Size (px)
Citation preview
Chapter 12
Wind Power Variability and Singular Events
Sergio Martin-Martínez,Antonio Vigueras-Rodríguez, Emilio Gómez-Lázaro,Angel Molina-García, Eduard Muljadi andMichael Milligan
Additional information is available at the end of the chapter
http://dx.doi.org/10.5772/52654
1. Introduction
There are several sources of wind power variability, including short-term (seconds to mi‐nutes) and long-term (hours of the day, or seasonal). The type of wind turbine, the controlalgorithm, and wind speed fluctuations all affect the short-term power fluctuation at eachturbine. The blade of a Type 1 induction generator wind turbine experiences the tower shad‐ow effect every time a blade passes the tower; the output of the Type 1 turbine commonlyfluctuates because of this. Wind turbines Type 3 and Type 4 are equipped with power elec‐tronics and have a reasonable range of speed variation; thus, the impact of the tower shad‐ow effect is masked by the power converter control. Because of wind speed fluctuations andwind turbulence, the power output also influences the output of the wind turbine generator.
However, in the big picture, the power fluctuation at a single turbine is not as important asthe total power output of a wind power plant. The interface between the wind power plantand the power system grid is called the point of interconnection (POI). All the meters to cal‐culate revenue, measure voltage and frequency, and measure other power quality attributesare installed at the POI. At the POI, all the output power from individual turbines is injectedinto the power grid. A wind power plant covers a very large area; thus, there are variousdiversities within each plant (e.g., wind speed, line impedance, and instantaneous terminalvoltage at each turbine). The power measurement from a single wind turbine usually showsa large fluctuation of output power; however, because many turbines are connected in awind power plant, the power fluctuation from one turbine may cancel that of another,which effectively rectifies the power fluctuation of the overall plant.
© 2012 Martin-Martínez et al.; licensee InTech. This is an open access article distributed under the terms ofthe Creative Commons Attribution License (http://creativecommons.org/licenses/by/3.0), which permitsunrestricted use, distribution, and reproduction in any medium, provided the original work is properly cited.
Additionally, many wind power plants are co-located in the same region where wind resour‐ces are excellent; thus, the spatial diversity among wind power plants contributes to a smooth‐er output power of the region than the output power of an individual wind power plant.
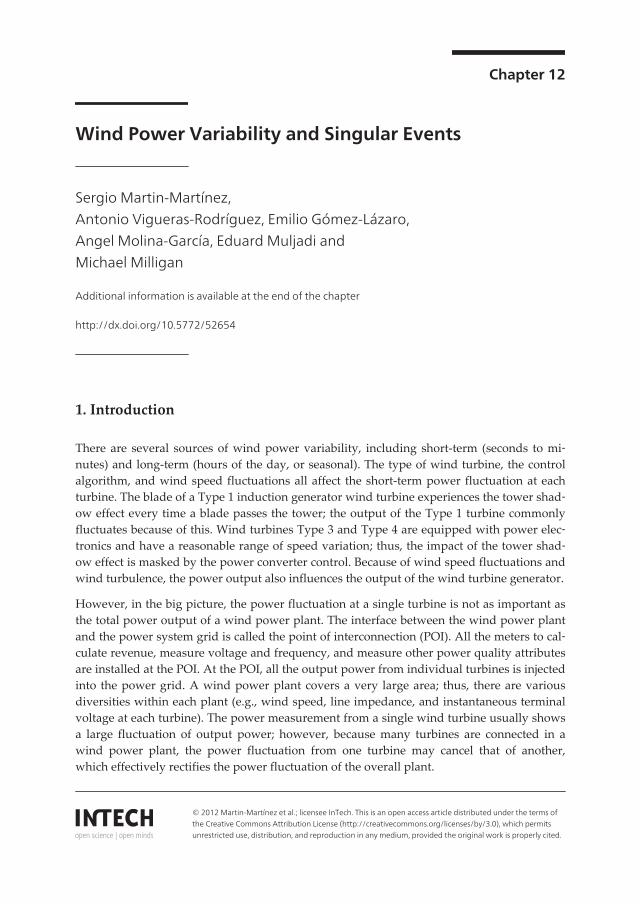
Figure 1. Real and reactive power output of a wind power plant; (a) Single turbine representation (b) Sixteen turbinesrepresentation
Figure 1(a) shows the fluctuation in the output power when the wind power plant is repre‐sented by a single turbine. Figure 1(b) illustrates the real and reactive power output whenthe wind power plant is represented by sixteen turbines. With greater wind diversity, asshown in Figure 1(b), the power fluctuation is smoother than that with less wind turbinerepresentation, as shown in Figure 1(a) [1].
2. Wind speed variability
Overall wind variability consists of different fluctuating terms with different periods, depend‐ing on the sources. For instance, fluctuating term can be caused by day-night effects (e.g., theeffects of sea breeze), because there are “quick” fluctuations in some minute periods.
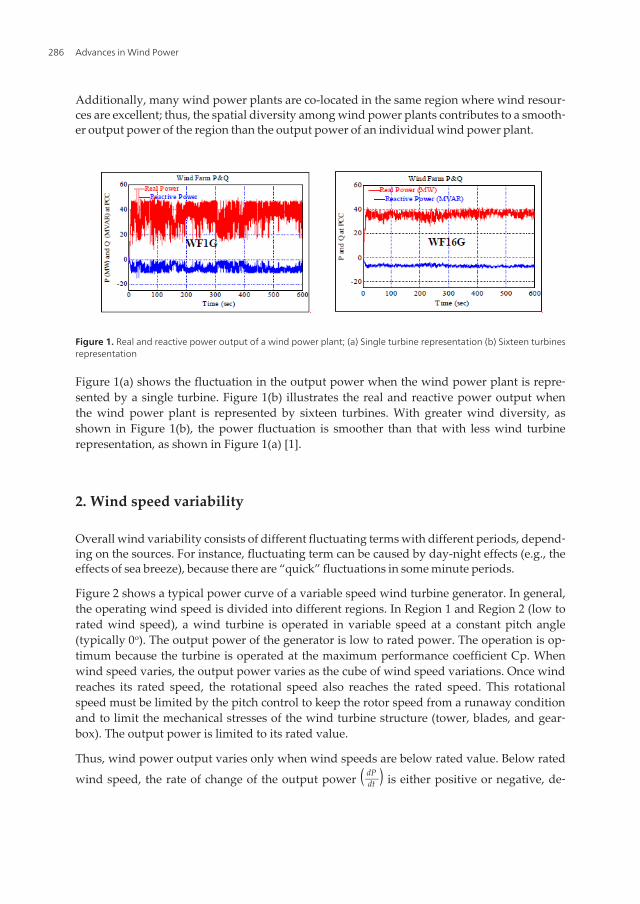
Figure 2 shows a typical power curve of a variable speed wind turbine generator. In general,the operating wind speed is divided into different regions. In Region 1 and Region 2 (low torated wind speed), a wind turbine is operated in variable speed at a constant pitch angle(typically 0o). The output power of the generator is low to rated power. The operation is op‐timum because the turbine is operated at the maximum performance coefficient Cp. Whenwind speed varies, the output power varies as the cube of wind speed variations. Once windreaches its rated speed, the rotational speed also reaches the rated speed. This rotationalspeed must be limited by the pitch control to keep the rotor speed from a runaway conditionand to limit the mechanical stresses of the wind turbine structure (tower, blades, and gear‐box). The output power is limited to its rated value.
Thus, wind power output varies only when wind speeds are below rated value. Below rated
wind speed, the rate of change of the output power ( dPdt ) is either positive or negative, de‐
Advances in Wind Power286
pending on the direction of wind speed change. Above rated wind speeds, any fluctuations
will be capped at rated by the pitch action, or dPdt =0.
Wind Speed (m/s)
Power
Cut-inWind speed
CpmaxOperationConstant pitch variable rpm = 0o
PratedOperationVariable PitchConstant rpm0o < < 23o
Cut-offWind speed
Region 1,2
InertialEnergyVaries
Region 3Inertial Energy Constant
Cp
TSR ()
TSR ()
Cp
Pitchaction
Figure 2. Power curve of a typical wind turbine generator
If the power controller is not properly designed, wind fluctuations may excite the mechani‐cal resonance of the structure or gearbox, which may lead to mechanical failures of the windturbine [2]–[3].
Spectral tools are often used to analyze wind speed variability because they make it possibleto study different frequency fluctuation terms. The most popular one used for this purposeis the Power Spectral Density (PSD).
The PSD of a function is defined by the Fourier transform of its autocorrelation. PSD istherefore expressed in frequency domain. Its physical meaning is related to fluctuating ki‐netic energy on a certain frequency.
Wind Power Variability and Singular Eventshttp://dx.doi.org/10.5772/52654
287
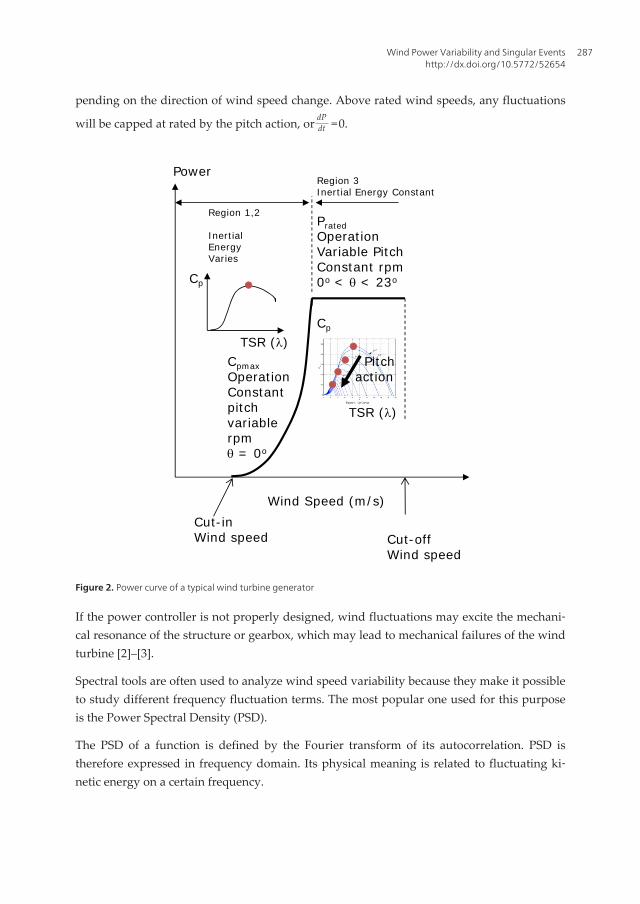
Van der Hoven [4] analyzed the PSD of horizontal wind speed, based mainly on measure‐ments done at Brookhaven National Laboratory. Figure 3 shows such spectra, with twomain peaks and a spectral gap between them. The first peak occurred at a period of aroundfour days and was caused by migratory pressure systems of a synoptic weather map scale.The second peak occurred at a period of 1 minute because of a mechanical and/or convectivetype of turbulence. Van der Hoven’s observations also showed some relation between thespectral gap shape and surface roughness under some circumstances. Additional analysisshows more complex spectra, especially over the ocean or in smooth terrains [5]–[9]; wherethere is an important contribution of mesoscale fluctuations combined with various phe‐nomena such as convective longitudinal rolls [11] or cumulus clouds [12] that may containconsiderable spectral density in the frequency range. At some other places, the gap was veri‐fied by experimental data [4], [13]–[14].
Figure 3. Spectrum estimated by Van der Hoven [4]
PSD spectrum is usually calculated by using short segments of data with similar atmospher‐ic characteristics. The reduction or removal of the spectral gap introduces some difficultieson the analysis because microscale and macroscale are no longer separated. This limits thefindings of particular atmospheric regimes lasting long enough to calculate a meaningfulspectrum. Thus, some researchers are considering the use of more complex spectral toolsbased on time and frequency domain. For instance, the Hilbert-Huang transform has beenused for analyzing wind fluctuations over the North Sea [8].
Wind speed variability is important with regard to power system management. An exampleof the significance of these power fluctuations is in Energinet.dk (the Danish TransmissionSystem Operator). According to [15], Energinet.dk has observed that power fluctuationsfrom the 160-MW offshore wind power plant at Horns Rev in West Denmark introduce sev‐eral challenges to reliable operation of the local power system. The power fluctuations alsocontribute to deviations from the planned power exchange with the Central European Pow‐er System. Moreover, it was observed that the timescale of the power fluctuations was fromtens of minutes to several hours.
Advances in Wind Power288
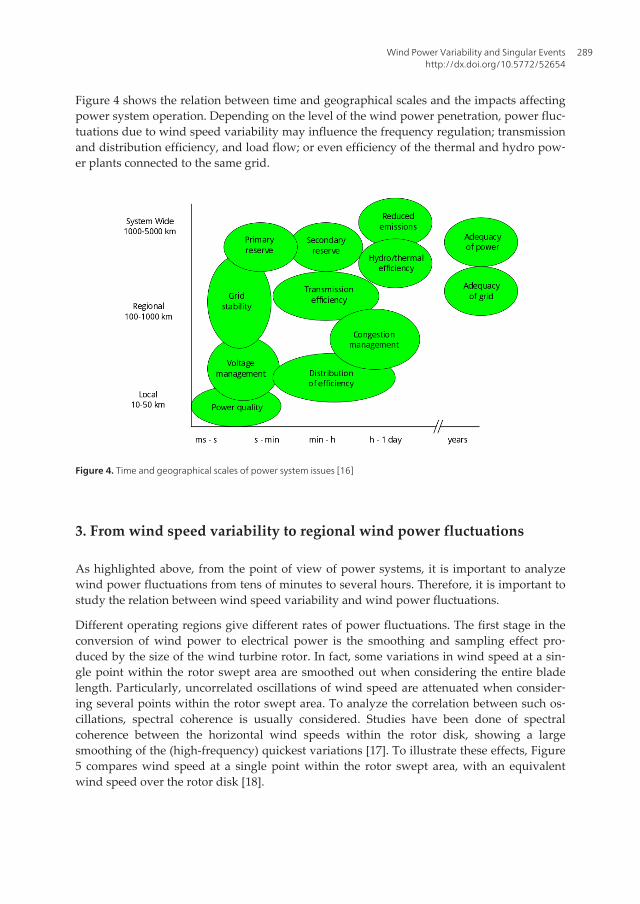
Figure 4 shows the relation between time and geographical scales and the impacts affectingpower system operation. Depending on the level of the wind power penetration, power fluc‐tuations due to wind speed variability may influence the frequency regulation; transmissionand distribution efficiency, and load flow; or even efficiency of the thermal and hydro pow‐er plants connected to the same grid.
Figure 4. Time and geographical scales of power system issues [16]
3. From wind speed variability to regional wind power fluctuations
As highlighted above, from the point of view of power systems, it is important to analyzewind power fluctuations from tens of minutes to several hours. Therefore, it is important tostudy the relation between wind speed variability and wind power fluctuations.
Different operating regions give different rates of power fluctuations. The first stage in theconversion of wind power to electrical power is the smoothing and sampling effect pro‐duced by the size of the wind turbine rotor. In fact, some variations in wind speed at a sin‐gle point within the rotor swept area are smoothed out when considering the entire bladelength. Particularly, uncorrelated oscillations of wind speed are attenuated when consider‐ing several points within the rotor swept area. To analyze the correlation between such os‐cillations, spectral coherence is usually considered. Studies have been done of spectralcoherence between the horizontal wind speeds within the rotor disk, showing a largesmoothing of the (high-frequency) quickest variations [17]. To illustrate these effects, Figure5 compares wind speed at a single point within the rotor swept area, with an equivalentwind speed over the rotor disk [18].
Wind Power Variability and Singular Eventshttp://dx.doi.org/10.5772/52654
289
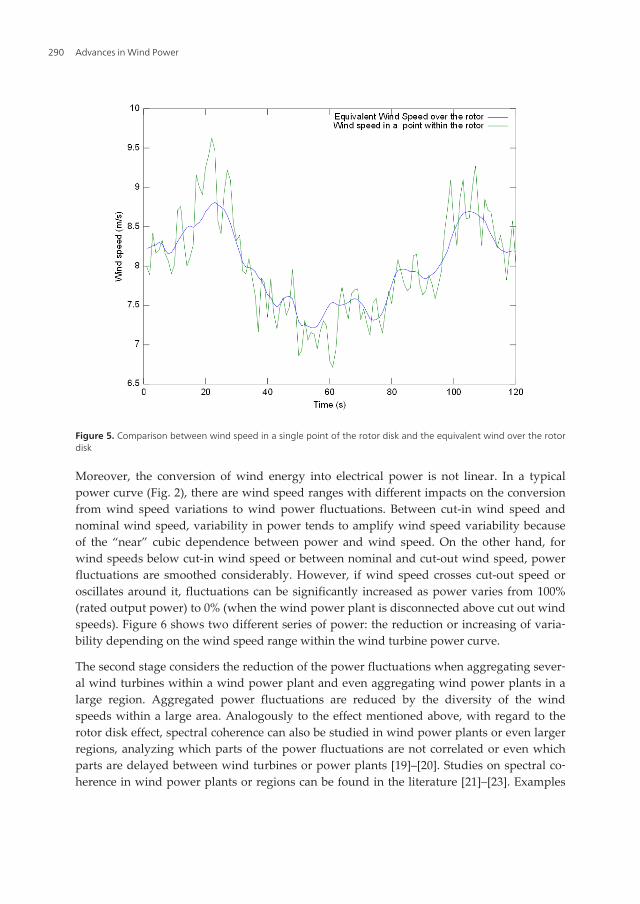
Figure 5. Comparison between wind speed in a single point of the rotor disk and the equivalent wind over the rotordisk
Moreover, the conversion of wind energy into electrical power is not linear. In a typicalpower curve (Fig. 2), there are wind speed ranges with different impacts on the conversionfrom wind speed variations to wind power fluctuations. Between cut-in wind speed andnominal wind speed, variability in power tends to amplify wind speed variability becauseof the “near” cubic dependence between power and wind speed. On the other hand, forwind speeds below cut-in wind speed or between nominal and cut-out wind speed, powerfluctuations are smoothed considerably. However, if wind speed crosses cut-out speed oroscillates around it, fluctuations can be significantly increased as power varies from 100%(rated output power) to 0% (when the wind power plant is disconnected above cut out windspeeds). Figure 6 shows two different series of power: the reduction or increasing of varia‐bility depending on the wind speed range within the wind turbine power curve.
The second stage considers the reduction of the power fluctuations when aggregating sever‐al wind turbines within a wind power plant and even aggregating wind power plants in alarge region. Aggregated power fluctuations are reduced by the diversity of the windspeeds within a large area. Analogously to the effect mentioned above, with regard to therotor disk effect, spectral coherence can also be studied in wind power plants or even largerregions, analyzing which parts of the power fluctuations are not correlated or even whichparts are delayed between wind turbines or power plants [19]–[20]. Studies on spectral co‐herence in wind power plants or regions can be found in the literature [21]–[23]. Examples
Advances in Wind Power290
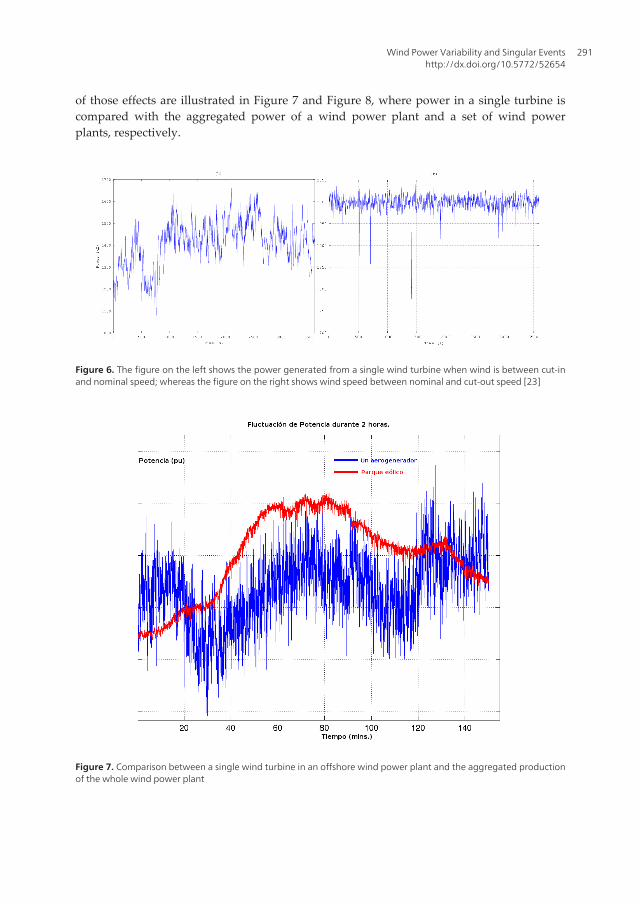
of those effects are illustrated in Figure 7 and Figure 8, where power in a single turbine iscompared with the aggregated power of a wind power plant and a set of wind powerplants, respectively.
Figure 6. The figure on the left shows the power generated from a single wind turbine when wind is between cut-inand nominal speed; whereas the figure on the right shows wind speed between nominal and cut-out speed [23]
Figure 7. Comparison between a single wind turbine in an offshore wind power plant and the aggregated productionof the whole wind power plant
Wind Power Variability and Singular Eventshttp://dx.doi.org/10.5772/52654
291
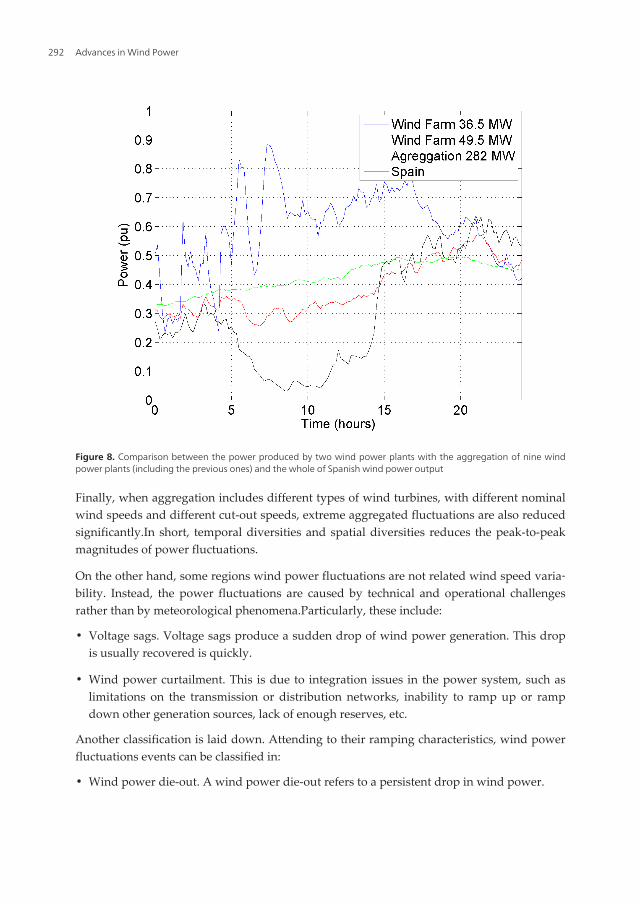
Figure 8. Comparison between the power produced by two wind power plants with the aggregation of nine windpower plants (including the previous ones) and the whole of Spanish wind power output
Finally, when aggregation includes different types of wind turbines, with different nominalwind speeds and different cut-out speeds, extreme aggregated fluctuations are also reducedsignificantly.In short, temporal diversities and spatial diversities reduces the peak-to-peakmagnitudes of power fluctuations.
On the other hand, some regions wind power fluctuations are not related wind speed varia‐bility. Instead, the power fluctuations are caused by technical and operational challengesrather than by meteorological phenomena.Particularly, these include:
• Voltage sags. Voltage sags produce a sudden drop of wind power generation. This dropis usually recovered is quickly.
• Wind power curtailment. This is due to integration issues in the power system, such aslimitations on the transmission or distribution networks, inability to ramp up or rampdown other generation sources, lack of enough reserves, etc.
Another classification is laid down. Attending to their ramping characteristics, wind powerfluctuations events can be classified in:
• Wind power die-out. A wind power die-out refers to a persistent drop in wind power.
Advances in Wind Power292

• Wind power rise. A wind power rise consists in a sustained rise in wind power that cancreate a persistent ramp up.
• Wind power lull. Wind die-outs are inevitably followed by wind rises. When both eventshappen in short succession, they form a wind power lull or a wind power dip.
• Wind power gust. A wind gust is opposite of a wind lull: it starts with a ramp up andends with a ramp down.
4. Overview of spanish experience dealing with wind power variability:Examples of singular events
In this section, examples of the Spanish experience of singular events produced by eitherwind speed variability or operational issues are examined.
4.1. Voltage sags
Wind turbine manufacturers are required by transmission system operators (TSOs) to equiptheir turbines with fault ride-through (FRT) capability as the penetration of wind energy in theelectrical systems grows [25]. Spain developed a procedure to measure and to evaluate the re‐sponse of wind turbines and wind power plants subjected to voltage sags [26].The procedurefor verification, validation, and certification of the requirements are described in the PO 12.3.This wind power plant commissioning and validation are based on the response of wind pow‐er plants in the event of voltage sags. The result of wind power plant commissioning leads tothe certification of its conformity with the response requirements specified in the Spanish gridcode [27]. Some aspects related to that grid code are explained in detail in [28]–[29].
On the other hand, because of the growing impact on power grid operations, the recent rap‐id expansion of wind generation has given rise to widespread interest in field testing andcommissioning of wind power plants and wind turbines. Validation of computer dynamicmodels of wind turbines is not a trivial issue. Validation must ensure that wind turbinemodels represent with sufficient accuracy the performance of the real turbine, especiallyduring severe transient disturbances [30]. In [32], different field tests for model validationand standards compliance are categorized according to the main input or stimulus in thetest—control stimulus and external physical stimulus. Among these tests, the FRT capabilityof wind turbines can be performed using factory tests, at the individual wind turbine gener‐ator terminals, and using short-circuit field measurement data based on operational windturbines and wind power plants.
Short-circuit field measurement data on operational wind turbines and wind power plants[33]—called opportunistic wind power plant testing in [31]—is performed with measure‐ment equipment installed at the wind power plant site. The equipment records naturally oc‐curring power system disturbances that are then used to validate wind turbine models.Power system modeling during the disturbances must be taken into account in the valida‐tion of wind turbine models. Therefore, monitoring wind power plants and wind turbines
Wind Power Variability and Singular Eventshttp://dx.doi.org/10.5772/52654
293
can be of interest for turbine manufacturers, wind power plant operators, and TSOs.Both thepre fault and the post fault data and power system network must be represented properly.
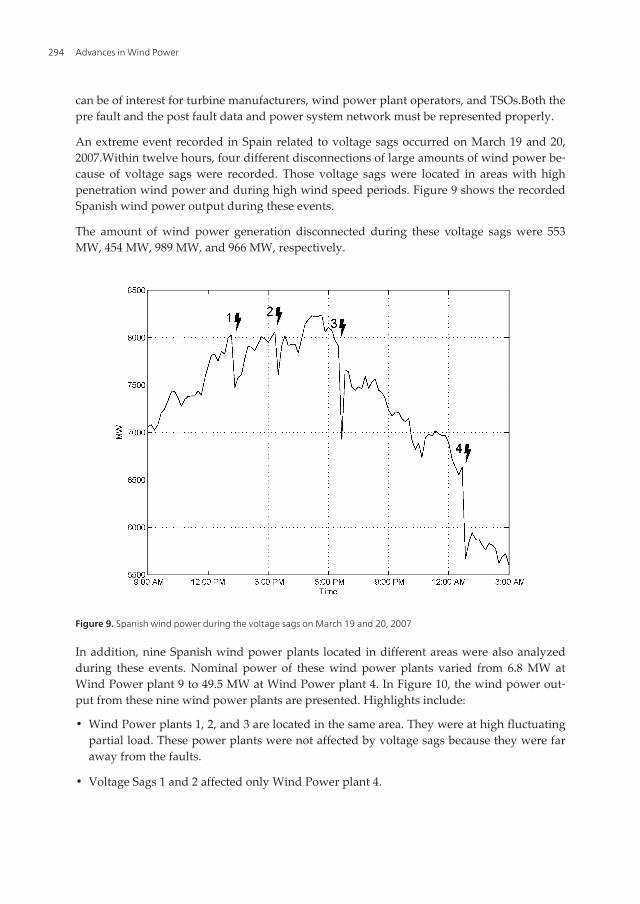
An extreme event recorded in Spain related to voltage sags occurred on March 19 and 20,2007.Within twelve hours, four different disconnections of large amounts of wind power be‐cause of voltage sags were recorded. Those voltage sags were located in areas with highpenetration wind power and during high wind speed periods. Figure 9 shows the recordedSpanish wind power output during these events.
The amount of wind power generation disconnected during these voltage sags were 553MW, 454 MW, 989 MW, and 966 MW, respectively.
Figure 9. Spanish wind power during the voltage sags on March 19 and 20, 2007
In addition, nine Spanish wind power plants located in different areas were also analyzedduring these events. Nominal power of these wind power plants varied from 6.8 MW atWind Power plant 9 to 49.5 MW at Wind Power plant 4. In Figure 10, the wind power out‐put from these nine wind power plants are presented. Highlights include:
• Wind Power plants 1, 2, and 3 are located in the same area. They were at high fluctuatingpartial load. These power plants were not affected by voltage sags because they were faraway from the faults.
• Voltage Sags 1 and 2 affected only Wind Power plant 4.
Advances in Wind Power294
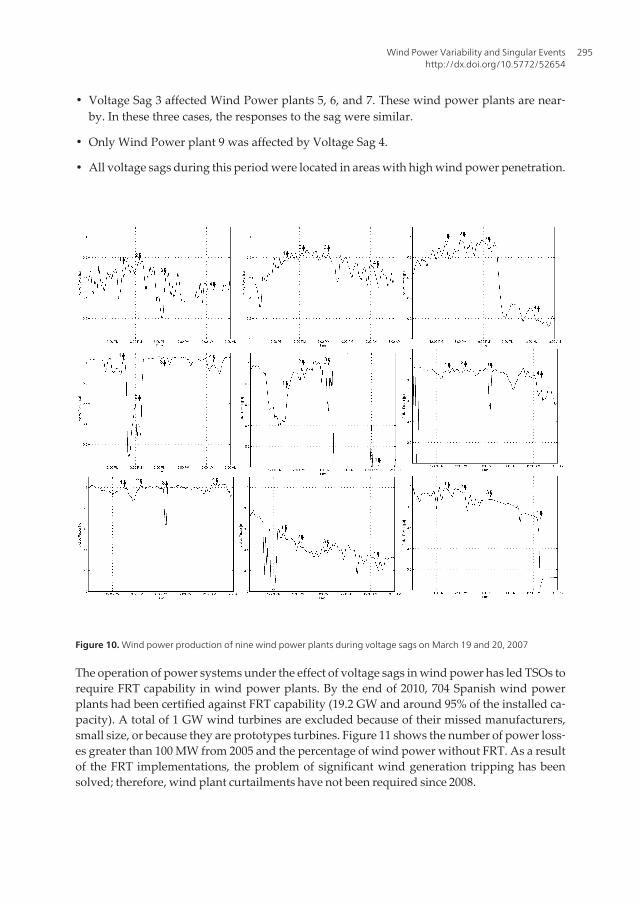
• Voltage Sag 3 affected Wind Power plants 5, 6, and 7. These wind power plants are near‐by. In these three cases, the responses to the sag were similar.
• Only Wind Power plant 9 was affected by Voltage Sag 4.
• All voltage sags during this period were located in areas with high wind power penetration.
Figure 10. Wind power production of nine wind power plants during voltage sags on March 19 and 20, 2007
The operation of power systems under the effect of voltage sags in wind power has led TSOs torequire FRT capability in wind power plants. By the end of 2010, 704 Spanish wind powerplants had been certified against FRT capability (19.2 GW and around 95% of the installed ca‐pacity). A total of 1 GW wind turbines are excluded because of their missed manufacturers,small size, or because they are prototypes turbines. Figure 11 shows the number of power loss‐es greater than 100 MW from 2005 and the percentage of wind power without FRT. As a resultof the FRT implementations, the problem of significant wind generation tripping has beensolved; therefore, wind plant curtailments have not been required since 2008.
Wind Power Variability and Singular Eventshttp://dx.doi.org/10.5772/52654
295

Figure 11. Evolution of wind power with FRT and number of power losses greater or equal to 100 MW by voltagesags in Spain [34]
The implementation of the supervisory control and data acquisition of wind generation inreal time have decreased the number and the size of power curtailments, improved the qual‐ity and the security of the electricity supply, and maximized renewable energy integration.To further enhance wind energy integration, the Spanish TSO (Red Eléctrica de España, orREE) submitted a proposal of a new grid code (P.O 12.2) to the Ministry, with additionaltechnical requirements for FRT, among others. The main purpose this proposal is to antici‐pate the expected problems in the Spanish power system between 2016 and 2020, by takinginto account the incoming plants and new power plants to be deployed during these yearsto come. It is expected that P.O. 12.2 can be approved and applied in 2013.
4.2. Klaus Storm (January 23, 24, and 25, 2010)
Meteorological phenomena (e.g., storms or cyclones) are capable of causing large variations inwind power production and very high wind speeds.A storm within this category can affect alarge number of wind turbines that have approximately the same cut-out wind speeds. Whenthe cut-out speed is reached, the power generated goes from rated power to zero immediately.If this phenomenon spreads over several wind power plants in a particular area, it can cause amajor threat to the power system stability and may lead to a cascading blackout.
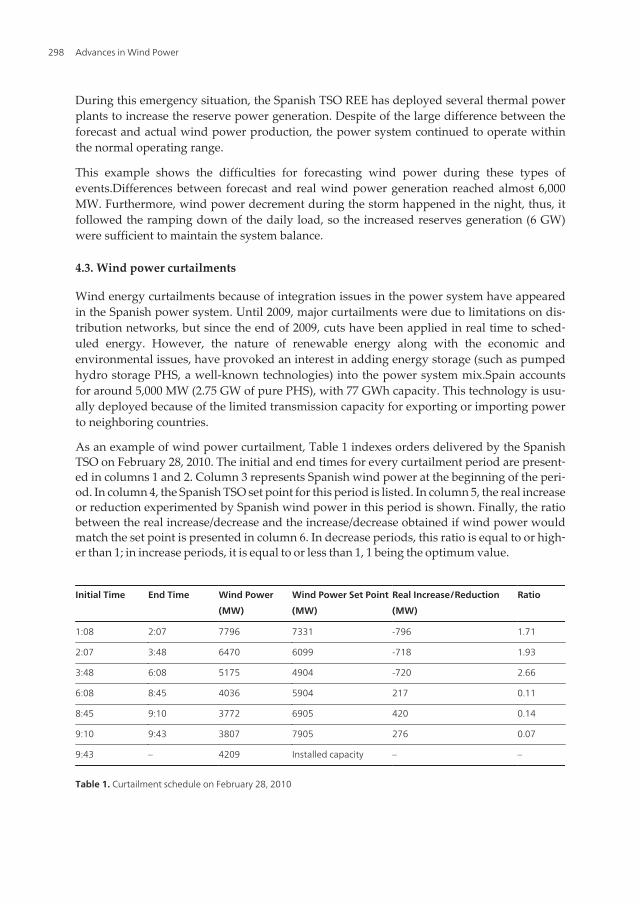
The storm Klaus was named after an extra-tropical mid-latitude cyclone that struck betweenJanuary 23 to January 25, 2009, affecting northern Spain and southern France. Wind speedsof higher than 150 km/h were recorded in the Spanish and French coastlines. The result wasthe disconnection of many wind power plants in northern areas of Spain, leading to a reduc‐tion of about 7,000 MW of wind power in a few hours (refer to Figure 12). Figure 13 showsthe impact of the storm on a Spanish wind power plant.The wind power plant consists of 30NEG Micon 82 Wind Turbines with a nominal power of 49.5 MW.
Advances in Wind Power296
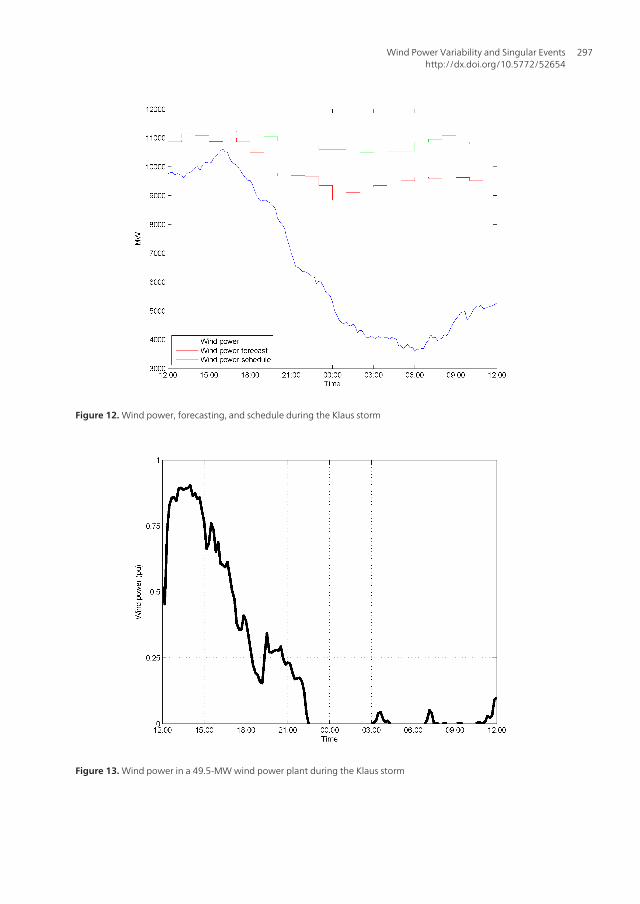
Figure 12. Wind power, forecasting, and schedule during the Klaus storm
Figure 13. Wind power in a 49.5-MW wind power plant during the Klaus storm
Wind Power Variability and Singular Eventshttp://dx.doi.org/10.5772/52654
297
During this emergency situation, the Spanish TSO REE has deployed several thermal powerplants to increase the reserve power generation. Despite of the large difference between theforecast and actual wind power production, the power system continued to operate withinthe normal operating range.
This example shows the difficulties for forecasting wind power during these types ofevents.Differences between forecast and real wind power generation reached almost 6,000MW. Furthermore, wind power decrement during the storm happened in the night, thus, itfollowed the ramping down of the daily load, so the increased reserves generation (6 GW)were sufficient to maintain the system balance.
4.3. Wind power curtailments
Wind energy curtailments because of integration issues in the power system have appearedin the Spanish power system. Until 2009, major curtailments were due to limitations on dis‐tribution networks, but since the end of 2009, cuts have been applied in real time to sched‐uled energy. However, the nature of renewable energy along with the economic andenvironmental issues, have provoked an interest in adding energy storage (such as pumpedhydro storage PHS, a well-known technologies) into the power system mix.Spain accountsfor around 5,000 MW (2.75 GW of pure PHS), with 77 GWh capacity. This technology is usu‐ally deployed because of the limited transmission capacity for exporting or importing powerto neighboring countries.
As an example of wind power curtailment, Table 1 indexes orders delivered by the SpanishTSO on February 28, 2010. The initial and end times for every curtailment period are present‐ed in columns 1 and 2. Column 3 represents Spanish wind power at the beginning of the peri‐od. In column 4, the Spanish TSO set point for this period is listed. In column 5, the real increaseor reduction experimented by Spanish wind power in this period is shown. Finally, the ratiobetween the real increase/decrease and the increase/decrease obtained if wind power wouldmatch the set point is presented in column 6. In decrease periods, this ratio is equal to or high‐er than 1; in increase periods, it is equal to or less than 1, 1 being the optimum value.
Initial Time End Time Wind Power
(MW)
Wind Power Set Point
(MW)
Real Increase/Reduction
(MW)
Ratio
1:08 2:07 7796 7331 -796 1.71
2:07 3:48 6470 6099 -718 1.93
3:48 6:08 5175 4904 -720 2.66
6:08 8:45 4036 5904 217 0.11
8:45 9:10 3772 6905 420 0.14
9:10 9:43 3807 7905 276 0.07
9:43 – 4209 Installed capacity – –
Table 1. Curtailment schedule on February 28, 2010
Advances in Wind Power298
4.4. Over-response to wind power curtailments
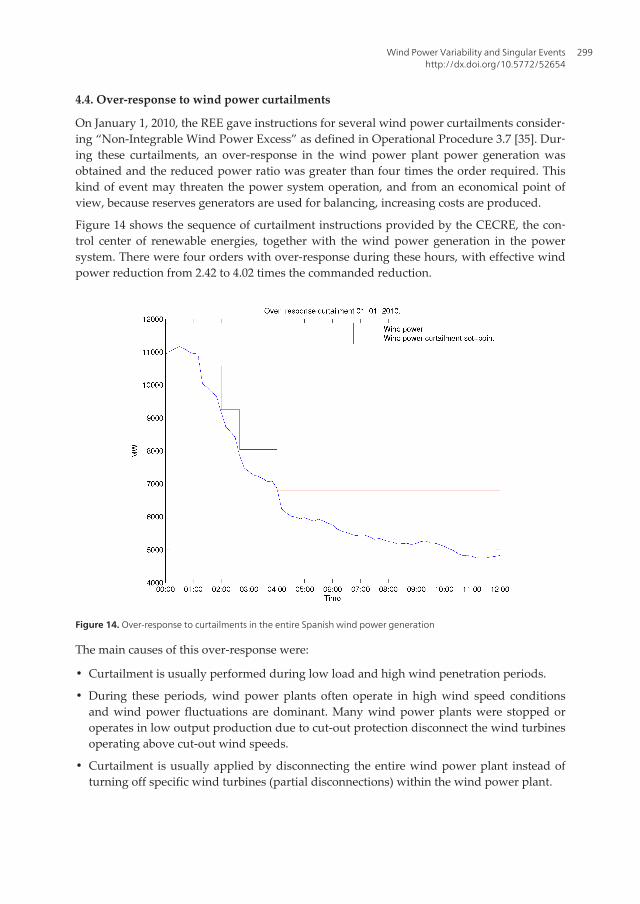
On January 1, 2010, the REE gave instructions for several wind power curtailments consider‐ing “Non-Integrable Wind Power Excess” as defined in Operational Procedure 3.7 [35]. Dur‐ing these curtailments, an over-response in the wind power plant power generation wasobtained and the reduced power ratio was greater than four times the order required. Thiskind of event may threaten the power system operation, and from an economical point ofview, because reserves generators are used for balancing, increasing costs are produced.
Figure 14 shows the sequence of curtailment instructions provided by the CECRE, the con‐trol center of renewable energies, together with the wind power generation in the powersystem. There were four orders with over-response during these hours, with effective windpower reduction from 2.42 to 4.02 times the commanded reduction.
Figure 14. Over-response to curtailments in the entire Spanish wind power generation
The main causes of this over-response were:
• Curtailment is usually performed during low load and high wind penetration periods.
• During these periods, wind power plants often operate in high wind speed conditionsand wind power fluctuations are dominant. Many wind power plants were stopped oroperates in low output production due to cut-out protection disconnect the wind turbinesoperating above cut-out wind speeds.
• Curtailment is usually applied by disconnecting the entire wind power plant instead ofturning off specific wind turbines (partial disconnections) within the wind power plant.
Wind Power Variability and Singular Eventshttp://dx.doi.org/10.5772/52654
299
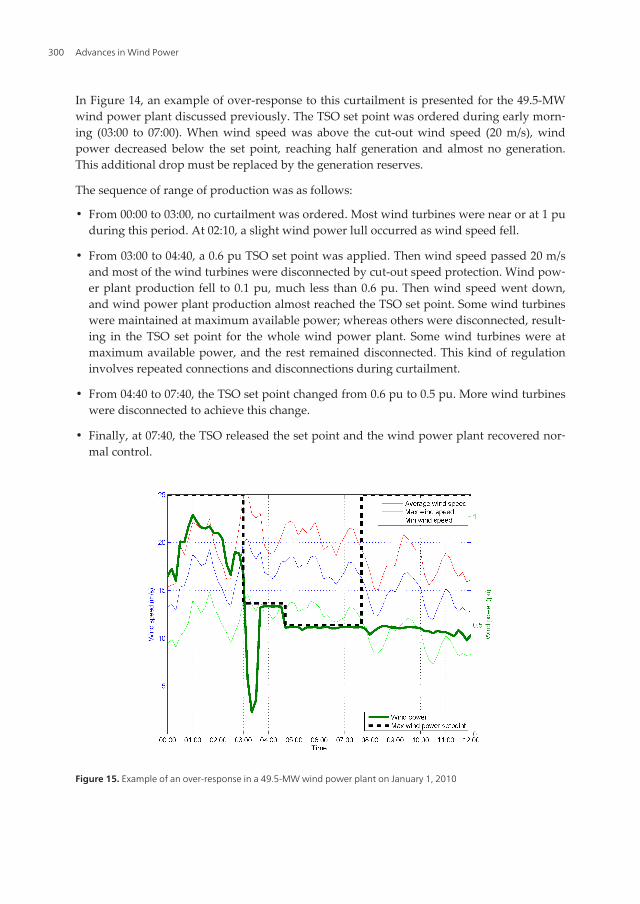
In Figure 14, an example of over-response to this curtailment is presented for the 49.5-MWwind power plant discussed previously. The TSO set point was ordered during early morn‐ing (03:00 to 07:00). When wind speed was above the cut-out wind speed (20 m/s), windpower decreased below the set point, reaching half generation and almost no generation.This additional drop must be replaced by the generation reserves.
The sequence of range of production was as follows:
• From 00:00 to 03:00, no curtailment was ordered. Most wind turbines were near or at 1 puduring this period. At 02:10, a slight wind power lull occurred as wind speed fell.
• From 03:00 to 04:40, a 0.6 pu TSO set point was applied. Then wind speed passed 20 m/sand most of the wind turbines were disconnected by cut-out speed protection. Wind pow‐er plant production fell to 0.1 pu, much less than 0.6 pu. Then wind speed went down,and wind power plant production almost reached the TSO set point. Some wind turbineswere maintained at maximum available power; whereas others were disconnected, result‐ing in the TSO set point for the whole wind power plant. Some wind turbines were atmaximum available power, and the rest remained disconnected. This kind of regulationinvolves repeated connections and disconnections during curtailment.
• From 04:40 to 07:40, the TSO set point changed from 0.6 pu to 0.5 pu. More wind turbineswere disconnected to achieve this change.
• Finally, at 07:40, the TSO released the set point and the wind power plant recovered nor‐mal control.
Figure 15. Example of an over-response in a 49.5-MW wind power plant on January 1, 2010
Advances in Wind Power300

Possible solutions to avoid over-response to wind power curtailments, with the actual ca‐pacity of energy storage and transmission to other countries, are:
• The TSO should dispose of real-time wind power generation as well as a wind powerforecast during the curtailment period. Maintenance schedules and cut-out shutdownsmust be taken into account.
• Performing curtailment orders at the control center level instead of the wind power plantlevel must be studied.
• Control centers are connected to the CECRE and could improve curtailment management.
• Information about the reasons of curtailment, the application method, and wind powerplant response could help toward overall optimization.
5. Conclusions
There are different types of events in which wind power fluctuates significantly. In somecases, fluctuations are produced by variations of wind speed, especially during meteorologi‐cal events such as storms. Other power fluctuations are not directly linked with wind behav‐ior and have a technical cause related to power system operation issues.
In this chapter, examples of the different events affecting wind power fluctuations wereshown.The behaviors and the responses of the Spanish power system and wind powerplants experiencing such events were analyzed. Examples presented in this chapter showthat some of the wind power integration issues are related to low-voltage ride-through.They are solved through strict grid code enforcement. Other solutions to manage the reservepower generation and the wind power fluctuations are also very important in order to ach‐ieve high levels of wind power penetration. In the Spanish case, this could require increas‐ing the availability of dispatchable and fast-start power plants, as well as increasing windpower plant participation on supporting the power system by providing voltage control, in‐ertial emulation, frequency control, oscillation damping, or updated voltage ride-throughcapabilities.
Acknowledgements
This work was supported in part by the “Ministerio de Ciencia y Innovación”(ENE2009-13106) and in part by the “Junta de Comunidades de Castilla-La Mancha”(PEII10-0171-1803), both projects co-financed with FEDER funds.
This work was also supported by the U.S. Department of Energy under Contract No. DE-AC36-08-GO28308 with the National Renewable Energy Laboratory.
Wind Power Variability and Singular Eventshttp://dx.doi.org/10.5772/52654
301
Author details
Sergio Martin-Martínez1, Antonio Vigueras-Rodríguez2, Emilio Gómez-Lázaro1,Angel Molina-García3, Eduard Muljadi4 and Michael Milligan4
1 Renewable Energy Research Institute, Universidad de Castilla-La Mancha, Albacete, Spain
2 Renewable Energy Research Institute, Albacete Science and Technology Park and Univer‐sidad de Castilla-La Mancha, Albacete, Spain
3 Department of Electrical Engineering, Universidad Politécnica de Cartagena, Cartagena,Spain
4 National Renewable Energy Laboratory, Golden, Colorado, USA; Michael Milligan, Na‐tional Renewable Energy Laboratory, Golden, Colorado, USA
References
[1] Bialasiewicz, J. T., & Muljadi, E. The Wind Farm Aggregation Impact on Power Qual‐ity. In: The 32nd Annual Conference of the IEEE Industrial Electronics Society (IE‐CON’06), Paris, France; (2006).
[2] Mandic, G., Gotbi, E., Nasiri, A., Muljadi, E., Oyague, F., Mechanical, Stress., Reduc‐tion, in., Variable, Speed., Wind, Turbine., & Drivetrains, . In: Windpower (2011).Anaheim, CA; 2011.
[3] GoranMandic, Adel Nasiri, Eduard Muljadi, EhsanGhotbi and Francisco Oyague.Me‐chanical Stress Reduction in Variable Speed Wind Turbine Drivetrains. In: IEEEECCE, Phoenix, AZ; (2011).
[4] Van der Hoven.Power spectrum of horizontal wind speed in the frequency rangefrom 0.0007 to 900 cycles per hour. Journal of Meteorology (1957). , 14, 160-164.
[5] Heggem, T., Lende, R., & Løvseth, J. Analysis of long time series of coastal wind.American Meteorological Society (1998). , 55, 2907-2917.
[6] Fiedler, F., & Panofsky, H. A. Atmospheric scales and spectral gaps. Bulletin of theAmerican Meteorology Society (1970). , 51, 1114-1119.
[7] Agee, E., Chen, T., Dowell, K. A., review, of., mesoscale, cellular., & convection, . Bul‐letin of the American Meteorology Society (1973). , 54, 1004-1012.
[8] Vincent, C. L., Pinson, P., & Giebela, G. Wind fluctuations over the North Sea, Inter‐national Journal of Climatology (2011). , 31(11), 1584-1595.
Advances in Wind Power302

[9] Vigueras‐, Rodríguez. A., Sørensen, P., Cutululis, N., Viedma, A., & Donovan, M. H.Wind model for low frequency power fluctuations in offshore wind farms. Wind En‐ergy (2010). , 13(5), 471-482.
[10] Gjerstad, J., Aasen, S. E., Andersson, H. I., Brevik, I., & Lovseth, J. Andersson HI, Bre‐vik I, and Lovseth J. An analysis of low-frequency maritime atmospheric turbulence.Journal of the atmospheric sciences (1995).
[11] Smedman, A. Occurrence of roll circulation in a shallow boundary layer. Boundary-Layer Meteorology (1991). , 57, 343-358.
[12] Stull, R. An Introduction to Boundary Layer Meteorology. Kluwer Academic: Nor‐well, USA, (1988).
[13] Courtney, M., & Troen, I. Wind speed spectrum from one year of continuous 8 hzmeasurements. In: Proceedings of the Ninth Symposium on Turbulence and Diffu‐sion; (1990).
[14] Yahaya, S., & Frangi, J. P. Cup anemometer response to the wind turbulence meas‐urement of the horizontal wind variance. AnnalesGeophysicae (2004).
[15] Akhmatov, V., Kjaergaard, J. P., & Abildgaard, H. Announcement of the large off‐shore wind farm Horns Rev B and experience from prior projects in Denmark. In: Eu‐ropean Wind Energy Conference; (2004).
[16] Holttinen, H., Meibom, P., Orths, A., O’Malley, M., Ummels, B., Tande, J. O., Estan‐queiro, A., Gomez, E., Smith, J. C., & Ela, E. Impacts of large amounts of wind poweron design and operation of power systems, results of IEA. In: 7th International Work‐shop on Large Scale Integration of Wind Power and on Transmission Networks forOffshore Wind Farms; (2008).
[17] Veers PS. Three-Dimensional Wind Simulation.Sandia National Laboratories Techni‐cal Report: New Mexico and California, USA, (1988).
[18] Sørensen, P., Hansen, A. D., & Carvalho-Rosas, P. E. Wind models for simulation ofpower fluctuations from wind farms. Journal of Wind Engineering and IndustrialAerodynamics (2002). , 90, 1381-1402.
[19] Sørensen, P., Cutululis, N., Vigueras-Rodríguez, A., Jensen, L. E., Hjerrild, J., Dono‐van, M. H., & Madsen, H. Power Fluctuation from Large Wind Farms IEEE Transac‐tions on Power Systems (2007). , 22(3), 958-965.
[20] Sørensen, P., Cutululis, N., Vigueras-Rodríguez, A., Madsen, H., Pinson, P., Jensen,L. E., Hjerrild, J., & Donovan, M. Modelling of Power Fluctuations from Large Off‐shore Wind Farms. Wind Energy (2008). , 11, 29-43.
[21] Schlez W, Infield D. Horizontal, two point coherence for separations greater than themeasurement height. Boundary-Layer Meteorology 1998; 87: 459-480.
Wind Power Variability and Singular Eventshttp://dx.doi.org/10.5772/52654
303
[22] Vigueras-Rodríguez, A., Sørensen, P., Viedma, A., Donovan, M. H., & Gómez-Láz‐aro, E. Spectral Coherence Model for Power Fluctuations in a Wind Farm. Journal ofWind Engineering and Industrial Aerodynamics (2012). , 102, 14-21.
[23] Woods, M., Davy, R., Russel, C., Coppin, P., & Cross, . Cross-Spectrum of WindSpeed for Meso-Gamma Scales in the Upper Surface Layer over South-Eastern Aus‐tralia. Boundary Layer Meteorology (2011).
[24] Jensen, N. O., Kristensen, L., Larsen, S. E., (ed., , America, Meteorology., Society, Bos‐ton., & , U. S. A. (1990). 301-304.
[25] Characterization and visualization of voltage dips in wind power installations. IEEETransactions on Power Delivery, , 24(4), 2071-2078.
[26] Spanish Wind Energy Association.Procedure for verification validation and certifica‐tion of the requirements of the PO 12.3 on the response of wind farms in the event ofvoltage dips, 4th edition, Spain, (2008).
[27] Red Eléctrica de España. REE. P.O. 12.3 Requisitos de respuesta frente a huecos detensión de las instalaciones eólicas. Red Eléctrica de España, (2006).
[28] Gómez-Lázaro, E., Fuentes, J. A., Molina-García, A., Ruz, F., & Jimenez, F. Field testsof wind turbines submitted to real voltage dips under the new Spanish grid code re‐quirements. Wind Energy (2007).
[29] Gómez-Lázaro, E., Fuentes-Moreno, J. A., Molina-García, A., Ruz, F., & Jiménez-Buendía, F. Results using different reactive power definitions for wind turbines sub‐mitted to voltage dips: Application to the Spanish grid code. In Power SystemsConference (IEEE PES). Atlanta (USA), (2006).
[30] Jimenez, F., Gómez-Lázaro, E., Fuentes, J. A., Molina-García, A., & Vigueras-Rodrí‐guez, A. Validation of a DFIG wind turbine model and wind farm verification fol‐lowing the Spanish grid. Wind Energy (2012).
[31] Coughlan, Y., Smith, P., Mullane, A., & O’Malley, M. Wind turbine modelling forpower system stability analysis- a system operator perspective. IEEE Transactions onPower Systems (2007).
[32] Piwko RJ, Miller NW, and MacDowell JM.Field testing and model validation of windpower plants. In IEEE Power and Energy Society General Meeting- Conversion andDelivery of Electrical Energy in the 21st Century, Pittsburgh PA, USA; (2008).
[33] Singh, M., Faria, K., Santoso, S., & Muljadi, E. Validation and analysis of wind powerplant models using short-circuit field measurement data. In IEEE Power & EnergySociety General Meeting, Calgary, Canada; (2009).
[34] Coronado LM. Huecos de tensión: La visión del operador del sistema.In Huecos deTensión: Requisitos y Procedimientos en Fotovoltaica, Madrid, Spain; (2011).
[35] Red Eléctrica de España. P.O. 3.7 Programación de la generación de origen renovableno gestionable ;2009.
Advances in Wind Power304


![An Open-Access Web-Based Tool to Access Global, Hourly ... · practical global wind power availability [50,51], inter-annual wind power production variability [42], and wind variability](https://img.dokumen.tips/doc/110x75/60456687923b036b1f3b92b0/an-open-access-web-based-tool-to-access-global-hourly-practical-global-wind.jpg)