Embed Size (px)
Citation preview
1
Whotopia HMIS Case Description
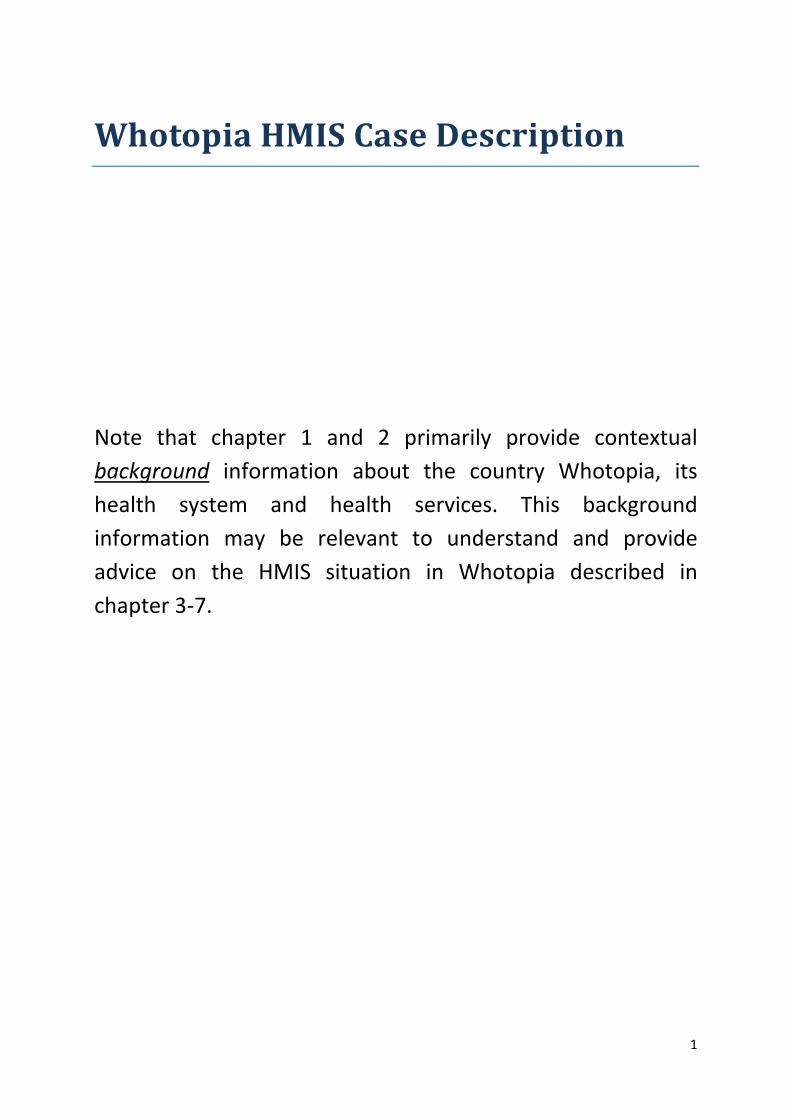
Note that chapter 1 and 2 primarily provide contextual background information about the country Whotopia, its health system and health services. This background information may be relevant to understand and provide advice on the HMIS situation in Whotopia described in chapter 3-7.

2
Contents 1 Whotopia Country Profile..................................................................................................................... 4
1.1 Whotopia Health Status ................................................................................................................ 4
2 The Whotopia Health System ............................................................................................................... 5
2.1 Goals and objectives of the health system .................................................................................... 5
2.2 Structure of the Health System ..................................................................................................... 5
2.2.1 Levels of Health Care .............................................................................................................. 7
2.2.2 Administrative Organization .................................................................................................. 8
2.3 Functions and Performance of the Health System ........................................................................ 9
2.3.1 Health Financing ..................................................................................................................... 9
2.3.2 Health Service Provision and the Essential Health Package ................................................. 10
3 The Whotopia Health Information System ........................................................................................ 11
3.1 Health Information System Assessment ..................................................................................... 11
3.2 Data processing and Dissemination ............................................................................................ 12
3.3 Population Figures, Census and Surveys ..................................................................................... 12
4 Program-specific reporting systems and HMIS .................................................................................. 13
4.1 Data Reporting Frequency – from facility ................................................................................... 13
4.2 Data Elements and Sources of the data ...................................................................................... 14
4.3 Data Aggregation and Reporting – at and from district level ..................................................... 16
4.4 Data Analysis at district level and higher .................................................................................... 18
4.5 Data Sharing and Information Use .............................................................................................. 19
5 Program Coordination: Supervision and Meetings ............................................................................ 20
5.1 Program Supervision ................................................................................................................... 20
5.2 Review Meetings ......................................................................................................................... 21
5.3 Ordering and Distribution of Drugs and Medical Supplies .......................................................... 21
5.4 Other non-program coordinator duties ...................................................................................... 22
6 District Health Management Team (DHMT)....................................................................................... 22
7 Emerging mHealth and eHealth Initiatives in Whotopia HMIS .......................................................... 23

3
List of Abbreviations and Acronyms
ART Anti-Retroviral Therapy DEHO District Environmental Health Officer DHIS District Health Information Software DHMT District Health Management Team DHO District Health Office DIP District Implementation Plan DNO District Nursing Officer EPI Expanded Program for Immunization HIS Health Information System HIV Human Immune Deficiency Virus HMIS Health Management Information System HMIU Health Management Information Unit HSA Health Surveillance Assistant IDSR Integrated Disease Surveillance and Response IS Information System ITN Insecticide Treated Nets MCH Maternal and Child Health MOH Ministry of Health MSH Management Sciences for Health
4
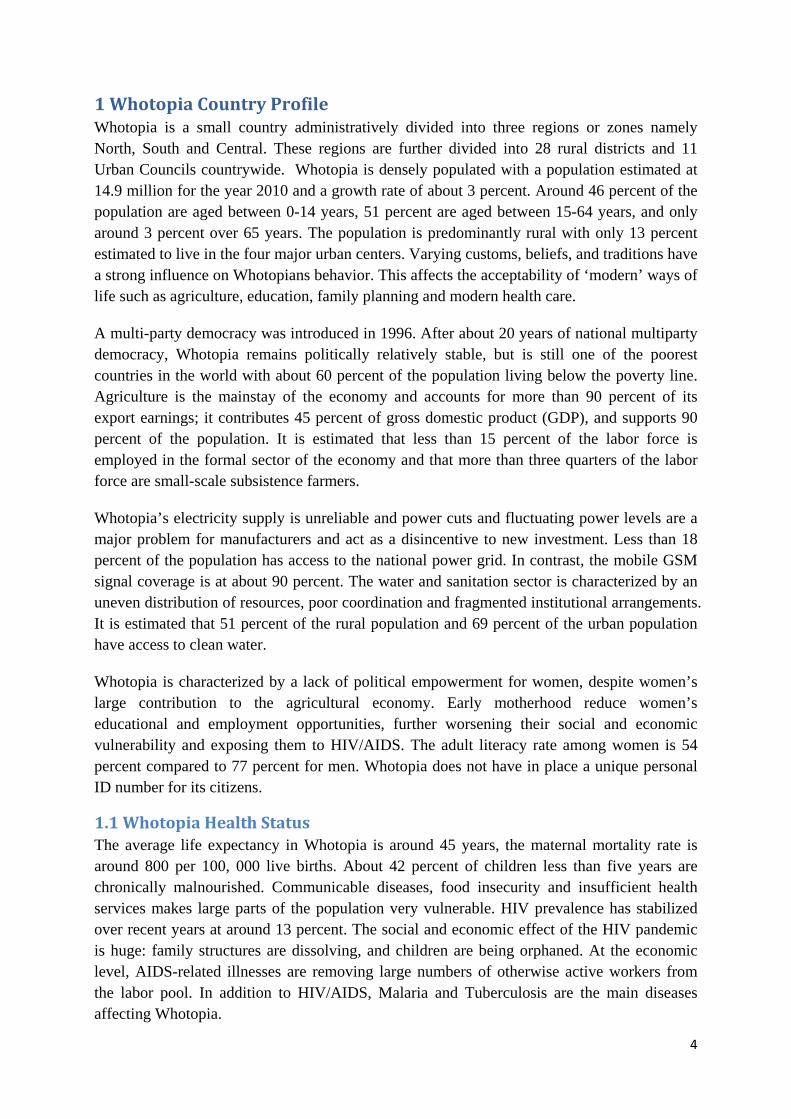
1 Whotopia Country Profile Whotopia is a small country administratively divided into three regions or zones namely North, South and Central. These regions are further divided into 28 rural districts and 11 Urban Councils countrywide. Whotopia is densely populated with a population estimated at 14.9 million for the year 2010 and a growth rate of about 3 percent. Around 46 percent of the population are aged between 0-14 years, 51 percent are aged between 15-64 years, and only around 3 percent over 65 years. The population is predominantly rural with only 13 percent estimated to live in the four major urban centers. Varying customs, beliefs, and traditions have a strong influence on Whotopians behavior. This affects the acceptability of ‘modern’ ways of life such as agriculture, education, family planning and modern health care.
A multi-party democracy was introduced in 1996. After about 20 years of national multiparty democracy, Whotopia remains politically relatively stable, but is still one of the poorest countries in the world with about 60 percent of the population living below the poverty line. Agriculture is the mainstay of the economy and accounts for more than 90 percent of its export earnings; it contributes 45 percent of gross domestic product (GDP), and supports 90 percent of the population. It is estimated that less than 15 percent of the labor force is employed in the formal sector of the economy and that more than three quarters of the labor force are small-scale subsistence farmers.
Whotopia’s electricity supply is unreliable and power cuts and fluctuating power levels are a major problem for manufacturers and act as a disincentive to new investment. Less than 18 percent of the population has access to the national power grid. In contrast, the mobile GSM signal coverage is at about 90 percent. The water and sanitation sector is characterized by an uneven distribution of resources, poor coordination and fragmented institutional arrangements. It is estimated that 51 percent of the rural population and 69 percent of the urban population have access to clean water.
Whotopia is characterized by a lack of political empowerment for women, despite women’s large contribution to the agricultural economy. Early motherhood reduce women’s educational and employment opportunities, further worsening their social and economic vulnerability and exposing them to HIV/AIDS. The adult literacy rate among women is 54 percent compared to 77 percent for men. Whotopia does not have in place a unique personal ID number for its citizens.
1.1 Whotopia Health Status The average life expectancy in Whotopia is around 45 years, the maternal mortality rate is around 800 per 100, 000 live births. About 42 percent of children less than five years are chronically malnourished. Communicable diseases, food insecurity and insufficient health services makes large parts of the population very vulnerable. HIV prevalence has stabilized over recent years at around 13 percent. The social and economic effect of the HIV pandemic is huge: family structures are dissolving, and children are being orphaned. At the economic level, AIDS-related illnesses are removing large numbers of otherwise active workers from the labor pool. In addition to HIV/AIDS, Malaria and Tuberculosis are the main diseases affecting Whotopia.

5
2 The Whotopia Health System
2.1 Goals and objectives of the health system The central government of Whotopia consists of ministries and non-ministerial departments with their headquarters located in Capital City. The ministries and governmental departments also have field services organized at zonal and district levels. The health challenges faced by Whotopia have justified the development of a Sector Wide Approach by the Ministry of Health and its Development Partners aiming at improving the availability of quality healthcare for poor and vulnerable populations. The Sector Wide Approach is based on the reorganization of the health sector based on the principle of decentralization of health services to District Assemblies. The goal is to strengthen the health systems through equitable health financing, increased human resources, reliable pharmaceutical and supplies logistics, and effective monitoring and evaluation. The Sector Wide Approach also aims to enhance the capacity of the Ministry of Health for stewardship and policy development, and strengthen the systems for planning, budgeting, and delivery of quality health services in the districts. Finally, it aims to expand communities’ participation in the delivery of essential health interventions. The Government recently made a policy decision that all services within the Essential Health Package (see description in section 2.3.2) should be delivered free-of-charge.
2.2 Structure of the Health System The Health Sector has a plurality of health service providers. In general the providers can be separated into the traditional and modern sectors. A large number of people use the two sectors simultaneously or consecutively, and they are seen by most Whotopians to complement each other.
Traditional Health Providers Traditional health providers exist in most communities and they can be divided into two main categories: traditional healers who deal with diseases/spirits, and traditional birth attendants (TBAs). The TBAs have more established links with the modern health sector as many of them have been trained to support primary health care since 1992, and they deliver approximately 35 percent of the pregnant women. Over the last few years the national official policy on TBA practice has shifted from legal to outright ban and back to “legal in cases of emergency”. The main reason for lifting the ban on TBAs shortly after its introduction was due to the public health systems’ failure to support the sudden surge in institution based deliveries, due to limited resources, bed capacity, undermanned facilities, and unskilled staff at facilities. In addition, many Whotopians could not deliver at facilities due to long travelling distances from villages. The legal uncertainty concerning TBA assisted deliveries has made the previously cooperative TBAs reluctant to report data on any of their service to the mainstream Health Management Information System (HMIS).
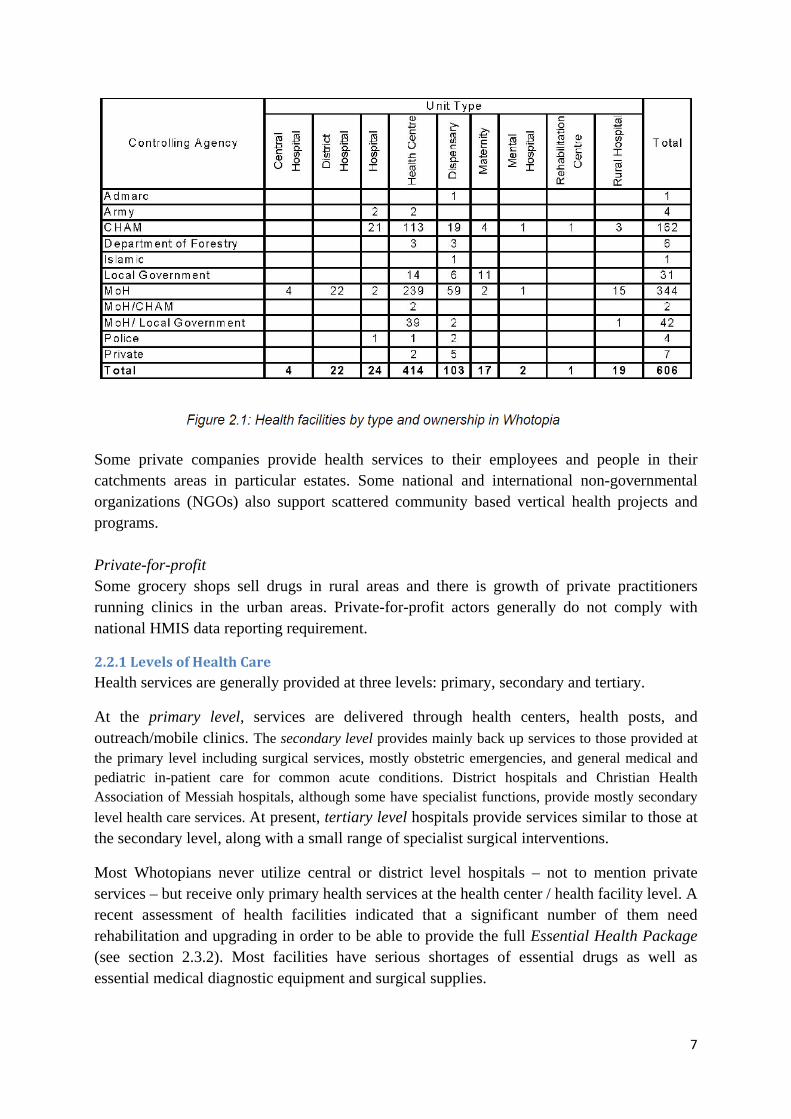
Modern Health Sector There are three main categories of health service providers in the modern sector; the public sector, non-profit private sector and for-profit private sector. Health facilities by type and ownership are presented in Figure 2.1

6
The public sector The Ministry of Health provides about 60 percent of public health services, mostly for free. Government District Health Offices (DHO) are responsible for the provision of public services at district level. Sub-district health facilities such as health centers, dispensaries and mobile clinics provide services to local communities. Health Surveillance Assistants (HSAs) are administered from the sub-district health facilities by Senior HSAs and play a crucial role in the public health services. The number of duties given to HSAs has increased considerably over the last few years. From being vaccinators and specific outbreak and prevention servants, they have become the main point of contact between the formal health service delivery system and the community. With disease prevention and local participation for health improvement becoming trends in the professional health sector their mandate has evolved to include general health and outbreak monitoring, and local advancement of hygiene and sanitation, including water and food in private households, schools and markets.
A range of health programs imposed by the government or other actors in the health industry need the HSAs to perform a variety of detailed tasks since they are the ones who know the communities best. The spreading of health related information and the influencing of people’s knowledge on many topics are thus a considerable part of HSAs job, along with extensive reporting. To get a job as an HSA applicants should have a Whotopia School Certificate of Education, which implies four years of education after eight years of primary school, or a Whotopia Junior Certificate of Education, implying two years in secondary school. However, many acting HSAs are currently not meeting these requirements due to recruitment challenges. HSAs currently number only 80 per 100.000 people. Poor infrastructure and low literacy rates compound the problem of getting information to HSAs where it is needed most—in rural, hard-to-reach communities with limited access to health information resources.
Apart from the Ministry of Health, The Ministry of Local Government, through Districts and Urban Councils, provides some health services. The ministry of Local Government is in charge of constructing and maintaining physical infrastructure such as communication infrastructure and health facilities. The Ministries of Agriculture and Education also provide health services, and there are services for specific target groups such as armed forces, prisons and the police.
Non-Profit private sector The Christian Health Association of Messiah (CHAM) provides a large proportion of services at variable charges. The Association is made up of independent church-related and other private voluntary agency facilities. It operates autonomously about 160 health units in predominantly rural areas. Though primarily curative in orientation, most units also provide primary health care services. Most of CHAMs health institutions provide basic training for nurses and other health personnel. The quality of services provided at CHAM facilities is generally considered better than those provided at Ministry of Health facilities.
7
Some private companies provide health services to their employees and people in their catchments areas in particular estates. Some national and international non-governmental organizations (NGOs) also support scattered community based vertical health projects and programs. Private-for-profit Some grocery shops sell drugs in rural areas and there is growth of private practitioners running clinics in the urban areas. Private-for-profit actors generally do not comply with national HMIS data reporting requirement.
2.2.1 Levels of Health Care Health services are generally provided at three levels: primary, secondary and tertiary.
At the primary level, services are delivered through health centers, health posts, and outreach/mobile clinics. The secondary level provides mainly back up services to those provided at the primary level including surgical services, mostly obstetric emergencies, and general medical and pediatric in-patient care for common acute conditions. District hospitals and Christian Health Association of Messiah hospitals, although some have specialist functions, provide mostly secondary level health care services. At present, tertiary level hospitals provide services similar to those at the secondary level, along with a small range of specialist surgical interventions.
Most Whotopians never utilize central or district level hospitals – not to mention private services – but receive only primary health services at the health center / health facility level. A recent assessment of health facilities indicated that a significant number of them need rehabilitation and upgrading in order to be able to provide the full Essential Health Package (see section 2.3.2). Most facilities have serious shortages of essential drugs as well as essential medical diagnostic equipment and surgical supplies.

8
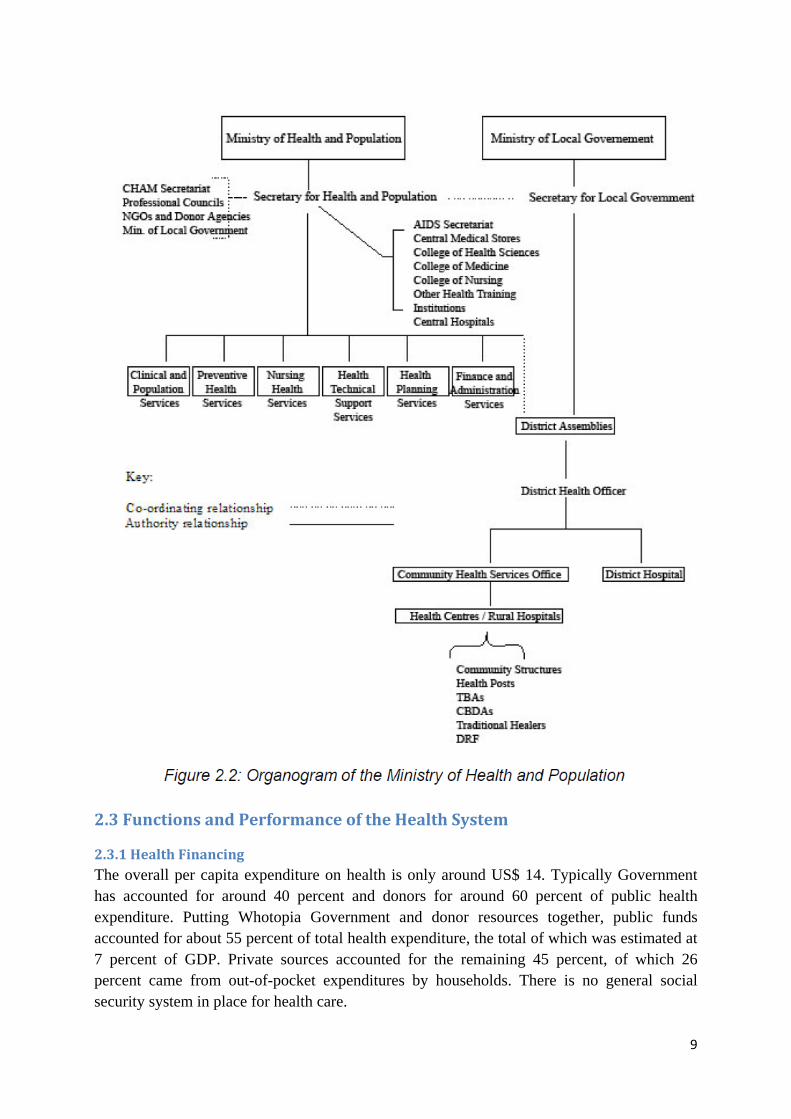
2.2.2 Administrative Organization The Ministry of Health has overall responsibility for developing policies, planning strategies and programs, and ensuring that all health care providers follow the national policies and standards so that quality health services are provided to the population. It has a Principal Secretary who is responsible for the operational, financial and administrative affairs of the Ministry of Health. The ministry has seven technical sub-divisions, see Figure 2.2 for more details. The operational aspects of the health services are facilitated through collaboration between the Ministry of Health and the Ministry of Local Government. At times there are conflicts between the two ministries due to uncertainties pertaining to their mandates and accountabilities in terms of co-ordination and organization of the health system in Whotopia.
Below the central level, the health system is divided into 28 districts and each district’s District Health Officer is accountable to the Principal Secretary of both ministries. The District Health Officer, assisted by the District Health Management Team (DHTM), is responsible for the dissemination of national policies, overall coordination of health services and programs, and provision of services at district level. Although the DHMT has the mandate to supervise all health facilities and services within the district, their full extent of authority is unclear (see chapter 6 for more details about the DHMT). The District Health Office is mainly based at Ministry of Health district hospitals, and manages and supervises both hospital and peripheral government facilities such as health centers, dispensaries and mobile clinics. The team has direct control over MOH units only. The Christian Health Association of Messiah hospitals supervise their own peripheral clinics. National central hospitals report directly to the central level by the Principal Secretary. With the new policy direction to decentralize health services to District Assemblies, the DHO will have the responsibility for the management of all health services in the district and will be accountable to the District Assemblies for decisions on financial planning and expenditures.
Until 1999, the MOH had a regional level, but these Regional Health Offices were abolished due to the fact that no tangible decisions were taken at the Regional Health Offices and therefore they did not add any value to the delivery of health services. However, the abolishment of the regional level created some difficulties in the supervision of the district health services from the Ministry of Health center. This led to the formation of Zones, with MOH Directors allocated the task of general supervision of the districts within their assigned zone. This arrangement has worked less than satisfactorily, because the MOH Directors have serious time constraints. In view of this deficit in support to the districts, the MOH have established Zonal Health Support Offices to facilitate the management and coordination of the health services at the operational level by reducing the management distance between the MoH headquarters and the District Health Offices. The Zonal Support Office’s functions include technical advice and facilitation support of decentralization, Essential Health Package (EHP) implementation, and inter-district collaboration.
9
2.3 Functions and Performance of the Health System
2.3.1 Health Financing The overall per capita expenditure on health is only around US$ 14. Typically Government has accounted for around 40 percent and donors for around 60 percent of public health expenditure. Putting Whotopia Government and donor resources together, public funds accounted for about 55 percent of total health expenditure, the total of which was estimated at 7 percent of GDP. Private sources accounted for the remaining 45 percent, of which 26 percent came from out-of-pocket expenditures by households. There is no general social security system in place for health care.

10
2.3.2 Health Service Provision and the Essential Health Package The Whotopia health service delivery is focused on the provision of the Essential Health Package (EHP) introduce in 2002. The EHP consists of a cluster of cost-effective interventions. The EHP addresses the major causes of morbidity and mortality among the general population and focuses particularly on medical conditions and service gaps that disproportionately affect the rural poor. The EHP includes: antiretroviral drugs for HIV/AIDS patients plus voluntary counselling, testing and treatment of other sexually transmitted diseases; safeguarding of reproductive health and family planning plus maternity services; treatment and prevention of malaria and vaccine preventable diseases included in the Expanded Program on Immunization; tuberculosis testing and treatment; treatment of acute respiratory infections; diarrheal diseases and injuries; and treatment of malnutrition. The objective of the EHP is to improve technical and allocative efficiency in the delivery of health care; to ensure universal coverage of health services; and to provide cost-effective interventions that can control the main causes of disease burden in Whotopia. The aforementioned Health Surveillance Assistants (HSAs are mentioned in section 2.2) are considered to be the “backbone” for the provision of EHP services in Whotopia.
Human resources One of the crucial factors affecting the quality of delivery of the Essential Health Package (EHP) is human resources. The workforce in the health sector as a whole is estimated at 15,700 persons. This does not include an estimated 3,600 Traditional Birth Attendants and 2,300 community-based distributor agents for contraceptives. Sixty eight percent (68 percent) of the total workforce are employees of the Ministry of Health. The Christian Health Association of Messiah employs about 26 percent with the remaining 6 percent divided among the Ministry of Local Government, the police, army and non-governmental organizations (NGOs).
The total number of physicians in the country is 219, being one doctor per 45,662 Whotopians, way below the WHO recommended average ratio of 1 to 10,000! The Whotopia University of Medicine produces about 20 doctors per year. Considering the population, this figure is extremely low and this has resulted in heavy reliance on other categories of health professionals such as clinical officers and nurses to carry out some of the work for doctors. In practice, health professionals also perform most health information system related tasks such as data collection, collation and reporting. However, there is currently no HMIS curriculum in pre-training institutions such as the University of Medicine or in nursing schools.
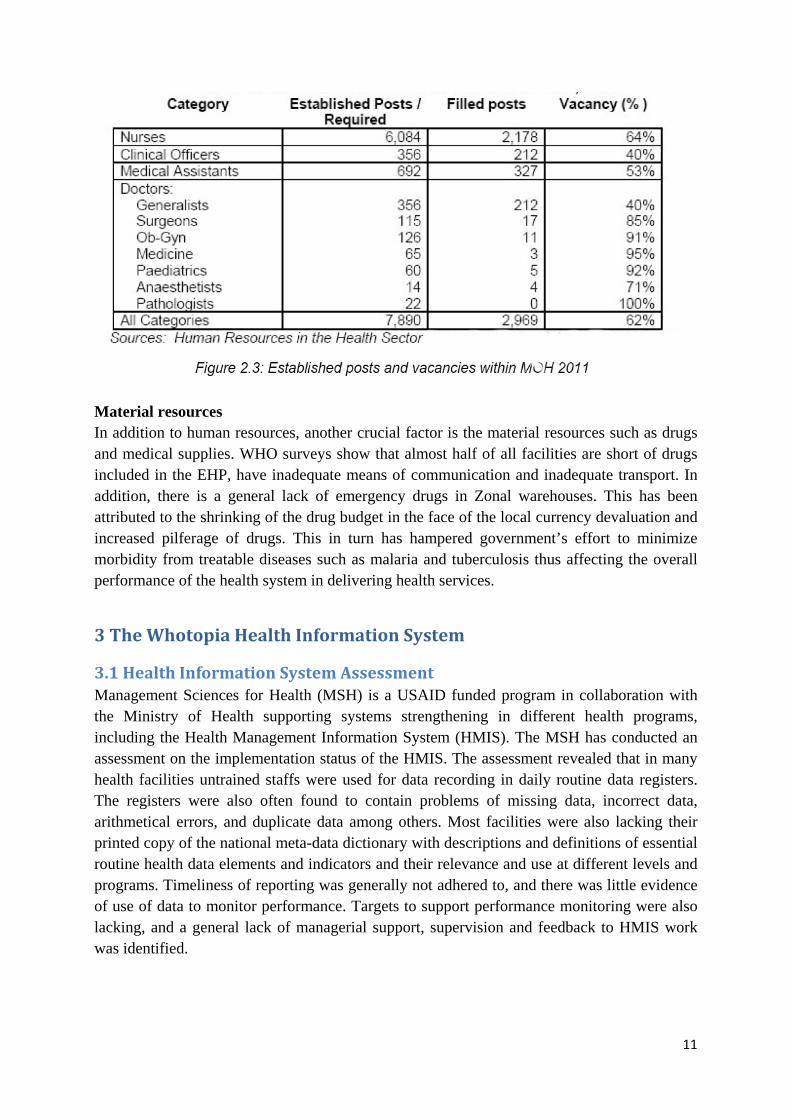
There is also a severe shortage of nurses, having 64 percent of the 6,084 established positions vacant (Figure 2.3). The current training outputs are too low to fill the large number of vacant health personnel positions. Furthermore, most of the skilled health workers are leaving the public services mainly due to poor salaries and working conditions. Thus, there is a collapsing human resource capacity and this negatively affects the performance of the health systems. The health personnel that remain are required to work beyond their limit.
11
Material resources In addition to human resources, another crucial factor is the material resources such as drugs and medical supplies. WHO surveys show that almost half of all facilities are short of drugs included in the EHP, have inadequate means of communication and inadequate transport. In addition, there is a general lack of emergency drugs in Zonal warehouses. This has been attributed to the shrinking of the drug budget in the face of the local currency devaluation and increased pilferage of drugs. This in turn has hampered government’s effort to minimize morbidity from treatable diseases such as malaria and tuberculosis thus affecting the overall performance of the health system in delivering health services.
3 The Whotopia Health Information System
3.1 Health Information System Assessment Management Sciences for Health (MSH) is a USAID funded program in collaboration with the Ministry of Health supporting systems strengthening in different health programs, including the Health Management Information System (HMIS). The MSH has conducted an assessment on the implementation status of the HMIS. The assessment revealed that in many health facilities untrained staffs were used for data recording in daily routine data registers. The registers were also often found to contain problems of missing data, incorrect data, arithmetical errors, and duplicate data among others. Most facilities were also lacking their printed copy of the national meta-data dictionary with descriptions and definitions of essential routine health data elements and indicators and their relevance and use at different levels and programs. Timeliness of reporting was generally not adhered to, and there was little evidence of use of data to monitor performance. Targets to support performance monitoring were also lacking, and a general lack of managerial support, supervision and feedback to HMIS work was identified.
12
3.2 Routine for Data processing and Dissemination in General All health personnel involved in managing and delivery of health services are expected to collect, aggregate and analyses information using paper, pencil and a simple calculator and make immediate use of data in their daily work. At the end of every month each facility is supposed to manually aggregate data from all the registers into a quarterly report. The report should be submitted quarterly to the district health office (DHO), i.e., to the Assistant Statistician or a data entry clerk who performs data entry. The facilities are also supposed to have monthly meetings where facility generated data is analyzed and discussed among facility mangers and service providers, however, for the last few years this practice has generally become more and more infrequent and irregular.
The district Assistant Statistician is supposed to compile a report each quarter based on the quarterly reports received from the facilities in the district and a computerized system, the District Health Information Software (DHIS), has been established to assist in the processing of the data of each facility including the district hospital. The district report produced should then be submitted to the MOH, i.e. the Health Management Information Unit (HMIU). This district report is also supposed to be fed back to the health facilities and other stakeholders who are partners in health service management in the district. However, many health facilities rarely receive any feedback in the form of processed data reports. Each district is supposed to conduct an annual review meeting with its sub-district facility in-charges and other stakeholders and produces an annual performance report with the content of: district at a glance: maps, facts and figures; current health status in the district, i.e., analysis of routine indicators; Organization of health services: types of services, delivery points and frequencies; Quality assurance, monitoring and supervision.
At national level, each quarter the HMIU compiles data from all reporting districts and central hospitals and produces quarterly monitoring aggregated and comparative reports for use by different national programs and other stakeholders. A copy of this report is sent back to district health offices and central hospitals for their self-assessment, comparative analysis and actions. The distribution of these reports is often severely delayed due to printing and or transportation issues. Computers are available at most of the relevant offices at national, zonal levels to permit the rapid compilation of sub-national data, but support for ICT equipment is inadequate at the district level and non-existing at the health facility level.
3.3 Population Figures, Census and Surveys The HMIS in Whotopia obtains population data from the national census. The target population for each year is projected for each level using the inter-census growth rate for that particular level. The Ministry of Health provides its population data requirements to the National Statistics Office in order to incorporate it in the decennial census.
The current vital registration in the country is a voluntary system and therefore does not capture total events. Births and deaths that take place at a health facility are recorded in ward (inpatient) registers, but there is no mechanism to capture the events that are taking place in the communities. Surveys carried out every four years are the main source for collection of population data on health outcome and impact indicators. The following important impact

13
indicators are currently generated from survey data only: life expectancy, total fertility rate, crude death rate, maternal mortality rate, infant mortality rate, under five mortality rate and neonatal mortality rate.
4 Program-specific Reporting Systems and the HMIS Some programs have their own reporting systems whereby program-specific forms are used to report data from the health facilities to the districts. This section presents more details on these program systems for a selected few programs namely Integrated Disease Surveillance and Response (IDSR), Malaria Control, Maternal and Child Health (MCH) and HIV/AIDS. The MCH program is further divided into sub-programs namely Expanded Program of Immunization (EPI); Safe Motherhood and Family Planning. The HIV/AIDS program is also sub-divided into Voluntary Counselling and Testing (VCT); Anti-Retroviral Therapy (ART); and Prevention of Mother to Child Transmission of HIV/AIDS (PMTCT).
4.1 Data Reporting Frequency from Health Facilities As mentioned in section 3.2 the reporting frequency of data from the facilities to the district level is quarterly. The data completeness and timeliness associated with the quarterly paper based reporting to DHO is compromised by transportation on muddy roads, fuel shortages, occasional inadequate supplies of printed forms, or simple neglect. Some data collection tools are not being filled in and used as intended. Staffs at health facilities explain that when they travel to the DHO to deliver reports their travel costs are neither refunded nor subsidized, thus workarounds and improvisations are commonplace. For instance, facility health workers may send reports with ambulance drivers whenever they come by the health facility. District staff, such as the Assistant Statistician, prefers the delivery of reports by facility staff personally, as the face to face encounter is one of the few opportunities for providing supervision and feedback under resource constrained circumstances.
For the vertical programs, the data reporting frequency using their program-specific forms varies but the majority of the programs report data on monthly basis with only the ART program reporting quarterly. The disease surveillance program (IDSR) additionally is required to report data weekly using a specific form, but in practice verbal reporting (e.g., on mobile phone) is mostly done especially when there is zero reporting (i.e., zero cases but they still need to report). Table 4.1 below shows the details of reporting frequency for the programs and to whom they are submitted.
There are some exceptions to the general report flow, which have been indicated by the asterisk symbol in Table 4.1. For the Family Planning program (*), the monthly reporting is only done in one of the districts while in the other district there is no parallel reporting of data for this program. For most programs, the reports are submitted to their respective district program coordinators. However, for the PMTCT program (**), in one of the districts, the reports are submitted to the PMTCT coordinator but in the other district the facility reports are submitted to the VCT coordinator. The ART program is also exceptional (***). The program is only run in hospitals i.e. the District Hospitals, rural hospitals and some private hospitals

14
and each of these hospitals report directly to the national level i.e. to the Ministry of Health and not to the District ART coordinator.
In general the HMIS quarterly reporting frequency is considered one of the key factors contributing to the existence of parallel program reporting as some of the programs require data on a monthly basis. Thus, the HMIS was considered incapable of providing timely data to the programs, while also excluding certain data elements, data not disaggregated by age and gender, and donors’ international reporting requirements not met by the HMIS reporting.
4.2 Data Elements and Sources of Data The data elements collected by the HMIS quarterly reporting form (known as HMIS 15) are those that fall under issues of: Maternal services, Family planning, Child Health, Attendance, Tuberculosis, Supplies, Community health, Human Resources available, Finance, Physical facilities, Management and Supervision, New disease cases, Admissions and In-patient deaths. The program-specific reports contain details of their specific areas of interest and table 4.2 below shows the issues covered in each of the reporting forms of the programs.

15
As table 4.2 indicates, some of the aspects covered in the program reports are also covered in the HMIS 15 form hence there are some data overlaps. However, the data on the program reports tends to be more detailed on the subject matter i.e. disaggregated in various aspects while the HMIS has aggregated data, for instance, the IDSR data is disaggregated by age group, severity of the cases etc. In other cases, the data on HMIS is not an aggregated form of the program data but rather a subsection of the program data, for instance, the EPI form has data on vaccination performance by antigen and so has data, for example, on Polio 0, 1, 2 and 3 while the HMIS form has data on Polio 3 only.
In addition to this data overlap, there is also data duplication whereby there are some data elements that are on both the HMIS and the program-specific forms. This duplication of HMIS data mainly exists with the Safe Motherhood, Family Planning, Malaria Control, VCT, PMTCT and EPI forms. Furthermore, data overlap and duplication also exists among and
16
between some of the programs for instance between IDSR and EPI as they are both doing surveillance on Measles, Polio and Neonatal Tetanus. However, these program-reporting forms also contain other data elements that are neither on the HMIS form nor on the other program forms. Point of Service Delivery: the Sources of Data The source of all routine data is the interaction between the patient/client at the periphery health unit level where data is collected using patient/client health booklets (health passports for woman and child health), tally sheets and facility-based forms and registers. The sources of data for the quarterly HMIS form are mainly the health facility registers, namely the. HMIS registers 1-9. Additionally, the HMIS-15 form also obtains its data from the VCT register, ART register, Tuberculosis forms, Attendance registers, HSAs reports and stock books.
The table 4.2 above also shows the sources of the data for the program reporting forms and these include the HMIS registers, lab registers, VCT registers, ART registers, and ITN registers. Even though the VCT registers and ART registers were not included as HMIS registers, they are official registers developed by Ministry of Health and other stakeholders. There are exceptions whereby the programs have their own data collection tools for instance the PMTCT program has their own unofficial register (which is basically a note book) and this has been introduced because the program is relatively new and the existing design of the HMIS tools did not collect the data the program required.
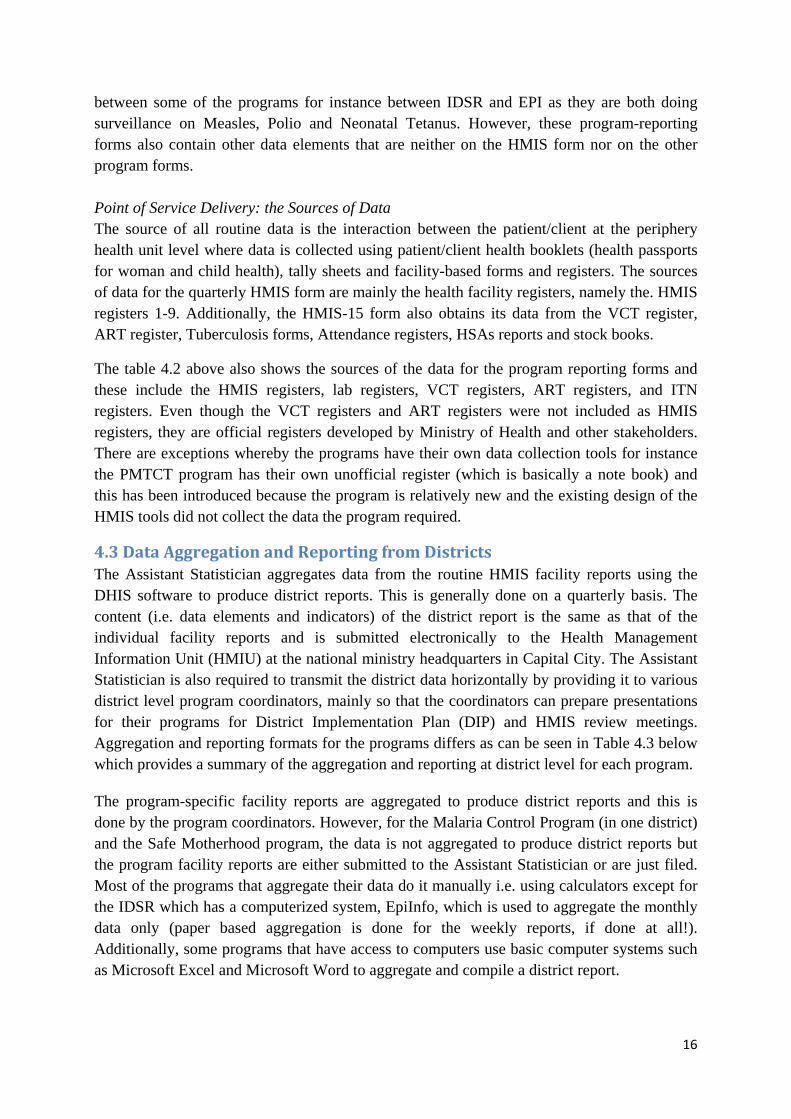
4.3 Data Aggregation and Reporting from Districts The Assistant Statistician aggregates data from the routine HMIS facility reports using the DHIS software to produce district reports. This is generally done on a quarterly basis. The content (i.e. data elements and indicators) of the district report is the same as that of the individual facility reports and is submitted electronically to the Health Management Information Unit (HMIU) at the national ministry headquarters in Capital City. The Assistant Statistician is also required to transmit the district data horizontally by providing it to various district level program coordinators, mainly so that the coordinators can prepare presentations for their programs for District Implementation Plan (DIP) and HMIS review meetings. Aggregation and reporting formats for the programs differs as can be seen in Table 4.3 below which provides a summary of the aggregation and reporting at district level for each program.
The program-specific facility reports are aggregated to produce district reports and this is done by the program coordinators. However, for the Malaria Control Program (in one district) and the Safe Motherhood program, the data is not aggregated to produce district reports but the program facility reports are either submitted to the Assistant Statistician or are just filed. Most of the programs that aggregate their data do it manually i.e. using calculators except for the IDSR which has a computerized system, EpiInfo, which is used to aggregate the monthly data only (paper based aggregation is done for the weekly reports, if done at all!). Additionally, some programs that have access to computers use basic computer systems such as Microsoft Excel and Microsoft Word to aggregate and compile a district report.
17
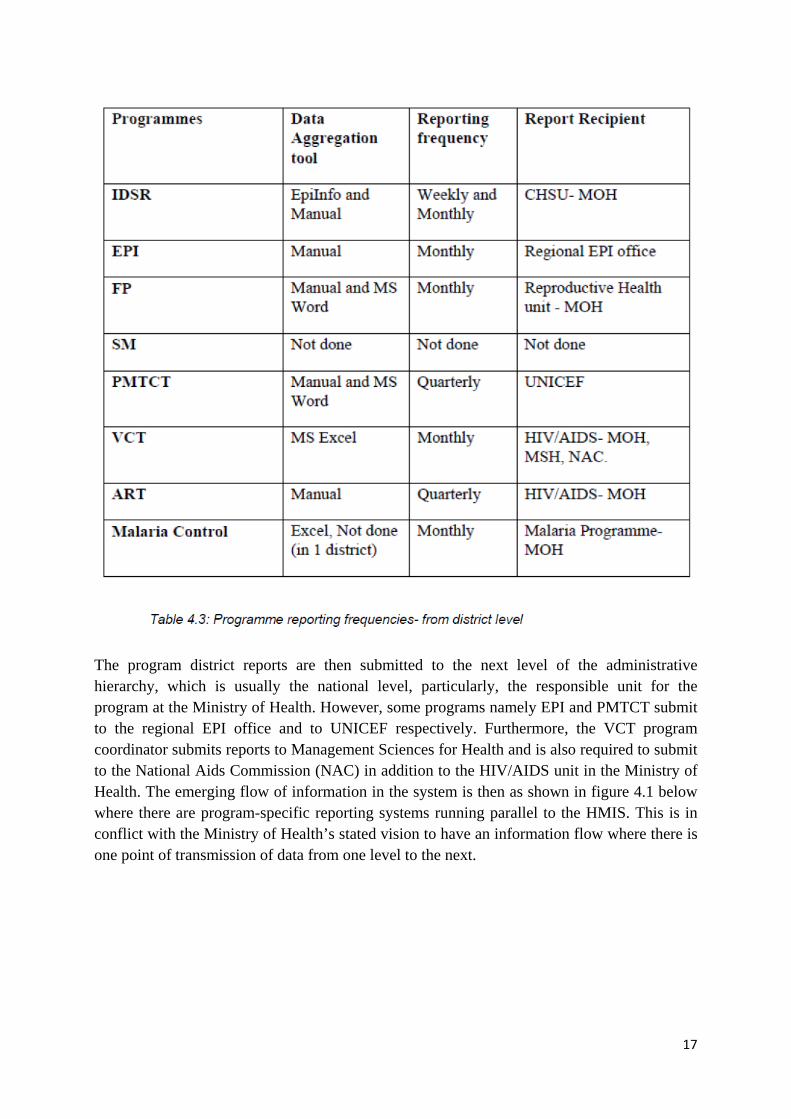
The program district reports are then submitted to the next level of the administrative hierarchy, which is usually the national level, particularly, the responsible unit for the program at the Ministry of Health. However, some programs namely EPI and PMTCT submit to the regional EPI office and to UNICEF respectively. Furthermore, the VCT program coordinator submits reports to Management Sciences for Health and is also required to submit to the National Aids Commission (NAC) in addition to the HIV/AIDS unit in the Ministry of Health. The emerging flow of information in the system is then as shown in figure 4.1 below where there are program-specific reporting systems running parallel to the HMIS. This is in conflict with the Ministry of Health’s stated vision to have an information flow where there is one point of transmission of data from one level to the next.
18
4.4 Data Analysis at district level and higher The districts’ Assistant Statisticians mainly analyze HMIS data in order to calculate HMIS indicators for presentation in tables and graphs. When one district Assistant Statisticians was asked whether or not HMIS decision makers at higher organizational levels utilize the processed data for evidence based decision making the statistician was reluctant to conclude, but suggested that high-level budgets and plans are typically not informed by the HMIS analysis produced. Other programs such as EPI calculate indicators such as coverage, wastage rate and dropout rates, and this was part of the data/information on the program reporting form. The existence of these data elements on the forms made it possible for the program coordinators to assess the performance of the programs by comparing the calculated indicators to national and international (WHO) program targets.
Some program coordinators produced tables and graphs of the data for instance showing disease prevalence and trends, timeliness and completeness. Some of the programs produced graphs and tables as part of quarterly or annual reports they were required to produce and submit to the national level. Additionally, the graphical and tabular analysis of data by some coordinators also seemed to be stimulated when there was need to make presentations and produce reports on the program performance for meetings, workshops or sometimes training sessions. Thus if there was none of these activities going on, it was not likely that there would be such data analysis where graphs are produced. For instance one coordinator explained:

19
“I prepare graphs, for instance I am currently preparing graphs to present at the DIP/HMIS review meeting to be held this month.”
When asked if he prepared any graphs for his own use, he replied:
“Yes, I also prepare graphs for my own use but I haven’t done that in a long time because I haven’t had stationary (paper).”
Another coordinator also explained:
“I don’t produce graphs; it is the statistician who produces graphs… The graphs are mostly used for HMIS review meetings….”
When asked about the national level meetings, the coordinator explained:
“The graphs are used during national level meetings where the data for all districts is reviewed…. I ask the statistician to produce graphs for me for the meeting… I give him my program data to use for making the graphs.”
Furthermore, many coordinators considered that they analyzed the data by merely looking at the data on the reporting forms and based on previous knowledge about that facility this provides a view of the performance of the facilities in that program. This can be seen in one coordinator description of a certain facility:
“[Facility Name] is the worst performing facility and I know this because when the reports come from this facility, the figures fluctuate a lot so it seems they are just guessing the figures, and they usually report late.”
4.5 Data Sharing and Information Use in General Unfortunately, evidence – based decision making is not perceived as a winning strategy by many potential HMIS stakeholders in Whotopia. There are few, if any, organizational or personal incentives that motivate widespread sharing and use of information. The lack of a strong information culture applies to data producers (i.e., health staff) as well as donors, health-care professionals, managers, statisticians, planners and policymakers. In general managers at higher levels tend to demand access to processed data from statisticians once they are approached by politicians, media and external consultants rather than on a regular basis. In addition, the use of graphs and maps to disseminate information on health is not adequate in the sense that few facilities use them; and where used, they are rarely up to date and hardly well understood. This in turn is related to existing human skill and capacity shortages and a general lackluster attitude towards information use in some health facilities.
The national Health Management Information System unit is supposed to produce and disseminate regular bulletins from routine sources as a form of feedback down to districts in the Ministry of Health hierarchy. This mechanism was working well a few years ago, when an external donor was involved in funding the bulletin development process and distribution.
20
However, as the donor project funding was discontinued, so also was the bulletin development and distribution routine.
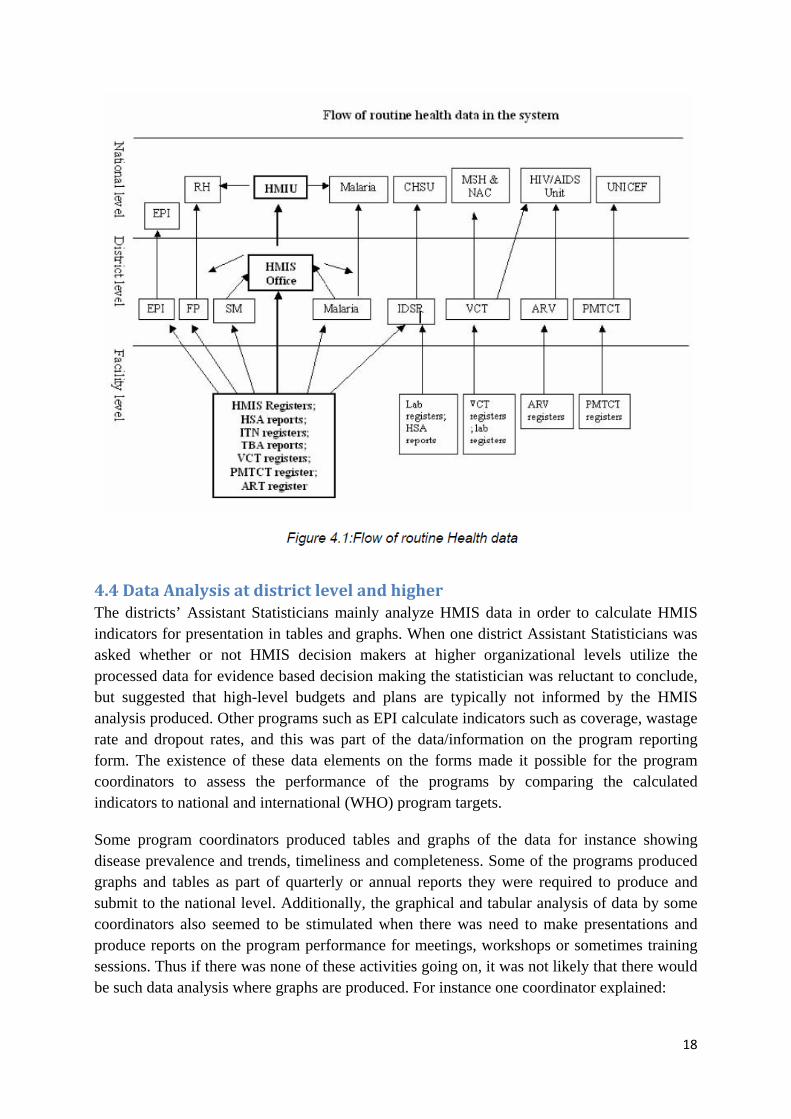
A recent HMIS data use assessment (Table 4.4) shows that health information is used to some extent to describe health problems and or challenges at different organizational levels. However, health information is not consistently used in planning frameworks and resource allocation processes. Further, the assessment suggests that managers and care providers at health facilities are adequately using health information for health service delivery management. However, information utilization is limited at district, zonal and national level. The assessment is inconclusive as to why districts are not using the health information for health service delivery, management, continuous monitoring and periodic evaluation.
Table 4.4 Overall assessment of HMIS Information Use in Whotopia
5 Program Coordination: Supportive Supervision and Meetings
5.1 Program Supervision As one of the areas of supervision is on data management, the compiled monthly data at the facility is referred to by most coordinators during supervision either to supervise data collection at the facility, or to verify and investigate further on data reported or to assess the performance of the facility in that program. The reports guide the coordinators in identifying problematic areas and these are further investigated during supervision. One coordinator explained that:
“By looking at the reports, I can see which facilities are having problems in terms of submitting on time and filling the reports (i.e. have gaps) and so I take note of these facilities and when I go for supervision I investigate the reason for this.”

21
Another coordinator also explained that during supervision, she concentrates mostly on areas where she identified problems because the time is limited and does not allow for thorough supervision to cover all important areas. Supportive feedback to most health facilities is irregular or non-existent in Whotopia. The general lack of feedback appears to have a negative impact on data collectors understanding of the HMIS data collection tools and data quality issues. In general data quality is currently not a key concern with many of the health staff tasked with colleting and reporting health data in Whotopia.
5.2 Review Meetings Some programs, such as IDSR and VCT, are required to hold quarterly district level meetings. For the IDSR, they conduct disease surveillance meetings and usually, the focus is on a few selected diseases which they monitor. The participants include district health management, other related-program coordinators, facility staff and stakeholders. For the VCT meetings participants are counsellors working in the facilities district wide.
There are several types of meetings that the program coordinators attend such as program specific regional or national level meetings and DIP and HMIS review meetings. There are quarterly and annual DIP review meetings and HMIS review meetings. The DIP and HMIS review meetings are organized by the Assistant Statistician who is also assigned the duties as DIP coordinator. The program coordinators are part of the attendants but also the DHMT members, facility in-charges and other relevant stakeholders. These meetings are supposed to happen on a routine basis i.e. either quarterly and annually but their actual implementation significantly depends on availability of financial resources. The last few years these meetings have been close to non-existent due to lack of fund for reimbursement of travelling.
5.3 Ordering and Distribution of Drugs and Medical Supplies In general, the pharmacy at the district hospital is responsible for ordering supplies drugs and medical supplies for the hospital and the health facilities. The facilities submit reports monthly to the pharmacy with data on the stock on hand and quantity used in that month. The pharmacy uses this data to estimate the required quantity to be ordered from the Central Medical Stores for the whole district. The Medical Stores distributes the supplies directly to the facilities and the pharmacy receives supplies for the district hospital, for health facilities and some private facilities.
Most of the coordinators are only responsible for ordering supplies from the pharmacy for use at the district hospital or for distributing to health facilities that have ran out of stock. However, for some programs particularly EPI and PMTCT, the coordinators order supplies from the regional office monthly and from UNICEF quarterly respectively and later distribute these supplies to the health centers. For EPI, calculation of the amounts required is based on the estimated annual target population figure from the National Statistical Office. The amount distributed to the facilities is based on the facility catchment population figure that is provided by the facility and this is from head counts in the catchment area. For PMTCT, the required amount of supplies is calculated from the program data collected and reported by the facilities; therefore, the program data is used for ordering and distributing supplies.
22
Additionally, for the IDSR program, their data is used to estimate required resources in case of an outbreak especially cholera outbreak. For instance, the previous year’s cholera attack rate is used to estimate the supplies required for preparedness of cholera outbreaks. The required supplies may be included in the district’s budgetary plan (i.e. the DIP) or may be sourced from stakeholders such as the ministry or other stakeholders (such as the District Assembly and NGOs).
5.4 Other non-program coordinator duties The health officials working as program coordinators performing the above-mentioned duties are primarily clinicians, midwives, nurses, and environmental health officers and therefore some are also involved in providing services i.e. actual interaction with patients and clients at the district hospital. Some of these services are directly related to their program while others are outside the programs they are in charge of. This affects how they perform their program-coordinator duties, particularly, with the severe shortage of staff in the public health sector, the available personnel is required to see a large number of clients. Thus for the program coordinators who also provide services, this essentially means that there is less time for performing other managerial work. One task that suffers from this situation is health facility supervision. Supervision of health facilities is not done as regularly as they are supposed to because coordinators are busy with other duties such as seeing clients at the hospital.
6 District Health Management Team (DHMT) The DHMT comprises of the District Health Officer (DHO), District Nursing Officer (DNO), District Environmental Health Officer (DEHO), Administrator and the Accountant. The District Health Officer is the head of the team and is in charge of all health related activities in the whole district, the District Nursing Officer is responsible for activities in the area of nursing district wide and the District Environmental Health Officer is responsible for all preventive health care activities in the district. Thus, their duties include supervision, mobilizing and allocating resources (including human resource), organizing service delivery, monitoring disease control, attending meetings, and producing reports for national level. Additionally, the DHO and DNO perform health care provision to patients and clients.
Planning and allocation of resource is mostly done during meetings such as the DIP meeting and monthly DHMT financial meetings where they decide which activities to implement for the month based on the DIP and the funding provided. As indicated earlier, the DHMT members are also required to attend meetings at national level. For some of these meetings they are required to present performance of the district in a particular area of focus and hence they require health data. Additionally, the members are also required at times to produce reports to submit to the national level, which also require health data. In these cases, the data is obtained from the HMIS Assistant Statistician. However, at times, the statistician may not have the particular data/information they require and so the data may be obtained from the specific program coordinator if possible.
Other data is sometimes obtained on demand from other systems that are currently not interoperable such as the Pension Payroll and Personnel Information System (PPPIS) which

23
contains basic human resource data, the Integrated Financial Management Information System (IFMIS) for financial information, and the Logistic Management Information System (LMIS) for information on drugs and medical supply distribution to pharmacies. The Ministry of Health has established an integrated and comprehensive LMIS. This system provides necessary information on drugs, vaccines, contraceptives and other commodities, supplies and their use. However, there are essentially no correlation checks between HMIS service records and pharmacy records. Therefore it is difficult to link actual cases with drugs dispensed. Specific surveys have however shown that large discrepancies between commodity distribution and actual consumption and utilization have led to critical stock outs in some facilities while there is over stocking and wastage in other facilities. In general different systems such as PPPIS, IFMIS, LMIS and HMIS use different data standards and database identifier codes/keys. No standardized framework for data exchange exists between the different system databases.
7 Emerging mHealth and eHealth Initiatives in Whotopia HMIS Even among HSAs, access to mobile phones is not uncommon in Whotopia these days, although actual phone ownership is low. Whotopia has witnessed a proliferation of mobile phone centered health initiatives over the last five years. The most frequently mentioned challenges related to mobile phones included inconsistent network access, cost of air time, and lack of electricity to recharge phones.
Non-Governmental Organizations (NGOs) working in the health sector initiate pilot studies at community and health facility levels. Most of the initiatives are in the areas of patient monitoring & management and data collection and reporting tools. The Ministry of Health faces the challenges of coordinating and facilitating collaboration between these efforts, as it lacks comprehensive knowledge about which stakeholders are implementing mobile solutions for what purpose and where. Some of the more recent pilot initiatives embarked on by donors consists of electronic patient management information systems at specific health facilities and for specific programs. However, it is unclear to what extent it is feasible to scale up such costly patient centered solutions to cover whole zones or Whotopia as a whole.
Currently there is no joint contact point and a no standard term agreement with mobile operators on pricing, billing and mobile service coverage; priority areas for mHealth research and collaboration are not defined and sharing of information, resources and technology maintenance between various stakeholders and projects are lacking. In many ways the new mobile health initiatives initiated by donors threaten to increase the number of vertical parallel reporting streams and reinforce the current fragmentation in the health information systems in Whotopia. This could potentially put additional reporting pressure on already overburdened health workers.
There is no comprehensive mHealth, eHealth or ICT strategy or policy for the health sector either related to aggregate data or individual health records/patient data. Similarly a clear legal framework concerning digital storage and accessibility to any type of health data is lacking in Whotopia.