Embed Size (px)
Citation preview

Whole
Genome
Sequencing:
Regulatory Applications
March 31, 2020

2
Brought To
You By:

3
Webinar Logistics
• Everyone is muted• Questions will be addressed during the Q&A session
at the end of the presentation• The presentation is being recorded• The recording/slides will be distributed following the
presentation• Adjourn (60 minutes)• There will be 3 important survey questions at the
conclusion of this webinar. Your response is appreciated

4
Speaker
Dr. Eric Brown

5
Eric W. Brown, Ph.D., M.Sc., FAAM
Director, Division of MicrobiologyOffice of Regulatory Science , Center for Food Safety and Applied Nutrition
US Food and Drug Administration, Washington, DC
“The Promise of Whole Genome Sequencing and The
Continued Advancement of Food Microbiology Deeper
into the 21st Century”
March 31, 2020

6

7

8

9
Yes….but Salmonella, E. coli, and Listeria are all still alive and well on Earth.
A simple and profound vision statement?

10
“Whole Genome Sequencing Is The Biggest Thing To
Happen To Food Microbiology Since
Pasteur Showed Us How To Culture Pathogens…”Dr. Jorgen Schlundt
Exec Director and Founder
The Global Microbial Identifier

11
THE EVOLUTION OF SUBTYPING TOOLS FOR
BACTERIAL PATHOGENS
STAR-GAZING
LIGHT-
TELESCOPE
MODERN
REFRACTION
TELESCOPE
RADIO
TELESCOPE HUBBLE
PATHOGEN
PLATING
BIOTYPING
SPECIATION
SEROTYPING
PFGE WGS
time
12
Some perspective on the US food supply
• Tracking and Tracing of food pathogens
• Over 200,000 registered food facilities
–81,574 Domestic and 115,753 Foreign
• More than 300 ports of entry
• More than 130,000 importers and more than 11 million import lines/yr
• In the US there are more than 2 million farms

13
Finished Product Processing Facility Farm
Ecologic ReservoirsImport LinesGlobal Point Source
Tracking contamination down and FAST!
SAVES LIVES

14
Identifying an Outbreak Vehicle: Lines of Evidence
Three types of evidence used:
– Epidemiologic: association between illness and food exposure
– Traceback: suspected food item links back to a common source of contamination
– Microbiologic/laboratory:pathogen found in the food, farm or facility
www.fda.gov

15
0
5
10
15
20
25
30
35
40
4 8 12 16 20 24 28 32 36 40 44 48 52 56 60 64 68
Representative* Timeline forConventional Approach to Foodborne Illness Investigation
Contaminated food
enters commerce
Source of contamination
identified too late to
prevent most illnesses
CDC
FDA/FSIS
Nu
mb
er
of
Cas
es
Days
*Data is for illustrational purposes and does not represent an actual outbreak
16
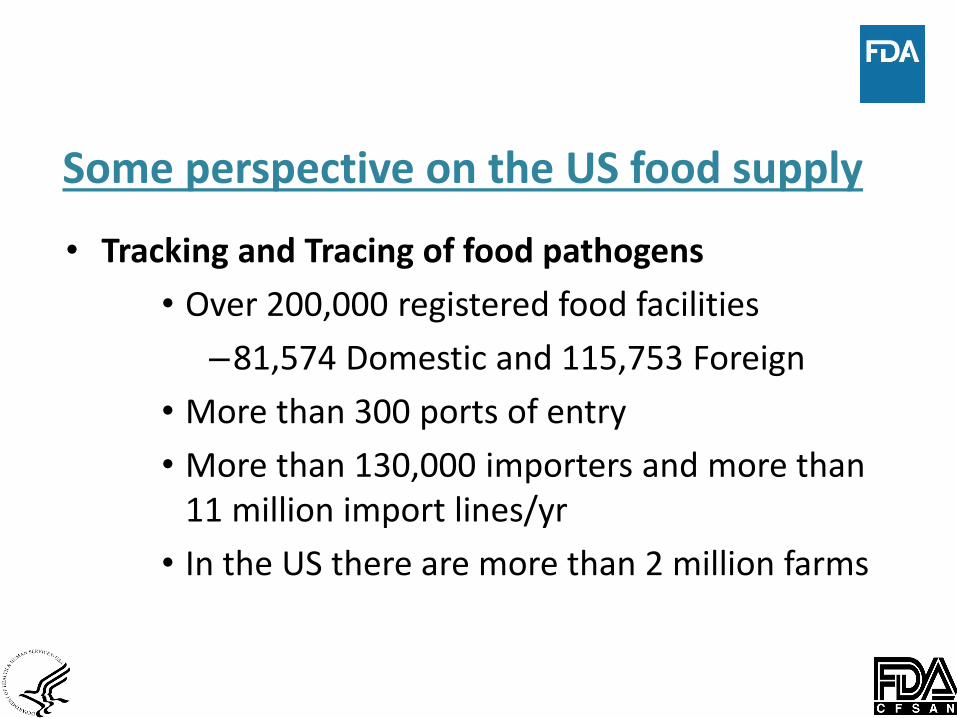
Outbreak Investigation Timelines
Epidemiology Investigation Regulatory Investigation
Questionnaires
Laboratory results
Patient interviews
Inspection
Sample collection
Laboratory results
Recall time
Regulatory Investigation
Traditional approach
Epidemiology Investigation
WGS added approach

17
WGS Surveillance Outcome
www.fda.gov
More outbreaks identified
Fewer Sick PeopleIn
crea
sed
use
of
WG
SIlln
ess Averted

18
The Complex and Global Etiology of Foods
Shrimp – India
Cilantro – Mexico
Romaine – Salinas, CA
Cheddar – Wisconsin
Carrots – Idaho
Gruyere – Switzerland
Pecans – Georgia
Sprouts – Chicago
Red Cabbage - NY
Shrimp – Indonesia
Imitation Crab – Alaska
Tuna Scrape – India
Fish Roe – Seychelles
Salmon – Puget Sound
Soy Sauce – China
Rice – Thailand
Seaweed Wrap – CA
Avocado – Mexico
Cucumber – Maryland
Wasabi – Japan
Pepper – Vietnam
Watermelon – Delaware
Blackberries – Guatemala
Blueberries – New Jersey
Pineapple – Guam
Grapes – California
Kiwi – New Zealand
Apples – New York
Pears – Oregon
Cantaloupe – Costa Rica
Honeydew – Arizona
Papaya – Mexico
Banana – Costa Rica
Salad Sushi Fruit platter

19
2009
Don’t eat the salamae
Rejected by Science
2010
FOODBORNE OUTBREAK INVESTIGATION:
WGS analysis of foodborne salmonellae case study
This investigation focused on
Salmonella Montevideo samples
associated with red and black pepper
used in the production of Italian-style
spiced meats in a New England
processing facility. This manufacturer
was implicated in a major salmonellosis
outbreak that affected more than 272
people in 44 states and the District of
Columbia.
15-20x shot gun sequencing
35 pure culture isolates
from patients, foods and
Environmental samples.
Concatenate 40 variable genes for
Phylogenetic analysis

20
PFGE-SpeI
JIXS18.0001
PFGE-BlnI
JIXA26.0012
PFGE-XbaI
JIXX01.0011
During the S. Montevideo outbreak, all isolates
were indistinguishable by 1st, 2nd, and 3rd enzyme
PFGE.

21

22
Environmental sampling combined with WGS can help point to root cause of the contamination

23
“It’s the seagulls!”
Everyone likes to blame the seagulls.

24
The VES
The DelMarVa:~170 miles long~<12 miles wide at its most narrow point
~5,454 sq miles~pop. 685,000~plant/animal ag; comm. fishing; tourism beaches
~colonized 1631 by DutchWest India Co.

25
Environmental surveys

It’s really is the water!

27
WA
OR
CA
MT
ID
NV
AZ
UT
WY
CO
NM
TX
OK
KS
NE
SD
ND
MN
IA
MO
AR
LA
MSAL
GA*
FL
SC*TN
NC
IL
WIMI
OH*
IN
KY
WV VA
PA
NY
ME
VTNH
NJ*DE
MD*
Washington D.C.
MA
CT
RI
AK
HI
Environmental/Surface water sampling
(*) Scan of the state in agricultural areas
-5 sites per state, 4 samplings over 1 summer
-Wadeable streams
Some studies were multiple years longitudinal
efforts to the same sites at regular intervals

28
Why Develop a WGS based Network?
• Tracking and Tracing of food pathogens• Insufficient resolution of current tools
-matching clinical to environmental
• Faster identification of the food involved in the outbreak
• Limited number of investigators vs. facilities and import lines
• Global travel
• Global food supply

29

30

31
GenomeTrakr• First distributed sequencing based network
• State and Federal laboratory network collecting and sharing genomic data from foodborne pathogens
• Partner with NIH/NCBI for storage and serving data
• Partner with CDC for human real-time surveillance
• Partner with FSIS/USDA to better cover the food supply
• Partner with the food industry to expand use to industry
• Partner with international organizations to expand use worldwide
• Open-access genomic reference database

Resource costs in a WGS lab network
Labs to generate
WGS data
Sequence storage,
data provider & analysis
Network administration
and management

33
Clinical
Samples
Food and
Environmental
Samples
Maximum
WGS Benefit
Importance of a Balanced Approach

34
December 31, 2019 GenomeTrakr Numbers
Species Total Isolates
Salmonella enterica 249,281
E.coli and Shigella 95,045
Campylobacter jejuni 47,371
Listeria monocytogenes 30,525
Vibrio parahaemolyticus 2,861
Cronobacter 713
Vibrio vulnificus 384
Clostridium botulinum 303
Clostridium perfringens 250
Total 426,733

35
Role of WGS in investigations
Pointing to potential sources of contamination
Defining scope of contamination and illness
Effectiveness of cleaning and sanitization
Providing a piece of the information used in
regulatory action
Root cause

How do we use the GenomeTrakr information?Example of Listeria in sprouts using a phylogenetic
perspective.
WGS and Phylogeny identifies novel linkages
for outbreak detection and infectious control.
>36,000 clusters
examined daily
For clusters of <50
SNPs

Post inspection determines root cause of contamination event.

38
Interpreting WGS in the regulatory env.
Manuscript: Pightling et al. 2018. Frontiers in microbiology.

39Manuscript: Pightling et al. 2018. Frontiers in microbiology.
Interpreting WGS in the regulatory env.
Listeria monocytogenes isolates collected from a food
processing facility during a single inspection
Escherichia coli isolates implicated in a 2016 flour outbreak
Salmonella enterica isolates collected from a food processing
facility and closely related clinical isolates

40
Field 1
Field 2
Processing facility
Scenario 1 (pass through)

41
Field 1
Field 2
Processing facility
Scenario 2: Resident
Contamination

42
Facility Match Probability P(F|D<=d)
SNP Distance
Pro
babili
ty
SNP
cutoffSal. Lis.
0 0.82 0.94
5 0.78 0.89
10 0.72 0.86
15 0.68 0.79
20 0.65 0.70
Yu Wang, James B. Pettengill, Arthur Pightling, Ruth Timme, Marc Allard,
Errol Strain, and Hugh Rand (2018) Genetic Diversity of Salmonella and
Listeria Isolates from Food Facilities. Journal of Food Protection: December
2018, Vol. 81, No. 12, pp. 2082-2089.
Predictive Power of WGS

43
From inspections we have combined facility and
genomic information from 5,321 Listeria and 6,351
Salmonella isolates collected by the FDA to
characterize common origin P between those isolates.
As we predicted, if two isolates are from different
facilities, the probability that they are genetically close
is rather low [P(D < 20) = 0.00016 for Salmonella and
0.00042 for Listeria].
Predictive Power of WGS

44
“Bypassing a Food Vehicle
Altogether”
“Linking up halfway across the
world”
S. Braenderup in nut butter (2014):
S. Tennessee in peanut butter paste (2007/2009) & S. Agona in dry cereal
(1998-2008): “Probing back in time”
S. Enteritidis in shell eggs (2010): “Sourcing down to the
farm”
S. Montevideo in salami (2009): “Sorting through the
ingredients”
“A COMPASS THAT POINTS TRUE NORTH and a TELESCOPE FOR THE DEEPEST OF SPACE”
S. Bareilly in tuna (2012):

45
“The right tool for the right job”
“The right key to open the lock”
Applications of WGS in the Food
Safety Environment
Delimiting scope and traceback of food contamination events (Track-N-
Trace)
Quality control for FDA testing and surveillance (Confidence in Regulatory
Actions)
Preventive control monitoring for compliance standards (the “repeated
event” project)
…

46
SeqSero
Salmonella Serotyping by Whole Genome Sequencing
•Reads (paired-end & interleaved)
•Reads (paired-end)
•Reads (single-end)
•Genome Assembly
*The following formats are supported for raw reads input: .fastq.gz(preferred), .fastq and .sra.
Please select your input file:
*The following formats are supported for raw reads
input: .fastq.gz(preferred), .fastq and .sra.
Please select the first reads file:
Please select the second reads file:
*The following formats are supported for raw reads input: .fastq.gz(preferred), .fastq and .sra.
Please select your input file:
*The FASTA format is supported for genome assembly input.
Please select your input file:
Salmonella Serotyping

47

48
49
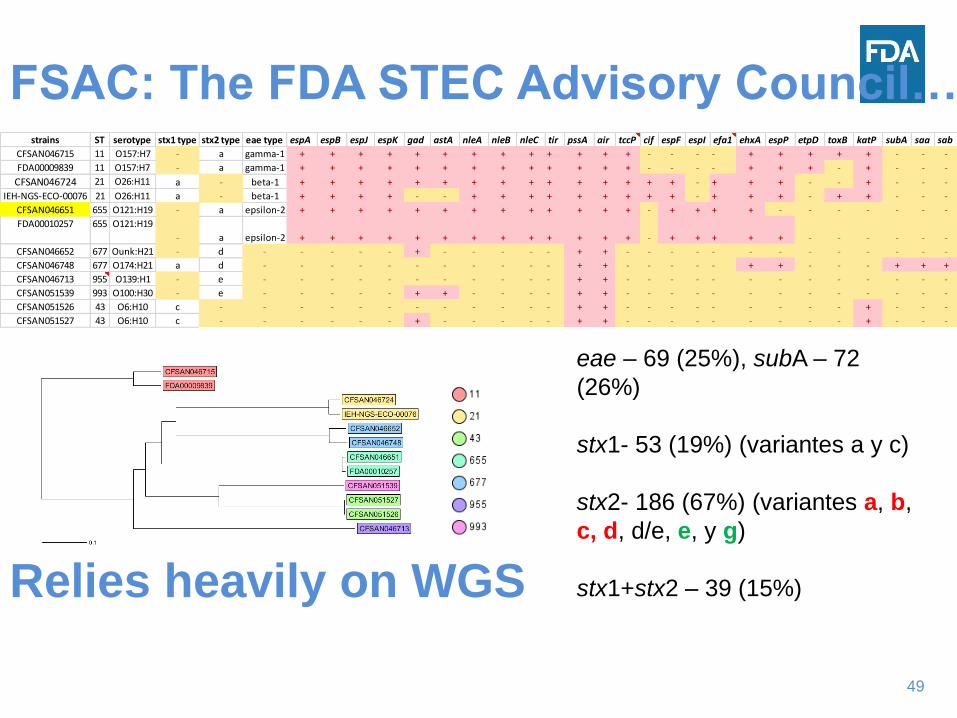
strains ST serotype stx1 type stx2 type eae type espA espB espJ espK gad astA nleA nleB nleC tir pssA air tccP cif espF espI efa1 ehxA espP etpD toxB katP subA saa sab
CFSAN046715 11 O157:H7 - a gamma-1 + + + + + + + + + + + + + - - - - + + + + + - - -
FDA00009839 11 O157:H7 - a gamma-1 + + + + + + + + + + + + + - - - - + + + - + - - -
CFSAN046724 21 O26:H11 a - beta-1 + + + + + + + + + + + + + + + - + + + - - + - - -
IEH-NGS-ECO-00076 21 O26:H11 a - beta-1 + + + + - - + + + + + + + + + - + + + - + + - - -
CFSAN046651 655 O121:H19 - a epsilon-2 + + + + + + + + + + + + + - + + + + - - - - - - -
FDA00010257 655 O121:H19
- a epsilon-2 + + + + + + + + + + + + + - + + + + + - - - - - -
CFSAN046652 677 Ounk:H21 - d - - - - - + - - - - - + + - - - - - - - - - - - - -
CFSAN046748 677 O174:H21 a d - - - - - - - - - - - + + - - - - - + + - - - + + +
CFSAN046713 955 O139:H1 - e - - - - - - - - - - - + + - - - - - - - - - - - - -
CFSAN051539 993 O100:H30 - e - - - - - + + - - - - + + - - - - - - - - - - - - -
CFSAN051526 43 O6:H10 c - - - - - - - - - - - - + + - - - - - - - - - + - - -
CFSAN051527 43 O6:H10 c - - - - - - + - - - - - + + - - - - - - - - - + - - -
eae – 69 (25%), subA – 72
(26%)
stx1- 53 (19%) (variantes a y c)
stx2- 186 (67%) (variantes a, b,
c, d, d/e, e, y g)
stx1+stx2 – 39 (15%)
FSAC: The FDA STEC Advisory Council…
Relies heavily on WGS

Leveraging GenomeTrakr &
NCBI Pathogen Detection
WGS Data to Enhance
• Risk Assessment
• Attribution
• Large-scale
Epidemiology studies
GEN ME
GRAPH R
Lesson: You can predict more
using structured metadata ontologies
for risk assessment.
GenomeGraphR: WGS data integration, analysis,
and visualization for risk assessment and management:
https://fda-riskmodels.foodrisk.org/genomegraphr/
Moez Sanaa, Régis Pouillot, Francisco J Garces-Vega, Errol Strain, Jane M
Van Doren doi: https://doi.org/10.1101/495309 2018.

S. Bareilly CFSAN000189
new genomic island
arsenic resistance operon
about 40 kb
Salmonella Bareilly from Tuna

52
GOAL = <5 years have first 25 mapped
Salmonella Adaptations of particular interest to food safety specialists:
(1) Thermal tolerance
(2) Dessication resistance
(3) Osmotic/Ionic tolerance
(4) Quat resistance
(5) Chlorine resistance
(6) Biofilm persistence
(7) Surface adherence
(8) Antibiotic resistance
(9) Antimicrobial resistance
(10) Ecological fitness
(11) Heavy metal resistance
(12) Metabolic persistence
(13) Enhanced hydrophobic fitness
(14) Produce invasiveness
(15) Flower invasiveness
(16) Root system invasiveness
(17) Acid resistance
(18) Surface water fitness
(19) In vivo plant migratory fitness
(20) Soil fitness
(21) Capsaicin resistance
(22) Swarming
(23) Trans-ovarian poultry colonization
(24) Fecal persistence (poultry)
(25) Yolk content invasion
(26) Multidrug resistance
(27) External amoeba harborage
(28) Internal amoeba harborage
(29) Acyl-homoserine lactone (AHL)
(30) KatE stationary-phase catalase
(31) In vivo migratory fitness
(32) RDAR phenotype
(33) The ‘Weltevreden’ type
(34) Persistence within the tomato**

5353
Adaptation of lineage III Newport in tomato using
transcriptomic approach
0
20
40
60
80
100
120
140
160
180
200
Nu
mb
er o
f g
en
es
COG functions
C Energy production and conversion
D Cell cycle control and mitosis
E Amino Acid metabolis and transport
F Nucleotide metabolism and transport
G Carbohydrate metabolism and transport
H Coenzyme metabolis
I Lipid metabolism
J Tranlsation
K Transcription
L Replication and repair
M Cell wall/membrane/envelop biogenesis
N Cell motility
O Post-translational modification, protein
turnover, chaperone functions
P Inorganic ion transport and metabolism
Q Secondary Structure
T Signal Transduction
U Intracellular trafficing and secretion
Y Nuclear structure
R General Functional Prediction only
S Function Unknown

54
WGS at FDA:
Where We Started
WGS at FDA:
Where We Are Now
WGS at FDA:
Where We Are Headed
oMolecular Epidemiology
oEnhanced Traceability
oOutbreak Surveillance
oGenomeTrakr
oMicrobiological QA/QC
Antibiotic Resistance
Salmonella Serovar Calls
Metagenomics GAPs
EHEC/STEC Risk
Source-Tracking/Indexing
Quasi-Metagenomics
•Metagenomic CID
•Enhanced PCs/Adaptive
changes
•Attribution and Root
Cause
•MetagenomeTrakr
•Transcriptomics
WGS Evolution at FDA

55
Minor et al., 2015.
Risk Analysis. 35(6):1-15
Salmonella spp.
(nontyphoidal)
$5,483,959,000 41%
Campylobacter spp.
$2,963,541,000 22%
Listeria monocytogenes
$2,317,572,000 17%
E. coli O157:H7
$648823 5%

56
Canada United States
Incidence of illness 47,028 1,200,000
Costs to adopt WGS $158,340,000 $100,000,000
QUALY lost 469.75 16,782
Total Illness costs $287,770,000 $3,300,000,000
Total net benefit of adopting WGS $90,250,000 $1,000,000,000
Economic IMPACT on Foodborne Salmonella When Using
WGS
*Model assumes 70% reduction in numbers of illnesses due to WGS implementation.; Benefits gained due to earlier detection
and decreased time to recall food items.; United States estimates are adjusted based on increase population size.; Additional
analysis is needed to adjust to US illnesses and US health care costs. Based on Jain et al., 2019 An economic analysis of
salmonella detection in fresh produce, poultry, and eggs using whole genome sequencing technology in Canada. Food Res. Int.
116: 802-809.

57

58
FDA circa 1906 –FOOD SAFETY
PRESENTATION POINTS
Various desktop NGS platforms now exist andare dropping precipitously in price – and per reaction cost making the technology largely accessible for public health applications.
WGS has already become an integral part of the science of food safety, both for morecomprehensive characterization and testing of foods and for providing insight aboutthe scope and sources of outbreaks and other food contamination events. Development of international open source databases will empower WGS for sentinel surveillance work on a global scale.
WGS, as part of a laboratory next-generation analysis pipeline, can augmentfood safety investigations, particularly in cases where strain homogeneity is aproblem, by (i) delimiting the scope of a contamination event; (ii) affirming a cluster from common background genotypes; and (iii) source-tracking by comparative genomics of food and environmental isolates of Salmonella. Recall, sequences are agnostic.

59
Acknowledgements
• FDA
• Center for Food Safety and Applied Nutrition
• Center for Veterinary Medicine
• Office of Regulatory Affairs
• National Institutes of Health
• National Center for Biotechnology Information
• State Health and University Labs
• Alaska
• Arizona
• California
• Florida
• Hawaii
• Maryland
• Minnesota
• New Mexico
• New York
• South Dakota
• Texas
• Virginia
• Washington
• USDA/FSIS
• Eastern Laboratory
• CDC
• Enteric Diseases Laboratory
• INEI-ANLIS “Carolos Malbran Institute,”
Argentina
• Centre for Food Safety, University College
Dublin, Ireland
• Food Environmental Research Agency,
UK
• Public Health England, UK
• WHO
• Illumina
• Pac Bio
• CLC Bio
• Other independent collaborators
FDA circa 1906 –FOOD SAFETY

60
Q & A

61
If your question wasn’t
answered…
Please contact Scott Nichols at [email protected] or one of the trade organization representatives and we would be
happy to respond.
Thank you.

62
Brought To
You By:

Whole
Genome
Sequencing:
Regulatory Applications
March 31, 2020