Embed Size (px)
Citation preview

WHO BRIBES?
Evidence from the United Nations’ Oil-for-Food Program
Yujin Jeong*
HEC Montréal
Department of International Business
3000, chemin de la Côte-Sainte-Catherine
Montréal, Québec H3T 2A7
Tel.: +1 514 340 5626
Fax.: +1 514 340 6987
E-mail: [email protected]
Robert J. Weiner
George Washington University
School of Business
Department of International Business
2201 G Street NW, Suite 401
Washington, DC 20052
Tel: + 1 202 994 5981
Fax: + 1 202 994 7422
E-mail: [email protected]
PLEASE DO NOT CITE WITHOUT AUTHORS‘ PERMISSION
*Corresponding author
Keywords: supply side of corruption; bribery; rent; ownership structure; international trade; UN
Oil-for-Food-Program
ACKNOWLEDGEMENTS
This paper is based on the first author‘s dissertation chapter, and benefited from helpful
comments by Meghana Ayyagari, Alvaro Cuervo-Cazurra, Joseph Gastwirth, Witold Henisz,
Sok-Hyon Kang, Fred Lindahl, Anu Phene, Susan Rose-Ackerman, Robert Savickas, Jordan
Siegel, Tina Søreide, Jennifer Spencer, Stephen Tallman, Paul Vaaler, and participants at the
Yale Law School Anti-corruption Policy Workshop, London Business School Trans-Atlantic
Doctoral Conference, Academy of International Business (AIB) Doctoral Consortium, AIB/JIBS
Emerging Research Frontiers Conference and the American Economic Association, Canadian
Economics Association, and AIB Meetings, and seminar participants at the GW International
Business Department, the GW Institute for Middle East Studies, and HEC Montréal. The GW
Center for International Business Education and Research supported this project. Opinions as
well as any errors are solely our responsibility.

1
Abstract
How do managers react in an environment where bribery is likely to bring high rewards, but also
presents high risks? Most corruption research examines the demand side (officials‘ requests for
bribes) in a domestic setting. In contrast, we examine the supply side (firms‘ illicit payments),
asking who bribes and who does not, in a global setting – the United Nations‘ (UN) Oil-for-Food
Program, part of UN sanctions on Iraq. Some companies helped Iraq circumvent UN sanctions
through bribe payments in the form of illicit surcharges. Using unique transaction-level data
uncovered and published through an independent investigation, we examine factors affecting
managerial decisions on bribe payments in order to understand why some firms pay bribes, while
others do not. Our analysis draws on the economic theory of crime, agency theory, and
influences of home-country institutions. Results suggest that firms pay larger bribes when there
are stronger financial and managerial incentives. Implementation of the OECD Anti-Bribery
Convention at home negatively affects firms‘ illicit behavior abroad, decreasing the likelihood of
firms‘ engaging in foreign bribery. Moreover, we find little relationship between a widely-used
country-level corruption perception index and actual bribery by firms.

2
INTRODUCTION
Globalization and the rise of international trade and investment have been associated with a
―corruption eruption,‖ as firms encounter widespread bribery in many countries (Beets, 2005). A
combination of growing policy concern, increased availability of data at the country level, and
broader interest in ethical dimensions of management has generated a substantial scholarly
literature on corruption in recent years.
Little is known, however, about managerial behavior in the face of requests for bribes in
international business. In some countries, declining such requests can lead to loss of current and
future business (Spencer and Gomez, forthcoming), especially as international commerce often
entails competition with foreign firms, and many home countries do not outlaw bribery abroad.
How do firms react in an environment of ‗pay to play,‘ where bribery is likely to bring high
rewards, but also presents high risks?
The central contribution of this paper is examination of the supply-side of corruption (i.e.,
firms as bribe-payers) in a global setting, where companies from many home countries are
confronted with bribe requests from a host government. Why do some firms engage in cross-
border bribery, while others do not? We construct a framework for examining the supply side of
corruption, focusing on explaining variability in managerial behavior. Our framework is based
on the economic theory of crime (Becker, 1968), agency theory (Jensen and Meckling, 1976),
and influences of home-country institutions.
Examination of firms‘ strategic response to bribe requests requires data that go beyond
widely-used country-level corruption indices. Secrecy and ethical considerations make such data
largely unavailable, however, hindering empirical research. We use the United Nations (UN)‘

3
Oil-for-Food Program (OFFP) as a natural laboratory providing an unusual opportunity to lift the
veil of secrecy regarding managerial corrupt behavior.
Under the OFFP, the UN imposed sanctions on Iraq, in part in order to deprive the Iraqi
government of funds. Iraqi officials evaded UN sanctions by requesting ‗illegal‘ surcharges1
from companies seeking oil-export contracts (Independent Inquiry Committee into the UN
OFFP, hereafter IIC, 2005a, 2005b; U.S. Senate, 2005). Circumvention of UN sanctions through
the ―Saddam Bribery System‖ of oil allocations (U.S. Senate, 2005: 2, 32) was widespread, and
later became the subject of official inquests, which produced detailed investigative reports (IIC
2005a, 2005b; U.S. Senate, 2005). These reports provide specific and comprehensive
information on bribe requests and payments unlike any in the literature.
Our approach to understanding why firms pay bribes contributes to corruption research in
several ways. First, as noted above, we shed light on the supply side of corruption (bribe payers)
in a global setting, where companies from many home countries competed for export contracts in
one host country, Iraq. Research on corruption is primarily domestic, based on perceptions, not
actions, and focuses on the demand side (bribe takers), resulting in limited treatment of the
suppliers‘ perspective (Martin et al., 2007). Literature on cross-border corruption is also sparse
and focuses on effects of public-sector corruption on foreign direct investment (FDI).2
1 For illegality of surcharges, see Appendix and U.S. Senate (2005: 33) which documents that
―these under-the-table surcharge payments were in direct violation of U.N. sanctions and the Oil
for Food Program because they were not deposited into the U.N.-controlled escrow account…‖ 2 Aidt (2003), Svensson (2005), Lambsdorff (2006), Seldadyo and de Haan (2006), and Triesman
(2007) and provide surveys of the corruption literature. Studies of corruption‘s effects on FDI
include Rodriguez et al. (2005), Uhlenbruck et al. (2006), and Weitzel and Berns (2006).
Robertson and Watson (2004) and Kwok and Tadesse (2006) examine reverse causality, looking
at the effect of inward FDI on host-country corruption.

4
Second, the surcharge payment data published as part of a $35 million official probe of the
OFFP (Associated Press, 2005) enable us to present ―objective and quantitative measures of
actual corruption‖ (Tanzi, 1998), in contrast to widely-used survey-based measures of corruption.
Using this data, we provide evidence on the relationship between perceived corruption and firms‘
corrupt behavior in practice. Studies of the influence on perceived corruption of cultural and
institutional factors are numerous (see Footnote 2), but few provide empirical evidence on the
relationship of perceived and actual corruption.
Lastly, recent years have witnessed increased interest in anti-corruption policies in the
international community. A major question of policy concern is the effectiveness of anti-
corruption laws. Do such laws make a difference in practice, or can managers easily circumvent
them? Evidence on this is scarce, not only because data on corrupt behavior are missing, but also
because cross-country comparisons require controlling for factors that are difficult to measure,
such as the extent and quality of legal enforcement. Our study of the underlying causes of
supply-side corruption seeks to provide insight into the effectiveness of the global community‘s
effort to reduce corruption.
Cross-country studies of the causes of corruption face several challenges. Survey data may
reflect varying definitions of corruption across countries. Use of OFFP data helps avoid biases
stemming from definitions of corruption that might vary by survey respondents‘ home countries,
as well as bias stemming from beneficiaries of corruption being less likely to report than victims.
Statistical analysis can conflate supply- and demand-side factors (Baugn et al., 2010; Sung,
2005); empirical results may thus reflect a mixture of factors that affect both public officials‘
decisions to seek bribes, and managers‘ decisions in paying them, making identification of
underlying influences challenging. Moreover, survey data based on perceptions or experience

5
may contain systematic biases related to a country‘s ability to address corruption. For example,
countries may be perceived as cleaner due to lack of detection or reporting of corruption, rather
than lack of corruption itself.
We are able to address these challenges here because the demand side (the Iraqi government)
was the same across contracts. Requests for bribes were standardized across exporting firms, and
centralized at the highest levels of government (IIC, 2005b). Such ‗grand corruption‘ (Rose-
Ackerman, 1999; Jain, 2001) involving a corrupt principal avoids agency problems on the
demand side. In contrast to ‗petty corruption‘ (which involves extortion by a corrupt agent, so
that bribe size depends on the soliciting bureaucrat and the paying firm; Svensson, 2003), bribery
decisions under OFFP did not depend on the specific collecting agent.3 The OFFP thus provides
a clean natural experiment, allowing us to attribute variation in illicit behavior to the supply side
– firms that exported oil from Iraq.
The remainder of the paper is organized as follows. The next section briefly describes the UN
OFFP. This is followed by our theory development and hypotheses. Empirical analysis is
outlined next. Results and findings are discussed in the following sections. The last section
concludes.
THE UNITED NATIONS OIL-FOR-FOOD PROGRAM4
The OFFP was the largest humanitarian relief program in UN history (IIC 2005a: Vol I, 1). The
United Nations Security Council (UNSC) imposed trade and financial sanctions on Iraq in
3 Corruption under OFFP is also ‗grand‘ measured by average bribe size – over $700,000.
Compare average bribes of roughly $8,300 in Svensson (2003) and $2,100 in Olken (2007), all
figures per transaction. 4 See Appendix for additional details. For further information, see IIC (2005a, 2005b) and the
official UN Program website (www.un.org/Depts/oip/index.html).

6
Resolution 661, four days after its invasion of Kuwait in 1990. A central aspect of UN sanctions
was an embargo on the export of oil, the basis of the Iraqi economy. In response to ensuing
hardship in Iraq, the UNSC authorized the OFFP in 1995 (Resolution 986; IIC 2005a: Vol I, 14),
which was implemented in 13 six-month phases during 1996-2003 (IIC, 2005a). Imports of
humanitarian goods (primarily food and medicine) were financed by exports of Iraqi oil, with all
payment going through the UN, in order both to help the Iraqi people and deprive the Iraqi
regime of funds.
Under the OFFP, ―Iraq was free to sell its oil so long as it was sold at what the UN decided
was a fair market price and the proceeds of each sale were deposited to a UN-controlled escrow
account to be used only for humanitarian and other purposes allowed by the UNSC‖ (IIC, 2005b:
2). In the first years of the program (which started in 1996), the Iraqi government priced its oil-
export contracts below market levels, and allocated oil to various groups, individuals, and
governments around the world sympathetic to its political positions, as well as to countries
holding seats on the UNSC (Heaton 2005; Hsieh and Moretti, 2006).
Starting in the second half of 2000, the Iraqi government exploited the OFFP to generate
income outside UN oversight through illicit surcharges on oil exports. In Fall 2000, Iraq
requested that the UN allow it to impose surcharges on oil exports. According to IIC (2005a: Vol
II, 135), ―Faced with [UN] rejection for payment of a surcharge from the program, Iraq resorted
to a covert surcharge policy.‖ When the trade press reported Iraq‘s imposition of surcharges in
contravention of UN sanctions, the UN sent a formal notice to buyers of Iraqi oil, informing
them that surcharges violated UN sanctions and ―buyers of Iraqi oil shall not pay any kind of
surcharge to Iraq‖ (IIC 2005a: Vol II, 137; See Appendix). The official investigation into OFFP

7
terms Iraqi income through surcharge payments ‗illicit‘ throughout its reports (IIC 2005a,
2005b).
During Fall 2000 - Fall 2002 (OFFP phases 8-12), Iraq collected a total of $229 million in
illicit surcharges from its oil buyers (IIC 2005a: Vol I, 85). Requests for surcharge payments
were fixed per barrel exported, and due 30 days after loading oil for export. Failure to pay
resulted in exclusion from further oil-export contracts with the Iraqi government, which kept
meticulous track of how much each company owed, and how much had been paid (IIC 2005b:
11-12, US Senate 2005: 9-10).5 The illicit surcharge was collected from 138 of the 169
companies on which it was levied. In addition to the 31 companies that did not pay surcharges,
90 companies paid less than the surcharge requested (IIC 2005a: Vol I, 87).6
An examination of the micro-data on a contract-by-contract basis reveals that 104 companies
did not pay surcharges on at least one contract during the bribe phase of the OFFP. The
consequences of not paying are not entirely clear in the data, in part due to the fact that the bribe
period started in the middle of phase 8 of the OFFP, and ended in the middle of phase 12, in
combination with the fact that contracts cannot be pinned down more precisely than their
phase. Of the 104 companies, 19 received contracts in a later phase of the bribe period, despite
the fact that they did not pay a bribe, 44 did not receive additional contracts during the bribe
period, and 41 could not be determined. For example, a company that did not pay in phase 10,
but received a contract in phase 12 could have received the contract during the bribe period (first
5 ―Unless a higher official had given a company dispensation, SOMO (the State Oil Ministry
Organization) prohibited a company from loading additional oil when surcharges were overdue‖
(IIC 2005b:11). 6The consequences of partial payment were unclear. Some companies continued to obtain
contracts despite their balance due, through a variety of promises, excuses, bad checks, etc., but
others did not. The various investigative reports in IIC (2005b) and US Senate (2005) provide
anecdotes.
8
part of phase 12), or afterward (last part of phase 12); we cannot tell which. The most that can be
said is that not paying a bribe made receipt of further contracts much less likely.
Official reports on the OFFP (IIC 2005a, 2005b; US Senate, 2005) provide facts in
voluminous detail, but scholarly research is limited. Two studies are relevant to our study
(Heaton, 2005; Hsieh and Moretti, 2006); neither, however, utilizes information on firm bribery.
THEORY DEVELOPMENT AND HYPOTHESES
“The underlying causes of corruption remain poorly understood and widely debated. Yet the
study of corruption beyond the realm of opinion surveys is still in its infancy, and there is little
firm evidence relating corruption to real-world causal factors.” (Fisman and Miguel, 2007:
1021)
Corruption is widely defined as the misuse of public authority for private gain. Theories of
corruption focus primarily on understanding the demand side – what factors are likely to raise or
lower public officials‘ likelihood of corrupt behavior (Shleifer and Vishny, 1993; Rose-
Ackerman, 1999; Lambsdorff, 2006)? In contrast, understanding of the supply side of bribery is
practically absent (Martin et al., 2007). We fill the gap by focusing on firms‘ responses to
requests for bribes and explaining why some engage in foreign bribery. Our discussion is built
upon the economic theory of crime (Becker, 1968), where criminal activity (bribery decisions
here) is analyzed as a function of expected returns. We advance the theory by introducing agency
and institutional considerations. Below, we discuss rent as the key motivator for firms‘ illicit
behavior, and ownership structure and home-country institutional environment as factors that
may mitigate or exacerbate managerial incentives to pay bribes.
Financial incentives: rent

9
The economic theory of crime (Becker 1968, Ehrlich 1996) assumes that decisions regarding
illegal activity are based on self-interest, driven by incentives facing decision-makers. The theory
predicts that managers maximize firms‘ profits, net of bribes, and decide whether to bribe based
on analysis of expected returns including the likelihood of detection and severity of punishment
(Rose-Ackerman, 1978; Ades and Di Tella, 1997).
A central component of the economics approach to bribery is short-term financial incentive,
referred to as ‗rent‘ in the corruption literature. The source of rent under OFFP is below-market
transactions through managers‘ access to corrupt officials (managers‘ meetings with Iraqi
officials are recounted in IIC, 2005b). Will firms pay bribes if enough rent is on the table,
notwithstanding the risk of detection and punishment? The incentive theory predicts that the
greater the rent, the greater the incentive for corruption, and hence the more will managers be
prone to corrupt behavior (Ades and Di Tella, 1999; Jain, 2001). This leads us to hypothesize
that bribe payments by managers will be positively related to economic rents at the contract
level. Thus,
Hypothesis 1: The higher the contract rent, the greater the bribe payment.
Despite its significance in the theory of economic incentives, the rent hypothesis suffers from
a conceptual shortcoming due to its focus on short-term financial incentives. The economic
theory of crime does not allow for choices between honest and corrupt behavior; it predicts that
all firms will offer bribes unless their costs are elevated through deterrence policies aimed at
increasing the likelihood of detection or penalties for illicit behavior. If rent is high enough, all
will bribe; if it is low enough, none will.

10
We extend the theory by considering factors that may result in variation in incentives facing
managers for illicit behavior. Our objective is to relax the theory‘s unrealistic prediction that
firms facing requests for bribes act identically. We focus on three dimensions of firm
heterogeneity that the literature suggests may affect strategy – (1) ownership structure (Jensen
and Meckling, 1976), (2) legal consequences (Rose-Ackerman, 1999), and (3) home-country
institutional environment (Kogut 1991, Murtha and Lenway 1994)
Firm ownership: agency considerations
The corporate governance literature suggests that managerial behavior is related to firm
ownership (Jensen and Meckling, 1976). Managers bear the risk and consequences of detection
and punishment, yet may not benefit from the outcome of bribery decisions, depending on their
ownership in the firm. In the corruption literature, agency problems are discussed primarily on
the demand side of bribery (e.g., agents hired by governments to collect taxes instead collect
bribes; Rose-Ackerman, 1978; Aidt, 2003). A few studies discuss relationships between firm
ownership and corrupt behavior, but do not examine how managerial incentives under different
ownership structures affect bribery decisions (Clarke and Xu, 2004; Wu, 2005a, 2009; Martin et
al., 2007).
Here, the rent the firm obtains on each contract benefits shareholders. It is managers who
make bribery decisions, however, and bear the consequences of bribery if caught (since
shareholders are not accountable for managers‘ unlawful behavior). Managers will thus have
greater incentive to bribe when they have more ownership stakes in the firm. In explaining
variability associated with managerial incentives to bribe, we focus on types of ownership

11
structures where managers have differing equity stakes: state-owned enterprises (SOEs),
privately-owned, publicly-listed, and partial-state/partial-public companies.
State ownership makes managers less prone to paying bribes. Managers of SOEs by
definition have no equity stake, and typically face weaker performance incentives than those in
the private sector (Megginson 2005; Clarke and Xu, 2004; Martin et al., 2007). Moreover, SOEs‘
connections with their home governments can shield them from corruption, making them likelier
to lobby rather than bribe (Bennedsen et al, 2009). In contrast, owner-managers of privately-held
firms have large ownership stakes in their firms, and thus have more to gain through bribes,7
while managers of publicly-listed companies typically have little ownership stake, and hence less
to gain from bribery than owner-managers of private firms.8
Our discussion on bribery and managerial incentives provides an interesting reversal of the
predictions of usual principal-agent theory for commonly-examined managerial misconduct, e.g.,
financial misreporting and stealing from stockholders. In these cases, if the behavior is detected,
owners face financial losses far exceeding penalties levied (Karpoff et al, 2008), and even
bankruptcy (e.g., Enron in the USA and Parmalat in Italy). Here detection may damage the
firm‘s reputation, but is unlikely to threaten the viability of a firm because bribes are on a
7 Privately-held firms also tend to be less connected to their government, and have weaker
bargaining power, which lead to more bribery (Lambsdorff and Cornelius, 2000; Clarke and Xu,
2004; Martin et al., 2007; Wu, 2009; Fan et al., 2009). Wu (2009) provides supporting evidence
that privately-held firms are more likely to pay bribes than other types of firms in Asia. 8 Public companies also tend to have greater reporting requirements and regulatory scrutiny than
privately-held firms. For example, the US Foreign Corrupt Practices Act, the first legislation to
criminalize cross-border bribery (see discussion below), included accounting requirements for
enforcement. These applied only to firms registered with the US Securities and Exchange
Commission; i.e., publicly-listed firms (Noonan 1984: 679).

12
contract basis. This implies that agency considerations here may result in managers‘ acting more
ethically than shareholders would prefer, not less.9
Also, some OFFP participating firms are partially state-owned and partially publicly-held.
We expect managers in these firms to face incentives intermediate between those of fully state-
owned enterprises and publicly-listed firms. To summarize the discussion, we expect bribe
payments by managers to vary with the degree of separation of ownership and control. Thus,
Hypothesis 2: Owner-managers in private firms will pay bribes the most, managers in
publicly-held firms next, managers in partially state-owned firms next, and managers in fully
state-owned firms the least.
Legal consequences
Legal systems are an important part of corruption detection and deterrence (Rose-Ackerman,
1999; Tanzi, 1998; Treisman, 2000; Kimbro, 2002; Herzfeld and Weiss 2003; Wu, 2009). ―The
most obvious cost [of corruption] is the risk of being caught and punished.‖ (Treisman, 2000:
402). Legal institutions are relevant where cross-border bribery is a crime in the home country.
Thus, central to the role of institutions is whether a firm‘s home-country criminalizes paying
bribes to foreign public officials and how well anti-bribery laws at home are enforced. While the
effectiveness of law enforcement is difficult to observe, we expect that countries with higher-
quality judicial systems will more effectively discourage foreign bribery when it is illegal.
Cross-border bribery has long been unlawful only in the U.S., through the Foreign Corrupt
Practices Act of 1977. In 1999, the Organization for Economic Cooperation and Development
9 We are grateful to Steve Tallman for this point.

13
(OECD) put into force the Convention on Combating Bribery of Foreign Public Officials in
International Business Transactions (henceforth Anti-Bribery Convention).10
As of 2010, it has
38 signatory countries including eight non-OECD members. These countries implement the
Convention through legislation making foreign bribery illegal (Baugn et al., 2010: 18).
Research suggests that laws against bribery abroad deter cross-border corruption (Spencer
and Gomez, forthcoming), especially when multiple countries enforce the laws together (Cuervo-
Cazurra, 2008). We expect that illegality of cross-border bribes in a home country will deter
firms‘ engagement in foreign bribery. Thus,
Hypothesis 3: Firms from countries that have implemented the OECD Anti-Bribery
Convention will bribe less abroad than firms from countries that have not implemented it.
Home-country institutions: financial transparency and corruption norms
The cost of corruption includes the likelihood as well as consequences of detection. Detection in
part depends on societal transparency, which goes beyond national legal systems. Financial
transparency at both firm and societal levels may discourage bribery, since it raises the
likelihood of detection. A number of empirical studies (e.g., Kimbro, 2002; Wu 2005a, 2005b)
provide supporting evidence suggesting that better disclosure practices help decrease bribery.
Similarly, a more transparent home-country environment makes overseas illicit payments easier
to detect. Walter (1985) addresses the role of financial secrecy in facilitating bribery, corruption,
10
More recently, the United Nations Convention Against Corruption (UNCAC) entered into
force in 2005. Although the UNCAC is much broader and detailed in its coverage and provisions
with 140 signatory countries (as of 2010), the OECD Anti-Bribery Convention was the only
international agreement in force during the OFFP.

14
tax evasion and money laundering, and notes that money laundering often occurs through tax
havens. We expect that firms from financially more transparent countries will bribe less.
Another potentially important determinant of cross-border bribery is home-country culture
related to corruption. A recent study by Fisman and Miguel (2007) shows that social norms
related to corruption at home help explain individuals‘ illicit behavior abroad. We conjecture that
the more the home country is perceived as corrupt, the more its firms engage in foreign bribery.
EMPIRICAL STRATEGY
Data and sample
The illicit nature of corruption makes data reliability and comprehensiveness a critical issue. We
are fortunate here in two respects. First, the Iraqi regime was longstanding but fell quickly,
leaving behind extensive documentation. The State Oil Ministry Organization (SOMO) of Iraq
maintained an electronic database of surcharges requested, paid, and unpaid, on a transaction-
specific basis. Second, IIC crosschecked SOMO data against bank records, UN-approved
contracts, and letters of trade credit, and verified accuracy through interviews of Iraqi officials
involved with the creation and execution of the OFFP.
In constructing variables, we utilize two datasets: OFFP and non-OFFP data. OFFP data
come from five oil tables in the IIC report (2005b). This dataset contains detailed information on
legal and illegal payments associated with each oil contract, company names and home
countries. Non-OFFP data include information on crude oil prices from Datastream, and home-
country and company characteristics. Firm-level information is gathered from various sources
including electronic company databases (ORBIS, Datastream), OFFP investigative reports,
especially US Senate (2005) and IIC (2005b), article databases (Lexis-Nexis, Factiva, ProQuest),

15
and company websites. Country institutional data come from related websites and literature (see
below). Table 1a and 1b present summary statistics on OFFP data and non-OFFP data,
respectively.
―Insert Table 1a and 1b here‖
Our sample is the 457 oil contracts during the OFFP bribe period (P8-12), which involved
187 companies from 51 countries. In the case of multinational companies, the OFFP database
sometimes lists the subsidiary that exported oil from Iraq; we group foreign subsidiaries under
their parent firm.11
This reduced the number of firms and countries to 181 and 48, respectively.
Among the 457 contracts, 310 contracts (68%) entailed illegal payments, involving (after
consolidating subsidiaries) 137 companies from 38 countries.
Dependent variable
Our dependent variable, bribe is the percentage of surcharges paid in contract value, calculated
by:
Surcharges PaidBribe = ×100
Contract Value
(1)
The median bribe is about 1.3 percent of contract value; the maximum, about 4.8 percent.
Although large in absolute terms due to large contract size, these figures are small in percentage
terms because close monitoring by the UN obliged Iraq to price its oil close to market value,
limiting its ability to impose large surcharges (IIC, 2005a: Vol I: 98-100, Vol III: 141).
11
Grouping affects only a few firms and transactions (4 parent companies, 8 transactions). The
subsidiaries are registered in Aruba, the Cayman Islands, the British Virgin Islands, and
Singapore, jurisdictions that typically lack some country-level data. Dropping these 8
transactions does not affect the results.

16
Independent variables
Rent
Despite its role in theories of corruption, rent has been tested in the literature only indirectly. In
the absence of transaction-specific data, researchers have relied on industry- or country-specific
factors as proxies (e.g., size and scope of the public sector, trade protection, natural resources;
see Jain, 2001; Lambsdorff, 2006). The OFFP data enable measurement of rent for each contract,
and thus examination of how firms‘ behavior depends on financial incentives. To our knowledge,
no study has empirically measured rent at a transaction level, or examined the relationship
between rent and bribery.
The nature of corruption under OFFP – paying bribes to obtain a commodity at below-market
price – facilitates a straightforward measure of rent through comparison of market prices and
OFFP contract prices. The rent indicates how large the gap is between the market price and the
OFFP price. We calculated the OFFP price by dividing contract value by contract size measured
by barrels lifted. In equation form, rent for each contract is calculated by:
1 Contract ValueRent = Daily Market Price
n Barrels Lifted
(2)
The first term in equation (2) indicates a phase-averaged market price where n denotes the
number of trading days in each OFFP phase of 8-12 (2000-2002), and daily market price is the
crude oil price for Arab Gulf Dubai ($/barrel) during the corresponding phase. We use Arab Gulf
Dubai as a substitute for Iraqi oil. Dubai is widely traded and similar in both quality and
production location.
Ownership

17
Given the large number of countries in the database, and the challenge of finding information on
privately-held firms (the majority of participants in OFFP), we are only able to characterize firms
along two dimensions: ownership structure and line of business. Ownership is categorized by
private, public, state, partial-state and unknown dummy variables. Each dummy takes the value
one, if a firm is privately-held (Private), listed on a stock exchange (Publicly-held), state-owned
(State), or listed while being partially owned by a state (Partial state) at time of the contract,
respectively; otherwise, zero.
OECD Anti-Bribery Convention
We capture the illegality of cross-border bribes in the home country through its implementation
of the OECD Anti-Bribery Convention. Implementation indicates that it is a criminal offense in
the home country to bribe a foreign public official. The OECD Anti-Bribery dummy takes the
value one if a home country implemented the Convention during P8-12, and zero otherwise.
Legal origin
In searching for broad measures that reflect overall law enforcement quality and are not highly
correlated with other institutional variables, we adopt a legal origin dummy for common law
systems (La Porta et al., 1998, 2008). The literature on law and finance indicates that common-
law legal systems put more weight on court decisions, and are associated with more independent
judiciaries, more secure property rights and better contract enforcement than civil-law systems
(La Porta et al., 2008). Treisman (2000) used this measure as a proxy for the effectiveness of
legal systems and found a negative relationship between common-law systems and perceived
corruption.

18
Financial transparency
Home-country financial transparency is measured along two dimensions. First, we include a ‗tax
haven‘ dummy that equals one, if a home country is identified as a tax haven in the list in
Dharmapala and Hines (2009), and zero otherwise. Second, we use the ‗financial freedom‘ index
from Heritage Foundation to capture the level of financial transparency more broadly, through
the degree of banking security as well as independence of the financial sector from government
control.12
Perceived corruption
National institutional environments influence corruption (Spencer and Gomez, forthcoming). We
include ‗perceived corruption‘ using Transparency International‘s Corruption Perception Index
(CPI below) as a summary measure to capture ‗social norms related to corruption‘ (Fisman and
Miguel, 2007). CPI is one of the most widely used indices in the corruption literature, and highly
correlated with other corruption indices (Herzfeld and Weiss, 2003).13
Previous studies show that
CPI is related to cultural, economic, and historical factors (e.g., Husted, 1999; Treisman, 2000;
Herzfeld and Weiss, 2003; Wu, 2005a). Moreover, because CPI aggregates ratings from a wide
variety of surveys, both national and cross-country, it largely avoids the biases associated with
12
We thank an anonymous referee for this suggestion. Bushman et al. (2004: 244) document that
―financial transparency is higher in countries with low state ownership of enterprises, low state
ownership of banks, and low risk of state expropriation of firms‘ wealth‖. 13
TI‘s Bribe Payers Index (BPI) also captures perceptions on corruption from the perspectives of
the private sector (local and foreign companies) on foreign bribery based on their experience in a
particular country of operation. We use only CPI, however, as BPI is available for far fewer
home countries as well as highly correlated with CPI (0.89 in our sample).

19
varying definitions of corruptions by reporters in each country discussed in the introduction (for
corruption-survey methodology, see Knack, 2006).
Diplomatic connections
Firms may be more able to resist bribe requests if their home countries are in a position to help
Iraq (Heaton, 2005). We control for diplomatic connections using a dummy, UNSC that equals
one if a contract is associated with a country that served as a member of the UNSC when the
contract was signed, and zero otherwise.
Table 1c provides variable descriptions.
―Insert Table 1c here‖
STATISTICAL ANALYSIS
As part of our exploratory data analysis, we plot bribe against rent in Figure 1. It suggests both a
positive linear relationship between bribe and rent, and imperfect measurement of our rent
variable. Rent, by definition, should be at least zero; otherwise, companies would not export
Iraqi oil. However, Figure 1 displays negative rents in a number of cases, points to the left of the
vertical line. This imperfect measurement comes from using phase-average market prices (see
equation 2 above); exact dates for each contract are not publicly available. This introduces noise
into our measurement of rent, which may bias the estimated coefficient toward zero.
―Insert Figure 1 here‖
Figure 1 also shows many zero values in our dependent variable (Bribe). Note that one-third
of the bribe values in our sample are zero, suggesting the need for a censored regression model in
statistical analysis (Maddala, 1983). We report results from Tobit estimation as well as ordinary

20
least squares (OLS) below. Although the Tobit model is appropriate for censored data like ours,
it is well known that the method is more sensitive to misspecification than OLS. When the
outcome values are censored at zero, OLS estimates are inconsistent, but can still be informative
in terms of direction and significance (Wooldridge 2002: 525).
Our main statistical analysis proceeds in two steps. First, we test for differences in corrupt
behavior among the home-countries after controlling for rent, using the least squares dummy
variable (LSDV) model with no intercept (Greene, 2003). Without findings of differences in
coefficients across home-countries, we would not expect any systematic relationships between
bribery and country-level variables. In contrast, a finding of home-country coefficient
differences would be consistent with the view that corruption at home helps explain corruption
abroad. The equation we estimate is thus:
Bribe = αRent + Σβ Home-country + ε = 1, 2, …48i i i
(3)
where Bribe and Rent are as measured in equations (1) and (2), respectively, Home-country is an
indicator variable, and ε is an error term.
In the second step, we examine the effects of the factors driving cross-border bribery on the
size of bribe through both OLS and standard Tobit models using equation (4):
Bribe = δ + Rent Σφ Ownership + Σλ Legal Consequences Σπ Home Institutions ωγ + + + j j k k l l (4)
where Bribe and Rent are measured as in equations (1) and (2), respectively, Ownership is a set
of dummy variables indicating whether the firm is ‗private‘ (baseline), ‗publicly-held‘, ‗partial-
state‘, ‗state‘, and ‗unknown‘, Legal Consequences include the dummies for ‗OECD Anti-
Bribery‘ Convention and ‗legal origin‘ (common-law), and Home Institutions include the two

21
measures of financial transparency (‗tax haven‘, ‗financial freedom‘), ‗perceived corruption‘ and
‗UNSC‘.
All explanatory variables are rescaled, if necessary, so that higher values indicate a weaker
institutional environment. For instance, perceived corruption is rescaled so that 1 indicates
countries perceived as the least corrupt and 10 as the most corrupt.
RESULTS
Home-country effects
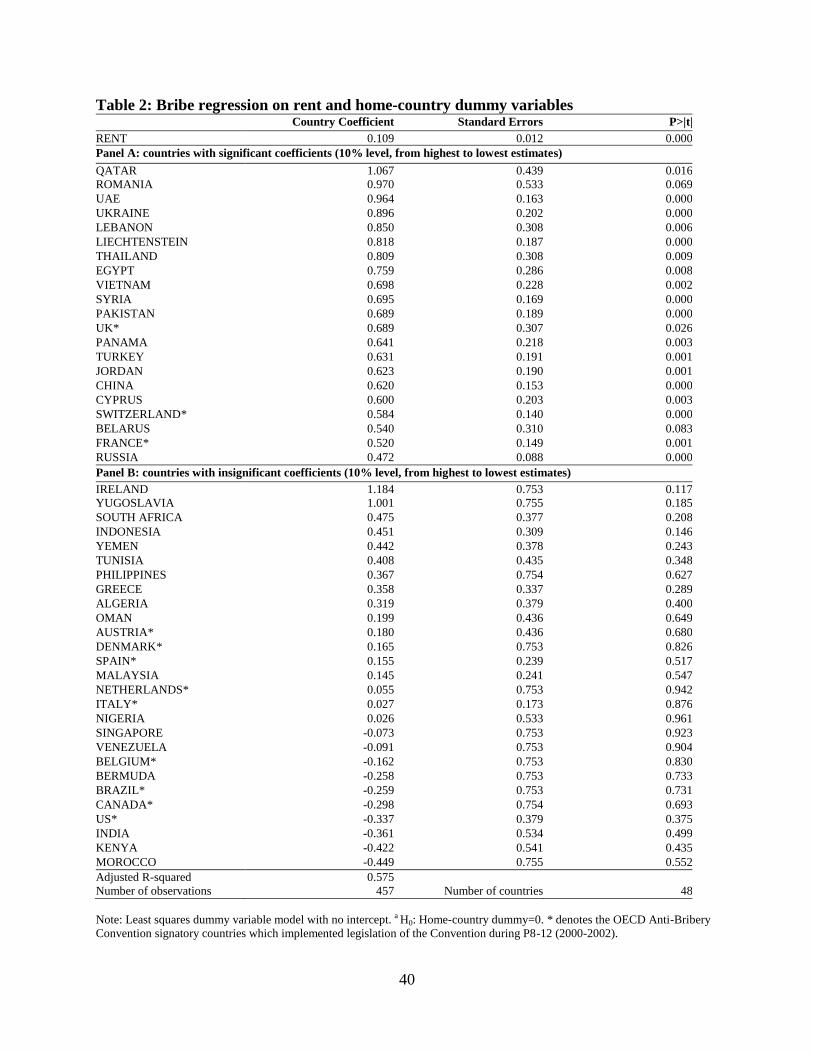
Table 2 reports the coefficients of equation (3) estimated using the full sample of 457 contracts
from 48 countries. The coefficients demonstrate variation in mean bribe level for each country,
after controlling for rent. We note that most of the 21 countries associated with significant
coefficients (see Panel A) have high levels of perceived corruption according to the CPI.
However, corruption is also perceived to be high in many of the 27 countries associated with
insignificant coefficients (see Panel B).
Consistent with the hypothesis that cross-border anti-bribery laws reduce corruption, only
three countries, among the 15 signatory countries that implemented the OECD Anti-Bribery
Convention during OFFP P8-12 (2000-2002), are associated with significant coefficients. The
rest are associated with insignificant coefficients.
―Insert Table 2 here‖
Factors driving cross-border bribery

22
Results from OLS and standard Tobit models14
are reported in Table 3a, where model (1)
includes only rent, and models (2a) and (2b) add home-country institutions, with the two
measures of financial transparency, tax haven (labeled TH) and financial freedom (labeled FF) .
Firm-level characteristics are added in models (3a) using TH and (3b) using FF. As shown at the
bottom of Table 3a (F statistics for OLS and the log-likelihood ratio statistics for Tobit), the
country-level and the firm-level characteristics are jointly significant at the 5 percent level. The
Tobit estimates generally exhibit the same signs as the OLS estimates with similar statistical
significance across all models.
―Insert Table 3a here‖
Hypothesis 1: rent
The most noticeable aspect of the results in Table 3a is the positive and robustly significant
coefficient estimates on rent of 0.10-0.13, with associated p-values less than 0.001 across all
models. Models (1)-(2b) show how much the variability associated with the bribes paid can be
explained only by rent and by home-country institutions, respectively. Note that rent alone
explains 16% of the variability in model (1). From OLS model (1) to models (2a) and (2b), the
explanatory power increases by 9% (from 0.156 to 0.170), and 11% (from 0.170 to 0.189) from
models (2a) and (2b) to (3a) and (3b) where we add the firm-level variables. The small changes
in goodness of fit for both OLS (adjusted R2s) and Tobit models (pseudo R
2s) indicate that rent is
14
All models are estimated based on robust standard errors clustered by home-country (Moulton,
1990). Our examination of inflation factors (<10) and condition numbers (<100, Cameron and
Trivedi, 2005: 350) indicates no serious multicollinearity concerns. We thank an anonymous
referee for suggesting use of condition numbers to check multicollinearity.

23
the main variable that explains cross-border bribery. These findings provide supporting evidence
for Hypothesis 1.
The sensitivity of bribes to changes in rents can be illustrated for a coefficient of 0.10 as
follows. Given the units, a $1/barrel increase in rent leads to a 0.10% rise in bribe. The mean
bribe is 0.80% (of contract value), and mean rent is $2.41 per barrel (Table 1b). This leads to an
elasticity calculation at the mean of:
%Δbribe Δbribe bribe 0.10 0.80η = = = = 0.30
%Δrent Δrent rent 1.00 2.41
Thus a one percent increase in rent on a contract leads to a 0.30 percent increase in bribe; the
remaining part of the increase in rent is kept by the bribe-payer. This magnitude appears
reasonable; if exporters competed away rents through offering larger bribes for contracts, we
might expect the elasticity to be closer to one, but as there was no ‗market for bribes,‘ the
number should be positive, but < 1.
Hypothesis 2: ownership
The results largely support Hypothesis 2. Consistent with the prediction that owner-managers in
private firms will bribe the most, we find that the coefficients on publicly-held, partial-state, and
state are all negative and significant relative to private as baseline in models (3a) and (3b).
However, we find that the largest coefficient is on partial-state, rather than state, indicating that
managers in partially state-owned firms bribe the least.
Hypotheses 3: legal consequences

24
The coefficient on the OECD Anti-Bribery Convention is negative and significant, consistent
with the prediction in Hypothesis 3 in models (2a) - (3b), except Tobit model (3a) where the
associated p-value slightly exceeds 0.10. The results support Hypothesis 3 that firms from
countries whose laws criminalize foreign bribery bribe less abroad, suggesting a deterrence
effect of the Convention.
Given the interest in the effectiveness of the Anti-Bribery Convention noted earlier, we
investigate its deterrence effect using a bivariate nonparametric χ2
test, and report the result in
Table 3b. The result shows that the propensity to bribe for firms from non-signatory countries is
71% vs. 58% for those from signatory countries (p-value < .05).
―Insert Table 3b here‖
While statistically significant, the difference in the propensity to bribe (13%) suggests a
modest effect of the Convention on cross-border bribery by firms. It should also be noted that the
deterrence effect is likely underestimated because most countries had implemented the
Convention shortly before the onset of the OFFP bribe regime (P8-12).15
Home-country institutions
We do not find individual significance of other home-country characteristics in models (2a) -
(3b). Although not statistically significant, the coefficients on the legal origin (common-law)
dummy are all negative, consistent with the view that a higher quality judicial system may deter
firms‘ foreign bribery behavior through stronger law enforcement. Likewise, the two measures of
financial transparency--tax haven (TH) and financial freedom (FF) are statistically insignificant,
but exhibit the expected positive signs. Results on UNSC are also insignificant.
15
We thank an anonymous reviewer for this point.

25
The coefficients on perceived corruption are all negative. Although none is significant, this is
inconsistent with the view that the more corrupt is the home country, the more its firms will
engage in foreign bribery. We examine this further in Figure 2, where we plot bribes paid,
contract by contract, against home-country perceived corruption. Consistent with the result, the
figure displays no systematic relationship between actual and perceived corruption, suggesting
that firms from countries perceived as clean do not necessarily behave as cleanly as their home
countries‘ reputations.
―Insert Figure 2 here‖
Robustness checks
We checked the robustness of the results in several different ways. First, our firm-level results on
ownership structure may capture reputation effects, rather than managerial incentives. As noted
earlier, managers of publicly-held firms are subject to greater scrutiny so may care more about
reputation, and loss of reputation through bribery can be costly, given its impact on future
business. Our ability to measure reputation is limited by our multi-country sample of firms that
are mostly privately held. In looking at reputation, we focus on the fact that oil exporters fall into
two groups – firms that can process crude oil (industrial firms), and intermediaries (who must
resell it).
The strategy literature suggests that reputation is industry-specific, and likely to be of greater
concern for industrial firms, especially those in polluting and heavily-regulated industries, such
as oil (Fombrum and Shanley 1990, Bansal and Roth 2000, Bertels and Peloza 2008).Theoretical
models and empirical evidence also suggest that intermediaries such as trading companies
facilitate corruption (Oldenburg, 1987; Lambsdorff 2002; Hasker and Okten, 2008). This is

26
especially true in the petroleum industry, where trading companies have long had problematic
reputations, e.g. Frynas and Mellahi (2003), McPherson and Searraigh (2007).
The industrial firms in our sample are primarily large multinational enterprises, which tend to
be more visible, and subject to more public scrutiny (Strike et al., 2006). The remainder are
primarily small trading companies with low profiles; hence reputation is likely to be less
important. Moreover, some firms were created solely to participate in the OFFP – referred to as
‗front‘ or ‗shell‘ companies in the trade press. If reputation rather than managerial incentives
under different ownership structures is driving our firm-level results, adding industry-segment
dummies should reduce or eliminate the effect of ownership, with positive coefficients on trading
and front companies (industrial firms as a baseline).
Results (not reported, but available on request) show that our main results do not change.
Ownership dummies are largely unaffected when the industry-segment dummies are added to
models (3a) and (3b) in Table 3a. Trading and front companies are more prone to corruption than
industrial firms, but none of the coefficients is significant.
Second, in order to check whether firm responses to bribe requests are affected by prior bribe
payments during the bribe period, we adjusted for repeated contracts in the models in Table 4
using two variables, respectively: i) a dummy that equals 1 if a company made more than one
contract during the period, otherwise, 0, and ii) the number of prior OFFP contracts signed by the
firm. Overall results do not change when either of these measures is included.
Lastly, some of the contracts in the OFFP database appear to be parts of a single contract.
They usually have consecutive contract numbers in the data. To assess the potential impact of
splitting one contract into two, we combined neighboring contracts. Although the sample size
becomes slightly smaller (418), the main results do not change.
27
DISCUSSION
In summary, we consistently found significant positive rent coefficients across all models,
indicating that firms pay larger bribes when there are strong financial incentives, even when
there are legal and societal strictures against corruption. At the firm level, we found that
ownership structure affects managers‘ reaction to bribe requests; unregulated small companies
that can more easily avoid public scrutiny are the most prone to bribery. At the country level, we
found a significant negative effect on firms‘ illicit behavior abroad of the implementation of the
OECD Anti-Bribery Convention at home. Lastly, we found little relationship between a widely-
used country-level corruption perception index and actual bribery by firms.
A potential explanation for this weak relationship can be found in self-selection by firms
participating in the OFFP during the bribe period. Countries perceived as cleaner may be
associated with fewer firms willing to enter into the contracting process with Iraq once word of
bribe requests circulated. If there is a systematic relationship between perceived home-country
corruption and the tendency of firms from that country to participate in the bribe period, then
countries with low CPI scores (cleaner) may be indistinguishable from those with high scores. In
other words, firm heterogeneity within a country could explain our finding of statistically-
insignificant effects of corruption perception on actual bribery.
We are able to assess self-selection here through examination of firm participation in the pre-
bribe period (phases 1 to 7). For each country with firms participating in the pre-bribe regime,
we calculate the fraction of firms from that country that exited when the bribe regime started.
Self-selection would imply a negative correlation – the cleaner the home country (i.e., the lower
the rescaled CPI score), the higher the fraction of its firms exiting when the bribe regime started.

28
The correlation is positive (0.25) and significant at the 5 percent level, however, indicating that
self-section does not explain our finding that perceived corruption at the national level is not a
predictor of corrupt behavior at the firm level.
CONCLUSION
Taking advantage of data on actual bribe requests and payments, we examined determinants of
supply-side corruption in a global setting, where companies from many home countries faced
bribe requests from a host government, Iraq. In examining factors affecting managerial decisions
on bribe payments, we applied concepts from the economic theory of crime, agency theory, and
institutions to the analysis of the supply side of bribery.
Bribe payments at a transaction-level allowed us to measure financial incentives (rents)
confronting firms faced with bribe requests. Fisman and Miguel (2007) found that ‗cultural or
social norms related to corruption‘ (proxied by CPI) drive corrupt behavior when such behavior
is not penalized. The absence of penalties in their case (diplomatic parking tickets in New York)
facilitates a clean test for social norms related to corruption as a determinant of illicit behavior,
but prevents assessment of financial incentives and costs of corruption we examined here. We
showed that after controlling for such norms and costs of corruption, rent significantly explains
the variability in corporate illicit behavior.
At the firm level, we applied principal-agent theory to explain the differences in firms‘ bribe
payments, and hypothesized that they would depend on the varying degrees of separation and
control of ownership structure. Consistent with this view, we found that owner-managers in
privately-held firms, less subject to public scrutiny, paid bribes abroad the most. The results on

29
managerial incentives hold when we consider the possible effect of reputation associated with
ownership structure.
The home-country institutional environment affects managerial decisions through likelihood
and consequences of detection. Our results on legal consequences provide optimism for ant-
corruption policy, in the form of a deterrence effect of implementation of the OECD Anti-
Bribery Convention. Finally, our finding of little relationship between perceived corruption
measures and actual corruption should encourage researchers to move beyond such measures in
analyzing the causes and consequences of corruption.
Overall, results indicate that firms pay larger bribes in an environment of ‗pay to play‘ where
they face stronger financial incentives. Such incentives are enforced by lack of monitoring and
weak legal environment to deter business corrupt practices at the international level. Our results
shed light on important areas that private and public sectors can work together in order to
facilitate better anti-corrupt business environment globally—improving corporate governance at
the local level and strengthening monitoring and legal enforcement at the international level.
Our study contributes to the broader literature on the influence of home-country institutions
on firms‘ international behavior (Spencer and Gomez, forthcoming, King and Shaver 2001,
Murtha and Lenway, 1994). We found that, despite the fact that the UN and its member states
were unable to monitor illicit behavior during OFFP, firms from countries where cross-border
corruption is illegal were less prone to bribery. Encouraging more nations to implement the anti-
bribery convention(s) at the international level can act as a deterrent to firms‘ corrupt behavior
abroad.
We conclude by noting some limitations of our study. Rent is measured imperfectly due to
the absence of contract-date information in the OFFP data. Also, the fact that most OFFP

30
participating firms are international and small-to-medium-sized trading companies linits our
ability to examine firm-level determinants. Lastly, any study based on a single industry raises a
question of external validity – to what extent is the petroleum industry typical of other parts of
the global stage? Does corruption in the petroleum industry reflect broader managerial
behavior?16
Whether managers would act differently in a different industry in the face of
demands for bribes remains a question for future research.
16
The petroleum industry is widely viewed as prone to corruption, part of the so-called ‗resource
curse‘ (Auty, 1993). The industry is characterized by large rents and extensive government
participation, and concentrated in countries with weak governance. Indeed, oil-producing
countries tend to be perceived as corrupt, according to Transparency International (McPherson
and MacSearraigh, 2007). Global industries with similar characteristics include mining, forestry,
tourism.

31
REFERENCES
Ades, A., Di Tella, R. 1997. The New Economics of Corruption: A Survey and Some New
Results. Political Studies, 45: 496-515.
Aidt, T. S. 2003. Economic Analysis of Corruption: A Survey. Economic Journal, 113: F632 -
F658.
Associated Press. No Rush to Examine Oil-For-Food Documents. December 22.
Auty, R. M. 1993. Sustaining Development in Mineral Economies: The Resource Curse Thesis.
London: Routledge.
Bansal, P., Roth, K.. 2000. Why Companies Go Green: A Model of Ecological Responsiveness.
Academy of Management Journal, 43(4), August: 717-736.
Baugn, C., Bodie, N.L., Buchanan, M.A., Bixby, M.B., 2010. Bribery in International Business
Transactions. Journal of Business Ethics, 92(1): 15-32.
Becker, G.S. 1968. Crime and Punishment: An Economic Approach. Journal of Political
Economy, 76(2): 169-217.
Beets, S.D. 2005. Understanding the Demand-side Issues of International Corruption. Journal of
Business Ethics, 57(1): 65-81.
Bennedsen, M., Feldmann, S. E.,Lassen, D.D., 2009. Strong Firms Lobby, Weak Firms Bribe: A
Survey-Based Analysis of the Demand for Influence and Corruption. Available at SSRN:
http://ssrn.com/abstract=1503028
Bertels, S., Peloza, J. 2008. Running Just to Stand Still? Managing CSR Reputation in an Era of
Ratcheting Expectations. Corporate Reputation Review, 11(1): 56-72
Brammer, S., S. Pavelin, 2006. Corporate Reputation and Social Performance: The Importance
of Fit. Journal of Management Studies, 43: 435-455.
Bushman, Robert, Joseph Piotroski, Abbie Smith. 2004, What determines corporate
transparency? Journal of Accounting Research, 42: 207-252.
Cameron, A. C., Trivedi, P. K. 2005. Microeconometrics: Methods and Applications, New York:
Cambridge University Press.
Clarke, G. R. G., Xu, L. C. 2004. Privatization, competition, and corruption: how characteristics
of bribe takers and payers affect bribes to utilities. Journal of Public Economics, 88: 2067-2097.

32
Collins, J.D., Uhlenbruck, K., Rodriguez, P. 2008. Why Firms Engage in Corruption: A Top
Management Perspective. Journal of Business Ethics, 87(1): 89-108.
Cuervo-Cazurra, A. 2008. The effectiveness of laws against bribery abroad. Journal of
International Business Studies, 39: 634-651.
Dharmapala, D., Hines, R. 2009. Which Countries Become Tax Havens? Journal of Public
Economics, 93 (9-10): 1058-1068.
Djankov, S., Porta, R., Lopez de Silnaes, F. and Shleifer, A. 2003. Courts, Quarterly Journal of
Economics, 118 (2).
Ehrlich, I. 1996. Crime, Punishment, and the Market for Offenses. Journal of Economic
Perspectives, 10(1): 43-67.
Fama, Eugene F., Michael C. Jensen, 1983. Separation of Ownership and Control, Journal of
Law and Economics, Vol. 26, No. 2.
Fan, C.S, Lin, C., Treisman, D.2009. Political decentralization and corruption: Evidence from
around the world, Journal of Public Economics, 93 (1-2): 14-34.
Fisman, R., Miguel, E. 2007. Corruption, Norms and Legal Enforcement: Evidence from
Diplomatic Parking Tickets, Journal of Political Economy, 115(6):1020-1048.
Fombrun and Shanley, M. 1990. What's in a Name? Reputation Building and Corporate Strategy.
Academy of Management Journal 33,(2), June: 233-258
Frynas, J.G., Mellahi, K. 2003. Political risks as firm-specific (dis)advantages: Evidence on
transnational oil firms in Nigeria, Thunderbird International Business Review 45 (5): 541-565.
Greene, W. H. 2003. Econometric Analysis. 5th ed. NJ: Prentice Hall.
Hasker, K., Okten, C. 2008. Intermediaries and Corruption. Journal of Economic Behavior &
Organization 67: 103-115
Heaton, P. 2005. Oil for What?-Illicit Iraqi Oil Contracts and the U.N. Security Council. The
Journal of Economic Perspectives, 19(4).
Herzfeld, T., C. Weiss. 2003. Corruption and legal (in)effectiveness: an empirical investigation.
European Journal of Political Economy, 19: 621-632.
Hsieh, C., Moretti, E. 2006. Did Iraq Cheat the United Nations? Underpricing, Bribes, and the
Oil for Food Program. Quarterly Journal of Economics, 121(4).

33
Husted, B.W. 1999. Wealth, Culture, and Corruption. Journal of International Business Studies,
30: 339-360.
Independent Inquiry Committee into the United Nations Oil-for-Food Program, 2005a. Report on
the Management of the Oil-for-Food Programme, September.
Independent Inquiry Committee into the United Nations Oil-for-Food Program, 2005b. Report
on the Manipulation of the Oil-for-Food Programme, October.
Jackson, H., Roe, M. 2009. Public and Private Enforcement of Securities Laws: Resource-Based
Evidence. Journal of Financial Economics, 93:207-238.
Jain, A. K. 2001. Corruption: A Review. Journal of Economic Surveys, 15(1).
Jensen, M. and Meckling, W. 1976. Theory of the firm: Managerial behavior, agency costs and
ownership structure. Journal of Financial Economics 3(4), 305-360.
Karpoff, J. M., D. S. Lee, and G. S. Martin .2008. The Cost to Firms of Cooking the Books.
Journal of Financial and Quantitative Analysis 43 : 581-611
Kimbro, M. B. 2002. A Cross-Country Empirical Investigation of Corruption and Its
Relationship to Economic, Cultural and Institutional Variables: An Examination of the Role of
Accounting and Financial Statements Quality. Journal of Accounting Auditing and Finance,
17(4), 325–349.
King, A.A. and Shaver, J.M. 2001 Are aliens green? Assessing foreign establishments'
environmental conduct in the United States. Strategic Management Journal 22, 1069-1085.
Knack, S. 2006. Measuring Corruption in Eastern Europe and Central Asia: A Critique of the
Cross-Country Indicators. World Bank Policy Research Working Paper No. 3968.
Kogut, B. 1991. Country capabilities and the permeability of borders. Strategic Management
Jounal 12(S1), 33-47.
Kuziemko, I., Werker, E. 2006. How Much Is a Seat on the Security Council Worth?
Foreign Aid and Bribery at the United Nations. Journal of Political Economy, 114.
Kwok, C.C.Y., Tadesse, S. 2006. The MNC as an agent of change for host-country institutions:
FDI and Corruption. Journal of International Business Studies, 37: 767–785.
La Porta, R., Lopez-de-Silanes, F., Shleifer, A., Vishny, R.W. 1998. Law and Finance. Journal
of Political Economy, 106(6): 1113-1155
La Porta, R., Lopez-de-Silanes, F., Shleifer, A. 2008. The Economic Consequences of Legal
Origins. Journal of Economic Literature, 46(2): 285-.

34
Lambsdorff, J. G. 2002. Making corrupt deals: contracting in the shadow of the law. Journal of
Economic Behavior & Organization 48(3) July: 221-241
Lambsdorff, J. G. 2006. Consequences and Causes of Corruption – What do We Know from a
Cross-Section of Countries? in S. Rose-Ackerman ed., International Handbook on the
Economics of Corruption. Cheltenham, UK: Edward Elgar.
Lambsdorff, J. G., Cornelius, P. 2000. Corruption, Foreign Investment and Growth. The Africa
Competitiveness Report 2000/2001, Cambridge, MA: Harvard University and Oxford: Oxford
University press: 70-78.
Maddala, G. S. 1983. Limited-Dependent and Qualitative Variables in Econometrics, New York:
Cambridge University Press.
Martin, K., Cullen, J., Johnson, J., Parboteeah, K. 2007. Deciding to Bribe: A Cross-level
Analysis of Firm and Home Country Influences on Bribery Activity. Academy of Management
Journal, 50(6): 1401-1422.
McPherson C, MacSearraigh S. 2007. Corruption in the Petroleum Sector. In Campos J.E.,
Pradhan S, eds. The Many Faces of Corruption. Washington, DC: World Bank.
Megginson, W. L. 2005. The Financial Economics of Privatization. Oxford: Oxford University
Press.
Moulton, B.R. 1990. An Illustration of a Pitfall in Estimating the Effects of Aggregate Variables
on Micro Units. Review of Economics and Statistics, 72(2): 334-338.
Murtha, T.P., Lenway, S.A. 1994. Country Capabilities and the Strategic State: How National
Political Institutions Affect Multinational Corporations‘ Strategies. Strategic Management
Journal 15, 113-129.
Noonan, John T., Jr. Bribes: The Intellectual History of a Moral Idea. New York: Macmillan,
1984.
Oldenburg, P. 1987. Middlemen in Third-World Corruption: Implications of an Indian Case.
World Politics 39(4), pp. 508-535
Olken, B.A. 2007. Monitoring Corruption: Evidence from a Field Experiment in Indonesia,
Journal of Political Economy, 115(2).
Roberts, P., Dowling, G. 2002. Corporate Reputation and Sustained Financial Performance.
Strategic Management Journal. 23: 1077-1093.

35
Robertson, C.J. 2008. An Analysis of 10 Years of Business Ethics Research in Strategic
Management Journal: 1996-2005. Journal of Business Ethics, 80(4): 745-753.
Robertson, C.J., Watson, A. 2004. Corruption and Change: the Impact of FDI. Strategic
Management Journal. 25: 385-396.
Rodriguez, P., Uhlenbruck, K., Eden, L. 2005. Government corruption and the entry strategies of
multinationals. Academy of Management Review. 30(2): 383–396.
Rose-Ackerman, S. 1978. Corruption: A Study in Political Economy. New York: Academic
Press.
Rose-Ackerman, S. 1999. Corruption and Government: Causes, Consequences, and Reform.
Cambridge: Cambridge University Press.
Seldadyo, H., Haan, J. 2006. The Determinants of Corruption: A Literature Survey and New
Evidence, 2006 EPCS Conference, Finland, 2006.
Shleifer, A., Vishny, R.W. 1993. Corruption, Quarterly Journal of Economics, 108(3).
Spencer, J.W., Gómez, C. forthcoming. MNEs and Corruption: the Impact of National
Institutions and Subsidiary Strategy. Strategic Management Journal.
Strike, V., Gao, J., Bansal, P. 2006. Being Good while Being Bad: Social Responsibility and the
International Diversification of US Firms. Journal of International Business Studies, 37: 850-
862.
Svensson, J. 2003. Who Must Pay Bribes and How Much? Evidence from a Cross-Section of
Firms. Quarterly Journal of Economics, 118(1).
Sung, H.-E. 2005. Between Demand and Supply: Bribery in International Trade. Crime, Law, &
Social Change 44: 111-131.
Svensson, J. 2005. Eight Questions about Corruption. The Journal of Economic Perspective,
19(3).
Tanzi, V. 1998. Corruption Around the World: Causes, Consequences, Scope, and Cures, IMF
Staff Papers, 45 (4).
Treisman, D. 2000. The Causes of Corruption: A Cross-National Study. Journal of Public
Economics, 76 (3).
Treisman, D., 2007. What Have We Learned About the Causes of Corruption from Ten Years of
Cross-National Empirical Research? Annual Review of Political Science, 10.

36
Uhlenbruck, K, Rodriguez, P., Doh, J., Eden, L. 2006. The Impact of Corruption on Entry
Strategy: Evidence from Telecommunication Projects in Emerging Economies. Organization
Science, 17 (3): 402-414.
U.S. Senate, Permanent Subcommittee on Investigations, 2005. Oil for Influence: How Saddam
Used Oil to Reward Politicians under the United Nations Oil-for-Food Program, May.
Vernon R. (ed.), 1976. The Oil Crisis, New York: Norton.
Walter, I. 1985. Secret money: the world of international financial secrecy, Lexington, MA: Free
Press.
Weitzel, U., Berns, S. 2006. Cross-border takeovers, corruption, and related aspects of
governance. Journal of International Business Studies, 37: 786-806.
Wooldridge, J. M. 2002. Econometric Analysis of Cross Section and Panel Data, 2nd ed.
Cambridge: MIT Press.
Wu, X. 2005a. Corporate Governance and Corruption: A Cross-Country Analysis. Governance:
An International Journal of Policy, Administration and Institutions, 18(2): 151-170.
Wu, X. 2005b. Firm Accounting Practices, Accounting Reforms and Corruption in Asia. Policy
and Society, 24 (3), 53-78.
Wu, X. 2009. Determinants of Bribery in Asia: Evidence from Business Environment Survey.
Journal of Business Ethics. 87(1):75-88.

37
Table 1a: Summary statistics on OFFP data during phases 8-12 (2000 - 2002)
OFFP Phases
Dates1
(MM/DD/YY)
Phase P8 P9 P10 P11 P12 P8-12*
From 06/09/00 12/06/00 07/04/01 12/01/01 05/30/02 06/09/00
To 12/05/00 07/03/01 11/30/01 05/29/02 12/04/02 12/04/02
Total
Number
Contract 106 86 90 106 69 457
Bribe Contract 55 78 88 78 11 310
Firm 88 78 72 74 58 186
Country 38 32 28 29 28 50
Contract Value2
(USD in
Thousands)
Total Amount 9,246,960 7,029,857 4,563,463 5,075,422 4,613,494 30,529,194
Max 385,841 674,112 308,972 313,994 476,543 674,112
Min 10,348 14,015 3,724 6,013 8,798 3,724
Mean 87,235 81,743 50,705 47,881 66,862 66,885
S.D. 76,474 111,606 53,716 45,887 78,767 25,702
Surcharges Paid3
(USD in
Thousands)
Total Amount 13,424 88,996 76,547 44,748 4,498 228,213
Max 1,163 9,804 5,432 3,744 1,171 9,804
Min 8 50 50 25 30 8
Mean 244 1,141 870 574 409 736
S.D. 238 1,650 919 614 299 1,060
Barrels Lifted4
(bbl in
Thousands)
Barrels in total 364,799 347,300 270,904 244,017 196,593 1,423,614
Max 15,548 34,308 19,043 15,234 19,569 34,308
Min 500 916 200 275 403 200
Mean 3,441 4,038 3,010 2,302 2,849 3,128
S.D. 3,056 5,641 3,136 2,272 3,262 1,272
Notes: * These figures are calculated based on the entire phases 8-12. Some firms and countries appear more than once during P8-12.
Sources: 1 Office of the Iraq Programme Oil-for-Food website, Phases (I-XIII) 2 UN OFFP Records (IIC Table 2, 2005b: 55) 3 SOMO Surcharge Records (ibid.) 4 UN OFFP Records (ibid.)

38
Table 1b: Summary statistics on non-OFFP data
Panel A: Daily Market Price (6/9/2000-12/4/2002)
Phase Dates
Crude Oil-Arab Gulf Dubai FOB (U$/bbl)
Mean Median S.D. Min. Max.
8 6/9/2000
12/5/2000
28.40 28.64 23.42 23.42 32.80
9 12/6/2000
7/3/2001
24.06 24.20 19.13 19.13 27.41
10 7/4/2001
11/30/2001
21.73 22.76 15.73 15.73 26.68
11 12/3/2001
5/29/2002
21.27 20.35 16.81 16.81 26.07
12 5/30/2002
12/4/2002
24.99 24.59 21.87 21.87 27.65
Notes: Statistics are generated after omitting U.S. official holidays during 6/9/2000-12/4/2002 (Source: Datastream).
Panel B: Company and Country Characteristics
Variable Short Description Mean S.D. Min. Max. Sum N
Bribe Percentage of contract value paid in surcharge 0.80 0.83 0 4.84 - 457
Rent Phase average daily market price of Arab Gulf
Dubai crude oil – contract value per bbl 2.41 3.08 -5.42 9.80 - 457
Publicly-held Dummy for publicly-held (listed) company 0.05 0.21 0 1 22 457
Private Dummy for private company 0.71 0.46 0 1 323 457
State Dummy for state-owned company 0.17 0.38 0 1 79 457
Partial state Dummy for listed state-owned company 0.04 0.19 0 1 17 457
Unknown Dummy for company with no ownership
information 0.04 0.18 0 1 16 457
OECD Anti-Bribery Dummy for entry into force of implementing
legislation of OECD Anti-Bribery Convention 0.22 0.42 0 1 101 457
Legal origin Dummy for common law legal system 0.27 0.44 0 1 117 440
Tax haven Dummy for tax-haven country 0.22 0.41 0 1 99 457
Financial freedom Aggregated measure of banking security as well
as independence from government control 51.07 21.87 10 90 - 438
Perceived corruption Corruption perception index 6.70 2.04 1.46 9.80 - 438
UNSC Dummy for U.N. security council membership 0.40 0.49 0 1 184 457
Panel C: Correlations
1 2 3 4 5 6 7 8 9 10 11 12 13
1 Bribe 1.00
2 Rent 0.39 1.00
3 Publicly-held 0.12 0.04 1.00
4 Private -0.11 -0.04 -0.35 1.00
5 State -0.13 0.00 -0.31 -0.04 1.00
6 Partial state -0.04 0.00 -0.71 -0.10 -0.09 1.00
7 Unknown 0.04 -0.06 -0.30 -0.04 -0.04 -0.09 1.00
8 OECD Anti-Bribery -0.15 -0.06 0.14 0.16 0.08 -0.24 -0.11 1.00
9 Legal origin 0.02 0.03 0.15 0.01 -0.04 -0.19 0.05 -0.14 1.00
10 Tax haven 0.05 -0.03 0.25 -0.09 -0.08 -0.24 0.07 0.10 -0.04 1.00
11 Financial freedom 0.07 0.05 -0.27 -0.02 -0.01 0.35 -0.02 -0.59 -0.16 -0.68 1.00
12 Perceived corruption 0.05 0.04 -0.30 -0.07 0.02 0.37 0.04 -0.76 -0.15 -0.42 0.72 1.00
13 UNSC -0.05 -0.04 -0.30 0.05 -0.02 0.38 -0.06 -0.07 -0.21 -0.42 0.47 0.25 1.00
Note: Pearson product-moment correlation coefficients.

39
Table 1c: Variable description
Variable Detailed Description Sources
Bribe Percentage of surcharges paid in contract value. IIC Report
Rent Arab Gulf Dubai phase average daily market price – (contract
value/barrels lifted) IIC Report, DataStream
Public Indicator variable equal to 1 if a contract is associated with a firm
listed on a stock exchange, at time of the contract.
Various sources including Bureau
van Dijk Electronic Publishing
(BvDEP)'s ORBIS
database,,Datastream, major U.S.
and world publication, and
company information sources
through LexisNexis, IIC Report
including other UN OFFP
contract documents, and the trade
press.
Private Indicator variable equal to 1 if a contract is associated with a
privately-held firm, at time of the contract.
State Indicator variable equal to 1 if a contract is associated with a state-
owned firm, at time of the contract.
Partial state Indicator variable equal to 1 if a contract is associated with a listed
state-owned firm, at time of the contract.
Unknown Indicator variable equal to 1 if a contract is associated with a firm
whose ownership is unknown.
OECD
Anti-Bribery
Indicator variable equal to 1 if a home country implemented the
OECD Convention on Combating Bribery of Foreign Public
Officials in International Business Transactions (OECD Anti-
Bribery Convention) during P8-12 (2000-2002).
OECD Anti-Bribery Convention
Ratification Status (OECD
website)
Legal origin
(common law)
Indicator variable equal to 1 if a contract is associated with a
country whose legal origin is English-common law or a former
British colony.
La Porta et al., 2008; Treisman,
2000
Tax haven Indicator variable equal to 1 if a home country is identified as a tax
haven. Dharmapala and Hines, 2006
Financial
freedom
A measure of banking security as well as a measure of
independence from government control and interference in the
financial sector (scale: 0-100).
Heritage Foundation, 2001-2002
Perceived
corruption
Corruption Perception Index (CPI) as a proxy for social norms
related to corruption. CPI is on a scale of 1-10, where a lower score
was rescaled to indicate less corrupt.
Transparency International‘s
Corruption Perception Index,
2001-2002. Where 2001 and
2002 data absent, most recent
prior data used.
UNSC
Indicator variable equal to 1 if a contract is associated with a
country that served as a member of the U.N. Security Council when
the contract was signed.
UNSC website
40
Table 2: Bribe regression on rent and home-country dummy variables Country Coefficient Standard Errors P>|t|
RENT 0.109 0.012 0.000
Panel A: countries with significant coefficients (10% level, from highest to lowest estimates)
QATAR 1.067 0.439 0.016
ROMANIA 0.970 0.533 0.069
UAE 0.964 0.163 0.000
UKRAINE 0.896 0.202 0.000
LEBANON 0.850 0.308 0.006
LIECHTENSTEIN 0.818 0.187 0.000
THAILAND 0.809 0.308 0.009
EGYPT 0.759 0.286 0.008
VIETNAM 0.698 0.228 0.002
SYRIA 0.695 0.169 0.000
PAKISTAN 0.689 0.189 0.000
UK* 0.689 0.307 0.026
PANAMA 0.641 0.218 0.003
TURKEY 0.631 0.191 0.001
JORDAN 0.623 0.190 0.001
CHINA 0.620 0.153 0.000
CYPRUS 0.600 0.203 0.003
SWITZERLAND* 0.584 0.140 0.000
BELARUS 0.540 0.310 0.083
FRANCE* 0.520 0.149 0.001
RUSSIA 0.472 0.088 0.000
Panel B: countries with insignificant coefficients (10% level, from highest to lowest estimates)
IRELAND 1.184 0.753 0.117
YUGOSLAVIA 1.001 0.755 0.185
SOUTH AFRICA 0.475 0.377 0.208
INDONESIA 0.451 0.309 0.146
YEMEN 0.442 0.378 0.243
TUNISIA 0.408 0.435 0.348
PHILIPPINES 0.367 0.754 0.627
GREECE 0.358 0.337 0.289
ALGERIA 0.319 0.379 0.400
OMAN 0.199 0.436 0.649
AUSTRIA* 0.180 0.436 0.680
DENMARK* 0.165 0.753 0.826
SPAIN* 0.155 0.239 0.517
MALAYSIA 0.145 0.241 0.547
NETHERLANDS* 0.055 0.753 0.942
ITALY* 0.027 0.173 0.876
NIGERIA 0.026 0.533 0.961
SINGAPORE -0.073 0.753 0.923
VENEZUELA -0.091 0.753 0.904
BELGIUM* -0.162 0.753 0.830
BERMUDA -0.258 0.753 0.733
BRAZIL* -0.259 0.753 0.731
CANADA* -0.298 0.754 0.693
US* -0.337 0.379 0.375
INDIA -0.361 0.534 0.499
KENYA -0.422 0.541 0.435
MOROCCO -0.449 0.755 0.552
Adjusted R-squared 0.575
Number of observations 457 Number of countries 48
Note: Least squares dummy variable model with no intercept. a H0: Home-country dummy=0. * denotes the OECD Anti-Bribery
Convention signatory countries which implemented legislation of the Convention during P8-12 (2000-2002).

41
Table 3a: OLS and Tobit regressions of bribe on economic incentives and home-country institutions
OLS TOBIT
Dependent variable: (1) (2a) (2b) (3a) (3b) (1) (2a) (2b) (3a) (3b)
Bribe TH FF TH FF TH FF TH FF
Rent 0.106*** 0.104*** 0.104*** 0.104*** 0.104*** 0.132*** 0.130*** 0.129*** 0.129*** 0.128***
(0.018) (0.016) (0.016) (0.017) (0.017) (0.026) (0.025) (0.025) (0.025) (0.025)
Public (private: baseline)
-0.322† -0.328†
-0.613† -0.621†
(0.169) (0.168)
(0.350) (0.351)
Partial state
-0.546*** -0.548***
-1.201*** -1.207***
(0.106) (0.107)
(0.318) (0.323)
State
-0.163** -0.163**
-0.254* -0.255*
(0.054) (0.055)
(0.105) (0.103)
Unknown
0.159 0.167
0.141 0.159
(0.171) (0.172)
(0.241) (0.241)
OECD Anti-Bribery
-0.455* -0.458** -0.368† -0.347† -0.659* -0.734** -0.519 -0.563†
(0.197) (0.166) (0.215) (0.189) (0.291) (0.261) (0.315) (0.290)
Legal origin (common-law)
-0.071 -0.078 -0.082 -0.077 -0.124 -0.168 -0.137 -0.167
(0.124) (0.123) (0.115) (0.115) (0.164) (0.158) (0.150) (0.146)
Financial transparencya
0.039 0.001 0.001 0.002 0.169 0.000 0.119 0.000
(0.108) (0.002) (0.102) (0.002) (0.167) (0.003) (0.159) (0.003)
Perceived corruption
-0.056 -0.068 -0.037 -0.046 -0.078 -0.102 -0.043 -0.062
(0.045) (0.043) (0.045) (0.044) (0.065) (0.062) (0.065) (0.064)
UNSC
-0.027 -0.055 -0.002 -0.028 0.016 -0.023 0.059 0.024
(0.097) (0.099) (0.097) (0.095) (0.138) (0.143) (0.141) (0.139)
Constant 0.547*** 1.048** 1.085*** 0.961* 0.935** 0.266*** 0.930† 1.178** 0.768 0.933*
(0.033) (0.378) (0.283) (0.376) (0.300) (0.073) (0.550) (0.437) (0.543) (0.455)
R2 (OLS)/ Pseudo R2M (Tobit)b 0.156 0.182 0.182 0.206 0.207 0.047 0.060 0.059 0.078 0.078
Adj. R2 (OLS)/ Pseudo R2W(Tobit)c 0.156 0.170 0.170 0.188 0.189 0.156 0.179 0.180 0.196 0.198
F-test (OLS) / LR test (Tobit)d - 2.63* 2.65* 3.34* 3.43** - 14.65* 13.60* 21.13*** 21.66***
N 457 439 439 439 439 457 439 439 439 439
Notes: Robust standard errors clustered by country are reported in parentheses for both OLS and standard Tobit regressions. All institutional variables are rescaled, so that higher
values indicate a weaker institutional environment. a Financial transparency measured by tax haven (TH) and financial freedom (FF) as indicated in each model. b McFadden‘s
Pseudo R2 computed by [1- Log likelihood (full model) / Log likelihood (constant only model)]. c Squared multiple correlation between bribe and its predicted value (Wooldridge,
2002). d Likelihood ratio test statistic is calculated by - 2[LogLrestrict. - LogLunrestric.]. Model (1) is re-estimated using the sample size of 439 for the joint significance tests.
Statistical significance is reported based on two-sided tests: † p < 0.10, * p < 0.05, ** p < 0.01, *** p < 0.001

42
Table 3b: χ2 test of association between home-country’s implementation of the OECD Anti-
Bribery Convention and foreign bribery
Home Country's Implementation of
the OECD Anti-Bribery Convention
Bribeb
Total Yes No
Yes
(row percent)
64
(58.2)
46
(41.8)
110
No
(row percent)
246
(70.9)
101
(29.1)
347
Total 310 147 457
Statistic Value Prob.
Chi-squareda 6.185 0.013
a H0: There is no association between home-country‘s implementation of the OECD Anti-Bribery Convention and
foreign bribery by its firms. b Bribe at the row level indicates whether each contract by a participating firm is associated with a bribe.

43
Figure 1: Bribes and contract rents
01
23
45
Bri
be
(%
of
Co
ntr
act
Val
ue
)
-5 0 5 10
1million*Rent/ContractValue

44
Figure 2: Bribes and corruption perception index
Notes: Corruption perception index (CPI) scores come from Transparency International (various years). CPI scores
are available only for 439 contracts. Significance of coefficients refers to 10% level.
01
23
45
Bri
be
(% o
f Co
ntra
ct V
alue
)
1 2 3 4 5 6 7 8 9 10
Rescaled Corruption Perception Index (Higher, More Corrupt)
Insignificant Country Coefficients
Significant Country Coefficients
Russian Contracts

45
APPENDIX: Background notes on the UN Oil-for-Food Program
(1) UN Oil overseers fax warning buyers of Iraqi crude oil (Dec. 15, 2000)
Source: IIC report (2005a, 137)
(2) Accuracy of bribe data
Investigators had access to both transaction databases and bank records of the Iraqi government,
and used both to verify illicit payments. They also interviewed both bribe payers and recipients,
and provided companies opportunities to provide rebuttal evidence prior to publication of IIC
(2005b). None did (IIC, 2005b). For more details, see IIC (2005b) and US Senate (2005).
(3) Humanitarian aid
In addition to oil-export surcharges, the Iraqi regime collected hundreds of millions of dollars
through kickbacks on humanitarian imports, which we do not examine. The number and variety
of goods imported make it difficult to ascertain which of the firms that paid kickbacks (and
which of those that did not) were in comparable positions, clouding the lens for observation of
illicit behavior.


![Who Must Pay Bribes and How Much? Evidence from a Cross ...characteristics. Ades and Di Telia [1999] utilize the same source but use country averages. Hellman et al. [2000a,b] also](https://img.dokumen.tips/doc/110x75/5e61acd1fbf4491e831cec8e/who-must-pay-bribes-and-how-much-evidence-from-a-cross-characteristics-ades.jpg)