Embed Size (px)
Citation preview
WHITE RIVER WATERSHED ARKANSAS AND MISSOURI
WHITE RIVER TABLE ROCK LAKE
MASTER PLAN FOR DEVELOPMENT AND MANAGEMENT OF TABLE ROCK
LAKE
Revised: 2013
Chapter 1 Introduction ................................................................................................................ 1-1
a. Project Authorization ....................................................................................................... 1-1
b. Project Purpose ................................................................................................................ 1-2
c. Purpose and Scope of Master Plan................................................................................... 1-2
d. Brief Watershed and Project Description ........................................................................ 1-3
e. Listing of Prior Design Memorandums ........................................................................... 1-4
f. Listing of Pertinent Project Information .......................................................................... 1-4
Chapter 2 Project Setting and Factors Influencing Management and Development (Existing Conditions) ................................................................................................................................... 2-1
a. Description of Reservoir .................................................................................................. 2-1
b. Hydrology and Groundwater ........................................................................................... 2-1
c. Sedimentation and Shoreline Erosion .............................................................................. 2-2
d. Water Quality ................................................................................................................... 2-2
e. Project Access .................................................................................................................. 2-4
f. Climate ............................................................................................................................. 2-6
g. Topography, Geology, and Soils ..................................................................................... 2-6
h. Resource Analysis (level 1 inventory data) ..................................................................... 2-2
(1) Fish and Wildlife Resources ...................................................................................... 2-2
(2) Vegetative Resources ................................................................................................. 2-3
(3) Threatened & Endangered Species ............................................................................ 2-6
(4) Invasive species ......................................................................................................... 2-6
(5) Ecological Setting ...................................................................................................... 2-7
(6) Wetlands .................................................................................................................... 2-8
i. Cultural Resources ........................................................................................................... 2-9
Prehistoric ............................................................................................................................ 2-9
Historic ................................................................................................................................. 2-9
Previous Investigation in the Table Rock Lake Area ......................................................... 2-10
Recorded Cultural Resources in the Lake Area ................................................................. 2-10
j. Demographics ................................................................................................................ 2-10
k. Economics ...................................................................................................................... 2-12
l. Recreation Facilities, Activities and Needs ................................................................... 2-12
(1) Facility Information ................................................................................................. 2-12
(2) Recreation Areas ...................................................................................................... 2-12
(3) Future Park Development Area ............................................................................... 2-18
(4) Zones of Influence ................................................................................................... 2-18
(5) Visitation Profiles (OMBIL) .................................................................................... 2-20
(6) Recreation Analysis ................................................................................................. 2-21
(7) Recreational Carrying Capacity ............................................................................... 2-25
m. Real Estate ..................................................................................................................... 2-31
(1) Acquisition Policy .................................................................................................... 2-31
(2) Management and Disposal Policy ............................................................................ 2-31
n. Pertinent Public Laws .................................................................................................... 2-31
Chapter 3 Goals and Objectives ................................................................................................. 3-1
a. The Table Rock Lake Master Plan Revision Vision Statement ....................................... 3-1
b. Policy and Master Plan Revision Schedule ..................................................................... 3-1
c. Goals and Objectives ....................................................................................................... 3-3
(1) Goals .......................................................................................................................... 3-3
(2) Resource Objectives................................................................................................... 3-3
Chapter 4 Land Allocation, Land Classification, Water Surface, and Project Easement Lands 4-1
Chapter 5 Resource Plan............................................................................................................. 5-1
Chapter 6 Special Topics/Issues/Considerations ........................................................................ 6-1
a. Sedimentation. ................................................................................................................. 6-1
b. Water Supply ................................................................................................................... 6-1
c. Public Safety. ................................................................................................................... 6-2
d. Public Outreach. ............................................................................................................... 6-2
Chapter 7 Agency and Public Coordination ............................................................................... 7-1
a. Introduction ...................................................................................................................... 7-1
b. Scoping. ........................................................................................................................... 7-1
c. Focus Groups. .................................................................................................................. 7-2
d. Draft Master Plan/Draft Environmental Assessment. ...................................................... 7-2
e. Final Master Plan/Final EA. ............................................................................................ 7-2
Chapter 8 Summary of Recommendations ................................................................................. 8-1
Chapter 9 Bibliography .............................................................................................................. 9-1
Appendix A NEPA Documents Appendix B Summary of Public Comments Appendix C Design Memorandums and Prior Supplements Appendix D Plates
1-1
Chapter 1 Introduction
a. Project Authorization Authorization is defined as “permission to undertake a specific activity”; in the context of this Master Plan revision, project authorization is defined as the ways and means by which the United States Corps of Engineers was originally justified in studying and constructing the White River Basin reservoirs, specifically Table Rock Lake. Additional authorizations for the project followed, including operating Table Rock Lake for Recreation, Fish and Wildlife, and Water Supply. In 1937 the Chief of Engineers presented a report to Congress reviewing his flood-control plans for the Ohio and Mississippi Valleys. The report stressed the need for reservoir control in the White River Basin and set up a system of flood-control reservoirs. In discussion of the Chief of Engineers’ report, the House Committee on Flood Control wrote that in addition to flood control, permanent pools for recreation and conservation of water for other useful purposes would add greatly to the usefulness of reservoir projects without sacrificing flood-control values. The Table Rock Lake project was later authorized as one of the multiple-purpose reservoir projects in the White River Basin for control of floodwaters, generation of hydropower, and other purposes by Section 4 of the Flood Control Act of 1938, as amended by the Flood Control Act of 1941. The Table Rock Lake project authorizations include the following:
• The Flood Control Act approved 28 June 1938 (Public Law No. 761, 75th Congress, 3rd Session) as modified by the Flood Control Act approved 18 August 1941 (Public Law No. 228, 77th Congress, 1st Session) to include the authorization of the project for flood control and generation of hydroelectric power.
• Section 4 of the Flood Control Act approved 22 December 1944 (58 stat 889), as amended by Section 4 of the Flood Control Act approved 24 July 1946 (60 stat 642), as amended by Section 209 of the Flood Control Act approved 3 September 1954, as further amended by Section 207 of the Flood Control Act Of 1962, as further amended by Section 2 of the Land and Water Conservation Fund Act of 1965;
• Section 210 of the Rivers and Harbors Flood Control Act of 1968 authorized the Chief of Engineers, under supervision of the Secretary of the Army, to provide for recreational development and use of the lake projects under his control.
• Public Law 86-93, 86th Congress, (s. 42, approved 17 July 1959) modified the authorization of the project to include, without reimbursement, 27,000 acre-feet of storage to provide water for operation of a fish hatchery by the State of Missouri.
• Section 6, Public Law 78-534. Under Section 6 of Public Law 78-534 (the 1944 Flood Control Act), the Secretary of the Army is authorized to enter into agreements for surplus water with states, municipalities, private concerns, or individuals at any reservoir under the control of the Department of the Army. The price and terms of the agreements may be
1-2
as the Secretary deems reasonable. These agreements may be for domestic, municipal, and industrial uses, but not for crop irrigation.
• Title III of Public Law 85-500 (the 1958 River and Harbor Act) is entitled the "Water Supply Act of 1958." Section 301(a), established a policy of cooperation in development of water supplies for domestic, municipal, industrial, and other purposes. Section 301(b) is the authority for the Corps to include municipal and industrial (M&I) water storage in reservoir projects and to reallocate storage in existing projects to M&I water supply. However, as specified in Section 301(d), modifications to a planned or existing reservoir project to add water supply, which would seriously affect the project, its other purposes, or its operation, requires congressional authorization. This act was amended by Section 10 of Public Law 87-88 and by Section 932 of Public Law 99-662.
• Section 10 of Public Law 87-88 (the Federal Water Pollution Control Act Amendments of 1961) modified the 1958 Water Supply Act. This modification permitted the acceptance of assurances for future water supply to accommodate the construction cost payments for future water supply.
• Section 932 of Public Law 99-662 (the Water Resources Development Act 1986), amended the Water Supply Act of 1958, as amended. This amendment applies to Corps projects but not to Bureau of Reclamation projects. The amendment eliminated the 10-year interest free period for future water supply, modified the interest rate formula, limited repayment to 30 years, and required annual operation, maintenance and replacement costs to be reimbursed annually. This latter requirement had always been a part of Corps policy and repayment procedures.
• Public Law 88-140, approved 16 October 1963, extended to the non-Federal sponsor of water supply storage the right to use the storage for the physical life of the project subject to repayment of costs. This removed an uncertainty as to the continued availability of the storage space after the 50-year maximum period previously allowed in contracts.
b. Project Purpose Table Rock Lake is a multiple purpose water resource development project primarily for flood management and hydropower generation. Additional purposes include providing water storage to supply a fish hatchery (Public Law 86-93 of 1959); and for recreation and for fish and wildlife mitigation to the extent that those additional purposes do not adversely affect flood control, power generation, or other authorized purposes of the project (Flood Control Act of 1944 as amended in 1946, 1954, 1962, 1965 and 1968 and the Water Resources Act of 1996). Table Rock Lake is a major component of a comprehensive plan for water resource development in the White River Basin of Missouri and Arkansas. Additional beneficial uses include increased power output of downstream power stations resulting from the regulated flow from the Table Rock Lake project.
c. Purpose and Scope of Master Plan This report updates Design Memorandum No. 17-E, Updated Master Plan for Development and Management of Table Rock Reservoir approved September 1976. The Master Plan is the strategic land use management document that guides the comprehensive management and development of all project recreational, natural, and cultural resources throughout the life of the
1-3
water resource project. The Master Plan guides the efficient and cost-effective management, development, and use of project lands. It is a vital tool for the responsible stewardship and sustainability of project resources for the benefit of present and future generations. The Master Plan guides and articulates Corps responsibilities pursuant to Federal laws to preserve, conserve, restore, maintain, manage, and develop the project lands, waters, and associated resources. The Master Plan is a dynamic operational document projecting what could and should happen over the life of the project and is flexible based upon changing conditions. The Master Plan deals in concepts, not in details, of design or administration. Detailed management and administration functions are addressed in the Operational Management Plan (OMP), which implement the concepts of the Master Plan into operational actions. The Master Plans will be developed and kept current for Civil Works projects operated and maintained by the Corps and will include all land (fee, easements, or other interests) originally acquired for the projects and any subsequent land (fee, easements, or other interests) acquired to support the operations and authorized missions of the project. The Master Plan is not intended to address the specifics of regional water quality, shoreline management, or water level management; these areas are covered in a project’s shoreline management plan or water management plan. However, specific issues identified through the Master Plan revision process can still be communicated and coordinated with the appropriate internal Corps resource (i.e. Operations for shoreline management) or external resource agency (i.e. Missouri Department of Natural Resources for water quality) responsible for that specific area.
d. Brief Watershed and Project Description The project is located in the scenic Ozark Mountain region of southwest Missouri and northwest Arkansas. The total area contained in the Table Rock project, including both land and water surface, consists of 62,241 acres. Of this total, 1,835 acres are flooded national forest land, 57,745 acres were acquired in fee, 2,896 acres are in flowage easement, 78 acres are under permit, and 3,050 acres are in the streambed. (Check with Barbra Holmes) The region is characterized by narrow ridges between deeply cut valleys that are well wooded with deciduous trees and scattered pine and cedar. When the lake is at the top of the conservation pool, the water area comprises 42,578 acres and 759 miles of shoreline within fee. The shoreline is irregular with steep bluffs to gently sloping points. Construction of Table Rock Dam was initiated in November 1954. The dam was completed in August 1958, and the powerhouse and switchyard were completed in June 1959. The lake was declared operational for public use in March 1960. There are 14 parks on Table Rock Lake presently operated by the Corps of Engineers, 8 of which are operated by the Ozarks Rivers Heritage Foundation through a cooperative agreement. The U.S. Forest Service has developed 1 park which they maintain and operate. 1 State Park is located on Table Rock Lake and it is operated by the Department of Natural Resources. 1 Park is operated by a commercial concessionaire. (Rodney and Jeremy will provide further updates to this paragraph)
1-4
e. Listing of Prior Design Memorandums A listing of prior design memorandums and accompanying supplements are provided in a table listing in Appendix C.
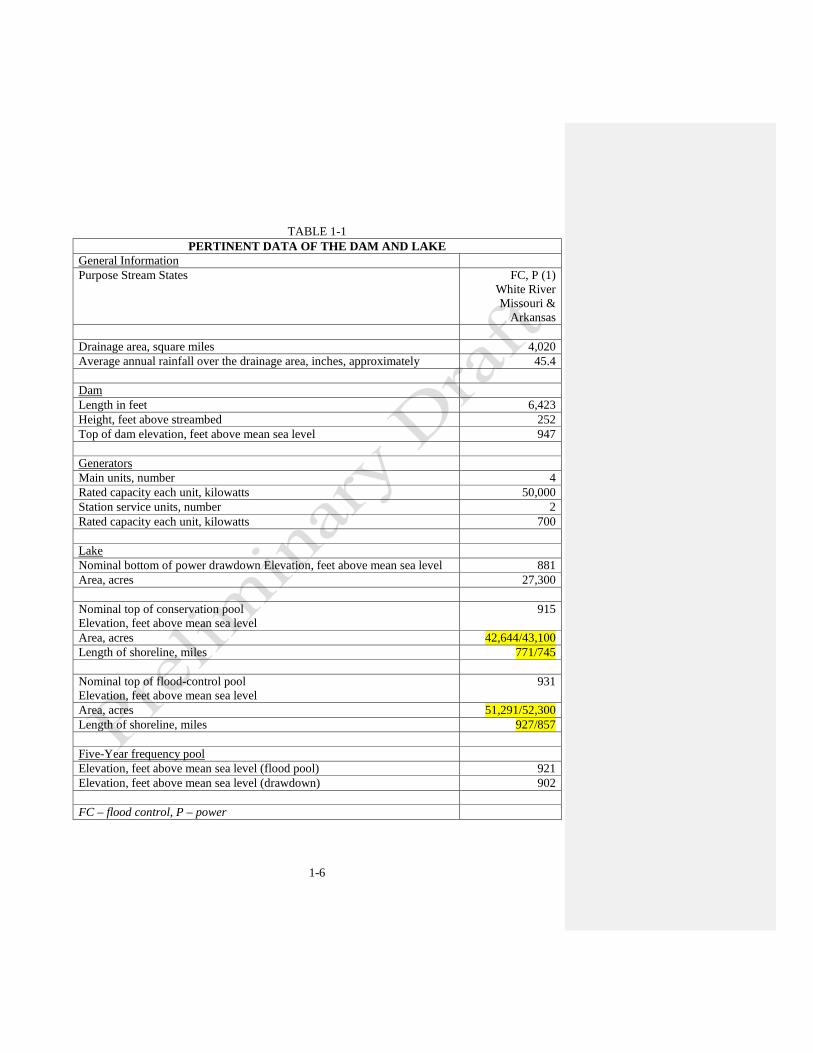
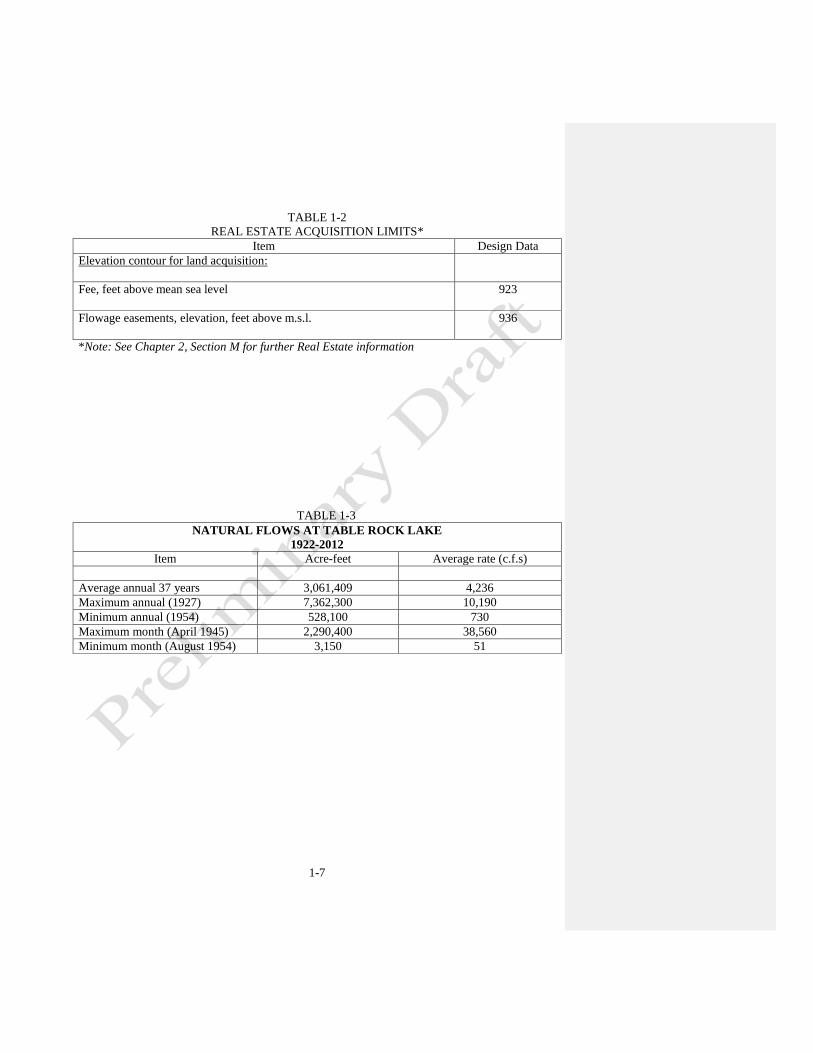
f. Listing of Pertinent Project Information Table Rock Dam is located at river mile 528.8 on the White River in Stone and Taney Counties, Missouri, about 6 miles southwest of Branson, Missouri. The lake extends westerly along the White River to Beaver Dam at mile 609.0 and comprises lands in Taney and Stone counties. Table Rock Lake is one of a series of five lakes in the Upper White River Basin in northern Arkansas and southern Missouri. The other lakes in the series are Beaver, located upstream, Taneycomo and Bull Shoals located downstream on the White River, and Norfork on the North Fork River. The Table Rock project includes a concrete gravity-type dam with embankment extensions and a hydro-electric generating plant. The dam is comprised of 1,602 feet of concrete gravity section and 4,821 feet of embankments at a height of 252 feet above the streambed. The spillway section, 531 feet long, is located above the river channel and is controlled by 10 tainter crest gates 37 feet high by 45 feet long. In the base of the concrete section are four, 4-foot by 9-foot conduits and four, 18-foot diameter power penstocks. The power generating plant consists of four 50,000 kilowatt generating units. Table 1-1 summarizes the pertinent engineering data on the project. Real estate acquisition limits are shown in Table 1-2. Table Rock Lake Dam was determined to have a hydrologic deficiency because the existing, original spillway would not safely pass the Inflow Design Flood (IDF) and/or Probable Maximum Flood (PMF) as described in ER 1110-8-2. The PMF (1,435,000 cfs) was based on a basin average Probable Maximum Precipitation (PMP) of 22.5 inches (excess of 19.06 inches). In December 1994, the Little Rock District produced a Dam Safety Assurance Program Evaluation Report discussing the hydrologic deficiencies at Table Rock Dam and outlined several alternatives to correct those deficiencies. The report initially recommended raising the existing dam by ten feet and providing a temporary traffic detour via a newly constructed downstream bridge. Although approval of the project was granted by the Acting Assistant Secretary of the Army for Civil Works, the Little Rock District was encouraged to continue to seek other alternative methods for maintaining traffic to reduce the overall cost of the project. During the initial stages of design, an idea was presented to construct an alternative auxiliary gated spillway that would be located approximately 3,500 feet north of the existing concrete dam. This plan would allow for construction to take place in the dry without the need for a costly cofferdam. Advantages of this plan (over the dam raising option) included: a) a temporary detour is not required since traffic can pass uninterrupted along the existing roadway while the new auxiliary spillway is being constructed; b) the design elevation of the lake would be reduced by ten feet to the original elevation of 942; c) the environmental issues associated with the detour road and bridge would be eliminated, and; d) the overall project cost would be reduced.

1-5
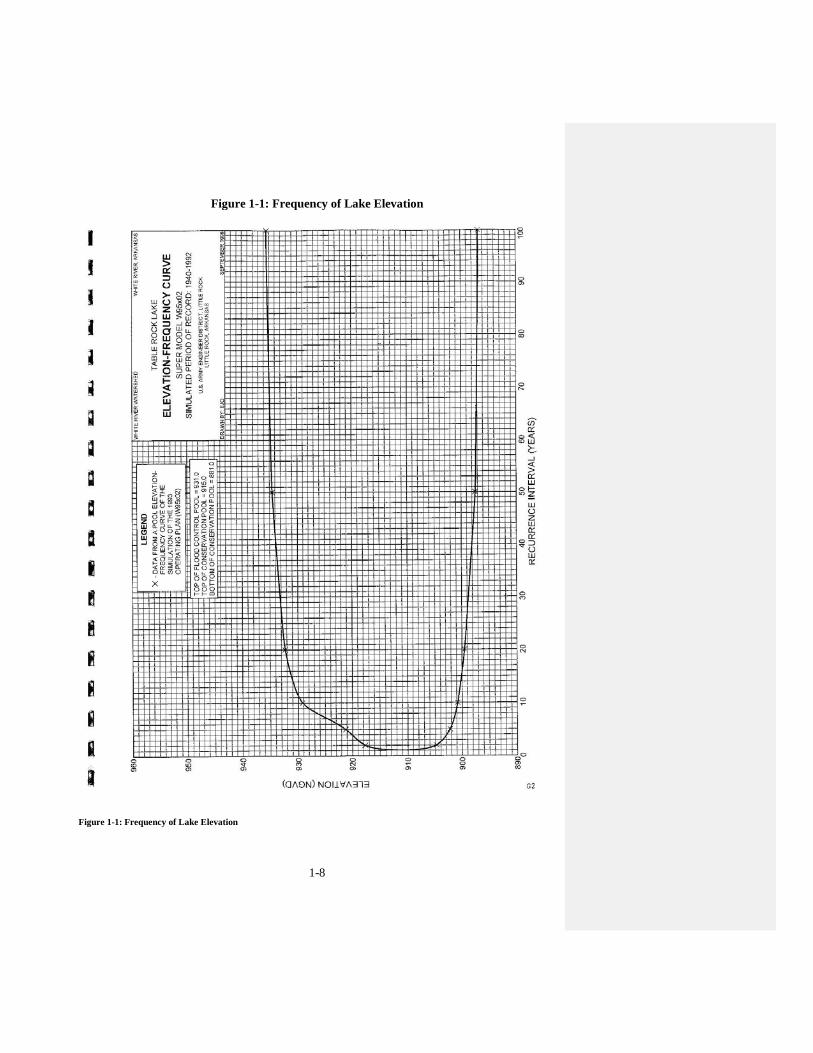
Based on the factors listed above, the auxiliary spillway alternative was adopted as the solution for correcting the existing hydrologic deficiencies. Approval of the new alternative was formally requested in March 1996 and concurrence was received from HQUSACE in August 1996. In general, the auxiliary spillway includes a gated ogee spillway, earthen embankment, spillway bridge, roadway, training dike, approach channel, and control house. The auxiliary spillway has eight 14.75 meter wide by 14.257 meter high (~48ft by 46.75ft) tainter gates with seven- three meter (~10ft) wide intermediate piers. The concrete ogee weir has a crest elevation of 273.10 (896.0), which match the crest elevation of the existing dam. Overall, the spillway is approximately 140 meters (459ft) wide. These new gates provide a spilling capacity of 400,000 cfs. This increases the total spilling capacity of Table Rock dam to 950,000 cfs. The auxiliary gated spillway and embankment is located approximately 3,500 feet north of the existing dam. The location was chosen because a natural draw occurs just upstream of the existing embankment at this location (former Moonshine Beach area) and the existing embankment is most shallow in this area thereby lessening the construction cost. Although the location of the auxiliary spillway would seem to be an imposing threat to the structures located immediately downstream (i.e. fish hatchery and powerhouse), it should be noted that both of these facilities would already be beneath approximately 20 feet of water during flood risk management operations before the auxiliary spillway is ever operated. The water level is due to the releases through the ten gates on the existing dam. Operation of the project related to the storage in the pools is twofold. Conservation pool storage is designed for holding water to be used for authorized purposes, both during normal conditions or during an extended period of below normal rainfall. The flood pool zone is for the temporary impoundment of water to be released after downstream high water has receded. The hydroelectric power plant produces electricity which is marketed by the Southwestern Power Administration, U.S. Department of the Energy. The dam was designed with spillway capacity to pass inflow with a maximum pool elevation of 942 feet m.s.1. Under less than extreme conditions, the lake is operated for a nominal flood control pool elevation of 931 feet m.s.l. Withdrawals of storage for authorized conservation uses, can cause the lake elevation to fluctuate between 915 feet m.s.1., which is the top of the conservation pool, and 881 feet m.s.1., the bottom of the conservation drawdown pool. Under prolonged extreme conditions of low rainfall and runoff, the reservoir may be drawn as low as the maximum probable drawdown, elevation 846 feet m.s.l. to meet the long-range hydro-electric power commitments. During flood conditions, the lake level may rise into the flood control pool and it is possible to exceed the top of the flood control pool by raising the tainter gates. The lake can exceed the top of the flood control pool by several feet when raising these gates in an operation known as an induced surcharge operation. A summary of the inflow to the lake for the 90-year period from 1922 to 2012 is shown in Table 1-3. The area-capacity data for various elevations are furnished on Figure 1-1.
1-6
TABLE 1-1 PERTINENT DATA OF THE DAM AND LAKE
General Information Purpose Stream States FC, P (1)
White River Missouri &
Arkansas Drainage area, square miles 4,020 Average annual rainfall over the drainage area, inches, approximately 45.4 Dam Length in feet 6,423 Height, feet above streambed 252 Top of dam elevation, feet above mean sea level 947 Generators Main units, number 4 Rated capacity each unit, kilowatts 50,000 Station service units, number 2 Rated capacity each unit, kilowatts 700 Lake Nominal bottom of power drawdown Elevation, feet above mean sea level 881 Area, acres 27,300 Nominal top of conservation pool Elevation, feet above mean sea level
915
Area, acres 42,644/43,100 Length of shoreline, miles 771/745 Nominal top of flood-control pool Elevation, feet above mean sea level
931
Area, acres 51,291/52,300 Length of shoreline, miles 927/857 Five-Year frequency pool Elevation, feet above mean sea level (flood pool) 921 Elevation, feet above mean sea level (drawdown) 902 FC – flood control, P – power
1-7
TABLE 1-2
REAL ESTATE ACQUISITION LIMITS* Item Design Data
Elevation contour for land acquisition:
Fee, feet above mean sea level
923
Flowage easements, elevation, feet above m.s.l.
936
*Note: See Chapter 2, Section M for further Real Estate information
TABLE 1-3 NATURAL FLOWS AT TABLE ROCK LAKE
1922-2012 Item Acre-feet Average rate (c.f.s)
Average annual 37 years 3,061,409 4,236 Maximum annual (1927) 7,362,300 10,190 Minimum annual (1954) 528,100 730 Maximum month (April 1945) 2,290,400 38,560 Minimum month (August 1954) 3,150 51
1-8
Figure 1-1: Frequency of Lake Elevation
Figure 1-1: Frequency of Lake Elevation
2-1
Chapter 2 Project Setting and Factors Influencing Management and Development (Existing Conditions)
a. Description of Reservoir The project area is located in the heart of the Ozark Mountain region. Most of Table Rock Lake lies in southwestern Missouri with a very small portion of the lake in northwestern Arkansas. The waters of Table Rock Lake have become a playground for visitors from all over the nation. Table Rock Lake’s water recreation and activities are as varied as the Ozark Mountain terrain that surrounds the lake. With nearly 800 miles of shoreline, Table Rock’s many coves and lake arms make boating and water recreation such as skiing, fishing, diving, and swimming especially popular. Four major rivers, James River, White River, Kings River, and Long Creek make up the lake’s major tributaries. Commercial concessions like marinas and resorts are scattered throughout the lake and about 12 percent of the shoreline is made available for wet slip storage. Also scattered around the lake are public recreation areas that are known nationwide for camping. Much of the shoreline has numerous subdivisions as the Branson and Kimberling City areas of the lake are extremely developed. The predominate shoreline vegetation is an oak- hickory hard wood forest. Numerous limestone bluffs are found around the lake also and red cedar is the principle evergreen and is dispersed throughout the region. The Cow Creek area located on the south border and center of the lake remains relatively undeveloped. The extent of Table Rock Lake and the structural features of the project also contribute to the tremendous attraction for a large amount of visitors to this area. The quality recreational and environmental resources of the project have greatly influenced the development of the entire region.
b. Hydrology and Groundwater Three of the large springs of Missouri feed into Table Rock Lake. Reed's Spring is at the town of the same name in Stone County; Crystal Springs is one-half mile north of Cassville in Barry County; and Roaring River Spring is in Roaring River State Park 7 Miles south of Cassville. A great many unnamed springs, both permanent and intermittent, are in the lake area, and all appear to derive their water from higher ground. Information from wells and small springs in the area indicates that the water table under the higher part of that portion of the lake rim is probably near elevation 900. Many impermeable zones exist which create perched water tables, and many of the shallow wells obtain their water from perched ground water pools. However, because of solution widened joints and structures in the rock, an interchange of water occurs between the formations that underlie the area and leaky aquifers are common. Additionally, because of exposed fractured, weathered, permeable rock, percolation of surface water into the water table is common place.

2-2
Major tributaries to Table Rock Lake are the Kings River and Long Creek from the south and the James River from the north. The drainage is typically steep in the headwaters of the smaller streams and transitions to lesser slopes as they reach the main stem of the White River. These streams can be flashy with intense rainfall. The area is primarily wooded and rural with the exception of the highway 65 corridor from Branson to Springfield. The percent of the basin which is impervious has increased with the rapid development of the area, but remains a small percentage of the overall watershed.
c. Sedimentation and Shoreline Erosion Sediment ranges were established at Table Rock Lake at the time of construction. According to the White River 1993 Water Control Master Manual, the inflow to the White River reservoirs has not historically had a major sediment load; therefore, initial sediment ranges for the lake was established as index ranges to be surveyed only on a spot basis every 10 years unless a sedimentation problem was identified. Some sediment ranges were resurveyed in 1961, 1962, 1964, and the last time in August of 1978. Thus far, no major sediment deposits have been identified with the sedimentation surveys. Therefore, many of the ranges have never been resurveyed. (Reference- WHITE RIVER BASIN ARKANASAS AND MISSOURI,WATER CONTROL MASTER MANUAL,MARCH 1993) Erosion of the residual soil containing cherts and clays accounts for the tumbled gravels found in streambeds of the watershed. Slopes can be 5 to 90 degrees and tend to be steeper in areas close to creeks or water bodies. Noticeable erosion can be found where gravel roadways lead up to boat launches and docks. Most of these embankments are steep and allow stormwater to pick up speed as it heads towards the lake. As gravel washes into Table Rock Lake it also carries smaller sediments and soils. Sediment is large contributor to nutrient input into any water body. (Reference- Table Rock Lake Watershed Management Plan, Table Rock Lake Water Quality, Inc., July 9, 2012)
d. Water Quality Table Rock Lake has been listed by the Environmental Protection Agency (the 303(d) List) as impaired due to excessive nutrient concentrations, particularly nitrogen and phosphorus, since 2002. According to the EPA report, these excessive nutrient concentrations occur most frequently in the James River, Kings River and Long Creek arms of the lake. The upper portion of the White River is also listed as impaired for excessive chlorophyll and nitrogen. In the study by Jones et. al. 2008, it was shown that Table Rock Lake was an oligotrophic lake based on the samples taken near Table Rock Dam, while various arms or branches of the lake such as the James River mouth or Long Creek area, where it receives water from these tributaries, shows tendencies toward being more eutrophic. (Information provided by Table Rock Lake Water Quality, Inc.) Lake fluctuations, associated with power production and flood control procedures, produce changes in the environment along the shoreline of the lake. Turbidity adversely affects Table Rock Lake short periods of time after heavy rains. During these periods of heavy runoff, urban areas and other parts of the terrain especially those that have had the protective vegetation removed, contribute silt and other suspended particles to the tributaries. Table Rock, like all

2-3
other lakes of its size in the Ozark region, stratifies chemically and thermally in the late spring with stratification extending into late fall and early winter. This naturally occurring phenomenon causes portions of the lake below the thermocline to be unfit for fish habitat because of low concentrations of dissolved oxygen. This undesirable water, when discharged downstream may cause some problems in the tailwaters. To combat this problem, the dissolved oxygen content is monitored and liquid oxygen is added to the discharge waters as necessary. A highly productive trout fishery has been established in Lake Taneycomo by the Missouri Conservation Commission because of the available discharge of cold water from the dam. Historically, Table Rock Lake experiences periods of up to five months (July-November) duration when dissolved oxygen (DO) concentrations are less than 4 mg/L near the turbine intakes. Accordingly, turbine release DO levels have been low enough to cause concern for downstream aquatic life. During these low DO periods, the turbines at Table Rock have been operated at reduced capacity to aspirate air through the vacuum breaker system (i.e. ‘venting operation’). Water releases are generally made for power generation except in the case of flood control operation. The Southwestern Power Administration (SWPA) markets power generated at this dam and other projects in the region. Four 50-MW generating units provide approximately 640,000 MWh annually. The typical peak flow for the hydro facility is 13,000 cfs. The maximum turbine discharge is 15,100 cfs. The venting operation can improve release DO concentrations significantly, but the plant derating is costly due to efficiency losses and loss of peaking capacity. In addition to using turbine venting to increase DO, Table Rock is utilizing an existing oxygen system where oxygen is injected into the penstocks. The oxygen storage and injection system at Table Rock was installed in 1973. Currently, oxygen is injected into the penstock through two, ¾-inch piezometer taps around the lower perimeter of the penstock. The oxygen for this system is supplied from a liquid oxygen storage and supply facility consisting of two 52-ton (11,000-gallons each) liquid oxygen storage tanks and a set of water-cooled evaporators capable of producing at least 4,430 scfm of gaseous oxygen. During the low DO season, maximum generation is limited based on the Table Rock Operational Action Plan. The following is a quote out of the Table Rock Operational Action Plan for 2007 Low Dissolved Oxygen Season: “Plan of Action: The operational objective is to sustain DO concentrations in the release at or above 6 mg/L as long as possible through use of the turbine venting systems improvements and to prevent DO concentrations from receding below 4 mg/L, if possible, through actions as outlined below. The plan to accomplish this consists of an oxygen monitoring program, improvements to the turbine venting systems, use of the oxygen injection system, and operational response actions scaled to the severity of DO depletions. Throughout the low DO season, all unit loadings by the powerhouse operator will take into consideration the turbine venting systems improvements to insure the release DO is as high as possible while meeting current electrical output requirements. When required generation combined with the use of the turbine venting systems improvements is insufficient to maintain DO concentrations at the first

2-4
downstream monitor at or above 4 mg/L, then the use of the oxygen injection system and/or spillway releases will be used to maintain 4.0 mg/L in the downstream releases to the extent possible.” In September 2010, the Tennessee Valley Authority (TVA) released a report (“Table Rock Project Forebay Oxygen Diffuser System Report Update, September 29, 2010”) that presented an analysis of a ‘Forebay Oxygen Diffuser System’ at Table Rock Lake; this forebay oxygen diffuser system would work in conjunction with the existing venting operation and oxygen injection system to help alleviate the low DO concentrations Table Rock Lake experiences. It was decided at the time the new system was too costly to install, with operation and maintenance costs also very high; the existing plan of action (use of the venting operation plus the existing oxygen injection system) would attain the desired results needed during events of low DO concentrations.
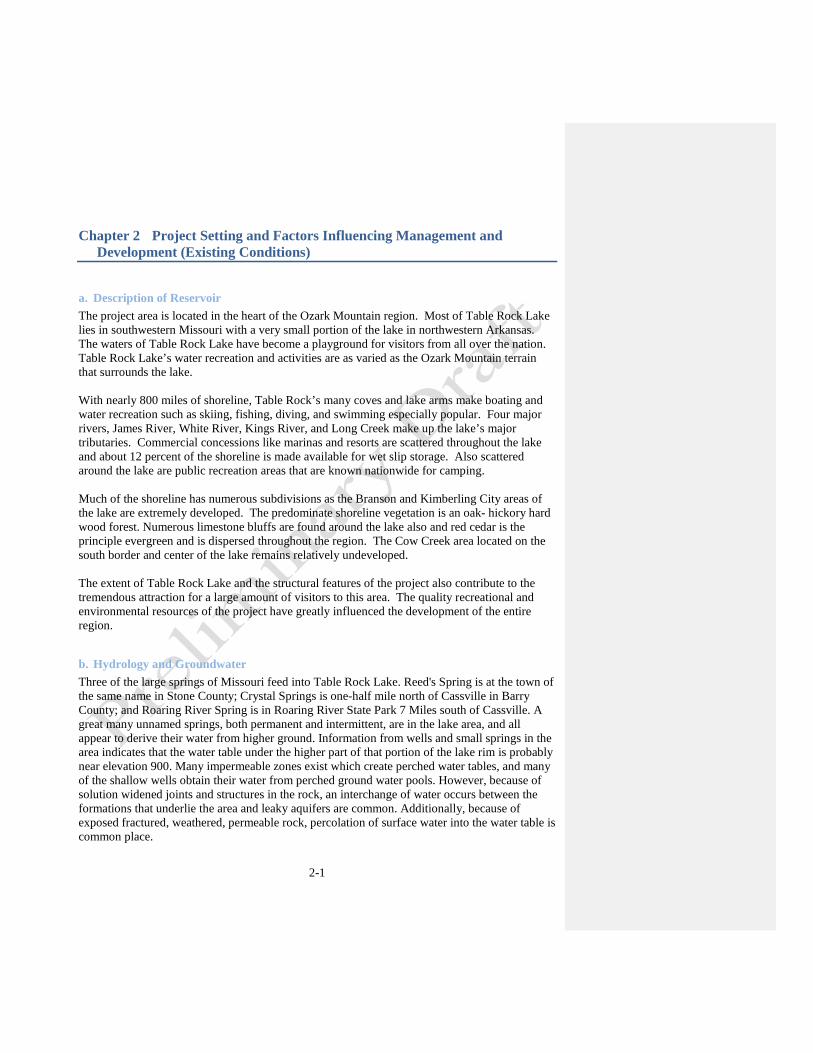
e. Project Access Visitors from the north may reach Table Rock Lake by way of US Highway 65 to the east end of the lake or Missouri State Highway 39 off US 60 to the west end. Both US Highways 60 and 65 serve Springfield, Missouri. Visitors from St. Louis may reach Springfield on Interstate Highway 44 while visitors from Kansas City may travel State Highway 13. Visitors from all points south may travel US 65 to the east end of the lake or take US Highway 62 off US 65 about 5 miles north of Harrison to the west end of the lake. The lake is surrounded by US, State and county roads, making access possible at many points in any given area of the lake. Further highway and airport access can be referenced in Figure 2-1 Table Rock Lake Project Access.
2-5
Figure 2-1 Table Rock Lake Project Access
2-6
f. Climate Climate within the Table Rock Lake Zone of Influence is temperate, with summer extremes lasting for longer periods throughout northern Arkansas, and winter temperatures being more influential in the zone's northern reaches in Missouri. Extremes may vary from lows below around 0oF usually caused by Canadian air masses to highs above 100 oF occurring from southern Arkansas to central Missouri during the summer months. Extreme temperatures may occur for short periods of time at any location within the zone. Rainfall averages vary from 40 to 48 inches throughout the zone. Average annual rainfall over the watershed varies from 44 to 46 inches. Monthly rainfall varies from 2.5 inches in the winter months to about 5 inches in the spring. Heavy rainfall events are commonplace, due either to strong convective environments or to stalled frontal boundaries with a strong fetch of overriding gulf moisture. Average snowfall each year averages from 8 to 16 inches from south to north across the watershed. Snow packs are usually short lived and are not commonly a concern for flooding.
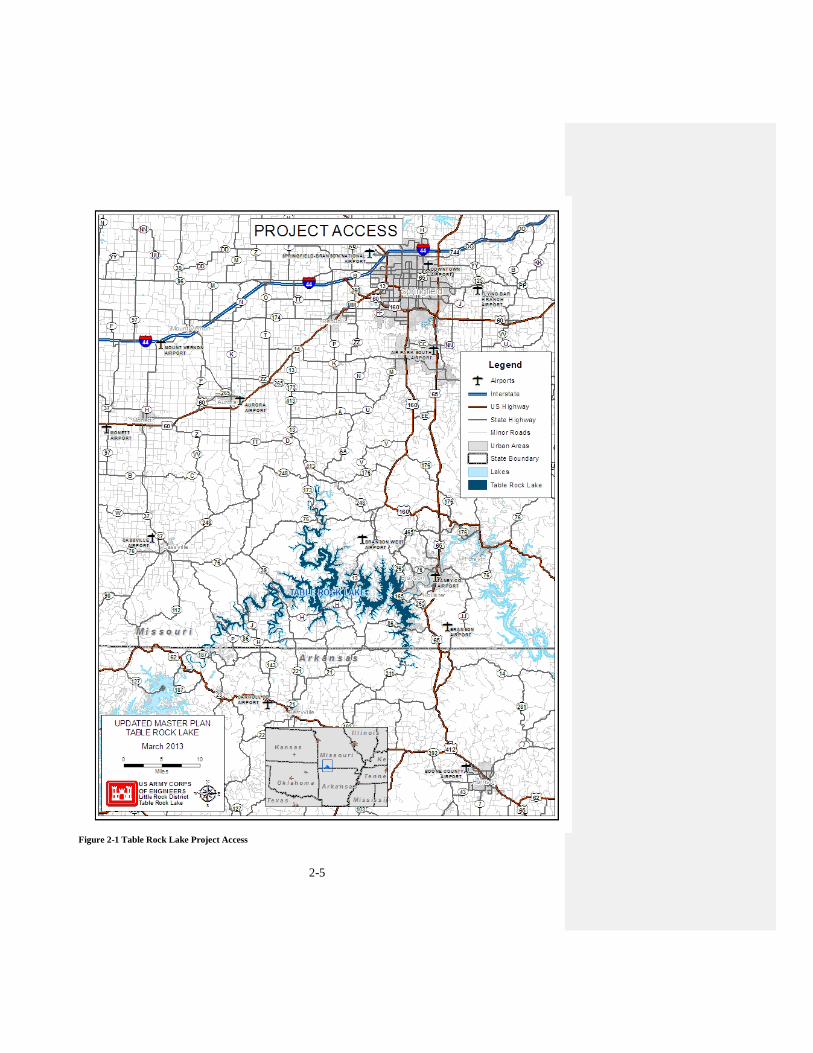
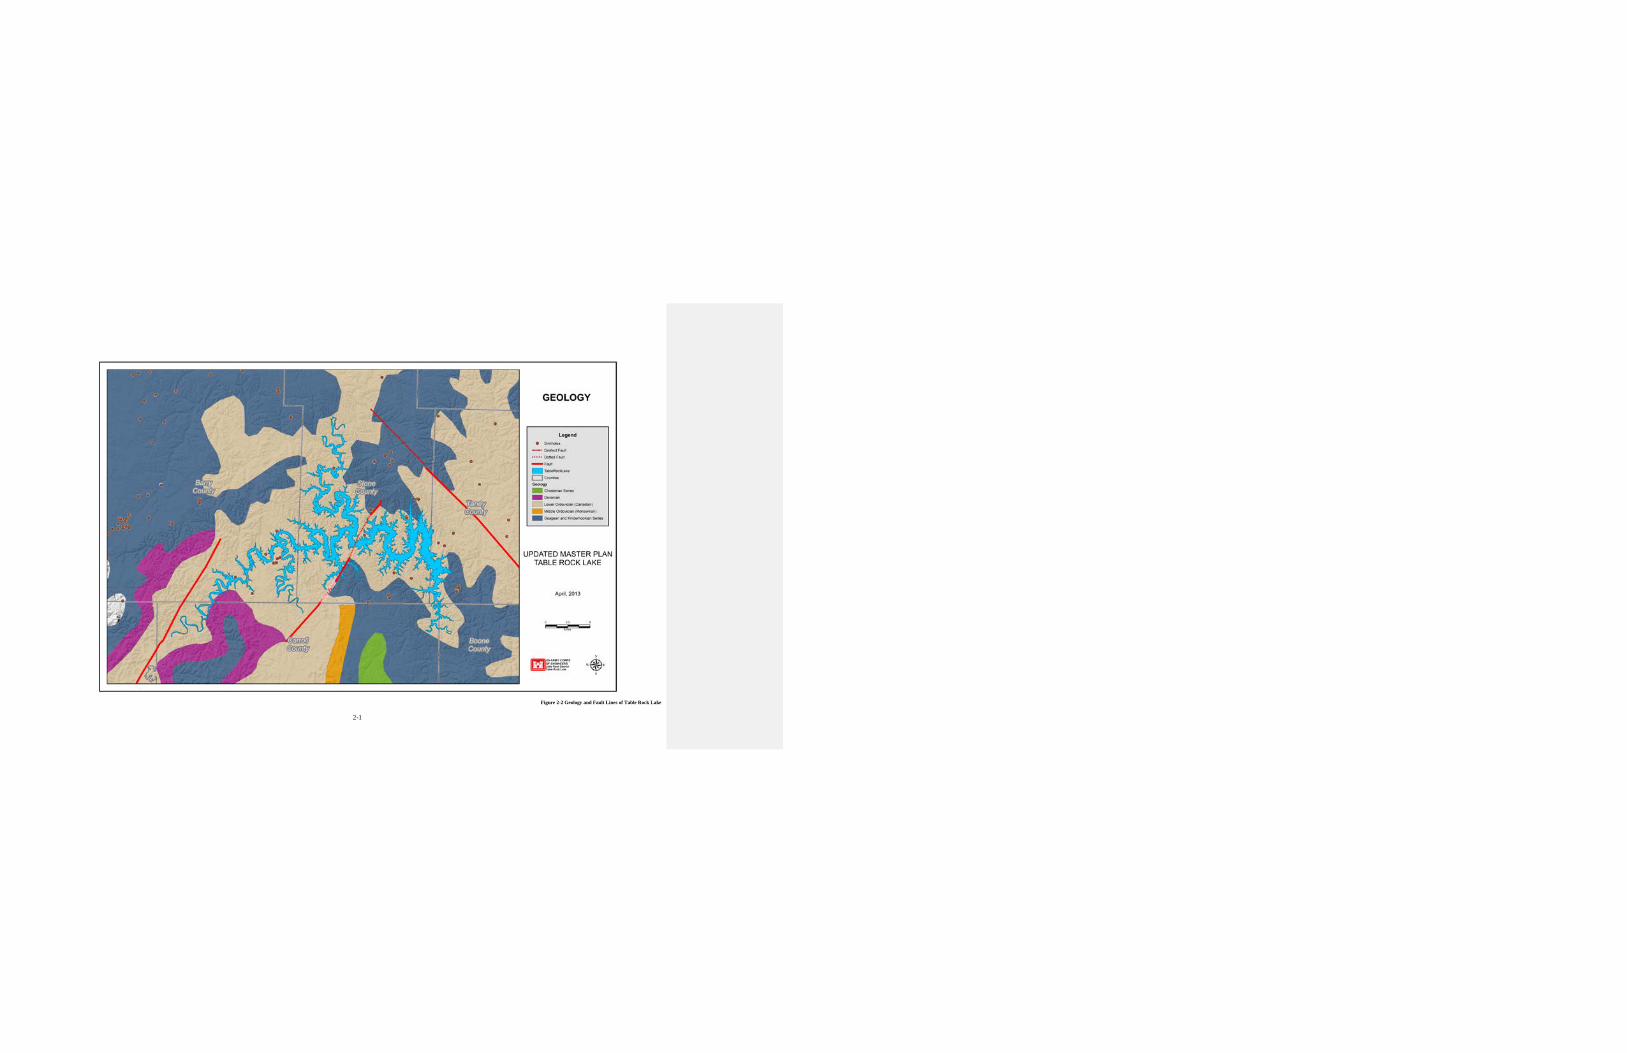
g. Topography, Geology, and Soils Table Rock Lake is on the southwest flank of the Ozark uplift, a structural and topographic high, which is often referred to as the Ozark Plateaus province. The plateau surfaces of this province are underlain by gently dipping, sedimentary bedrock. The highest ridges in the area surrounding the lake are a part of the Springfield Plateau, the middle level of the plateau province, which in this region rises to an elevation of about 1,400 feet. In this region the river and its tributaries have entrenched themselves about 700 feet below the plateau surface. As a result, the plateau has been deeply dissected by erosion and the original surface is present only as the tops of narrow steep ridges. Bedrock strata exposed in the uplands bordering the lake are of Mississippian and Ordovician age. The formations of Mississippian age underlie the plateau surface and most of the higher slopes of the basin and in most areas are well away from the lake and associated lake shore developments. Strata of the Jefferson City-Cotter Formation of Ordovician age underlie the lake and the adjoining slopes. This formation is predominantly dolomite but contains subordinate amounts of chert, quartzite, sandstone, and shale. Most of the strata are more or less argillaceous, and several have been silicified in various degrees. Chert occurs as nodules, and in thin beds along with sandstone or quartzite. Shale occurs as material along partings, and as thin seams along bedding planes. The strata about the lake appear to be nearly horizontal, but are warped gently over a large area by the Osage-Verona anticline, the crest of which is aligned over the Kings River arm of the lake. Two major faults are in the lake area (figure 2-2). These are very old and there are no indications of recent movement along them. One, a part of the Shell Knob - Eagle Rock structure crosses Roaring River where it empties into the lake. It trends about N. 37 E., and is downthrown on the east. It has no effect on the strata beyond the immediate vicinity of the fault. The other, Lampe fault crosses under the Highway 13 White River bridge. It trends N. 30 E., has a displacement of about 190 feet, and is downthrown on the east. Joints observed in rock along the lake are nearly vertical and do not carry through many beds. The strike of the most prominent set
Comment [A1]: Here is the name of one fault, I think the one running through the middle of the lake. Can’t find anything on the other one.

2-7
(primary) ranges from N. 5 E. to N. 10 W. A secondary, more poorly developed set inter-sects these at near right angles. The region surrounding Table Rock Dam is subject to infrequent, mild, seismic shocks but not within recorded history are any shocks of sufficient intensity to damage structures or property.
2-1
Figure 2-2 Geology and Fault Lines of Table Rock Lake
2-1
Although the bedrock of the region is soluble, most of the basin where it is underlain by the dolomites of the Jefferson City-Cotter Formation is characterized by surface drainage. This is indicated by the scarcity of important sinks, the absence of large areas without surface drainage, and a well developed stream system with normal well-branched tributaries. Two caves, Marvel Cave and Fairy Cave, are operated commercially in the region of the lake. Both caves are in the Boone Formation and extend into the Jefferson City-Cotter Formation. However, it should be noted that over most of the area in the Jefferson City-Cotter Formation is not favorable to the extensive development of caves, and those noted in the formation are small. The most significant factor limiting the development of project land is topography. The typical ruggedness of this area hampers intensive development in many locations, and limits the number of sites containing appropriate slopes and adequately-sized areas of land desirable for the location of water access recreation facilities. Extensive alteration of landforms is not acceptable under Corps of Engineers guidelines. The geology of the area imposes no unusual restraints on construction. However, ground water pollution is a potentially severe problem because of the easy access of surface water into the water table and of the free interchange of water between rock formations. Soils around the lake, except in the flood plain, and terrace deposits along the streams, are principally residual material formed by decomposition of the dolomite beds. Generally, they are silty soil over clay subsoil, both containing chert fragments from sand size up to small boulders. The material is loose and friable near the surface but becomes harder and more compact with depth. Contacts of leached chert, disintegrated limestone, and plasticity also increase with depth. As much as 20 feet of residual soil has been encountered by borings, but at most places it is less than 8 feet thick and in some places it is entirely absent. Flood plain material consists of silt and sand over sandy, chert gravel at many places in stream channels. Most of the soils in the vicinity of the lake are low in fertility. Detailed soil survey information can be found through Natural Resources Conservation Service at: (add SSURGO database information) The following four soils associations are found in and around the Table Rock Project area: Clarksville-Noark, Captina-Nixa, Caydon-Pembroke-Sogn, and the Caydon-Sogn. Most of the soils found in the Table Rock project do have characteristics which must be considered in development. The ability of soils to withstand intensive use should be investigated prior to initiation of construction. Trampling on these sites may cause soil compaction, resulting in increased surface runoff and accelerated erosion. Also, vegetative cover may be affected because of the reduction of air and water holding capacity of the soil. It should be noted, however, that soil compaction on use sites is not now a major problem because most of the soils are stoney and resist compaction. Another factor in some areas is shoreline erosion resulting from wave action which may cause serious problems in maintenance and hamper development of water related facilities.
2-2
h. Resource Analysis (level 1 inventory data) Resource management and land use planning include operation and management in several related fields of endeavor. Some of these include fish and wildlife, vegetative, threatened and endangered, invasive species, ecological setting, and wetlands.
(1) Fish and Wildlife Resources The impoundment of the White River and other tributary streams and rivers which form Table Rock Lake resulted in changes in the composition of the fish populations. Smallmouth bass was the principal game fish found in the White River prior to impoundment. The Missouri Department of Conservation (MDC) is the agency responsible for managing the fishery. Sport fish species currently found in Table Rock Lake include: largemouth bass, spotted bass, smallmouth bass, white bass, walleye, flathead catfish, channel catfish, white crappie, black crappie and paddlefish. Due to the quality and diversity of the fishery, Table Rock Lake serves as a national fishing destination, hosting hundreds of bass tournaments annually. Table Rock Lake was first impounded in 1959. Since its impoundment, the native forests that were flooded in abundance have begun to degrade, thus reducing existing fish and forage habitat. In 2007, the Table Rock Lake National Fish Habitat Initiative (NFHI) began with the primary objective to improve fish habitat within Table Rock Lake. Water quality, along with monitoring the effectiveness and longevity of the structures are additional goals of this project. This project has developed a framework for a broader national habitat program (Casaletto-Water Watch 2012). Since 2007, 2,096 fish habitat structures have been placed in Table Rock Lake. Structures include piles of hardwood and evergreen trees, stumps, and rocks. The impoundment of Table Rock Lake caused environmental changes in the tailwater portion of the White River downstream from the dam. MDC realized that the cold water discharges from Table Rock Lake would necessitate a change in their fisheries management program for Lake Taneycomo, a 2,080 acre lake formed by the construction of Powersite Dam on the White River in Taney County, Missouri. Rainbow trout and brown trout were stocked in Lake Taneycomo to replace the warm-water fishery. This cold-water fishery is a success. However, because of various unfavorable environmental factors such as lack of suitable substrate, fluctuation of water temperatures and dissolved oxygen levels, and pulsation of current and water level, trout reproduction is very limited. Shepherd of the Hills trout hatchery has been established downstream from Table Rock Dam by the Missouri Department of Conservation. Public Law 86-93 provided that 27,000 acre-feet in the power drawdown storage not to exceed 22 cubic feet per second would be for the use of this hatchery. 700,000 rainbow and 10,000 brown trout from Shepherd of the Hills Hatchery and from hatcheries of the U.S. Fish and Wildlife Service are stocked in Taneycomo annually. The trout fishery has flourished and is now Missouri's largest and most popular trout fishing destination. Fishing effort has increased from approximately 25,000 fishing trips in 1959 to 140,000 fishing trips in 2009. Paddlefish and walleye have been introduced into Table Rock Lake to add diversity to the fishery. Natural reproduction of paddlefish in Table Rock Lake is considered minimal. MDC stocks approximately 7,500 paddlefish in the James River Arm each year. Walleye have been stocked by both Arkansas Game and Fish Commission (AGFC) and MDC. MDC has stocked

2-3
over 350,000 walleye in the James River Arm and these fish are now reproducing on their own (Bush 2012). White-tailed deer and eastern wild turkey are common game animals found and hunted in the Table Rock Lake area. Black bear have become more common in the area over the past few years though Missouri has yet to demonstrate that the black bear population is large enough to sustain hunting. The principal small game species found in the Table Rock Lake area in open upland areas include bobwhite quail, cottontail rabbit, and mourning dove. Gray and fox squirrels are common in upland wooded areas and are also popular for sportsmen. Habitat management that includes removal of exotic species and application of prescribed fire do much to benefit these populations. The ringed-neck duck and lesser scaup are the predominant migratory waterfowl species visiting the Table Rock Lake area. Mallard ducks are also present; however, they are only transient visitors as their characteristic feeding habits of obtaining food from shallow waters discourage them from obtaining food from the deep, clear waters of Table Rock Lake. Migratory geese common to the area are lesser snow geese and Canada geese of the Eastern Prairie Population. Giant Canada geese were introduced to the area by the Missouri Department of Conservation in 1971 and 1972 and have become established as a resident population. Resident giant Canada geese are in fact so numerous in several coves that their presence has become a nuisance. Several egg and nest destruction permits are issued every year to limit local reproduction. Ring-billed gulls are seen frequently around the Table Rock Lake area. Greater and lesser yellow legs are also seen during their peak migration in the spring and fall. Table Rock is also one of the few places in Missouri where visitors can see both the turkey vulture and the black vulture at the same time in the winter. Principal furbearing animals found in the Table Rock Lake area are mink, muskrat, beaver, and raccoon. Beaver are so numerous as to be considered a nuisance for dock owners.
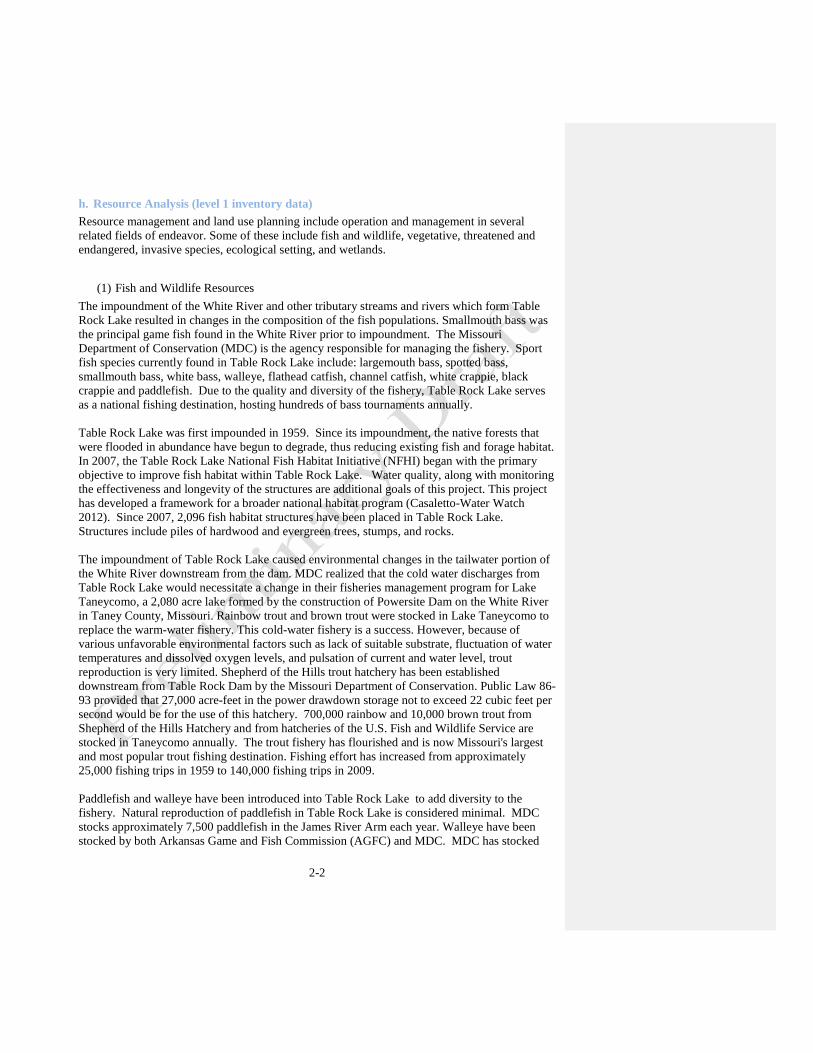
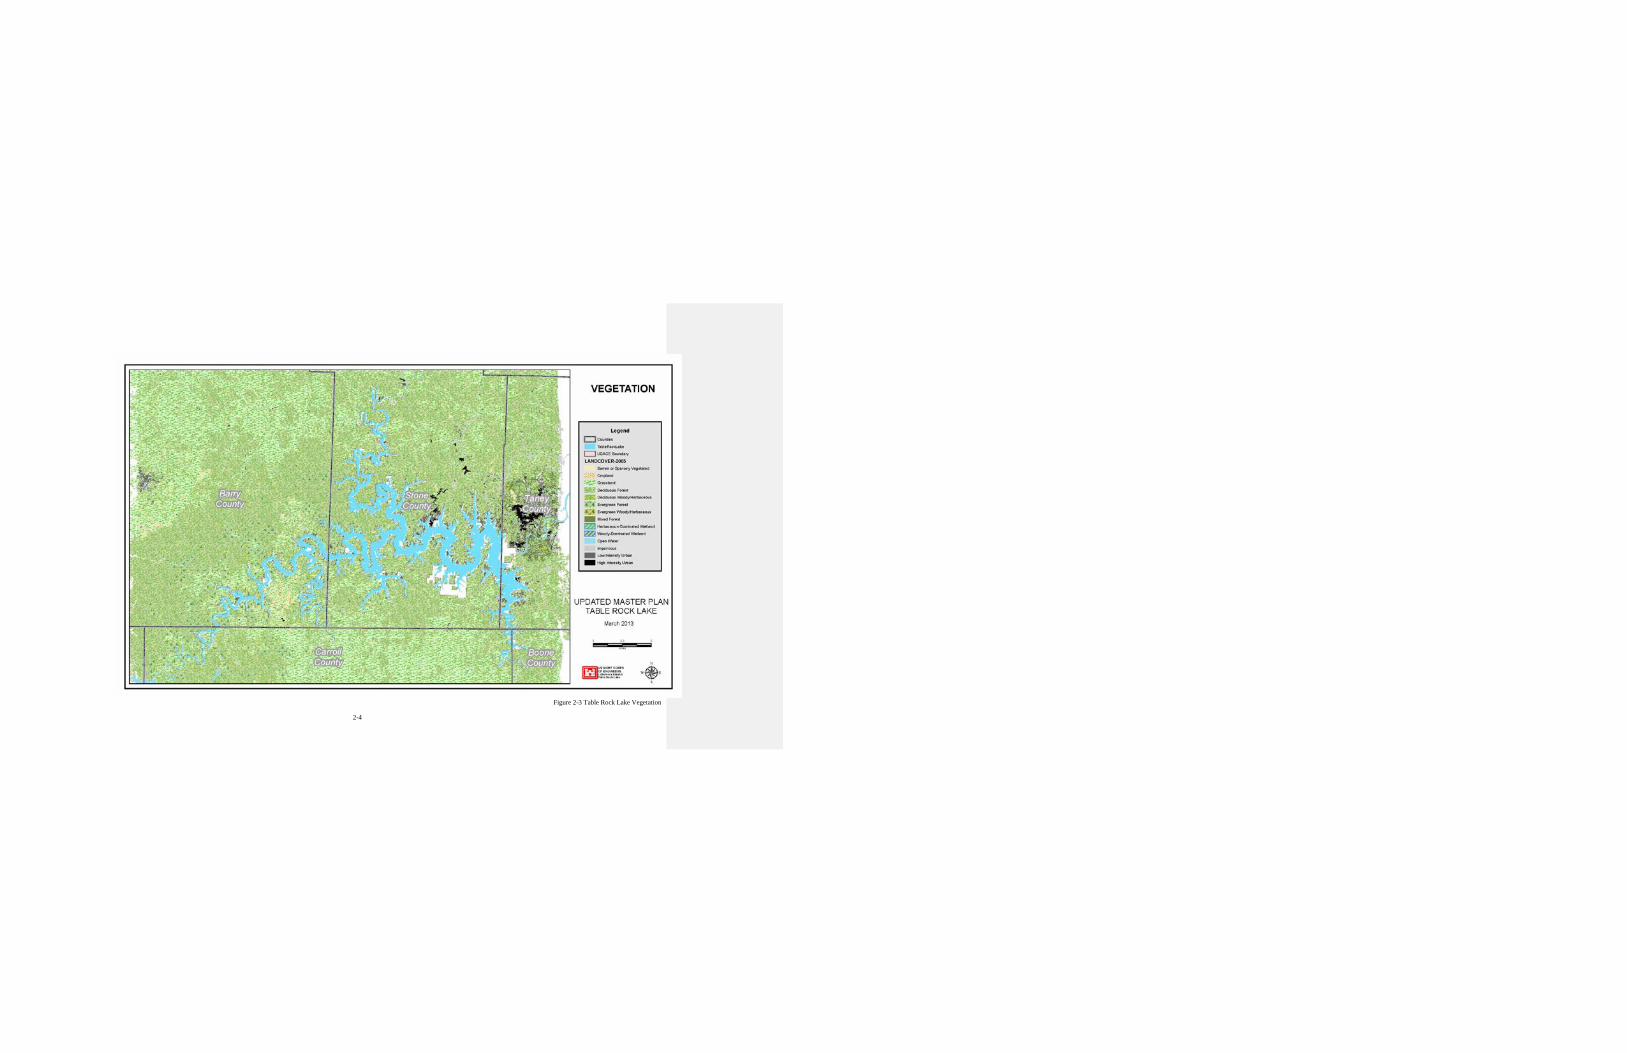
(2) Vegetative Resources The project area surrounding the lake is mostly forested (figure 2-3). Trees and shrubs around the lakeshore include persimmon, honey locust, hawthorn, dogwood, redbud, coralberry, snowberry, sumac, and buttonbush. Frequent periods of inundation keep the thin strip of government owned lands around the lake in early stages of succession. Red cedar, the principal evergreen, is dispersed throughout the region and is found in many large, scattered groups. Ground covers consist of green briar, sedge, and native grasses. In 1999 a large tract of land was exchanged between the Corps of Engineers and the United States Forest Service in the Cow Creek area. The Corps gained a block of land that is approximately 3,300 acres. Land cover types in this area consist mainly of a deciduous forest. Evergreens consist of shortleaf pine that was planted by the U.S. Forest Service along the ridge tops and red cedar in the side slope glades. See figure 2-4 Cow Creek Block Land Cover.
2-4
Figure 2-3 Table Rock Lake Vegetation
2-5
Figure 2-4 Cow Creek Block Vegetation
2-6
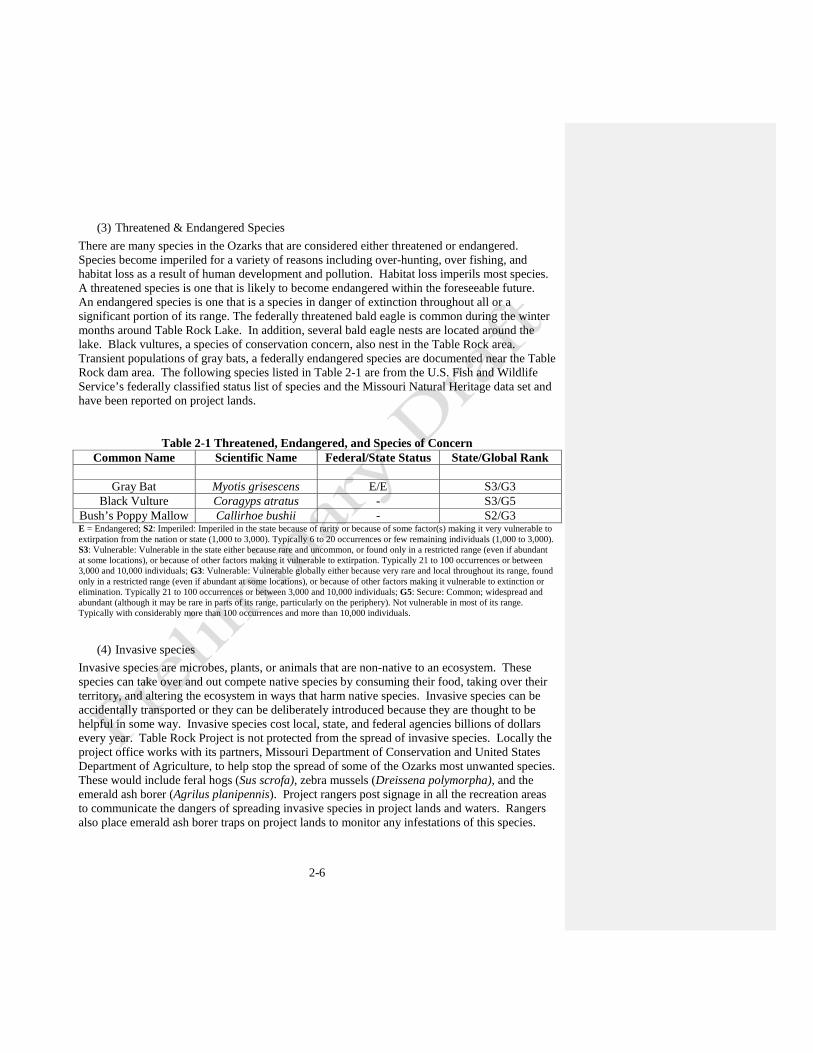
(3) Threatened & Endangered Species There are many species in the Ozarks that are considered either threatened or endangered. Species become imperiled for a variety of reasons including over-hunting, over fishing, and habitat loss as a result of human development and pollution. Habitat loss imperils most species. A threatened species is one that is likely to become endangered within the foreseeable future. An endangered species is one that is a species in danger of extinction throughout all or a significant portion of its range. The federally threatened bald eagle is common during the winter months around Table Rock Lake. In addition, several bald eagle nests are located around the lake. Black vultures, a species of conservation concern, also nest in the Table Rock area. Transient populations of gray bats, a federally endangered species are documented near the Table Rock dam area. The following species listed in Table 2-1 are from the U.S. Fish and Wildlife Service’s federally classified status list of species and the Missouri Natural Heritage data set and have been reported on project lands.
Table 2-1 Threatened, Endangered, and Species of Concern Common Name Scientific Name Federal/State Status State/Global Rank
Gray Bat Myotis grisescens E/E S3/G3
Black Vulture Coragyps atratus - S3/G5 Bush’s Poppy Mallow Callirhoe bushii - S2/G3 E = Endangered; S2: Imperiled: Imperiled in the state because of rarity or because of some factor(s) making it very vulnerable to extirpation from the nation or state (1,000 to 3,000). Typically 6 to 20 occurrences or few remaining individuals (1,000 to 3,000). S3: Vulnerable: Vulnerable in the state either because rare and uncommon, or found only in a restricted range (even if abundant at some locations), or because of other factors making it vulnerable to extirpation. Typically 21 to 100 occurrences or between 3,000 and 10,000 individuals; G3: Vulnerable: Vulnerable globally either because very rare and local throughout its range, found only in a restricted range (even if abundant at some locations), or because of other factors making it vulnerable to extinction or elimination. Typically 21 to 100 occurrences or between 3,000 and 10,000 individuals; G5: Secure: Common; widespread and abundant (although it may be rare in parts of its range, particularly on the periphery). Not vulnerable in most of its range. Typically with considerably more than 100 occurrences and more than 10,000 individuals.
(4) Invasive species Invasive species are microbes, plants, or animals that are non-native to an ecosystem. These species can take over and out compete native species by consuming their food, taking over their territory, and altering the ecosystem in ways that harm native species. Invasive species can be accidentally transported or they can be deliberately introduced because they are thought to be helpful in some way. Invasive species cost local, state, and federal agencies billions of dollars every year. Table Rock Project is not protected from the spread of invasive species. Locally the project office works with its partners, Missouri Department of Conservation and United States Department of Agriculture, to help stop the spread of some of the Ozarks most unwanted species. These would include feral hogs (Sus scrofa), zebra mussels (Dreissena polymorpha), and the emerald ash borer (Agrilus planipennis). Project rangers post signage in all the recreation areas to communicate the dangers of spreading invasive species in project lands and waters. Rangers also place emerald ash borer traps on project lands to monitor any infestations of this species.
2-7
(5) Ecological Setting The Natural Resource Management Mission of the U.S. Army Corps of Engineers (ER 1130-2-550, Chapter 2, Paragraph 2-2.a.(1), dated 15 November 1996) states the following:
“The Army Corps of Engineers is the steward of the lands and waters at Corps water resources projects. Its Natural Resource Management Mission is to manage and conserve those natural resources, consistent with ecosystem management principles, while providing quality public outdoor recreation experiences to serve the needs of present and future generations.
In all aspects of natural and cultural resources management, the Corps promotes awareness of environmental values and adheres to sound environmental stewardship, protection, compliance and restoration practices.
The Corps manages for long-term public access to, and use of, the natural resources in cooperation with other Federal, State, and local agencies as well as the private sector.
The Corps integrates the management of diverse natural resource components such as fish, wildlife, forests, wetlands, grasslands, soil, air, and water with the provision of public recreation opportunities. The Corps conserves natural resources and provides public recreation opportunities that contribute to the quality of American life.” With respect to this mission statement, specifically, “…consistent with ecosystem management principles…”, the following paragraphs address “ecological setting” or “ecoregion”, what ecoregion Table Rock Lake and surrounding areas fall under, and what parameters define the Table Rock Lake ecoregion. Ecoregions are areas with generally similar ecosystems and with similar types, qualities, and quantities of environmental resources. Ecoregion boundaries are determined by examining patterns of vegetation, animal life, geology, soils, water quality, climate, and human land use, as well as other living and non-living ecosystem components. A large area that includes generally similar ecosystems and that has similar types, qualities, and quantities of environmental resources is known as an ecoregion. The purpose of ecological land classification is to provide information for research, assessment, monitoring, and management of ecosystems and ecosystem components. Federal agencies, State agencies, and nongovernmental organizations responsible for different types of resources within the same area use this information to estimate ecosystem productivity, to determine probable responses to land management practices and other ecosystem disturbances, and to address environmental issues over large areas, such as air pollution, forest disease, or threats to biodiversity. The ecoregion Table Rock Lake and surrounding areas fall under is labeled as the “Ozark Highlands”. This ecoregion is defined as follows:
2-8
Location: This region covers a large portion of southern Missouri and northern Arkansas, and small portions of northeastern Oklahoma and southeastern Kansas. Climate: The ecoregion is on the boundary between mild and severe mid-latitude climates, between humid continental and humid subtropical. It has hot summers and mild to severe winters with no pronounced dry season. The mean annual temperature ranges from approximately 12 degrees Celsius to 15 degrees Celsius and the frost-free period ranges from 140 to 230 days. The mean annual precipitation is 1,101 mm (43.4 inches), ranging from 965 to 1,244 mm (38-49 inches). Some snowfall occurs in winter, but lasts only a few days. Vegetation: Oak-hickory and oak-hickory-pine forest stand are typical. Some savannas and tallgrass prairies were once common in the vegetation mosaic. Post oak, blackjack oak, black oak, white oak, hickories, shortleaf pine, little bluestem, Indiangrass, big bluestem, eastern red cedar glades are common in the area. Hydrology: Numerous perennial and intermittent streams flow in the region, of low to moderate gradient, and mostly in a dendritic drainage pattern. There are numerous springs, few lakes, but some sinkhole ponds and several large reservoirs. Terrain: The terrain here is more irregular in physiography than the adjacent regions, with the exception of the Boston Mountains (8.4.6) to the south. Mostly a dissected limestone plateau, the region has karst features, including caves, springs, and spring-fed streams. There are some steep, rocky hills, with elevations ranging from 80 to 560 meters above sea level (masl), and some gently rolling plains. Limestone, chert, sandstone, and shale are common, with some small areas of igneous rocks in the east. Ultisols and Alfisols are typical with mesic and some thermic soil temperature regimes and udic soil moisture regimes. Wildlife: White-tailed deer, coyote, bobcat, beaver, gray bat, wild turkey, eastern bluebird, bobwhite, warblers, collared lizard, many salamanders, and Ozark cavefish occur in the region. Land Use/Human Activities: Less than one-fourth of the core of this region has been cleared for pasture and cropland, but half or more of the periphery, while not as agricultural as bordering ecoregions, is in cropland and pasture. Livestock farming of cattle and hogs, poultry production, pasture and hay are common. Lead and zinc mining occurs. Forestry, recreation, rural residential, urban uses also occurs. There is some public national forest land. Larger towns and cities include Joplin, Springfield, Rolla, Farmington, Eminence, Poplar Bluff, West Plains, Tahlequah, Bentonville, Rogers, Springdale, Berryville, Harrison, Mountain Home, and Batesville.
(6) Wetlands Wetland areas are relatively limited within Table Rock Lake and throughout the adjacent government property surrounding the lake. This is due to the steeply sloped terrain and thin, rocky soil layers overlying bedrock along the shoreline, which do not typically support wetland vegetation. The sparse wetland areas that occur within the lake surface area have mostly formed as mud flats within the upper reaches of the major tributaries to the lake. Additionally, a few
2-9
coves on the lake have also established small wetland areas. This is due to sediment washing from streams and accumulating at the point where the stream bed enters the normal lake surface at the upper end of the cove. These areas can support emergent wetland vegetation at times depending on seasonal flooding and the controlled lake elevation. Within the State of Missouri, The U.S. Fish and Wildlife Service National Wetlands Inventory (NWI) indicates approximately 12 acres of wetlands occurring within the lake surface area and in adjacent floodplains. The NWI maps also indicate wetlands in the Arkansas portion of the lake, but approximate acreages are not included. The majority of this wetland acreage is classified as palustrine scrub/schrub, either seasonally or temporarily flooded. Further, there are some areas mapped as palustrine forested occurring within wooded floodplain areas along the upper reaches of the James River, Kings River, and Long Creek.
i. Cultural Resources
Prehistoric Evidence of human settlement in the Ozark region can be traced back about 14,000 years, coinciding with the end of the last ice age. Early Native Americans in the region were likely a mixture of hunter-gatherers, utilizing caves and bluffs seasonally for shelter near waterways. These nomadic tribes claimed territories, which they would use seasonally for hunting, fishing, and gathering. While the archeological record shows evidence of human settlement in the Ozarks, it is difficult to identify all tribes that made this region their home. Prehistory is primarily divided into four periods: PaleoIndian (10,000-7,800 BC), Archaic (7,800-800 BC), Woodland (800-950 AD), and Mississippian (950-1600 AD). The PaleoIndian period marks the earliest evidence of habitations in the Ozark region. The emergence of the Archaic period witnesses an increase in populations and larger seasonal encampments on the bluffs along the White River, and its tributaries. The introduction of earthen pottery and the bow and arrow is generally recognized as the Woodland Period in the Ozarks. The Mississippian Culture emerges, flourishes, then declines in present-day. Mississippi River Valley and southeastern U.S. Burial mounds, domestic structures, agriculture, and more permanent settlements characterize this era. The Jenkins Cave, located near the head of Bull Creek, and Slow Drip Rockshelter in southern Stone County, contained evidence of a Mississippian component due to the presence of shell-tempered pottery and triangular arrow point. Oral and early written history and archeological evidence suggest some tribes known to have lived or hunted in the Ozarks include the Osage, Caddo, and Quapaw.
Historic Historically, Ozark country of southwestern Missouri and northwestern Arkansas had few, if any, white settlers before the Nineteenth Century. Henry Schoolcraft, the first traveler to document his excursions to the region, traveled this portion of the White and James Rivers in 1818 and 1819 while making a survey of lead mines in southwestern Missouri. The turbulent period of the Civil War was keenly felt in southwestern Missouri and northwestern Arkansas. Two of the major battles west of the Mississippi were fought in this part of the country; one in southwestern Missouri at Wilson's Creek and one in the northwestern corner of Arkansas, the Battle of Pea Ridge.
2-10
The areas surrounding Table Rock have several historical sites that are significant on the local and regional level. None of these sites have National significance. However, when combined with others like them across the country they record the theme of the American way of life. Marvel Cave, which is located at Silver Dollar City, Missouri, the largest privately owned commercial tourist attraction in the Table Rock Lake area, is listed on the National Registry of natural landmarks. In the southern portion of the Ozarks in Eureka Springs, AR, much of the rich cultural heritage lies along an area that was once traversed by Native American people during the Trail of Tears. The Bluff Shelter at Blue Springs, which is listed on the National Register of Historic Places, is a small shelter that has evidence of prehistoric occupation that dates as far back as 8,000 BC. The small town of Beaver, Arkansas has a rich historic significance. Beaver Park, which borders the little community of Beaver, was the home place of Squire Beaver, a legendary resident of the portion of the White River which is now the upper end of Table Rock Lake. Beaver Park is the only project property with any specific historical significance. The Beaver Bridge, which is listed on the National Register of Historic Places and on Table Rock Lake property, survives as one of three wire cable suspension bridges left in Arkansas and as an outstanding example of Early Transportaion Era (1903-1922) engineering. This entire portion of the Ozarks, however, represents a heritage of determined mountain dwellers who adapted to a rough way of life in order to survive. Examples of how dwellers of the Ozarks lived historically can be seen in some of the private tourist attractions within the Table Rock Lake region.
Previous Investigation in the Table Rock Lake Area The waterways are so important archeologically that the major physiographic regions of the state were subdivided by stream drainages to facilitate the survey and excavation of the archeological resources. A survey of the Table Rock Lake area was conducted under the supervision of Carl Chapman, University of Missouri, in 1951, with additional excavations and testing being conducted by Chapman from 1955 through 1959 during the construction phase of Table Rock Dam. At the conclusion of the work in 1959, 872 sites had been identified in and around Table Rock Lake. Subsequent studies include “Archaeological Assessments Report No. 49, Cultural Resources Survey at Selected Locations, Table Rock Lake, Missouri and Arkansas, 1986”; “Archaeological Assessments Report No. 167, Archeological Investigations at 3CR238, 1993”.
Recorded Cultural Resources in the Lake Area Today, Table Rock fee land is home to 1,076 archeological sites made up of open camp sites, shelter and cave sites, rock cairns, and earthen mound sites. Less than 1 percent of the known sites within the lake area were investigated any further than documentation. However, Chapman concluded that a reasonable picture was obtained of the archeological potential in the lake area.
j. Demographics Population and per capita income within the Table Rock Zone of Influence is projected to increase through the year 2040 as shown in Table 2-2. This zone includes the urban areas of Kansas City and St. Louis, Missouri, as well as Tulsa and Oklahoma City, Oklahoma; Little Rock, Arkansas; and Memphis, Tennessee. Other cities of significant size within the zone of

2-11
influence include Springfield, Joplin, Jefferson City, and Columbia, Missouri; Fort Smith, Jonesboro and Pine Bluff, Arkansas; and Muskogee, Oklahoma.
Table 2-2 Population and Income Projections for the Table Rock Lake
Zone of Influence
Year Population Per Capita Income 2000 11,625,921 $25,885 2010 12,719,370 $36,496
2020* 13,470,538 $49,316 2030* 14,385,042 $61,247 2040* 15,299,547 $73,177
*Data for these years are forecasted estimates based on historic rates of growth Data from www.census.gov
The tourism generated by Table Rock and its surrounding attractions is the basis for the economic and population growth of the immediate area of the lake. Population density varies from 9,000 persons per square mile in St. Louis proper to only a few per square mile in many rural counties throughout the zone. Birth and mortality rates do not vary significantly from the average national rates. Population within the zone continues to grow with the most significant growth occurring in the cities. This is due to the younger people moving from rural to urban areas, and workers continuing to move from farming to industrial jobs. Per capita income within the Table Rock Lake Zone of Influence is steadily increasing as it has for the past twenty years. The most rapid economic growth has occurred in Oklahoma where the per capita income increased about 50 percent during the 2000's. All four States within the zone are experiencing more economic contribution by industry. Kansas City and St. Louis, both within the zone are important trading centers for large regions. They rank among the foremost in the nation as grain and cattle markets. Food processing, aerospace, transportation equipment, pet foods, prefab houses, mobile homes, greeting cards, tires, paint, appliances, fuels, and chemical processing are among the major types of manufacturing playing major roles in the economy of the zone. Agriculture makes a substantial contribution to the zone's economy with livestock, dairy, hogs, poultry, soybeans, cotton and rice production among the most influential. Tourism is becoming increasingly important in Arkansas and Missouri with contributions of millions of dollars annually to each State's economy. Public education programs range from some of the worst in the nation to some of the best. All four states within the zone have advanced education programs with numerous state supported colleges and universities. Cultural opportunities vary within the Table Rock Zone of Influence, from Ozark folk culture found throughout northern Arkansas and southern Missouri to professional symphony and ballet companies as well as

2-12
concert facilities, professional sports teams, museums, a world-class American art museum, and other such activities available in Kansas City and St. Louis.
k. Economics TYLER WILL PROVIDE INFO
l. Recreation Facilities, Activities and Needs The recreational resource of the Table Rock Lake is considered to be of great importance to this Ozark Mountain region. The project offers many recreational activities such as swimming, SKUBA diving, boating, water skiing, fishing, picnicking, camping, as well as hiking and biking trails. There are 14 parks on Table Rock Lake presently operated by the Corps of Engineers, 8 of which are operated by the Ozarks Rivers Heritage Foundation through a cooperative agreement. The U.S. Forest Service has developed 1 park which they maintain and operate. 1 State Park is located on Table Rock Lake and it is operated by the Department of Natural Resources. 1 Park is operated by a commercial concessionaire. The criteria discussed in this section are of a basic nature to be used for the planning, development, and management of the project with consideration being given to the latest trends in recreational activities and needs. These criteria furnish guidelines for determining the type and number of facilities needed to satisfy the current and projected demand and also furnishes guidelines for serviceability, operation, and maintenance of facilities. Considerations for the physically handicapped will be included in the design of facilities.
(1) Facility Information The siting of facilities and development of parks should be of the highest quality, should be safe, and should promote the health, welfare, and aesthetic enjoyment of the public. The siting of each facility should result in the compromise between conservation of the natural environment and providing for public use. Only the most adaptable terrain should be used for siting of overall facilities with consideration given to the natural features so that the most scenic parts of the site may remain undeveloped for the enjoyment of visitors. Facility siting should be in harmony as much as feasible with the environment in which they are to be placed to avoid excessive grading and clearing for site preparation.
(2) Recreation Areas Aunts Creek-)This 59 acre park lies on the east shoreline of the Aunts Creek Arm, a tributary of the James River, at the end of Missouri State Highway OO (Plate PM–1). Facilities include a park booth, 56 campsites, 4 picnic sites, 1 showerhouse with restrooms, 2 restrooms, swim beach, playground, group pavilion, 2 launch ramps, 2 courtesy docks, and an RV dump station. Water is supplied by 1 permitted well and sewage is disposed of through a permitted discharging system. Wastewater and sludge is intermittently removed by a contractor. The park is operated through a partnership with the Ozarks Rivers Heritage Foundation.

2-13
Future improvements include: rehabilitation and modernization to campsites 1 – 31 and 32 – 56, including upgrading utilities to 50 amp electric service and water to each site.
Baxter- This 60 acre park is located on the east side of the Big Indian Creek Arm at the end of Missouri State Highway H (Plate PM–2). Facilities include a park booth, 54 campsites, 4 picnic sites, 1 showerhouse with restrooms, 2 restrooms, swim beach, playground, launch ramp, courtesy dock, and an RV dump station. Water is supplied by 1 permitted well and sewage is disposed of through a permitted discharging system. Wastewater and sludge is intermittently removed by a contractor. The park is operated through a partnership with the Ozarks Rivers Heritage Foundation. The park has a commercial marina concessionaire. Future improvements include: Construct 12 new campsites on the southeast side of the park. Beaver Town Campground (Concessionaire)- This 7 acre park is operated by the town of Beaver under long-term contract with the U.S. Army Corps of Engineers and is located in the town of Beaver Arkansas on the White River between Beaver Lake and Table Rock Lake seven miles NW of the Town of Eureka Springs (Plate PM–3). Facilities include a park booth, 44 RV sites, 10 tent sites, 5 picnic sites, 2 shower houses (currently shut down), restrooms, swim beach and swim deck, playground, group pavilion, high and low water launch ramps, and an RV dump station. Water is supplied by one permitted well. A contractor periodically removes waste water and sludge. All sites have potable water and electricity. Fifteen RV sites are full hook up. Future improvements include: Restoration of the swimming beach after the flood of 2010. Improving the walking trail and extending it across the old railroad bridge to Holiday Island to connect with their trail. (Is this Big Indian ?) - (Plate PM–4). Big Bay (USFS)- Big Bay Recreation Area is set in a red cedar and hardwood forest on the shore of Table Rock Lake (Plate PM–17). The facility features; picnicking, vault toilet in picnic area, and a boat ramp with parking area near picnic area. Visitors will need to bring their own water for drinking. Former Campgrounds are closed at this site. Big M- This 97 acre park is located on the north shore of the White River Arm at the end of Missouri State Highway M (Plate PM–5). Facilities include a park booth, 60 campsites, 7 picnic sites, 2 showerhouses with restrooms, 2 restrooms, swim beach, playground, launch ramp, courtesy dock, and an RV dump station. Water is supplied by 1 permitted well, and sewage is disposed of by a non-permitted drip irrigation system. Wastewater and sludge is intermittently removed by a contractor. The park has a commercial marina concessionaire. Future improvements include: rehabilitation and modernization to campsites 1 – 17 and 32 – 46, including upgrading utilities to 50 amp electric service and water to each site.
2-14
Campbell Point- This 110 acre park is located on the north shore of the White River Arm 5 miles east of the town of Shell Knob, Missouri (Plate PM–6). Facilities include a park booth, 76 campsites, 5 picnic sites, 2 showerhouses with restrooms, swim beach, playground, group pavilion, launch ramp, courtesy dock, and an RV dump station. Water is supplied by 2 permitted wells, and sewage is disposed of through a permitted discharging system. Wastewater and sludge is intermittently removed by a contractor. The park is operated through a partnership with the Ozarks Rivers Heritage Foundation. The park has a commercial marina concessionaire. Future improvements include: rehabilitation and modernization to campsites 48 - 75 including upgrading utilities to 50 amp electric service and water to each site. Construct a new road to service the marina, separating marina traffic from the campground. Cape Fair- This 77 acre park is located approximately 1 mile southwest of the town of Cape Fair, Missouri(Plate PM–7) . Facilities include a park booth, 81 campsites, 4 picnic sites, 2 showerhouses with restrooms, 2 restrooms, 2 launch ramps, 2 courtesy docks, swim beach, playground, group pavilion, and RV dump station. Water is supplied by 2 permitted wells, and sewage is disposed of through a permitted discharging system. Wastewater and sludge is intermittently removed by a contractor. The park is operated through a partnership with the Ozarks Rivers Heritage Foundation. The park has a commercial marina concessionaire. Future improvements include: rehabilitation and modernization to campsites 38 - 82, including upgrading utilities to 50 amp electric service and water to each site. Coombs Ferry – (Plate PM-8) Cow Creek – (Plate PM-9) Cricket Creek- This 57 acre park is located on the east shore of the Long Creek Arm of Arkansas (Plate PM–10). Facilities include a park booth, 36 campsites, 6 picnic sites, 1 showerhouse with restrooms, 1 restroom, swim beach, playground, 2 launch ramps, courtesy dock, and RV dump station. Water is supplied by a municipal water source and sewage is removed by contract hauler. The park has a commercial marina concessionaire. Future improvements include: rehabilitation and modernization to campsites 4 - 21, including upgrading utilities to 50 amp electric service and water to each site. Dewey Short Visitor Center and Project Office – (Plate PM-11)

2-15
Eagle Rock- This 45 acre park is located on the north shore of the upper White River arm (Plate PM–12). Facilities include a park booth, 56 campsites, 6 picnic sites, 1 showerhouse with restrooms, 1 restroom, swim beach, playground, launch ramp, courtesy dock, and RV dump station. Water is supplied by a permitted well, and sewage is disposed by lateral field. The park has a commercial marina concessionaire. Future improvements include: rehabilitation and modernization to campsites 1 - 35, including upgrading utilities to 50 amp electric service and water to each site. Construct a group pavilion. Indian Point- This 89 acre park is located on the east shore of the north Indian Creek arm (Plate PM–13). Facilities include a park booth, 78 campsites, a group camp area, 7 picnic sites, 2 showerhouses with restrooms, 2 restrooms, swim beach, playground, group pavilion, launch ramp, courtesy dock, and RV dump station. Water is supplied by 2 permitted wells, and sewage is disposed by drip field irrigation. The park is operated through a partnership with the Ozarks Rivers Heritage Foundation. The park has a commercial marina concessionaire Future improvements include: rehabilitation and modernization to campsites 30 - 47, including upgrading utilities to 50 amp electric service and water to each site. Add an additional showerhouse on the northwest side of the park. Construct new camping loop on east side of park. Joe Bald – (Plate PM-14) Kimberling City/ Port of Kimberling (Concessionaire) This 217 acre park is located in Kimberling City, Missouri (Plate PM–15). The park includes a campground store, 119 campsites, 9 park model cabins, 3 showerhouses with restrooms, 3 pit toilet restrooms, day use area, RV dump station, 2 launch ramps (1 public, 1 customer only), 2 courtesy docks, 2 swimming areas (1 public, 1 customer only), playground area, group pavilion, baseball field, volleyball court, tennis court, basketball court. Water is supplied by 3 permitted wells and sewage is disposed of through two permitted discharge systems as well as periodic sludge removal by a contractor. The park is operated by a concessionaire: Port of Kimberling Marina. The marina consists of 34 docks of varying sizes within the main lease area of varying sizes as well as 13 remote service docks in the Kimberling City Area. Additionally, the marina includes a dry stack storage facility for boats upto 35ft long. Port of Kimberling works with several sub-lessees and offers a full service fuel dock, pump-out facility, ski boat rental, fishing boat rental, pontoon rental, houseboat rental, wave runner rental, ski shop, boat towing service and a floating café. Future improvements include: Expansion of the dry stack facility and modernization of the campground and marina facilities. This expansion has been planned through an Environmental Assessment.
2-16
Kings River – (Plate PM-16) Long Creek- This 57 acre park is located on the east shore of the Long Creek arm (Plate PM–17). Facilities include a park booth, 47 campsites, 6 picnic sites, 1 showerhouse with restrooms, 2 restrooms, swim beach, playground, group pavilion, launch ramp, courtesy dock, and RV dump station. Water is supplied by 1 permitted well, and sewage is disposed of through a permitted discharging system. Wastewater and sludge is intermittently removed by a contractor. The park has a commercial marina concessionaire. Future improvements include: rehabilitation and modernization to campsites 1- 3, 8 – 19, and 29 - 47, including upgrading utilities to 50 amp electric service and water to each site. Mill Creek- This 33 acre park is located on a peninsula on the south side of the lake at the end of State Highway RB in the Kimberling City area (Plate PM–18). Facilities include a park booth, 67 campsites, 3 picnic sites, 1 showerhouse with restrooms, 2 restrooms, swim beach, playground, group pavilion, launch ramp, courtesy dock, and RV dump station. Water is supplied by a municipal water source and sewage is disposed of by 2 separate lateral fields. The park is operated through a partnership with the Ozarks Rivers Heritage Foundation. Future improvements include: construction of a fishing tournament weigh-in station. Moonshine Beach- This 38 acre recreation area is a day use park located north of the Table Rock Dam (Plate PM–19). Facilities include a sand swim beach, 1 showerhouse with restroom, 1 restroom, playground, launch ramp, courtesy dock, multiple shaded picnic shelters with grills, and 1 pavilion. Water and sewer are provided by municipality. The park is operated thru a partnership with the Ozarks Rivers Heritage Foundation. The foundation provides concessions including food, beverage, water toy rentals, umbrellas, and retail merchandise, thru a sublease agreement with Fat Daddy’s Barbeque. Future improvements include: expanding parking facilities, and installing a pavilion on the peninsula. Old Hwy 86- This 57 acre park is located on the west side of the Long Creek Arm of Table Rock Lake at the end of Missouri State Highway UU (Plate PM–20). Facilities include a park booth, 77 campsites, 7 picnic sites, 1 showerhouse with restrooms, 3 restrooms, swim beach, playground, group pavilion, launch ramp, courtesy dock, and RV dump station. Water is supplied by 1 permitted well, and sewage is disposed by drip irrigation field. The park is operated through a partnership with the Ozarks Rivers Heritage Foundation.
2-17
Future improvements include: construction of a new camping loop on the northwest side of the park. Overlook – (Plate PM-21) Peninsula Observation Loop – (Plate PM-22) Table Rock State Park ( Missouri Department of Natural Resources)- This 325-acre park operated by Missouri Department of Natural Resources, Division of State Parks is located on the eastern shore of Table Rock Lake one mile south of Table Rock Dam on Highway 165 (Plate PM–23) . Facilities include: a visitor contact station/park office; covered shelter house; sand volleyball court; 4 lane boat launch ramp; 21 picnic sites; 3 playgrounds; amphitheater for outdoor interpretive programs; two campgrounds with a total 157 campsites consisting of 50-amp and 30-amp campsites with electric/water/sewer and electric only hookups, basic campsites and family campsites with electricity; 3 shower houses with restrooms and laundry; 3 restrooms (one has showers and laundry for marina guests); 2 vault toilets; 2 park residences; 1.5 miles of paved multi-use trail; 1 mile of natural surface hiking trail and 11.75 miles of natural surface hiking/mountain biking trails. The park also has a commercial marina concession operation that has over 600 wet-slips and offers the following services: boat and personal watercraft rentals; scuba diving; para-sailing; sailing catamaran; bike rentals; gas sales; food services; and store. The park’s infrastructure includes 2 permitted wells with a 52,000 gallon storage tank. The wastewater system is a mixture of gravity and force main lines with 4 wastewater lift stations. The wastewater is pumped into Taney County Sewer Districts lift station which is located within our licensed area, and pumped into the city of Hollister for treatment. Future improvements include: upgrading campsites to 50-amp electric/water/sewer and 50-amp electric only; construction of a new gated single entrance to the park and administrative complex; construction of camper cabins in the campgrounds; relocation of the park residence and maintenance compound; and construction of housekeeping cabins. Viney Creek- This 98 acre park is located on the south shore of the White River arm near Golden, MO (Plate PM–24). Facilities include a park booth, 46 campsites, 3 picnic sites, 1 showerhouse with restrooms, 1 restroom, swim beach, playground, launch ramp, courtesy dock, and RV dump station. Water is supplied by a permitted well and sewage is disposed of through a permitted discharging system. Wastewater and sludge is intermittently removed by a contractor. Future improvements include: rehabilitation and modernization to campsites 1- 4, and 29 - 43, including upgrading utilities to 50 amp electric service and water to each site. Construct a group pavilion.
2-18
Viola- This 34 acre park is located on the east shore of the Kings River arm (Plate PM–25). Facilities include a park booth, 53 campsites, 1 showerhouse with restrooms, 2 restrooms, swim beach, playground, launch ramp, courtesy dock, and dump station. Water is supplied by 2 permitted wells and sewage is disposed of by drip irrigation. The park has a commercial marina concessionaire. Future improvements include: rehabilitation and modernization to campsites 1- 9, 25 - 32 and 54 - 58, including upgrading utilities to 50 amp electric service and water to each site.
(3) Future Park Development Area There are currently not any areas that have been designated for future park development. This plan suggests that if future recreation development is needed, this development will be accommodated either within the existing High Density classified land areas or on private property. Engineering and Design Recreational Facility and Customer Service Standards can be referenced in EM1110-1-400 http://publications.usace.army.mil/publications/eng-manuals/EM_1110-1-400_sec/toc.htm
(4) Zones of Influence The Table Rock Lake Zone of Influence has been determined from visitor surveys to include those counties situated with at least 50 percent of their population within 250 highway miles of the lake. The zone includes counties in Missouri, Arkansas, Oklahoma, and Kansas, and reservation data for this counties are shown in Table 2-3. This zone represents the area in which approximately 90 percent of the day-use visitors and 85 percent of the overnight visitors to Table Rock reside. It therefore has a direct influence upon the use of the lake and its parks. Table Rock Lake, its public and commercial facilities, and the scenic qualities of the area are nationally advertised in vacation and sporting publications. The lake is well suited for the types of recreational development for which it is being utilized. Further project development as proposed will not adversely affect the integrity of the resource characteristics. Development plans and management practices will continue to be periodically evaluated to assure proper resource use as well as the validity of planning assumptions utilized in this plan. A number of diverse factors were studied in preparation of this master plan. The following is a discussion of those factors influencing planning and management of Table Rock Lake.
There are 33 other completed Corps of Engineers lakes and 13 river navigation pools offering similar recreational opportunities within 250 highway miles of Table Rock Lake. The total 1974 visits to these projects were 61,221,400. A list of these projects and their 1968 and 1974 visits are shown on Table V-2. Despite this competition, annual visits to Table Rock have increased from 3,931,800 in 1968 to 6,188,100 in 1975. Other Corps of Engineers projects currently authorized or under construction are shown in Table V-3.
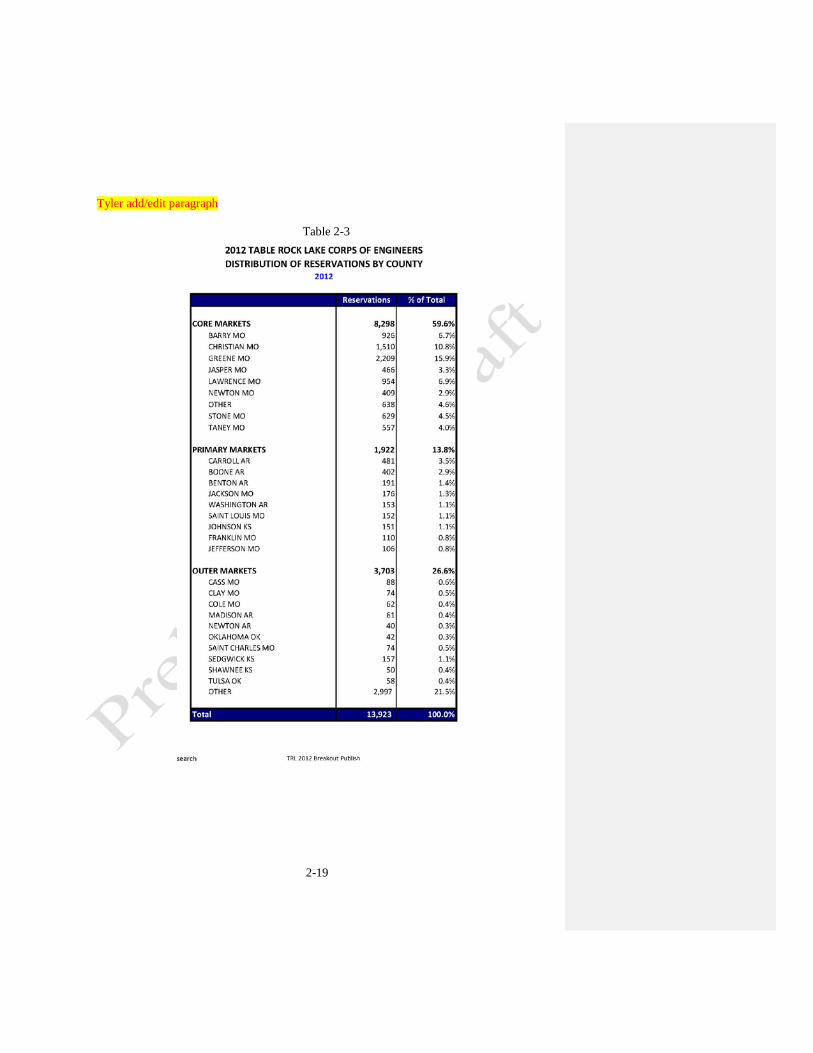
2-19
Tyler add/edit paragraph
Table 2-3
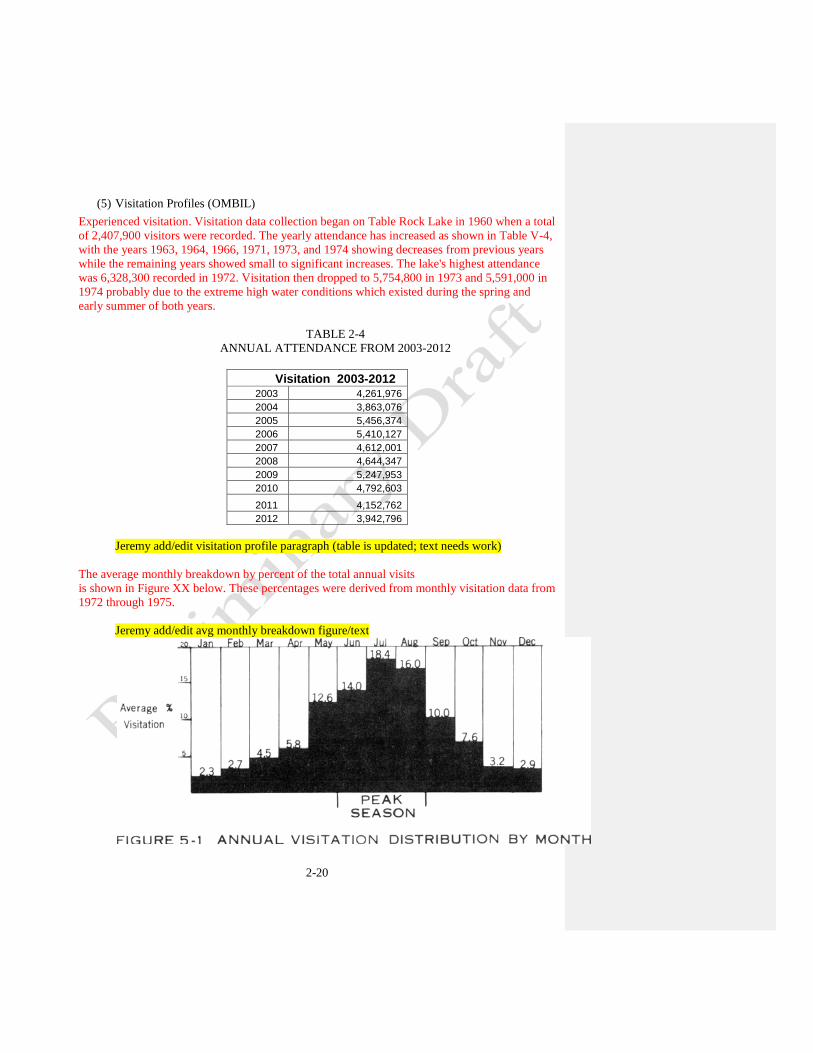
2-20
(5) Visitation Profiles (OMBIL) Experienced visitation. Visitation data collection began on Table Rock Lake in 1960 when a total of 2,407,900 visitors were recorded. The yearly attendance has increased as shown in Table V-4, with the years 1963, 1964, 1966, 1971, 1973, and 1974 showing decreases from previous years while the remaining years showed small to significant increases. The lake's highest attendance was 6,328,300 recorded in 1972. Visitation then dropped to 5,754,800 in 1973 and 5,591,000 in 1974 probably due to the extreme high water conditions which existed during the spring and early summer of both years.
TABLE 2-4
ANNUAL ATTENDANCE FROM 2003-2012
Visitation 2003-2012 2003 4,261,976 2004 3,863,076 2005 5,456,374 2006 5,410,127 2007 4,612,001 2008 4,644,347 2009 5,247,953 2010 4,792,603
2011 4,152,762 2012 3,942,796
Jeremy add/edit visitation profile paragraph (table is updated; text needs work)
The average monthly breakdown by percent of the total annual visits is shown in Figure XX below. These percentages were derived from monthly visitation data from 1972 through 1975.
Jeremy add/edit avg monthly breakdown figure/text
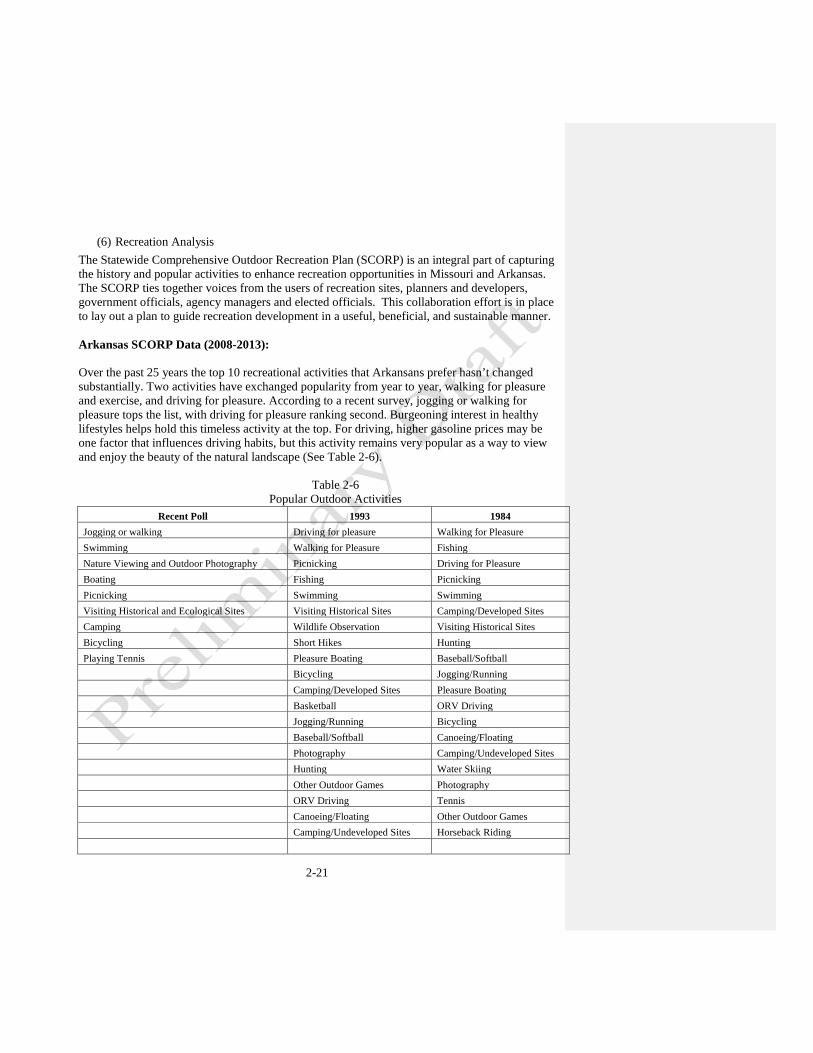
2-21
(6) Recreation Analysis The Statewide Comprehensive Outdoor Recreation Plan (SCORP) is an integral part of capturing the history and popular activities to enhance recreation opportunities in Missouri and Arkansas. The SCORP ties together voices from the users of recreation sites, planners and developers, government officials, agency managers and elected officials. This collaboration effort is in place to lay out a plan to guide recreation development in a useful, beneficial, and sustainable manner. Arkansas SCORP Data (2008-2013): Over the past 25 years the top 10 recreational activities that Arkansans prefer hasn’t changed substantially. Two activities have exchanged popularity from year to year, walking for pleasure and exercise, and driving for pleasure. According to a recent survey, jogging or walking for pleasure tops the list, with driving for pleasure ranking second. Burgeoning interest in healthy lifestyles helps hold this timeless activity at the top. For driving, higher gasoline prices may be one factor that influences driving habits, but this activity remains very popular as a way to view and enjoy the beauty of the natural landscape (See Table 2-6).
Table 2-6
Popular Outdoor Activities Recent Poll 1993 1984
Jogging or walking Driving for pleasure Walking for Pleasure Swimming Walking for Pleasure Fishing Nature Viewing and Outdoor Photography Picnicking Driving for Pleasure Boating Fishing Picnicking Picnicking Swimming Swimming Visiting Historical and Ecological Sites Visiting Historical Sites Camping/Developed Sites Camping Wildlife Observation Visiting Historical Sites Bicycling Short Hikes Hunting Playing Tennis Pleasure Boating Baseball/Softball Bicycling Jogging/Running Camping/Developed Sites Pleasure Boating Basketball ORV Driving Jogging/Running Bicycling Baseball/Softball Canoeing/Floating Photography Camping/Undeveloped Sites Hunting Water Skiing Other Outdoor Games Photography ORV Driving Tennis Canoeing/Floating Other Outdoor Games Camping/Undeveloped Sites Horseback Riding
2-22
Along with walking and driving, other core interests involve access to water (swimming, boating), or common leisure time gatherings (picnics and camping). People often use trails as part of their activities, especially for bicycling, walking, hiking or nature viewing and photography, which makes trails an important type of facility in terms of planning for outdoor recreation. Access to parks, trails and other facilities is primarily through automobiles and roadways. With the steady interest in driving for pleasure (or total demand increasing with population growth), and general access by car to most sites, the public roadways are becoming ever more important to the broader functioning of recreational sites and facilities.
For a copy of the entire Arkansas SCORP it can be found at: http://www.recpro.org/assets/Library/SCORPs/ar_scorp_2009.pdf
Missouri SCORP Data (2013-2017):
A telephone survey of Missouri residents was conducted in July 2011. A total of 768 surveys were completed, half in urban and half in rural regions of the state, providing a 95% (+/- 5%)confidence interval for each. Results were combined and weighted based on the 70%/30% urban/rural ratio of the state’s population. The survey focused on residents who had participated in outdoor recreation at a public facility at least once in the past year; those who had not participated in the past year were screened out of the survey.
Availability of Outdoor Recreation Available Activities Residents are satisfied with the availability of outdoor recreation activities in Missouri overall, and more than a third are very satisfied. They are less satisfied, however, with the availability of organized and supervised outdoor recreation programs and only one in five residents are “very satisfied.” In particular, residents who are not satisfied with programs want more opportunities for walking, biking and youth related activities. Available Facilities Most Missourians are satisfied with the number and availability of outdoor recreation facilities in the state, but those who are not satisfied want more walking trails, water parks/pools and parks. One in ten Missourians has limited access to sidewalks, and more than half of those residents would use sidewalks if they were available in their neighborhoods. Young Americans 41nationwide expressed similar desires for sidewalks during President Obama’s America’s Great Outdoors (AGO) Initiative, suggesting that communities use sidewalks and pathways to link neighborhoods to parks and green spaces. Missouri residents who visit certain types of facilities at least once a year say more of those are needed -- gardens, trails, outdoor swimming pools, camping sites, outdoor aquatic complexes, target shooting sites, ATV/ORV riding areas, outdoor basketball courts, tennis courts and Frisbee golf courses.

2-23
Popularity of Outdoor Recreation Popular Activities The most popular outdoor recreation activity among Missourians is walking – more than a third of residents walk daily. More than one in five Missourians enjoy daily gardening, wildlife observation/birding and dog walking. Most Missouri residents walk for recreation, join in outdoor family gatherings, drive for sightseeing, visit local parks and garden at least once a year. More than half enjoy picnicking, outdoor swimming, visiting historic/education sites, wildlife observation/birding, fishing and boating at least annually .Walking, bicycling, baseball and golf are more popular among urban residents while rural Missourians are more likely to be fishing, boating, target shooting, hunting and ATV riding. Table 2-7 lists the most popular activities from the Missouri SCORP Data.
Popular Facilities Walkable streets/sidewalks, local parks, gardens, fishing sites and outdoor swimming pools are the most popular facilities used by Missourians at least monthly. More than one in five residents visit playgrounds, lakes, trails, boat access sites, rivers, picnic areas and historic/education sites at least once a month. Three out of four Missourians use local parks and walkable streets/ sidewalks at least once a year. More than half of Missourians visit historic/education sites, lakes, gardens, picnic areas, and/or state parks annually or more often. A recent national study showed that people place a greater priority on having sidewalks and places to take walks than on living within walking distance of specific places in a community, such as stores and restaurants. Not surprisingly, urban residents are more likely to use walkable streets/ sidewalks and local parks while rural residents are more likely to use fishing sites, lakes and rivers.
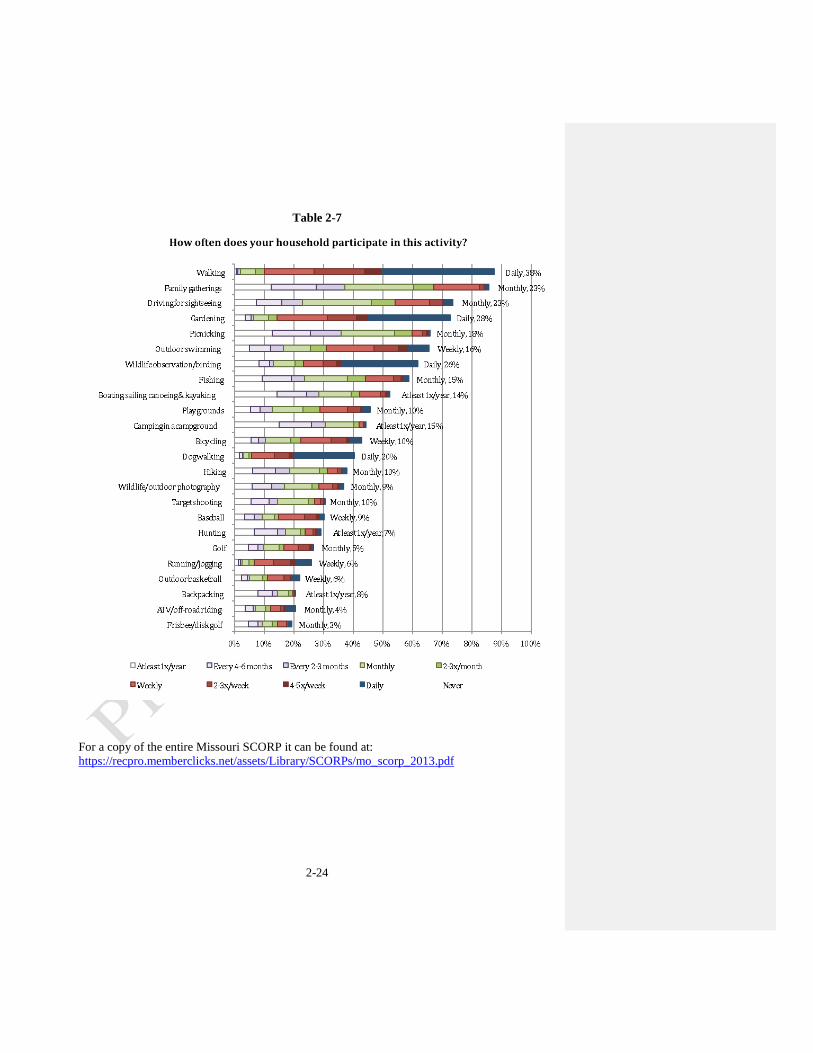
2-24
Table 2-7
For a copy of the entire Missouri SCORP it can be found at: https://recpro.memberclicks.net/assets/Library/SCORPs/mo_scorp_2013.pdf
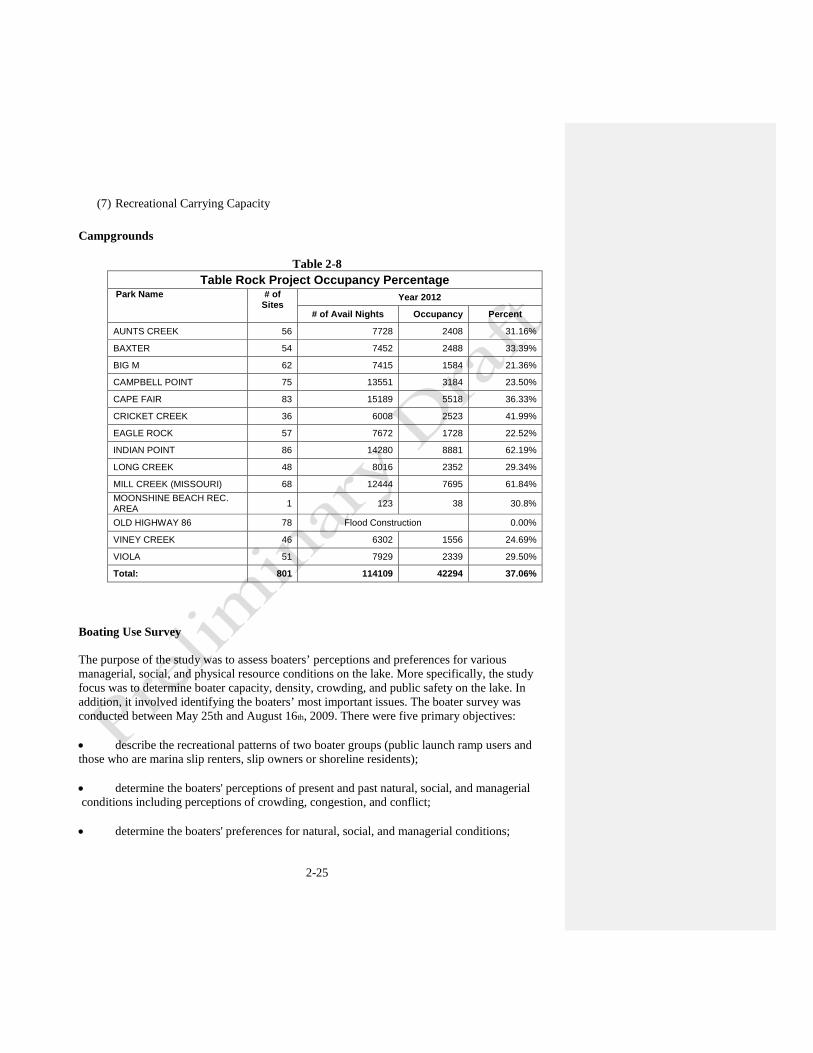
2-25
(7) Recreational Carrying Capacity Campgrounds
Table 2-8 Table Rock Project Occupancy Percentage
Park Name # of Sites
Year 2012
# of Avail Nights Occupancy Percent
AUNTS CREEK 56 7728 2408 31.16%
BAXTER 54 7452 2488 33.39%
BIG M 62 7415 1584 21.36%
CAMPBELL POINT 75 13551 3184 23.50%
CAPE FAIR 83 15189 5518 36.33%
CRICKET CREEK 36 6008 2523 41.99%
EAGLE ROCK 57 7672 1728 22.52%
INDIAN POINT 86 14280 8881 62.19%
LONG CREEK 48 8016 2352 29.34%
MILL CREEK (MISSOURI) 68 12444 7695 61.84% MOONSHINE BEACH REC. AREA 1 123 38 30.8%
OLD HIGHWAY 86 78 Flood Construction 0.00%
VINEY CREEK 46 6302 1556 24.69%
VIOLA 51 7929 2339 29.50%
Total: 801 114109 42294 37.06%
Boating Use Survey The purpose of the study was to assess boaters’ perceptions and preferences for various managerial, social, and physical resource conditions on the lake. More specifically, the study focus was to determine boater capacity, density, crowding, and public safety on the lake. In addition, it involved identifying the boaters’ most important issues. The boater survey was conducted between May 25th and August 16th, 2009. There were five primary objectives: • describe the recreational patterns of two boater groups (public launch ramp users and those who are marina slip renters, slip owners or shoreline residents); • determine the boaters' perceptions of present and past natural, social, and managerial conditions including perceptions of crowding, congestion, and conflict; • determine the boaters' preferences for natural, social, and managerial conditions;

2-26
• quantify the amount and character of recreational boating use occurring during the primary boating season, and; • test and refine the inventory procedures developed at other lakes. Key Findings The primary finding of this boating conflict classification study is that Table Rock Lake should be managed for priority management compartments and zones which contain Class I or Class II management compartment classifications (see Figures 2- 5 and 2-6 ) indicating higher conflict/density. These compartments are priority concerns for safety as validated by the higher accident/incident rates found in Class I and Class II management compartments as opposed to those represented by other classes. When viewing the management compartment classification maps for the 20 to 100% projected increases in average number of boats, it appears that, at a 60% increase in boats above the number of boats counted in this study, there is a threshold of crossing nearly half of Table Rock Lake’s management compartments as being a Class I designation for density/conflict. Therefore, management should strive to conserve use levels to prevent these levels from exceeding this threshold. Without this type of management strategy, opportunities for other classes of experience on the lake will be eliminated and those boaters looking to fish, swim, or relax quietly will likely be displaced elsewhere to seek out their recreational experiences. Problematic areas identified as areas to avoid and that are unsafe by boaters in these Class I compartments include Kimberling City, the dam area, the main channel, the state park, and Aunt’s Creek among others. To mitigate the negative attributes cited by boaters for why they avoid those locations, management will need to consider increasing law enforcement strategies to curb unsafe boating behavior, illegal behaviors associated with alcohol consumption, enforce or post speed limits, and remove debris hazards from the water. Class II management compartments were, generally, highly variable in their density and conflict levels. These management compartments such as Joe Bald, Lower White, Shell Knob- Campbell Point, Central White, and Holiday Island should be examined more closely to determine the cause of conflicts. For example, although Holiday Island had very low density, conflict levels were high. The reason for the high conflicts in this management compartment is related to the developed, resort setting of this small wooded island where activities such as smaller craft rentals are commonly conflicting with other boat traffic. Visitors also cited crowding and boat traffic as primary reasons for avoiding the unsafe locations mentioned above. Social condition strategies to reduce crowding/density may include reducing parking, slips, leases, or concessions or other development near the above locations on the lake. Other strategies to mitigate the above social impacts that could be considered include dispersion strategies or temporary closures of areas to rehabilitate the resource and redirect traffic to other locations. Despite having some select areas where boaters are raising safety and crowding concerns, the majority of boaters perceived that the ramps and lake were moderately to extremely safe.
2-27
Therefore, the overall condition of law enforcement and regulations appear to be effective in providing perceptions of Table Rock Lake as a safe lake to boat. In fact, many of the respondents listed the increased patrols and law enforcement as being very beneficial to their experience. Mail-back survey respondents appear to be more sensitive than ramp users to social impacts as indicated by their relatively higher ratings of crowding and concerns for safety. In fact, the majority of mail-back survey respondents responded that the lake was at least moderately crowded to extremely crowded. Perhaps these boaters have more of a sense of ownership or investment in the resource both physically and financially causing them to perceive impacts more than ramp users. Overall, crowding perceptions were lower than expected by the researchers of this study. The moderate crowding scores among ramp users are likely related to the fact that most ramp boaters on Table Rock Lake are in groups of three to four people already and come to TRL for the social setting and experience of watching other boaters, many of whom they might already know since local, regular boaters comprised the majority of the ramp user sample. The comments to open-ended questions made by ramp users included multiple references to more “bigger boats” suggesting some negative concerns for the larger pontoon boats on TRL. Boats on Table Rock Lake did average to be longer (19.4 feet for ramp and 23.4 for mail-back survey respondents). Therefore, with a further increase in larger boats on the lake an increase in these negative concerns may heighten among those with smaller boats. Many negative references were made about the unsafe behavior of jet skiers (PWCs) as reported in their additional comments. Many boaters also noted negative changes in the resource such as increased traffic and dirtier water. Positive changes listed in the comments included better fishing, docks, cleaner water, less garbage and increased law enforcement. Thus, management appears to have been effective at cleaning up the area and providing an increased presence. With cruising being the primary activity of both ramp and mail-back survey respondents, it heightens the potential for future conflict and safety concerns since an increasing number of moving boats are always more intrusive and of more risk to swimmers, skiers, and fishermen. Furthermore, with mail-back survey respondents listing their secondary activity as relaxing, this group may be more sensitive to louder boats and the sheer number of boats as an interruption of this activity. The high frequency of swimming on the lake among both ramp users and mail-back survey respondents suggests that water quality is high on the list of concerns but many perceptions were that water quality has been improving well and appears to be a lot cleaner than it once was. However, many respondents also mentioned a decrease in water quality so there appears to be a split decision on the improvement of water quality. Some locations were much more important to boaters such as Cape Fair, Cow Creek, Aunt’s Creek, and Long Creek. Ramp users and mail-back survey respondents, as a majority, cited close, familiar, solitude, relaxing, good fishing, good facilities, and calm water and scenery, as the primary reasons that they visited their favorite location. To manage for these qualities, it appears that these favorite locations should contain low speed or no wake zones to allow for calmer water, better fishing, and quieter solitude for relaxing.

2-28
A number of comments were made about the need to improve facilities; however, many boaters also listed negative concerns about increasing developments on the shoreline. The survey data indicated that some additional boat ramps, campgrounds, and parking areas should be considered but it does not support other substantial developments, such as marinas. The results of inferential statistics in this study indicate that perceptions of crowding are correlated with the need for more facilities such as boat ramps, parking and marinas. This finding indicates that the development of more adequate facilities could decrease perceptions of crowding among TRL boaters. This may be particularly true for those boating on cabin cruisers who preferred additional marinas. Fishermen appear to be significantly opposed to additional developments such as building more boat ramps. Crowding perceptions correlated with perceptions of safety indicating that increasing use could increase perceptions of danger among boaters conducting their recreational activities on TRL. Based on the above key findings, the researchers of this study recommend the following to USACE management: 1. Preventing a substantial (i.e., 60%) increase in existing use levels; 2. Preserving opportunities to escape existing heavy boat traffic and high wakes; and 3. Reducing conflicts through increased and improved boater education, on-water law enforcement and patrol, and by limiting density levels through dispersion or allocation strategies.
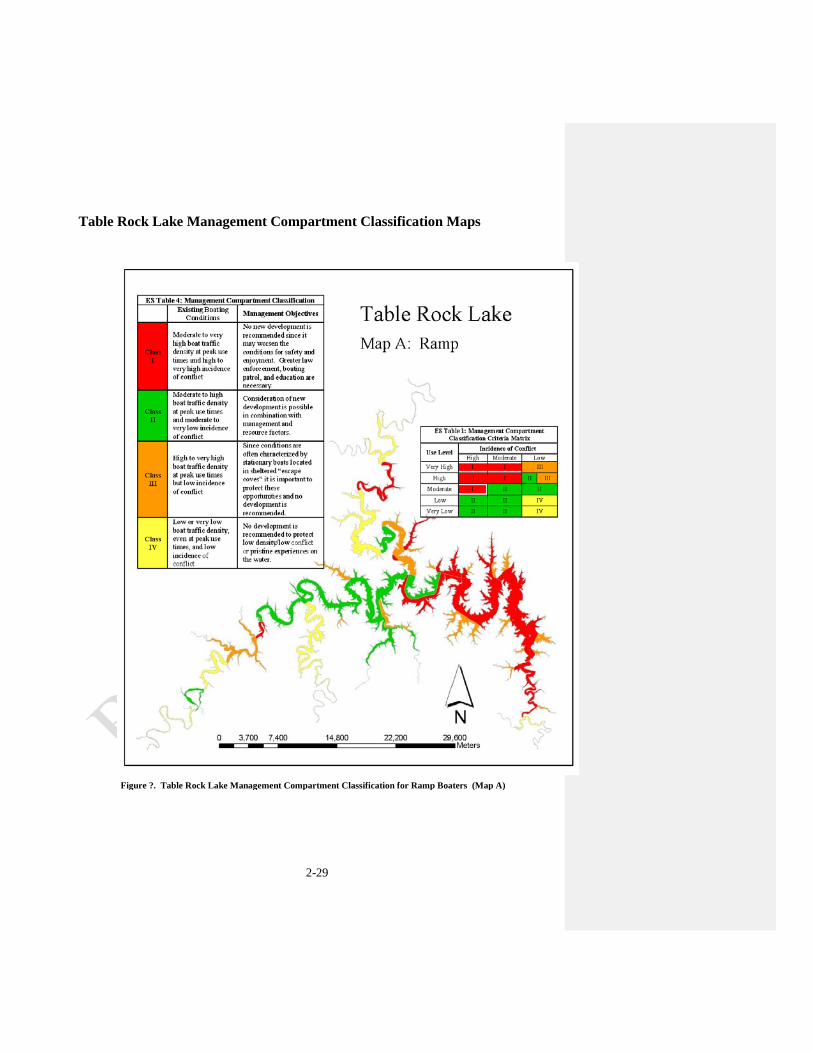
2-29
Table Rock Lake Management Compartment Classification Maps
Figure ?. Table Rock Lake Management Compartment Classification for Ramp Boaters (Map A)
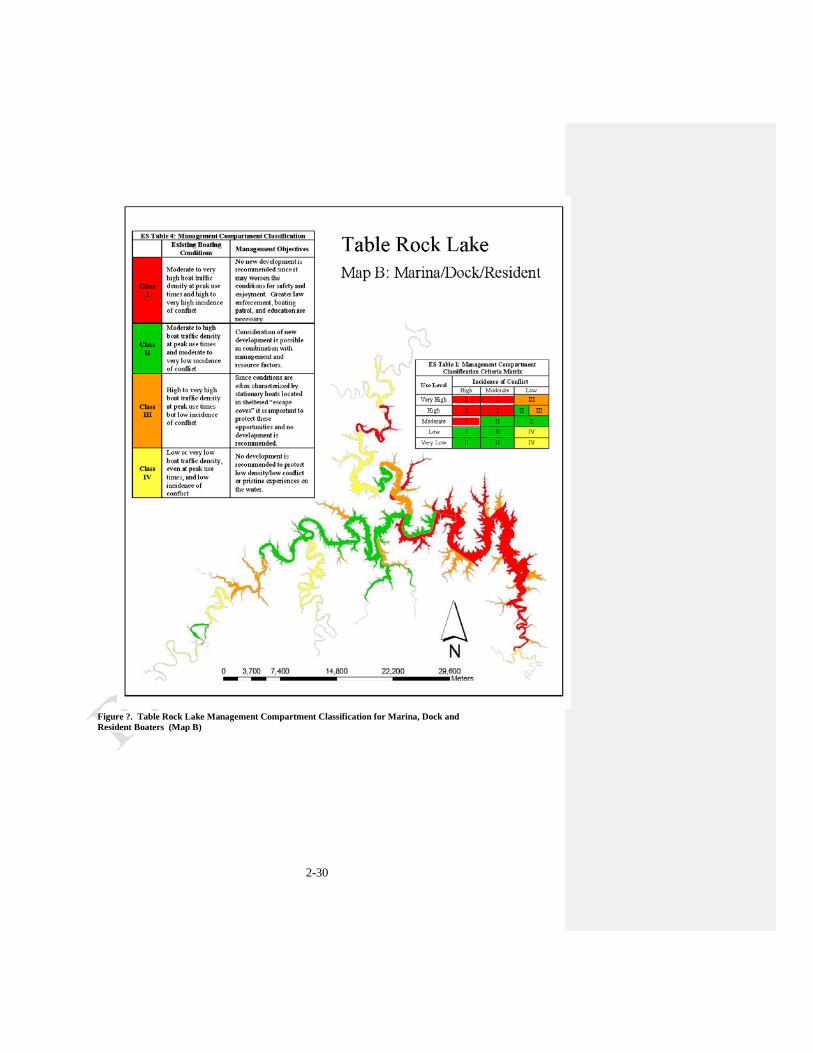
2-30
Figure ?. Table Rock Lake Management Compartment Classification for Marina, Dock and Resident Boaters (Map B)
2-31
m. Real Estate
(1) Acquisition Policy The Flood Control Act of June 28, 1938 (Public Law No. 76, 75th Congress, 3rd Session) approved a comprehensive plan for flood control and other purposes in the White River Basin. This comprehensive plan was modified by the Flood Control Act of August 18, 1941 (Public Law 228, 77th Congress, 1st Session). A Design Memorandum was completed identifying all land and interests in land that would be necessary for the operation, maintenance and control of the reservoir. This report identified the “guide” elevation 936-foot contour necessary for this project. The authorized acquisition for land was to a minimum elevation of 923’ msl. It was further identified that lands would be purchased by blocked out lines in increments of 5 and 2 ½ acre tracts along regular sectional subdivision breakdowns to encompass the guide contour for fee acquisition. In areas where the blocked-out line did not encompass lands needed for occasional flooding (elevation 936), an additional flowage easement was acquired between the fee acquisition line and elevation 936’ msl. Additionally, areas were identified above elevation 936 for acquisition of lands to account for islands, inaccessible lands, steep ravines and bluffs and up to elevation 945 near the upstream reservoir limits, along with additional lands identified for public use and access areas. Acquisition by “blocking out” was authorized within the 1953 “Real Estate Land Acquisition Policy for Civil Works Projects,” as revised. The Real Estate Design Memorandum outlining all lands identified above was submitted and approved through our Division Offices to Headquarters.
(2) Management and Disposal Policy The Real Estate Management and Disposal program for Table Rock is administered by the Little Rock District Real Estate Division in accordance with all applicable laws, regulations, and policies. All requests for action must be received via a written request made to the Table Rock Lake Operations Manager, who makes a recommendation through the Little Rock District Chief or Operations to the Chief of Real Estate.
n. Pertinent Public Laws Application of Public Laws. Development and management of Federal reservoirs are regulated by a number of statutes and guided by USACE documents. The following sections provide a summary of the relevant policies and Federal statutes. Recreation The policies and public laws listed below address development and management of recreational facilities on public lands and are pertinent to the Table Rock Lake project. PL 78-534, Flood Control Act of 1944 (22 December 1944), authorized the Chief of Engineers to provide facilities in reservoir areas for public use, including recreation and
2-32
conservation of fish and wildlife. PL 79-526, Flood Control Act of 1946 (24 July 1946), amends PL 78-534 to include authority to grant leases to nonprofit organizations at recreational facilities in reservoir areas at reduced or nominal charges. PL 83-780, Flood Control Act of 1954 (3 September 1954), further amends PL 78-534 and authorizes the Secretary of the Army to grant leases to Federal, State, or governmental agencies without monetary considerations for use and occupation of land and water areas under the jurisdiction of the Department of the Army for park and recreational purposes when in the public interest. PL 87-874, Flood Control Act of 1962, broadened the authority under PL 78-534 to include all water resource projects. Joint Land Acquisition Policy for Reservoir Projects (Federal Register, Volume 27, 22 February 1962) allows the Department of the Army to acquire additional lands necessary for the realization of potential outdoor recreational resources of a reservoir. PL 88-578, Land and Water Conservation Fund Act of 1965 (1 September 1964), prescribes conditions under which USACE may charge for admission and use of its recreational areas. PL 89-72, Federal Water Project Recreation Act of 1965 (9 July 1965), requires sharing of financial responsibilities in joint Federal and non-Federal recreational and fish and wildlife resources with no more than half of the cost borne by the Federal Government. PL 90-480, Architectural Barriers Act of 1968 (12 August 1968), as amended, requires access for persons with disabilities to facilities designed, built, altered, or leased with Federal funds. PL 101-336, Americans with Disabilities Act of 1990 (ADA) (26 July 1990), as amended by the ADA Amendments Act of 2008 (PL 110-325), prohibits discrimination based on disabilities in, among others, the area of public accommodations and requires reasonable accommodation for persons with disabilities. PL 102-580, Water Resources Development Act of 1992 (31 October 1992), authorizes the USACE to accept contributions of funds, materials, and services from non-Federal public and private entities to be used in managing recreational facilities and natural resources. PL 103-66, Omnibus Budget Reconciliation Act–Day Use Fees (10 August 1993), authorized the USACE to collect fees for the use of developed recreational sites and facilities, including campsites, swimming beaches, and boat ramps. PL 104-333, Omnibus Parks and Public Lands Management Act of 1996 (12 November 1996), created an advisory commission to review the current and anticipated demand for recreational opportunities at lakes and reservoirs managed by the Federal Government and to develop alternatives to enhance the opportunities for such use by the public. Water Resource Protection and Flood Risk Management A number of public laws address water resources protection and flood risk management and integration of these goals with other Project purposes such as recreation. The following are pertinent to Table Rock Lake. PL 75-761, Flood Control Act of 1938 (28 June 1938), authorizes the construction of civil engineering projects such as dams, levees, dikes, and other flood risk management measures through the USACE. PL 77-228, Flood Control Act of 1941(18 August 1941), amended the Flood Control Act of 1938 and appropriated $24M to support construction of multiple-purpose reservoir projects in the White River Basin.
2-33
PL 78-534, Flood Control Act of 1944 (22 December 1944), specifies the rights and interests of the states in water resources development and requires cooperation and consultation with State agencies in planning for flood risk management. PL 79-14, Rivers and Harbors Act of 1945 specifies the rights and interests of the states in watershed development and water utilization and control, and the requirements for cooperation with state agencies in planning for flood control and navigation improvements. PL 85-500, Water Supply Act of 1958 (3 July 1958), authorizes the USACE to include municipal and industrial water supply storage in multiple-purpose reservoir projects. PL 87-88, Federal Water Pollution Control Act Amendments of 1961 (20 July 1961), requires Federal agencies to address the potential for pollution of interstate or navigable waters when planning a reservoir project. PL 89-80, Water Resources Planning Act of 1965 (22 July 1965), provides for the optimum development of the Nation’s natural resources through coordinated planning of water and related land resources. It provides authority for the establishment of a water resources council and river basin commission. PL 89-298, Flood Control Act of 1965 (27 October 1965), authorizes the Secretary of the Army to design and construct navigation, flood risk management, and shore protection projects if the cost of any single project does not exceed $10 million. PL 92-500, Federal Water Pollution Control Act (Clean Water Act) (October 18, 1972) Establishes a national goal of eliminating all discharges into U.S. waters by 1985 and an interim goal of making the waters safe for fish, shellfish, wildlife and people by July 1, 1983. Also provides that in the planning of any Corps reservoir consideration shall be given to inclusion of storage for regulation of streamflow. PL 95-217, Clean Water Act of 1977 (15 December 1977), amends PL 87-88 and requires the Environmental Protection Agency (EPA) to enter into written agreements with the Secretaries of Agriculture, the Army, and the Interior to provide maximum utilization of the laws and programs to maintain water quality. PL 99-662, Water Resource Development Act of 1986 (17 November 1986), establishes cost sharing formulas for the construction of harbors, inland waterway transportation, and flood risk management projects. Fish and Wildlife Resources A number of public laws address protection and maintenance of fish and wildlife resources. The following are pertinent to the Table Rock Lake project: PL 79-732, Fish and Wildlife Coordination Act (10 March 1934), provides authority for making project lands available for management by interested State agencies for wildlife purposes. Title 16 U.S. Code (U.S.C.) §§ 668-668a-d, Bald and Golden Eagle Protection Act of 1940 (8 June 1940) as amended, prohibits anyone, without a permit issued by the Secretary of the Interior, from taking bald eagles (Haliaeetus leucocephalus), including their nests or eggs. PL 85-624, Fish and Wildlife Coordination Act (12 August 1958), states that fish and wildlife conservation will receive equal consideration with other project purposes and be coordinated with other features of water resources development programs. The Federal Water Project Recreation Act of 1965 (PL 89-72) requires consideration of opportunities for fish and wildlife enhancement in planning water resources projects. Non-Federal bodies are encouraged to operate and maintain the project fish and wildlife enhancement facilities. If non-Federal bodies agree in writing to administer the facilities at their expense, the
2-34
fish and wildlife benefits are included in the project benefits and project cost allocated to fish and wildlife. Fees may be charged by the non-Federal bodies to repay their costs. If non-Federal bodies do not so agree, no facilities for fish and wildlife may be provided. PL 91-190, National Environmental Policy Act of 1969 (NEPA) (1 January 1970), establishes a broad Federal policy on environmental quality stating that the Federal government will assure for all Americans safe, healthful, productive, and aesthetically and culturally pleasing surroundings, and preserve important historic, cultural, and natural aspects of our national heritage. PL 93-205, Conservation, Protection, and Propagation of Endangered Species (28 December 1973), requires that Federal agencies will, in consultation with the U.S. Fish and Wildlife Service (USFWS), further conservation of endangered and threatened species and ensure that their actions are not likely to jeopardize such species or destroy or modify their critical habitat. PL 95-632, Endangered Species Act Amendments of 1978 (10 November 1978), specifies a consultation process between Federal agencies and the Secretaries of the Interior, Commerce, or Agriculture for carrying out programs for the conservation of endangered and threatened species. PL 101-233, North American Wetland Conservation Act (13 December 1989), directs the conservation of North America wetland ecosystems and requires agencies to manage their lands for wetland/waterfowl purposes to the extent consistent with missions. PL 106-147, Neo-tropical Migratory Bird Conservation Act (20 July 2000) promotes the conservation of habitat for neo-tropical migratory birds. Forest Resources The following law pertains to management of forested lands and is pertinent to the Table Rock Lake project: PL 86-717, Conservation of Forest Land Act of 1960 (6 September 1960), provides for the protection of forest cover in reservoir areas and specifies that reservoir areas of projects developed for flood risk management or other purposes that are owned in fee and under the jurisdiction of the Secretary of the Army and the Chief of Engineers will be developed and maintained so as to encourage, promote, and ensure fully adequate and dependable future resources of readily available timber through sustained yield programs, reforestation, and accepted conservation practices. Cultural Resources A number of public laws mandate protection of cultural resources on public lands. The following are pertinent to USACE project lands at the Table Rock Lake project: PL 59-209, Antiquities Act of 1906 (8 June 1906), applies to the appropriation or destruction of antiquities on federally owned or controlled lands and has served as the precedent for subsequent legislation. PL 74-292, Historic Sites Act of 1935 (21 August 1935), declares that it is a national policy to preserve for public use historic sites, buildings, and objects of national significance for the inspiration and benefit of the people of the United States. PL 86-523, Reservoir Salvage Act of 1960 (27 June 1960), provides for the preservation of historical and archaeological data that might otherwise be lost as the result of the construction of a dam and attendant facilities and activities.
2-35
PL 89-665, National Historic Preservation Act of 1966 (NHPA) (15 October 1966), establishes a national policy of preserving, restoring, and maintaining cultural resources. It requires Federal agencies to take into account the effect an action may have on sites that may be eligible for inclusion on the National Register of Historic Places. PL 93-291, Archaeological and Historic Preservation Act of 1974 (24 May 1974), amends PL 86-523 and provides for the Secretary of Interior to coordinate all Federal survey and recovery activities authorized under this expansion of the Reservoir Salvage Act of 1960. The Federal construction agency may expend up to 1 percent of project funds on cultural resource surveys. PL 96-95, Archaeological Resources Protection Act of 1979 (31 October 1979), updates PL 59-209 and protects archaeological resources and sites on public lands and fosters increased cooperation and exchange of information among governmental authorities, the professional archaeological community, and private individuals. PL 101-601, Native American Graves Protection and Repatriation Act (16 November 1990), requires Federal agencies to return Native American human remains and cultural items, including funerary objects and sacred objects, to their respective peoples. Leases, Easements, and Rights-of-Way A number of laws and regulations govern the granting of leases, easements, and rights-of-way on Federal lands. The following are pertinent to USACE project lands at the Table Rock Lake project: 16 U.S.C. § 663, Impoundment or Diversion of Waters (10 March 1934), for wildlife resources management in accordance with the approved general plan. 10 U.S.C. § 2667, Leases: Non-excess Property of Military Departments and Defense Agencies (10 August 1956), authorizes the lease of land at water resource projects for any commercial or private purpose not inconsistent with other authorized project purposes. U.S.C. Titles 10, 16, 30, 32, and 43 address easements and licenses for project lands; 16 U.S.C. § 460d authorizes use of public lands for any public purpose, including fish and wildlife, if it is in the public interest. 16 U.S.C. §§ 470h-3, Lease or Exchange of Historic Property (15 October 1966), for historic properties. PL 91-646, Uniform Relocation Assistance and Real Property Acquisition Policies Act of 1970 (2 January 1971), establishes a uniform policy for fair and equitable treatment of persons displaced as a result of Federal or federally assisted programs. PL 94-579, Federal Land Policy and Management Act of 1976 (21 October 1976) establishes a policy that the Federal Government receives fair market value for the use of the public lands and their resources unless otherwise provided for by statute. Provides for the inventory of public land and land use planning. It also establishes the extent to which the executive branch may withdraw lands without legislative action.
3-1
Chapter 3 Goals and Objectives
a. The Table Rock Lake Master Plan Revision Vision Statement The Table Rock Master Plan Revision Project Delivery Team (PDT) developed the following vision statement to help guide the process of revising the Table Rock Lake Master Plan: “Balanced public use of the lake while sustaining the natural, cultural, and socio-economic resources of the area.”
b. Policy and Master Plan Revision Schedule Corps Master Plan guidance is contained in ER 1130-2-550, Recreation Operations and Maintenance Guidance and Procedures, dated 15 November 1996 (including Change 7, dated 30 January 2013) and EP 1130-2-550, Recreation Operations and Maintenance Guidance and Procedures, dated 15 November 1996 (including Change 5, dated 30 January 2013). The Table Rock Master Plan Revision began in June 2012 and the process was divided by the PDT into five phases: Phase 1 – Initiate Master Plan Revision Process. (June – December 2012)
1. Internal PDT coordination. a. Educate PDT/District Leadership/Vertical Team on Master Plans and
proposed process b. Develop PMP (update as needed) c. Assign PDT Roles/Responsibilities and begin developing MP background
information, MP outline/format and GIS database and Mapping needs. d. Id and engage Vertical Team. Develop appropriate IPR schedule.
2. Scope and evaluate NEPA requirements (EA/EIS/Cat Excl.) and develop/approve
sequence and timing of implementation. Incorporate decisions into PMP.
3. Develop Communication Plan. Incorporate into PMP. a. Email/mailing distribution list—options for contracting if we send a
general initiation postcard out. Email is preferred method for distribution for updates.
b. Web page (coordination of info among PDT, reviewed and posted by PAO)
3-2
c. Other Social Media (Facebook, Twitter, etc)—District has FB page; PAO can add project specific new releases and MP updates to this page
d. News release and newsletter (by mail, computer and direct distribution). e. Correspondence to agency partners, stakeholders and political interests.
4. Data Inventory.
a. ID data needed or required
5. Scoping Workshops a. Educate public on what a master plan is (it is not a SMP or OMP)—
30,000 ft view. Include this information in public notices about scoping workshops, on website page, on any social media
b. Agency, Partner, Stakeholder scoping workshops. c. Conduct public orientation/input/scoping workshops.
6. Public Comment period. Collect comments. Comment analysis—develop scoping report.
Phase 2 – Develop Draft Master Plan. (January-July 2013) 1. Initiate Chapter Development (Chapters 1 and 2) 2. Scoping Report—take information from this and ‘digest’—what is the
public telling us? 3. Formulate Chapter 3, 4, 5, 6, 7, 8, and 9. 4. DQC draft document 5. Conduct In Progress Reviews with Vertical Team. 6. News release and newsletter about draft Master Plan public review and
input. 7. Correspondence to key partners and political interests explaining draft MP
with their comments from scoping. 8. Conduct agency workshop(s) explaining draft MP with their comments
from scoping. 9. Conduct Partners and stakeholders workshop(s) explaining draft MP with
their comments from scoping. 10. Conduct public workshop(s) explaining draft MP with their comments
from scoping.
Phase 3 – Develop Final Master Plan. (August-September 2013) 1. Address Vertical Team, DQC, and ATR, comments. 2. Address agency, partner, stakeholder and public comments. 3. Conduct agency/partner/stakeholder workshops explaining final MP and
what happens next. 4. Conduct public workshops explaining final MP and what happens next.
Phase 4 – Receive approval of Final Master Plan.(October-November 2013) 1. Coordinate plan internally for approval. 2. Send out correspondence to key partners/stakeholders and political
interests about final plan approval.
3-3
3. Do news releases/newsletter about final plan approval—also explain what happens next.
4. Distribute hard copies and/or CD’s of approved Master Plan Update to appropriate offices, partners and stakeholders. Make approved plan available at Corps websites.
Phase 5—Implement Final Master Plan (December 2013)
1. Supplements as necessary. 2. Plan for next revision in 2018.
c. Goals and Objectives
(1) Goals Goals are defined in this context as methods of achieving a prescription of an overall land use management plan, resource objectives, and associated design and management concepts. Surface water zoning at Table Rock Lake will also be included in this master plan revision. From the master plan guidance ER and EP, there are five goals for a Master Plan: GOAL A. Provide the best management practices to respond to regional needs, resource capabilities and suitabilities, and expressed public interests consistent with authorized project purposes. GOAL B. Protect and manage project natural and cultural resources through sustainable environmental stewardship programs. GOAL C. Provide public outdoor recreation opportunities that support project purposes and public demands created by the project itself while sustaining project natural resources. GOAL D. Recognize the particular qualities, characteristics, and potentials of the project. GOAL E. Provide consistency and compatibility with national objectives and other State and regional goals and programs.
(2) Resource Objectives Resource objectives are defined in the context as clearly written statements that respond to identified issues and that specify the desirable and attainable goals for resource development and/or management for the lands and waters under the jurisdiction of the Little Rock District, Table Rock Lake Project Office AOR. The objectives stated in this Master Plan support the goals of the Master Plan, Environmental Operating Principles (EOPs), and applicable national performance measures. They are consistent with authorized project purposes, Federal laws and directives, regional needs, resource capabilities, and take public input into consideration.

3-4
Recreational and natural resources carrying capacities are also accounted for during development of the objectives found in this Master Plan. Both the Missouri and Arkansas State Comprehensive Outdoor Recreation Plans (SCORP) were considered as well. The objectives in this master plan to the best extent possible aim to maximize project benefits, meet public needs, and foster environmental sustainability for Table Rock Lake. Recreational Objectives
• Evaluate the demand for improved and increased public access to and on Corps-managed public lands and water for recreational activities (i.e. camping, walking, hiking, biking, boating, hunting, fishing, wildlife viewing, etc.) and facilities (i.e. campsites, picnic facilities, overlooks, all types of trails, boat ramps, courtesy docks, interpretive signs/exhibits, and parking lots). Goal A, C
• Measure current public use levels (i.e. boat traffic) and evaluate impacts from overuse and crowding regarding boat congestion. Goal A, C
• Evaluate recreational use zoning and regulations for designated quiet water or no-wake areas with emphasis on natural resource protection, quality recreational opportunities, and public safety concerns. Goal A
• Follow the Environmental Operating Principles associated with recreational use of waterways for all water-based management activities and plans. Goal B, C, E
• Increase ADA compliant facilities on Table Rock Lake. Goal A, C, E • Evaluate demand for commercial facilities on public lands and waters. Goal A, C • Evaluate established private exclusive use of public lands through permits/outgrants to
determine impacts on public lands and waters. Goal A, C • Consider flood/conservation pool to address potential impact to recreational facilities (i.e.
campsites, docks, etc.). Goal A, B, C, D • Ensure consistency with USACE Recreation Strategic Plan. Goal E • Reference the Missouri Statewide Comprehensive Outdoor Recreation Plan (SCORP)
and the Arkansas Statewide Comprehensive Outdoor Recreation Plan to ensure consistency in achieving recreation goals. Goal E
Natural Resource Management Objectives
• Consider flood/conservation pool levels to optimize habitat conditions, as long as there is no interference with the Project’s other authorized purposes, i.e. flood risk management. Goal A, B, D
• Enhance management and conservation of fish and wildlife resources, especially endangered species. Goal A, B, D, E
• Consider watershed approach during decision-making process. Goal E • Optimize resources, labor, and funds for protection and restoration of fish and wildlife
habitats. Goal B, E • Minimize activities which disturb the scenic beauty or aesthetics of the lake. Goal A, B,
C, D • Evaluate erosion control and sedimentation issues at Table Rock Lake. Goal A, B, E • Identify and protect unique or sensitive habitat areas. Goal A, B, D, E
Stop unauthorized uses of public lands such as agricultural trespass, timber theft, unpermitted docks and other structures, clearing of vegetation, unauthorized roadways,

3-5
off-road vehicle (ORV) use, trash dumping, poaching, and placement of advertising signs that create negative environmental impacts. Goal A, B, C, D, E
Environmental Compliance Objectives
• Improve the lake’s water quality to sustain healthy fish and wildlife populations, habitat conditions, recreation opportunities, and avoid negative effects to public water supply, ensuring public health and safety. Goal A, B, C, D, E
• Consider both point and non-point sources of water quality problems during decision making. Goal A, B, D, E
• Improve coordination, communication, and cooperation between regulating agencies and non-governmental organizations to resolve and/or mitigate environmental problems. Goal A, B, D, E
• Ensure compliance with Environmental Review Guide for Operations (ERGO) at all Table Rock Lake recreational facilities. Goal A, B, E
Visitor Information and Education Objectives
• Provide more opportunities (i.e. town hall meetings) for communication between agencies, special interest groups, and the general public. Goal A, D, E
• Implement more educational and outreach programs on the lake. Topics to include water quality, history, cultural resources, water safety, recreation, nature, and ecology. Goal A, B, C, D, E
• Establish a network among local, state, and federal agencies concerning the exchange of lake-related information for public education and management purposes. Goal A, D, E
• Increase public awareness of special use permits or other authorizations required for special activities, organized special events, and commercial activities on public lands and waters of the lake. Goal A, B, C
• Capture trends concerning boating accidents and other incidents on public lands and waters and coordinate data collection with other public safety officials. Goal A, C, D, E
• Promote Corps Water Safety message. Goal A, C, D, E • Educate adjacent landowners on difference between shoreline cleanup policies and
vegetation modification. Goal A, B, C, D, E Economic Impacts Objectives
• Balance economic and environmental interests involving Table Rock Lake. Goal A, B, C, D, E
• Evaluate the type and extent of additional commercial/industrial development that may be sustained on public lands. Goal A, B, C, D, E
• Work with local communities to promote tourism and recreational use of the lake to favorably impact socioeconomic conditions surrounding the lake. Goal A, B, C, D, E
General Management Objectives
• Resurvey and maintain the public lands boundary lines to ensure it is clearly marked and recognized in all areas. Goal A, B, D
• Secure sustainable funding for the shoreline management program. Goal A, B, C, D, E
3-6
• Ensure consistency with USACE Campaign Plan (national level), IPlan (regional level), OPlan (District level). Goal E
• Reference Recreation Adjustment Plan if funding levels change in future years. Goal E • Ensure consistency with Executive Order 13148, ‘Greening the Government Through
Leadership in Environmental Management’ (21 April 2000). Goal E • Ensure consistency with Executive Orders 13423 and 13514, ‘Strengthening Federal
Environmental, Energy, and Transportation Management (24 January 2007) and ‘Federal Leadership in Environmental, Energy, and Economic Performance (5 October 2009), respectively, to guarantee compliance with Leadership in Energy and Environmental Design (LEED) criteria for government facilities. Goal E
Cultural Resources Management Objectives
• Monitor and better coordinate lake development and the protection of cultural resources with State Historic Preservation Offices and federally recognized Tribes. Goal A, B, D, E
• Complete an inventory of cultural resources. Goal A, B, D, E • Increase public awareness and education of regional history. Goal B, D, E • Maintain full compliance with Section 106 and 110 of the National Historic Preservation
Act; the Archeological Resources Protection Act; and the Native American Graves Protection and Repatriation Act on public lands surrounding the lake. Goal B, D, E
• Stop unauthorized use of public lands as it pertains to the illegal excavation and removal of cultural resources. Goal B, D, E
4-1
Chapter 4 Land Allocation, Land Classification, Water Surface, and Project Easement Lands
Table Rock Lake is a multipurpose project constructed primarily for flood control and generation of hydroelectric power. Recreation is a third resource created by the impounding of water, but utilization and management of this resource must not conflict with the regulation of the lake for the two primary purposes for which it was authorized. The principal concept in planning Table Rock Lake was for public use and benefit. This concept has been implemented, and first among priorities for public use are stringent standards for public health, safety and sanitation. The plan of development considers these standards in land use allocations and in planning for the recreational activities associated with the project. To provide the greatest possible recreational/outdoor experience, safeguards have been implemented over the use of Government-owned land adjacent to the lakeshore. At Table Rock Lake, much of the shoreline is being retained in its rugged, natural state. Forest management practices are implemented to maintain existing vegetation in a healthy state while juvenile plant material is being planted to revegetate open spaces. Ownership of land adjacent to Government-owned land is not considered sufficient reason to allow the adjacent owner to have private and exclusive access to the lake across Government-owned land. To satisfy the public demand for access to the lake, access roads and docks of quasi-public nature are permitted provided that the nature and extent of these facilities may be considered supplying a demand that is in harmony with the overall development of the lake and not in conflict with management practices as determined by the District Engineer. The existing lands required for project operation purposes and recreation have been indicated on the land classification Plates (LC-1 through LC-25) The lands described in the various designations throughout the lake are very similar in general characteristics of soil, topography, and vegetative cover typical of the foothills of the Ozark Mountains. Project lands total 65,604 acres which include 3,050 acres in the stream bed, 2,896 acres of easement lands, and 1,835 acres of flooded U.S. Forest Service lands. The easement lands lie above or landward of the fee acquisition line but below the 936 elevation and are indicated by the brown color on the land use maps. The easement lands are under private ownership and the Corps of Engineers has only the right to flood these lands. Lands specifically required for the operation of the project total 52,705 acres, which include the fee and easement lands, lands below the flood control pool, and 405 acres of land for the dam and appurtenant works. The remaining lands are allocated for recreation use and for the preservation of natural resources. All lands in the Table Rock Lake project are classified as project operations lands acquired and allocated to provide for safe, efficient operation of the project. Project operations lands reserved for recreational purposes and lands reserved for preservation of natural resources are indicated by color coding on the land use maps. Land use allocations are discussed as follows:
4-2
a. Land Allocation. Lands are allocated by their congressionally authorized purposes for
which the project lands were acquired. There are four land allocation categories applicable to Corps projects:
(1) Operations. These are the lands acquired for the congressionally authorized purpose of constructing and operating the project. Most project lands are included in this allocation.
(2) Recreation. These lands were acquired specifically for the congressionally authorized purpose of recreation. These lands are referred to as separable recreation lands. Lands in this allocation can only be given a land classification of “Recreation”.
(3) Fish and Wildlife. These lands were acquired specifically for the congressionally authorized purpose of fish and wildlife management. These lands are referred to as separable fish and wildlife lands. Lands in this allocation can only be given a land classification of “Wildlife Management”.
(4) Mitigation. These lands were acquired specifically for the congressionally authorized purpose of offsetting losses associated with development of the project. These lands are referred to as separable mitigation lands. Lands in this allocation can only be given a land classification of “Mitigation”.
b. Land Classification. Land classification designates the primary use for which project lands are managed. Project lands are zoned for development and resource management consistent with authorized project purposes and the provisions of the National Environmental Policy Act (NEPA) and other Federal laws.
(1) Project Operations. This category includes those lands required for the dam, spillway, switchyard, levees, dikes, offices, maintenance facilities, and other areas that are used solely for the operation of the project.
(2) High Density Recreation. Lands developed for intensive recreational activities for the visiting public including day use areas and/or campgrounds. These could include areas for concessions (marinas, comprehensive resorts, etc), and quasi-public development.
(3) Mitigation. This classification will only be used for lands with an allocation of Mitigation and that were acquired specifically for the purposes of offsetting losses associated with development of the project.
(4) Environmentally Sensitive Areas. Areas where scientific, ecological, cultural or aesthetic features have been identified. Designation of these lands is not limited to just lands that are otherwise protected by laws such as the Endangered Species Act, the National Historic Preservation Act or applicable State statues. These areas must be considered by management to ensure they are not adversely impacted. Typically, limited or no development of public use is allowed on these lands. No agricultural or grazing uses are permitted on these lands unless
4-3
necessary for a specific resource management benefit, such as prairie restoration. These areas are typically distinct parcels located within another, and perhaps larger, land classification, area.
(5) Multiple Resource Management Lands. This classification allows for the designation
of a predominate use as described below, with the understanding that other compatible uses described below may also occur on these lands. (e.g. a trail through an area designated as Wildlife Management.) Land classification maps must reflect the predominant sub-classification, rather than just Multiple Resource Management.
(a) Low Density Recreation. Lands with minimal development or infrastructure that support passive public recreational use (e.g. primitive camping, fishing, hunting, trails, wildlife viewing, etc.)
(b) Wildlife Management. Lands designated for stewardship of fish and wildlife resources.
(c) Vegetative Management. Lands designated for stewardship of forest, prairie, and other native vegetative cover.
(d) Future/ Inactive Recreation Areas. Areas with site characteristics compatible with potential future recreational development or recreation areas that are closed. Until there is an opportunity to develop or reopen these areas, they will be managed for multiple resources.
(6) Water Surface. If the project administers a surface water zoning program, then it should be included in the Master Plan.
(a) Restricted. Water areas restricted for project operations, safety, and security purposes.
(b) Designated No-Wake. To protect environmentally sensitive shoreline areas, recreational water access areas from disturbance, and for public safety.
(c) Fish and Wildlife Sanctuary. Annual or seasonal restrictions on areas to protect fish and wildlife species during periods of migration, resting, feeding, nesting, and/or spawning.
(d) Open Recreation. Those waters available for year round or seasonal water-based recreational use.
c. Project Easement Lands. All lands for which the Corps holds an easement interest, but not a fee title. Planned use and management of easement lands will be in strict accordance with the terms and conditions of the easement estate acquired for the project. Easements were acquired for specific purposes and do not convey the same rights or ownership to the Corps as other lands.
(1) Operations Easement. Corps retains rights to these lands necessary for project operations

4-4
(2) Flowage Easement. Corps retains the right to inundate these lands for project
operations. (3) Conservation Easement. Corps retains rights to lands for aesthetic, recreation and
environmental benefits.
5-1
Chapter 5 Resource Plan (1) Classification and Justification (a) Resource Objectives (b) Acreages (c) Description of use by classification (2) Land Classification map showing management agency(ies) (3) Recreation area map (bubble diagrams showing location of existing , proposed and future development needs) Classification and Justification Project Operations land classification includes those lands required for the dam, spillway, switchyard, levees, dikes, offices, maintenance facilities, and other areas that are used solely for the operation of the project. Justification: On Table Rock the lands classified as Project Operations have been classified by definition. Areas adjacent to the dam, auxiliary spillway, maintenance compound, Lake Taneycomo below the dam, and storage areas have remained project operations. Lands previously classified as project operations near Baird Mountain have been reclassified to wildlife management to meet project needs and future goals. (Acreage = 232) High Density Recreation land classification is for those lands intended to be developed or are currently developed for intensive recreational activities for the visiting public including day use areas and/or campgrounds. These could include areas for commercial concessions (marinas, comprehensive resorts, etc.), and quasi-public development. Justification: On Table Rock the lands classified as high density recreation in this Revised Master Plan are by-in-large lands that were similarly classified in the previous Master Plan as supplemented. These include lands classified for existing and future recreation use areas, as detailed in Chapter 4, as well as, lands for the White River Landing (Showboat Branson Belle). Additional lands added to this classification in this revision includes lands adjacent to those existing comprehensive resorts, located on the adjoining private property, where the resorts contain more than 200 overnight rental units and the current usage of the resort dock facility currently offer fuel and a convenience store services to their bona-fide overnight guests. We have received complaints from the public and the concessionaires because these facilities are unable to offer services to the general public, even though they appear to be a full service marina. The intended purpose of the revised classification for these resorts is to allow these resorts to apply for conversion to a full service commercial concession (marina) lease. (Acreage = 1914) Mitigation land classification allows for lands with an allocation of Mitigation and that were acquired specifically for the purposes of offsetting losses associated with development of the project. There are currently no lands classified as mitigation land at the Table Rock project. Environmentally Sensitive Area land classification is for those land areas where scientific, ecological, cultural or aesthetic features have been identified. Designation of these lands is not
5-2
limited to just lands that are otherwise protected by laws such as the Endangered Species Act, the National Historic Preservation Act or applicable State statutes. These areas must be considered by management to ensure they are not adversely impacted. Typically, limited or no development of public use is allowed on these lands. No agricultural or grazing uses are permitted on these lands unless necessary for a specific resource management benefit, such as prairie restoration. There areas are typically distinct parcels located within another, and perhaps larger, land classification, area. A brief narrative should be provided describing the associated resource analysis and/or inventory used in making the classification. Justification: Current areas which were previously not classified and adjacent to US Forest Service Land have been classified as Environmentally Sensitive land. These lands aim to preserve the scenic, historical, archaeological, scientific, water quality, or ecological value of the overall project. Lands which were previously classified as Natural Area have been converted to Environmentally Sensitive Lands due to a terminology change in policy guidance. In response to the public’s feedback to keep the lake natural and scenic, areas which fall within the definition above have been retained or converted to Environmentally Sensitive with the intention of preservation of the land. (Acreage = 6889) Multiple Resource Management land classification allows for the designation of a predominate use as described below, with the understanding that other compatible uses described below may also occur on these lands (e.g. a trail through an area designated as Wildlife Management.) Land classification maps must reflect the predominant sub-classification, rather than just Multiple Resource Management.
- Low Density Recreation land classification includes lands with minimal development or infrastructure that support passive public recreational use (e.g. primitive camping, fishing, hunting, trails, wildlife viewing, etc.) Justification: With the advancement of technology available, the low density recreation land has been adjusted accordingly to accommodate existing development and infrastructure with the realignment of existing boundaries. This accommodation allowed for expanding low density areas to capture developed areas and meeting the opportunity of existing and future adjacent land development. In areas which were previously low density recreation land with no permits, no houses, and undeveloped lots, these areas where changed to environmentally sensitive in effort to preserve the scenic, historical, archaeological, scientific, water quality, or ecological value of the overall project.. In areas which were previously low density, containing development such as housing, these areas remained low density unless existing land was not suitable for this classification. (e.g. ecological, aesthetic, environmental, or cultural resources present). Edges of zoning, monuments, and terrain such as ditch lines were used as boundaries for this classification. (Acreage = 5231)
- Wildlife Management land is designated for stewardship of fish and wildlife resources. Justification: On Table Rock Lake, areas which have been classified as wildlife management lands consist of large tracts of land and shoreline areas where food plots can be established to supplement and enhance the existing wildlife forage. The areas classified have been determined to contain suitable habitat for native wildlife and will be protected for this purpose. The majority
5-3
of these areas have been established in locations that are accessible by road or by water for the public. In the case these areas are developed as wildlife management areas in the future, hunting will be allowed on these public lands, unless otherwise posted. The majority of the lands classified as wildlife management in the current Master Plan were acquired by the Corps of Engineers thru the 1999 U.S. Forest Service Exchange. (Acreage = 3,252) - Vegetative Management land is designated for stewardship of forest, prairie, and other native vegetative cover. Justification: On Table Rock Lake, vegetative management land is classified along the entire shoreline of the lake with the exception of the following; High Density, Low Density areas containing a resort lease, environmentally sensitive areas, and wildlife management. The Vegetative Management Land classification is established as an opportunity to respond to the public’s demand ensuring water quality conservation. (Acreage = 2018). The Vegetative Management Land classification on Table Rock has been established as a platform to the Shore Line Management Plan, thus, allowing flexibility of the management of various vegetative species to ensure a healthy riparian vegetation buffer. Riparian vegetation plays an important role in water quality. Specifically, a riparian buffer provides bank stabilization, act as a natural filter, capturing sediment and pollutants from runoff, and habitat protection.(Planning Techniques, 2008)
-Future or Inactive Recreation Areas land classification is for those land areas with site characteristics compatible with potential future recreational development or recreation areas that are closed. Until there is an opportunity to develop or reopen these areas, they will be managed for multiple resources. Table Rock project has no land areas in this classification category. The project has no developed recreation areas that have been completely closed. The area previously listed as the “Future James River Recreation Area” has been classified as a Wildlife Management Area by this Plan. This plan suggests that if future recreation development is needed, this development will be accommodated either within the existing High Density classified land areas or on private property. Water Surface is for those waters classified for particular purposes when the project administers a surface water zoning program. -Restricted surface waters are restricted for project operations, safety, and security purposes. Justification: Restricted water surface classifications are by-in-large areas that were once considered restricted in the prior Master Plan. The exception to this classification is an additional restricted area upstream of the auxiliary spillway.(Acreage = 29) -Designated No Wake surface waters are established protect environmentally sensitive shoreline areas, recreational water access areas from disturbance, and for public safety. Table Rock project has no water surface area in this classification category. Although there are “no wake” buoys located on the lake, this is determined by the Missouri State Highway Patrol upon request and consideration with the Corps of Engineers Table Rock project. - Fish and Wildlife Sanctuary surface waters are areas where annual or seasonal restrictions on areas to protect fish and wildlife species during periods of migration, resting,

5-4
feeding, nesting, and or spawning are present. Table Rock project has no water surface areas in this classification category. Open Recreation Areas classification is for those waters available for year round or seasonal water based recreation use. Justification: On Table Rock Lake all water surface acres are classified as open recreation, with the exception of restricted areas above and below the dam and auxiliary spillway. (Acreage = 42,651) Project Easement land classification is for those lands for which the Corps holds an easement interest, but not fee title. Planned use and management of easement lands will be in strict accordance with the terms and conditions of the easement estate acquired for the project. Easements were acquired for specific purposes and do not convey the same rights or ownership to the Corps as other lands. The following types of easements were acquired for the Table Rock Project:
(1) Operations Easement. The Corps retains rights to these lands necessary for project operations (access, etc.). Justification: Table Rock Project operations easements are generally for road right-of-ways that provide access to project facilities. Road right-of-ways purchased for the relocation of roads inundated by the creation of the project have been disposed of to the appropriate operating authority.
(2) Flowage Easement. The Corps retains the right to inundate these lands for project operations. Justification: The easements acquired for the operation of the Table Rock Project are typically applicable to that portion of the described property laying between elevation 936 feet, National Geodetic Vertical Datum, and the Government Fee Take Line. The typical flowage easement estate grants the Government the perpetual right to occasionally overflow the easement area, if necessary, for the operation of the reservoir; and specifically provides that “no structures for human habitation shall be constructed or maintained on the land; and provided further that no other structures of any other type shall be constructed or maintained on the land except as may be approved in writing by the representative of the United States in charge of the project.” All flowage easement deeds should be checked for exact rights acquired prior to proceeding in any action on the easement.
(3) Conservation Easement. The Corps retains the rights to lands for aesthetic, recreation, and environmental benefits. There are currently no lands classified as conservation easement lands on Table Rock Lake.
6-1
Chapter 6 Special Topics/Issues/Considerations This chapter discusses the special topics, issues, and considerations the PDT talked about during the development of the master plan. Special topics, issues, and considerations are defined in this context as any problems, concerns, and/or needs that could affect or are affecting the stewardship and management potential of the lands and waters under the jurisdiction of the Little Rock District, Table Rock Lake Project Office Area of Responsibility (AOR). The following text highlights what is experienced at Table Rock Lake and for simplicity, has been broken down into subcategories.
a. Sedimentation. While Table Rock Lake is perceived as a clear, transparent lake, some issues with sedimentation exist at points along the lake. During the scoping process, the area around the dam was noted to have an issue with sedimentation. This poses a problem for the water intake structure for the Missouri Department of Conservation’s Shepherd of the Hills Fish Hatchery located just downstream of the Table Rock Lake Dam. While drafting the Master Plan, the PDT talked about this issue and had the following recommendations for potential resolution:
• Determine rate of sedimentation (i.e. how much sediment is already there; what is the rate of sedimentation.
o Every year during the budget cycle, a request is made for sedimentation surveys to be completed at Corps lakes. The information from these surveys would help in determining both the amount of sedimentation present and the rate of sedimentation.
• Monitor sediment deposits. • Consider implementing policies for boat dock owners to improve the roadways to their
docks and launch ramps to allow the capture of gravels and sediments. • Consider a cost-sharing partnership with other agencies to find resolutions to
sedimentation issues.
b. Water Supply Table Rock Lake does not have any identified municipal/ industrial users or contracts for water supply at this time. However, during the master plan revision process, the PDT noted another ongoing study, the Southwest Missouri Water Demand Planning Assistance to States (PAS) study, within the Little Rock District, would be investigating potential water supply sources for areas located in Missouri, Kansas, and Oklahoma. This PAS is being done in partnership with the Tri-State Water Resource Coalition and the Missouri Department of Natural Resources. The PDT took the ongoing PAS study into consideration and an indication there would be a future water reallocation request with the intention of completing a water supply contract and construction of a water supply intake structure on Table Rock Lake. Coordination and communication took place between the two teams as to potential locations for an intake structure

6-2
around the lake. This information would help the Master Plan PDT in determining the proposed land classification uses mentioned in Chapter 5.
c. Public Safety. One of the top three concerns identified through the scoping process was the safety of the public, including the size and speed of boats on the lake. The PDT discussed how to resolve the public’s concern with perceived safety issues on Table Rock Lake and have following recommendations for potential resolution:
• Pro-active communication with the Missouri Water Safety Patrol. o Buoy placement o Incident response
• Limit boat dock size on community, marina, and resort docks.
d. Public Outreach. The Table Rock Lake area of responsibility (AOR) encompasses a substantial amount of land and water in southwest Missouri and parts of northern Arkansas. Within this area comes numerous resources and responsibility for those resources often intertwine and overlap among various agencies (Federal, State, and Local) and interest groups. The PDT recognized this issue from the beginning of this master plan revision process and after consideration, have the following recommendation for potential resolution:
• Organize a ‘steering committee’ made up of the key resource agencies and interests groups.
• Educate the general public about the resources of the lake and what agency responsibilities.
Some of the topics identified for further discussion amongst the steering committee include: • Clean Marina Initiative • Creating a strategic vision among agencies, partners, and stakeholders • Table Rock National Fish Habitat Initiative (NFHI) • Future development adjacent to Table Rock Lake • Table Rock Lake and surrounding area as a high tourist destination—how to maximize
capture of economic benefits
Add Vegetation Buffer paragraph.
7-1
Chapter 7 Agency and Public Coordination
a. Introduction No one agency has control over or oversight of stewardship activities on the public lands and waters surrounding Table Rock Lake. Responsibility for natural resource and recreation management falls to several agencies who own or have jurisdiction over these public lands and waters. Increasingly, competition for the use of these lands and waters and their natural resources can create conflicts and concerns among stakeholders. The need to coordinate a cooperative approach to protect and sustain these resources is compelling. Many opportunities exist to increase the effectiveness of Federal programs through collaboration among agencies and to facilitate the process of partnering between government and non-government agencies. To sustain healthy and productive public lands and water with the most efficient approach requires individuals and organizations to recognize their unique ability to contribute to commonly held goals. The key to progress is building on the strengths of each sector, achieving goals collectively that could not be reasonably achieved individually. Given the inter-jurisdictional nature of Table Rock Lake, partnering opportunities exist and can promote the leveraging of limited financial and human resources. Partnering and identification of innovative approaches to deliver justified levels of service defuse polarization among interest groups, and lead to a common understanding and appreciation of individual roles, priorities, and responsibilities. To the extent practical, this Master Plan and a proactive approach to partnering will position Table Rock Lake to aggressively leverage project financial capability and human resources in order to identify and satisfy customer expectations, project and sustain natural and cultural resources and recreational infrastructure, and programmatically bring Corps management efforts and outputs up to a justified level of service. Public involvement and extensive coordination within the Corps of Engineers and with other affected agencies and organizations is a critical feature required in developing or revising a Project Master Plan. Agency and public involvement and coordination has been a key element in every phase of the Table Rock Lake master plan revision thus far.
b. Scoping. One agency and three public scoping workshops were held in late November and early December 2012 with over 2,000 people in attendance. To prepare for the scoping workshops, the Corps contracted with CDM-Smith. An after action Memorandum for Record (MFR) is included in Appendix B, Summary of Public Comments that details the preparation and work prior to, during, and after the public scoping workshops held in the fall of 2012. From the scoping process, a Scoping report was finalized on 4 February 2013. The report summarizes the public participation process for, and the public comments resulting from, the Table Rock Lake MP Revision public scoping workshops and comment period. “Scoping” is the process of determining the scope, focus, and content of a NEPA document. Scoping workshops
7-2
are a useful tool to obtain information from the public and governmental agencies. For a planning process such as the MP revision, the scoping process was also used as an opportunity to get input from the public and agencies about the vision for the MP update and the issues that the MP should address where possible. The Scoping Report is located in Appendix B, Summary of Public Comments.
c. Focus Groups. The PDT made the decision to work with focus groups during the scoping process, in part due to the high interest in the Master Plan revision process from other agencies and the public. The focus groups were formed in response to the top three concerns heard from the public during the scoping process: Water Quality, Safety, and Recreation. The focus group meetings will be held on the 8th and 9th of May 2013 at the Dewey Short Visitors Center Theater. An informal icebreaker session will be held the evening of Tuesday, May 7th, 2013 from 4:00PM to 6:00PM also at the Dewey Short Visitors Center. The icebreaker session provides the opportunity for all three focus groups to meet together, share ideas, and talk with the Corps Master Plan PDT on an informal basis. Ground rules and expectations for the focus group meetings will also be set during this time. An after action MFR will be developed to capture any lessons learned from these meetings and this report will be updated to include the MFR.
d. Draft Master Plan/Draft Environmental Assessment. Currently scheduled for release at end of July 2013 with public workshops scheduled for mid-August 2013.
e. Final Master Plan/Final EA. Currently scheduled for early December 2013 with public workshops in mid-December 2013.

8-1
Chapter 8 Summary of Recommendations UNDER DEVELOPMENT

9-1
Chapter 9 Bibliography UNDER DEVELOPMENT

9-1

Appendix-A
Appendix A NEPA Documents

Appendix-A

Appendix-B
Appendix B Summary of Public Comments

Appendix-B

Appendix-C
Appendix C Design Memorandums and Previous Supplements
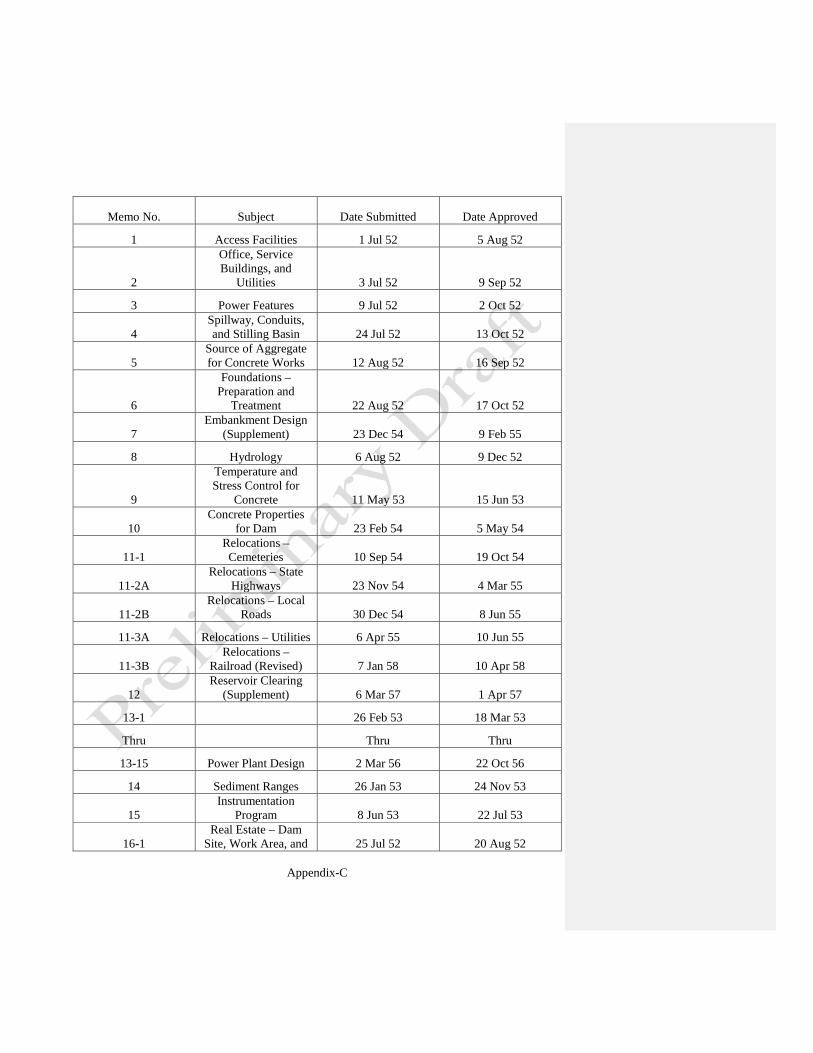
Appendix-C
Memo No. Subject Date Submitted Date Approved
1 Access Facilities 1 Jul 52 5 Aug 52
2
Office, Service Buildings, and
Utilities 3 Jul 52 9 Sep 52
3 Power Features 9 Jul 52 2 Oct 52
4 Spillway, Conduits, and Stilling Basin 24 Jul 52 13 Oct 52
5 Source of Aggregate for Concrete Works 12 Aug 52 16 Sep 52
6
Foundations – Preparation and
Treatment 22 Aug 52 17 Oct 52
7 Embankment Design
(Supplement) 23 Dec 54 9 Feb 55
8 Hydrology 6 Aug 52 9 Dec 52
9
Temperature and Stress Control for
Concrete 11 May 53 15 Jun 53
10 Concrete Properties
for Dam 23 Feb 54 5 May 54
11-1 Relocations – Cemeteries 10 Sep 54 19 Oct 54
11-2A Relocations – State
Highways 23 Nov 54 4 Mar 55
11-2B Relocations – Local
Roads 30 Dec 54 8 Jun 55
11-3A Relocations – Utilities 6 Apr 55 10 Jun 55
11-3B Relocations –
Railroad (Revised) 7 Jan 58 10 Apr 58
12 Reservoir Clearing
(Supplement) 6 Mar 57 1 Apr 57
13-1 26 Feb 53 18 Mar 53
Thru Thru Thru
13-15 Power Plant Design 2 Mar 56 22 Oct 56
14 Sediment Ranges 26 Jan 53 24 Nov 53
15 Instrumentation
Program 8 Jun 53 22 Jul 53
16-1 Real Estate – Dam
Site, Work Area, and 25 Jul 52 20 Aug 52
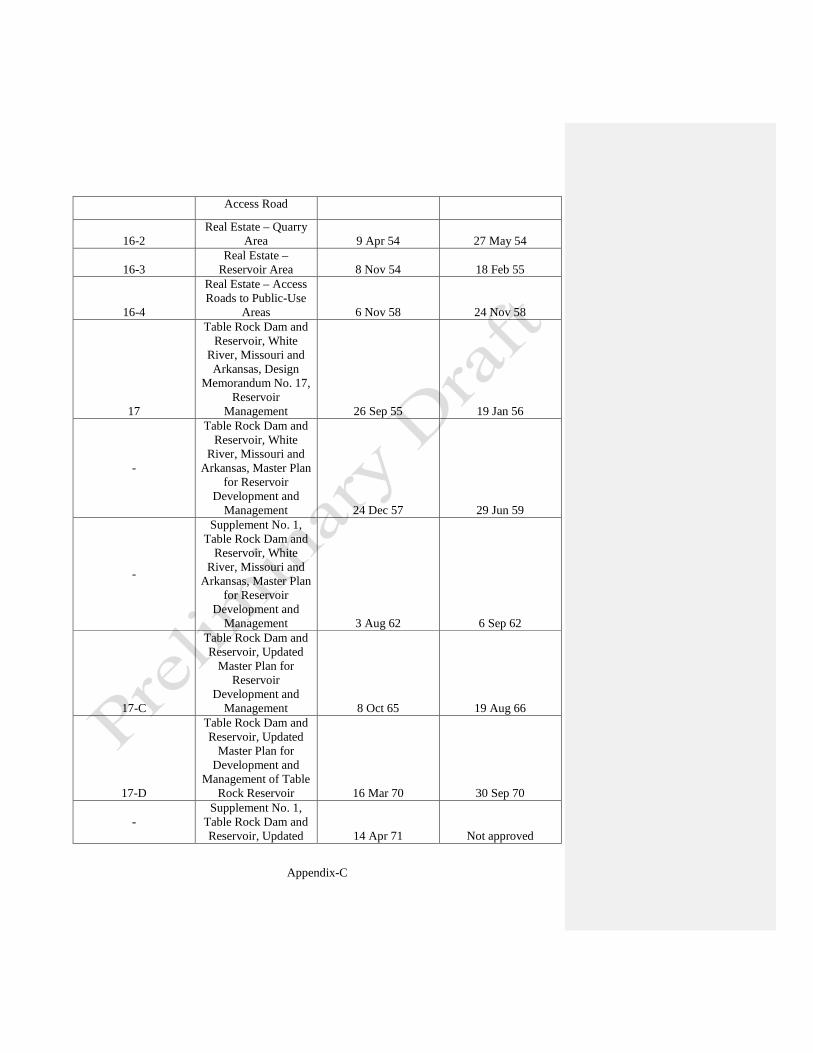
Appendix-C
Access Road
16-2 Real Estate – Quarry
Area 9 Apr 54 27 May 54
16-3 Real Estate –
Reservoir Area 8 Nov 54 18 Feb 55
16-4
Real Estate – Access Roads to Public-Use
Areas 6 Nov 58 24 Nov 58
17
Table Rock Dam and Reservoir, White
River, Missouri and Arkansas, Design
Memorandum No. 17, Reservoir
Management 26 Sep 55 19 Jan 56
-
Table Rock Dam and Reservoir, White
River, Missouri and Arkansas, Master Plan
for Reservoir Development and
Management 24 Dec 57 29 Jun 59
-
Supplement No. 1, Table Rock Dam and
Reservoir, White River, Missouri and
Arkansas, Master Plan for Reservoir
Development and Management 3 Aug 62 6 Sep 62
17-C
Table Rock Dam and Reservoir, Updated
Master Plan for Reservoir
Development and Management 8 Oct 65 19 Aug 66
17-D
Table Rock Dam and Reservoir, Updated
Master Plan for Development and
Management of Table Rock Reservoir 16 Mar 70 30 Sep 70
- Supplement No. 1,
Table Rock Dam and Reservoir, Updated 14 Apr 71 Not approved
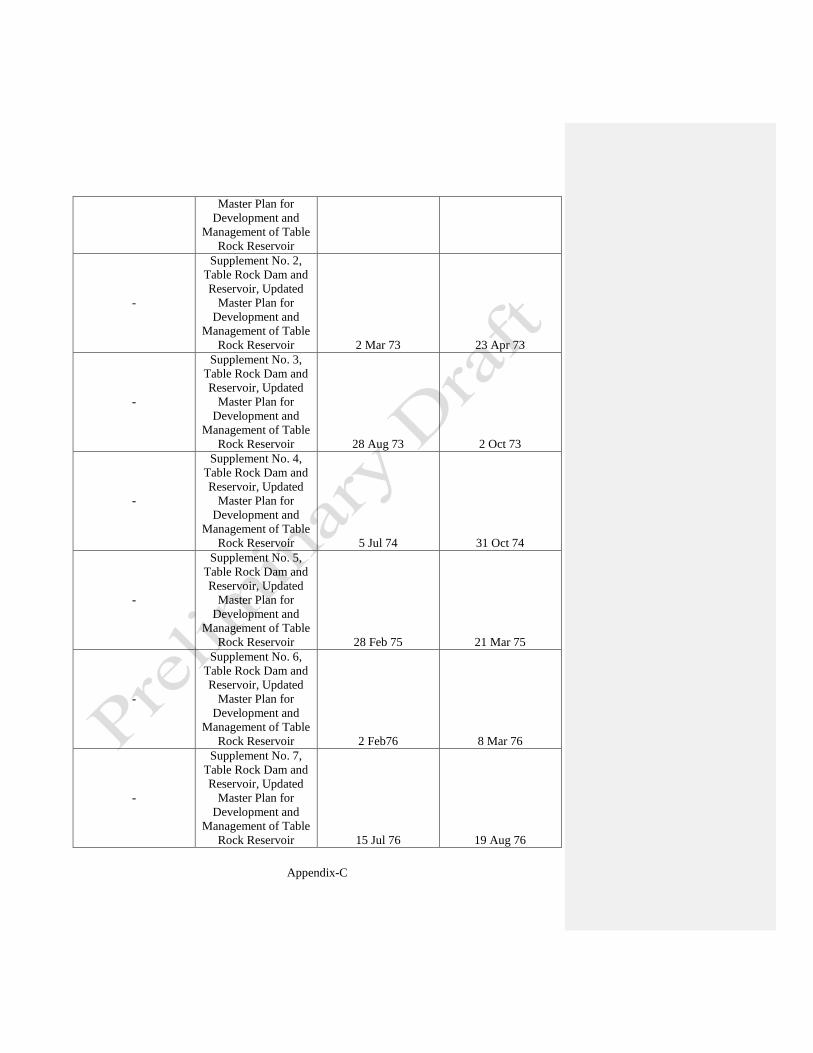
Appendix-C
Master Plan for Development and
Management of Table Rock Reservoir
-
Supplement No. 2, Table Rock Dam and Reservoir, Updated
Master Plan for Development and
Management of Table Rock Reservoir 2 Mar 73 23 Apr 73
-
Supplement No. 3, Table Rock Dam and Reservoir, Updated
Master Plan for Development and
Management of Table Rock Reservoir 28 Aug 73 2 Oct 73
-
Supplement No. 4, Table Rock Dam and Reservoir, Updated
Master Plan for Development and
Management of Table Rock Reservoir 5 Jul 74 31 Oct 74
-
Supplement No. 5, Table Rock Dam and Reservoir, Updated
Master Plan for Development and
Management of Table Rock Reservoir 28 Feb 75 21 Mar 75
-
Supplement No. 6, Table Rock Dam and Reservoir, Updated
Master Plan for Development and
Management of Table Rock Reservoir 2 Feb76 8 Mar 76
-
Supplement No. 7, Table Rock Dam and Reservoir, Updated
Master Plan for Development and
Management of Table Rock Reservoir 15 Jul 76 19 Aug 76

Appendix-C
-
Supplement No. 8, Table Rock Dam and Reservoir, Updated
Master Plan for Development and
Management of Table Rock Reservoir 30 Jul 76 26 Nov 76
18 Dam and Appurtenant
Works 26 Jan 56
* Summarizes previous submissions
and approvals 19 Operational Facilities 29 Oct 59 6 Jun 60
19
Enhancement of Public Areas of the
Powerhouse 6 Sep 72 15 Feb 73
20 Resident Office and
Visitor Center 31 Aug 72 16 Nov 73
17-E
Table Rock Lake, Updated Master Plan for Development and Management of Table
Rock Lake 13 Oct 76 23 Dec 76
-
Supplement No. 1, Table Rock Dam and Reservoir, Updated
Master Plan for Development and
Management of Table Rock Reservoir 3 Feb 77 15 Mar 77
-
Supplement No. 2, Table Rock Dam and Reservoir, Updated
Master Plan for Development and
Management of Table Rock Reservoir 26 Apr 77 16 May 77
-
Supplement No. 3, Table Rock Dam and Reservoir, Updated
Master Plan for Development and
Management of Table Rock Reservoir 13 Feb 79 13 Mar 79
-
Supplement No. 4, Table Rock Dam and Reservoir, Updated
Master Plan for 8 Jul 81 23 Jul 81

Appendix-C
Development and Management of Table
Rock Reservoir
-
Supplement No. 5, Table Rock Dam and Reservoir, Updated
Master Plan for Development and
Management of Table Rock Reservoir 10 Sep 81 15 Oct 81
-
Supplement No. 6, Table Rock Dam and Reservoir, Updated
Master Plan for Development and
Management of Table Rock Reservoir 26 Oct 81 3 Nov 81
-
Supplement No. 7, Table Rock Dam and Reservoir, Updated
Master Plan for Development and
Management of Table Rock Reservoir 27 Jun 84 6 Nov 84
-
Supplement No. 8, Table Rock Dam and Reservoir, Updated
Master Plan for Development and
Management of Table Rock Reservoir 21 Nov 84 24 Dec 84
-
Supplement No. 9, Table Rock Dam and Reservoir, Updated
Master Plan for Development and
Management of Table Rock Reservoir 20 Dec 84 18 Apr 85
-
Supplement No. 10, Table Rock Dam and Reservoir, Updated
Master Plan for Development and
Management of Table Rock Reservoir 31 Jan 85
22 Mar 85*Disapproved
- Supplement No. 11, 28 Mar 85 16 Apr 85

Appendix-C
Table Rock Dam and Reservoir, Updated
Master Plan for Development and
Management of Table Rock Reservoir
-
Supplement No. 12, Table Rock Dam and Reservoir, Updated
Master Plan for Development and
Management of Table Rock Reservoir 19 Nov 85 4 Dec 85
-
Supplement No. 13, Table Rock Dam and Reservoir, Updated
Master Plan for Development and
Management of Table Rock Reservoir 5 Mar 86 2 Apr 86
-
Supplement No. 14, Table Rock Dam and Reservoir, Updated
Master Plan for Development and
Management of Table Rock Reservoir 23 May 86 12 Jun 86
-
Supplement No. 15, Table Rock Dam and Reservoir, Updated
Master Plan for Development and
Management of Table Rock Reservoir 30 Jun 86 18 Jul 86
-
Supplement No. 16, Table Rock Dam and Reservoir, Updated
Master Plan for Development and
Management of Table Rock Reservoir 4 Apr 88 19 Apr 88
-
Supplement No. 17, Table Rock Dam and Reservoir, Updated
Master Plan for Development and 11 May 88 7 Jun 88

Appendix-C
Management of Table Rock Reservoir
-
Supplement No. 18, Table Rock Dam and Reservoir, Updated
Master Plan for Development and
Management of Table Rock Reservoir 10 Apr 89 24 Apr 89
-
Supplement No. 19, Table Rock Dam and Reservoir, Updated
Master Plan for Development and
Management of Table Rock Reservoir
-
Supplement No. 20, Table Rock Dam and Reservoir, Updated
Master Plan for Development and
Management of Table Rock Reservoir 31 Jan 90 28 Feb 90
-
Supplement No. 21, Table Rock Dam and Reservoir, Updated
Master Plan for Development and
Management of Table Rock Reservoir 16 Mar 90 5 Apr 90
-
Supplement No. 22, Table Rock Dam and Reservoir, Updated
Master Plan for Development and
Management of Table Rock Reservoir 13 Aug 90 30 Aug 90
-
Supplement No. 23, Table Rock Dam and Reservoir, Updated
Master Plan for Development and
Management of Table Rock Reservoir 1 Nov 90
26 Nov 90*Action Suspended
- Supplement No. 24, Table Rock Dam and 19 Mar 92 8 Apr 92

Appendix-C
Reservoir, Updated Master Plan for
Development and Management of Table
Rock Reservoir
-
Supplement No. 25, Table Rock Dam and Reservoir, Updated
Master Plan for Development and
Management of Table Rock Reservoir 9 Mar 93 31 Mar 93
-
Supplement No. 26, Table Rock Dam and Reservoir, Updated
Master Plan for Development and
Management of Table Rock Reservoir 22 Feb 94 1 Mar 94
-
Supplement No. 27, Table Rock Dam and Reservoir, Updated
Master Plan for Development and
Management of Table Rock Reservoir 7 Jul 94 21 Jul 94
-
Supplement No. 28, Table Rock Dam and Reservoir, Updated
Master Plan for Development and
Management of Table Rock Reservoir 27 Mar 95 13 Apr 95
-
Supplement No. 29, Table Rock Dam and Reservoir, Updated
Master Plan for Development and
Management of Table Rock Reservoir 26 Apr 95 28 Jul 95
-
Supplement No. 30, Table Rock Dam and Reservoir, Updated
Master Plan for Development and
Management of Table 20 Sep 95 16 Oct 95
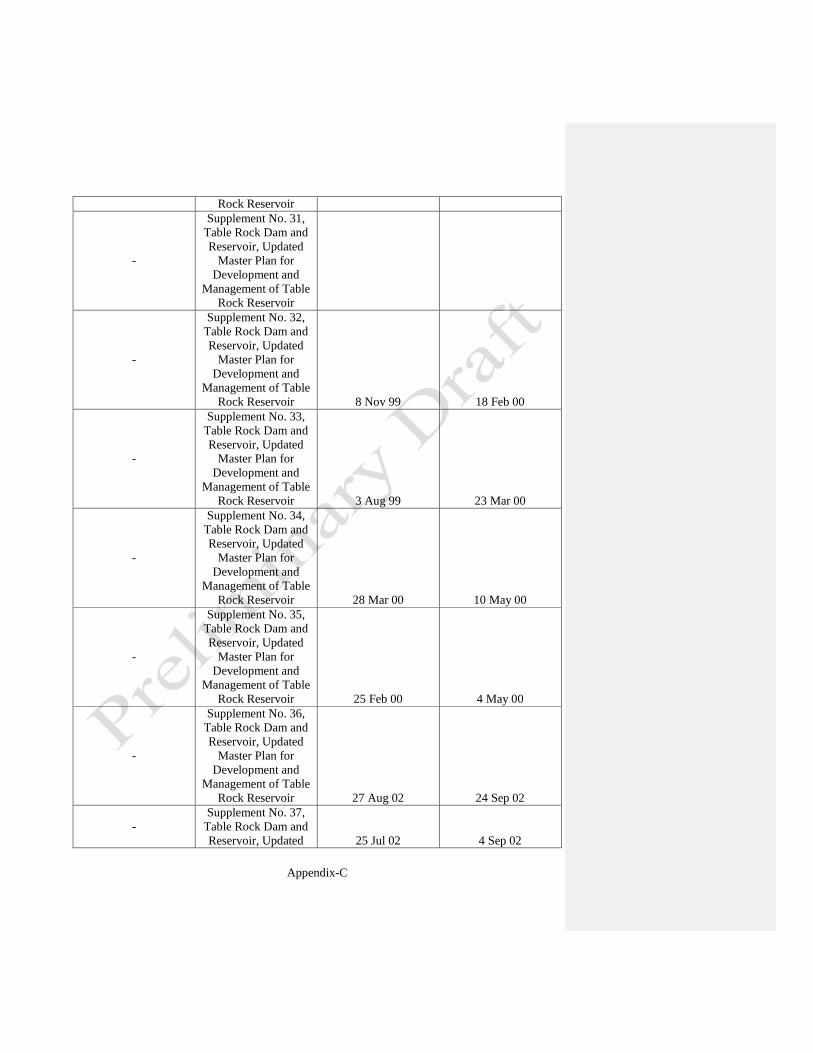
Appendix-C
Rock Reservoir
-
Supplement No. 31, Table Rock Dam and Reservoir, Updated
Master Plan for Development and
Management of Table Rock Reservoir
-
Supplement No. 32, Table Rock Dam and Reservoir, Updated
Master Plan for Development and
Management of Table Rock Reservoir 8 Nov 99 18 Feb 00
-
Supplement No. 33, Table Rock Dam and Reservoir, Updated
Master Plan for Development and
Management of Table Rock Reservoir 3 Aug 99 23 Mar 00
-
Supplement No. 34, Table Rock Dam and Reservoir, Updated
Master Plan for Development and
Management of Table Rock Reservoir 28 Mar 00 10 May 00
-
Supplement No. 35, Table Rock Dam and Reservoir, Updated
Master Plan for Development and
Management of Table Rock Reservoir 25 Feb 00 4 May 00
-
Supplement No. 36, Table Rock Dam and Reservoir, Updated
Master Plan for Development and
Management of Table Rock Reservoir 27 Aug 02 24 Sep 02
- Supplement No. 37,
Table Rock Dam and Reservoir, Updated 25 Jul 02 4 Sep 02

Appendix-C
Master Plan for Development and
Management of Table Rock Reservoir

Appendix-D
Appendix D Plates

Appendix-D