Embed Size (px)
Citation preview

1
What’s a Worm Worth? Steve Wratten, Harpinder Sandhu, Sue Unsworth, Jacquie Bay
Earthworms, large or small, are all annelids belonging to the class Oligochaeta. New Zealand has
native earthworms that belong to the family Megascolecidae. These are the earthworms that you will find in native forests. Those that you commonly find in your garden, city parks, farmlands and orchards are introduced species that belong to the family Lumbricidae.
Decomposers down-under
Earthworms are decomposers, feeding on dead and decaying plant matter under the soil surface. Different species occupy niches in different sections of the soil profile. Some species are well adapted to live in the leaf litter of the forest floor while others occupy the rich dark topsoil (just below the lead litter) and others the subsoil.
No matter what the niche, the earthworm is an essential component of our ecosystems, with a public profile that does little to recognise its true worth. Without decomposers, such as earthworms, bacteria and fungi, the nutrient cycles would come to a standstill. Decomposers play an essential role in unlocking the nutrients held in the tissue of dead organisms. Through the work of the decomposers, cells and tissues are broken down. The decomposer gains the energy it needs to live from the dead tissues. At the same time important organic matter and nutrients such as carbon, nitrogen and phosphorus are released back into the environment., creating in the case of earthworms rich soils that we rely on for horticultural and agricultural productivity.
“The plough is one of the most ancient and most
valuable of man's inventions; but long before he
existed the land was in fact regularly ploughed, and
still continues to be thus ploughed by earth-worms. It
may be doubted whether there are many other animals
which have played so important a part in the history of
the world, as have these lowly organised creatures.”
Charles Darwin 1881 (p 313)
The formation of vegetable mould, through the action of worms.
London: John Murray

2
What’s a Worm Worth?
New Zealand spends millions of dollars each year on soil management practices. These are activities that are designed to improve the productivity of soil such as the addition of fertilisers or compost, irrigation or drainage, crop rotation or effluent application.
This investigation is best carried out between the months of September and December (Southern Hemisphere), however useful results can be obtained in any season.
Aim:
a) To investigate the effect of soil management practices on earthworm populations.
b) To calculate the economic value of earthworms in terms of the topsoil they produce.
Materials: Garden spade, plastic bags, newspaper, ruler, data sheet, electronic balance (2dp), calculator.
Method: Make sure that all groups in your class agree on the method so that you can combine the results. 1. Select two or more contrasting sites, where different soil management practices have been in
place. Examples of contrasting sites could include:
A well maintained garden which has had a lot of organic matter (e.g. compost) added to it. A fence line with no vegetation because it is regularly sprayed with weed killer. A grassy area such as a garden lawn or city park (with permission in all cases!). A farm paddock with a history of fertiliser use.
2. Create a square on your spade:
Measure the width of the spade blade and record this in the data sheet (W).
Measure this distance up from the bottom of the spade blade.
Using a permanent marker pen, draw a line across the top of W.
3. At each of your sites, dig holes the same width as your spade, and as deep as the horizontal red line on your spade. Collect the sample and put it into a labelled bag.
4. Spread the soil from each sample on to a plastic sheet or newspaper. Pull the soil sample apart with your fingers and count the number of juvenile and adult earthworms in each sample. See page 3 for instructions on how to tell the difference between juvenile and adult earthworms.
5. Using an electronic balance to 2 decimal places, measure the total mass of earthworms each sample. This is called the earthworm biomass.
6. Record your measurements in the data sheet on page 4 and then calculate the value of the earthworms based on the total biomass present in your samples.
3
Earthworm Identification
You will not be able to identify the individual species of earthworm that you find; however you will be able to tell whether the earthworms are juveniles or adults. The adult earthworm has a recognisable saddle or clitellum that is part of the reproductive system, forming a sac or cocoon into which the eggs are deposited. The clitellum is visible in adult earthworms, distinguishing them from the juveniles.
Clitellum
Adult earthworm showing clitellum
The Basis of the Calculations
The economic value of earthworms in soil formation will be calculated based on the assumption that: that one tonne of earthworms forms 1000kg of topsoil. the value of farmland includes the contribution to production
made by its topsoil. A tonne of topsoil can be purchased from garden centres in
Christchurch, New Zealand at a rate of NZ$40 per tonne.
Useful Facts:
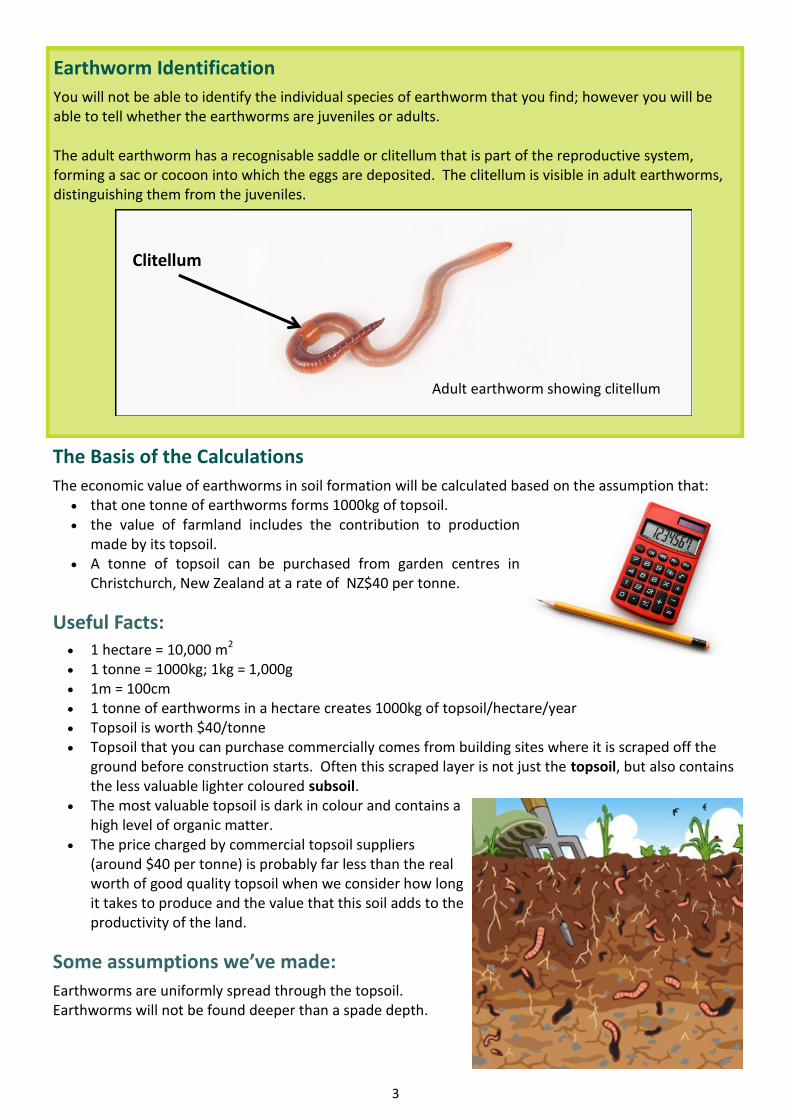
1 hectare = 10,000 m2 1 tonne = 1000kg; 1kg = 1,000g 1m = 100cm 1 tonne of earthworms in a hectare creates 1000kg of topsoil/hectare/year Topsoil is worth $40/tonne Topsoil that you can purchase commercially comes from building sites where it is scraped off the
ground before construction starts. Often this scraped layer is not just the topsoil, but also contains the less valuable lighter coloured subsoil.
The most valuable topsoil is dark in colour and contains a high level of organic matter.
The price charged by commercial topsoil suppliers (around $40 per tonne) is probably far less than the real worth of good quality topsoil when we consider how long it takes to produce and the value that this soil adds to the productivity of the land.
Some assumptions we’ve made:
Earthworms are uniformly spread through the topsoil. Earthworms will not be found deeper than a spade depth.

4
Results:
Complete the results table for each of your samples. To improve the reliability of your data, you should share the results of each group in your class, enabling you to take the average of several samples for each site.
Soil Management Histories: Describe (and if possible photograph) your sites. Try to find out as much as possible about the soil management history. An example has been provided for you on page 6.
Raw Results – count and biomass of earthworms at each site
Site Site 1: Site 2: Site 3:
Location
Aspect
Current planting where samples were taken
Historical planting
Soil management history
Information sources
Site 1: Site 2: Site 3:
Count (No.) Biomass (g) Combined
Adult & Juv
Count (No.) Biomass (g) Combined
Adult & Juv.
Count (No.) Biomass (g) Combined
Adult & Juv. Adult Juv. Adult Juv. Adult Juv.
Sample 1 (Gp 1)
Sample 2 (Gp2)
Sample 3 (Gp3)
Sample 4 (Gp4)
Sample 5 (Gp 5)
Sample 6 (Gp 6)
Sample 7 (Gp 7)
Sample 8 (Gp 8)
Average (Enter into the table
on page 5)

5
Calcu
lating th
e area o
f each
samp
le d
ug b
y the
spad
e
If you
r spad
e is 17
cm (0
.17
m) w
ide, th
e area of a sam
ple h
ole w
ill be 0
.17
x 0.1
7 = 0.0
3m
2 (2 significan
t figures)
Spad
e wid
th (W
) = Length
of Sam
ple (L)
Are
a of th
e surface o
f the sam
ple = W
x W = W
2
Becau
se we are assu
min
g that earth
wo
rms are n
ot fo
un
d b
elow
app
roxim
ately 1 spad
e length
, we can
assum
e that u
sing
the su
rface area of th
e samp
le (rather th
an vo
lum
e) we can
estimate th
e nu
mb
er of earth
wo
rms p
er hectare u
nd
er the
Calcu
lation
s (Use 2
significan
t figures)
Examp
le calculatio
n fo
r 1 site
Site 1
Site 2
Site 3
N = A
verage
nu
mb
er o
f earth
wo
rms p
er sam
ple
fo
r each
site (fro
m p
age 4)
20
M = A
verage
total b
iom
ass of e
arthw
orm
s pe
r sam
ple
for e
ach site
(from
page 4
) 4
.00
g
A = A
rea o
f soil sam
ple
in m
2
A = len
gth x w
idth
of sam
ple
A
= W x W
0.1
7m
x 0.17
m
= 0.0
3m
2
H = N
um
be
r of so
il samp
les th
at will fit in
to 1
h
ectare
H = 1
0,0
00
m2 ÷ A
10
,00
0m
2 ÷ 0.03
m2
= 33
0,0
00
samp
les/ hectare
E= Nu
mb
er o
f earth
wo
rms p
er he
ctare E = H
x N
33
0,0
00
x 20
= 6
,60
0,0
00
earth
wo
rms / h
ectare
ME = M
ass of e
arthw
orm
s per h
ectare in
grams
ME = H
x M
33
0,0
00
x 4.00
g = 1
,30
0,0
00
g / hectare
1 gram
of livin
g earth
wo
rm b
iom
ass make
s 1
gram o
f top
soil p
er ye
ar Th
ere
fore
ho
w m
any gram
s of to
pso
il do
ou
r w
orm
s make
/ he
ctare?
Co
nve
rt ME fro
m gram
s to to
nn
es
1 to
nn
e = 1,0
00
,00
0 gram
s M
E (grams) ÷ 1
,00
0,0
00
= ME
(ton
nes)
If there are 1
,32
0,0
00
g of w
orm
s in
1 h
ectare, they w
ill make
1,3
00
,00
0 gram
s of to
pso
il / year. 1
,30
0,0
00
g / hectare ÷
1,0
00
,00
0
= 1.3
ton
nes / h
ectare
If it costs $
40
to b
uy 1
ton
ne
of to
pso
il and
ou
r e
arthw
orm
s mad
e 1
.32
ton
ne
s pe
r he
ctare –
ho
w m
uch
mo
ne
y are th
e e
arthw
orm
s makin
g fo
r the
farme
r? Eco
no
mic valu
e o
f earth
wo
rms in
te
rms o
f top
soil p
rod
uctio
n / h
ectare
$
= ME x 4
0 (1
ton
ne o
f top
soil co
sts $4
0)
1.3
ton
nes / h
ectare x $4
0 = $
52
p
er hectare.
The w
orm
s in 1
hectare o
f soil are
makin
g $5
2 w
orth
of to
pso
il each
year. O
n a 1
00
hectare farm
that is
$5
,20
0 w
orth
of to
pso
il / year.
W = W
idth
of
Spad
e Used
(cm)

6
Example Soil Management Histories:
Conclusion
From the results, what conclusions (if any) can you draw about the effect of soil management practices on earthworm populations and their value in your samples.
Discussion Questions:
1. Considering the information you collected about soil management histories at each site, discuss factors that may have contributed to the patterns seen in the data.
2. What does the adult : juvenile ratio at each site suggest about the suitability of the soil at the time of collection for sustaining earthworm populations. How could you use this ratio to track the positive or negative impact of soil management over a period of time.
3. Discuss the validity and reliability of your data.
4. Discuss the value of the environmental service that worms provide in horticultural, agricultural and forestry ecosystems, considering in your discussion soil management and productivity.
Site Site 1: Community Garden
Site 2: School Field, Auckland Grammar School
Site 3: Fence edge
Location Cathedral Place, Parnell, Auckland
Mountain Road, Epsom, Auckland
Cathedral Place, Parnell, Auckland
Aspect Land slopes towards the east at an angle of approx. 30 degrees. Large oak trees and mixed natives on the northerly border. Open lawn on southerly border.
Flat, open on all aspects. No shadows.
Fence is alongside car park with narrow strip of lawn (1m wide) between the car park and the fence.
Current planting where samples were taken
Mixed vegetable planting / fruit trees. Samples taken from bean / tomato / spinach mixed beds.
Perennial ryegrasses. Sample taken from outside edge of the field.
Perennial ryegrasses beside concrete block fence. Sample taken from soil immediately adjacent to the fence (in the sprayed zone).
Historical planting
Mixed vegetables in rotating crops for the past 4 years. Previous planting - overgrown scrub.
Perennial ryegrasses > 50 years. Perennial ryegrasses beside concrete block fence.
Soil management history
Mulched every 4 months Watered during the summer. Drainage laid.
Watered during summer months. Drainage. Annual fertiliser.
Sprayed with weed killer every 6 months.
Information sources
Community Garden Coordinator School Grounds Manager Grounds Manager
Acknowledgements:
This resource is derived from research on biodiversity at Lincoln University funded by the Foundation for Research, Science and Technology (LINX0303) conducted by Professors Steve Wratten, Ross Cullen and Dr Harpinder Sandhu. The resource was initially developed by Sue Unsworth and Steve Wratten for Science Outreach, Lincoln University and later adapted by Jacquie Bay and Steve Wratten for the BioProtection Research Centre in collaboration with LENScience.
Photos and diagrams from istockphoto.com (used under licence), LENScience, Lincoln University, or the public domain.
For further information contact: [email protected] | [email protected] | [email protected]
http://bioprotection.org.nz | http://www.lincoln.ac.nz | http://lens.auckland.ac.nz
Copyright © Lincoln University, 2011