Embed Size (px)
Citation preview

Working Paper 264
What Would Doubling Aid do for Macroeconomic Management in Africa?
Mick Foster and Tony Killick
April 2006
Overseas Development Institute 111 Westminster Bridge Road
London SE1 7JD UK
Acknowledgements Mick Foster is an independent consultant and Tony Killick is a Senior Research Associate of the Overseas Development Institute. We would like to acknowledge the financial and professional support of the UK Department for International Development, which commissioned this work. We are also indebted to our colleague Paolo de Renzio for his valuable guidance and support, as well as to the authors of the various background studies underlying our paper. However, we alone are responsible for the views expressed here. ISBN 0 85003 799 9
© Overseas Development Institute 2006 All rights reserved. No part of this publication may be reproduced, stored in a retrieval system, or transmitted in any form or by any means, electronic, mechanical, photocopying, recording or otherwise, without the prior written permission of the publishers.

iii
Contents
Summary of conclusions v
1. Background and approach 1 1.1 Coverage of study 1 1.2 Data problems 1 1.3 Approach and structure 2
2. The country cases 5
3. How should aid surges be managed? 10 (a) Lessons from commodity booms 10 (b) Desirable combinations of absorption and spending 11
4. Findings from the country studies 14 (a) Was the increased aid absorbed? 14 (b) Was increased aid spent? 16 (c) Summary of aid utilisation 19
5. Is there a Dutch Disease problem? 21
6. Conclusions and implications for scaling-up 25 6.1 A balance sheet 25 6.2 The key variables 26 6.3 Policy implications for donors 27
7. Works cited 29 7.1 Background papers prepared for this study 29 7.2 Other works cited 29

iv
Table 1: Aid per capita, 1993-2003 5 Table 2: Pre-surge aid dependence 6 Table 3: Aid trends in seven African countries 6 Table 4: Average aid as % of GNI: 5 year periods 1970-2003 7 Table 5: Aid and economic performance 9 Table 6: Was the aid increase absorbed? 14 Table 7: Foreign-exchange reserves, in months of imports: pre- and post-aid surge 15 Table 8: Tanzania: real exchange rate and trade ratios 16 Table 9: Net fiscal aid as % of total net aid 17 Table 10:Was aid spent? 18 Table 11: Aid utilisation by country 19 Table 12: Dutch Disease indicators 21
Box 1: The distinction between absorption and spending of aid 3 Box 2: Consequences of spending aid that has not been absorbed: Tanzania 20

v
Summary of conclusions The purpose of this paper is to explore the consequences for macroeconomic management of the envisaged scaling-up of aid to African countries, to report on the results of recent research and to consider the policy implications. Building on recent work from the International Monetary Fund, ODI commissioned country studies of Mauritania, Mozambique, Sierra Leone and Tanzania to examine their recent experience of aid surges. The IMF study additionally included analysis of Ethiopia, Ghana and Uganda, and was based on a distinction between the absorption and spending of aid. ODI followed this approach, but extended it to consider longer-term and more qualitative matters. ODI also commissioned a paper on the macroeconomic effects of commodity price surges, to examine what inferences might be drawn from these experiences. The strength of the following conclusions is undermined by three factors: serious deficiencies in data on aid flows; difficulty in identifying unambiguous and relevant episodes of aid surge comparable with the scaling-up that is projected for the next few years; and a bias in country coverage towards those which donors regard as having good policy reform records. In retrospect, we also regret that we did not pay more attention to the influence on aid surges on the quality of state spending decisions, a factor which emerges as rather crucial in our analysis. These limitations should be kept in mind when reading the following chief conclusions:
• The countries in question were already highly reliant on aid prior to their aid surges. This added to the potential extent of macroeconomic repercussions from the aid increases.
• The record for these countries reveals great year-on-year and medium-term aid volatility,
with large swings in aid receipts and past surges followed by aid declines. This has coloured the policy responses of recipient governments. The current donor promise to increase aid for the MDGs and sustain it thereafter would, if implemented, represent a sharp break from past experiences.
• Evidence from the literature on commodity booms emphasises a strong link between terms
of trade movements and fluctuations in economic activity. It further shows that gains to output or income from booms have often been at best meagre and short-lived, while the costs resulting from subsequent price declines have been both significant and of longer duration. Additional revenues have often been badly spent, with deterioration in the quality of public expenditures.
• In considering the macro consequences of an aid surge, it is the extent to which the resulting
increased availability of foreign exchange is absorbed – in the form of a widened balance of payments current account deficit – which is critical. It is only when additional foreign resources enter the economy that aid has an impact on the levels of production, consumption and investment that the economy can attain.
• The most appropriate policy response to an aid surge cannot be identified without reference
to a rather wide range of considerations. The need for a case-by-case approach is indicated. The closest to a general golden rule is for government to avoid large excesses of spending over absorption, as such excesses threaten to generate inflationary pressures with adverse consequences for growth, poverty reduction and the private sector.
• In the cases studied, governments proved more willing or able to spend aid than to absorb it
(see Table 11). In none of the seven cases was the aid increase both fully absorbed and fully spent. This result is clearly contrary to what is preferred by many donors.

vi
• The country cases produced little evidence of aid increases resulting in symptoms of Dutch Disease. However, this was partly because governments consciously sought to avoid this (hence the limited absorption). For this and other reasons, we regard the issue of whether a large scaling-up of aid would induce Dutch Disease problems as unresolved. There is logic and evidence pointing in both directions and we caution against assuming that a doubling of aid to African countries would not induce this type of macroeconomic difficulty. Much would depend on how the aid was deployed and on its productivity.
• Looking at macroeconomics overall, while the envisaged doubling of aid would bring real
benefits, there is a risk that it could be accompanied either by exchange-rate appreciations or counter-productive excesses of spending over absorption. Serious declines in the quality of public spending may also occur, which would reduce the benefits derived. The potential for major gains is clear but there are reasons for doubting whether this potential will be substantially realised.
• We see the following as the main determinants of the eventual outcome:
the degree of co-ordination of fiscal and monetary policy within recipient countries; the perceived predictability of the aid increases. Based on past experiences, it would be
reasonable and responsible for recipient governments to plan on the basis that the aid surge will not be sustained;
the quality of public financial management and the degree of donor influence on that; and
the quality of aid data flows to permit evidence-based macro policy decision-making.
• Finally, there are important lessons for the policies of donor governments and IFIs:
It is crucial to increase the reliability and predictability of aid, and to construct credible mechanisms for convincing recipients that the unreliability of past promises will not be repeated. Mechanisms such as the proposed International Financing Facility can underpin global aid flows, but they need to be supported by credible action to limit the volatility of aid to individual countries.
Given that scaling-up of aid should generally be accompanied by increased absorption if it is to avoid undesirable consequences, there needs to be more explicit agreement as to how the foreign exchange will be absorbed, as well as how budget resources will be spent. This has implications for the content of IMF policy advice and programmes. In particular, there is an urgent need for governments and their development partners to return to the fundamentals of relieving growth constraints and, in particular, the supply-side and other constraints on export success.
Rapid increases in aid stand a good chance of being wasted unless they are provided in the context of more carefully prioritised plans than exist at present. Failing this, there is a risk that donor disillusion will develop, leading to broken promises which leave recipient governments with the familiar problem of transient benefits succeeded by high costs as they try to run expanded services and infrastructures with lower than expected resources.
Donors should accept the politically unpalatable fact that there is a range of circumstances in which it makes sense for recipient governments to use all or part of an aid surge to add to reserves, external and domestic. Where there are good reasons for thinking that the tax system is holding back private sector growth, using aid as an opportunity for tax reform can also be legitimate.

1
1. Background and approach Britain and other donor governments have committed to double aid to Africa by 2010. The prospect of such a ‘scaling-up’ sounds a blessing to Ministers of Finance struggling to balance their budgets but the reality is more complex. Many African countries already receive large aid inflows relative to the scale of their economies and budgets. A doubling of this could bring in extra foreign exchange, investible resources and government revenues on a scale typically equivalent to a fifth of national income, 100% of existing investment and a very large proportion of tax revenues. Whatever the benefits, a ‘macroeconomic shock’ on this scale could not fail to have large balance of payments and monetary and fiscal consequences, posing real challenges for economic management. There are also related questions about absorptive capacity. The purpose of this paper is to explore the consequences of aid scaling-up for macroeconomic management, to report on the results of recent research and to consider the policy implications. 1.1 Coverage of study This synthesis paper tries to distil some general lessons and findings on the macroeconomic consequences of scaling up aid flows. It draws on three main sources:-
i. four country case studies commissioned by ODI (Mauritania, Mozambique, Sierra Leone, Tanzania);
ii. a recent IMF study of the macroeconomic consequences of scaling up aid that presented
five country case studies based on a common analytical framework (Ethiopia, Ghana, Mozambique, Tanzania, Uganda) (IMF, 2005; Aiyar et al., 2005); and
iii. a review of the literature on commodity export booms, to explore whether it provides
lessons relevant to the macroeconomics of increased aid. Two of the countries covered by ODI were also studied by the IMF, giving a total sample of seven countries. The ODI studies were commissioned before the IMF study was produced, and did not have a common methodology. In order to facilitate the drawing of conclusions, an attempt has been made to apply a broadly similar analytical framework to present some of the material from the two ODI cases not covered in the IMF study. The focus on Africa is appropriate, given that the region has by far the highest relative aid levels, and is expected to receive the steepest increase in future aid in order to reach the MDGs. According to projections by OECD/DAC, aid to Africa is expected to more than double between 2004 and 2010.1 1.2 Data problems There are serious disparities in data on aid between different sources. The OECD/DAC publishes data on donor commitments and disbursements, based on donor self-reporting, and is the source for statistics published in the World Bank’s World Development Indicators. Independently, governments collect data on donor commitments and disbursements. These tend to differ from the OECD/DAC statistics and to be generally lower for a number of reasons:
1 See oecd.org/dataoecd/57/30/35320618.pdf.
2
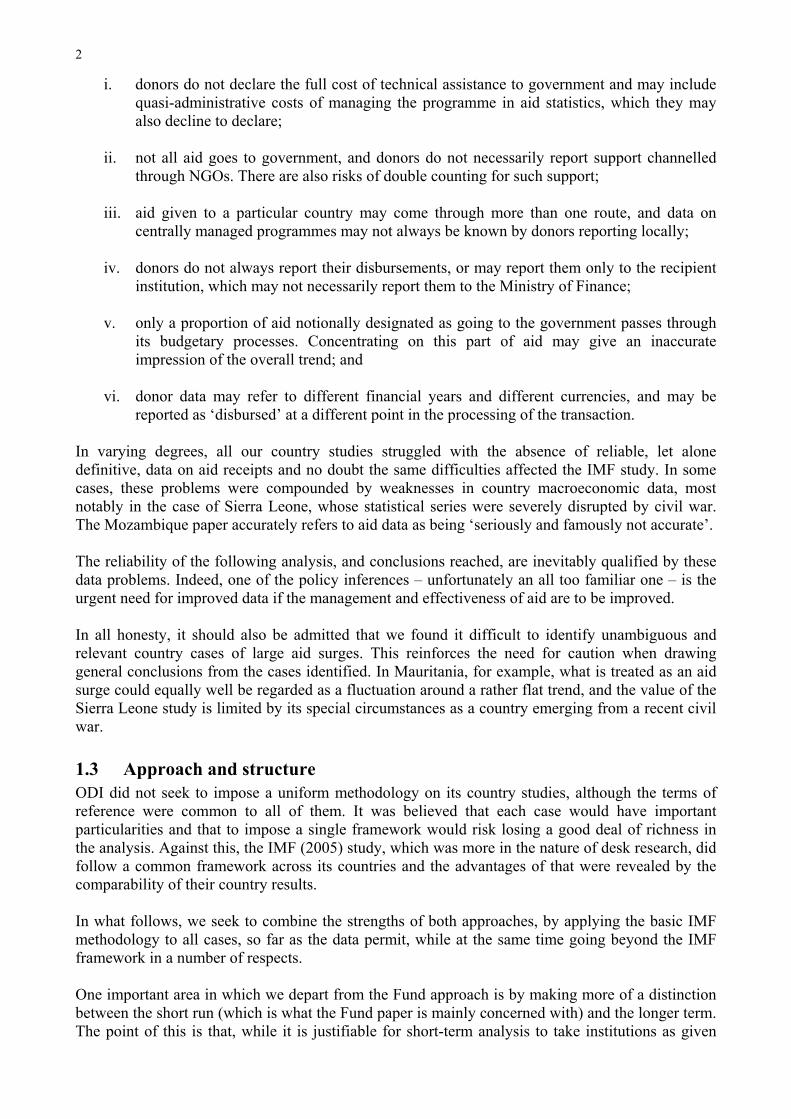
i. donors do not declare the full cost of technical assistance to government and may include quasi-administrative costs of managing the programme in aid statistics, which they may also decline to declare;
ii. not all aid goes to government, and donors do not necessarily report support channelled
through NGOs. There are also risks of double counting for such support; iii. aid given to a particular country may come through more than one route, and data on
centrally managed programmes may not always be known by donors reporting locally; iv. donors do not always report their disbursements, or may report them only to the recipient
institution, which may not necessarily report them to the Ministry of Finance; v. only a proportion of aid notionally designated as going to the government passes through
its budgetary processes. Concentrating on this part of aid may give an inaccurate impression of the overall trend; and
vi. donor data may refer to different financial years and different currencies, and may be
reported as ‘disbursed’ at a different point in the processing of the transaction. In varying degrees, all our country studies struggled with the absence of reliable, let alone definitive, data on aid receipts and no doubt the same difficulties affected the IMF study. In some cases, these problems were compounded by weaknesses in country macroeconomic data, most notably in the case of Sierra Leone, whose statistical series were severely disrupted by civil war. The Mozambique paper accurately refers to aid data as being ‘seriously and famously not accurate’. The reliability of the following analysis, and conclusions reached, are inevitably qualified by these data problems. Indeed, one of the policy inferences – unfortunately an all too familiar one – is the urgent need for improved data if the management and effectiveness of aid are to be improved. In all honesty, it should also be admitted that we found it difficult to identify unambiguous and relevant country cases of large aid surges. This reinforces the need for caution when drawing general conclusions from the cases identified. In Mauritania, for example, what is treated as an aid surge could equally well be regarded as a fluctuation around a rather flat trend, and the value of the Sierra Leone study is limited by its special circumstances as a country emerging from a recent civil war. 1.3 Approach and structure ODI did not seek to impose a uniform methodology on its country studies, although the terms of reference were common to all of them. It was believed that each case would have important particularities and that to impose a single framework would risk losing a good deal of richness in the analysis. Against this, the IMF (2005) study, which was more in the nature of desk research, did follow a common framework across its countries and the advantages of that were revealed by the comparability of their country results. In what follows, we seek to combine the strengths of both approaches, by applying the basic IMF methodology to all cases, so far as the data permit, while at the same time going beyond the IMF framework in a number of respects. One important area in which we depart from the Fund approach is by making more of a distinction between the short run (which is what the Fund paper is mainly concerned with) and the longer term. The point of this is that, while it is justifiable for short-term analysis to take institutions as given

3
and to disregard the supply-side effects of aid inflows, for the longer term both factors need to be taken into account more. For the purposes of short-term analysis and in the spirit of the IMF paper, a key distinction is made between the absorption and spending of aid inflows. When aid is transferred to an economy, it is useful to distinguish between the transfer of foreign exchange and the spending that it helps to finance. The foreign exchange accrues in the first instance to the central bank reserves, while the recipient of the aid (usually the government, although it could be an NGO) is credited with the value in domestic currency, which is available to spend or save. If the aid is provided ‘in kind’, the spending of the aid is simultaneous with the use of the foreign exchange. Even in this case, the distinction is valuable, however, since the aid might pay for imports that would otherwise have been funded from other sources, increasing both the foreign exchange available for other purposes and the domestic bank balances available for spending. We follow the IMF in referring to the utilisation of the foreign exchange as ‘absorption’, and to the utilisation of the domestic counterpart as ‘spending’ of the aid (Box 1).
Box 1: The distinction between absorption and spending of aid
When aid is transferred to an economy the foreign exchange accrues in the first instance to central bank reserves, while the recipient government is credited with the value in domestic currency. We refer to the utilisation of the foreign exchange as ‘absorption’, and to the utilisation of the domestic counterpart as ‘spending’ of the aid. Aid is ‘absorbed’ when the balance of payments current account deficit (excluding aid) increases, either because more is imported or increased domestic demand causes producers to export less. Aid is ‘spent’ when the fiscal deficit (excluding aid) increases, either as a result of higher government expenditure, or lower domestic revenue.
• Absorption is defined as the widening of the current account deficit (excluding aid) due to more aid.
Absorption depends both on exchange rate policy and on policies that influence the demand for imports.
• Spending is defined as the widening of the fiscal deficit (excluding aid) due to additional aid. The importance of this distinction is that aid only enables an economy to invest and consume more by
financing an increase in imports. If the aid is simply spent on domestically produced goods and services, it does nothing to increase their supply. Unless there is spare capacity in the economy, the inevitable result is an increase in inflationary pressures.
The importance of the distinction is that aid only enables an economy to invest and consume more than it otherwise would, by financing an increase in net imports of goods and services. Real resources are only transferred when the aid results in an increase in net imports. If the aid is simply spent on domestically produced goods and services, it does nothing to increase their supply. Unless there is spare capacity in the economy, extra local expenditure financed by aid will simply squeeze out existing customers for the goods and services bought with the aid. If the increased expenditure financed by aid does not result in increased net imports, it achieves nothing that could not be achieved through expansionary domestic fiscal and monetary policy. The qualification in the last paragraph concerning the existence of spare capacity is potentially important, however. All economies operate within their production possibility boundaries, perhaps especially so in Africa, and in that sense there is always spare capacity. However, the obstacles to eliminating this are often profound and long-term, and it is only exceptionally the case in African economies that much of the spare capacity is a result of demand deflation. In that sense, the assumption of full capacity has justification, at least in the short term. However, we should note as a special case the situation of economies bouncing back after civil conflict or some other major catastrophe, such as Sierra Leone. In such cases, it is indeed possible to achieve quite rapid increases in output by improved utilisation of production capabilities that had been dislocated by the catastrophe.

4
When aid is spent on local goods and services, the normal route is that donors provide foreign exchange to the central bank, which credits the government account with the local currency equivalent. Absorbing the aid requires the central bank to sell the foreign exchange to finance imports. This may require some appreciation of the real exchange rate to persuade the market to buy the foreign exchange. The extent of the real appreciation will depend on the responsiveness of imports and exports to changes in the level of demand and in relative prices. The necessary adjustment may come through first round effects (government uses the aid to finance imports) or through indirect second round effects (those from whom government makes purchases increase their net imports). The necessary adjustment can come either through increased demand for imports, or through reduced supply of exports as firms respond to increased demand and better relative prices by diverting some of their output to the domestic market. In African-type economies, there are typically limited possibilities of switching export production to meet domestic demand, so the main adjustment is likely to be effected by increased imports. The adjustment in relative prices that may be required to enable the increased aid to be absorbed may raise fears of ‘Dutch Disease’, whereby the traded goods sectors of the economy lose competitiveness as a consequence of exchange-rate appreciation. If the traded goods sectors are regarded as particularly important because of their leading role in transferring technology, it is argued that the need for a real appreciation can damage the long-run growth potential of the economy. The benefits of the aid-funded expenditures would need to be offset against any negative effects. The remainder of this paper is structured as follows. Section 2 sets out some salient facts about the countries studied, particularly the recent histories of aid flows into them. Section 3 then briefly considers what might be an ideal policy response to an aid surge, drawing on lessons from past commodity booms and examining the factors which might determine an optimal policy response. The determination of an optimal response turns out to be more complex than might have been expected. Section 4 presents findings from the country studies, applying the absorption-spending distinction just described, and Section 5 takes this further by focusing on the important question of whether an aid surge is likely to generate Dutch Disease symptoms. Section 6 concludes and examines the implications of the study for the scaling-up of aid.
5
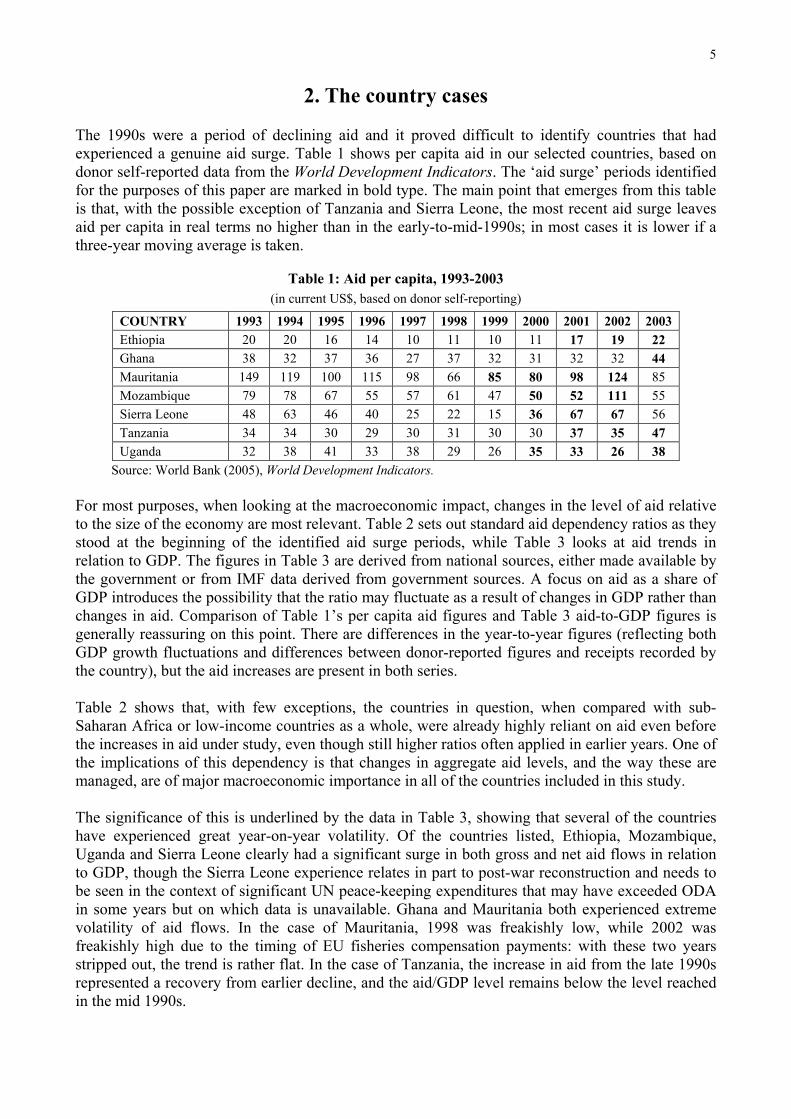
2. The country cases The 1990s were a period of declining aid and it proved difficult to identify countries that had experienced a genuine aid surge. Table 1 shows per capita aid in our selected countries, based on donor self-reported data from the World Development Indicators. The ‘aid surge’ periods identified for the purposes of this paper are marked in bold type. The main point that emerges from this table is that, with the possible exception of Tanzania and Sierra Leone, the most recent aid surge leaves aid per capita in real terms no higher than in the early-to-mid-1990s; in most cases it is lower if a three-year moving average is taken.
Table 1: Aid per capita, 1993-2003 (in current US$, based on donor self-reporting)
COUNTRY 1993 1994 1995 1996 1997 1998 1999 2000 2001 2002 2003 Ethiopia 20 20 16 14 10 11 10 11 17 19 22 Ghana 38 32 37 36 27 37 32 31 32 32 44 Mauritania 149 119 100 115 98 66 85 80 98 124 85 Mozambique 79 78 67 55 57 61 47 50 52 111 55 Sierra Leone 48 63 46 40 25 22 15 36 67 67 56 Tanzania 34 34 30 29 30 31 30 30 37 35 47 Uganda 32 38 41 33 38 29 26 35 33 26 38
Source: World Bank (2005), World Development Indicators. For most purposes, when looking at the macroeconomic impact, changes in the level of aid relative to the size of the economy are most relevant. Table 2 sets out standard aid dependency ratios as they stood at the beginning of the identified aid surge periods, while Table 3 looks at aid trends in relation to GDP. The figures in Table 3 are derived from national sources, either made available by the government or from IMF data derived from government sources. A focus on aid as a share of GDP introduces the possibility that the ratio may fluctuate as a result of changes in GDP rather than changes in aid. Comparison of Table 1’s per capita aid figures and Table 3 aid-to-GDP figures is generally reassuring on this point. There are differences in the year-to-year figures (reflecting both GDP growth fluctuations and differences between donor-reported figures and receipts recorded by the country), but the aid increases are present in both series. Table 2 shows that, with few exceptions, the countries in question, when compared with sub-Saharan Africa or low-income countries as a whole, were already highly reliant on aid even before the increases in aid under study, even though still higher ratios often applied in earlier years. One of the implications of this dependency is that changes in aggregate aid levels, and the way these are managed, are of major macroeconomic importance in all of the countries included in this study. The significance of this is underlined by the data in Table 3, showing that several of the countries have experienced great year-on-year volatility. Of the countries listed, Ethiopia, Mozambique, Uganda and Sierra Leone clearly had a significant surge in both gross and net aid flows in relation to GDP, though the Sierra Leone experience relates in part to post-war reconstruction and needs to be seen in the context of significant UN peace-keeping expenditures that may have exceeded ODA in some years but on which data is unavailable. Ghana and Mauritania both experienced extreme volatility of aid flows. In the case of Mauritania, 1998 was freakishly low, while 2002 was freakishly high due to the timing of EU fisheries compensation payments: with these two years stripped out, the trend is rather flat. In the case of Tanzania, the increase in aid from the late 1990s represented a recovery from earlier decline, and the aid/GDP level remains below the level reached in the mid 1990s.

6
Table 2: Pre-surge aid dependence (aid dependency ratios (%) for year immediately prior to, or at commencement of, surge period)
Aid/GNI Aid/gross capital formation
Aid/imports Aid/total govt. expenditures
Mauritania 17 87 33 66 Mozambique 28 62 20 (52) Sierra Leone 46 564 110 49† Tanzania 13 78 54 33 Ethiopia 18 96 54 (67) Ghana 13 51 19 n.av Uganda 14 69 48 64 Sub-Saharan Africa** 5 23 11 n.av All low income countries**
2 11 8 n.av
Notes: *On-budget aid only, *2001 figures, † On-budget aid only. Authors’ estimates in parentheses. Sources: World Bank (2005), World Development Indicators; ODI country case studies.
Table 3: Aid trends in seven African countries Country 1995 1996 1997 1998 1999 2000 2001 2002 2003 IMF case study countries Ethiopia Gross aid (%GDP) 11.7 8.8 24.3 18.1 17.5 Net aid (%GDP) 4.7 6 8.8 16.1 15 Ghana Gross aid (%GDP) 8.7 7.5 8.8 14.9 6.1 9.5 Net aid (%GDP) 3.2 2.8 -0.3 10.6 2.6 7.1 Mozambique Gross aid (%GDP) 13.4 13.4 20 16.7 18.5 17.4 Net aid (%GDP) 11.6 11.4 20.4 15.4 16.4 15 Tanzania Gross aid (%GDP) 13.3 12.7 12.8 12.5 10.5 10.5 Net aid (%GDP) 4.6 6.6 7.5 7.9 6.6 7.6 ODI Case Study ODA (%GDP) 17 14 12 12 11 11 13 13 16 Uganda Gross aid (%GDP) 9.8 10.3 13.9 13.8 12.9 Net aid (%GDP) 8.4 9.4 14.2 13.7 12.9 ODI case study countries Mauritania Total official gross 26.4 29.7 25.8 22.5 27 28.2 27.8 43.9 25 ODA net 21.8 25.2 22.3 16.8 22.7 22.9 24.4 34.9 20.7 Sierra Leone Gross aid (%GDP) 23 20 14 16 11 29 46 45 37 Net aid (%GDP)
Sources: IMF (2005); ODI country case studies.

7
To put these recent aid surges in context, it is instructive to look at longer term trends (Table 4 and Figure 1).
Table 4: Average aid as % of GNI: 5 year periods 1970-2003 1970-74 1975-79 1980-84 1985-89 1990-94 1995-99 2000-03 Ethiopia .. .. 4.1 10.1 14.5 11.7 18.1 Ghana 2.2 3.4 3.8 8.9 10.8 9.0 11.9 Mauritania 10.1 32.9 26.3 24.8 25.0 22.4 25.4 Mozambique 5.8 26.2 60.5 32.5 35.1 Sierra Leone 2.1 3.7 6.6 11.9 22.7 17.4 35.9 Tanzania 8.5 25.4 13.4 13.5 Uganda 2.0 1.4 7.3 6.0 20.1 11.8 13.8
Source: World Bank (2005), World Development Indicators These longer term trends reveal that the factors driving aid surges change over time, and are rarely sustained for more than a few years. The long-term experience of each of our country examples is of wild swings in aid receipts. For example:
• Aid to Ghana surged from less than 5% in the early 1980s to 14% by 1989 as economic reforms made it a donor favourite. This sank back towards 7% of GNI in the 1990s as economic performance became more erratic, before experiencing a somewhat stop-start revival over the last few years.
• Mauritania has also experienced large swings in aid, first from Arab donors with aid peaking
at 47% of GNI in 1978 and swinging thereafter between less than 20% to over 30% of GNI with no clear trend.
• Aid to Mozambique was over 50% of GNI during the post-war reconstruction years, falling
to about 21% of GNI in 1999 before the current surge. • Sierra Leone has suffered a series of erratic spikes and collapses in aid depending on the
progress of domestic conflict and faltering reform efforts. • Tanzania has experienced three distinct aid surges. The first, between 1970 and 1982,
coincided with donor enthusiasm for Ujamaa policies, succeeded by collapsing aid as disillusion set in. The adoption of economic reforms in 1986 saw a second surge until 1992, when aid reached 30% of GNI, before donor dissatisfaction with government commitment led to a second collapse in aid to around 11% of GNI. The most recent aid surge to about 16% of GNI has yet to bring it back to the levels experienced in the mid-1990s.
• Uganda received strong support for the successful reform efforts introduced in the late
1980s, with aid peaking at 26% of GNI in 1992. The government steadily reduced aid dependence as the economy grew, to about 11% of GNI by 1999, before the renewed aid surge associated with donor support for the poverty strategy.
The key point about each of these histories is that the current donor promise to increase aid for the MDGs and sustain it thereafter for as long as it is required would, if implemented, represent a very sharp break from past experiences.

Figu
re 1
0.0
10.0
20.0
30.0
40.0
50.0
60.0
70.0
80.0
90.0
100.
0
1970
1972
1974
1976
1978
1980
1982
1984
1986
1988
1990
1992
1994
1996
1998
2000
2002
Aid (% of GNI)
Ethi
opia
Gha
naM
aurit
ania
Moz
ambi
que
Rw
anda
Sier
ra L
eone
Tanz
ania
Uga
nda
Sour
ce: W
orld
Ban
k (2
005)
, Wor
ld D
evel
opm
ent I
ndic
ator
s.

9
Returning to the recent aid surge, which is the main topic of analysis in this paper, Table 5 shows net aid in these countries alongside brief data on economic performance. The recent surge was accompanied by an improvement in GDP growth in four of the countries, and with continuing good growth performance (albeit slightly slower) in Mozambique and Uganda. Slow growth in Ethiopia was due to drought. Inflation remained under control in three countries, and showed progress towards stabilisation in a further three countries, leaving only Mozambique with evidence of a flare-up in inflation from previously low levels. The aid surge was accompanied by higher investment in six countries and little change in Ghana, but private investment fell in Tanzania and Ethiopia. Increased aid responded to the ending of wars in Sierra Leone and Ethiopia, introduction of improved economic performance and policies in Mauritania and Tanzania, and continued good performance in Uganda and Mozambique, while it fluctuated with variable economic policy performance in Ghana.
Table 5: Aid and economic performance Country Indicator Pre-surge Aid-surge ODI case studies Mauritania Period covered 1996-98 1999-02 Net ODA as % GDP 21.4 26.2 GDP growth p.a. (%) 4.1 4.4 Inflation p.a. (%) 6 4 Investment (%GDP) 20.3 30 Non-Govt investment (%GDP) 14.6 21.5 Sierra Leone Period covered 1997-99 2000-03 Gross ODA as % GDP 13.7 39.2 GDP growth p.a. (%) -8.9 5.5 Inflation p.a. (%) 35 negative Investment (%GDP) 4.8 8.7 IMF & ODI cases Mozambique Period covered 1998-99 2000-02 Net ODA as % GDP 11.5 17.4 GDP growth p.a. (%) 9.7 7.3 Inflation p.a. (%) 1.8 13 Investment (%GDP) 30.5 41 Tanzania Period covered 1998-99 2000-03 Net ODA as % GDP 5.6 7.4 GDP growth p.a. (%) 2.8 5.4 Inflation p.a. (%) 10 4.9 Investment (%GDP) 15.5 17.8 Private investment (%GDP) 12.4 11.5 IMF-only cases Ethiopia Period covered 1999-00 2001-03 Net ODA as % GDP 5.3 13.3 GDP growth p.a. (%) 5.7 1.8 Inflation p.a. (%) 4.7 2.2 Investment (%GDP) 16.4 19.6 Private investment (%GDP) 9.8 9.4 Ghana Period covered 1998-00 2001-03 Net ODA as % GDP 1.3 6.8 GDP growth p.a. (%) 4.1 (1999-00) 4.6 Inflation p.a. (%) 85 20.5 Investment (%GDP) 24 23 Private investment (%GDP) 14 14 Uganda Period covered 1999-00 2001-03 Net ODA as % GDP 10.1 13.5 GDP growth p.a. (%) 6.6 5.6 Inflation p.a. (%) 3 2.7 Investment (% GDP) 19.6 21 Private investment (% GDP) 11.2 13.9
Sources: IMF (2005) and ODI country case studies.

10
3. How should aid surges be managed? (a) Lessons from commodity booms2 The literature on commodity booms suggests a number of relevant lessons for managing the consequences of a surge in aid flows. First, it reveals a rather strong link between terms of trade instability and fluctuations in economic growth in affected countries, explaining as much as half of variations in their growth rates. This is worth emphasising because, given the levels of aid dependence revealed in Table 2 and to say nothing of the much higher ratios that would follow a major aid surge, it is likely that in many cases the magnitude of aid shocks could easily be larger than the terms of trade shocks, with a correspondingly greater potential for economic destabilisation, in either direction. However, perhaps the main conclusion from the literature on commodity booms is that the gains to output or income have been at best meagre and short-lived, while the costs resulting from negative shocks have been both significant and of longer duration. The causes of the asymmetry that results in meagre benefits from the boom, but prolonged costs from the subsequent reduction in revenues, can be summarised as:
• Incorrectly assuming that a temporary increase in revenues would be sustained. If the increase is assumed to be permanent, both governments and private actors are more likely to increase consumption and incur long-term spending obligations that are costly to exit from. For example, Malaysia borrowed on the expectation that the oil price increase of 1979/80 would be sustained, and faced a period of painful adjustment and negative growth in the mid-1980s when real prices returned to much lower levels. Nigeria and Jamaica incurred huge debts in the expectation that commodity booms would continue.
• Deterioration in the quality of public expenditure in the boom years. This has been well
documented by Lal and Myint (1996). It is far more difficult for a government to resist spending pressures when revenues increase. Nigeria during the oil boom years is the most notorious example of wasteful public expenditure, but there are many other examples: Malawi following a tobacco boom implemented projects previously regarded as unviable; Trinidad used oil revenues to sustain consumption subsidies; Mexico used oil revenues to protect the domestic private sector from oil price rises; Côte d’Ivoire expanded the numbers and pay of public sector employees. However, this type of unrealism is not inevitable and, in Africa, Botswana has shown how a commodity bonanza can be harnessed for long-term development.
• Although the early stages of a commodity boom are often accompanied by increased saving,
including acquiring overseas assets, the literature suggests that the foreign savings tend to be repatriated before the end of the boom, and tend not to extend the boom across over time. In terms of our methodology, the boom revenues, with rare exceptions, tend to be fully absorbed by the economy.
There are some very direct implications from this literature for the management of aid surges:
• Additional revenues are often badly spent and it is therefore vital to ensure that credible plans and budgets have been prepared, setting out how the additional resources will be used
2 This section draws heavily on a background paper commissioned from Adeel Malik. His paper provides extensive bibliographical
referencing for the empirical statements made below.

11
to accelerate progress. In the aid context, crucial factors will be the strength of in-country institutions’ bearing upon the quality of fiscal management (including the extent of financial sector deepening) and especially the underlying nature of their political systems. Exchange-rate policy is likely to be an important variable. The extent to which donors are able to influence the quality of public finance management will also be a factor.
• Our analysis of aid trends shows that, like commodity booms, aid surges have often proved
short-lived. It is entirely reasonable and responsible to smooth the erratic nature of aid by absorbing only a portion of the increase, using the foreign exchange reserves to prolong the duration of higher aid and insure against a mistakenly optimistic view of the permanence of the surge. A series of gradual incremental increases will almost certainly be easier to manage than a rapid and large scaling-up.
• It is also sensible for governments to err on the side of caution in spending increased aid
revenues, having correctly identified that the costs of future aid cuts can exceed the benefits of the aid boom.
• Whether an aid increase is viewed by recipient authorities as permanent or temporary is a
crucial determinant of appropriate policy responses. Improving the predictability and reliability of aid flows is essential if they are to be well used and if costs of subsequent adjustment to aid levels are to be manageable. Aid recipients need to be aware that it is far easier to increase public expenditure than to reduce it, and also of the dangers of repeating the experience of commodity boom episodes when fleeting benefits were followed by sustained and significant costs.
(b) Desirable combinations of absorption and spending In considering how governments should react to an aid surge, it is important to be clear about the limitations of the analysis. First, because the focus here is on macroeconomic management, we take a relatively short-term view. As a result, we set aside the potential longer-run effects of the aid on production and incomes. This becomes an important consideration, for example, when we come in Section 5 to consider the Dutch Disease issue. We also set aside complications arising from time-lags between absorption and spending. These could be rather strongly expansionary or inflationary when spending occurs more quickly than absorption, as was established in an earlier literature on the macroeconomics of counterpart funds.3 Furthermore, the short-term focus tends to gloss over one of the other conclusions of the counterpart funds literature; that general equilibrium effects are likely to differ from first-round effects (Bruton, 1992). It is important to bear these limitations in mind. Subject to these caveats and following the IMF, we can identify four polar combinations of absorption and spending:
i. Neither absorb the foreign exchange, nor spend the counterpart. The aid is saved, with the foreign exchange added to reserves. The counterpart is used by government to reduce its indebtedness but there is no change in the level of demand or the growth of the economy.
ii. Spend the counterpart, without absorbing the foreign exchange. If the foreign exchange
is added to reserves but government spends the counterpart on local goods and services, the aid increases the monetary base and raises domestic demand, which is inflationary unless there is spare capacity in the economy. If there is spare capacity, government could anyway have loosened fiscal or monetary policy to bring it into use, and it can be argued that
3 On this, see the special issue of the IDS Bulletin edited by Simon Maxwell (1992).

12
anything achieved by the aid could have been done equally well without it, by relaxing macroeconomic policy. Spending without absorbing is thus closely analogous to deficit financing, the macroeconomic effects of which are rather well understood (Roemer, 1989).
iii. Absorb the foreign exchange, without spending the counterpart. If government saves the
domestic currency counterpart but the foreign exchange is sold to finance increased net imports, the effect of the aid on the macro-economy will be deflationary, taking demand out of the economy as foreign exchange is sold for domestic currency and is then used to finance increased net imports. This can be a sound use of aid if the budget deficits and inflation need to be reduced. It may be an effective way of assisting the growth of the private sector, via reduced use of the inflation tax and less crowding-out in credit markets.
iv. Fully absorb the foreign exchange and spend the counterpart. If the aid is entirely spent
on additional imports, then the foreign-exchange reserves and the government budget deficit are unchanged. The economy enjoys a boost through increased net imports, but the increased demand is matched by increased supply of net imports and there is no effect on the domestic supply-demand balance. Unless all the aid is used to finance government imports that would not otherwise have been purchased, absorbing all the foreign exchange in higher net imports may require an appreciation of the real exchange rate, to persuade purchasers to switch enough demand from domestic to foreign goods and services.
A key point highlighted by this four-way classification is that it is the absorption of the foreign exchange that is critical, since it is only when additional foreign resources enter the economy that aid has an impact on the levels of production, consumption and investment that the economy can attain. On the face of it, option (iv) seems the most obviously desirable of these combinations: fully absorb and fully spend – what the IMF describes as the ‘textbook solution’. Certainly, this is likely to be the combination with which donors, concerned to justify their budgets, are most likely to be comfortable. However, it all depends…
a) On the quality of spending decisions and the effects of large increases in resources on this (see above on commodity booms). If a surge can only be spent at the cost of lowering the productivity of spending, deferring spending and smoothing it over a longer period may well be preferable.
b) Even if the quality of decisions were not affected, whether immediate spending were
desirable would also depend on how the money would be spent, e.g. as between tradeable and non-tradeable sectors, between consumption and investment, and between its direct use for public sector development or its re-channelling to the private sector, e.g. through the banking system.
c) On the initial state of the public finances. Where the government is operating from hand to
mouth, without reserves to smooth cash flow imbalances, and/or is using the non-payment of bills to the private sector as a management tool, there is a strong prime facie case for not spending all the aid increase and devoting it instead to eliminating arrears in payments and building a cushion of reserves. The same would also hold where the initial situation was characterised by excessive monetary expansion and unwanted inflationary pressures. Similarly, as is often the case in low-income countries, where the domestic public debt is large in relation to government spending and other macro magnitudes, and where the servicing of that debt is onerous (probably exacerbated by the effects of past government borrowing in raising interest-rate structures), there is a similarly strong prima facie case for

13
using at least part of aid increases to retire public debt. Indeed, to do so may be a valuable way in which an aid surge can be used indirectly to encourage the growth of the private sector, by lowering interest rates and improving its access to credit.
d) On the overall macroeconomic situation. For example, spending all of an aid surge in the
midst of a commodity boom might not be a good idea. Similarly, absorbing it all through increased imports might not be the best course when external debt-servicing claims are large and/or foreign-exchange reserves are low.
e) On expectations: it should need no further emphasis that what would be an optimal response
will be crucially influenced by the authorities’ expectations about whether the aid surge is temporary or will be sustained.
So the most appropriate response is a contingent matter that cannot be settled without reference to a rather wide range of considerations. The need for a case-by-case approach is indicated. Perhaps the nearest we can get to a general golden rule is for government to avoid large excesses of ‘spending’ over ‘absorption’, for such excesses threaten to generate inflationary pressures, with adverse consequences for growth and poverty reduction. The private sector is also apt to be harmed, as a result of attempts by the central bank to control the situation through credit stringency and higher interest rates.

14
4. Findings from the country studies (a) Was the increased aid absorbed? Looking at the experience of our seven countries (Table 6), Tanzania and Ghana absorbed none of the aid increase, Ethiopia and Uganda absorbed less than one third, and Mozambique about two thirds. Only Mauritania appears to have absorbed the aid increase in full but that is rather misleading. The data problems in Sierra Leone make it difficult to interpret, since official development assistance was increasing at a time when (unrecorded) peacekeeper spending may have been falling. The modest increase in foreign-exchange reserves suggests that most of the aid increase was absorbed, however.
Table 6: Was the aid increase absorbed? (all figures expressed as % of GDP)
Country Pre-aid surge Aid surge Difference Incremental aid absorbed? Mauritania 1996-1998 1999-2002 Net aid inflows 21.4 26.2 4.8 Non-aid current account -5.9 -11.2 -5.3 Non-aid capital account 2.7 5.9 3.2 Change in reserves -5.0
Fully absorbed in the sense that net imports increased by more than aid, though increased imports were partly reflecting inflows associated with foreign direct investment in oil, and foreign-exchange reserves increased by more than the aid increase.
Sierra Leone 1997-99 2000-03 Gross aid inflows 13.7 39.2 25.5 Current account before transfers
-7.1 -17.4 -10.3
Change in reserves -2.2
Not easy to see what is happening due to weak aid data, and lack of data on UN peace-keeping expenditure. Very modest increase in reserves and substantial increase in current account deficit suggests aid was mostly absorbed.
Tanzania 1998-99 2000-04 Net aid inflows 5.6 7.8 2.2 Non-aid current account -9.2 -6.8 2.3 Non-aid capital account 4.1 1.7 -2.4 Change in reserves -0.6 -2.7 -2.2
Not absorbed 0%
Mozambique Net aid inflows 11.5 17.4 5.9 Non-aid current account -19.7 -23.6 -3.9 Non-aid capital account 8.7 8.3 -0.4 Change in reserves -0.5 -2.1 -1.7
Mostly absorbed 66%
Ethiopia Net aid inflows 5.3 13.3 8.0 Non-aid current account -9.2 -10.8 -1.6 Non-aid capital account 2.0 1.3 -0.7 Change in reserves 1.9 -3.8 -5.7
20% absorbed through current account, 71% added to reserves, some deterioration in non-aid capital account.
Ghana Net aid inflows 1.3 6.8 5.5 Non-aid current account -13.4 -3.4 10.0 Non-aid capital account 9.9 2.1 -7.8 Change in reserves 2.2 -5.4 -7.6
Not absorbed, reserves increase by more than the value of incremental aid, current account improves, capital account deteriorates.
Uganda Net aid inflows 8.9 13.6 4.7 Non-aid current account -10.1 -11.4 -1.3 Non-aid capital account 1.6 -1.1 -2.8 Change in reserves -0.4 -1.1 -0.7
Absorbed 27% through current account, but 60% through deterioration of capital account, 15% added to reserves.
Source: IMF (2005) and ODI country case studies, supplemented by IMF country reports. Note a negative change in reserves denotes an increase.

15
Ethiopia, Ghana, Mozambique and Sierra Leone had very low levels of foreign-exchange reserves at the beginning of the aid surge (Table 7), making it reasonable to give some priority to re-building them rather than fully absorbing the aid increase. Ghana also experienced a roller-coaster pattern of aid flows and may have been nervous about spending increases that might not be sustained. In Mozambique, there was a conscious policy of rebuilding reserves and avoiding full absorption as a prudent response to the proven unpredictability of year-to-year aid receipts. Mauritania is expecting a big increase in future revenues and export earnings as oil development comes on stream, and therefore has no pressing need to save aid. Although the current account deterioration exceeded the aid increase, it is slightly misleading to describe this as ‘full absorption’ of the aid. Mauritania was in the fortunate position where large capital inflows and a significant aid increase meant it was able to finance an increase in net imports larger than the aid increase, while also increasing reserves by a value roughly equal to the cumulative increase on average aid levels in the pre-surge period. We have therefore classed it as a case of partial absorption. The Mauritania study also argues that, perhaps more by good fortune than by design, the pattern of aid receipts was counter-cyclical with reductions in export earnings arising from declining world prices in 2000-02, although it was not until 2002 that there was any large deterioration in the terms of trade. The other three countries all started with a relatively comfortable foreign exchange position, yet did not fully absorb the increased aid.
Table 7: Foreign-exchange reserves, in months of imports: pre- and post-aid surge Pre-surge (Year) Aid surge (Year) Ethiopia 2.2 (1999-2000) 3.8 (2002/03) Ghana 1.3 (2000) 4.9 (2003) Mauritania 4.6 (1998) 8.7 (2002) Mozambique 5.5 (1999) 5.4 (2003) Sierra Leone 2.0 (1999) 2.3 (2003) Tanzania 5.3 (2000/01) 7.0 (2003/04) Uganda 5.4 (2000/01) 6.6 (2003/04)
Source: IMF Country Reports, balance of payments tables Concerns to protect the profitability of exporting may have been part of the reason why central banks chose not to sell the additional foreign exchange. None of the countries allowed the real exchange rate to appreciate. All of the IMF case study countries experienced real exchange-rate (REER) depreciation during the aid surge period, with the exception of Ghana, where the rate recovered very slightly after precipitous decline in the pre-aid period. The REER has been steadily depreciating in Mauritania since 1995. It also depreciated in Sierra Leone, partly reflecting the relief of supply shortages after the war. The case of Tanzania suggests that government fears regarding the consequences of real exchange-rate appreciation may have had some foundation. During the second half of the 1990s, a combination of rapid growth in foreign direct investment in mineral extraction and rising aid resulted in a real appreciation of the exchange rate by 25%. The appreciation occurred despite a build-up of reserves, as increased foreign exchange receipts from aid and FDI were not matched by increased imports in an economy that was growing relatively sluggishly at 3-4% per annum. As theory would predict, Tanzanian exports showed a weak performance during the period of real exchange-rate appreciation. The Bank of Tanzania was only able to reverse the appreciation after 2000 by more aggressive reserve accumulation and slightly looser credit control. Exports grew rapidly as the rate depreciated. Although much of this represented gold exports coming on stream and could not be attributed to the change in the exchange rate, manufactured goods, fish products, and other non-traditional exports also took off after 2000. However, one consequence of the reserve accumulation, as we have seen, was that the aid surge was not absorbed.

16
Table 8: Tanzania: real exchange rate and trade ratios
1996 1999 2000 2004 REER (1995=100) 108 135 100 Exports:GDP (%) 20 13.5 14 20 Imports:GDP (%) 31 26 23 30 Forex reserves in months of imports
2.6 4.1 5.6 7.2
Source: Tanzania country study. It appears from the above that the seven countries avoided any symptom of ‘Dutch Disease’, but did so in part by locking up a large share of the aid increase in foreign exchange reserves, in order to permit continued real depreciation of their effective exchange rates. We take up these themes later, with the Dutch Disease issue examined more fully in Section 5. Although the increase in aid receipts by Ethiopia, Mozambique and Uganda was of the same broad order of magnitude as the envisaged doubling of aid to Africa by 2010, the increased aid that was actually absorbed by these three countries was much less: roughly a two thirds increase in four years in Mozambique, and much less in the other two. Further absorbing the large increases now on offer would require a far more relaxed attitude to the prospect of real exchange-rate appreciation but with potentially harmful results for the production of tradeables. (b) Was increased aid spent? When aid is provided to a country, the foreign exchange usually accrues to the Central Bank, while the counterpart value in domestic currency is credited to a government bank account. Government can use the domestic counterpart of an aid increase in three ways: increase public expenditure, reduce revenue (i.e. finance a tax cut), or reduce the public debt. A tax cut passes the financial benefit to the private sector. A reduction in public sector debt may have the same effect if it eases credit conditions for the private sector. Macroeconomic problems can arise through poor co-ordination between decisions on the absorption of the foreign exchange and decisions on the utilisation of the domestic counterpart. A number of practical difficulties arise when aid is channelled via routes that do not automatically get recorded in government fiscal accounts, either because donors provide aid ‘in kind’, in the form of directly procured goods and services, or because aid is channelled via some alternative disbursement route not forming part of the fiscal accounts. A portion of official aid may also finance expenditures by non-government organisations not forming part of public expenditure. Weak monitoring of aid disbursements using off-budget routes can cause problems in macroeconomic management, because it is difficult to distinguish between a change in the level of aid and a change in the route through which it is disbursed. The statistics used in the IMF study appear to show similar figures for net aid from a balance of payments perspective and from a fiscal perspective, although different years are used in different tables and it is difficult to fully reconcile the numbers (Table 9). This presumably captures programme aid plus that portion of project aid for which disbursement data is available, and which is disbursed by, or in support of, government.

17
Table 9: Net fiscal aid as % of total net aid Country Net fiscal aid to govt as % of total aid Pre-surge Surge (Year) Ethiopia 100 84 Ghana 100 107 Mozambique 112 103 Tanzania 84 110 Uganda 104 92
Source: Calculated from IMF, 2005. Data not available for Mauritania and Sierra Leone. Aid was not used to finance tax cuts: the revenue share increased in six of the seven countries, falling slightly in Mauritania. Mauritania, Mozambique, Tanzania and Uganda spent all or most of the domestic counterpart to the aid increase in the form of increased public expenditure. In the case of Sierra Leone, increased aid was partly used to reduce an unsustainable level of domestic financing of the government deficit and to reduce indebtedness. However, weak aid data for Sierra Leone make it difficult to distinguish to what extent increased budget expenditure represents a real increase and how much represents improved capture of aid in the budget. Ghana and Ethiopia did not spend the aid increase, using it instead to reduce domestic indebtedness. Unfortunately, our studies throw little light on the quality of the increased spending. In retrospect, a failure to include this factor was an important deficiency of the studies reported here. The Sierra Leone paper is alone in including some salient remarks on this:
Some evidence of corruption comes from the Public Expenditure Tracking Survey (PETS) which tracks the flow of expenditures from the head offices of government ministries in Freetown to regional and district offices. The PETS provides feedback on the extent to which pro-poor expenditures reach the intended beneficiaries. Two PETS surveys were conducted in 2001. The results revealed that ‘resources transferred to provincial offices are negligible relative to the allocations made by the Ministry of Finance’ (Ministry of Finance, 2003). Another PETS survey was conducted in 2003. It reported the following: (i) schools received only 45% of the school fee subsidies paid by government to schools in 2002 and (ii) medical officers around the country received less than 10% of essential drugs sent to them from the Central Medical Stores in Freetown. It is generally believed that if much more effort is not put into tackling corruption, any large increase in aid levels might be misused…
And then there is the story of the capital city, Freetown:
At the time of first drafting this report, April 2005, basic services remained erratic even in Freetown, the national capital. Most parts of the city go without electricity supply for days or weeks. Most business enterprises rely almost entirely on standby generators. Pipe-borne water supply is unavailable in large parts of the city. Fixed line telephony is problematic with frequent breakdowns. Garbage collection has been at a standstill for some weeks now. Almost all observers are extremely disappointed about these outcomes in view of the large aid inflows Sierra Leone has received in recent years. The war is not perceived as a credible explanation for these outcomes. Many of these facilities functioned better during the war. Corruption is perceived as a major culprit … The consensus is that much more effort could be forthcoming from the government.

18
Sierra Leone is admittedly a particularly difficult case but we are not at all sure that it is entirely unrepresentative.
Table 10: Was aid spent? Pre-surge Surge Difference Was aid spent? ODI only Mauritania 1996-98 1999-2002 Net aid inflows 21.4 26.2 4.8 Revenue (excluding grants) 28.5 27.9 -0.6 Expenditure (excluding external interest)
22.7 27.2 4.5
Overall fiscal balance before aid
5.8 0.7 -5.1
More than 100% spent.
Sierra Leone 1997-99 2000-03 Net fiscal aid inflows 3.3 23.4 20.1 Revenue (excluding grants) 6.6 13.3 6.7 Expenditure 18.4 31.2 12.8 Overall fiscal balance before grants
-11.7 -17.4 -5.7
Govt spent 28%. Figure is distorted by large 2001 debt relief (reduced external debt by 20% of GDP). Excluding 2001, government spent 54% of the aid increase. Some use of aid to reduce domestic financing of the un-sustainable deficit was inevitable.
IMF & ODI case studies Mozambique 1998-99 2000-03 Net fiscal aid inflows 12.9 17.9 5.0 Revenue (excluding grants) 12.6 13.9 1.3 Expenditure 26.0 32.7 6.7 Overall fiscal balance before grants
-13.0 -18.5 -5.5
Spent 100%
Tanzania IMF: 1998-
99 IMF: 2000-03
Net fiscal aid inflows 4.7 8.6 3.9 Revenue (excluding grants) 12.1 12.5 0.4 Expenditure 16.7 20.7 4.0 Overall fiscal balance before grants
-4.8 -8.3 -3.5
Spent 91%
IMF only Ethiopia 1999-00 2001-03 Net fiscal aid inflows 5.3 11.2 5.9 Revenue (excluding grants) 18.0 19.4 1.5 Expenditure 31.8 32.5 0.7 Overall fiscal balance before grants
-13.8 -13.0 0.8
Not spent 0%
Ghana 1998-00 2001-03 Net fiscal aid inflows 1.3 7.0 6.0 Revenue (excluding grants) 17.1 19.0 1.9 Expenditure 27.0 29.3 2.3 Overall fiscal balance before grants
-9.9 -10.3 -0.4
Not spent 7%
Uganda 1999-00 2001-03 Net fiscal aid inflows 9.3 12.5 3.2 Revenue (excluding grants) 12.6 12.8 0.1 Expenditure 22.2 24.7 2.5 Overall fiscal balance before grants
-9.6 -12.0 -2.4
Mostly spent 74%
Source: IMF (2005), and ODI country case studies.

19
One of the influences on the extent to which governments spend aid increases relates to the predictability and sustainability of such rises. Governments deciding how to utilise aid are faced with the following problems:
• Aid is committed only short-term and usually conditionally, making it an unreliable source of funding for long-term spending obligations (such as are required in order to achieve the MDGs). As Tables 3 and 4 have shown, it would be unwise to assume that increases will be sustained.
• Commitments are themselves unreliable, with one study suggesting that past trends are a
better guide to likely aid disbursements than donor promises.4 • The timing of donor disbursements within and between years is also unpredictable.
Given these problems, governments have sensibly adopted cautious planning assumptions. Tanzania bases budgets on aid actually committed, and authorises spending only on aid actually received. It consequently budgets very conservatively, preferring to use a supplementary budget to allocate additional receipts rather than incurring the need for budget cuts. This makes forward planning and prioritisation difficult, and tends to result in a stop-start pattern of activity. Uganda has a more forward-looking view, and has achieved some success in getting more aid allocated as budget support, and released early in the budget year. Uganda has also been relatively sophisticated in adjusting donor promises based on past disbursement performance. (c) Summary of aid utilisation Table 11 reproduces the classification of aid absorption and expenditure as set out in the IMF report, with the two further ODI countries added.
Table 11: Aid utilisation by country
Not spent Partly spent Mostly spent Fully spent
Not absorbed Ghana (0, 7) Tanzania (0, 91)
Partly absorbed Ethiopia (20, 0) Uganda (27, 74) Mauritania (??, 100)
Mostly absorbed Sierra Leone (??)
Mozambique (66, 100)
Fully absorbed (Figures in parentheses refer respectively to percentages of aid absorbed and spent. Question marks indicate that the data are not clear.)
Ethiopia and Ghana neither absorbed nor spent the increased aid, taking the opportunity to re-build foreign-exchange reserves and reduce government debt. The history of volatile aid receipts (due to the war in Ethiopia and erratic economic management in Ghana) may have prompted both to reduce their vulnerability to future fluctuations in aid. Sierra Leone also needed to re-build foreign-exchange reserves and reduce unsustainable domestic financing of the budget, but also had to finance post-war reconstruction. It therefore absorbed most of the aid, and significantly increased spending.
4 Bulir and Hamann (2003). See also Bulir and Hamann (2005), finding that recent attempts to reduce volatility have not resulted
in significant improvements.

20
Mauritania, with high aid and FDI inflows and with the prospect of a big improvement in earnings from oil, was able to both increase net imports and add to foreign-exchange reserves. This can only be described as ‘full absorption’ of the aid if it is assumed that aid was financing the growth in net imports. In practice, a significant share of increased net imports was directly related to capital inflows related to oil development. We have therefore classed Mauritania as a case of partial absorption. The aid increase was in any case more in the nature of a recovery from a previous decline rather than a genuine ‘surge’. The other countries spent the domestic counterpart, but did not absorb the foreign exchange. The increased public expenditure was not truly ‘financed’ by aid, which was largely saved in higher foreign-exchange reserves, but was actually financed from domestic sources. Essentially, the choices are between increased demand growth and the risk of inflation, or tighter control on private sector credit to leave room for faster growth in public expenditure. Box 2 shows the consequences of these policy choices in the case of Tanzania, which were rather negative for the development of the private sector.
Box 2: Consequences of spending aid that has not been absorbed: Tanzania Aid to government in Tanzania increased by 8% of GDP between 1995 and 2004, and was the major source of finance for an 11% of GDP increase in public expenditure. However, total aid to the economy fell as a share of GDP in the 1990s, and we have seen that the subsequent increase in aid was not absorbed through increased net imports. Tanzania: Trends in government finance (all as % of GDP)
Indicator 1995 1996 1997 1998 1999 2000 2001 2002 2003 2004Total domestic revenue 13 13 14 13 13 11 12 12 13 13 Total expenditure 14 13 17 17 18 18 21 19 23 25 Total aid to govt 3 4 4 5 4 6 5 6 8 11 Total aid: GDP 17 14 12 12 11 11 13 13 16
Source: Based on Ministry of Finance data and Economic Survey for 2002 and 2004. With government revenue flat as a share of GDP, increased government expenditure required tight credit controls to avoid an inflationary increase in domestic demand. Tanzania domestic credit as % of GDP
1994 1995 1996 1997 1998 1999 2000 2001 2002 2003 Inflation 27.4 21 16.1 12.9 7.8 6 5.2 4.9 4.4 Total domestic credit by the banking sector (% GDP) 27.1 23.0 15.7 12.4 12.2 13.0 12.0 9.7 9.6 8.4 Domestic Credit to Private Sector (% GDP) 9.7 6.7 3.1 3.5 4.3 4.7 4.6 4.9 6.0 7.6
Average real lending rate 1 6 8 12 15 17 16 11 11
Source: Bank of Tanzania, Bureau of Statistics and Public Expenditure Review, 2003; and World Development Indicators.
By 1996, private sector credit as a share of GDP was less than one third of the level of the early 1990s. As a share of a rapidly growing GDP, it was still significantly below the level of the early to mid-1990s by 2003. Although lending rates came down slightly, inflation came down far more quickly, resulting in real interest rates increasing from 1% to peak at 17% in 2000, a rate at which few investments could be confident of being profitable. Both public and private investment came down during the period of shrinking aid and declining economic growth in 1993-6, but private investment continued to fall in the late 1990s.
21
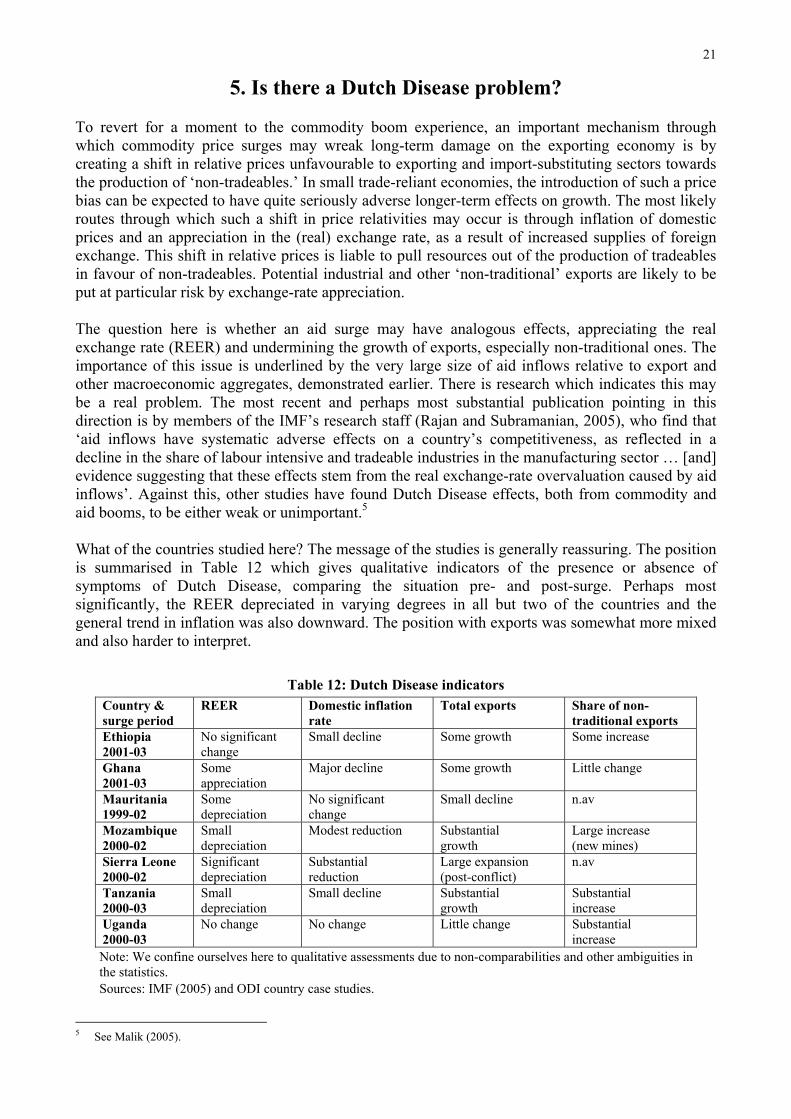
5. Is there a Dutch Disease problem? To revert for a moment to the commodity boom experience, an important mechanism through which commodity price surges may wreak long-term damage on the exporting economy is by creating a shift in relative prices unfavourable to exporting and import-substituting sectors towards the production of ‘non-tradeables.’ In small trade-reliant economies, the introduction of such a price bias can be expected to have quite seriously adverse longer-term effects on growth. The most likely routes through which such a shift in price relativities may occur is through inflation of domestic prices and an appreciation in the (real) exchange rate, as a result of increased supplies of foreign exchange. This shift in relative prices is liable to pull resources out of the production of tradeables in favour of non-tradeables. Potential industrial and other ‘non-traditional’ exports are likely to be put at particular risk by exchange-rate appreciation. The question here is whether an aid surge may have analogous effects, appreciating the real exchange rate (REER) and undermining the growth of exports, especially non-traditional ones. The importance of this issue is underlined by the very large size of aid inflows relative to export and other macroeconomic aggregates, demonstrated earlier. There is research which indicates this may be a real problem. The most recent and perhaps most substantial publication pointing in this direction is by members of the IMF’s research staff (Rajan and Subramanian, 2005), who find that ‘aid inflows have systematic adverse effects on a country’s competitiveness, as reflected in a decline in the share of labour intensive and tradeable industries in the manufacturing sector … [and] evidence suggesting that these effects stem from the real exchange-rate overvaluation caused by aid inflows’. Against this, other studies have found Dutch Disease effects, both from commodity and aid booms, to be either weak or unimportant.5 What of the countries studied here? The message of the studies is generally reassuring. The position is summarised in Table 12 which gives qualitative indicators of the presence or absence of symptoms of Dutch Disease, comparing the situation pre- and post-surge. Perhaps most significantly, the REER depreciated in varying degrees in all but two of the countries and the general trend in inflation was also downward. The position with exports was somewhat more mixed and also harder to interpret.
Table 12: Dutch Disease indicators Country & surge period
REER Domestic inflation rate
Total exports Share of non- traditional exports
Ethiopia 2001-03
No significant change
Small decline Some growth Some increase
Ghana 2001-03
Some appreciation
Major decline Some growth Little change
Mauritania 1999-02
Some depreciation
No significant change
Small decline n.av
Mozambique 2000-02
Small depreciation
Modest reduction Substantial growth
Large increase (new mines)
Sierra Leone 2000-02
Significant depreciation
Substantial reduction
Large expansion (post-conflict)
n.av
Tanzania 2000-03
Small depreciation
Small decline Substantial growth
Substantial increase
Uganda 2000-03
No change No change Little change Substantial increase
Note: We confine ourselves here to qualitative assessments due to non-comparabilities and other ambiguities in the statistics. Sources: IMF (2005) and ODI country case studies.
5 See Malik (2005).

22
Most of the ODI country studies reported an absence of evidence of Dutch Disease problems. Added to this is the conclusion of the IMF study, that there was no evidence of REER appreciation during the aid surge episodes studied there. One recurring line of explanation for the countries’ apparent immunity from this disease is that, in the type of economies studied here, export supply is more likely to be determined by non-price factors, such as poor transport and storage facilities. The Mozambique study stresses this, along with market-structure considerations:
…the hypothesis that Dutch Disease may explain export performance in Mozambique is too simplistic. In fact, sectors that are growing fast are those dependent on FDI, that are of large scale, that operate within oligopolistic or monopolistic conditions, and which do not depend on (seriously constrained) local productive capacities. Outside such conditions, no sector of the economy is growing fast, and most are either stagnant or collapsing. [Furthermore], the economy is starved of crucial capacities – technological, financial, entrepreneurial, informational, skills, certification and quality systems, organisation of supply chains, and so on. Very large projects benefit from linkages with international corporations, which address many of the issues mentioned, and/or they can create the conditions if necessary. Medium and small projects do not necessarily benefit from the same international linkages and cannot afford to create all the conditions they need to operate successfully.
However, we would like to caution against discarding Dutch Disease as a potential negative effect of an aid scaling-up. We should remind ourselves that existing aid levels in the countries under study are already high and, therefore, that any major scaling-up could have potentially large macroeconomic effects. The envisaged doubling of aid would raise major issues for absorption and spending. Moreover, relative prices are ultimately apt to assert an important influence, not least because they affect the incentives for relieving non-price bottlenecks. Before setting out our reasons for concern, we should draw attention to a measurement problem. Theory defines the REER in terms of the relative movement of the prices for tradeable and non-tradeable goods and services. The difficulties are (a) that few goods and services are actually non-tradeable (although some are more readily tradeable than others) and (b), in any case, the price ratio in question cannot be directly observed. As a pragmatic matter, therefore, statisticians measure the REER by adjusting the nominal exchange rate for differences in the inflation rates of the home country and its trading partners. As can be judged, however, this is conceptually different and it is by no means obvious that an inflation-adjusted REER is an accurate proxy for a ‘true’ REER based on relative tradeable/non-tradeable prices. Caution is therefore needed in drawing any strong policy conclusion – in either direction – on the basis of most computations of REERs. Turning now to reasons for a continuing concern about Dutch Disease, one is our finding that none of the countries fully absorbed and spent the aid in question. To the extent that this was so, the idea of an ‘aid surge’ has to be qualified and the basis for predicting symptoms of Dutch Disease is weakened. Not only that but fear of Dutch Disease was one of the specific reasons for holding back. This is brought out most clearly in the Tanzania paper, where the central bank explicitly restrained the absorption of available aid for fear of exchange-rate appreciation. There is, however, a limit to the desirable extent to which foreign-exchange reserves can be accumulated (see the Mozambique paper for some impatience with the opportunities lost by such a policy) and as that option disappears the dangers of a REER appreciation are increased. A second concern relates to changes in recent years to the uses of aid, particularly the modern-day preoccupation with using it to directly promote poverty reduction and the MDGs. Beyond the short

23
run, whether or not an aid surge disadvantages the tradeable-goods sectors is likely to be strongly influenced by how the aid is used, and how effectively. Where, for example, it is used to reduce the non-price constraints on exporters, e.g. by appropriate improvement in the infrastructure, the cost-reducing effects of this can more than offset any disincentives emerging from the exchange rate (Adam and Bevan, 2005). Another possibility is that aid might be used to reduce or remove forms of taxation which reduce private sector efficiency and investment, although donor Ministers of Development Co-operation are likely to be rather resistant to this option. Unfortunately, recent years have witnessed a switch in aid use away from directly-productive investments in favour of current and investment expenditures in the social sectors. To illustrate, Killick (2005a) estimated the proportion of British aid to Africa devoted to ‘directly productive’ activities (economic plus rural livelihoods sectors), expressed as a percentage of aid for ‘social’ spending (education plus health plus social plus governance), to have fallen from 371% in 1988/9-1989/90 and 208% in 1993/4-1994/5, to only 45% by 2003/4. Among our case studies, the Sierra Leone study provides data for 2003 showing over 70% of total aid going to humanitarian, social and governance uses and only 8% to productive sectors and infrastructure (with 21% unallocated). It is fairly safe to say that this is a general pattern (although the position in Ghana is probably more mixed). An implication of this is that non-tradeables have become the more favoured outputs, increasing the danger of Dutch Disease. Other country illustrations point in the same direction. Thus, the Mozambique paper states:
Aid-driven growth is more related to private and public consumption and services, because two thirds of current expenditure, heavily financed by aid, is concentrated on the delivery of social services. Public expenditure is not directly related to the development of productive capacities, apart from a broad and general approach to infra-structures and human capital.
Along similar lines, the Tanzania paper points out that much aid is now directed at achieving the MDG targets and that the incremental costs of doing so are mainly local costs, more likely to affect non-tradeable prices. In Mauritania too, our study shows that net recruitment of civil servants, facilitated by increased aid, has been exclusively concentrated in education and health and that increased public-sector investments have not induced significant new imports. Another, related, feature of the countries studied is that virtually no evidence has been found of aid being channelled to the private sector, or of it being utilised within the public sector for the explicit purpose of promoting private-sector development, a point also observed by the IMF study. This provides evidence of the behaviour of private investment pre- and post-surge in four of the countries and finds small declines in three of them (Ethiopia, Ghana and Tanzania). The significance of these considerations, of course, is that it is principally within the private sector that we would expect tradeables to be produced, while non-tradeables are likely to come disproportionately from the public sector. A further related consideration is that the probable pro-public sector effects of scaling-up aid will tend to raise the demand for non-tradeables relative to tradeables, because the state will probably have a lower marginal propensity to import, as compared with private agents. If this is the case, it will tend to raise the price of non-tradeables relative to tradeables, i.e. to appreciate the REER – a pure example of Dutch Disease. Finally, we should examine the export record of our countries. If Dutch Disease were a significant problem, that would predict a stagnant export record, particularly as regards manufactured and other non-traditional goods. The IMF paper states that overall export performance was strong in most countries in their sample and also shows a rather strong relative growth in non-traditional exports in three of them (Mozambique, Tanzania and Uganda).

24
Our own country studies portray a less reassuring scene. Tanzania certainly provides a positive case, with substantial rises in the dollar value of exports in recent years, exclusively concentrated in ‘non-traditional’ categories. While the latter are dominated by minerals, exports of manufactures have also grown quite fast, if only from a very small base. Mozambique can also point to rather rapidly growing total and non-traditional exports but our authors argue that this outcome has been a function of FDI in new ‘mega projects’ and that other exports ‘are significantly lower and stagnant’. Of Mauritania, our authors note that ‘Economic growth was not led by exports (which have even decreased in spite of favourable price competitiveness)’. They attribute this outcome to ‘an unfavourable tax structure, difficult access to bank credit, too costly civil services, telecommunications and transport’ but it is worth pointing out that a depreciating REER should not be equated with improving export profitability if the effect of the aid surge is to result in a slower rate of depreciation than would otherwise have occurred. For this reason, an absence of REER appreciation during an aid surge is not sufficient to dispose of the Dutch Disease hypothesis. To conclude on this topic and notwithstanding the reassuring indicators in Table 12, we regard the issue of whether a large scaling-up of aid is likely to induce Dutch Disease problems as unresolved. There is logic and evidence pointing in both directions and we caution against assuming that a large increase in aid to African countries would not induce this type of macroeconomic difficulty. The microeconomics of how the aid is used and its productivity will be crucial determinants, and there is every reason to expect that these would vary widely across countries.

25
6. Conclusions and implications for scaling-up 6.1 A balance sheet An implication of our analysis is that the doubling of aid to Africa would create some considerable challenges. A balance sheet would have entries on both sides. A reckoning for the cases studied above could be summarised as follows. Starting with the positives, overwhelmingly the most important are the direct benefits that would surely accrue from the increased assistance and the ways in which this would further the cause of reducing poverty and accelerating progress towards the MDGs. Of course, the extent to which these benefits are realised would hinge crucially on the quality of the extra spending facilitated – what is often called the absorptive capacity of governments. On this, it seems that in our case studies governments had the ability to spend all or most of the extra aid coming their way, with capacity constraints apparently not so large as to prevent this. The main exception was Sierra Leone, as might have been expected of a country only recently emerged from civil war. There are surprisingly few complaints in our studies about limited capacities and poor-quality spending, although the studies did not attempt to focus on this aspect. We can note in this connection that the aid surges studied were responses by donors to improvements in economic policies and performance and, in some cases, to the ending of conflicts. The aid surge was associated with higher investment and improved revenue performance. That this was the case was itself a positive, as was the willingness and ability of donors to respond to these developments. The question here is whether the commitment to double aid would be consistent with confining its allocation to well-performing governments. A final positive from our findings is that the symptoms of Dutch Disease that might have been predicted from the aid surges were generally absent. An argument can be made that fears of this have been exaggerated and that non-price export constraints are a larger development problem for economies of this type, although the previous section has just cautioned against any presumption that Dutch Disease effects would be unimportant. Turning now to the negatives, we should first remember that our study (and the IMF’s) was about an unrepresentative sample of countries, biased in favour of good performers. A more universal scaling-up of aid to Africa is now contemplated. One therefore needs to be cautious about extrapolating general statements about African economies from the relatively positive record of our sample. Next we should recall that there has been a good deal less absorption than spending. This has happened, in some cases, on a scale which contravened the ‘golden rule’ suggested in Section 3(b), that governments should avoid large excesses of spending over absorption. Countries have pursued a policy of stable or declining REERs in order to maintain the profitability of exporting and import-substituting. The one exception was Tanzania in the late 1990s, when exchange-rate appreciation was associated with poor export performance until policy was changed. The result of these exchange-rate policies has been difficulty in fully absorbing the aid increase, with most countries accumulating reserves and absorbing less than half of the aid increase in higher net imports. None of the countries studied absorbed an aid increase on the scale now envisaged for Africa (doubling by 2010); the two thirds increase in aid absorption over four years in Mozambique was the closest. The dangers of an excess of spending over absorption are the generation of inflationary pressures and/or a compensating credit squeeze on the private sector. At the same time, monetary authorities’

26
reluctance to sell all of the extra foreign exchange made available by an aid surge is understandable and, indeed, responsible. It may partly reflect the lessons of previous commodity booms. The literature suggests that commodity booms bring meagre and transitory benefits, whereas the costs of the subsequent collapses are deeper and more lasting. There are two reasons for this:
• If governments incorrectly assume that a transient boom is permanent, they incur long-term spending obligations that are costly and difficult to reverse.
• Booms damage incentives for prudent budgetary management, opening the door to pressures
for wasteful or low-priority expenditure. The relevance of the commodity boom case is underlined by the evidence we have presented showing that past amounts of aid have swung wildly from year to year and over the medium term. The recent aid surges reviewed in this report need to be viewed in the context of a forty-year history of extreme fluctuations in aid levels. Monetary authorities are right to be reluctant to assume that a short-term increase will be sustained in future. To sum up, the thrust of the positives and negatives unmistakably points in a cautionary direction. The potential for major gains from a scaling-up of aid is undoubted but the reasons for doubting that this potential will be substantially realised are rather powerful.6 6.2 The key variables If the balance sheet provides an unclear pointer, we can ask what factors are likely to determine whether the positives or negatives will dominate. We would single out four variables as of particular importance:
1. The degree of co-ordination of fiscal and monetary policies within recipient countries. The importance of this dimension is a key finding of the IMF paper and is reinforced by our own studies. It follows analytically from the distinction between absorption and spending. There tends to be a separation of decision-making between the central bank and monetary policy staff of the Ministry of Finance, and the staff responsible for budget preparation and management. Thus, our Mauritanian study indicates that observed consistency of fiscal and monetary/exchange rate stances ‘was more a matter of chance than the outcome of a thoughtful and deliberate management effort’ and the paper on Mozambique concludes that, ‘although Mozambique can absorb and spend more aid, it needs significantly better and better coordinated monetary policies to deal with inflows of resources. This will also require better planning of disbursement of resources throughout the budget cycle and a stringent adherence of aid donors to such planning…’
2. The perceived predictability of aid flows. The starting point here is the central empirical finding that none of the governments included fully absorbed the aid increases in the episodes studied. This is contrary to what donors would prefer and raises large questions about what might happen as a result of the prospective doubling of aid – a much larger increase than most of the surges studied here. What emerges is the centrality of the view taken by recipient authorities of the likelihood that the increase would be permanent. As we have already observed, the amount of aid has swung wildly from year to year in the past and over the medium term. The aid surges reviewed in this report need to be viewed in the context of a forty-year history of extreme fluctuations. Governments’ willingness to absorb any future scaling-up of aid depends crucially on the extent to which they and their policy-makers can be reasonably convinced that future predictability will be greatly improved as a
6 For a wider-ranging critique of the scaling-up agenda see Killick (2005b).
27
source of long-term development finance. As recounted above, the Tanzanian case illustrates the potentially negative effects for inflation and for the private sector of an aid surge which the national authorities do not believe to be permanent, just as the decision in Mozambique to use some of an aid surge to increase reserves was a rational response by the monetary authorities to the temporary nature of previous aid increases. A fully absorbed and spent but unsustained doubling of aid could do more harm than good, placing a large collective responsibility on donors. Equally, a dependable long-term period of incremental increases would be considerably easier to manage, macroeconomically, than the large, quick, but potentially unsustained, scaling-up in prospect at present.
3. The quality of public financial management (PFM) and the degree of donor influence on this will also be of much importance, not least because of its potential influence on tradeable-goods producers. On the one hand, there are the salutary experiences with commodity booms pointing to a large-scale waste of public resources in the face of sudden increases in state spending power. We should bear in mind here the Sierra Leone example cited earlier. On the other hand, there are the safeguards that the IFIs and bilateral donors seek to build in to ensure that their monies are well spent and reach intended beneficiaries. A key issue here is the extent to which their efforts are likely to be successful. The past history of donor-driven PFM reforms is not encouraging, nor is the wider literature on the effectiveness of conditionality. Moreover, a large scaling-up would create additional strains: increased pressures to spend within donor agencies, reducing their ability to act in a discriminating way to restrict enlarged aid allocations to those countries with good or improving standards of PFM, and a danger that the demands of the scaling-up itself may debilitate domestic efforts to strengthen the local institutional base.
4. The quality of aid data flows. If improved coordination of fiscal and monetary policies at the macroeconomic level is to be feasible, it has to be evidence-based – and the evidence has to be available. There are at least two major problems here: (a) the poor past record of donor agencies in providing recipient authorities with comprehensive, reliable and up-to-date statistics on actual and intended levels of support and (b) the limited ability (and perhaps interest) of recipient governments in processing data and feeding it into policy decision processes. To some extent, problem (a) reflects past donor reluctance to channel assistance through domestic budgetary processes. Evidently, there is little prospect for a sophisticated matching-up of fiscal and monetary responses if a significant amount of any increase in aid continues not to be ‘on budget’ and goes unreported to government.
6.3 Policy implications for donors The analysis of this paper draws attention to some important challenges attendant on the scaling-up of aid to Africa and the overall tone is cautionary. For donors contemplating doubling aid for Africa in order to help achieve the MDGs, the main policy implications are rather easily read from the ‘key variables’ just listed. We therefore conclude by emphasising a few implications which we regard as crucial. First, it is difficult to overstate the importance of improving the reliability and predictability of aid as a form of long-term finance, and (more difficult) of convincing governments that reliability has genuinely improved. Governments have had forty years to learn that aid increases are rarely sustained for more than a few years. This consideration favours arrangements such as the proposed International Financing Facility, which would provide greater assurance of dependable long-term flows at the global level, but this needs to be complemented by credible action to ensure that the reliability of aid is increased for individual countries, requiring donors to accept some restraints on their freedom to interrupt aid (see Foster, 2005a for a discussion and some suggestions). It also favours a measured, incremental approach over a large short-term increase.

28
Second, the increases in aid-financed public expenditure contemplated across Africa must be accompanied by increased absorption of the aid if it is not to risk damaging, counter-productive consequences for private sector growth. The incremental costs are dominated by local recurrent costs, and the necessary increased demand for foreign exchange may not be forthcoming without acceptance of exchange-rate appreciation. However, such an appreciation may itself be a serious drawback, following the Dutch Disease model. Aid therefore needs to be provided in the context of much more explicit agreement as to how the foreign exchange will be absorbed as well as how the budget resources will be spent. The IMF would need to be party to such agreements. There is a danger that donors are pressing ahead with plans for massive aid increases without having undertaken sufficient analysis of the implications for the rest of the economy. African governments have clearly been uncomfortable with the prospect of significant real exchange-rate appreciation, but the issue is not explicitly tackled. The consequences of implementing an expansion of public expenditures dominated by local costs without aid absorption is likely to be unhelpful to economic growth and to reducing long-term aid dependence. In this context, what emerges from our discussion is that public expenditure choices – and the donor agencies which are involved – need to give far more attention to relieving supply constraints, particularly for export industries, as a means to absorb aid without placing pressure on the private sector. The social sectors clearly contribute in the medium-to-long-term, but the decline in spending on economic services and infrastructure needs to be re-examined. Third, rapid increases in aid stand a good chance of being wasted unless they are provided in the context of carefully prioritised plans. This may sound banal but such plans are not yet in place, and large new commitments are being disbursed from ‘special’ vertical funds without any clear understanding of how they fit into overall budgetary or sectoral strategies (see Foster, 2005b). Questions arise about the capacities of African governments to spend rapidly increasing budgets effectively, as well as about the ability of donors to exert a decisive influence on PFM. Hence, there is a high risk that donor disillusion will develop, leading to broken promises and leaving governments with the familiar problem of transient benefits being succeeded by high costs, as they try to run expanded services and infrastructures with lower than expected resources. Finally, donors need to reconcile themselves to two politically uncomfortable facts: (a) that it may quite often be the case that it makes good macroeconomic sense for aid to be saved for a while, rather than absorbed and spent; and (b) that there are some circumstances when it would make good sense to use aid to reduce taxation, especially to alleviate ways in which specific taxes may discourage private sector efficiency and investment.


29
7. Works cited 7.1 Background papers prepared for this study (Copies of these papers are available on request from [email protected].) Country studies of the macroeconomic impact of scaling-up aid (2005): MAURITANIA by Jean-Francois Brun, Mamadou Cissoko, Jean-Pierre Foirry and Christopher Grigoriou MOZAMBIQUE by Carlos N. Castel-Branco (team leader) and José Sulemane with Francisco Fernandes, Amílcar Tivane and Eugénio Paulo SIERRA LEONE by Victor A.B. Davies TANZANIA by Mick Foster, Josaphat Kweka, Daniel Ngowi, Justine Musa and Longinus Rutasitara Malik, Adeel, (2005) ‘Macroeconomic effects of commodity shocks: a review of issues’. 7.2 Other works cited Adam, C.S. and Bevan, D.L. (2005) ‘Aid and the supply side: public investment, export
performance and Dutch Disease in low income countries’. Processed, University of Oxford. August. ([email protected]).
Aiyar, Shekhar, Andrew Berg and Mumtaz Hussain (2005), ‘The macroeconomic challenge of more aid’, Finance and Development 42(3), September.
Bruton, Henry and Catherine B. Hill (1992) ‘The macroeconomic effects of counterpart funds’, in Maxwell, op cit, pp.7-12.
Bulir, Ales and A. Javier Hamann (2003) ‘Aid volatility: an empirical assessment’, IMF Staff Papers 50(1).
Bulir, Ales and A. Javier Hamann (2005) ‘Volatility of development aid: from the frying pan into the fire?’. Washington, DC: IMF (processed). February.
Foster, Mick (2005a) ‘Improving the Medium to Long-term predictability of Aid’, (processed, report to DFID) January.
Foster, Mick (2005b) ‘MDG Oriented Sector and Poverty Reduction Strategies: Lessons from Experience in Health’, HNP Discussion Paper, World Bank, October.
International Monetary Fund (2005) ‘The macroeconomics of managing increased aid inflows: experiences of low-income countries and policy implications’. Washington, DC: IMF (processed). August. (‘the IMF study’).
Killick, Tony (2005a) ‘Policy autonomy and the history of British aid to Africa’, Development Policy Review 23 (6), November.
Killick, Tony (2005b), ‘Don’t throw money at Africa’, IDS Bulletin, 36(3), September. Lal, Deepak and Hla Myint (1996) The Political Economy of Poverty, Equity and Growth. New
York: Oxford University Press. Maxwell, Simon (ed.) (1992) special issue of IDS Bulletin on ‘Counterpart Funds and
Development’, 23(2); April. Rajan, Raghuram G. and Arvind Subramanian (2005) ‘What undermines aid’s impact on growth?’,
Working Paper WP/05/126 June. Washington, DC: IMF. Roemer, M. (1989) ‘The macroeconomics of counterpart funds revisited’, World Development,
17(6); June. World Bank (2005) World Development Indicators.