Embed Size (px)
Citation preview
Report No. 29383-ET
Ethiopia A Strategy to Balance and Stimulate Growth
A Country Economic Memorandum January 23, 2005 Poverty Reduction and Economic Management 2 (AFTP2) Africa Region
Green Cover Document of the World Bank
GOVERNMENT FISCAL YEAR: July 8-July 7 CURRENCY EQUIVALENTS
Currency Unit = Birr (ETB) US$1.00 = ETB 8.45 (August 6, 2004)
Weights and Measures: Metric System
ABBREVIATIONS AND ACRONYMS ADLI Agricultural development-led industrialization BOT Build, operate, and transfer CEM Country economic memorandum Cm Centimeter CSA Central Statistical Authority EARO Ethiopian Agricultural Research Organization ECGEM Ethiopia Computable General Equilibrium Model FDI Foreign direct investment FWF Food-for-work GDP Gross domestic product GOE Government of Ethiopia Ha Hectare HIPC Heavily Indebted Poor Countries Initiative Km Kilometer Masl Meters above sea level MDG Millennium Development Goals MoFED Ministry of Finance and Economic Development MoWR Ministry of Water Resources MT Metric ton Mts Meters NGO Nongovernmental organization OECD Organization for Economic Cooperation and Development ODA Official development assistance p.a. Per annum PADETES Participatory Demonstration and Training Extension System PSCAP Public Sector Capacity Building Program SAM Social accounting matrix Sq km Square kilometer SDPRP Sustainable Development and Poverty Reduction Program SOE State-owned enterprise TFP Total factor productivity
Vice President: Country Director:
Sector Director: Sector Manager:
Task Team Leader:
Gobind Nankani Ishac Diwan Paula Donovan Kathie Krumm Karim El Aynaoui
i

ACKNOWLEDGEMENTS This country economic memorandum is the product of a year of team research, interactions, and dialogue in Ethiopia and field trips to Amhara, Dire Dawa, Harar, Oromiya, and Tigray regions. While the CEM is a World Bank-led work, it is also the product of numerous interactions with many people and institutions in Ethiopia: the Government of Ethiopia, the private sector, NGOs, academia, bilateral and multilateral donors, and World Bank colleagues. Several background papers were presented at conferences and seminars in Addis Ababa and at the Bank. Two key events were initially organized in Addis Ababa to identify and discuss some of the key themes developed in the CEM. In July, 2003, a seminar was organized jointly with the Ethiopian Research and Development Institute. In September 2003, the Country Unit organized a one-day retreat on growth strategies with the Prime Minister and his cabinet and a multisectoral Bank team led by Nicholas Stern (Sr. Vice President and Chief Economist) and Ishac Diwan (Country Director). The team is grateful for the comments and suggestions provided by the participants at these meetings. The CEM team would like to thank His Excellency Newai Gebre-ab, Chief Economic Adviser of the Prime Minister, and the Ethiopian Authorities for their support and very active collaboration: Central Statistical Authority, Ethiopian Electric Light and Power Corporation, Ethiopian Investment Authority, Ethiopian Road Authority, Ethiopian Telecommunication Corporation, Ministry of Agriculture, Ministry of Education, Ministry of Finance and Economic Development, Ministry of Health, Ministry of Water Resource, and National Bank of Ethiopia. The team would also like to thank in Addis Ababa: Addis Ababa University, Ethiopian Economic Association, Ethiopian Economic Research Institute, and Ethiopian Research and Development Institute. The task team leader of the CEM and author of the report is Karim El Aynaoui. The CEM core team includes Jalal Abdel-Latif, Pierre-Richard Agénor, Shenaz Ahmed, Omar Aloui, Seifulaziz Milas, and Senait Kassa Yifru. The report is based on several inputs prepared in the form of background papers (see list in Appendix 5). Contributors include Bemnet Aschenaki, Nihal Bayraktar, Befekadu Degefe, Eleni Gabre-Madhin, Rahel Kassahun, Gizaw Molla, Belay Seyoum Ketema, and Alemayehu Seyoum Taffesse. Research assistance was provided by Mesfin Girma Bezawagaw and Eskinder Tesfaye. Invaluable guidance, inputs, and suggestions throughout the preparation were given by Ishac Diwan, Robert Blake, Jeni Klugman, and Kathie Krumm. Precious comments and suggestions were received from the reviewers: Jean-Jacques Dethier, Delfin Sia Go, and John McIntire. We also would like to thank for useful discussions Luc Christiaensen, Paul Collier, and Dani Rodrik. Inputs and comments were also received from Herbert Acquay, Abebaw Alemayehu, Taye Alemu Mengistae, Anwar Bach-Baouab, Madhur Gautam, Getahun Gebru, Navin Girishankar, Yusuf Haji Ali, Christina Leb, Assaye Legesse, Dino Leonardo Merotto, Negede Lewi, Karen Mcconnell Brooks, Laketch
ii

Mikael Imru, David Nielson, Gebreselassie Okubagzhi, Jemal Mohammed Omer, Agata Pawlowska, Michelle Phillips, John Riverson, Menbere Taye Tesfa, Yitbarek Tessema, Rene Van Nes, and Dileep Wagle. The team would like to thank all who contributed to the production of this report, including those whose names may have been inadvertently omitted.
iii
CONTENTS
ABBREVIATIONS AND ACRONYMS ............................................................................................................ i ACKNOWLEDGEMENTS................................................................................................................................ii CONTENTS ...................................................................................................................................................... iv TABLES, BOXES, AND FIGURES................................................................................................................vii EXECUTIVE SUMMARY ............................................................................................................................... ix
CHAPTER 1. DYNAMICS BLOCKING ETHIOPIA’S GROWTH POTENTIAL .................................................................1
1. A Poor Nation Making Very Slow Progress................................................................................................2 A. Slow Long-term Growth Due to Poor Initial Conditions ..................................................................2 B. The Structure of the Economy: Family Labor, Low Productivity Activities,
and Public Firms are Prominent........................................................................................................7 C. High Incidence of Income Poverty .................................................................................................14
2. Self-reinforcing Mechanisms.....................................................................................................................16
A. Geography.......................................................................................................................................16 The Population and Environmental Lock-in in the Highlands ...........................................................17 The Health Lock-in in the Lowlands...................................................................................................19
B. The Education Lock-in ...................................................................................................................20 C. The Nutrition Lock-in .....................................................................................................................21 D. The Public Capital Lock-in .............................................................................................................22
Infrastructure and Poverty Reduction ................................................................................................25 3. Spatial Analysis Shows Risks are Constraining Growth Potential ............................................................25
A. Ethiopia One: High Risk, Low Potential.........................................................................................27 B. Ethiopia Two: Low Risk, Medium Potential ..................................................................................28 C. Ethiopia Three: High Risk, Medium Potential................................................................................28 D. Ethiopia Four: High Risk, High Potential .......................................................................................29 E. Each Can Contribute To Economic Growth ...................................................................................30
CHAPTER 2. CURRENT STRATEGY: FOUNDATIONS, ACHIEVEMENTS, AND PROSPECTS ......................................31
1. Foundations of the Current Strategy: Agriculture as the Engine of Growth.............................................. 31 2. Macroeconomic Management ...................................................................................................................33 3. Performance of the Current Strategy .........................................................................................................36
A. Risks Prevent Increases in Agricultural Productivity .....................................................................38 Crop farming ......................................................................................................................................39 Livestock.............................................................................................................................................42 Agricultural exports have not taken off ..............................................................................................42
B. Demand Weaknesses and Food Aid Perversely Affect Farm Prices..............................................44 C. Investment Allocations Do Not Make the Most of the Country’s Growth Potential ......................46
Relations between Investment and Growth.........................................................................................46 Geographic Distribution of Public Investment...................................................................................48
D. Perceived Bias of Policies and Production Structure against the Private Sector.............................48 Domination of Growth by the Public Sector.......................................................................................49 Obstacles to Private Sector Development ..........................................................................................51
iv
4. Growth and Poverty Reduction Prospects under Current Circumstances..................................................53
A. Model Specifications ......................................................................................................................53 B. Results.............................................................................................................................................54
5. Conclusion.................................................................................................................................................56
CHAPTER 3. FOUNDATIONS OF A STRATEGY TO ACCELERATE GROWTH .............................................................57
1. More Balanced Targeting of Public Investment in Economic Infrastructure ............................................57 A. The Reward of Targeting Investment to Areas of High Potential...................................................59
Approach to Analysis..........................................................................................................................59 Results ................................................................................................................................................61 Policy Implications.............................................................................................................................67
B. Fostering Productive and Rural-Urban Linkages: Connectivity and Urban Development .............68 C. Two Activities with High Potential ................................................................................................71
Livestock Development.......................................................................................................................71 Irrigation and Hydropower ................................................................................................................71
2. Reducing Risks for the Private Sector .......................................................................................................77
A. Public Goods—Disease Control .....................................................................................................77 B. Measures to Reduce Market Distortions .........................................................................................79
Land Reform.......................................................................................................................................79 Reducing Distortions Created by Food Aid........................................................................................80
C. Improvements in the Investment Climate, Including Privatization.................................................83 Special Incentives for Private Business..............................................................................................83 Financial Reforms to Help with Risk Bearing ....................................................................................86 Safety Nets ..........................................................................................................................................86
3. Conclusion.................................................................................................................................................86
CHAPTER 4. THE ROLE OF FOREIGN AID IN STIMULATING GROWTH ..................................................................88
1. Trends and Lessons in Foreign Aid ...........................................................................................................88 A. Key Aid Statistics ...........................................................................................................................89 B. Aid, Taxation, and Public Investment.............................................................................................91
2. Modeling the Effects of Foreign Aid on Growth.......................................................................................92
A. Approach to Analysis......................................................................................................................92 B. Results.............................................................................................................................................95
Results of a Change in the Level of Foreign Aid ................................................................................95 Implications of Growth and Poverty Reduction Targets ....................................................................96
C. The Level of Public Investment Needed to Accelerate Growth and Halve Poverty .......................98 3. Foreign Aid, Absorptive Capacity, and Alignment of Aid with Government Policy .............................. 100 4. Conclusion............................................................................................................................................... 102
CHAPTER 5. POLICY RECOMMENDATIONS........................................................................................................... 104
1. Focus on Infrastructure that Supports Rural-Urban Linkages and Tradable Activities ........................... 104 2. Begin Reducing Risks by Developing Appropriate Public Goods .......................................................... 105 3. Mitigate Risks to Private Investors and Producers .................................................................................. 105 4. Tap Opportunities in Areas with High Potential...................................................................................... 106 5. Base Budgets on Regional Growth Strategies ......................................................................................... 109
v

APPENDIX 1. POVERTY AND LOW-GROWTH TRAPS: CHARACTERIZATION AND EVIDENCE ..................................... 110 APPENDIX 2. PUBLIC INVESTMENT AND ECONOMIC GROWTH: RECENT EVIDENCE................................................. 118 APPENDIX 3. MAPS……. ........................................................................................................................................... 122 APPENDIX 4. SIMULATION TABLES.......................................................................................................................... 133 APPENDIX 5. BACKGROUND PAPERS ....................................................................................................................... 138
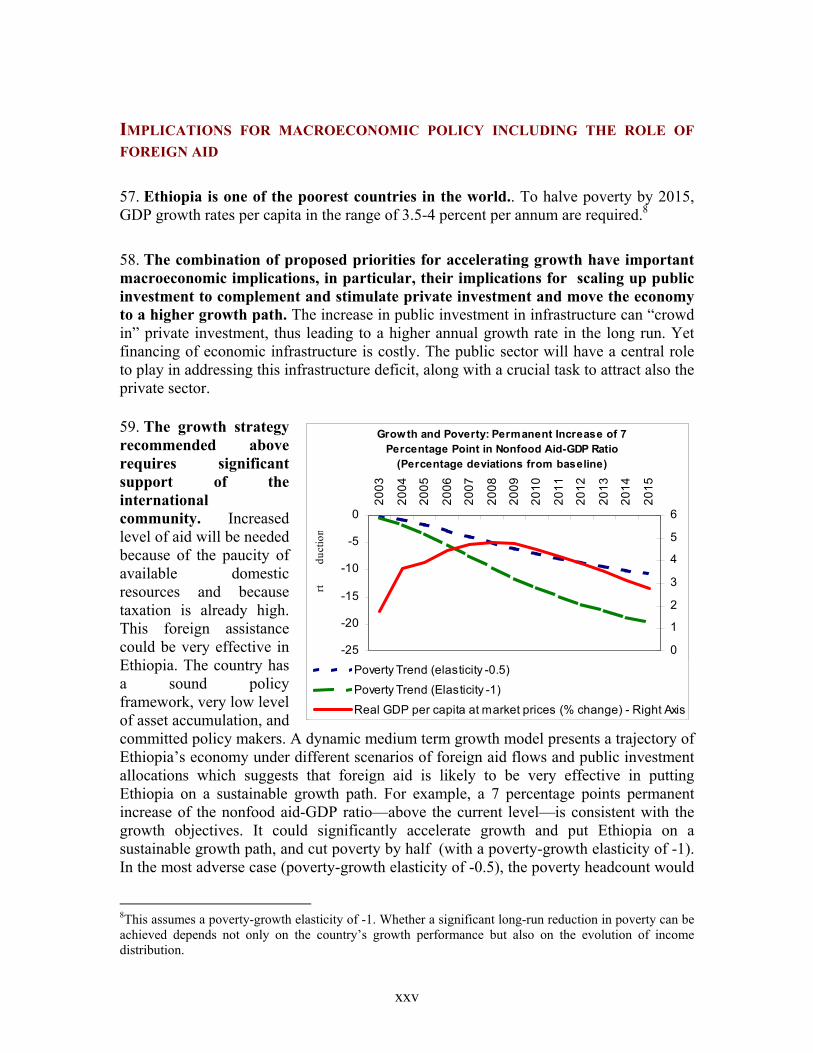
vi
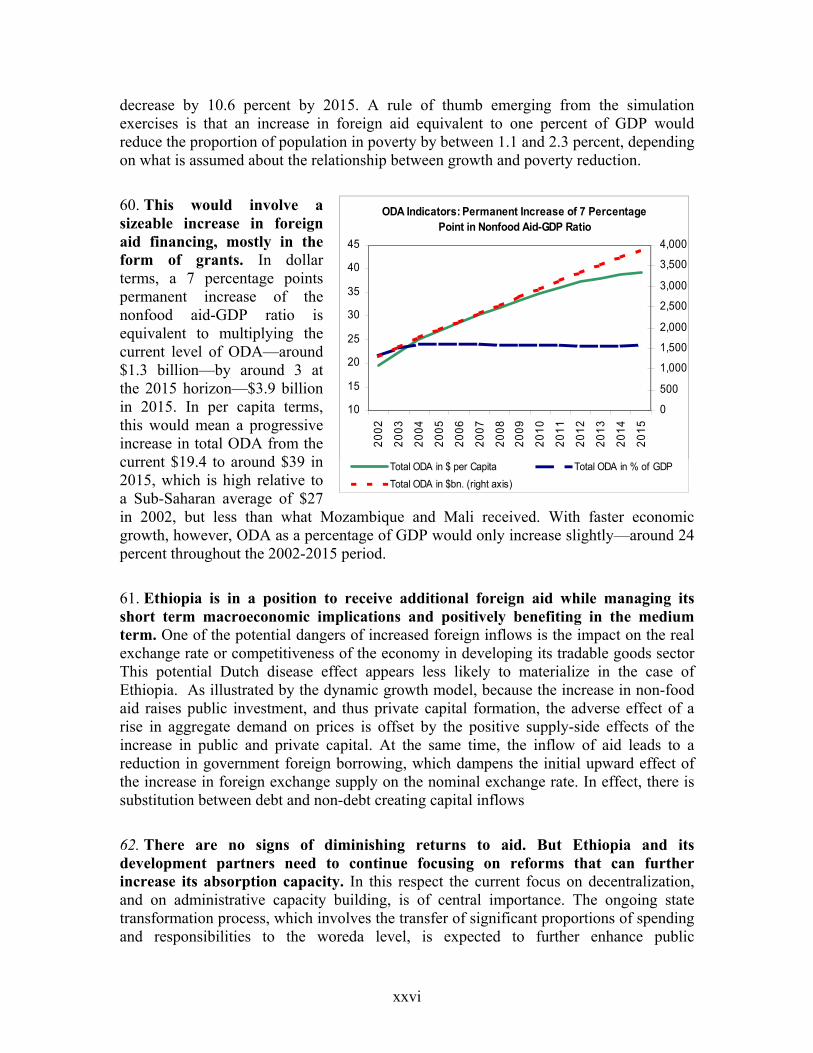
TABLES, BOXES, AND FIGURES Tables Table 1.1. Activities and Sectoral Contribution to Value Added by
Production Factor, 1999/2000...................................................................................... 9 Table 1.2. Factor Composition of Activities and Sectoral Value Added, 1999/2000 .................... 9 Table 1.3. Activities and Sectoral Contribution to Output by Commodity Group, 1999/2000.... 11 Table 1.4. Commodity Composition of Final Demand, 1999/2000 ............................................. 14 Table 1.5. Sources of Household Income, 1999/2000.................................................................. 15 Table 1.6. Poverty Incidence and Inequality ................................................................................ 16 Table 1.7. Key Infrastructure Indicators....................................................................................... 22 Table 1.8. Four Ethiopias: Key Indicators.................................................................................... 27 Table 2.1. Real Government Expenditure, 1999/00 – 2004/05 .................................................... 34 Table 2.2. Sectoral Composition of GDP..................................................................................... 36 Table 3.1. Alternative Scenarios of Targeting Public Investment in Economic Infrastructure.... 61 Table 3.2. Macroeconomic Impacts of Alternative Investments in Economic Infrastructure ...... 62 Table 3.3. Sectoral Impacts of Scenario 3, by Activity ................................................................ 64 Table 3.4. Sectoral Impacts of Scenario 3, by Commodity ................................................................. 65 Table 3.5. Macroeconomic Impacts of an Increase in Food Aid and Food-for-Work ................. 80 Table 3.6. Price Impacts of Increasing Food Aid by 10%............................................................ 81 Table 4.1. Government Sector: Effects of a Permanent Increase of
7 Percentage Points in Nonfood Aid-GDP Ratio....................................................... 96 Table 4.2. Ethiopia's Public Investment Plan, 2005-15*.............................................................. 99 Boxes Box 1.1. Why do Poor Countries Remain Poor?............................................................................ 5 Box 2.1. An Operational Macroeconomic Framework for Ethiopia ............................................ 53 Box 3.1: Using public investment to muster the forces for growth.............................................. 58 Box 3.2. A Quantitative Framework: The Ethiopia Computable General
Equilibrium Model (ECGEM) ...................................................................................... 59 Box 3.3. Why Poor and Delayed Attention to Irrigation? ............................................................ 72 Box 3.4. The Nile Basin Initiative................................................................................................ 74 Box 3.5: Costs and Benefits of Micro-dams................................................................................. 76 Box 3.6: Success with Special Incentives for Private Business ................................................... 83 Box 3.7. Constraints and Challenges to Horticulture Development in Ethiopia .......................... 85 Box 4.1. Foreign Aid and the Dutch Disease ............................................................................... 93
vii
Figures Figure 1.1. Real GDP per Capita, 1961-2003................................................................................. 2 Figure 1.2. Trends in Real Gross Domestic Income, 1950-2000 ................................................... 3 Figure 1.3. Trends in Per Capita GDP, 1950-2000 ........................................................................ 4 Figure 1.4. Share of Gross Domestic Saving, % of GDP............................................................... 4 Figure 1.5. Genuine Domestic Savings as Share of GDP (GNI), Average 2000-03 ...................... 6 Figure 1.6. Four Ethiopias: Risks and Growth Potentials ............................................................ 26 Figure 1.7. Four Ethiopias: Risks Are High in All and Increase With Potential.......................... 30 Figure 2.1. Index of Real Effective Exchange Rate, 1989/90-2002/03........................................ 35 Figure 2.2. Overall Budget Deficit, 1990/91-2003/04.................................................................. 35 Figure 2.3. Economic Performance has become more Dependent on Non Agricultural GDP..... 36 Figure 2.4. Economic Performance Has Become More Dependent on Non-Agricultural GDP .. 38 Figure 2.5. Temporary Crops (Cereals, Oilseeds and Pulses): Total Yields, and
Per Capita Yields and Production, 1982-2003........................................................... 40 Figure 2.6. Per Capita Production of Temporary Crops, by Rainfed
Agriculture Potential, 1996/97-2000/01 ................................................................... 41 Figure 2.7. Value Added of Livestock in percent of Overall GDP and
Agricultural GDP, 1993-2003................................................................................... 42 Figure 2.8. Price Trends for Key Exported Commodities, 1992/93-2002/03 ............................. 43 Figure 2.9. Export Value-to-Volume Ratio by Commodity ........................................................ 44 Figure 2.10. Food Aid as Proportion of Cereal Marketed, Metric Tons 1984/85-2000-2001....... 45 Figure 2.11. Trends in Public Investment, in percent of GDP 1975-2002 .................................... 46 Figure 2.12. Public and Private Investment................................................................................... 47 Figure 2.13. Quality Index of Infrastructure, 1974 - 2002 ............................................................ 48 Figure 2.14. Real Non-Agricultural GDP per Capita, 1961–2003 ................................................ 49 Figure 2.15. Composition of GDP growth and Domestic Demand............................................... 50 Figure 2.16. External Trade and Manufacturing Sector Indicators ............................................... 51 Figure 2.17. Evolution of Poverty under Trend-based Projections, 2003-2015 ............................ 55 Figure 3.1. Simplified Linkage Effects of Economic Infrastructure Investments ........................ 66 Figure 3.2. An Unbalanced Allocation of Public Investment Adversely
Affects Rural Terms of Trade .................................................................................... 67 Figure 3.3. A More Balanced Allocation of Public Investment is Good for GDP Growth.......... 68 Figure 4.1. GDP Per Capita and Aid Per Capita, 1974-2002 ....................................................... 89 Figure 4.2. Aid Flows: International Comparisons, 1983-2002 ................................................... 89 Figure 4.3. Composition of Aid per Capita, 1975-2002............................................................... 90 Figure 4.4. Aid and Fiscal Variables, 1975-2002......................................................................... 91 Figure 4.5. Public and Private Investment, 1975-2001 ................................................................ 92 Figure 4.6. Growth and Poverty: Effects of a Permanent Increase of 7
Percentage Points in Nonfood Aid-GDP Ratio.......................................................... 97 Figure 4.7. ODA Indicators: Effects of a Permanent Increase of 7
Percentage Points in Nonfood Aid-GDP Ratio........................................................ 101
viii

EXECUTIVE SUMMARY ETHIOPIA’S MADE GOOD PROGRESS IN THE 1990S BUT HUGE CHALLENGES REMAIN 1. Over the last 40 years, Ethiopia has not sustained long periods of high economic growth rates. Short lived spurts of growth are typically associated with positive shocks such as rainfall. Despite the respectable growth levels of the 1990s, per capita income today is at a level that had been reached previously in the early 1970s. GDP per capita has increased by a low 0.2 percent per year over the 1961-2003 period. 2. After a long period of economic decline, Ethiopia was able to revive growth in the last decade. A wave of reforms led to renewed confidence and translated in accelerated growth. Real GDP grew at an average 3.7 percent per year (above its long term trend) between 1993 and 2003, implying a 1 percent increase in per-capita income—compared to -0.5 percent per year over 1961-1992.1 3. The development strategy has registered some notable success. The Ethiopian government set the alleviation of poverty as its primary goal. Its development strategy—Agricultural Development Led Industrialization (ADLI)—focused on the development of smallholder agriculture as critical to transforming Ethiopia’s agrarian economy into a modern one through deeper linkages between agriculture and industry by increasing the productivity of peasant farmers and by developing the manufacturing sector so as it uses more of the country’s natural and human resources. Real non-agriculture GDP has increased by a solid 6.4 percent per year above its long-term trend during 1993-2003 with rapid expansion of the services and industrial sectors. Agricultural output grew by 1.7 percent per annum when smoothing out variations.2 Crop productivity has stagnated but this is still noteworthy given the dreadful environmental trap affecting large parts of the country. The shift in macroeconomic policy in the early 1990s decisively contributed to stability, raised growth rates, reduced the country’s external indebtedness, and created new margins of maneuver for sectoral and structural policies. The Government has cut tariffs, relaxed quota constraints, simplified licensing procedures, eased foreign exchange controls, discontinued compulsory grain delivery and the forced membership of cooperatives, begun a privatization process, authorized the operation of private domestic banks, and introduced an interbank money and foreign exchange market. 1Note that population growth was reduced over this period because of the separation with Eritrea. In 1993, population decreased by 2.7 percent. 2Without smoothing the huge fluctuations, annual average growth is 0.5 percent.
ix
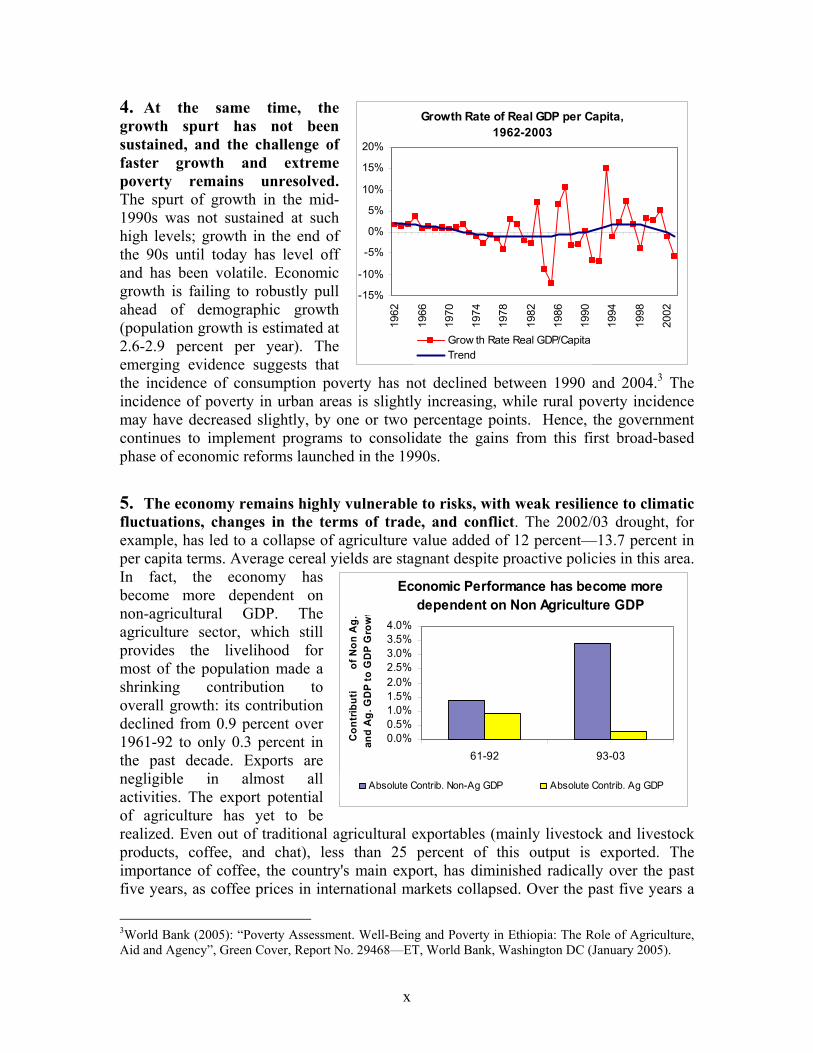
4. At the same time, the growth spurt has not been sustained, and the challenge of faster growth and extreme poverty remains unresolved. The spurt of growth in the mid-1990s was not sustained at such high levels; growth in the end of the 90s until today has level off and has been volatile. Economic growth is failing to robustly pull ahead of demographic growth (population growth is estimated at 2.6-2.9 percent per year). The emerging evidence suggests that the incidence of consumption poverty has not declined between 1990 and 2004.3 The incidence of poverty in urban areas is slightly increasing, while rural poverty incidence may have decreased slightly, by one or two percentage points. Hence, the government continues to implement programs to consolidate the gains from this first broad-based phase of economic reforms launched in the 1990s.
Growth Rate of Real GDP per Capita,1962-2003
-15%
-10%
-5%
0%
5%
10%
15%
20%
1962
1966
1970
1974
1978
1982
1986
1990
1994
1998
2002
Grow th Rate Real GDP/CapitaTrend
5. The economy remains highly vulnerable to risks, with weak resilience to climatic fluctuations, changes in the terms of trade, and conflict. The 2002/03 drought, for example, has led to a collapse of agriculture value added of 12 percent—13.7 percent in per capita terms. Average cereal yields are stagnant despite proactive policies in this area. In fact, the economy has become more dependent on non-agricultural GDP. The agriculture sector, which still provides the livelihood for most of the population made a shrinking contribution to overall growth: its contribution declined from 0.9 percent over 1961-92 to only 0.3 percent in the past decade. Exports are negligible in almost all activities. The export potential of agriculture has yet to be realized. Even out of traditional agricultural exportables (mainly livestock and livestock products, coffee, and chat), less than 25 percent of this output is exported. The importance of coffee, the country's main export, has diminished radically over the past five years, as coffee prices in international markets collapsed. Over the past five years a
ons
Economic Performance has become more dependent on Non Agriculture GDP
0.0%0.5%1.0%1.5%2.0%2.5%3.0%3.5%4.0%
61-92 93-03
Con
trib
uti
of N
on A
g.an
d A
g. G
DP
to G
DP
Gro
wt
Absolute Contrib. Non-Ag GDP Absolute Contrib. Ag GDP
x
3World Bank (2005): “Poverty Assessment. Well-Being and Poverty in Ethiopia: The Role of Agriculture, Aid and Agency”, Green Cover, Report No. 29468—ET, World Bank, Washington DC (January 2005).
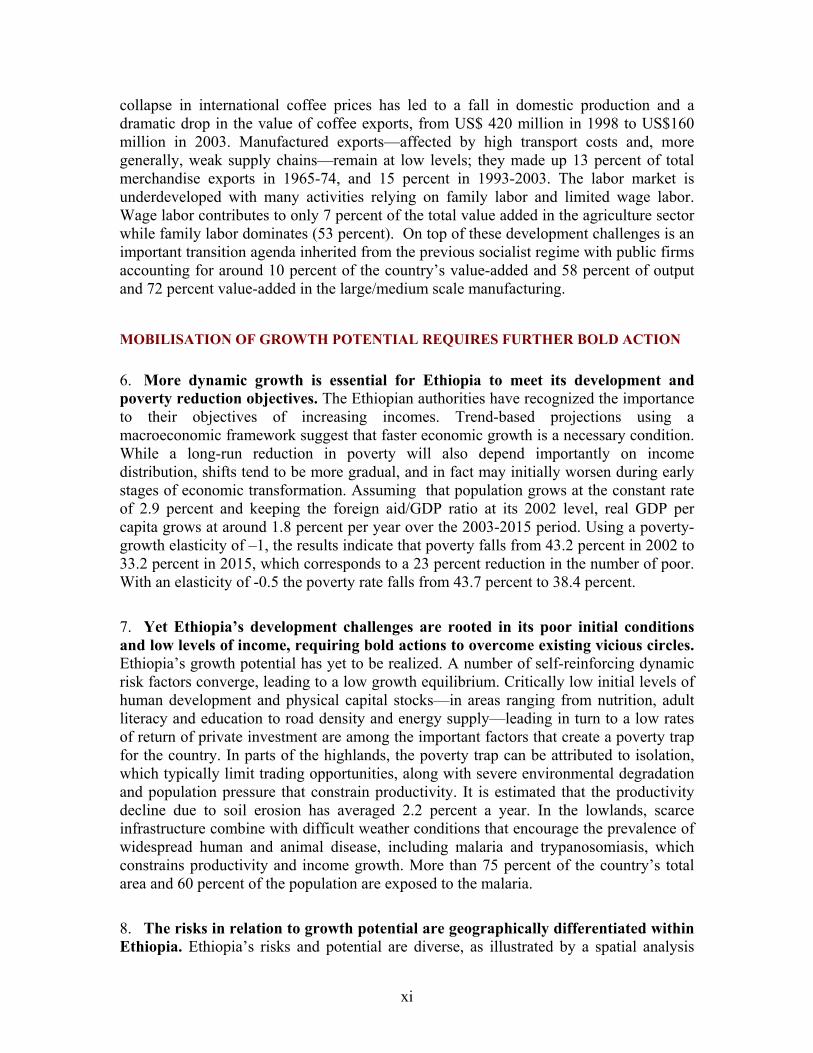
collapse in international coffee prices has led to a fall in domestic production and a dramatic drop in the value of coffee exports, from US$ 420 million in 1998 to US$160 million in 2003. Manufactured exports—affected by high transport costs and, more generally, weak supply chains—remain at low levels; they made up 13 percent of total merchandise exports in 1965-74, and 15 percent in 1993-2003. The labor market is underdeveloped with many activities relying on family labor and limited wage labor. Wage labor contributes to only 7 percent of the total value added in the agriculture sector while family labor dominates (53 percent). On top of these development challenges is an important transition agenda inherited from the previous socialist regime with public firms accounting for around 10 percent of the country’s value-added and 58 percent of output and 72 percent value-added in the large/medium scale manufacturing. MOBILISATION OF GROWTH POTENTIAL REQUIRES FURTHER BOLD ACTION 6. More dynamic growth is essential for Ethiopia to meet its development and poverty reduction objectives. The Ethiopian authorities have recognized the importance to their objectives of increasing incomes. Trend-based projections using a macroeconomic framework suggest that faster economic growth is a necessary condition. While a long-run reduction in poverty will also depend importantly on income distribution, shifts tend to be more gradual, and in fact may initially worsen during early stages of economic transformation. Assuming that population grows at the constant rate of 2.9 percent and keeping the foreign aid/GDP ratio at its 2002 level, real GDP per capita grows at around 1.8 percent per year over the 2003-2015 period. Using a poverty-growth elasticity of –1, the results indicate that poverty falls from 43.2 percent in 2002 to 33.2 percent in 2015, which corresponds to a 23 percent reduction in the number of poor. With an elasticity of -0.5 the poverty rate falls from 43.7 percent to 38.4 percent. 7. Yet Ethiopia’s development challenges are rooted in its poor initial conditions and low levels of income, requiring bold actions to overcome existing vicious circles. Ethiopia’s growth potential has yet to be realized. A number of self-reinforcing dynamic risk factors converge, leading to a low growth equilibrium. Critically low initial levels of human development and physical capital stocks—in areas ranging from nutrition, adult literacy and education to road density and energy supply—leading in turn to a low rates of return of private investment are among the important factors that create a poverty trap for the country. In parts of the highlands, the poverty trap can be attributed to isolation, which typically limit trading opportunities, along with severe environmental degradation and population pressure that constrain productivity. It is estimated that the productivity decline due to soil erosion has averaged 2.2 percent a year. In the lowlands, scarce infrastructure combine with difficult weather conditions that encourage the prevalence of widespread human and animal disease, including malaria and trypanosomiasis, which constrains productivity and income growth. More than 75 percent of the country’s total area and 60 percent of the population are exposed to the malaria. 8. The risks in relation to growth potential are geographically differentiated within Ethiopia. Ethiopia’s risks and potential are diverse, as illustrated by a spatial analysis
xi
based on simple indicators of risk and growth potential. For many parts of Ethiopia, the major source of risk is weather-related, as indicated by a drought risk indicator. For others, a major source of risk is health-related, as indicated by the prevalence of malaria and trypanosomiasis. Likewise, some parts have greater rainfed agriculture potential, others potential for irrigated agriculture; as well as differences in the intensity of feasibility of rural-urban and global market linkages. Several sources of growth are ripe to be tapped without overcoming serious risks. For example, the ADLI strategy already has shown results in crop productivity in the “low risk-medium potential” areas, despite a significant environmental degradation. The private sector already has begun to expand in floriculture near existing transport corridors such as the Addis Ababa. However, the geographic analysis also suggests that exploiting growth in many high potential areas will need to be accompanied by bold action to reduce and manage risks. For example, the western lowlands have vast expanses of land suitable for rainfed mechanized agriculture as well as irrigated farming, but producers face severe risks associated with tsetse fly malaria and drought, and lack of infrastructure. The dry southern and eastern lowlands have significant potential for irrigated farming and commercial livestock raising, but producers face severe risks associated with animal and human health, water, and absence of market linkages. 9. It would be difficult for the private sector alone to tap into this growth potential without public partnership. In a very risky environment, the expected returns of private investor are very high. To have their intended effect, public investments and an improved business climate must be complemented by the provision of public goods that directly and indirectly foster the development of the private sector. Specific public goods, which the private sector will not finance and that have significant social returns, will need to be provided to overcome some of the vicious circles and risks: control of human and animal diseases is an example. 10. Likewise, it would be difficult for the country to come out of the low equilibrium trap on the basis of its own resources alone. At around 5 percent of GDP, private domestic savings are already high, impressive for a country in Ethiopia’s situation. Because of the paucity of available resources and because taxation is already high (tax revenues are around 17 percent of GDP), an important financing effort is required on the part of policy makers and donors to overcome at least some of the mechanisms locking the country in a poverty trap in order to create a sustainable livelihood for a population that will double by 2040-2050 (to reach 125-140 million). 11. Aware of the challenge of faster growth, the Government has been devising actions to follow up on the first broad-based phase of economic reforms that was launched in the 1990s. The focus of the government’s actions is largely on policy implementation to consolidate the outcomes of the mid-1990s, and tackle the obstacles to sustained higher growth rates. Yet there are multiple signs indicating that it will be extremely difficult to achieve dynamic growth under current circumstances without a growth strategy that is more geographically differentiated and more balanced in its emphasis across rural and urban centers, domestic and tradable activities. The agricultural
xii

sector can work as an ‘engine of growth’ in some areas and for some households, and ADLI has identified some of the important interventions. But critical factors are missing and need to be included in an extended growth strategy: a more balanced and geographically-differentiated one. FIVE POLICY PRIORITIES: THREE IN (UNFINISHED) ADLI AGENDA AND TWO NEW BOLD INITIATIVES 12. Building on recent lessons, an expanded strategy would focus on a 3+2 set of priority entry points. Three are part of the unfinished agenda of ADLI: namely, connectivity, farmer risk management, and private sector development. Two are bold initiatives to help rebalance Ethiopia’s growth strategy: geographically-differentiated sub-strategies and investing in high potential areas. The implied recommendations combine measures that could pay-back in the medium to long term along side those that can be implemented in the short term.
Three Priorities for the (Unfinished) ADLI Agenda 1. Connectivity of rural economy with urban and global markets 13. A major challenge is to overcome the weak connectivity of the rural economy with urban areas and global markets. A key objective of ADLI is the transformation of subsistence farming into small-scale commercial farming. A critical ingredient to success is markets for the more productive agricultural sectors. The history of the late 1990s points to the problem stemming from the weak connectivity between the rural economy and urban markets. 14. Agricultural exports, a crucial ingredient for ADLI’s success, have not expanded significantly for two reasons.
First, the importance of coffee, the country's main export, has diminished radically over the past five years. The collapse of coffee prices in international markets has lead to a reduction in domestic production and a reduction in the unit value of coffee exports. Excessive dependence on commodities such as coffee as an engine of export growth is highly risky, given fierce international competition, policy distortions in key markets and uncertainty whether recent higher demand (reflected in higher commodity prices) will be sustained.
•
• Second, new non-traditional tradables in the agriculture sector have not emerged on the scale needed. Only 2 percent of non-traditional agricultural production is exported (compared to roughly 25 percent of traditional crops). Rapid growth in select non-traditional items such as roses suggests scope for scaling up. However, with the exception of enclaves around Addis Ababa and the largest cities severe structural constraints are in essence making agricultural commodities non-
xiii
tradable and hindering price competitiveness. Notable are high transport costs, weak supply chains, and limited intersectoral linkages, especially between modern industry and agriculture. The combination of low connectivity through roads, telecom, and railways; lack of water infrastructure; and limited urban infrastructure and energy creates a situation where it is hard for competitive supply chains to emerge for non-traditional high-value activities. For example, computations for 1999/2000 using the SAM show that, at a minimum, transaction costs in trade and transport amount to 14 percent of the value of output. Similarly, Ethiopia’s nominal shipment rate4 was 10.4 percent in 2002 (down from 12.6 percent in 1995). Though this seems competitive with the rates of other Sub-Saharan African countries (that of Kenya, with access to the sea, is 8.2 percent), it is much higher than those of South Africa or of Asian countries such as China, India, and Thailand. High international transport costs also tend to favor import substitution. In the garment making trade, for instance, Ethiopia’s overall transport costs represent around 28 percent of value added. This compares with the average transport cost in Africa of 15 - 20 percent and the world average of only 6.1 percent.
15. Higher levels of production of food crops focusing on domestic markets have had a tendency to depress prices and thus rural household incomes. This is mainly because domestic demand for food crops is not increasing at the same pace. In a context of slow growing domestic demand, high transactions costs and low labor incomes, improvement in agricultural productivity has been reflected in lower food prices to the extent that production is for the domestic market. This has been particularly true for maize, a crop for which yields have been responsive to a greater use of fertilizers and improved variety; while for other cereals yields have remained around their 20-year trend level. As a result, the internal terms of trade shifted against the rural sector: urban (often less poor) consumers have benefited rather than rural (often poorer) producers. Note that a recent study indicates that fifty-three percent of rural households were net buyers of grain in 1996 and may benefit from lower prices.5 Likewise, external markets have not been able to provide the additional boost in demand to sustain higher food crop prices. 16. Scaled-up investments limited to agriculture alone would not be sufficient to generate a significant expansion in other sectors, such as services, agro-industry and manufacturing. Using a model developed and calibrated for Ethiopia, simulations suggest a disappointing outcome—only 0.3 percent increase in real GDP—from a 10 percent increase in public investment in economic infrastructure fully allocated to activities and areas mainly producing goods with a low tradable potential, say food crops. Akin to Ethiopia’s recent experience, exports of goods, the labor market and intersectoral linkages are not stimulated. As a consequence, revenues increase only slightly, food crop prices tend to decline due to weak demand, and the demand for tradable inputs, such as fertilizers, barely increases. Hence, the terms of trade are hurting the rural sector. For food crops, in the absence of a more dynamic demand, increased levels of productivity
4Calculated from the balance of payment as (freight credit + freight debit + insurance credit + insurance debit) divided by (merchandise exports + merchandise imports). 5World Bank, Poverty Assessment, op. cit.
xiv
tend to translates in price volatility and decline, and more generally terms of trade evolving against the rural producers. 17. This is not to suggest an unbalanced growth strategy in the other direction, namely, promoting manufacturing exports with agricultural production feeding the cities would not work either. Without broad based growth of internal demand, the terms of trade will continue to hurt subsistence farmers. Moreover, it is difficult to foresee a rapid expansion of labor-intensive exports in the currently constrained and risky environment. Hence, an intermediate strategy appears to be appropriate for Ethiopia; i.e. a more balanced growth strategy that will attempt to foster deeper intersectoral and rural-urban linkages while addressing the dreadful risks affecting the country. 18. Rural-urban linkages remain severely undeveloped as reflected in low road and teledensity and weak urban development. Ethiopia has one of the lowest density road networks in Africa—roads follow routes radiating from the capital and do not integrate the country in an overall network, despite the fact that road transport accounts for some 95 percent of passenger and freight traffic in the country and is the only form of access to most rural communities. Some 60 percent of farms are more than half a day’s walk from an all-weather road. Another example is telecommunications. Although gains in network expansion since 2003 have led to a doubling in teledensity (0.5 to 0.95 lines per 100 inhabitants by mid 2004), Ethiopia still ranks at the bottom of sub-Saharan African countries in terms of telephone penetration rates. Likewise, thus far, Ethiopia suffers from the relative weakness of urban development and its network of regional and woreda capitals. With a total population exceeding 70 million, Ethiopia has only one city with more than 200,000 inhabitants; Addis Ababa, and it is twelve times larger than the second city Dire Dawa. 19. These constraints are reflected in high transactions costs for doing business. Bringing agricultural (as well as industrial) products to the market is a costly enterprise. The measured share of transactions costs in total output value is high—14 percent—and these shares are certainly underestimated because more than three-quarters of agricultural output does not pass through the market at all. Recommendation: Focus on human and physical infrastructure supportive of rural-urban linkages and tradable activities to expand domestic markets and tap international markets. 20. Expand investments in connectivity—roads, energy, telecom. These are vital to a gradual reduction of transaction costs for farmers’ products and development of factor and product markets, as well as to increase the rate of return of private investment which is currently low. For example, with an area of over 100,000 sq kms, the northern, medium to high rainfall zones of the western lowlands include millions of hectares of extensive, flat plains, suitable for large-scale mechanized agriculture. There are many basic goods and services that could be produced domestically using current technologies to meet an existing demand, provided that the flow of goods and information is improved. Improved
xv

accessibility to markets would in turn transform agriculture around cities and towns. 21. Aware of the key role played by economic infrastructure to spur growth, the country is already investing in its various components. For example, in the roads sector, recent annual investment has been in the range of $200 million. Current sectoral plans call for an increase to $247 million in 2005 and up to $400 million by 2007, and based on this trend road construction will continue to progress with investments averaging $500 million during the next 10 years, a good start but insufficient to ensure adequate connectivity to high potential areas in Ethiopia. In telecom, the public monopoly is also expected to continue its intense effort with an investment program of around $200 million recently, with sectoral plans of roughly $260 million by 2007, suggesting around $300 million a year over 2005-2015, again a good start but from a very low base. In electric power, the planned investments in hydropower will almost double the supply of electricity, for a total cost of around US$ 2 billion over 2005-15. Hence, further attention is needed to scale up financing and implementation capacity, as discussed below in the context of scaling up of the government’s overall public investment program. 22. Specifically, facilitate spatial decentralization of infrastructure around regional and woreda towns to enable them to become regional nuclei for economic growth. Developing these towns could provide services for their vicinity, accelerate rural growth and mobilize other potential sources of economic growth. Particular attention needs to be given to increased investment in outlying areas with the highest development potential, and to the more effective integration of those areas into the national economy. Select woreda and regional capitals can play a key role in the local economies, by augmenting their investment budgets and by creating the conditions for the private sector to be involved in partnership in energy, water utilities, telecom distribution, urban development, etc. 23. Accelerate urban land reform. Pursuing and deepening the ongoing reforms in this area is vital so as to eliminate this uncertainty to maximize the rate of return of private and public investment, and more generally government efforts to stimulate growth. This includes solving the problems with land legislation (federal and regional prototypes) especially regarding leases as basis for collateral, cost recovery, and lease periods that are so far delimited in time. 24. Facilitate labor mobility to allow this factor to move to rural non-agricultural activities, small towns and urban centers. The development of urban labor markets would facilitate the diffusion of innovation and knowledge via a higher concentration of activities, as well as generate demand-side effects through higher income levels and consumption patterns of wage earners, which rely more on market transactions than on self-sufficiency. This would contribute to urban as well as rural growth, and, to a more balanced growth path for the economy as a whole. Further work on labor markets could provide more concrete institutional and policy recommendations. 25. Pursue reform of public utilities structure to improve efficiency and reduce costs of
xvi
connectivity. Sectors such as telecommunications and transport (air, shipping lines, and land) are critical to connectivity. Yet, as noted earlier, trade and transport cost are high. Only part of this is explained by the costs of meeting the important socioeconomic objective of greater access through cross-subsidization. Hence, increase access will also depend on innovative solutions to reduce costs and bring in the private sector at every stage and through various arrangements—concessions, privatizations, partnerships, risk guaranties, BOTs, etc. 2. Understanding impact of risks on farmers’ behaviors 26. The country has not been able to break free from its numerous poverty traps and the impact of the related risks on farmers’ behaviours. The environment is extremely risky for many farmers, leading them to pursue rational low risk-low return strategies. The inability to absorb risk carries over into future years as well, for example, drought deprives the farmer not only of current income but also of assets, which may be lost (e.g., oxen dying) or sold in the market. This in turn limits their investments in technologies and inputs that could yield higher returns, such as industrial fertilizers, improved seeds, crop rotation and fallowing, but which impose a downside risk to the farmers. This further undermines future prospects of production growth Even where linkages have been strengthened, agricultural productivity has struggled to improve despite attempts to raise yield by increasing input utilization. Hence, sustaining the initial policy push in basic agricultural technology will increasingly reach limits despite significant public support. Recommendation: Initiate a Risk Reduction Process by Developing Appropriate Public Goods 27. Focus current policies aiming at increasing rainfed agriculture productivity where they can be most successful, and complement with expansion of risk sharing instruments on a large scale. Current interventions aiming at increasing cereal productivity remain appropriate in several parts of Ethiopia, in particular through the promotion of fertilizers, investments in soil and water conservation to mitigate the environmental degradation, public investments in connectivity—roads, telecom, and other market infrastructure. Accelerating growth will depend on improvements in both higher potential and food insecure regions where roughly 22 percent of the population currently reside. Yet these will need to be complemented with explicit risk-sharing mechanisms which can help overcome the resistance to technology adoption. These include piloting weather-risk insurance and micro rural finance institutions. These could efficiently complement the current interventions and increase the demand for basic inputs. 28. Current programs for rainwater harvesting ponds at the household level, small/micro-dams and small-scale irrigation can be scaled up successfully. For example, the construction of micro-dams appears to be economically viable with a reasonable return on investment over a 2-5 years period depending on location and technology. This could be improved in areas where the topography/situation allows for small dams able to
xvii
irrigate a significantly larger area. Annual net profits of micro-dams would be expected to cover development costs within two years. 29. Swiftly implement the proposals of the coalition for food security to develop safety nets that are not distorting food crop markets. It is estimated that a 10 percent increase in food aid depresses the terms of trade for food crop by 0.15 percent. The progressive replacement of emergency food aid by productive and cash-based safety nets should gradually eliminate the distortion impact of food aid on relative prices of agricultural products, and consequently producers’ incentives in the rural sector. 30. Gradually eliminate the perception by economic agents of a residual uncertainty on land markets. An important step would be for the government to acknowledge the existence in the rural areas of emerging informal land markets. This could be pursued and deepened in the context of the ongoing land reform at the regional level. A gradual approach will prevent fire sales from farmers an unsustainable urban population growth. 31. These several risk mitigation measures proposed above can help to increase consumption per capita in poor and food insecure areas. Analysis suggests that rising agricultural input usage in food insecure areas to the level observed in food secure areas—provided that risk mitigation measures allow farmers to move out their low risk-low return strategies—could increase per capita consumption by 4 percent and reduce the poverty headcount by roughly 3 percentage points.6 This also suggests that this will not be the route out of poverty for many other households in those areas and that other strategic components are necessary. In effect, the problem of low agricultural productivity may prove more intractable in fragile, lower potential areas, even with risk-mitigation mechanisms in place. Hence, for some vulnerable households, even bolder action will be required. For these households, it will be important to explore other channels that help shift such vulnerable households away from their traditional agricultural base. One is development of other high-potential agricultural areas in Ethiopia, discussed further below, complemented with increased labor mobility related to rural-urban linkages discussed above. 3. Mitigating risks to private sector investments, with prominent
private sector role only gradually emerging 32. The prominent role of the public sector and the absence of a critical mass of private entrepreneurs in many key high value-added sectors puts private investment in a situation of low self-fulfilling expectations. This includes several sub-sectors where the country has potential, like livestock and leather products. Perception of huge risks negatively affects the rate of return of private investment and, hence, willingness to invest on the requisite scale. In all cases, the perception by economic agents still remains that there is a bias against the private sector.
6World Bank, Poverty Assessment, op. cit.
xviii

33. Ethiopia is an economy in transition from a socialist to a market economy model, with an unfinished agenda of privatization, competition and reforming the public sector in manufacturing. Weak domestic competition and contestability in many sectors, the nature of state interventions, and the numerous state-owned enterprises combine to lead to an uneven level playing field. An effective policy to increase domestic competition has yet to be implemented. Thus far, market deregulation—and the related privatization process—has not stimulated dynamic private sector development. Many industrial enterprises remain under state monopoly or extended control of the state. There is also an important agenda for agriculture, in terms of competition in inputs markets (fertilizers and credit) as well as more developed market institutions on the output side (commodities markets, warehouse receipts). There are currently about 138 enterprises waiting to be privatized. Large enterprises have not attracted significant interest from potential buyers. The Government is about to change its approach to remove the bottlenecks holding up the privatization program. 34. Another obstacle to growth is the high cost of capital and low access to credit, which is due to the large size of the public sector’s overall financing needs combined with an unfinished agenda in the almost wholly state-owned banking sector, further contributing to lack of development in the financial sector. The public sector still accounts for the bulk of financial sector assets, including those of the banking sector. Similarly, domestic public debt absorbs new lending by banks while the non-bank financial sector, excluding informal credit institutions, remains negligible. The lack of competition is apparently a key obstacle to the development of a more efficient financial sector. Concurrently, the private sector lacks access to financial services and faces credit rationing. 35. High-potential zones and activities have not been tapped and developed by the private sector, even if there are some stories of local “virtuous circles”. These virtuous circles illustrate the links between public investment, private investment, market forces and growth that Ethiopia can scale up. For instance, thanks to irrigation and suitable linkages to urban areas, farmers develop commercial crops such as onions in Arsi zone along the Awash river, near Addis Ababa. Owing to linkages, this activity stimulates land and labor markets and services input suppliers. Competition on quality and price reduces costs and generates higher incomes for farmers. Higher incomes in rural areas generate another round. When there are complementarities between the supply of public goods, markets forces and economic development, overall economic and social costs of innovation and technology diffusion and skill acquisition can be reduced. The challenge remains how to scale-up these rare local “virtuous circles” and partnerships. Recommendation: Improve the Investment Climate and Seek Complementarities between Private and Public Investment 36. Accelerate ongoing efforts aiming at improving the investment climate. It includes deepening the reforms in the financial sector to expand credit availability, greater access
xix
to micro finance, and accelerating the implementation of the privatization program. While the government has recently devised new policies to address some of the shortcomings in this area, effectively nurturing a positive environment for firms could considerably magnify the returns on public investment efforts. 37. Nurture the private sector. This should include consultations with the private sector about stimulating high value added exports such as horticulture, floriculture, and livestock products. The objective would be to identify priority constraints where the public sector is best positioned to address, with a focus on the 5 I’s: investment, infrastructure, institutions, innovation, and inputs. These include, in addition to investment in economic infrastructure, efficient customs procedures; market information; extension services and farmer training; plant disease control; pesticide regulation; promoting competition in marketing and transport services; investment in varietal research in horticulture and post-harvest management; investment in research on post-harvest handling; establishment of grades and standards; and quality grading and certification. In addition, government activities that can be justified include: support for producer and trade associations; coordination of producers and buyers; provision of credit for investment; land leasing at concessionary rates to investors; campaigns to expand output of new crop; and investment in cold storage facilities. Part of this public-private partnership will be in the context of geographically-differentiated high-potential areas that have been untapped as discussed further below. 38. Involve the private sector in partnership for provision of infrastructure. Such greater involvement of the private sector can include a range of innovative solutions such as concessions, privatizations, BOTs, risk guaranties and partnerships . Additional analytical and technical work would be needed to devise well-designed and detailed implementation plans. 39. Speed-up the privatization of state farms and provide the appropriate complementary public goods to attract private investors. The state farms hold a total cultivable area of around 124,000 ha, of which only 100,000 are currently under cultivation due to lack of investment funds and poor management. Around 45 percent of the total cultivated area is irrigated. Available data indicate that while “some 22,000 ha of new modern irrigation schemes have been developed in the last decade, more than 21,000ha of irrigated state farms have been abandoned in the Middle Awash, Lower Awash and Rift Valley areas.”7 Except for the sugar factories, the state farms are functioning well below potential and could be an efficient entry point to attract domestic and foreign direct investment and boost exports.
7Federal Democratic Republic of Ethiopia, Water Sector Development Program, Vol. 1, Executive Summary, Ministry of Water Resources, Addis Ababa (October 2002).
xx

Two Bold Initiatives to Balance Strategy
4. Geographically-Differentiated and Regional Growth Strategies 40. The growth challenges in Ethiopia are geographically differentiated. The foregoing has suggested a variety of obstacles and mechanisms by which Ethiopia is “caught” in a low growth trap. Complementary to this analysis is a spatial perspective which highlights the differences among growth potentials and risks in the various zones of Ethiopia. As noted earlier, some regions are more affected by weather and health risks while others are affected by health risks. Growth potential and priorities depends on rainfed agricultural potential and the potential intensity for rural-urban and domestic-foreign market linkages and diversification. For some communities, priorities might be infrastructure for connectivity, for others bold investment programs to reduce risks and tap potential, and for yet others education to facilitate mobility into more dynamic growth areas and activities. Recommendation: Regional growth strategies should gradually drive budgets
41. Pursue the ongoing public financial management reforms as depicted in the Public Sector Capacity Building Program. 42. Regions should be encouraged to develop their own growth strategies. This should gradually drive budget allocations and budget discussions—along with social development objectives—with the federal level. 43. Develop appropriate fiscal instruments and condition their use on complementarities with private investment. The government will need to develop additional fiscal instruments available to regional authorities that are driven by existing growth potential consistent with the regional growth strategies. One is a fiscal instrument encouraging regional pooling to carry out large scale investments in infrastructure across regions—to support select growth nodes, consistent with the role of the Federal government. Access to these funds could be conditioned on the complementary attraction of private investment. 5. Tapping Opportunities in High-potential Areas 44. Opportunities in high-potential zones and activities have gone untapped and, hence, not stimulated broader growth. For example, malaria is widespread throughout the lowlands: more than 75 percent of the country’s area is exposed to malaria and 60 percent of the population, with peaks to 100 percent, is exposed to it. Trypanosomiasis spread by the tsetse fly is endemic in the western lowlands and the valleys leading down to them, particularly in the higher rainfall areas most suitable for rainfed farming. Partly
xxi
because of the continued threat of malaria and animal diseases in the lowlands, people continue to cluster in the eastern highlands where they are increasingly poor and dependent on diminishing plots of progressively less productive soils. Malaria has been rising in Ethiopia, but, bed nets are still largely unused in Ethiopia: in 2000 only 1 percent of households owned a bed net, out of which only 17.7 percent are insecticide treated. Attempts by highland farmers to resettle in the western lowlands were eventually defeated by the tsetse fly: ox plough based farming in the western lowlands is unlikely to be sustainable without serious tsetse control efforts. In the dry eastern and southern lowlands and the Rift Valley, livestock diseases constrain both the region’s potential for livestock production, and its access to international markets. Recommendation: Tackle the systemic risks in several high potential but undeveloped parts of Ethiopia. 45. Make malaria control a priority, with the Federal authorities supporting decentralized entities and mobilizing external support. Indoor residual spraying (IRS), has been successful in Ethiopia in the past and in other countries. This would open up the geographic regions of the lowlands for further development. 46. Provide public financing for tsetse fly eradication as a public good. To be effective and sustainable, tsetse eradication will need to be undertaken over large areas, with supervised labor to ensure implementation and follow-up throughout the tsetse-infested areas of the western lowlands and tsetse infested valleys leading down into the western lowlands. This would include the air and ground spraying of heavily infested areas; provision of free spray-on/pour-on insecticide preparations for cattle serving as mobile baits; preparation and placement of large numbers of simple insecticide-treated traps, and the employment of a person in each community to periodically service the traps by replacing the odorant baits. This should be followed up with the extended use of the Sterile Insect Technique, and periodic surveillance in order to be able to react promptly to future incursions.
Recommendation: Overcome constraints to tapping growth potential with ambitious –but well designed—investment programs, such as irrigation and power. 47. Explore opportunities under the Nile Basin Initiative including energy. Within the framework of this initiative, the Eastern Nile countries—Egypt, Ethiopia and Sudan—are now pursuing a two-track development strategy: (i) a Fast Track in which projects respond to urgent needs on the ground through irrigation development, watershed management, flood preparedness, and power interconnection); and (ii) a Multi-purpose Track that addresses comprehensive and integrated basin development, including large-scale investments. Cooperation on the Nile has enormous potential to trigger positive returns to the broader economy in Ethiopia. For instance, developing Ethiopia’s enormous hydropower potential becomes possible if export markets are developed; in addition to generating substantial revenues, this would also likely provide least cost electricity to expand access in Ethiopia In moving from dialogue to specific investments
xxii
in the Eastern Nile, there will be differences of perception on priorities as well as on costs, benefits and impacts among countries. The institutional framework of the NBI is proving to be a robust and effective forum for achieving consensus. 48. Increase attention to irrigation potential, by identifying initial feasible options while setting the stage for significant development taking place over time. Irrigation is a costly undertaking with important initial investment and a payback in the long term. It has significant externalities notably via the stimulation of labor markets. Current plans are to develop 275,000 ha of new irrigated land by 2016, in a watershed management framework, of which 54 percent of medium and large scale schemes (at a cost of $1.7 billion) compared to the need for 1.2 million ha of new irrigated land to meet Ethiopia’s cereal requirements (total potential is between 2.5-3 million ha.). Given Ethiopia’s limited experience in this area—and the large upfront financing requirements, there is still a lot to do in terms of feasibility studies and costing, developing technical and institutional capacities to manage the sector, creating regulatory capacity, developing an appropriate legal framework, and building capacity. Continued progress on the multi-country Nile Basin Initiative also will be an important prerequisite. 49. Rehabilitate and/or complete existing dams and related irrigation schemes and attract private investment. The private sector, which has been playing a timid role so far, should become much more involved. Already, the scope for state farm privatization has been mentioned as a first step. There are several abandoned and underutilized dams and related downstream irrigation schemes that are missing the basic infrastructure and dedicated public goods, such as good roads, needed to make them interesting for domestic and foreign private investors. While the number of unfinished projects abound, Several with the potential to irrigate 10,000 ha or more include Alwero Dam, Gode Diversion Dam, Omorati scheme and the Awah valley. 50. Develop multi-purpose dams in strategic locations for irrigation and hydropower, with physical linkages—such as roads and telecom—to urban and foreign markets. Dams are costly, but current literature is often ill informed or disputed as to the unit cost of dams. Some estimates are based on developed country costs, rather than taking full account of the costs of other countries, such as China, India or Turkey. Nonetheless, financing and capacity constraints necessitate a phasing of water infrastructure development. Basins where initial constraints are likely to be fewer include: Omo Basin for hydropower export to power-deficit neighboring countries and surplus for affordable pump irrigation, Dawa-Gennale Basin and Shabelle Basin for multi-purposes development of over one million ha. of irrigable land, as well as power and flood control, and in the dry pastoral eastern and southern lowlands where only a tiny fraction of the 1.5 million ha. of land has been irrigated. 51. Irrigated farming would also produce large quantities of crop residues suitable for dry season livestock feed. Irrigated fodder production would also open the way to large-scale commercial livestock production under controllable sanitary conditions, enabling better access to export markets. Multi-purpose dams could provide affordable hydropower to
xxiii
open the way to agro-processing, and encourage development of the southeast. 52. Build institutional capacity upfront. A significant development in the medium- to long-term will depend on innovative solutions to reduce costs and bring in the private sector at every stage and through various arrangements—concessions, privatizations, partnerships, risk guaranties, BOTs, etc—to complement public sources of financing. More studies are necessary to better understand costs, and technical and financial feasibility of these investments in the Ethiopian context. 53. In the livestock sector, establish a broader veterinary network with increased animal health coverage including an enabling environment for establishment of private veterinary service delivery systems. This will also require zoning according to international guidelines and establishment of disease-free zones. For livestock production, particular attention and support should be given to the Gennale-Dawa, Shabelle and Awash basins, where there is considerable potential for irrigated commercial farming and fodder production. 54. Expand connectivity for reaping the potential of mechanized agriculture. As the geographic scope of the agricultural base evolves and develops, infrastructure – roads, telecommunications, power – will be an important complement to the (small and large-scale) private sector investments in the rural economy. 55. These measures will further stimulate demand for continued investments in education and health to underpin improvements in labor productivity. The low capacity in science and technology, in particular, is important to augment for developing and implementing an expanded investment program aimed at accelerating growth. Human capital investment remains an important part of the overall story. The attempts at increasing agricultural yields through micro dam irrigation schemes is a good example of these extreme difficulties faced by Ethiopia in mustering, through initial public investments in technology, public investment, private investment, and market forces to accelerate growth. 56. Hence, a final set of recommendation is: Continue to strengthen education and health infrastructure. Develop capacity in science and technology in line with the increased role for public and private investment in tapping growth potential. Programs to strengthen human capital and develop capacity remain valid and central to the extended growth strategy.
xxiv
IMPLICATIONS FOR MACROECONOMIC POLICY INCLUDING THE ROLE OF FOREIGN AID 57. Ethiopia is one of the poorest countries in the world.. To halve poverty by 2015, GDP growth rates per capita in the range of 3.5-4 percent per annum are required.8 58. The combination of proposed priorities for accelerating growth have important macroeconomic implications, in particular, their implications for scaling up public investment to complement and stimulate private investment and move the economy to a higher growth path. The increase in public investment in infrastructure can “crowd in” private investment, thus leading to a higher annual growth rate in the long run. Yet financing of economic infrastructure is costly. The public sector will have a central role to play in addressing this infrastructure deficit, along with a crucial task to attract also the private sector.
59. The growth strategy recommended above requires significant support of the international community. Increased level of aid will be needed because of the paucity of available domestic resources and because taxation is already high. This foreign assistance could be very effective in Ethiopia. The country has a sound policy framework, very low level of asset accumulation, and committed policy makers. A dynamic medium term growth model presents a trajectory of Ethiopia’s economy under different scenarios of foreign aid flows and public investment allocations which suggests that foreign aid is likely to be very effective in putting Ethiopia on a sustainable growth path. For example, a 7 percentage points permanent increase of the nonfood aid-GDP ratio—above the current level—is consistent with the growth objectives. It could significantly accelerate growth and put Ethiopia on a sustainable growth path, and cut poverty by half (with a poverty-growth elasticity of -1). In the most adverse case (poverty-growth elasticity of -0.5), the poverty headcount would
Pove
y Re
Growth and Poverty: Permanent Increase of 7 Percentage Point in Nonfood Aid-GDP Ratio
(Percentage deviations from baseline)
-25
-20
-15
-10
-5
0
2003
2004
2005
2006
2007
2008
2009
2010
2011
2012
2013
2014
2015
rtdu
ctio
n
0
1
2
3
4
5
6
Poverty Trend (elasticity -0.5)Poverty Trend (Elasticity -1)Real GDP per capita at market prices (% change) - Right Axis
8This assumes a poverty-growth elasticity of -1. Whether a significant long-run reduction in poverty can be achieved depends not only on the country’s growth performance but also on the evolution of income distribution.
xxv
decrease by 10.6 percent by 2015. A rule of thumb emerging from the simulation exercises is that an increase in foreign aid equivalent to one percent of GDP would reduce the proportion of population in poverty by between 1.1 and 2.3 percent, depending on what is assumed about the relationship between growth and poverty reduction. 60. This would involve a sizeable increase in foreign aid financing, mostly in the form of grants. In dollar terms, a 7 percentage points permanent increase of the nonfood aid-GDP ratio is equivalent to multiplying the current level of ODA—around $1.3 billion—by around 3 at the 2015 horizon—$3.9 billion in 2015. In per capita terms, this would mean a progressive increase in total ODA from the current $19.4 to around $39 in 2015, which is high relative to a Sub-Saharan average of $27 in 2002, but less than what Mozambique and Mali received. With faster economic growth, however, ODA as a percentage of GDP would only increase slightly—around 24 percent throughout the 2002-2015 period.
ODA Indicators: Permanent Increase of 7 Percentage Point in Nonfood Aid-GDP Ratio
10
15
20
25
30
35
40
45
2002
2003
2004
2005
2006
2007
2008
2009
2010
2011
2012
2013
2014
2015
0
500
1,000
1,500
2,000
2,500
3,000
3,500
4,000
Total ODA in $ per Capita Total ODA in % of GDPTotal ODA in $bn. (right axis)
61. Ethiopia is in a position to receive additional foreign aid while managing its short term macroeconomic implications and positively benefiting in the medium term. One of the potential dangers of increased foreign inflows is the impact on the real exchange rate or competitiveness of the economy in developing its tradable goods sector This potential Dutch disease effect appears less likely to materialize in the case of Ethiopia. As illustrated by the dynamic growth model, because the increase in non-food aid raises public investment, and thus private capital formation, the adverse effect of a rise in aggregate demand on prices is offset by the positive supply-side effects of the increase in public and private capital. At the same time, the inflow of aid leads to a reduction in government foreign borrowing, which dampens the initial upward effect of the increase in foreign exchange supply on the nominal exchange rate. In effect, there is substitution between debt and non-debt creating capital inflows 62. There are no signs of diminishing returns to aid. But Ethiopia and its development partners need to continue focusing on reforms that can further increase its absorption capacity. In this respect the current focus on decentralization, and on administrative capacity building, is of central importance. The ongoing state transformation process, which involves the transfer of significant proportions of spending and responsibilities to the woreda level, is expected to further enhance public
xxvi
management functions. Also, the PSCAP objective of pursuit and scaling-up the ongoing public financial management reform is crucial to a judicious utilization of aid. 63. As foreign aid flows increase, improvements in budgeting will be necessary. Currently investment is planned and appraised as part of a comprehensive investment strategy, and project evaluation procedures, at least for external projects, are solid. It will be essential to maintain high quality of design and implementation in anticipation of large capital budget increases to ensure that the growth dividend indeed materializes. Increased aid-funded levels of public investment should be linked to the overall objective of rebalancing the current growth strategy. Block grants to towns could contribute to this objective as well as other instruments to transfer funding to local authorities, consistent with the overall growth strategy. IN CONCLUSION 64. The proposed growth strategy for Ethiopia encompasses a 3+2 agenda. First, it must build on the current strategy and address the unfinished agenda of ADLI, namely:
Strengthening market connectivity and rural-urban linkages, • • •
• •
Understanding farmer risks, and Improving environment for private sector development.
65. At the same time, the growth strategy must become more balanced and take bold steps, namely:
Geographically differentiating growth strategies, and Tapping high-potential areas through major investments.
66. Such a rebalancing and scaling up can be achieved within a sound overall macroeconomic framework. Scale-up of foreign aid will have an important role to play initially, as will partnership with the private sector given the financing constraints. 67. A combination of well functioning and thicker markets and supply of public goods will be critical to a sustainable pattern of economic growth. This should diversify the sources of growth—in agriculture, services, manufacturing, and rural and urban—away from traditional agricultural production, and create the conditions for high value added exports to expand. Accelerating growth will hinge on greater levels of public investment in infrastructure to build foundations for an enhanced market integration. A higher level of capital stock would, in turn, increase the rate of return of private investment which, in addition to a suitable investment climate, is critical to accelerate growth. The proposed short term actions could trigger a process of virtuous change based on market integration, labor productivity improvement and complementarities between public and private investments; build confidence; and lay the ground for future long term reforms.
xxvii
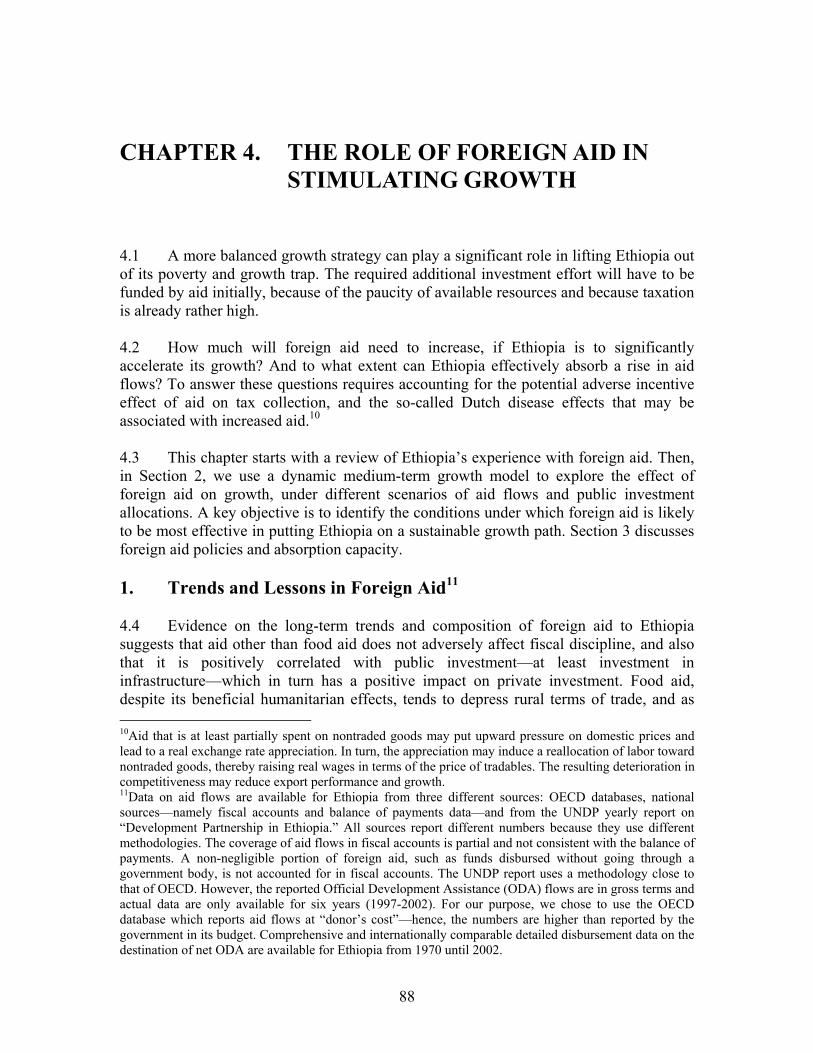
CHAPTER 4. THE ROLE OF FOREIGN AID IN STIMULATING GROWTH
4.1 A more balanced growth strategy can play a significant role in lifting Ethiopia out of its poverty and growth trap. The required additional investment effort will have to be funded by aid initially, because of the paucity of available resources and because taxation is already rather high. 4.2 How much will foreign aid need to increase, if Ethiopia is to significantly accelerate its growth? And to what extent can Ethiopia effectively absorb a rise in aid flows? To answer these questions requires accounting for the potential adverse incentive effect of aid on tax collection, and the so-called Dutch disease effects that may be associated with increased aid.10 4.3 This chapter starts with a review of Ethiopia’s experience with foreign aid. Then, in Section 2, we use a dynamic medium-term growth model to explore the effect of foreign aid on growth, under different scenarios of aid flows and public investment allocations. A key objective is to identify the conditions under which foreign aid is likely to be most effective in putting Ethiopia on a sustainable growth path. Section 3 discusses foreign aid policies and absorption capacity. 1. Trends and Lessons in Foreign Aid11 4.4 Evidence on the long-term trends and composition of foreign aid to Ethiopia suggests that aid other than food aid does not adversely affect fiscal discipline, and also that it is positively correlated with public investment—at least investment in infrastructure—which in turn has a positive impact on private investment. Food aid, despite its beneficial humanitarian effects, tends to depress rural terms of trade, and as 10Aid that is at least partially spent on nontraded goods may put upward pressure on domestic prices and lead to a real exchange rate appreciation. In turn, the appreciation may induce a reallocation of labor toward nontraded goods, thereby raising real wages in terms of the price of tradables. The resulting deterioration in competitiveness may reduce export performance and growth. 11Data on aid flows are available for Ethiopia from three different sources: OECD databases, national sources—namely fiscal accounts and balance of payments data—and from the UNDP yearly report on “Development Partnership in Ethiopia.” All sources report different numbers because they use different methodologies. The coverage of aid flows in fiscal accounts is partial and not consistent with the balance of payments. A non-negligible portion of foreign aid, such as funds disbursed without going through a government body, is not accounted for in fiscal accounts. The UNDP report uses a methodology close to that of OECD. However, the reported Official Development Assistance (ODA) flows are in gross terms and actual data are only available for six years (1997-2002). For our purpose, we chose to use the OECD database which reports aid flows at “donor’s cost”—hence, the numbers are higher than reported by the government in its budget. Comprehensive and internationally comparable detailed disbursement data on the destination of net ODA are available for Ethiopia from 1970 until 2002.
88
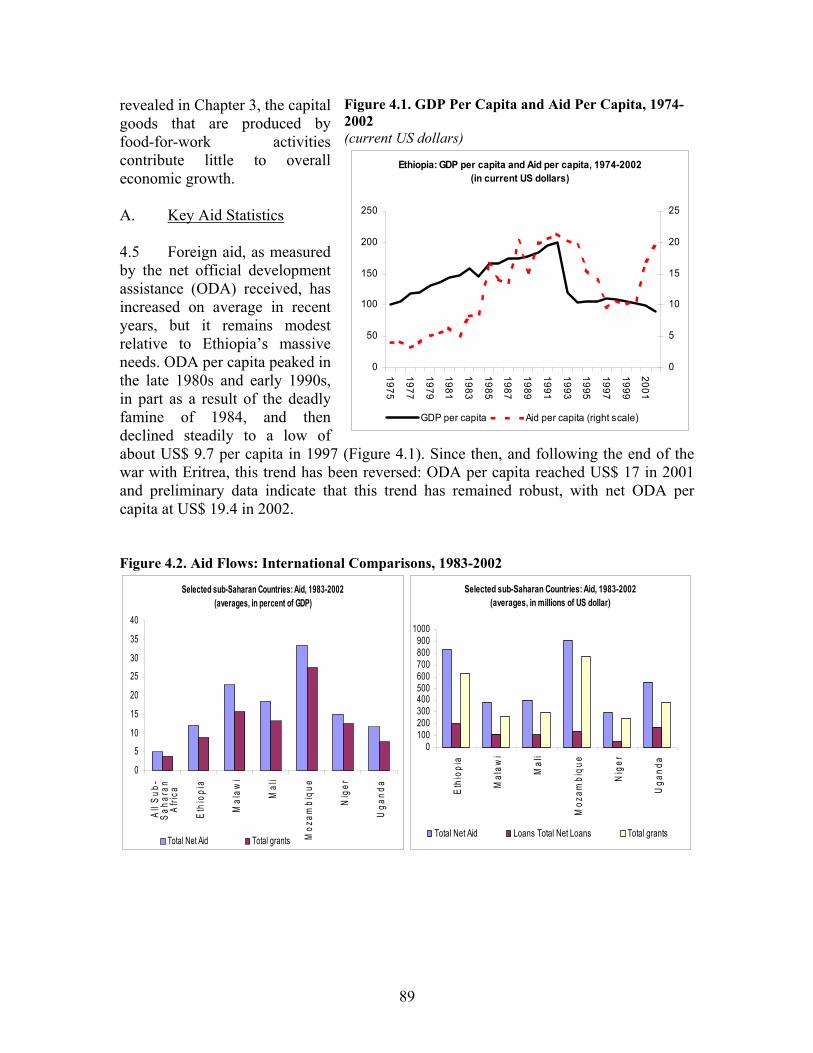
revealed in Chapter 3, the capital goods that are produced by food-for-work activities contribute little to overall economic growth. A. Key Aid Statistics 4.5 Foreign aid, as measured by the net official development assistance (ODA) received, has increased on average in recent years, but it remains modest relative to Ethiopia’s massive needs. ODA per capita peaked in the late 1980s and early 1990s, in part as a result of the deadly famine of 1984, and then declined steadily to a low of about US$ 9.7 per capita in 1997 (Figure 4.1). Since then, and following the end of the war with Eritrea, this trend has been reversed: ODA per capita reached US$ 17 in 2001 and preliminary data indicate that this trend has remained robust, with net ODA per capita at US$ 19.4 in 2002.
Figure 4.1. GDP Per Capita and Aid Per Capita, 1974-2002 (current US dollars)
Ethiopia: GDP per capita and Aid per capita, 1974-2002(in current US dollars)
0
50
100
150
200
250
1975
1977
1979
1981
1983
1985
1987
1989
1991
1993
1995
1997
1999
2001
0
5
10
15
20
25
GDP per capita Aid per capita (right scale)
Figure 4.2. Aid Flows: International Comparisons, 1983-2002
Selected sub-Saharan Countries: Aid, 1983-2002 (averages, in percent of GDP)
0
5
10
15
20
25
30
35
40
All S
ub-
Saha
ran
Afric
a
Ethi
opia
Mal
awi
Mal
i
Moz
ambi
que
Nig
er
Uga
nda
Total Net Aid Total grants
Selected sub-Saharan Countries: Aid, 1983-2002 (averages, in millions of US dollar)
0100200300400500600700800900
1000
Ethi
opia
Mal
awi
Mal
i
Moz
ambi
que
Nig
er
Uga
nda
Total Net Aid Loans Total Net Loans Total grants
89

Selected sub-Saharan Countries: Per Capita Aid, 1983-2002 (averages, in current US dollars)
0
10
20
30
40
50
60
70
All S
ub-
Saha
ran
Afric
a
Ethiop
ia
Malaw
i
Mali
Moz
ambiqu
e
Niger
Uga
nda
Total Net Aid Total grants
4.6 Compared with those of other Sub-Saharan countries, Ethiopia’s receipts of ODA are large in absolute terms and as a share of GDP (Figure 4.2). Overt he last 20 years, Ethiopia’s ODA amounted to around 12 percent of GDP, including the equivalent of 9 percent of GDP in the form of grants. These aid receipts are much higher than the average for sub-Saharan countries, and at par with those of Uganda, although below those of Mozambique, Malawi, and Mali. In per capita terms, however, Ethiopia’s ODA remains below Sub-Saharan averages, particularly those of Mozambique, Malawi, and Niger. Over the last 20 years, Ethiopia averaged US$ 15 per capita, of which US$ 12 represents grants. This is about half the level of aid to Uganda and a quarter of that to Mozambique (Figure 4.2). 4.7 Between 1992 and 2002, Ethiopia received about US$ 913 million of ODA annually, of which around 71 percent took the form of grants and the rest was at highly concessional terms. This is equivalent to US$ 15.4 per capita and 14 percent of GDP. Grant flows were equivalent to 10 percent of the country’s GDP and US$ 11 per capita. 4.8 An important feature of foreign aid in Ethiopia is the large share of food aid in total aid
Figure 4.3. Composition of Aid per Capita, 1975-2002 (US dollars)
Ethiopia: Composition of Aid per Capita(in US dollars)
0
2
4
6
8
10
12
14
16
18
20
1975
1977
1979
1981
1983
1985
1987
1989
1991
1993
1995
1997
1999
2001
0
1
2
3
4
5
6
7
8
9
10
Non-food aid Food aid (right scale) Loans (right scale)
90
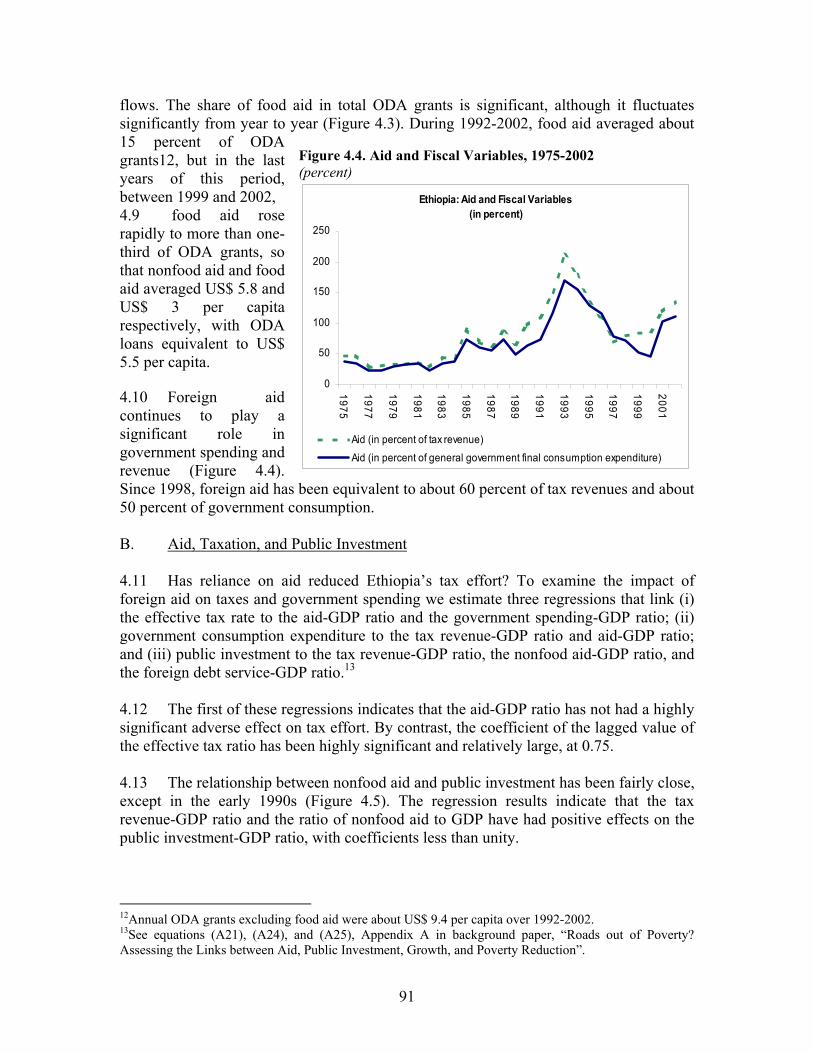
flows. The share of food aid in total ODA grants is significant, although it fluctuates significantly from year to year (Figure 4.3). During 1992-2002, food aid averaged about 15 percent of ODA grants12, but in the last years of this period, between 1999 and 2002, 4.9 food aid rose rapidly to more than one-third of ODA grants, so that nonfood aid and food aid averaged US$ 5.8 and US$ 3 per capita respectively, with ODA loans equivalent to US$ 5.5 per capita. 4.10 Foreign aid continues to play a significant role in government spending and revenue (Figure 4.4). Since 1998, foreign aid has been equivalent to about 60 percent of tax revenues and about 50 percent of government consumption.
Figure 4.4. Aid and Fiscal Variables, 1975-2002 (percent)
Ethiopia: Aid and Fiscal Variables (in percent)
0
50
100
150
200
250
1975
1977
1979
1981
1983
1985
1987
1989
1991
1993
1995
1997
1999
2001
Aid (in percent of tax revenue)Aid (in percent of general government final consumption expenditure)
B. Aid, Taxation, and Public Investment 4.11 Has reliance on aid reduced Ethiopia’s tax effort? To examine the impact of foreign aid on taxes and government spending we estimate three regressions that link (i) the effective tax rate to the aid-GDP ratio and the government spending-GDP ratio; (ii) government consumption expenditure to the tax revenue-GDP ratio and aid-GDP ratio; and (iii) public investment to the tax revenue-GDP ratio, the nonfood aid-GDP ratio, and the foreign debt service-GDP ratio.13 4.12 The first of these regressions indicates that the aid-GDP ratio has not had a highly significant adverse effect on tax effort. By contrast, the coefficient of the lagged value of the effective tax ratio has been highly significant and relatively large, at 0.75. 4.13 The relationship between nonfood aid and public investment has been fairly close, except in the early 1990s (Figure 4.5). The regression results indicate that the tax revenue-GDP ratio and the ratio of nonfood aid to GDP have had positive effects on the public investment-GDP ratio, with coefficients less than unity.
12Annual ODA grants excluding food aid were about US$ 9.4 per capita over 1992-2002. 13See equations (A21), (A24), and (A25), Appendix A in background paper, “Roads out of Poverty? Assessing the Links between Aid, Public Investment, Growth, and Poverty Reduction”.
91
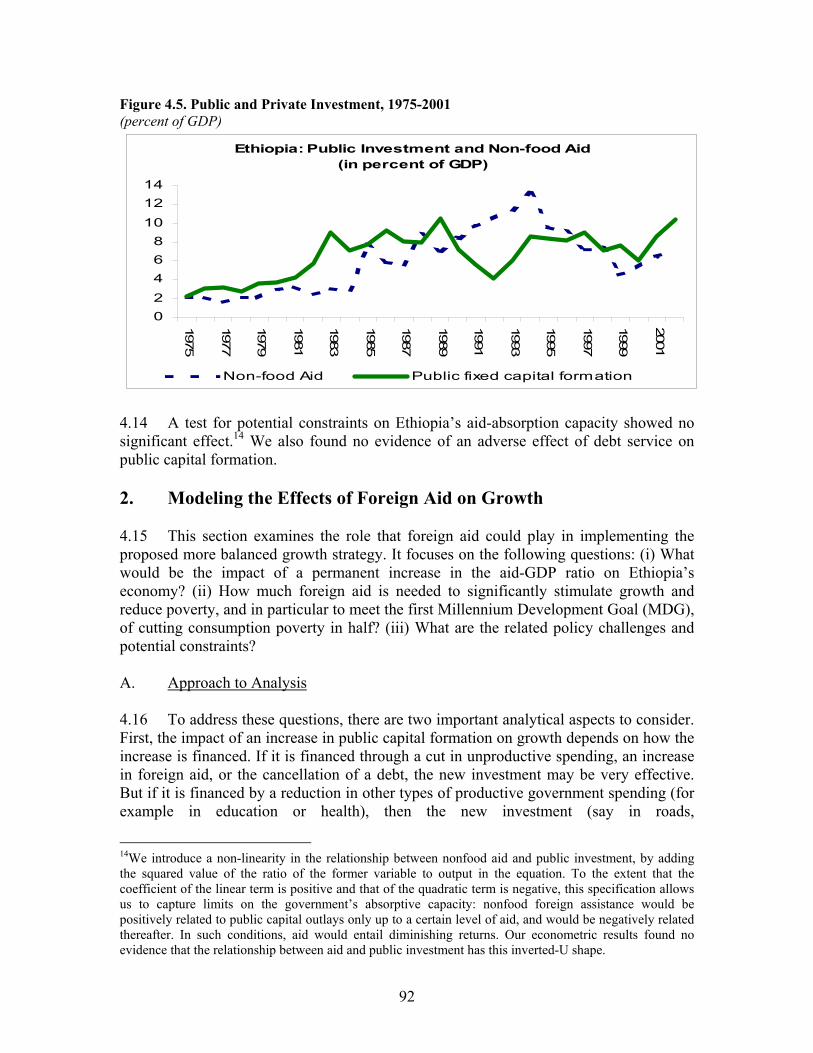
Figure 4.5. Public and Private Investment, 1975-2001 (percent of GDP)
Ethiopia: Public Investment and Non-food Aid(in percent of GDP)
02468
101214
1975
1977
1979
1981
1983
1985
1987
1989
1991
1993
1995
1997
1999
2001
Non-food Aid Public fixed capital formation
4.14 A test for potential constraints on Ethiopia’s aid-absorption capacity showed no significant effect.14 We also found no evidence of an adverse effect of debt service on public capital formation. 2. Modeling the Effects of Foreign Aid on Growth 4.15 This section examines the role that foreign aid could play in implementing the proposed more balanced growth strategy. It focuses on the following questions: (i) What would be the impact of a permanent increase in the aid-GDP ratio on Ethiopia’s economy? (ii) How much foreign aid is needed to significantly stimulate growth and reduce poverty, and in particular to meet the first Millennium Development Goal (MDG), of cutting consumption poverty in half? (iii) What are the related policy challenges and potential constraints? A. Approach to Analysis 4.16 To address these questions, there are two important analytical aspects to consider. First, the impact of an increase in public capital formation on growth depends on how the increase is financed. If it is financed through a cut in unproductive spending, an increase in foreign aid, or the cancellation of a debt, the new investment may be very effective. But if it is financed by a reduction in other types of productive government spending (for example in education or health), then the new investment (say in roads,
14We introduce a non-linearity in the relationship between nonfood aid and public investment, by adding the squared value of the ratio of the former variable to output in the equation. To the extent that the coefficient of the linear term is positive and that of the quadratic term is negative, this specification allows us to capture limits on the government’s absorptive capacity: nonfood foreign assistance would be positively related to public capital outlays only up to a certain level of aid, and would be negatively related thereafter. In such conditions, aid would entail diminishing returns. Our econometric results found no evidence that the relationship between aid and public investment has this inverted-U shape.
92

telecommunications, and the like) may not allow the government to pull the economy out of its poverty trap (in this example, because progress is limited by the lack of qualified or healthy workers). Moreover, to the extent that public investment displaces or crowds out private investment, its impact on the economy’s overall rate of physical capital accumulation may be reduced. In designing a program to help a country move to a sustainable growth path, policy complementarities are very important. 4.17 Second, large inflows of foreign aid may create Dutch disease effects. It has also been argued, however, that if learning by doing takes place (that is, if productivity gains are endogenous) and spills over from one production sector to another, or if aid has a direct effect on public investment in infrastructure, then the longer-run effect on the real exchange rate may be ambiguous (Box 4.1). Box 4.1. Foreign Aid and the Dutch Disease A key concern associated with large inflows of foreign aid is the possibility that they may engender the Dutch disease.i An increase in aid that is spent at least in part on domestic nontraded goods leads to higher domestic prices through its impact on aggregate demand. Under a flexible exchange rate, it also leads to a nominal exchange rate appreciation, through the increased supply of foreign currency. In either case, the real exchange rate appreciates, thereby weakening the competitiveness of the country’s export sector. This is the so-called “spending effect.” At the same time, there is a “resource movement effect,” whereby factor inputs shift into the production of domestic non-traded goods, to match the increase in domestic demand. The reallocation of labor toward the non-traded goods sector raises real wages in terms of the price of tradable goods and compounds the adverse effect of the initial real appreciation on the export sector. However, recent research on Dutch disease effects emphasizes the longer-term impact of aid inflows on productivity and public investment, and thus the importance of distinguishing between short- and long-term effects in assessing the impact of aid on the real exchange rate. In the short term, the immediate effect of an aid inflow may be a real appreciation, through the two channels identified above. Over time, however, at least two other effects may come into play. The first is the productivity effect. A shift in resources away from traded sectors (such as manufacturing) may affect a country’s long-term growth prospects by reducing the rate of human capital accumulation, if these sectors generate strong “learning by doing” externalities. But if, on the contrary, learning-by-doing effects are strong in the non-tradable sector, and learning spillovers between sectors are important, the productivity and growth effects would operate in the opposite direction. Indeed, if the productivity gains are large enough, it is possible for the real exchange rate to depreciate in the long run, despite appreciating in the short term, and for the output of tradables to increase, instead of contracting.ii The second effect relates to the impact of aid on public investment. If aid has a direct effect on public investment in infrastructure, for instance, and public capital raises the productivity of private inputs as well as private capital formation, the longer-run effect on the real exchange rate may be ambiguous.iii Thus, when the dynamic effects of foreign aid are taken into account, short-run concerns with the Dutch disease may be overstated. How important is the Dutch disease effect of aid in practice? The evidence is mixed. While some studies have found evidence of sharp increases in aid inflows resulting in an appreciation of the real exchange rate, with adverse effects on the tradable sectorsiv, others have been less
93
conclusive.v Econometric studies indicate that Dutch disease can be significant, particularly in countries where aid accounts for a very large share of national income. In such conditions, designing appropriate policies to prevent Dutch disease effects from offsetting the positive effects of aid on growth is essential. In general, the appropriate choice of policy will depend on whether the aid inflow is permanent or transitory. If it is transitory, the adverse effect on the export sector may well be short-lived. In that case, policymakers may use macroeconomic policies to mitigate the real appreciation and the shift in production from the tradable to the non-tradable sector—for instance, sterilizing foreign exchange intervention or increasing the share of aid-financed government spending on traded goods. By contrast, if the aid inflow is permanent, macroeconomic policies must be supplemented by structural policies. These policies include measures to raise productivity in the non-traded goods sector (possibly through privatization and restructuring) and retraining opportunities for laid-off workers. To the extent that, as indicated earlier, spillover effects exist between sectors, the longer-run effect of aid inflows may well be a depreciation and an expansion of the tradable sector. ________________________ i Originally, the Dutch disease was identified as a syndrome affecting countries that have experienced a windfall associated with a natural resource discovery. See Max W. Corden (1984), “Booming Sector and Dutch Disease Economics: Survey and Consolidation,” Oxford Economic Papers 36 (November): 359-80. iiRagnar Torvik (2001), “Learning by Doing and the Dutch Disease,” European Economic Review 45 (February): 285-306. iiiChristopher Adam and David Bevan (2003), “Aid, Public Expenditure and Dutch Disease,” Working Paper No. 2003-02, Centre for the Study of African Economies, Oxford University (February). ivPeter Heller and Sanjeev Gupta (2002), “Challenges in Expanding Development Assistance,” IMF Discussion Paper, PDP/02/5 (March), cite several studies that provide evidence of this phenomenon in low-income countries (e.g., Burkina Faso, Cote d’Ivoire, Senegal, Togo, Malawi and Sri Lanka). v For example, see P. Hjertholm and J. Lauresen (1998), “Macroeconomic Issues in Foreign Aid,” Institute of Economics Discussion Paper, University of Copenhagen, and T. Nyoni (2000), “Foreign Aid and Economic Performance in Tanzania,” World Development 26. viNyoni (1998, op. cit.) 4.18 To assess the growth and poverty impacts of increased aid while accounting for the various factors that may limit the returns to aid, the model draws on the operational macroeconomic framework developed for the CEM.15 We run the following policy experiments:16
• •
A change in the ratio of aid to GDP; An evaluation of the level of nonfood aid needed by Ethiopia to accelerate growth enough to achieve a 50 percent reduction in the proportion of population in consumption poverty between 2003 and 2015—in line with the first Millennium Development Goal (MDG).
15See Chapter 2 above and CEM background paper, “Roads out of Poverty? Assessing the Links between Aid, Public Investment, Growth, and Poverty Reduction” for a full description of the model. 16All results are displayed as percentage changes (for variables in levels) or absolute differences (for variables in percentage form) from baseline values.
94
B. Results
Results of a Change in the Level of Foreign Aid 4.19 Our first experiment considers a permanent increase in the ratio of aid to GDP by one percentage point, compared to a baseline in which foreign aid remains at its 2002 value of 11.6 percent of GDP.17 4.20 The increase in aid would directly affect the budget (Table A4.2 in Appendix 4). On the one hand aid would lower the fiscal deficit, because it adds to resources “above the line”, and on the other it would increase the deficit, because it raises overall public investment. Public investment would initially increase by about 0.7 percent of GDP, but then rise quickly (indirectly as a result of the increase in tax revenue), becoming almost one to one, i.e. a one percent increase in aid produces a one percentage point increase in public investment. The initial reduction in the budget deficit would therefore gradually disappear. 4.21 The increase in public investment in infrastructure would “crowd in” private investment and raise the annual economic growth rate by about 0.2 percentage points in the long run. The increase in private capital accumulation would tend to raise the demand for educated labor, given the low degree of substitution between these two factors. Because the increase in public investment is allocated across all components of government capital formation (according to initial shares), at least part of the greater demand for educated labor would be matched by greater supply. Over time, the improvement in the health of the population would raise the productivity of educated labor, whereas the increase in public capital in infrastructure would raise the marginal productivity of all other production factors; including “effective” (healthy and educated) labor. These productivity gains would also help to raise domestic output, leading to an increase in consumption spending and to poverty reduction. 4.22 A rule of thumb emerging from this simulation is that an increase in foreign aid equivalent to one percent of GDP would reduce the proportion of population in poverty by between 1.1 and 2.3 percent, depending on what is assumed about the relationship between growth and poverty reduction. The growth rate of real disposable income per capita rises at its peak by almost 0.6 percentage points. With a growth-poverty reduction elasticity of -0.5, the poverty rate falls by only 1.1 percentage points by 2015. With a partial elasticity of -1, poverty would fall by about 2.3 percentage points over the same time horizon. 4.23 Throughout the period, the real exchange rate would depreciate as a result of both an initial reduction in composite prices and a nominal depreciation. Both would follow a supply response that outweighs the increase in aggregate demand that results from higher government spending. Put differently, the rise in domestic supply would put downward pressure on the prices of domestic goods. As a result, production would be reallocated 17This implies that food and nonfood aid increase in the same proportion, given that the shares of both categories remain constant over time.
95
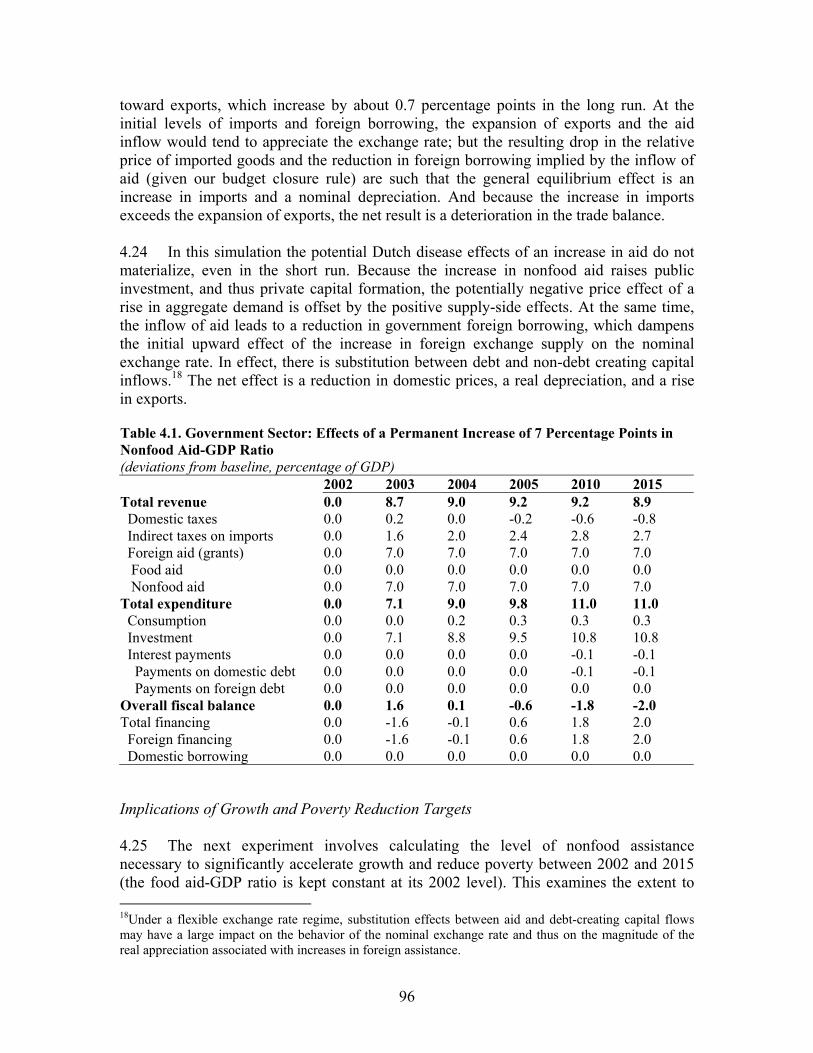
toward exports, which increase by about 0.7 percentage points in the long run. At the initial levels of imports and foreign borrowing, the expansion of exports and the aid inflow would tend to appreciate the exchange rate; but the resulting drop in the relative price of imported goods and the reduction in foreign borrowing implied by the inflow of aid (given our budget closure rule) are such that the general equilibrium effect is an increase in imports and a nominal depreciation. And because the increase in imports exceeds the expansion of exports, the net result is a deterioration in the trade balance. 4.24 In this simulation the potential Dutch disease effects of an increase in aid do not materialize, even in the short run. Because the increase in nonfood aid raises public investment, and thus private capital formation, the potentially negative price effect of a rise in aggregate demand is offset by the positive supply-side effects. At the same time, the inflow of aid leads to a reduction in government foreign borrowing, which dampens the initial upward effect of the increase in foreign exchange supply on the nominal exchange rate. In effect, there is substitution between debt and non-debt creating capital inflows.18 The net effect is a reduction in domestic prices, a real depreciation, and a rise in exports. Table 4.1. Government Sector: Effects of a Permanent Increase of 7 Percentage Points in Nonfood Aid-GDP Ratio (deviations from baseline, percentage of GDP) 2002 2003 2004 2005 2010 2015 Total revenue 0.0 8.7 9.0 9.2 9.2 8.9 Domestic taxes 0.0 0.2 0.0 -0.2 -0.6 -0.8 Indirect taxes on imports 0.0 1.6 2.0 2.4 2.8 2.7 Foreign aid (grants) 0.0 7.0 7.0 7.0 7.0 7.0 Food aid 0.0 0.0 0.0 0.0 0.0 0.0 Nonfood aid 0.0 7.0 7.0 7.0 7.0 7.0 Total expenditure 0.0 7.1 9.0 9.8 11.0 11.0 Consumption 0.0 0.0 0.2 0.3 0.3 0.3 Investment 0.0 7.1 8.8 9.5 10.8 10.8 Interest payments 0.0 0.0 0.0 0.0 -0.1 -0.1 Payments on domestic debt 0.0 0.0 0.0 0.0 -0.1 -0.1 Payments on foreign debt 0.0 0.0 0.0 0.0 0.0 0.0 Overall fiscal balance 0.0 1.6 0.1 -0.6 -1.8 -2.0 Total financing 0.0 -1.6 -0.1 0.6 1.8 2.0 Foreign financing 0.0 -1.6 -0.1 0.6 1.8 2.0 Domestic borrowing 0.0 0.0 0.0 0.0 0.0 0.0
Implications of Growth and Poverty Reduction Targets 4.25 The next experiment involves calculating the level of nonfood assistance necessary to significantly accelerate growth and reduce poverty between 2002 and 2015 (the food aid-GDP ratio is kept constant at its 2002 level). This examines the extent to 18Under a flexible exchange rate regime, substitution effects between aid and debt-creating capital flows may have a large impact on the behavior of the nominal exchange rate and thus on the magnitude of the real appreciation associated with increases in foreign assistance.
96
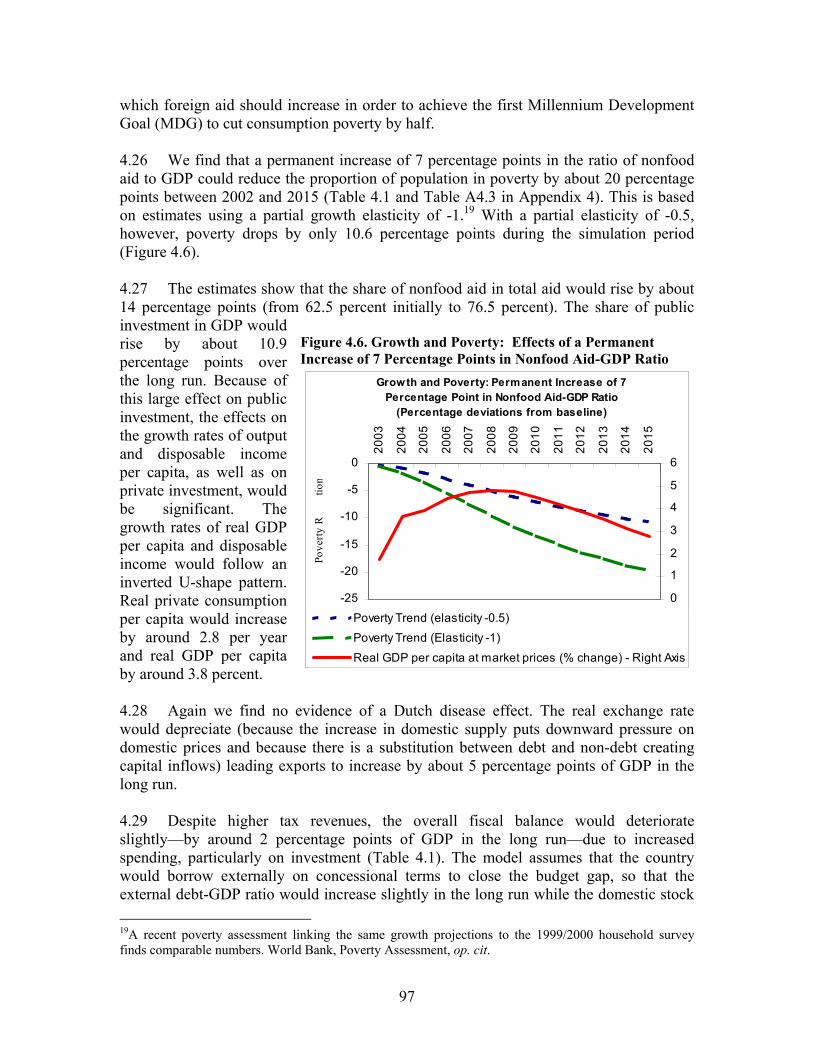
which foreign aid should increase in order to achieve the first Millennium Development Goal (MDG) to cut consumption poverty by half. 4.26 We find that a permanent increase of 7 percentage points in the ratio of nonfood aid to GDP could reduce the proportion of population in poverty by about 20 percentage points between 2002 and 2015 (Table 4.1 and Table A4.3 in Appendix 4). This is based on estimates using a partial growth elasticity of -1.19 With a partial elasticity of -0.5, however, poverty drops by only 10.6 percentage points during the simulation period (Figure 4.6). 4.27 The estimates show that the share of nonfood aid in total aid would rise by about 14 percentage points (from 62.5 percent initially to 76.5 percent). The share of public investment in GDP would rise by about 10.9 percentage points over the long run. Because of this large effect on public investment, the effects on the growth rates of output and disposable income per capita, as well as on private investment, would be significant. The growth rates of real GDP per capita and disposable income would follow an inverted U-shape pattern. Real private consumption per capita would increase by around 2.8 per year and real GDP per capita by around 3.8 percent.
educ
Figure 4.6. Growth and Poverty: Effects of a Permanent Increase of 7 Percentage Points in Nonfood Aid-GDP Ratio
Growth and Poverty: Permanent Increase of 7 Percentage Point in Nonfood Aid-GDP Ratio
(Percentage deviations from baseline)
-25
-20
-15
-10
-5
0
2003
2004
2005
2006
2007
2008
2009
2010
2011
2012
2013
2014
2015
Pove
rty R
tion
0
1
2
3
4
5
6
Poverty Trend (elasticity -0.5)Poverty Trend (Elasticity -1)Real GDP per capita at market prices (% change) - Right Axis
4.28 Again we find no evidence of a Dutch disease effect. The real exchange rate would depreciate (because the increase in domestic supply puts downward pressure on domestic prices and because there is a substitution between debt and non-debt creating capital inflows) leading exports to increase by about 5 percentage points of GDP in the long run. 4.29 Despite higher tax revenues, the overall fiscal balance would deteriorate slightly—by around 2 percentage points of GDP in the long run—due to increased spending, particularly on investment (Table 4.1). The model assumes that the country would borrow externally on concessional terms to close the budget gap, so that the external debt-GDP ratio would increase slightly in the long run while the domestic stock 19A recent poverty assessment linking the same growth projections to the 1999/2000 household survey finds comparable numbers. World Bank, Poverty Assessment, op. cit.
97
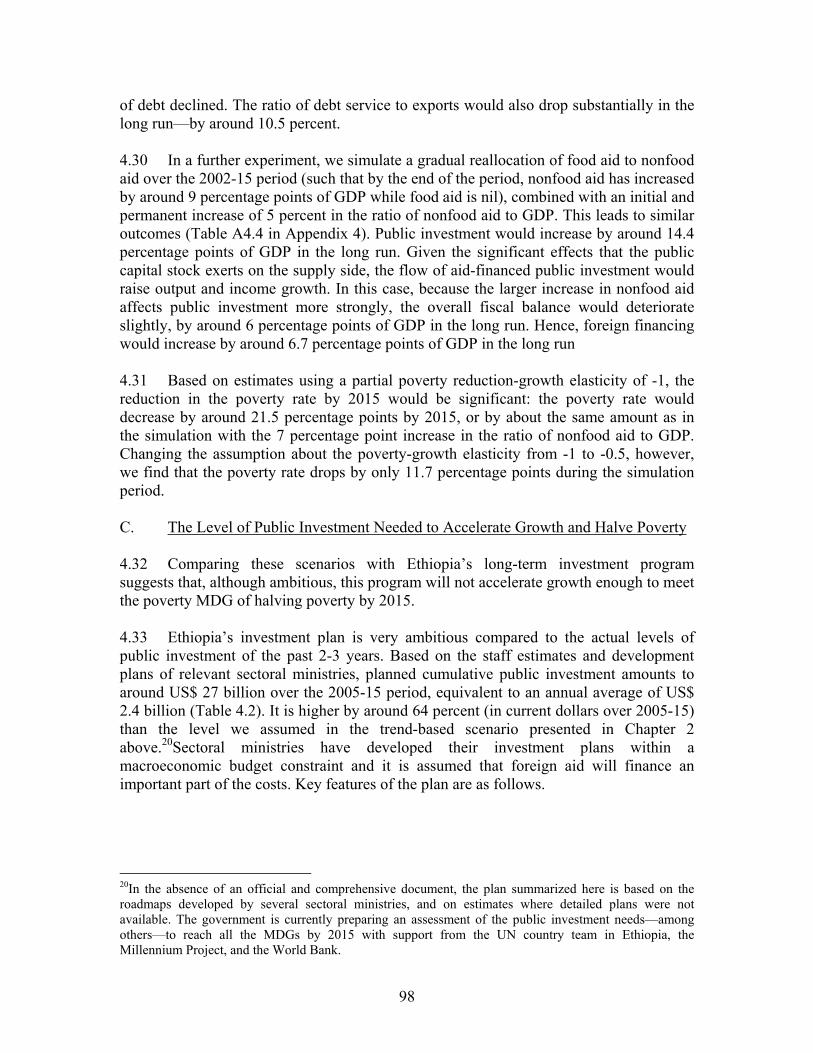
of debt declined. The ratio of debt service to exports would also drop substantially in the long run—by around 10.5 percent. 4.30 In a further experiment, we simulate a gradual reallocation of food aid to nonfood aid over the 2002-15 period (such that by the end of the period, nonfood aid has increased by around 9 percentage points of GDP while food aid is nil), combined with an initial and permanent increase of 5 percent in the ratio of nonfood aid to GDP. This leads to similar outcomes (Table A4.4 in Appendix 4). Public investment would increase by around 14.4 percentage points of GDP in the long run. Given the significant effects that the public capital stock exerts on the supply side, the flow of aid-financed public investment would raise output and income growth. In this case, because the larger increase in nonfood aid affects public investment more strongly, the overall fiscal balance would deteriorate slightly, by around 6 percentage points of GDP in the long run. Hence, foreign financing would increase by around 6.7 percentage points of GDP in the long run 4.31 Based on estimates using a partial poverty reduction-growth elasticity of -1, the reduction in the poverty rate by 2015 would be significant: the poverty rate would decrease by around 21.5 percentage points by 2015, or by about the same amount as in the simulation with the 7 percentage point increase in the ratio of nonfood aid to GDP. Changing the assumption about the poverty-growth elasticity from -1 to -0.5, however, we find that the poverty rate drops by only 11.7 percentage points during the simulation period. C. The Level of Public Investment Needed to Accelerate Growth and Halve Poverty 4.32 Comparing these scenarios with Ethiopia’s long-term investment program suggests that, although ambitious, this program will not accelerate growth enough to meet the poverty MDG of halving poverty by 2015. 4.33 Ethiopia’s investment plan is very ambitious compared to the actual levels of public investment of the past 2-3 years. Based on the staff estimates and development plans of relevant sectoral ministries, planned cumulative public investment amounts to around US$ 27 billion over the 2005-15 period, equivalent to an annual average of US$ 2.4 billion (Table 4.2). It is higher by around 64 percent (in current dollars over 2005-15) than the level we assumed in the trend-based scenario presented in Chapter 2 above.20Sectoral ministries have developed their investment plans within a macroeconomic budget constraint and it is assumed that foreign aid will finance an important part of the costs. Key features of the plan are as follows.
20In the absence of an official and comprehensive document, the plan summarized here is based on the roadmaps developed by several sectoral ministries, and on estimates where detailed plans were not available. The government is currently preparing an assessment of the public investment needs—among others—to reach all the MDGs by 2015 with support from the UN country team in Ethiopia, the Millennium Project, and the World Bank.
98
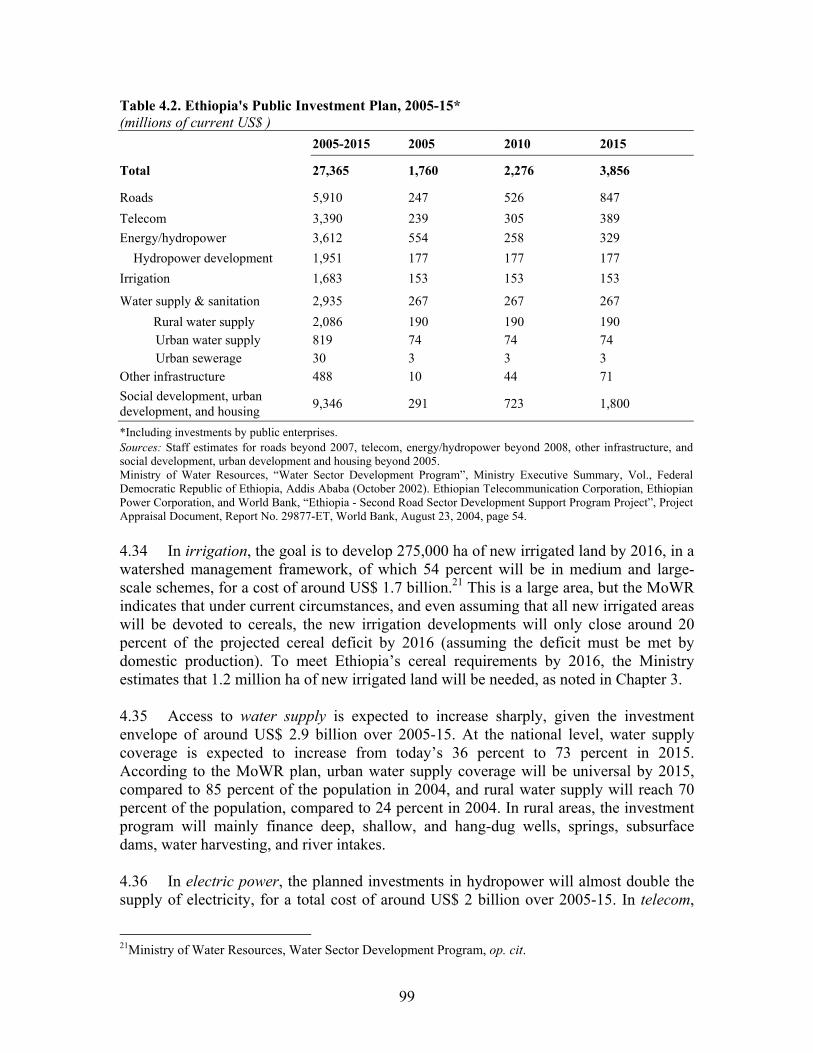
Table 4.2. Ethiopia's Public Investment Plan, 2005-15* (millions of current US$ ) 2005-2015 2005 2010 2015
Total 27,365 1,760 2,276 3,856
Roads 5,910 247 526 847 Telecom 3,390 239 305 389 Energy/hydropower 3,612 554 258 329
Hydropower development 1,951 177 177 177 Irrigation 1,683 153 153 153
Water supply & sanitation 2,935 267 267 267 Rural water supply 2,086 190 190 190
Urban water supply 819 74 74 74 Urban sewerage 30 3 3 3
Other infrastructure 488 10 44 71 Social development, urban development, and housing 9,346 291 723 1,800
*Including investments by public enterprises. Sources: Staff estimates for roads beyond 2007, telecom, energy/hydropower beyond 2008, other infrastructure, and social development, urban development and housing beyond 2005. Ministry of Water Resources, “Water Sector Development Program”, Ministry Executive Summary, Vol., Federal Democratic Republic of Ethiopia, Addis Ababa (October 2002). Ethiopian Telecommunication Corporation, Ethiopian Power Corporation, and World Bank, “Ethiopia - Second Road Sector Development Support Program Project”, Project Appraisal Document, Report No. 29877-ET, World Bank, August 23, 2004, page 54. 4.34 In irrigation, the goal is to develop 275,000 ha of new irrigated land by 2016, in a watershed management framework, of which 54 percent will be in medium and large-scale schemes, for a cost of around US$ 1.7 billion.21 This is a large area, but the MoWR indicates that under current circumstances, and even assuming that all new irrigated areas will be devoted to cereals, the new irrigation developments will only close around 20 percent of the projected cereal deficit by 2016 (assuming the deficit must be met by domestic production). To meet Ethiopia’s cereal requirements by 2016, the Ministry estimates that 1.2 million ha of new irrigated land will be needed, as noted in Chapter 3. 4.35 Access to water supply is expected to increase sharply, given the investment envelope of around US$ 2.9 billion over 2005-15. At the national level, water supply coverage is expected to increase from today’s 36 percent to 73 percent in 2015. According to the MoWR plan, urban water supply coverage will be universal by 2015, compared to 85 percent of the population in 2004, and rural water supply will reach 70 percent of the population, compared to 24 percent in 2004. In rural areas, the investment program will mainly finance deep, shallow, and hang-dug wells, springs, subsurface dams, water harvesting, and river intakes. 4.36 In electric power, the planned investments in hydropower will almost double the supply of electricity, for a total cost of around US$ 2 billion over 2005-15. In telecom,
21Ministry of Water Resources, Water Sector Development Program, op. cit.
99

the public monopoly is expected to continue an intense investment program of around US$ 300 million a year over 2005-15. And road construction will continue to progress with investments averaging US$ 500 million during the next ten years. 4.37 Even though much more ambitious than current levels, Ethiopia’s planned long-term investment program will not increase growth sufficiently for the country to halve poverty by 2015. To significantly accelerate growth and halve poverty between 2002 and 2015, our analysis indicates that public investment—financed from both domestic and external sources—will have to be roughly 50 percent higher in current dollars (around $42 billion) than it is in Ethiopia’s plan. This is equivalent to an average level of investment of 25 percent of GDP over 2005-15, compared to around 20 percent of (the same) GDP in Ethiopia’s currently planned long-term investment program. 3. Foreign Aid, Absorptive Capacity, and Alignment of Aid with
Government Policy 4.38 The above analysis concludes that foreign aid is likely to be very effective in putting Ethiopia on a sustainable growth path. The results also show that, thus far, Ethiopia’s absorptive capacity has been adequate. Other studies corroborate these results. Though Collier and Dollar (2002) have shown that in some countries receiving extremely large amounts of aid the estimated marginal productivity of aid is negative, in Ethiopia the estimated marginal impact of aid is high, reflecting a high level of poverty, reasonably good policies, and a modest amount of aid per capita in 1996. In Ethiopia, according to those authors, the one-off cost of lifting a person out of poverty is about US$ 600.22 4.39 We have found that a permanent increase of 7 percentage points in nonfood aid as a share of GDP could significantly increase growth and cut the incidence of poverty in half (assuming a growth-poverty reduction elasticity of -1). 4.40 This would entail a sizeable absolute increase in foreign aid (Figure 4.7). In dollars, the needed increase is equivalent to multiplying the current level of ODA—around US$ 1.3 billion—by around 3 at the 2015 horizon—amounting to US$ 3.9 billion. In per capita terms, this would mean a progressive increase in total ODA from the current US$ 19.4 to around US$ 39 in 2015. With faster economic growth, however, ODA as a percentage of GDP would increase slightly to around 24 percent throughout the 2002-15 period.23 The scenario also involves an important substitution between loans and grants, with the proportion of loans in total ODA flows decreasing from 46 percent in 2002 to
22Collier, Paul, and David Dollar (2002): “Aid Allocation and Poverty Reduction”, European Economic Review 46: 1475-1500. 23In 2002, total ODA was equivalent to 21.6 percent of GDP. Nonfood aid, food aid, and loans were respectively equivalent to 7.3, 4.4, and 9.9 percent of GDP.
100
4.41 around 23-22 percent from 2003 onward. 4.42 Additional elements indicating that Ethiopia could manage higher levels of aid are, first, the stable macroeconomic situation—low inflation and prudent exchange rate management have avoided overvaluation and put the country in a strong initial position—and second, the very low level of asset accumulation. Considering the significant deficits in human development and basic infrastructure in Ethiopia, increased aid will lead to productivity improvements in both tradable and non-tradable production.
10
30
Figure 4.7. ODA Indicators: Effects of a Permanent Increase of 7 Percentage Points in Nonfood Aid-GDP Ratio
ODA Indicators: Permanent Increase of 7 Percentage Point in Nonfood Aid-GDP Ratio
15
20
25
35
40
45
2002
2003
2004
2005
2006
2007
2008
2009
2010
2011
2012
2013
2014
2015
0
500
1,000
1,500
2,000
2,500
3,000
3,500
4,000
Total ODA in $ per Capita Total ODA in % of GDPTotal ODA in $bn. (right axis)
4.43 A sudden large increase in aid may still create severe absorption problems, however. Such constraints can arise from limited administrative capacity, weaknesses in public expenditure and financial management, or deficiencies in governance. Ethiopia’s public sector has relatively strong capacity by regional standards, but it needs a continued focus on reforms to increase its ability to absorb aid. 4.44 The government’s current focus on decentralization and on administrative capacity building is of central importance here.24 The state transformation process, which involves the transfer of significant proportions of spending and responsibilities to the woreda level, is expected to further enhance public management. Important components of the transformation process include a movement away from control to planning and management, institutionalization of budgeting processes, and strengthening of intergovernmental fiscal management and reporting systems. The comprehensive Public Sector Capacity Building Program (PSCAP) was launched in 2003 to support state transformation at the federal, regional, and local levels through demand-driven and judiciously sequenced reforms, systems development, and training. PSCAP will provide technical assistance, training, and logistical support for civil service reform, improving the capacity and motivation of civil servants, and enhancing expenditure management, woreda decentralization, municipal development, justice reform, and revenue enhancement. 24See “Public Sector Capacity Building Program Support Project”, Project Appraisal Document, the World Bank (March 25, 2004) for a detailed description of the World Bank-supported reform program in this area.
101
4.45 An efficient budgetary system, too, will be key to absorbing increased aid flows. In this area, Ethiopia has been gradually implementing a coherent and focused reform to improve its financial management system at the regional level, and to support the recent devolution to the woreda level. A transaction platform to improve efficiency and control of money flows is being implemented in selected regions, and will be scaled up and rolled out across the country in coming years. Systems are being developed for accountability, performance management, and multi-year expenditure planning. 4.46 The SDPRP, Ethiopia’s poverty reduction strategy paper, has been instrumental in aligning donor support with government policy and strategy. During its preparation, donors contributed to the analytical work and policy dialogue. In the recent Consultative Group meeting, the donor group committed itself to increase its support to the SDPRP, pledging a total of US$ 3.2 billion. Since then, the process of coordination among donors under the auspices of the DAG (in-country Donor Assistance Group) has improved markedly. An effort is underway to align donor support with the existing financial planning, budgeting, and reporting system. Ethiopia is a pilot country for enhanced donor harmonization, and some good progress has been achieved. In particular, most of the donors have initiated budget support operations in order to support the SDPRP. Budget support saves scarce capacity, enhances the policy dialogue, and can markedly reduce the transaction costs associated with ODA. 4.47 As aid inflows increase, Ethiopia’s budgets and investment programs will need to be increasingly driven by policies. Increased aid-funded levels of public investment should be linked to the overall objective of rebalancing the current growth strategy. Block grants to towns could contribute to this objective. It will become necessary to provide specific fiscal instruments to transfer funding to local authorities, allocating the funds according to local potential for growth, consistent with the overall growth strategy. Also, the creation of administrative pooling arrangements to carry out large-scale investments across regions, with the participation of the private sector, and consonant with the federal role, will be critical. 4. Conclusion 4.48 Increased foreign assistance could be very effective in Ethiopia because the country has a reasonably good policy framework, is affected by widespread poverty, and has a very low level of asset accumulation. A permanent increase of 7 percentage points in nonfood aid as a share of GDP could significantly accelerate growth, putting Ethiopia on a sustainable growth path and cutting consumption poverty by half.25 To halve poverty by 2015, GDP growth rates per capita in the range of 3.5-4 percent per annum are required.
25This assumes a poverty-growth elasticity of -1. Whether a significant long-run reduction in poverty can be achieved depends not only on the country’s growth performance but also on the evolution of income distribution. In the most adverse case—a poverty-growth elasticity of -0.5—the proportion of population in poverty would decrease by 10.6 percentage points by 2015.
102
4.49 A permanent increase in the nonfood aid-GDP ratio by 7 percentage points is sizeable. It is equivalent to multiplying the current level of ODA—$1.3 billion—by around 3 at the 2015 horizon—amounting to US$ 3.9 billion in 2015. In per capita terms, this would mean a progressive increase in total ODA from the current US$ 19.4 to around US$ 39 in 2015, which is high relative to a Sub-Saharan average of US$ 27 in 2002, but less than what Mozambique and Mali have received. 4.50 While thus far there are no signs of diminishing returns to aid, Ethiopia and its development partners need to continue focusing on reforms that can further increase absorptive capacity. In this respect the current focus on decentralization, and on administrative capacity building, is of central importance.
103

APPENDIX 4. SIMULATION TABLES
133
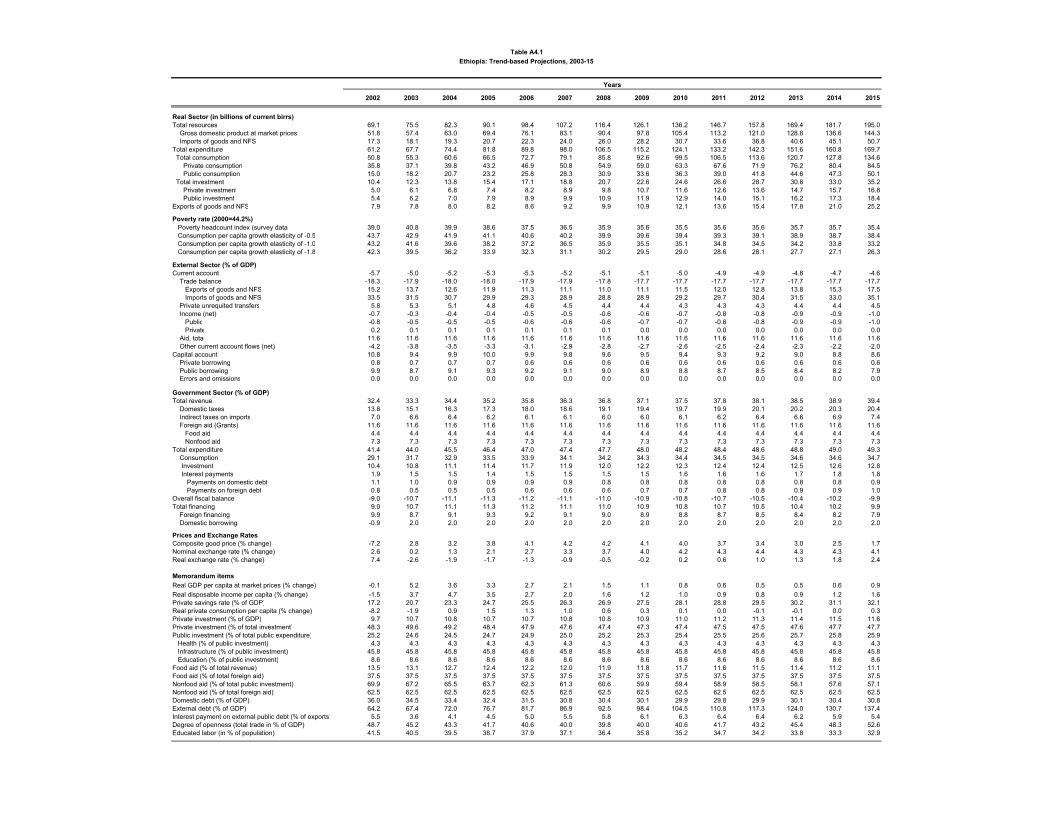
2002 2003 2004 2005 2006 2007 2008 2009 2010 2011 2012 2013 2014 2015
Real Sector (in billions of current birrs)Total resources 69.1 75.5 82.3 90.1 98.4 107.2 116.4 126.1 136.2 146.7 157.8 169.4 181.7 195.0 Gross domestic product at market prices 51.8 57.4 63.0 69.4 76.1 83.1 90.4 97.8 105.4 113.2 121.0 128.8 136.6 144.3 Imports of goods and NFS 17.3 18.1 19.3 20.7 22.3 24.0 26.0 28.2 30.7 33.6 36.8 40.6 45.1 50.7Total expenditure 61.2 67.7 74.4 81.8 89.8 98.0 106.5 115.2 124.1 133.2 142.3 151.6 160.8 169.7 Total consumption 50.8 55.3 60.6 66.5 72.7 79.1 85.8 92.6 99.5 106.5 113.6 120.7 127.8 134.6 Private consumption 35.8 37.1 39.8 43.2 46.9 50.8 54.9 59.0 63.3 67.6 71.9 76.2 80.4 84.5 Public consumption 15.0 18.2 20.7 23.2 25.8 28.3 30.9 33.6 36.3 39.0 41.8 44.6 47.3 50.1 Total investment 10.4 12.3 13.8 15.4 17.1 18.8 20.7 22.6 24.6 26.6 28.7 30.8 33.0 35.2 Private investment 5.0 6.1 6.8 7.4 8.2 8.9 9.8 10.7 11.6 12.6 13.6 14.7 15.7 16.8 Public investment 5.4 6.2 7.0 7.9 8.9 9.9 10.9 11.9 12.9 14.0 15.1 16.2 17.3 18.4Exports of goods and NFS 7.9 7.8 8.0 8.2 8.6 9.2 9.9 10.9 12.1 13.6 15.4 17.8 21.0 25.2
Poverty rate (2000=44.2%) Poverty headcount index (survey data) 39.0 40.8 39.9 38.6 37.5 36.5 35.9 35.6 35.5 35.6 35.6 35.7 35.7 35.4 Consumption per capita growth elasticity of -0.5 43.7 42.9 41.9 41.1 40.6 40.2 39.9 39.6 39.4 39.3 39.1 38.9 38.7 38.4 Consumption per capita growth elasticity of -1.0 43.2 41.6 39.6 38.2 37.2 36.5 35.9 35.5 35.1 34.8 34.5 34.2 33.8 33.2 Consumption per capita growth elasticity of -1.8 42.3 39.5 36.2 33.9 32.3 31.1 30.2 29.5 29.0 28.6 28.1 27.7 27.1 26.3
External Sector (% of GDP)Current account -5.7 -5.0 -5.2 -5.3 -5.3 -5.2 -5.1 -5.1 -5.0 -4.9 -4.9 -4.8 -4.7 -4.6 Trade balance -18.3 -17.9 -18.0 -18.0 -17.9 -17.9 -17.8 -17.7 -17.7 -17.7 -17.7 -17.7 -17.7 -17.7 Exports of goods and NFS 15.2 13.7 12.6 11.9 11.3 11.1 11.0 11.1 11.5 12.0 12.8 13.8 15.3 17.5 Imports of goods and NFS 33.5 31.5 30.7 29.9 29.3 28.9 28.8 28.9 29.2 29.7 30.4 31.5 33.0 35.1 Private unrequited transfers 5.8 5.3 5.1 4.8 4.6 4.5 4.4 4.4 4.3 4.3 4.3 4.4 4.4 4.5 Income (net) -0.7 -0.3 -0.4 -0.4 -0.5 -0.5 -0.6 -0.6 -0.7 -0.8 -0.8 -0.9 -0.9 -1.0 Public -0.8 -0.5 -0.5 -0.5 -0.6 -0.6 -0.6 -0.7 -0.7 -0.8 -0.8 -0.9 -0.9 -1.0 Private 0.2 0.1 0.1 0.1 0.1 0.1 0.1 0.0 0.0 0.0 0.0 0.0 0.0 0.0 Aid, total 11.6 11.6 11.6 11.6 11.6 11.6 11.6 11.6 11.6 11.6 11.6 11.6 11.6 11.6 Other current account flows (net) -4.2 -3.8 -3.5 -3.3 -3.1 -2.9 -2.8 -2.7 -2.6 -2.5 -2.4 -2.3 -2.2 -2.0Capital account 10.8 9.4 9.9 10.0 9.9 9.8 9.6 9.5 9.4 9.3 9.2 9.0 8.8 8.6 Private borrowing 0.8 0.7 0.7 0.7 0.6 0.6 0.6 0.6 0.6 0.6 0.6 0.6 0.6 0.6 Public borrowing 9.9 8.7 9.1 9.3 9.2 9.1 9.0 8.9 8.8 8.7 8.5 8.4 8.2 7.9 Errors and omissions 0.0 0.0 0.0 0.0 0.0 0.0 0.0 0.0 0.0 0.0 0.0 0.0 0.0 0.0
Government Sector (% of GDP)Total revenue 32.4 33.3 34.4 35.2 35.8 36.3 36.8 37.1 37.5 37.8 38.1 38.5 38.9 39.4 Domestic taxes 13.8 15.1 16.3 17.3 18.0 18.6 19.1 19.4 19.7 19.9 20.1 20.2 20.3 20.4 Indirect taxes on imports 7.0 6.6 6.4 6.2 6.1 6.1 6.0 6.0 6.1 6.2 6.4 6.6 6.9 7.4 Foreign aid (Grants) 11.6 11.6 11.6 11.6 11.6 11.6 11.6 11.6 11.6 11.6 11.6 11.6 11.6 11.6 Food aid 4.4 4.4 4.4 4.4 4.4 4.4 4.4 4.4 4.4 4.4 4.4 4.4 4.4 4.4 Nonfood aid 7.3 7.3 7.3 7.3 7.3 7.3 7.3 7.3 7.3 7.3 7.3 7.3 7.3 7.3Total expenditure 41.4 44.0 45.5 46.4 47.0 47.4 47.7 48.0 48.2 48.4 48.6 48.8 49.0 49.3 Consumption 29.1 31.7 32.9 33.5 33.9 34.1 34.2 34.3 34.4 34.5 34.5 34.6 34.6 34.7 Investment 10.4 10.8 11.1 11.4 11.7 11.9 12.0 12.2 12.3 12.4 12.4 12.5 12.6 12.8 Interest payments 1.9 1.5 1.5 1.4 1.5 1.5 1.5 1.5 1.6 1.6 1.6 1.7 1.8 1.8 Payments on domestic debt 1.1 1.0 0.9 0.9 0.9 0.9 0.8 0.8 0.8 0.8 0.8 0.8 0.8 0.9 Payments on foreign debt 0.8 0.5 0.5 0.5 0.6 0.6 0.6 0.7 0.7 0.8 0.8 0.9 0.9 1.0Overall fiscal balance -9.0 -10.7 -11.1 -11.3 -11.2 -11.1 -11.0 -10.9 -10.8 -10.7 -10.5 -10.4 -10.2 -9.9Total financing 9.0 10.7 11.1 11.3 11.2 11.1 11.0 10.9 10.8 10.7 10.5 10.4 10.2 9.9 Foreign financing 9.9 8.7 9.1 9.3 9.2 9.1 9.0 8.9 8.8 8.7 8.5 8.4 8.2 7.9 Domestic borrowing -0.9 2.0 2.0 2.0 2.0 2.0 2.0 2.0 2.0 2.0 2.0 2.0 2.0 2.0
Prices and Exchange RatesComposite good price (% change) -7.2 2.8 3.2 3.8 4.1 4.2 4.2 4.1 4.0 3.7 3.4 3.0 2.5 1.7Nominal exchange rate (% change) 2.6 0.2 1.3 2.1 2.7 3.3 3.7 4.0 4.2 4.3 4.4 4.3 4.3 4.1Real exchange rate (% change) 7.4 -2.6 -1.9 -1.7 -1.3 -0.9 -0.5 -0.2 0.2 0.6 1.0 1.3 1.8 2.4
Memorandum itemsReal GDP per capita at market prices (% change) -0.1 5.2 3.6 3.3 2.7 2.1 1.5 1.1 0.8 0.6 0.5 0.5 0.6 0.9Real disposable income per capita (% change) -1.5 3.7 4.7 3.5 2.7 2.0 1.6 1.2 1.0 0.9 0.8 0.9 1.2 1.6Private savings rate (% of GDP) 17.2 20.7 23.3 24.7 25.5 26.3 26.9 27.5 28.1 28.8 29.5 30.2 31.1 32.1Real private consumption per capita (% change) -8.2 -1.9 0.9 1.5 1.3 1.0 0.6 0.3 0.1 0.0 -0.1 -0.1 0.0 0.3Private investment (% of GDP) 9.7 10.7 10.8 10.7 10.7 10.8 10.8 10.9 11.0 11.2 11.3 11.4 11.5 11.6Private investment (% of total investment) 48.3 49.6 49.2 48.4 47.9 47.6 47.4 47.3 47.4 47.5 47.5 47.6 47.7 47.7Public investment (% of total public expenditure) 25.2 24.6 24.5 24.7 24.9 25.0 25.2 25.3 25.4 25.5 25.6 25.7 25.8 25.9 Health (% of public investment) 4.3 4.3 4.3 4.3 4.3 4.3 4.3 4.3 4.3 4.3 4.3 4.3 4.3 4.3 Infrastructure (% of public investment) 45.8 45.8 45.8 45.8 45.8 45.8 45.8 45.8 45.8 45.8 45.8 45.8 45.8 45.8 Education (% of public investment) 8.6 8.6 8.6 8.6 8.6 8.6 8.6 8.6 8.6 8.6 8.6 8.6 8.6 8.6Food aid (% of total revenue) 13.5 13.1 12.7 12.4 12.2 12.0 11.9 11.8 11.7 11.6 11.5 11.4 11.2 11.1Food aid (% of total foreign aid) 37.5 37.5 37.5 37.5 37.5 37.5 37.5 37.5 37.5 37.5 37.5 37.5 37.5 37.5Nonfood aid (% of total public investment) 69.9 67.2 65.5 63.7 62.3 61.3 60.6 59.9 59.4 58.9 58.5 58.1 57.6 57.1Nonfood aid (% of total foreign aid) 62.5 62.5 62.5 62.5 62.5 62.5 62.5 62.5 62.5 62.5 62.5 62.5 62.5 62.5Domestic debt (% of GDP) 36.0 34.5 33.4 32.4 31.5 30.8 30.4 30.1 29.9 29.8 29.9 30.1 30.4 30.8External debt (% of GDP) 64.2 67.4 72.0 76.7 81.7 86.9 92.5 98.4 104.5 110.8 117.3 124.0 130.7 137.4Interest payment on external public debt (% of exports) 5.5 3.6 4.1 4.5 5.0 5.5 5.8 6.1 6.3 6.4 6.4 6.2 5.9 5.4Degree of openness (total trade in % of GDP) 48.7 45.2 43.3 41.7 40.6 40.0 39.8 40.0 40.6 41.7 43.2 45.4 48.3 52.6Educated labor (in % of population) 41.5 40.5 39.5 38.7 37.9 37.1 36.4 35.8 35.2 34.7 34.2 33.8 33.3 32.9
Years
Table A4.1Ethiopia: Trend-based Projections, 2003-15

2002 2003 2004 2005 2006 2007 2008 2009 2010 2011 2012 2013 2014 2015
Real SectorTotal resources 0.00 0.43 0.68 0.84 1.02 1.21 1.44 1.69 1.96 2.24 2.54 2.87 3.17 3.45 Gross domestic product at market prices 0.00 -0.32 -0.32 -0.32 -0.26 -0.14 0.04 0.27 0.52 0.79 1.09 1.42 1.72 2.00 Imports of goods and NFS 0.00 3.01 4.42 5.65 6.75 7.69 8.47 9.14 9.74 10.23 10.63 11.02 11.40 11.73Total expenditure 0.00 0.31 0.41 0.45 0.55 0.70 0.89 1.13 1.40 1.68 2.00 2.31 2.62 2.93 Total consumption 0.00 -0.26 -0.32 -0.34 -0.30 -0.19 -0.02 0.19 0.43 0.70 0.99 1.28 1.57 1.86 Private consumption 0.00 -0.23 -0.35 -0.40 -0.36 -0.26 -0.09 0.12 0.35 0.62 0.90 1.18 1.46 1.74 Public consumption 0.00 -0.32 -0.25 -0.25 -0.19 -0.08 0.08 0.30 0.54 0.81 1.11 1.43 1.72 2.02 Total investment 0.00 2.87 3.33 3.49 3.65 3.82 4.04 4.29 4.57 4.87 5.20 5.54 5.88 6.22 Private investment 0.00 -0.33 -0.22 -0.05 0.17 0.43 0.72 1.07 1.43 1.82 2.24 2.68 3.11 3.53 Public investment 0.00 6.00 6.48 6.38 6.37 6.43 6.56 6.76 7.00 7.27 7.57 7.88 8.17 8.50Exports of goods and NFS 0.00 1.54 3.67 6.09 8.67 11.24 13.71 15.97 17.87 19.58 21.13 22.36 23.21 23.95
Poverty rate1 (2000=44.2%) Poverty headcount index (survey data) 0.00 -0.13 -0.34 -0.72 -1.15 -1.79 -1.93 -2.32 -2.86 -3.12 -3.15 -3.40 -3.65 -3.65 Consumption per capita growth elasticity of -0.5 0.00 -0.05 -0.13 -0.25 -0.38 -0.52 -0.64 -0.75 -0.84 -0.93 -0.99 -1.05 -1.09 -1.12 Consumption per capita growth elasticity of -1.0 0.00 -0.09 -0.27 -0.50 -0.77 -1.03 -1.28 -1.51 -1.70 -1.87 -2.01 -2.13 -2.23 -2.31 Consumption per capita growth elasticity of -1.8 0.00 -0.16 -0.48 -0.90 -1.37 -1.85 -2.31 -2.72 -3.08 -3.41 -3.69 -3.94 -4.15 -4.34
External Sector (% of GDP)1
Current account 0.00 0.26 0.17 0.12 0.09 0.07 0.05 0.04 0.02 0.01 0.02 0.02 0.02 0.01 Trade balance 0.00 -0.74 -0.84 -0.90 -0.93 -0.96 -0.98 -0.99 -1.01 -1.02 -1.02 -1.01 -1.02 -1.02 Exports of goods and NFS 0.00 0.24 0.42 0.56 0.64 0.68 0.69 0.70 0.69 0.68 0.67 0.67 0.66 0.65 Imports of goods and NFS 0.00 0.98 1.26 1.45 1.57 1.64 1.67 1.69 1.70 1.70 1.69 1.68 1.68 1.68 Private unrequited transfers 0.00 0.02 0.03 0.04 0.04 0.05 0.05 0.05 0.06 0.06 0.06 0.06 0.06 0.06 Income (net) 0.00 0.00 0.00 0.00 0.00 0.00 0.00 0.00 0.00 0.00 0.00 0.00 0.00 0.00 Public 0.00 0.00 0.00 0.00 0.00 0.00 0.00 0.00 0.00 0.00 0.00 0.00 0.00 0.00 Private 0.00 0.00 0.00 0.00 0.00 0.00 0.00 0.00 0.00 0.00 0.00 0.00 0.00 0.00 Aid, total 0.00 1.00 1.00 1.00 1.00 1.00 1.00 1.00 1.00 1.00 1.00 1.00 1.00 1.00 Other current account flows (net) 0.00 -0.02 -0.02 -0.02 -0.02 -0.02 -0.02 -0.02 -0.02 -0.03 -0.03 -0.03 -0.02 -0.02Capital account 0.00 -0.48 -0.32 -0.23 -0.17 -0.13 -0.10 -0.07 -0.04 -0.03 -0.04 -0.04 -0.03 -0.03 Private borrowing 0.00 0.00 0.00 0.01 0.01 0.01 0.01 0.01 0.01 0.01 0.01 0.01 0.01 0.01 Public borrowing 0.00 -0.49 -0.32 -0.24 -0.18 -0.13 -0.10 -0.08 -0.05 -0.04 -0.05 -0.05 -0.04 -0.03 Errors and omissions 0.00 0.00 0.00 0.00 0.00 0.00 0.00 0.00 0.00 0.00 0.00 0.00 0.00 0.00
Government Sector (% of GDP)1
Total revenue 0.00 1.18 1.17 1.15 1.12 1.10 1.07 1.05 1.04 1.03 1.02 1.00 1.00 1.01 Domestic taxes 0.00 -0.02 -0.09 -0.16 -0.21 -0.25 -0.28 -0.30 -0.32 -0.32 -0.33 -0.35 -0.35 -0.34 Indirect taxes on imports 0.00 0.21 0.26 0.30 0.33 0.34 0.35 0.35 0.36 0.36 0.35 0.35 0.35 0.35 Foreign aid (Grants) 0.00 1.00 1.00 1.00 1.00 1.00 1.00 1.00 1.00 1.00 1.00 1.00 1.00 1.00 Food aid 0.00 0.37 0.37 0.37 0.37 0.37 0.37 0.37 0.38 0.38 0.37 0.37 0.37 0.37 Nonfood aid 0.00 0.63 0.63 0.63 0.63 0.63 0.63 0.63 0.63 0.63 0.63 0.63 0.63 0.63Total expenditure 0.00 0.69 0.85 0.91 0.95 0.96 0.97 0.97 0.97 0.97 0.97 0.96 0.96 0.97 Consumption 0.00 0.00 0.02 0.03 0.02 0.02 0.02 0.01 0.01 0.01 0.01 0.00 0.00 0.01 Investment 0.00 0.69 0.83 0.89 0.92 0.94 0.96 0.96 0.97 0.97 0.97 0.97 0.97 0.97 Interest payments 0.00 0.01 0.00 0.00 0.00 0.00 0.00 0.00 -0.01 -0.01 -0.01 -0.01 -0.01 -0.01 Payments on domestic debt 0.00 0.00 0.00 0.00 0.00 0.00 0.00 0.00 0.00 0.00 -0.01 -0.01 -0.01 -0.01 Payments on foreign debt 0.00 0.00 0.00 0.00 0.00 0.00 0.00 0.00 0.00 0.00 0.00 0.00 0.00 0.00Overall fiscal balance 0.00 0.49 0.32 0.24 0.18 0.13 0.10 0.08 0.05 0.04 0.05 0.05 0.04 0.03Total financing 0.00 -0.49 -0.32 -0.24 -0.18 -0.13 -0.10 -0.08 -0.05 -0.04 -0.05 -0.05 -0.04 -0.03 Foreign financing 0.00 -0.49 -0.32 -0.24 -0.18 -0.13 -0.10 -0.08 -0.05 -0.04 -0.05 -0.05 -0.04 -0.03 Domestic borrowing 0.00 0.00 0.00 0.00 0.00 0.00 0.00 0.00 0.00 0.00 0.00 0.00 0.00 0.00
Prices and Exchange Rates1
Composite good price (% change) 0.00 -0.34 -0.36 -0.40 -0.39 -0.34 -0.27 -0.18 -0.10 -0.03 0.04 0.09 0.13 0.16Nominal exchange rate (% change) 0.00 0.13 0.15 0.19 0.24 0.29 0.33 0.36 0.35 0.36 0.35 0.30 0.28 0.29Real exchange rate (% change) 0.00 0.47 0.51 0.59 0.63 0.63 0.60 0.54 0.45 0.39 0.31 0.21 0.14 0.13
Memorandum items1
Real GDP per capita at market prices (% change) 0.00 -0.02 0.37 0.40 0.46 0.48 0.47 0.43 0.38 0.32 0.28 0.26 0.18 0.14Real disposable income per capita (% change) 0.00 0.21 0.40 0.54 0.60 0.60 0.56 0.49 0.41 0.35 0.29 0.22 0.16 0.13Private savings rate (% of GDP) 0.00 0.11 0.22 0.36 0.49 0.60 0.69 0.76 0.80 0.84 0.87 0.88 0.89 0.89Real private consumption per capita (% change) 0.00 0.10 0.22 0.33 0.40 0.42 0.42 0.38 0.33 0.29 0.24 0.18 0.15 0.13Private investment (% of GDP) 0.00 0.00 0.01 0.03 0.05 0.06 0.08 0.09 0.11 0.12 0.14 0.15 0.17 0.19Private investment (% of total investment) 0.00 -1.54 -1.61 -1.54 -1.47 -1.42 -1.38 -1.34 -1.31 -1.28 -1.25 -1.22 -1.18 -1.16Public investment (% of total public expenditure) 0.00 1.16 1.27 1.29 1.29 1.30 1.30 1.30 1.30 1.30 1.30 1.29 1.29 1.29 Health (% of public investment) 0.00 0.00 0.00 0.00 0.00 0.00 0.00 0.00 0.00 0.00 0.00 0.00 0.00 0.00 Infrastructure (% of public investment) 0.00 0.00 0.00 0.00 0.00 0.00 0.00 0.00 0.00 0.00 0.00 0.00 0.00 0.00 Education (% of public investment) 0.00 0.00 0.00 0.00 0.00 0.00 0.00 0.00 0.00 0.00 0.00 0.00 0.00 0.00Food aid (% of total revenue) 0.00 0.62 0.60 0.59 0.58 0.58 0.57 0.57 0.57 0.57 0.57 0.58 0.58 0.57Food aid (% of total foreign aid) 0.00 0.00 0.00 0.00 0.00 0.00 0.00 0.00 0.00 0.00 0.00 0.00 0.00 0.00Nonfood aid (% of total public investment) 0.00 1.42 0.99 0.96 0.95 0.96 0.96 0.97 0.98 0.98 0.98 1.00 1.01 0.99Nonfood aid (% of total foreign aid) 0.00 0.00 0.00 0.00 0.00 0.00 0.00 0.00 0.00 0.00 0.00 0.00 0.00 0.00Domestic debt (% of GDP) 0.00 0.11 0.09 0.08 0.06 0.02 -0.02 -0.07 -0.12 -0.16 -0.21 -0.26 -0.30 -0.33External debt (% of GDP) 0.00 -0.22 -0.44 -0.51 -0.54 -0.53 -0.50 -0.48 -0.45 -0.41 -0.40 -0.46 -0.50 -0.51Interest payments on external public debt (% of exports) 0.00 -0.05 -0.18 -0.35 -0.58 -0.85 -1.15 -1.47 -1.79 -2.10 -2.40 -2.68 -2.90 -3.10Degree of openness (total trade in % of GDP) 0.00 1.22 1.68 2.01 2.21 2.32 2.37 2.38 2.39 2.38 2.36 2.34 2.34 2.33Educated labor (in % of population) 0.00 0.00 0.00 0.00 0.01 0.01 0.02 0.03 0.03 0.04 0.05 0.05 0.06 0.071 Absolute deviations from base line.
Years
Table A4.2Ethiopia: Simulation Results
1 Percentage Point Increase in Aid to GDP Ratio(Percentage deviations from baseline, unless otherwise indicated)
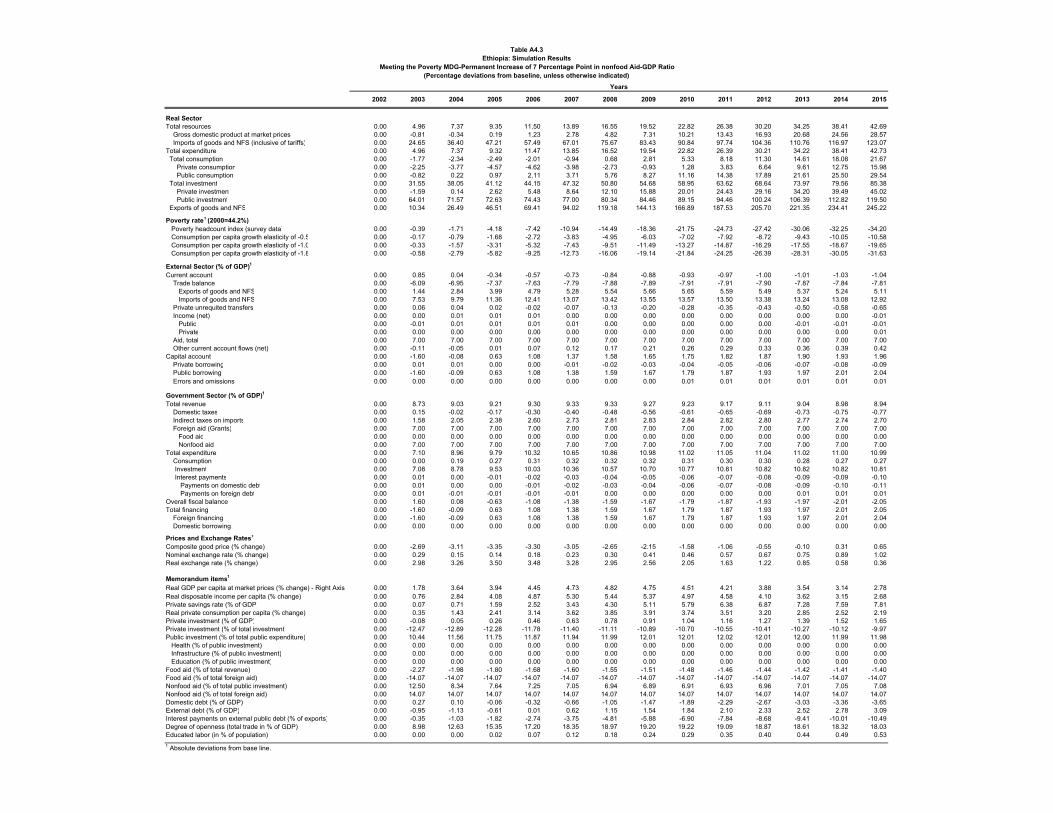
2002 2003 2004 2005 2006 2007 2008 2009 2010 2011 2012 2013 2014 2015
Real SectorTotal resources 0.00 4.96 7.37 9.35 11.50 13.89 16.55 19.52 22.82 26.38 30.20 34.25 38.41 42.69 Gross domestic product at market prices 0.00 -0.81 -0.34 0.19 1.23 2.78 4.82 7.31 10.21 13.43 16.93 20.68 24.56 28.57 Imports of goods and NFS (inclusive of tariffs) 0.00 24.65 36.40 47.21 57.49 67.01 75.67 83.43 90.84 97.74 104.36 110.76 116.97 123.07Total expenditure 0.00 4.96 7.37 9.32 11.47 13.85 16.52 19.54 22.82 26.39 30.21 34.22 38.41 42.73 Total consumption 0.00 -1.77 -2.34 -2.49 -2.01 -0.94 0.68 2.81 5.33 8.18 11.30 14.61 18.08 21.67 Private consumption 0.00 -2.25 -3.77 -4.57 -4.62 -3.98 -2.73 -0.93 1.28 3.83 6.64 9.61 12.75 15.98 Public consumption 0.00 -0.82 0.22 0.97 2.11 3.71 5.76 8.27 11.16 14.38 17.89 21.61 25.50 29.54 Total investment 0.00 31.55 38.05 41.12 44.15 47.32 50.80 54.68 58.95 63.62 68.64 73.97 79.56 85.38 Private investment 0.00 -1.59 0.14 2.62 5.48 8.64 12.10 15.88 20.01 24.43 29.16 34.20 39.49 45.02 Public investment 0.00 64.01 71.57 72.63 74.43 77.00 80.34 84.46 89.15 94.46 100.24 106.39 112.82 119.50 Exports of goods and NFS 0.00 10.34 26.49 46.51 69.41 94.02 119.18 144.13 166.89 187.53 205.70 221.35 234.41 245.22
Poverty rate1 (2000=44.2%) Poverty headcount index (survey data) 0.00 -0.39 -1.71 -4.18 -7.42 -10.94 -14.49 -18.36 -21.75 -24.73 -27.42 -30.06 -32.25 -34.20 Consumption per capita growth elasticity of -0.5 0.00 -0.17 -0.79 -1.68 -2.72 -3.83 -4.95 -6.03 -7.02 -7.92 -8.72 -9.43 -10.05 -10.58 Consumption per capita growth elasticity of -1.0 0.00 -0.33 -1.57 -3.31 -5.32 -7.43 -9.51 -11.49 -13.27 -14.87 -16.29 -17.55 -18.67 -19.65 Consumption per capita growth elasticity of -1.8 0.00 -0.58 -2.79 -5.82 -9.25 -12.73 -16.06 -19.14 -21.84 -24.25 -26.39 -28.31 -30.05 -31.63
External Sector (% of GDP)1
Current account 0.00 0.85 0.04 -0.34 -0.57 -0.73 -0.84 -0.88 -0.93 -0.97 -1.00 -1.01 -1.03 -1.04 Trade balance 0.00 -6.09 -6.95 -7.37 -7.63 -7.79 -7.88 -7.89 -7.91 -7.91 -7.90 -7.87 -7.84 -7.81 Exports of goods and NFS 0.00 1.44 2.84 3.99 4.79 5.28 5.54 5.66 5.65 5.59 5.49 5.37 5.24 5.11 Imports of goods and NFS 0.00 7.53 9.79 11.36 12.41 13.07 13.42 13.55 13.57 13.50 13.38 13.24 13.08 12.92 Private unrequited transfers 0.00 0.06 0.04 0.02 -0.02 -0.07 -0.13 -0.20 -0.28 -0.35 -0.43 -0.50 -0.58 -0.65 Income (net) 0.00 0.00 0.01 0.01 0.01 0.00 0.00 0.00 0.00 0.00 0.00 0.00 0.00 -0.01 Public 0.00 -0.01 0.01 0.01 0.01 0.01 0.00 0.00 0.00 0.00 0.00 -0.01 -0.01 -0.01 Private 0.00 0.00 0.00 0.00 0.00 0.00 0.00 0.00 0.00 0.00 0.00 0.00 0.00 0.01 Aid, total 0.00 7.00 7.00 7.00 7.00 7.00 7.00 7.00 7.00 7.00 7.00 7.00 7.00 7.00 Other current account flows (net) 0.00 -0.11 -0.05 0.01 0.07 0.12 0.17 0.21 0.26 0.29 0.33 0.36 0.39 0.42Capital account 0.00 -1.60 -0.08 0.63 1.08 1.37 1.58 1.65 1.75 1.82 1.87 1.90 1.93 1.96 Private borrowing 0.00 0.01 0.01 0.00 0.00 -0.01 -0.02 -0.03 -0.04 -0.05 -0.06 -0.07 -0.08 -0.09 Public borrowing 0.00 -1.60 -0.09 0.63 1.08 1.38 1.59 1.67 1.79 1.87 1.93 1.97 2.01 2.04 Errors and omissions 0.00 0.00 0.00 0.00 0.00 0.00 0.00 0.00 0.01 0.01 0.01 0.01 0.01 0.01
Government Sector (% of GDP)1
Total revenue 0.00 8.73 9.03 9.21 9.30 9.33 9.33 9.27 9.23 9.17 9.11 9.04 8.98 8.94 Domestic taxes 0.00 0.15 -0.02 -0.17 -0.30 -0.40 -0.48 -0.56 -0.61 -0.65 -0.69 -0.73 -0.75 -0.77 Indirect taxes on imports 0.00 1.58 2.05 2.38 2.60 2.73 2.81 2.83 2.84 2.82 2.80 2.77 2.74 2.70 Foreign aid (Grants) 0.00 7.00 7.00 7.00 7.00 7.00 7.00 7.00 7.00 7.00 7.00 7.00 7.00 7.00 Food aid 0.00 0.00 0.00 0.00 0.00 0.00 0.00 0.00 0.00 0.00 0.00 0.00 0.00 0.00 Nonfood aid 0.00 7.00 7.00 7.00 7.00 7.00 7.00 7.00 7.00 7.00 7.00 7.00 7.00 7.00Total expenditure 0.00 7.10 8.96 9.79 10.32 10.65 10.86 10.98 11.02 11.05 11.04 11.02 11.00 10.99 Consumption 0.00 0.00 0.19 0.27 0.31 0.32 0.32 0.32 0.31 0.30 0.30 0.28 0.27 0.27 Investment 0.00 7.08 8.78 9.53 10.03 10.36 10.57 10.70 10.77 10.81 10.82 10.82 10.82 10.81 Interest payments 0.00 0.01 0.00 -0.01 -0.02 -0.03 -0.04 -0.05 -0.06 -0.07 -0.08 -0.09 -0.09 -0.10 Payments on domestic debt 0.00 0.01 0.00 0.00 -0.01 -0.02 -0.03 -0.04 -0.06 -0.07 -0.08 -0.09 -0.10 -0.11 Payments on foreign debt 0.00 0.01 -0.01 -0.01 -0.01 -0.01 0.00 0.00 0.00 0.00 0.00 0.01 0.01 0.01Overall fiscal balance 0.00 1.60 0.08 -0.63 -1.08 -1.38 -1.59 -1.67 -1.79 -1.87 -1.93 -1.97 -2.01 -2.05Total financing 0.00 -1.60 -0.09 0.63 1.08 1.38 1.59 1.67 1.79 1.87 1.93 1.97 2.01 2.05 Foreign financing 0.00 -1.60 -0.09 0.63 1.08 1.38 1.59 1.67 1.79 1.87 1.93 1.97 2.01 2.04 Domestic borrowing 0.00 0.00 0.00 0.00 0.00 0.00 0.00 0.00 0.00 0.00 0.00 0.00 0.00 0.00
Prices and Exchange Rates1
Composite good price (% change) 0.00 -2.69 -3.11 -3.35 -3.30 -3.05 -2.65 -2.15 -1.58 -1.06 -0.55 -0.10 0.31 0.65Nominal exchange rate (% change) 0.00 0.29 0.15 0.14 0.18 0.23 0.30 0.41 0.46 0.57 0.67 0.75 0.89 1.02Real exchange rate (% change) 0.00 2.98 3.26 3.50 3.48 3.28 2.95 2.56 2.05 1.63 1.22 0.85 0.58 0.36
Memorandum items1
Real GDP per capita at market prices (% change) - Right Axis 0.00 1.78 3.64 3.94 4.45 4.73 4.82 4.75 4.51 4.21 3.88 3.54 3.14 2.78Real disposable income per capita (% change) 0.00 0.76 2.84 4.08 4.87 5.30 5.44 5.37 4.97 4.58 4.10 3.62 3.15 2.68Private savings rate (% of GDP) 0.00 0.07 0.71 1.59 2.52 3.43 4.30 5.11 5.79 6.38 6.87 7.28 7.59 7.81Real private consumption per capita (% change) 0.00 0.35 1.43 2.41 3.14 3.62 3.85 3.91 3.74 3.51 3.20 2.85 2.52 2.19Private investment (% of GDP) 0.00 -0.08 0.05 0.26 0.46 0.63 0.78 0.91 1.04 1.16 1.27 1.39 1.52 1.65Private investment (% of total investment) 0.00 -12.47 -12.89 -12.28 -11.78 -11.40 -11.11 -10.89 -10.70 -10.55 -10.41 -10.27 -10.12 -9.97Public investment (% of total public expenditure) 0.00 10.44 11.56 11.75 11.87 11.94 11.99 12.01 12.01 12.02 12.01 12.00 11.99 11.98 Health (% of public investment) 0.00 0.00 0.00 0.00 0.00 0.00 0.00 0.00 0.00 0.00 0.00 0.00 0.00 0.00 Infrastructure (% of public investment) 0.00 0.00 0.00 0.00 0.00 0.00 0.00 0.00 0.00 0.00 0.00 0.00 0.00 0.00 Education (% of public investment) 0.00 0.00 0.00 0.00 0.00 0.00 0.00 0.00 0.00 0.00 0.00 0.00 0.00 0.00Food aid (% of total revenue) 0.00 -2.27 -1.98 -1.80 -1.68 -1.60 -1.55 -1.51 -1.48 -1.46 -1.44 -1.42 -1.41 -1.40Food aid (% of total foreign aid) 0.00 -14.07 -14.07 -14.07 -14.07 -14.07 -14.07 -14.07 -14.07 -14.07 -14.07 -14.07 -14.07 -14.07Nonfood aid (% of total public investment) 0.00 12.50 8.34 7.64 7.25 7.05 6.94 6.89 6.91 6.93 6.96 7.01 7.05 7.08Nonfood aid (% of total foreign aid) 0.00 14.07 14.07 14.07 14.07 14.07 14.07 14.07 14.07 14.07 14.07 14.07 14.07 14.07Domestic debt (% of GDP) 0.00 0.27 0.10 -0.06 -0.32 -0.66 -1.05 -1.47 -1.89 -2.29 -2.67 -3.03 -3.36 -3.65External debt (% of GDP) 0.00 -0.95 -1.13 -0.61 0.01 0.62 1.15 1.54 1.84 2.10 2.33 2.52 2.78 3.09Interest payments on external public debt (% of exports) 0.00 -0.35 -1.03 -1.82 -2.74 -3.75 -4.81 -5.88 -6.90 -7.84 -8.68 -9.41 -10.01 -10.49Degree of openness (total trade in % of GDP) 0.00 8.98 12.63 15.35 17.20 18.35 18.97 19.20 19.22 19.09 18.87 18.61 18.32 18.03Educated labor (in % of population) 0.00 0.00 0.00 0.02 0.07 0.12 0.18 0.24 0.29 0.35 0.40 0.44 0.49 0.531 Absolute deviations from base line.
Years
Table A4.3Ethiopia: Simulation Results
Meeting the Poverty MDG-Permanent Increase of 7 Percentage Point in nonfood Aid-GDP Ratio(Percentage deviations from baseline, unless otherwise indicated)
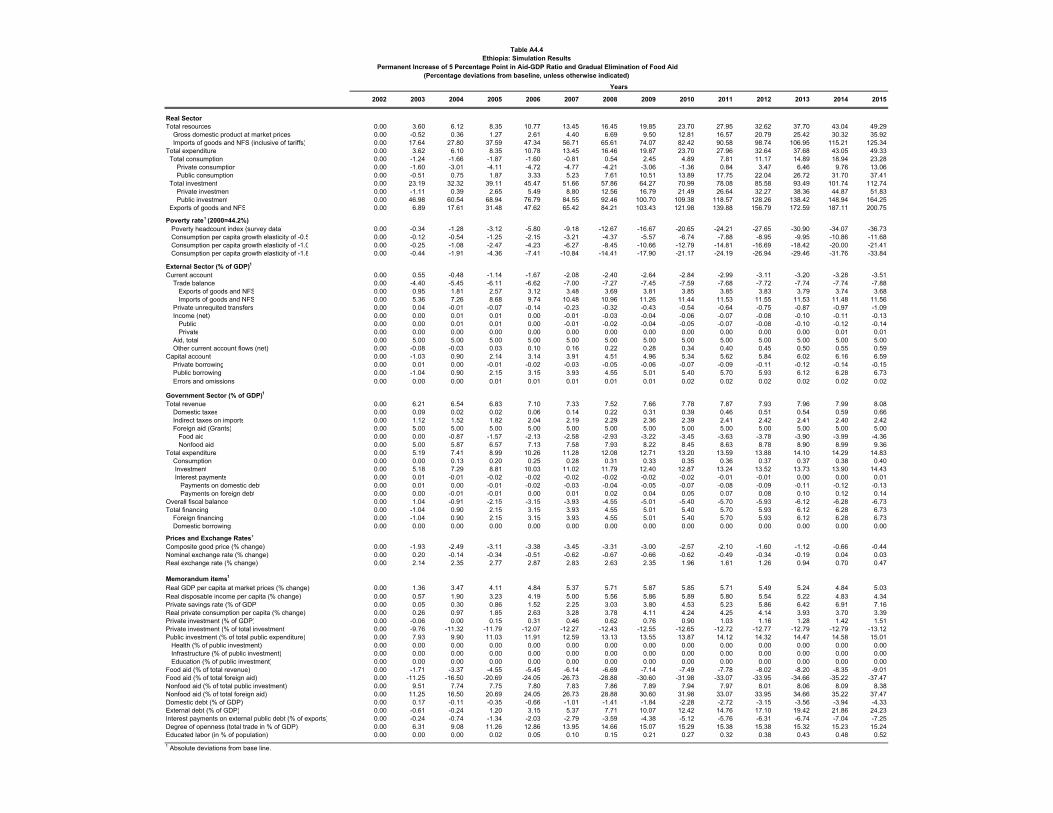
2002 2003 2004 2005 2006 2007 2008 2009 2010 2011 2012 2013 2014 2015
Real SectorTotal resources 0.00 3.60 6.12 8.35 10.77 13.45 16.45 19.85 23.70 27.95 32.62 37.70 43.04 49.29 Gross domestic product at market prices 0.00 -0.52 0.36 1.27 2.61 4.40 6.69 9.50 12.81 16.57 20.79 25.42 30.32 35.92 Imports of goods and NFS (inclusive of tariffs) 0.00 17.64 27.80 37.59 47.34 56.71 65.61 74.07 82.42 90.58 98.74 106.95 115.21 125.34Total expenditure 0.00 3.62 6.10 8.35 10.78 13.45 16.46 19.87 23.70 27.96 32.64 37.68 43.05 49.33 Total consumption 0.00 -1.24 -1.66 -1.87 -1.60 -0.81 0.54 2.45 4.89 7.81 11.17 14.89 18.94 23.28 Private consumption 0.00 -1.60 -3.01 -4.11 -4.72 -4.77 -4.21 -3.06 -1.36 0.84 3.47 6.46 9.76 13.06 Public consumption 0.00 -0.51 0.75 1.87 3.33 5.23 7.61 10.51 13.89 17.75 22.04 26.72 31.70 37.41 Total investment 0.00 23.19 32.32 39.11 45.47 51.66 57.86 64.27 70.99 78.08 85.58 93.49 101.74 112.74 Private investment 0.00 -1.11 0.39 2.65 5.49 8.80 12.56 16.79 21.49 26.64 32.27 38.36 44.87 51.83 Public investment 0.00 46.98 60.54 68.94 76.79 84.55 92.46 100.70 109.38 118.57 128.26 138.42 148.94 164.25 Exports of goods and NFS 0.00 6.89 17.61 31.48 47.62 65.42 84.21 103.43 121.98 139.88 156.79 172.59 187.11 200.75
Poverty rate1 (2000=44.2%) Poverty headcount index (survey data) 0.00 -0.34 -1.28 -3.12 -5.80 -9.18 -12.67 -16.67 -20.65 -24.21 -27.65 -30.90 -34.07 -36.73 Consumption per capita growth elasticity of -0.5 0.00 -0.12 -0.54 -1.25 -2.15 -3.21 -4.37 -5.57 -6.74 -7.88 -8.95 -9.95 -10.86 -11.68 Consumption per capita growth elasticity of -1.0 0.00 -0.25 -1.08 -2.47 -4.23 -6.27 -8.45 -10.66 -12.79 -14.81 -16.69 -18.42 -20.00 -21.41 Consumption per capita growth elasticity of -1.8 0.00 -0.44 -1.91 -4.36 -7.41 -10.84 -14.41 -17.90 -21.17 -24.19 -26.94 -29.46 -31.76 -33.84
External Sector (% of GDP)1
Current account 0.00 0.55 -0.48 -1.14 -1.67 -2.08 -2.40 -2.64 -2.84 -2.99 -3.11 -3.20 -3.28 -3.51 Trade balance 0.00 -4.40 -5.45 -6.11 -6.62 -7.00 -7.27 -7.45 -7.59 -7.68 -7.72 -7.74 -7.74 -7.88 Exports of goods and NFS 0.00 0.95 1.81 2.57 3.12 3.48 3.69 3.81 3.85 3.85 3.83 3.79 3.74 3.68 Imports of goods and NFS 0.00 5.36 7.26 8.68 9.74 10.48 10.96 11.26 11.44 11.53 11.55 11.53 11.48 11.56 Private unrequited transfers 0.00 0.04 -0.01 -0.07 -0.14 -0.23 -0.32 -0.43 -0.54 -0.64 -0.75 -0.87 -0.97 -1.09 Income (net) 0.00 0.00 0.01 0.01 0.00 -0.01 -0.03 -0.04 -0.06 -0.07 -0.08 -0.10 -0.11 -0.13 Public 0.00 0.00 0.01 0.01 0.00 -0.01 -0.02 -0.04 -0.05 -0.07 -0.08 -0.10 -0.12 -0.14 Private 0.00 0.00 0.00 0.00 0.00 0.00 0.00 0.00 0.00 0.00 0.00 0.00 0.01 0.01 Aid, total 0.00 5.00 5.00 5.00 5.00 5.00 5.00 5.00 5.00 5.00 5.00 5.00 5.00 5.00 Other current account flows (net) 0.00 -0.08 -0.03 0.03 0.10 0.16 0.22 0.28 0.34 0.40 0.45 0.50 0.55 0.59Capital account 0.00 -1.03 0.90 2.14 3.14 3.91 4.51 4.96 5.34 5.62 5.84 6.02 6.16 6.59 Private borrowing 0.00 0.01 0.00 -0.01 -0.02 -0.03 -0.05 -0.06 -0.07 -0.09 -0.11 -0.12 -0.14 -0.15 Public borrowing 0.00 -1.04 0.90 2.15 3.15 3.93 4.55 5.01 5.40 5.70 5.93 6.12 6.28 6.73 Errors and omissions 0.00 0.00 0.00 0.01 0.01 0.01 0.01 0.01 0.02 0.02 0.02 0.02 0.02 0.02
Government Sector (% of GDP)1
Total revenue 0.00 6.21 6.54 6.83 7.10 7.33 7.52 7.66 7.78 7.87 7.93 7.96 7.99 8.08 Domestic taxes 0.00 0.09 0.02 0.02 0.06 0.14 0.22 0.31 0.39 0.46 0.51 0.54 0.59 0.66 Indirect taxes on imports 0.00 1.12 1.52 1.82 2.04 2.19 2.29 2.36 2.39 2.41 2.42 2.41 2.40 2.42 Foreign aid (Grants) 0.00 5.00 5.00 5.00 5.00 5.00 5.00 5.00 5.00 5.00 5.00 5.00 5.00 5.00 Food aid 0.00 0.00 -0.87 -1.57 -2.13 -2.58 -2.93 -3.22 -3.45 -3.63 -3.78 -3.90 -3.99 -4.36 Nonfood aid 0.00 5.00 5.87 6.57 7.13 7.58 7.93 8.22 8.45 8.63 8.78 8.90 8.99 9.36Total expenditure 0.00 5.19 7.41 8.99 10.26 11.28 12.08 12.71 13.20 13.59 13.88 14.10 14.29 14.83 Consumption 0.00 0.00 0.13 0.20 0.25 0.28 0.31 0.33 0.35 0.36 0.37 0.37 0.38 0.40 Investment 0.00 5.18 7.29 8.81 10.03 11.02 11.79 12.40 12.87 13.24 13.52 13.73 13.90 14.43 Interest payments 0.00 0.01 -0.01 -0.02 -0.02 -0.02 -0.02 -0.02 -0.02 -0.01 -0.01 0.00 0.00 0.01 Payments on domestic debt 0.00 0.01 0.00 -0.01 -0.02 -0.03 -0.04 -0.05 -0.07 -0.08 -0.09 -0.11 -0.12 -0.13 Payments on foreign debt 0.00 0.00 -0.01 -0.01 0.00 0.01 0.02 0.04 0.05 0.07 0.08 0.10 0.12 0.14Overall fiscal balance 0.00 1.04 -0.91 -2.15 -3.15 -3.93 -4.55 -5.01 -5.40 -5.70 -5.93 -6.12 -6.28 -6.73Total financing 0.00 -1.04 0.90 2.15 3.15 3.93 4.55 5.01 5.40 5.70 5.93 6.12 6.28 6.73 Foreign financing 0.00 -1.04 0.90 2.15 3.15 3.93 4.55 5.01 5.40 5.70 5.93 6.12 6.28 6.73 Domestic borrowing 0.00 0.00 0.00 0.00 0.00 0.00 0.00 0.00 0.00 0.00 0.00 0.00 0.00 0.00
Prices and Exchange Rates1
Composite good price (% change) 0.00 -1.93 -2.49 -3.11 -3.38 -3.45 -3.31 -3.00 -2.57 -2.10 -1.60 -1.12 -0.66 -0.44Nominal exchange rate (% change) 0.00 0.20 -0.14 -0.34 -0.51 -0.62 -0.67 -0.66 -0.62 -0.49 -0.34 -0.19 0.04 0.03Real exchange rate (% change) 0.00 2.14 2.35 2.77 2.87 2.83 2.63 2.35 1.96 1.61 1.26 0.94 0.70 0.47
Memorandum items1
Real GDP per capita at market prices (% change) 0.00 1.36 3.47 4.11 4.84 5.37 5.71 5.87 5.85 5.71 5.49 5.24 4.84 5.03Real disposable income per capita (% change) 0.00 0.57 1.90 3.23 4.19 5.00 5.56 5.86 5.89 5.80 5.54 5.22 4.83 4.34Private savings rate (% of GDP) 0.00 0.05 0.30 0.86 1.52 2.25 3.03 3.80 4.53 5.23 5.86 6.42 6.91 7.16Real private consumption per capita (% change) 0.00 0.26 0.97 1.85 2.63 3.28 3.78 4.11 4.24 4.25 4.14 3.93 3.70 3.39Private investment (% of GDP) 0.00 -0.06 0.00 0.15 0.31 0.46 0.62 0.76 0.90 1.03 1.16 1.28 1.42 1.51Private investment (% of total investment) 0.00 -9.76 -11.32 -11.79 -12.07 -12.27 -12.43 -12.55 -12.65 -12.72 -12.77 -12.79 -12.79 -13.12Public investment (% of total public expenditure) 0.00 7.93 9.90 11.03 11.91 12.59 13.13 13.55 13.87 14.12 14.32 14.47 14.58 15.01 Health (% of public investment) 0.00 0.00 0.00 0.00 0.00 0.00 0.00 0.00 0.00 0.00 0.00 0.00 0.00 0.00 Infrastructure (% of public investment) 0.00 0.00 0.00 0.00 0.00 0.00 0.00 0.00 0.00 0.00 0.00 0.00 0.00 0.00 Education (% of public investment) 0.00 0.00 0.00 0.00 0.00 0.00 0.00 0.00 0.00 0.00 0.00 0.00 0.00 0.00Food aid (% of total revenue) 0.00 -1.71 -3.37 -4.55 -5.45 -6.14 -6.69 -7.14 -7.49 -7.78 -8.02 -8.20 -8.35 -9.01Food aid (% of total foreign aid) 0.00 -11.25 -16.50 -20.69 -24.05 -26.73 -28.88 -30.60 -31.98 -33.07 -33.95 -34.66 -35.22 -37.47Nonfood aid (% of total public investment) 0.00 9.51 7.74 7.75 7.80 7.83 7.86 7.89 7.94 7.97 8.01 8.06 8.09 8.38Nonfood aid (% of total foreign aid) 0.00 11.25 16.50 20.69 24.05 26.73 28.88 30.60 31.98 33.07 33.95 34.66 35.22 37.47Domestic debt (% of GDP) 0.00 0.17 -0.11 -0.35 -0.66 -1.01 -1.41 -1.84 -2.28 -2.72 -3.15 -3.56 -3.94 -4.33External debt (% of GDP) 0.00 -0.61 -0.24 1.20 3.15 5.37 7.71 10.07 12.42 14.76 17.10 19.42 21.86 24.23Interest payments on external public debt (% of exports) 0.00 -0.24 -0.74 -1.34 -2.03 -2.79 -3.59 -4.38 -5.12 -5.76 -6.31 -6.74 -7.04 -7.25Degree of openness (total trade in % of GDP) 0.00 6.31 9.08 11.26 12.86 13.95 14.66 15.07 15.29 15.38 15.38 15.32 15.23 15.24Educated labor (in % of population) 0.00 0.00 0.00 0.02 0.05 0.10 0.15 0.21 0.27 0.32 0.38 0.43 0.48 0.521 Absolute deviations from base line.
Years
Table A4.4Ethiopia: Simulation Results
Permanent Increase of 5 Percentage Point in Aid-GDP Ratio and Gradual Elimination of Food Aid(Percentage deviations from baseline, unless otherwise indicated)

138
APPENDIX 5. BACKGROUND PAPERS
The background papers and other CEM resources are available on the following website: http://www.worldbank.org/ethiopia/cem “The Structure of the Ethiopian Economy: A SAM-based Characterization” by A.
Seyoum Taffesse.
“A Quantitative Framework for Public Investment Policies in Ethiopia” by O. Aloui.
“Roads Out of Poverty? Assessing the Links Between Aid, Public Investment, Growth, and Poverty Reduction” by P.-R. Agénor, N. Bayraktar, and K. El Aynaoui.
“Four Ethiopias: A Regional Characterization Assessing Ethiopia's Growth Potential and Development Obstacles” by S. Milas and K. El Aynaoui.
“Assessing Ethiopia Growth Potential and Development Obstacles: Maps (Zonal Level) and Technical Appendix” by B. Seyoum Ketema and E. Tesfaye
“Assessing Ethiopia Growth Potential and Development Obstacles: Risk and Potential Maps and Technical Appendix” by B. Seyoum Ketema and E. Tesfaye
“Case Studies of Agricultural-Based Growth Strategies: Options and Trade-offs with Relevance for Ethiopia” by O. Aloui.
“A Flow of Funds Account for Ethiopia” by B. Degefe.
“Ethiopia's Recent Growth Performance: A Survey of the Literature” by R. Kassahun.
“Transport Costs in Ethiopia: An Impediment to Exports?” by B. Aschenaki.
“Analysis of High-Value Exports: A Review of Manufacturing Activities with High-Value Exports Growth Potential in Ethiopia” by G. Molla”.
“A Review of Manufacturing Activities with High-Value Exports Growth Potential in Ethiopia: Market Structure, Costs, Constraints, Competition, and Opportunities” by G. Molla.
“Can Agriculture Lead Growth in Ethiopia? The Importance of Linkages, Markets, and Tradability” by E. Garbre-Madhin
“Opportunities and Challenges for Developing High-Value Agriculture Exports in Ethiopia” by E. Garbre-Madhin
“Building the Case for Water Infrastructure” by S. Milas
“Ethiopia's Path to Survival and Development: Investing in Water Infrastructure” by S. Milas