Embed Size (px)
Citation preview

Forschungsinstitut zur Zukunft der ArbeitInstitute for the Study of Labor
DI
SC
US
SI
ON
P
AP
ER
S
ER
IE
S
What Works? A Meta Analysis of Recent Active Labor Market Program Evaluations
IZA DP No. 9236
July 2015
David CardJochen KluveAndrea Weber

What Works? A Meta Analysis of Recent
Active Labor Market Program Evaluations
David Card UC Berkeley and IZA
Jochen Kluve
Humboldt University, RWI and IZA
Andrea Weber
University of Mannheim and IZA
Discussion Paper No. 9236 July 2015
IZA
P.O. Box 7240 53072 Bonn
Germany
Phone: +49-228-3894-0 Fax: +49-228-3894-180
E-mail: [email protected]
Any opinions expressed here are those of the author(s) and not those of IZA. Research published in this series may include views on policy, but the institute itself takes no institutional policy positions. The IZA research network is committed to the IZA Guiding Principles of Research Integrity. The Institute for the Study of Labor (IZA) in Bonn is a local and virtual international research center and a place of communication between science, politics and business. IZA is an independent nonprofit organization supported by Deutsche Post Foundation. The center is associated with the University of Bonn and offers a stimulating research environment through its international network, workshops and conferences, data service, project support, research visits and doctoral program. IZA engages in (i) original and internationally competitive research in all fields of labor economics, (ii) development of policy concepts, and (iii) dissemination of research results and concepts to the interested public. IZA Discussion Papers often represent preliminary work and are circulated to encourage discussion. Citation of such a paper should account for its provisional character. A revised version may be available directly from the author.

IZA Discussion Paper No. 9236 July 2015
ABSTRACT
What Works? A Meta Analysis of Recent Active Labor Market Program Evaluations*
We present a meta-analysis of impact estimates from over 200 recent econometric evaluations of active labor market programs from around the world. We classify estimates by program type and participant group, and distinguish between three different post-program time horizons. Using meta-analytic models for the effect size of a given estimate (for studies that model the probability of employment) and for the sign and significance of the estimate (for all the studies in our sample) we conclude that: (1) average impacts are close to zero in the short run, but become more positive 2-3 years after completion of the program; (2) the time profile of impacts varies by type of program, with larger gains for programs that emphasize human capital accumulation; (3) there is systematic heterogeneity across participant groups, with larger impacts for females and participants who enter from long term unemployment; (4) active labor market programs are more likely to show positive impacts in a recession. JEL Classification: J00, J68 Keywords: active labor market policy, program evaluation, meta-analysis Corresponding author: Andrea Weber University of Mannheim L7, 3-5, Room 420 68131 Mannheim Germany E-mail: [email protected]
* We are extremely grateful to Diana Beyer, Hannah Frings and Jonas Jessen for excellent research assistance. Financial support from the Fritz Thyssen Foundation and the Leibniz Association is gratefully acknowledged.

1
In the aftermath of the Great Recession there is renewed interest in the
potential for active labor market policies (ALMP’s) to help ease a wide range of labor
market problems, including youth unemployment and persistent joblessness among
displaced adults (e.g., Martin, 2014). Although training programs, employment
subsidies, and other “active” policies have been in use for well over 50 years, credible
evidence on their causal impacts has only become available in recent decades (see
Lalonde 2003 for a brief history). Within a relatively short period of time the number of
scientific evaluations has exploded, holding out the prospect of being able to learn from
past studies what types of programs work best, in what circumstances, and for whom.
In this paper we undertake a meta analysis of the recent ALMP evaluation
literature, looking for systematic evidence on these questions.1 Building on an earlier
effort to track down the relevant literature (Card, Kluve, Weber, 2010; hereafter CKW),
we assemble a sample of 207 studies that provide 857 separate estimates of the effect
of a specific program on a particular subgroup of participants at a given post-‐program
time horizon. Our sample includes estimates for different types of programs and many
different participant subgroups, providing the opportunity to test whether certain
programs tend to work better (or worse) for specific groups. In many cases we also
observe impacts for the same program at shorter and longer horizons, allowing us to
characterize the profile of post-‐program impacts for different ALMP policies.
We summarize the estimates from different studies in two complementary ways.
Extending the traditional vote count approach, we classify "sign and significance" based
on whether the estimate is significantly positive, statistically insignificant, or significantly
negative. This classification can be applied to all the estimates in our sample, regardless
1 Previous reviews include Heckman, Lalonde and Smith (1999), who summarize 75 microeconometric evaluations from the U.S. and other countries, Kluve (2010), who reviews close to 100 studies from Europe, and Filges et al. (2015), who analyze a narrower set of 39 studies. Greenberg, Michalopoulos and Robins (2003) review U.S. programs targeted to disadvantaged workers. Ibarrarán and Rosas (2009) review programs in Latin America supported by the Inter-‐American Development Bank. Related meta analyses focusing on labor market interventions in low and middle income countries include Cho and Honorati (2014) and Grimm and Paffhausen (2015).

2
of the outcome variable or econometric technique used in the evaluation. Our
preferred approach, which we use for the large subset of studies that measure the
impact of a program on the probability of employment, models the effect size of the
estimate ̶ the impact on the employment rate of the program group, divided by the
standard deviation of employment in the comparison group. An effect size approach is
favored in the meta analysis literature (e.g., Hedges, 1981; Hedges and Olkin, 1985),
since effect sizes are not mechanically related to the number of observations used in the
study, whereas statistical significance is (in principle) sample-‐size dependent.
Fortunately, the two approaches yield similar conclusions when applied to the subset of
studies for which effect sizes are available, giving us confidence that our main findings
are invariant to how we summarize the literature.
We reach four main substantive conclusions. First, on average ALMP's have
relatively small effects in the short run (less than a year after the end of the program),
but larger positive effects in the medium run (1-‐2 years post program) and longer run
(2+ years). The average short run effect size for ALMP's that measure impacts on
employment is 0.04 σ's (standard deviation units) and is not significantly different from
zero. The average medium run effect size, by comparison, is 0.12 σ's, while the average
longer run effect size is 0.19 σ's, and both are highly significant (t>3).
Second, the time profile of impacts in the post-‐program period varies with the
type of ALMP. Job search assistance and sanction programs that emphasize "work first"
have relatively large short term impacts, on average. Training and private sector
employment programs have smaller short term impacts but larger effects in the
medium and longer runs. Public sector employment subsidies tend to have negligible or
even negative impacts at all horizons.
Third, we find that the average impacts of ALMP's vary across groups, with larger
effects for females and participants drawn from the pool of long term unemployed, and
smaller effects for older workers and youths. We also find suggestive evidence that
certain types of programs work better for specific subgroups of participants. Job search

3
assistance and sanction programs appear to be relatively more successful for
disadvantaged participants, whereas training and private sector employment subsidies
tend to work better for the long term unemployed. Finally, we investigate the role of
labor market conditions on the relative efficacy of ALMP's, and conclude that programs
have larger impacts in periods of slow growth and higher unemployment.
An important development in the recent evaluation literature is the increasing
use of randomized controlled trials (RCT's): one-‐fifth of our sample is obtained from
randomized designs. Reassuringly, RCT-‐based program estimates are not much
different from the non-‐experimental estimates in our sample, nor are there significant
differences between published and unpublished studies, or between highly-‐cited and
less-‐cited studies. Nevertheless, the choice of outcome variable and econometric
method has some influence on the sign and significance of the impact estimates, with a
tendency to find more positive estimates in studies that model endpoints like the time
to exit from the benefit system or the time to a new job.
I. Sample Construction
a. Sampling Impact Evaluation Studies
Our sample of studies extends the sample developed in CKW, using the same
criteria to select in-‐scope studies and the same protocols to extract information about
the programs and their impacts. The CKW sample was derived from responses to a 2007
survey of researchers affiliated with the Institute for the Study of Labor (IZA) and the
National Bureau of Economic Research (NBER). To extend this sample we began by
reviewing the research profiles and homepages of IZA research fellows with a declared
interest in “program evaluation”, looking for ALMP evaluations written since 2007. We
also searched the NBER working paper database using the search strings “training”,
“active”, “public sector employment”, and “search assistance.”
In a second step we used a Google Scholar search to identify all papers citing
CKW or the earlier review by Kluve (2010). We also searched through the International

4
Initiative for Impact Evaluation's "Repository of Impact Evaluation Published Studies,"
the online project list of the Abdul Latif Jameel Poverty Action Lab (J-‐PAL), and the list of
Latin American program evaluations reviewed by Ibarrarán and Rosas (2009).
After identifying an initial sample of studies using these steps, we reviewed the
citations in all the studies to verify whether there were any other studies that we had
not yet included. Finally, we identified four additional papers presented at a conference
in early fall 2014. The search process lasted from April to October 2014 and yielded 154
new studies that we considered for inclusion in our ALMP impact evaluation data base.
b. Inclusion Criteria
In order to generate a consistent data base across the two waves of data
collection (2007 and 2014) we imposed the same restrictions adopted in CKW. First, the
program(s) analyzed in the evaluation had to be one of following five types:
• classroom or on-‐the-‐job training
• job search assistance
• sanctions for failing to search, including threat of assignment to a program
• subsidized private sector employment
• subsidized public sector employment.
Second, we limited the employment subsidies to individually targeted subsidies,
excluding programs that allow firms to select the employees who receive a subsidy.
Third, we restricted attention to time-‐limited programs, eliminating open-‐ended
entitlements like education grants or child care subsidies. Fourth, we excluded public
programs with no explicitly “active” component, such as the manipulation of benefit
levels for unemployment insurance recipients.
Methodologically, we include only well-‐documented studies that use individual
micro data and incorporate a counterfactual/control group design or some form of
selection correction.

5
Applying these inclusion criteria, we retained 110 of the 154 studies identified in
the search process.2 We added these to the 97 studies from CKW, resulting in a total of
207 ALMP impact evaluations in our final data base. A complete list of these studies is
contained in an Appendix available on request for the authors.
c. Extracting Impact Estimates and Information on Programs and Participants
The next step in our data collection process was to extract information about the
programs and participants analyzed in each study, and the corresponding program
estimate. Using the same classification system as in CKW, we gathered information on
the type of ALMP, the age and gender of the participant population, the type of
dependent variable used to measure the impact of the program, and the econometric
methodology.3 We also gathered information on the (approximate) dates of operation
of the program; on the types of program participants (long term unemployed,
disadvantaged workers, or regular unemployment insurance recipients), on the source
of the data used in the evaluation (administrative records or a specialized survey), and
on the approximate duration of the program.
If a study reported separate impact estimates either by program type or by
participant group, we identified the program/participant subgroup (PPS) and coded the
impact estimates separately. Overall, we have information on 526 separate PPS's from
the 207 studies, with a minimum of 1 and a maximum of 10 PPS's in each study. We
also identified up to three impact estimates for each PPS, corresponding to three
different post-‐program time horizons: short-‐term (approximately one year after
completion of the program); medium term (approximately two years after); and longer-‐
term (approximately 3 years after). In total, we have 857 separate program estimates
2 The main reasons for exclusion were: overlap with other papers (i.e. estimating impacts for the same program); program out of scope; and no explicit counterfactual design. 3 As in CKW, we extracted the information from the studies ourselves, since we found that even advanced graduate students were often unable to interpret the studies.

6
for the 526 program/participant subgroups, with between one and three estimates of
the effect of the program at different time horizons.4
We use two complementary approaches to quantify the estimated program
impacts. First, we classify the estimates as significantly positive, insignificantly different
from zero, or significantly negative. This measure of effectiveness is available for every
estimate in our data base. For the subset of studies that measure program effects on
the probability of employment, we also extract an estimated effect size, defined as the
estimated impact on the employment rate of the program group, divided by the
standard deviation of the employment rate of the comparison group.5 As discussed in
more detail in section IVa, below, the effect size estimates are unaffected by the size of
the sample used in the estimation procedure, whereas the significance levels are in
principal dependent on the sample size. In the studies reviewed here, however, there is
little or no association between sample size and the likelihood of a significant point
estimate (either positive or negative). As a result the two ways of quantifying program
impacts lead to very similar conclusions.6
A final step in our data assembly procedure was to add information on labor
market conditions at the time of operation of the program. Specifically, we gathered
country-‐specific information on GDP growth rates and unemployment rates from the
OECD, the World Bank, and the ILO. We use the average growth rate and the average
unemployment rate during the period the program group participated in the ALMP to
proxy for cyclical conditions during the evaluation.
4 For a specific PPS and time horizon we try to identify and code the main estimate in the study. We do not include multiple estimates for the same PPS and time horizon. 5 Note that to measure the effect size we need both an impact estimate and the mean employment rate of the comparison group, which is not always available. We also extracted effect sizes for one study that measured program impacts on the duration of time to the start of the first job. 6 The same finding was obtained in CKW. As discussed below, we believe that this arises because larger sample sizes tend to be used with more complex research designs.

7
II. Descriptive Overview
a. Program Types, Participant Characteristics, Evaluation Design
Table 1 presents an overview of the program estimates in our final sample. As
noted, we have a total of 857 different impact estimates for 526 different PPS's
(program-‐type/participant subgroup combinations) extracted from 207 separate
studies. To deal with potential correlations between the program estimates from a
given study, throughout this paper we calculate standard errors clustering by study.
Column 1 of the table presents the characteristics of our overall sample, while
columns 2-‐6 summarize the estimates from five subgroups of countries: Austria,
Germany and Switzerland (the "Germanic" countries), which account for about one
quarter of all studies; Denmark, Finland, Norway and Sweden (the "Nordic" countries),
which account for another quarter of studies; Australia, Canada, New Zealand, U.K. and
U.S. (the "Anglo Saxon" countries), which account for just over 10% of studies; and two
non-‐mutually exclusive groups of lower and middle income countries -‐-‐ "non-‐OECD"
countries (10% of studies), and Latin American and Caribbean (LAC) countries (10% of
studies). For reference, Appendix Figure 1 shows the numbers of estimates by country.
The largest source countries are Germany (253 estimates), Denmark (115 estimates),
Sweden (66 estimates), the U.S. (57 estimates) and France (42 estimates).
As shown in the second panel of Table 1 we classify programs into broad types.
Training programs -‐-‐ including classroom and on-‐the-‐job training -‐-‐ account for about
one half of the program estimates, with bigger shares in the non-‐OECD and LAC
countries, and a smaller share in the Nordic countries. Job search assistance (JSA)
programs, private subsidy programs, and sanction/threat programs each account for
about one-‐sixth of the program estimates, though again there is variability across
country groups, with JSA and sanction/threat programs being particularly prevalent in
the Nordic and Anglo Saxon countries. Subsidized public sector job programs are
relatively rare in all county groups.

8
The next three panels of the table show the characteristics of the program
participant groups, classified by age group, gender, and "type" of participant. About
one-‐half of the estimates are for mixed age groups and mixed gender groups, but we
also have relatively large subsets of estimates that are specific to either younger or
older workers, or females or males. The majority of program estimates are for
participants who enter from the regular unemployment insurance (UI) system. Typically
these participants are assigned to a program and required to attend as a condition for
continuing benefit eligibility.7 The remaining estimates are split between programs that
serve the long term unemployed (LTU) and those that serve "disadvantaged" participant
groups. In many cases, LTU and disadvantaged participants are recruited from the
overall population and enroll voluntarily. Such voluntary programs are more common in
the Anglo Saxon countries and in less developed countries that lack a formal UI system. 8
Next we show the outcome variables used to measure the program impact and
the time horizons of the estimate. The most common outcome -‐-‐ particularly in the
Germanic and non-‐OECD countries -‐-‐ is the probability of employment, while the level of
earnings is the most common metric in the Anglo Saxon countries. About one sixth of
the program estimates -‐-‐ but 40% of the estimates from Nordic countries -‐-‐ measure the
exit rate from the benefit system, typically focusing on the rate of exit to a new
(unsubsidized) job. Finally, a small subset of estimates -‐ mostly from Anglo Saxon
countries -‐-‐ focus on the probability of unemployment. About one half of the estimates
are for a short term horizon (<1 year) after program completion, 35% for a medium
term (1-‐2 years), and 18% for a longer term (more than 2 year after).
The last row of the Table shows the fraction of program estimates that are based
on an experimental design. In most of our country groups about 30% of estimates come
from randomized controlled trials (RCT's) that have been explicitly designed to measure
7 This type of program requirement is widespread in Europe -‐-‐ see Sianesi (2004) for a discussion. 8 The U.S, job training programs analyzed in the seminal papers of Ashenfelter (1978), Ashenfelter and Card (1985), Lalonde (1986), Heckman, Ichimura, Smith, and Todd (1998) are all of this type.

9
the effectiveness of the ALMP of interest. An important exception is the Germanic
countries, where no experimentally based estimates are yet available.
The distribution of program estimates over time (defining time by the earliest
intake year of the program) is shown in Figure 1, with separate counts for the
experimental and non-‐experimental estimates. Our sample includes programs from as
far back as 1980, though the majority of estimates are from the 1990s and early 2000s.
The trend toward increasing use of experimental designs is clearly evident: among the
210 estimates from 2004 and later, 61% are from randomized designs.
b. Measures of Program Impact -‐ Overview
Table 2 gives an overview of our two main measures of program impact,
contrasting results for the short term, medium term, and long term. Column one
summarizes the sign and significance of all the available program estimates. Among the
415 short term estimates, 40% are significantly positive, 42% are insignificant, and 18%
are significantly negative. The pattern of results is more positive in the medium and
longer terms, with a majority of estimates (52%) being significantly positive in the
medium term, and 61% being significantly positive in the longer term.
Column 2 shows the distribution of sign and significance for the subset of studies
that use post-‐program employment rates to evaluate the ALMP program. These 111
studies account for 490 program estimates (57% of our total sample). The short term
program estimates from this subset of studies are somewhat less positive than in the
overall sample: only 31% are significantly positive, while 22% are significantly negative,
and 47% are insignificantly different from zero. In the medium and longer terms,
however, the discrepancy disappears. Indeed, the longer term estimates from
evaluations that study the probability of employment are slightly more positive than
estimates from studies that use other outcome variables. As discussed below, these
patterns are not explained by differences in the types of ALMP programs analyzed in
different studies, or by differences in participant characteristics. Instead, they reflect a

10
systematic tendency for studies based on hazard models for program exit to exhibit
more positive short term impacts than studies based on employment or earnings.
Column 3 of Table 2 shows the distributions of sign and significance associated
with the impact estimates that we can actually convert into effect sizes.9 The
distributions are very similar to those in column 2, suggesting that there is no systematic
bias associated with the availability of an effect size estimate, once we condition on the
outcome used in the evaluation.
Finally, column 4 shows the mean effect sizes for the subsample in column 3,
along with robust standard errors that take account of correlation among the program
estimates from the same study. The mean short term effect size estimate is 0.04 σ's and
is at best only marginally significant (t=1.65). By comparison the average effect sizes in
the medium and longer terms are 0.12 σ's and 0.19 σ's, respectively, and both are
significantly different from zero with a high degree of confidence. These estimates
reinforce the conclusion that on average, ALMP's have a relatively small impact in the
short run, but more positive effects in the medium and longer runs.
Distributions of effect size estimates in the short, medium, and longer runs are
shown in Figures 2a, 2b, and 2c, which give "forest plots" of the effect size estimates,
along with their associated confidence intervals, for studies from our most recent wave
of data collection.10 As suggested by the means in Table 2, the overall distribution of
effect size estimates clearly shifts to the right as the time horizon is extended. Another
interesting fact is that the width of the confidence intervals is uncorrelated with the
magnitude of the effect size estimates. There is no evidence that more positive effect
size estimates tend to be less precise -‐-‐ as might be feared if authors tend to search for
9 The main reason why we cannot extract an effect size estimate from a study that models the probability of employment is that there is no information on the employment rate of the comparison group in the relevant time frame. 10Information to construct confidence intervals was not extracted in CKW. Thus, the estimates reported in Figures 2a, 2b, and 2c are from the latest studies collected in our second round.

11
specifications that show a positive impact, or if small scale studies are more likely to be
written up if the results are positive (the so-‐called "file drawer" bias problem).
Returning to Table 2, column 4 also shows the mean effect sizes among program
estimates that are classified as significantly positive, insignificant, or significantly
negative. As would be expected if the classification of sign and significance is mainly
driven by variation in the magnitude of a particular effect size estimate -‐-‐ and not by
variation in the standard errors of the estimates -‐-‐ the mean effect size for significant
positive estimates is relatively large and positive, the mean effect size for significant
negative estimates is relatively large and negative, and the mean effect size for
insignificant estimates is close to 0. This pattern is illustrated in Appendix Figures 2a, 2b,
and 2d, where we plot the histograms of effect size estimates at each time horizon,
highlighting the contributions of estimates in each category of sign and significance. At
all three time horizons, the three subgroups of estimates appear to be drawn from
distributions that are centered on different midpoints. This separation suggests that the
sign and significance of an estimate can serve as (noisy indicator) of its effect size.
c. Variation in Program Impacts
Tables 3a and 3b provide a first look at the question of how ALMP impacts vary
across different types of programs and different participant groups. For each subset of
estimates we show the mean effect sizes at each time horizon and the corresponding
fraction of program estimates that is significantly positive.
Focusing first on comparisons across program types (Table 3a), notice that
training and private sector employment programs tend to have small effects in the short
run, coupled with more positive impacts in the medium and longer runs. In contrast,
JSA and sanction/threat programs have more stable or declining impacts over time.
These profiles are consistent with the nature of the two broad groups of programs.
Training and private subsidy programs require participants to pass up regular job
opportunities while in the program. This temporary withdrawal from the regular labor

12
market would be expected to depress outcomes in the period immediately after
completion of the program -‐-‐ a so-‐called "lock-‐in" effect (e.g., Ham and Lalonde, 1996).
Assuming that investments made during the program period are valuable, however, the
outcomes of participants will gradually catch up with those of the comparison group.11
By comparison, JSA and sanction/threat programs are designed to push participants into
the labor market quickly, with little or no investment component. In the absence of
large returns to recent experience, it is unlikely that these programs can have large long
run effects.12
Another clear finding in Table 3a is the relatively poor performance of public
sector programs -‐-‐ a result that has been found in other previous analyses (e.g.,
Heckman et al., 1999) and in our earlier study. This pattern suggests that private
employers place little value on the experiences gained in a public sector program -‐-‐
perhaps because many of these programs have little or no skill-‐building component, and
only serve to slow down the transition of participants to unsubsidized jobs.
The lower panel of the table compares estimates for different intake groups. An
interesting conclusion here is that programs that serve the long term unemployed and
disadvantaged individuals appear to have more positive short run outcomes than
programs for UI recipients. In the medium and longer runs, UI recipients appear to catch
up somewhat relative to the other two groups.
Table 3b shows the contrasts by age, gender and experimental design. The
comparisons by age show a mixed pattern, with somewhat larger average effect sizes
for youth than the other groups in the short run, but worse outcomes for both youth
and older participant groups in the medium and longer runs. The contrasts by
experimental design are also mixed, with the effect size comparisons suggesting more
11 As noted by Mincer (1974) a similar cross-‐over pattern is observed in the comparison of earnings profiles of high school graduates and college graduates. 12 Evidence on the value of labor market experience for lower skilled workers (Gladden and Taber, 2000; Card and Hyslop, 2005) suggests that the returns are modest and unlikely to exceed 2 or 3 percent per year of work.

13
positive results for experimental designs in the short run and more negative results in
the long run. The comparisons by gender are more consistent and suggest that female
participants benefit more than males or mixed gender groups.
We note that these simple contrasts must be interpreted carefully because there
are multiple sources of potential heterogeneity in the program impacts. For example,
the fractions of training programs evaluated by RCT's is relatively low. The meta analysis
models in Section IV directly address this issue using a multivariate regression approach.
d. Profile of Post-‐Program Impacts
Simple comparisons across the impact estimates in our sample suggest that
ALMP’s have more positive effects in the medium and longer terms. To verify that this is
actually true for a given program and participant subgroup – and is not simply an
artefact of heterogeneity across studies – we examine the within-‐PPS evolution of
impact estimates in Table 4.
Columns 1-‐3 show the changes in estimated effect size for the subset of studies
for which we observe both short and medium term estimates, medium and long term
estimates, and short and long term estimates, respectively. Estimated effect sizes tend
to increase as the time horizon is extended from the short run to the medium run. The
average change between the medium and longer runs is slightly negative, but overall
the short-‐run to long-‐run change is still positive.
Comparing across program types it is clear that the pattern of rising impacts is
driven almost entirely by training-‐based programs, which show a relatively large gain in
effect sizes from the short term to the medium term and only a small decline between
the medium and longer runs. The patterns for the other types of programs suggest
relatively constant or declining effect sizes over the post-‐program time horizon. In
particular, in contrast to the patterns in Table 3a, there is no indication of a rise in
impacts for private subsidy programs over time, suggesting that the gains in Table 3a
may be driven by heterogeneity between studies. We return to this point below.

14
In columns 4-‐6 we examine the within-‐study changes in sign and significance for
a broader set of studies. Here, we assign a value of +1 to PPS estimates that change
from insignificant to significantly positive or from significantly negative to insignificant;
-‐1 to estimates that change from significantly positive to insignificant or from
insignificant to significantly negative; and 0 to estimates that have the same
classification over time. This simple way of summarizing the within-‐study patterns
points to generally similar conclusions as the changes in effect size, though job search
assistance programs show more evidence of a rise in impacts from the short-‐run to the
medium run in column 4 than column 1, and private employment subsidies show a more
positive trend in impacts from the short to long run.
Appendix Table 1 presents full cross-‐tabulations of sign/significance at the
various post-‐program time horizons. As suggested by the simple summary statistics in
Table 4, most program estimates either remain in the same category, or become "more
positive" over time.
III. Meta Analytic Models of Program Impacts
a. Conceptual Framework
Consider an ALMP evaluation that models an outcome y observed for members
of both a participant group and a comparison group. Let b represent the estimated
impact of the program on the outcomes of the participants, let N represent the
combined sample size of participants and comparisons, let β represent the probability
limit of b (i.e., the estimate that would be obtained if N were infinite) and let σ
represent the standard deviation of y in the comparison group population. Assuming
that b has a standard asymptotic distribution, the estimator obtained with a sample size
of N is approximately normally distributed with mean β and variance v, where
v = K2 σ2 / N (1)

15
and K is a design factor reflecting the design features of the study.13 The actual estimate
obtained in the study can be written as:
b = β + K σ N-‐1/2 z ,
where z is a realization from an approximately normal distribution.
Assuming that σ is known (or can be estimated with high precision), the
associated estimate of the effect size is:
b/σ = β/σ + K N-‐1/2 z , (2)
which differs from the limiting effect size β/σ by a sampling error with variance K2/N.
Assume that the limiting effect size in a given study depends on a vector X of observed
characteristics of the study, (including features of the program, the participants, and the
evaluation design) and on unobserved factors ε:
β/σ = Xα + ε . (3)
where α is a vector of coefficients. This leads to a meta analysis model for the observed
effects size estimates of the form:
b/σ = Xα + u , (4)
where the error u = ε + N-‐1/2 K z includes both the sampling error in the estimate b and
the unobserved determinants of the limiting effect size for a given study.
We use simple regression models based on equation (4) to analyze the effect
sizes that are available in our sample. For the broader sample we use ordered probit
(OP) models for the 3-‐way classification of sign and significance. To understand the
interpretation of the OP models, note that equations (1) and (2) imply that the t-‐statistic
associated with the estimated impact (b) is:
t = b/v1/2 = (β/σ) N1/2/K + z .
Using equation (3):
t = [N1/2/K] Xα + z + [N1/2/K] ε . (5)
13 For example, in an experiment with 50% of the sample in the treatment group and no added covariates, K2 = 2 ( δ2 + 1 ), where δ is a factor representing the ratio of the standard deviation of the outcome after exposure to treatment to the standard deviation in the absence of treatment. In more complex designs such as difference in differences or instrumental variables K will be bigger.

16
If N/K2 -‐-‐ the "effective sample size" of a given study, taking account of the research
design -‐-‐ is constant across studies and there are no unobserved determinants of the
limiting effect size (i.e., ε=0) the t-‐statistic will be normally distributed with mean Xα'
where α'=[N1/2/K]α. 14 In this case the coefficients from an OP model for whether the t
statistic is less than -‐2, between -‐2 and 2, or greater than 2 (i.e., the sign and significance
of the estimated program effects) will be strictly proportional to the coefficients
obtained from a regression model of the corresponding effect sizes. One reason for the
effective sample size to remain roughly constant across studies is the endogenous
selection of research designs. Most analysts will only pursue a complex research design
if there is a big enough sample to ensure some minimum statistical power.
Even if N/K2 varies across studies, or there are unobserved determinants of the
limiting effect size in different studies, the implied data generating process may be
reasonably approximated by a simple ordered probit. Indeed, as we show below, in our
sample of studies the coefficients from effect size models and OP models are very nearly
proportional so we believe the approximation is reasonable.
b. Basic Effect Size Models
Table 5 presents the estimates from a series of regression models for 352 effect
size estimates observed for 200 program/participant subgroups in 83 different studies.
We pool the effect sizes for different post-‐program horizons and include dummies
indicating whether the program estimate is for the medium or long term (with short
term estimates in the omitted group). The basic model in column 1 includes only these
controls and a set of dummies for the type of program (with training programs in the
omitted category). Consistent with the simple comparisons in Table 3a, we find that the
14As can be seen from equation (2), the sampling variance of the effect size estimate from a given study is proportional to K2/N. From the sample of effect sizes and associated sampling errors summarized in Figures 1a, 1b and 1c we can estimate the variability of N/K2 across studies. This exercise suggests that the effective sample size varies fairly widely across studies, but is not highly correlated with N.

17
effect size estimates are larger in the medium and long run, and that public sector
employment programs are associated with smaller effect sizes.
The model in column 2 introduces additional controls for the type of participant
(UI recipients versus long term unemployed or disadvantaged), their age and gender,
the country group in which the program was offered, the duration of the program, and
four features of the evaluation: whether it had an experimental design, the square root
of the sample size, whether the study was published, and the study's citation percentile
relative to all studies in our sample released in the same year.15 These controls slightly
attenuate the growth in effect sizes over longer post-‐program horizons but have little
effect on the program type dummies.
Columns 3 and 4 introduce a parallel set of models that allow the time profiles of
post-‐program impacts to vary with the type of program. In these specifications the
"main effects" for each program type show the short term impacts relative to training
programs (the omitted type), while the interactions of program type with medium term
and long term dummies show how the impacts evolve relative to the profile for training
programs (which are summarized by the main effects in the first two rows). Three key
conclusions emerge from these more flexible specifications. First, as suggested by the
patterns in Table 4, the effect sizes for training programs tend to rise over time while
the effects for job search assistance and sanction/threat programs are nearly constant..
Second, public sector employment programs appear to be relatively ineffective at all
time horizons. Third, the profile for private sector training programs is relatively similar
to the profile for training programs.
The estimated coefficients for the extra control variables included in the models
in columns 2 and 4 of Table 5 are reported in the first two columns of Table 7. The
coefficient estimates from the two specifications are quite similar and suggest that the
15 We conducted a Google Scholar search for citations of all the studies in our final analysis sample in October 2014. We construct the citation rank of each study relative to other studies with the same publication date in our sample as our measure of citations. We also fit models that include the date of the study and the data source. These are very similar to the models presented in the table.

18
impact of ALMP's varies systematically with the type of participant (with larger effects
for the long term unemployed), their age group (more negative impacts for older and
younger participants), and their gender (larger effects for females). On the other hand
there is no indication that the country group, the duration of the program, or the
features of the evaluation matter. In particular, the estimated coefficient of the
experimental design dummy is relatively small in magnitude and insignificantly different
from 0 (t=0.63 in column 1 and 0.55 in column 2).
c. Basic Models for Sign and Significance
Effect sizes are available for only 40% of our overall sample. To supplement
these models we turn to ordered probit models for sign and significance. The first 4
columns of Table 6 present a series of OP models that are parallel to those in Table 5,
but fit to our overall sample of program estimates. The specifications in columns 1 and
3 have no controls other than dummies for medium and long term horizons and the
type of ALMP -‐-‐ in the latter case interacting the type of program with the time horizon
dummies. Columns 2 and 4 report expanded specifications that add the control
variables reported in columns 3 and 4 of Table 7. Finally, column 5 of Table 6 repeats
the specification from column 4, but fit to the subsample of 352 program estimates for
which we have an effect size estimate.
The OP models yield coefficients that are very highly correlated with the
corresponding coefficients from the effect size models, but 4-‐5 times bigger in
magnitude. For example, the correlation of the 14 coefficients from the specification in
column 4 of Table 6 with corresponding coefficients from the specification in column 4
of Table 5 is 0.84.16 Thus, the OP models confirm that the impacts of job search
assistance and sanction/threat programs tend to fade relative to the impacts of training
16 The regression model is: OP-‐coefficient = 0.00 + 4.64 × Effect-‐size-‐coefficient; standard error = 0.85.

19
programs, and that public sector employment programs are relatively ineffective at all
time horizons.17
The OP models also confirm most of our conclusions about the differential
impacts of ALMP's across different participant groups and in different countries.18
Comparing the coefficients in Table 7, both the effect size models and the
sign/significance models show smaller impacts of programs on young participants and
older participants, relative to the impacts on mixed age groups, and larger impacts for
long-‐term unemployed participants. Using the overall sample of program estimates the
OP models also point to a significantly positive relative impact for disadvantaged
participants. In contrast, the effect size models (and the OP models fit to the effect size
sample) yield an insignificant coefficient, arguably as a consequence of the small
number of studies that focus on this group.
One important difference between the effect size models and the OP models
concerns the relative impact of ALMP's on female participants. In the effect size models
the estimated coefficients for female participants are around 0.11 in magnitude, and
statistically significant at conventional levels (with t statistics around 2). In the OP
models, by comparison, the corresponding coefficients are relatively small in magnitude,
and far from significant. Further investigation reveals that this divergence is driven by
the upper tail of effect size estimates for female participants (see Appendix Figure 3),
and in particular by the relatively large effect size estimates for programs that show a
significantly positive effect.19 This upper tail of effect sizes does not appear to be driven
17 We also fit two simpler probit models for the events of reporting a positive and significant or negative and significant estimate, reported in Appendix Table 2. As would be expected if the ordered probit specification is correct, the coefficients from the model for a significantly positive effect are quite close to the OP coefficients, while the coefficients from the model for a significantly negative effect are close in magnitude but opposite in sign. Interestingly, neither of the probit models yields a significant effect for the square root of the sample size, confirming that variation in the significance of the program estimates across different studies is only weakly related to the sample size used in the study. 18 The correlation between the coefficients in columns 2 and 4 of Table 7 is 0.69. 19 The median and 75th percentiles of the effect size distribution for female participant groups, conditional on a positive impact, are 0.25, and 0.46 respectively. By comparison, the corresponding statistics for male and mixed gender participant groups are 0.15, and 0.27.

20
by a few outliers, but instead reflects a systematically higher probability of estimating a
large positive effect size when the participant group is limited to females.20
A final interesting aspect of the OP models is the pattern of coefficients
associated with the choice of dependent variable, reported in the top rows of Table 7.
These coefficients show that studies modeling the hazard rate of exiting the benefit
system or the probability of unemployment are significantly more likely to report
positive findings than studies modeling employment (the omitted category) or earnings.
Studies that model the hazard to a new job are also somewhat more likely to obtain
positive findings.21 We infer that some caution is warranted in interpreting the short
term impact estimates from studies that use outcomes other than employment or
earnings.
d. Are Some Programs Better (or Worse) for Different Participant Groups?
A longstanding question in the ALMP literature is whether certain participant
groups would have better outcomes if they were assigned to specific types of programs.
We address this in Table 8, which presents separate meta analysis models for the effect
sizes from different types of ALMP's.
As a benchmark column 1 presents a baseline specification fit to all 5 program
types, with dummies for the program types (not reported) and controls for the intake
group, the gender group, and the age group.22 The (omitted) base group is comprised of
mixed gender and age groups from the regular UI rolls. In this pooled specification the
estimated effects for females and long term unemployed participants are significantly
20 We also estimated separate effect size models for different types of participants -‐-‐ those from the regular UI system versus long term unemployed or disadvantaged groups. We found a significant positive coefficient for female participants in the models for both UI recipients and the long term unemployed. 21 Estimates from interacted models that allow different effects of the dependent variable at different time horizons (not reported in the table) show that the positive bias associated with the use of exit hazards is largely confined to short term impacts. 22 This is a simplified version of the specification reported in column 2 of Table 5 and column 1 of Table 7.

21
positive, while the coefficient for older participants is significantly negative, and the
coefficient for young participants is negative and marginally significant.
Columns 2-‐6 report estimates for the same specification (minus the controls for
the type of program) fit separately to effect sizes for each of the 5 program types.
Comparisons across these models suggest that long-‐term unemployed participants
benefit relatively more from "human capital" programs (i.e., training and private sector
employment), and relatively less from "work first" programs (i.e., job search and
sanction/threat programs). In contrast, disadvantaged participants appear to benefit
more from work first programs and less from human capital programs. Female
participants also appear to benefit relatively more from human capital programs, while
the relative effects for youths and older participants are not much different across the
program types.
Overall these results suggest that there may be potential gains to matching
specific participant groups to specific types of programs, though the small sample sizes
for most of the program types must be noted. Attempts to expand the power of the
analysis by using OP models for the sign and significance of the program estimates lead
to generally similar conclusions as the effect size models reported in Table 8 with only
modest gains in precision.
e. Effects of Cyclical Conditions
Another longstanding question in the ALMP literature is whether programs are
more (or less) effective in different cyclical environments.23 One view is that active
programs will tend to have smaller effects in a depressed labor market because
participants have to compete with other, more advantaged workers for a limited set of
jobs. An alternative view is that ALMP's are more effective in weak labor markets
23 A related question is whether program externalities are bigger or smaller in weak or strong labor markets. This is addressed in an innovative experiment conducted by Crepon et al. (2013).

22
because employers become more selective in a slack market, increasing the value of an
intervention (particularly those that raise human capital).
Three previous studies have investigated ALMP effectiveness over the business
cycle: Kluve (2010) uses between-‐country variation in a small European meta data set,
while Lechner and Wunsch (2009) and Forslund et al. (2011) specifically analyze
programs in Germany and Sweden, respectively. All three studies suggest a positive
correlation between ALMP effectiveness and the unemployment rate.
To provide some new evidence we added two alternative contextual variables to
our analysis, representing the average growth rate of GDP and the average
unemployment rate during the years the treatment group participated in the program.
Since growth rates and unemployment rates vary widely across countries, we also
introduced a set of country dummies that absorb any permanent differences in labor
market conditions across countries. The effect of these dummies is interesting in its own
right because the shares of different program types and participant groups also vary
widely across countries, leading to the possibility of bias in the measured effects of
program types and participant groups if there are unobserved country specific factors
that affect the average success of ALMP's in different countries.
The results of our analysis are summarized in Table 9. For reference column 1
presents a benchmark specification identical to the simplified effect size model in
column 1 of Table 8. Column 2 presents the same specification with the addition of 37
country dummies. The addition of these dummies leads to some modest but interesting
changes in the estimated coefficients in the meta analysis model. Most notably, the
coefficients associated with job search assistance (JSA) and sanction/threat programs
both become more negative, indicating that "work first" programs tend to be more
widely used in countries where all forms of ALMP's are relatively successful.
Column 3 presents a model that includes the control for average GPD growth
rate during the program period. The coefficient is negative and marginally significant
(t=1.78) providing suggestive evidence that ALMP's work better in recessionary markets.

23
A model that controls for the average unemployment rate shows the same tendency
(coefficient = 0.014, standard error = 0.016) though the effect is less precise.
A concern with the specification in column 3 is that the average number of
program estimates per country is small (many countries have only 2 or 3 estimates)
leading to potential over-‐fitting. To address this, we estimated the models in columns
4-‐6, using only data from the four countries that account for the largest numbers of
effect size estimates -‐ Denmark (17 estimates), France (20 estimates), Germany (147
estimates) and the U.S. (16 estimates). As shown in column 4, our baseline specification
yields coefficient estimates that are quite similar to the estimates from the entire
sample, though the relative impacts of JSA and sanction/threat programs are more
negative in these 4 countries.
Columns 5 and 6 present models that add the average GDP growth rate and the
average unemployment rate, respectively, to this baseline model. These specifications
suggest relatively important cyclical effects on ALMP effectiveness. For example,
comparing two similar programs operating in labor markets with a 3 percentage point
gap in growth rates, the program in the slower growth environment would be expected
to have a 0.2 larger effect size.
While not reported in the table, we also estimated meta analysis models for
these four countries that include an interaction between the cyclical variable and an
indicator for human capital type programs (i.e. training or private employment
programs). Using GDP growth as the cyclical indicator the estimated coefficients are
-‐0.048 (standard error = 0.023) for the main effect and -‐0.028 (standard error = 0.017)
for the interaction. Using unemployment as the cyclical indicator the patterns of the
main effect and the interaction are similar but less precise.24 Both models therefore
suggest that the impacts of training and private sector employment programs are more
24 The estimated main effect of average unemployment is 0.053 (standard error = 0.038), the estimated interaction effect is 0.0230 (standard error = 0.036).

24
countercyclical than the impacts of JSA, sanction/threat and public sector programs,
though the interaction terms are not significant at conventional levels.
While the evidence in Table 9 suggests a countercyclical pattern of program
effectiveness, it is worth emphasizing that the explanation for this pattern is less clear. It
is possible that the value of a given program is higher in a recessionary environment. It
is also possible, however, that the characteristics of ALMP participants, or of the
programs themselves, change in a way that contributes to a more positive impact in a
slow-‐growth/high-‐unemployment environment.
IV. Summary and Conclusions
We have assembled and analyzed a new sample of impact estimates from 207
studies of active labor market policies. Building on our earlier study (CKW), we argue
that it is important to distinguish between impacts at various time horizons since
completion of the program, and to consider how the time profile of impacts varies by
the type of ALMP. We also study the importance of participant heterogeneity, and look
for evidence that specific subgroups may benefit more or less from particular types of
programs. Finally, we study how the state of the labor market affects the measured
effectiveness of ALMP's.
With regard to the impacts of different types of ALMP's, we find that the time
profiles of "work first" style job search assistance and sanction/threat programs differ
from the profiles of "human capital" style training and private sector employment
subsidies. Work first programs tend to have larger short term effects, whereas human
capital programs have small (or in some cases even negative) short term impacts,
coupled with larger impacts in the medium or longer run (2-‐3 years after completion of
the program). We also confirm that public sector employment programs have
negligible, or even negative program impacts at all time horizons.
With regard to different participant groups, we find that female participants and
those drawn from the pool of long term unemployed tend to have larger program

25
effects than other groups. In contrast, the program estimates for youths and older
workers are typically less positive than for other groups. We also find indications of
potential gains to matching different participant groups to specific programs, with
evidence that work first programs are relatively more successful for disadvantaged
participants, whereas human capital programs are more successful for the long term
unemployed.
With regard to the state of the labor market, we find that ALMP's tend to have
larger impacts in periods of slow growth and higher unemployment. In particular, we
find a relatively large cyclical component in the program estimates from four countries
that account for one-‐half of our sample. We also find suggestive evidence that human
capital programs are more cyclically sensitive than work first programs.
Our findings on the relative efficacy of human capital programs for long term
unemployed, and on the larger impacts of these programs in recessionary
environments, point to a potentially important policy lesson. As noted by Krueger, Judd
and Cho (2014) and Kroft et al. (forthcoming), the number of long term unemployed
rises rapidly as a recession persists. This group has a high probability of leaving the
labor force, risking permanent losses in the productive capacity of the economy. One
policy response is countercyclical job training programs and private employment
subsidies, which are particularly effective for the longer-‐term unemployed in a
recessionary climate.
Methodologically, we find a number of interesting patterns in the recent ALMP
literature. Most importantly, we find that the estimated impacts derived from
randomized controlled trials, which account for one-‐fifth of our sample, are not much
different on average from the non-‐experimental estimates. We also find no evidence of
"publication bias" in the relationship between the magnitude of the point estimates
from different studies and their corresponding precision. The estimated impacts are
also very similar from published and unpublished studies, and from more and less cited
studies. We do find that the choice of outcome variable used in the evaluation matters,

26
with a tendency toward more positive short term impact estimates from studies that
model the time to first job than from studies that model the probability of employment
or the level of earnings.
Finally, we conclude that meta analytic models based on the sign and
significance of the program impacts lead to generally similar conclusions as models
based on effect sizes. This arises because much of the variation in the sign and
significance of estimated impacts across studies in the ALMP literature is driven by
variation in estimated effect sizes, rather than by variation in the corresponding
sampling errors.

27
References
Ashenfelter, Orley (1978). “Estimating the Effect of Training Programs on Earnings” Review of Economics and Statistics 60 (1): 47-‐57. Ashenfelter, Orley and David Card (1985). “Using the Longitudinal Structure of Earnings to Estimate the Effect of Training Programs.” Review of Economics and Statistics 67 (4): 648-‐660. Card, David and Dean R. Hyslop (2005). "Estimating the Effect of a Time-‐Limited Earnings Subsidy for Welfare Recipients." Econometrica 73 (6): 1723-‐1770. Card, D., J. Kluve and A. Weber (2010). "Active Labour Market Policy Evaluations: A Meta-‐analysis." Economic Journal 120 (548): F452-‐F477. Cho, Y. and M. Honorati (2014). “Entrepreneurship Programs in Developing Countries: A Meta Regression Analysis.” Labour Economics 28 (C): 110-‐130. Crépon, Bruno, Esther Duflo, Marc Gurgand, Roland Rathelot, and Philippe Zamora (2013). "Do Labor Market Policies have Displacement Effects? Evidence from a Clustered Randomized Experiment." Quarterly Journal of Economics 128 (2): 531-‐580. Filges, Trine, Geir Smedslund, Anne-‐Sofie Due Knudsen, and Anne-‐Marie Klint Jørgensen (2015). "Active Labour Market Programme Participation for Unemployment Recipients: A Systematic Review." Campbell Systematic Reviews 2015 (2). Forslund, A., P. Fredriksson and J. Vikström (2011). “What Active Labor Market Policy Works In a Recession?”. Nordic Economic Policy Review 1: 171-‐207. Gladden, Tricia and Christopher Taber (2000). "Wage Progression Among Less Skilled Workers." In Rebecca M. Blank and David Card, editors, Finding Work: Jobs and Welfare Reform. New York: Russell Sage Foundation. Greenberg, David H., Charles Michalopoulos and Philip K. Robins (2003). “A Meta-‐Analysis of Government-‐Sponsored Training Programs.” Industrial and Labor Relations Review 57 ( ): 31-‐53. Grimm, M. and A. L. Paffhausen (2015). “Do Interventions Targeted at Micro-‐Entrepreneurs and Small and Medium-‐sized Firms Create Jobs? A Systematic Review of the Evidence for Low and Middle Income Countries”. Labour Economics 32: 67-‐85.

28
Ham, John C. and Robert J. Lalonde (1996). "The Effect of Sample Selection and Initial Conditions in Duration Models: Evidence from Experimental Data on Training." Econometrica 64 (1): 175-‐205. Heckman, James J., Hidehiko Ichimura, Jeffrey A. Smith, and Petra Todd (1998). “Characterizing Selection Bias Using Experimental Data.” Econometrica 66 (5): 1017-‐1098. Hedges, Larry V. (1981). "Distribution theory for Glass' estimator of effect size and related estimators". Journal of Educational Statistics 6 (2): 107–128. Hedges, Larry V. and Ingram Olkin (1985). Statistical Methods for Meta-‐Analysis. Orlando: Academic Press. Ibarrarán, P. and D. Rosas (2009), Evaluating the Impact of Job Training Programs in Latin America: Evidence from IDB funded operations, Journal of Development Effectiveness 1: 195-‐216. Kluve, J. (2010). "The Effectiveness of European Active Labor Market Programs." Labour Economics 17: 904-‐918. Kroft, Kory, Fabien Lange, Matthew J. Notowidigdo, and Lawrence F. Katz. (forthcoming). "Long-‐term Unemployment and the Great Recession: The Role of Composition, Duration Dependence, and Non-‐Participation. Journal of Labor Economics. Krueger, Alan B., Judd Cramer, and David Cho (2014). "Are the Long-‐Term Unemployed on the Margins of the Labor Market?" Brookings Papers on Economics Activity Spring: 229-‐280. Lalonde, Robert J (1986). “Evaluating the Econometric Evaluations of Training Programs with Experimental Data.” American Economic Review 76 (4): 604-‐620. Lalonde, Robert J (2003). "Employment and Training Programs." In Robert A. Moffit, editor, Means Tested Transfer Programs in the United States. Chicago: University of Chicago Press. Lechner, Michael and Connie Wunsch (2009). “Are Training Programs More Effective when Unemployment is High?” Journal of Labor Economics 27 (4): 653-‐692. Martin, John P. (2014) "Activation and Active Labour Market Policies in OECD Countries: Stylized Facts and Evidence on Their Effectiveness." IZA Policy Paper No. 84.

29
Mincer, Jacob. (1974). Schooling, Experience and Earnings. New York: National Bureau of Economic Research.

Figure 1: Number of Program Estimates, By Year of Program Start
0
10
20
30
40
50
60
70
80
90
100
1980 1989 1994 1999 2004 2009
Year of Program Start
Number of Program
Estim
ates
Experimental Design
Non‐experimental Design

Figure 2a: Short Term Effect Sizes and Confidence Intervals
‐1 ‐0.8 ‐0.6 ‐0.4 ‐0.2 0 0.2 0.4 0.6 0.8 1
Short Term Effect Size
Note: 3 large positive estimated effect sizes not shown.

Figure 2b: Medium Term Effect Sizes and Confidence Intervals
‐1 ‐0.8 ‐0.6 ‐0.4 ‐0.2 0 0.2 0.4 0.6 0.8 1
Medium Term Effect Size

Figure 2c: Long Term Effect Sizes and Confidence Intervals
‐1 ‐0.8 ‐0.6 ‐0.4 ‐0.2 0 0.2 0.4 0.6 0.8 1
Long Term Effect Size

Table 1: Description of Sample of Program Estimates
Austria, U.S., U.K, Latin Amer.
Germany, Nordic Aust., N.Z., and
Full sample Switzerland Countries Canada Non‐OECD Carribean
(1) (2) (3) (4) (5) (6)
Number of estimates 857 290 212 87 132 72Number of PPS's 526 163 127 45 86 54Number of studies 207 52 48 24 33 19
Type of program (%):
Training 49 62 17 45 79 97
Job Search Assistance 15 8 26 22 2 0
Private Subsidy 13 17 15 5 11 3
Public Employment 8 9 10 3 6 0
Sanctions/Threat 16 5 32 25 2 0
Age of program group (%):
Mixed 56 54 61 72 40 25
Youth (<25 years) 21 12 20 15 53 69
Older (≥25 years) 23 33 19 13 8 6
Gender of Program group (%):
Mixed 51 53 67 43 43 11
Males only 24 24 18 25 23 44
Females only 24 23 16 32 31 44
Type of Program Participants (%):
Registered unemployed 64 86 67 33 24 0
Long‐term unemployed 10 8 10 25 7 0
Disadvantaged 26 6 23 41 69 100
Outcome of Interest (%):
Employment status 56 83 31 26 63 54
Earnings 23 8 25 47 36 43
Hazard to new job 11 7 25 3 0 0
Other hazard 6 0 16 2 0 3
Unemployment status 5 2 4 21 1 0
Effect Measured at (%):
Short Term 47 42 54 37 47 57
Medium Term 35 34 31 40 45 42
Long Term 18 23 16 23 8 1
Experimental Design (%) 19 0 39 31 28 26
Note: see text for description of sample. Study refers to an article or unpublished paper. PPS refers to a
program and participant subgroup (e.g., a job search assistance program for mixed gender youths).
Estimate refers to an estimate of the effect of the program on the participant subgroup at either a short‐
term (<1 year after completion of the program), medium term (1‐2 years post completion) or long term (2+
years post completion) time horizon.
Country of Study:

Table 2: Summary of Program Estimates by Availability of Effect Size
Mean Effect Size
Potentially Have for Col. 3 Sample
Full sample Have Effect Size Effect Size (robust std. error)a
(1) (2) (3) (4)
Number of estimates 857 490 352 ‐‐
Number of PPS's 526 274 200 ‐‐
Number of studies 207 111 83 ‐‐
Short Term Estimates
All ST estimates ‐‐ number [pct. of total estimates] 415 [48] 205 [42] 141 [40] 3.8 (2.3)
Significant positive ST estimate ‐‐ pct. of ST sample 40 31 33 21.4 (3.3)
Insignificant ST estimate ‐‐ pct. of ST sample 42 47 44 0.5 (1.2)
Significant negative ST estimate ‐‐ pct. of ST sample 18 22 23 ‐14.4 (2.4)
Medium Term (MT) Estimates
All MT estimates ‐‐ number [pct. of total estimates] 301 [35] 194 [40] 143 [41] 11.5 (2.8)
Significant positive MT estimate ‐‐ pct. of MT sample 52 50 47 24.2 (4.3)
Insignificant MT estimate ‐‐ pct. of MT sample 40 41 43 2.5 (0.8)
Significant negative MT estimate ‐‐ pct. of MT sample 8 9 10 ‐10.9 (2.3)
Long Term (LT) Estimates
All LT estimates ‐‐ number [pct. of total estimates] 141 [16] 91 [19] 68 [19] 18.5 (5.0)
Significant positive LT estimate ‐‐ pct. of sample 61 65 65 27.6 (6.1)
Insignificant LT estimate ‐‐ pct. of sample 35 32 32 2.7 (1.2)
Significant negative LT estimate ‐‐ pct. of sample 4 3 3 ‐9.7 (0.1)
Notes: see note to Table 1. Short term program estimates are for the period up to 1 year after the completion of the program. Medium term
estimates are for the period from 1 to 2 years after completion of the program. Long term estimates are for the period 2 or more years after
completion of the program. Effect sizes are only available for studies that model the probability of employment as the outcome of interest, and
provide information on mean employment rate of comparison group. a Entries in this column are mean effect sizes for the subset indicated by row heading. Standard error of mean is clustered by study.

Table 3a: Comparison of Impact Estimates by Program Type and Participant Group
Median
Number Sample Percent Short Medium Longer Short Medium Longer
Est's. Size RCT's Term Term Term Term Term Term
(1) (2) (3) (4) (5) (6) (7) (8) (9)
All 857 10,709 19.4 3.8 11.5 18.5 40 52 61
(141) (143) (68) (415) (301) (141)
By Program Type:
Training 418 7,700 12.9 3.9 14.0 13.6 35 54 67
(90) (92) (35) (201) (163) (54)
Job Search Assist. 129 4,648 51.2 4.1 4.4 2.3 53 63 43
(16) (13) (7) (68) (40) (21)
Private Subsidy 118 10,000 8.5 3.2 11.7 45.9 37 65 88
(13) (17) (16) (49) (37) (32)
Public Sector Emp. 76 17,084 0.0 ‐4.2 ‐2.2 2.5 32 25 27
(14) (12) (6) (41) (24) (11)
Sanction/Threat 116 17,391 31.0 17.8 14.6 3.6 52 38 43
(8) (9) (4) (56) (37) (23)
By Intake Group:
UI Recipients 554 11,000 17.1 ‐0.6 8.7 17.3 34 47 59
(93) (101) (50) (258) (193) (103)
Long Term Unem. 106 8,900 16.0 17.1 29.9 30.7 50 65 63
(17) (16) (10) (50) (40) (16)
Disadvantaged 197 7,027 27.4 9.8 11.1 10.4 50 59 68
(31) (26) (8) (107) (68) (22)
Mean Effect Sizes (×100) Pct. with Sig. Positive Impact
Notes: see Tables 1 and 2. Number of program estimates associated with each table entry is reported in parentheses. Effect sizes are only
available for studies that model the probability of employment as the outcome of interest.

Table 3b: Additional Comparisons of Impact Estimates by Participant Groups and Design
Median
Number Sample Percent Short Medium Longer Short Medium Longer
Est's. Size RCT's Term Term Term Term Term Term
(1) (2) (3) (4) (5) (6) (7) (8) (9)
All 857 10,709 19.4 3.8 11.5 18.5 40 52 61
(141) (143) (68) (415) (301) (141)
By Age:
Mixed Age 505 10,000 16.6 3.8 14.4 22.4 47 57 65
(71) (84) (51) (238) (178) (89)
Youth (<25) 180 3,000 33.3 7.5 5.9 0.1 32 41 67
(34) (29) (5) (92) (64) (24)
Non‐Youth 172 25,850 12.8 0.3 8.9 9.6 31 51 43
(36) (30) (12) (85) (59) (28)
By Gender:
Mixed Gender 466 11,000 19.7 3.9 9.4 11.3 39 52 59
(89) (85) (45) (224) (155) (87)
Males Only 191 10,000 15.2 ‐2.8 12.4 29.2 41 50 58
(24) (28) (9) (95) (72) (24)
Females Only 200 8,345 22.5 9.4 16.5 34.5 41 55 70
(28) (30) (14) (96) (74) (30)
By Evaluation Design:
Experimental 166 1,471 100.0 10.6 5.6 0.8 40 41 37
(28) (25) (15) (78) (58) (30)
Non‐experimental 691 16,000 0.0 2.1 12.7 23.5 40 55 68
(113) (118) (53) (337) (243) (111)
Mean Effect Sizes (×100) Pct. with Sig. Positive Impact
Notes: see Tables 1 and 2. Number of program estimates associated with each table entry is reported in parentheses. Effect sizes are only
available for studies that model the probability of employment as the outcome of interest.

Table 4: Transitions in Program Impacts for a Given Program and Participant Subgroup
(1) (2) (3) (4) (5) (6)
All 0.043 0.037 ‐0.012 0.231 0.250 0.020
(0.020) (0.035) (0.007) (0.055) (0.103) (0.052)
Number Studies 105 43 47 225 100 102
By Program Type
Training 0.070 0.087 ‐0.010 0.314 0.439 0.048
(0.018) (0.035) (0.011) (0.072) (0.085) (0.049)
Number Studies 70 28 28 121 41 42
Job Search Assist. 0.009 ‐0.005 ‐0.004 0.265 0.143 ‐0.111
(0.019) (0.003) (0.006) (0.095) (0.167) (0.144)
Number Studies 10 7 7 34 21 18
Private Subsidy ‐0.055 ‐0.006 ‐0.005 0.083 0.167 ‐0.062
(0.126) (0.156) (0.031) (0.150) (0.267) (0.068)
Number Studies 9 2 6 24 12 16
Public Sector Emp. ‐0.007 ‐0.299 ‐0.039 0.158 ‐0.143 ‐0.143
(0.070) (0.299) (0.039) (0.170) (0.494) (0.285)
Number Studies 10 2 2 19 7 7
Sanction/Threat 0.013 ‐0.048 ‐0.029 0.000 0.158 0.211
(0.035) (0.021) (0.012) (0.108) (0.182) (0.092)
Number Studies 6 4 4 27 19 19Notes: Change in effect size in column 1 represents the difference between the medium term and short term effect sizes for a given program and
participant subgroup (PPS). Changes in columns 2 and 3 are defined analogously. Change in sign/significance in column 4 is defined as +1 if the short term
estimate is significantly negative and the medium term estimate is insignificant, or if the short term estimate is insignificant and the medium term estimate
is significantly positive; 0 if the sign and significance of the short term and medium term estimates is the same; and ‐1 if the short term estimate is
significantly positive and the medium term estimate is insignificant, or if the short term estimate is insignificant and the medium term estimate is
significantly negative. Changes in columns 5 and 6 are defined analogously. Standard deviations (clustered by study number)in parenthesis.
Change in Effect Size Change in Sign/Significance
short term to
medium term
short term to
long term
medium term
to long term
short term to
medium term
short term to
long term
medium term
to long term

Table 5: Estimated Effect Size Models
(1) (2) (3) (4)
Effect Term (Omitted = Short Term)
Medium Term 0.071 0.056 0.101 0.088
(0.027) (0.021) (0.037) (0.025)
Long Term 0.131 0.091 0.097 0.099
(0.044) (0.038) (0.040) (0.040)
Program Type (Omitted = Training)
Job search Assist. ‐0.059 ‐0.012 0.002 0.029(0.027) (0.043) (0.026) (0.044)
Private Subsidy 0.094 0.086 ‐0.007 0.044(0.068) (0.057) (0.091) (0.099)
Public Sector Emp. ‐0.120 ‐0.152 ‐0.081 ‐0.084(0.034) (0.044) (0.055) (0.062)
Sanction/Threat 0.036 0.007 0.139 0.108(0.071) (0.094) (0.068) (0.098)
Interaction with Medium Term:
Job search Assist. ‐0.098 ‐0.092(0.043) (0.041)
Private Subsidy ‐0.016 ‐0.055(0.102) (0.104)
Public Sector Emp. ‐0.081 ‐0.09(0.070) (0.073)
Sanction/Threat ‐0.133 ‐0.105(0.048) (0.045)
Interaction with Long Term:
Job search Assist. ‐0.115 ‐0.083(0.041) (0.052)
Private Subsidy 0.329 0.182(0.142) (0.127)
Public Sector Emp. ‐0.030 ‐0.156(0.081) (0.108)
Sanction/Threat ‐0.239 ‐0.273(0.073) (0.092)
Additional Controls No Yes No Yes
R Squared 0.13 0.33 0.21 0.37
Dependent Variable = Estimated Effect Size
Notes: Standard errors (clustered by study) in parentheses. Models are linear regressions
with the effect size as dependent variable. Coefficients of additonal control variables
included in models in columns 2 and 4 reported in Table 7. Sample size is 352.

Table 6: Ordered Probit Modelsfor Sign/Significance of Estimated Program Impacts
(1) (2) (3) (4) (5)
Effect Term (Omitted = Short Term)
Medium Term 0.372 0.483 0.563 0.639 0.491
(0.088) (0.099) (0.130) (0.138) (0.145)
Long Term 0.597 0.742 0.901 1.053 1.030
(0.157) (0.167) (0.175) (0.171) (0.206)
Program Type (Omitted = Training)
Job search Assist. 0.274 0.286 0.531 0.532 0.569
(0.156) (0.168) (0.180) (0.197) (0.459)
Private Subsidy 0.139 0.076 ‐0.04 ‐0.132 ‐0.166
(0.189) (0.210) (0.224) (0.263) (0.438)
Public Sector Emp. ‐0.677 ‐0.758 ‐0.383 ‐0.489 ‐1.399
(0.219) (0.228) (0.276) (0.279) (0.496)
Sanction/Threat ‐0.110 ‐0.205 0.318 0.202 1.148
(0.172) (0.184) (0.206) (0.236) (0.653)
Interaction with Medium Term:
Job search Assist. ‐0.289 ‐0.283 ‐0.004
(0.235) (0.249) (0.343)
Private Subsidy 0.138 0.226 0.353
(0.289) (0.311) (0.486)
Public Sector Emp. ‐0.645 ‐0.573 0.051
(0.285) (0.288) (0.477)
Sanction/Threat ‐0.764 ‐0.705 ‐0.662
(0.226) (0.245) (0.278)
Interaction with Long Term :
Job search Assist. ‐1.017 ‐1.022 ‐0.832
(0.313) (0.294) (0.313)
Private Subsidy 0.611 0.58 1.274
(0.375) (0.387) (0.798)
Public Sector Emp. ‐0.643 ‐0.675 0.131
(0.490) (0.497) (0.832)
Sanction/Threat ‐0.999 ‐1.021 ‐1.638
(0.353) (0.375) (0.430)
Additional Controls No Yes No Yes Yes
Number of Observations 857 857 857 857 352
Log Likelihood ‐801 ‐765 ‐786 ‐752 ‐283
Dependent Variable = Ordinal Indicator for Sign/Significance
Notes: Standard errors (clustered by study) in parentheses. Models are ordered probits, fit to ordinal data
with value of +1 for significantly positive, 0 for insignificant, ‐1 for significantly negative estimate. Estimated
cutpoints (2 per model) are not reported in the Table. Model in column 5 is fit to subsample of estimates for
which an effect size estimate is available. Coefficients for additional control variables for models in columns
2, 4 and 5 are reported in Table 7.

Table 7: Estimated Coefficients for Additional Control Variables for Models Reported in Tables 5 and 6
(1) (2) (3) (4) (5)
Outcome of Interest (Omitted = Probability of Employment)
Earnings ‐0.003 ‐0.01(0.130) (0.132)
Hazard to New Job 0.275 0.264(0.211) (0.212)
Other Hazard 0.613 0.547(0.275) (0.263)
Unemployment Status 0.598 0.591(0.293) (0.285)
Age of Program Group (Omitted = Mixed)
Youths (<25) ‐0.062 ‐0.05 ‐0.368 ‐0.348 ‐0.518(0.045) (0.045) (0.151) (0.153) (0.287)
Older (>=25) ‐0.151 ‐0.135 ‐0.423 ‐0.425 ‐0.671(0.044) (0.045) (0.157) (0.160) (0.297)
Gender of Program Group (Omitted = Mixed)
Males only 0.029 0.020 ‐0.007 ‐0.006 ‐0.328(0.049) (0.049) (0.149) (0.149) (0.266)
Females only 0.107 0.094 0.064 0.053 0.000(0.052) (0.051) (0.144) (0.146) (0.250)
Country Group (Omitted = Nordic)Germanic 0.107 0.082 0.250 0.176 0.910
(0.073) (0.072) (0.192) (0.196) (0.488)
Anglo ‐0.07 ‐0.078 0.177 0.14 1.231(0.081) (0.076) (0.241) (0.236) (0.579)
East Europe 0.04 0.055 0.131 0.096 0.618
(0.072) (0.065) (0.201) (0.202) (0.378)
Rest of Europe 0.019 0.009 0.125 0.088 0.738
(0.060) (0.059) (0.187) (0.189) (0.483)
Latin America ‐0.01 ‐0.003 0.108 0.1 1.012(0.129) (0.130) (0.338) (0.338) (0.826)
Remaining Countries 0.084 0.089 ‐0.063 ‐0.064 1.124
(0.091) (0.092) (0.281) (0.286) (0.529)
Type of Program Participant (Omitted = Registered Unemployed)
Disadvantaged 0.06 0.049 0.542 0.527 0.356
(0.089) (0.088) (0.228) (0.228) (0.623)
Long‐term Unemployed 0.217 0.212 0.388 0.404 0.392(0.076) (0.074) (0.181) (0.179) (0.332)
Other Controls:
Progam > 9 Months ‐0.056 ‐0.043 ‐0.135 ‐0.122 ‐0.55(0.042) (0.041) (0.179) (0.177) (0.232)
Experiment ‐0.031 ‐0.027 ‐0.065 ‐0.095 ‐0.314(0.049) (0.049) (0.170) (0.170) (0.332)
Square Root of Samplesize ‐0.039 ‐0.028 0.159 0.098 0.484
(0.086) (0.077) (0.184) (0.191) (0.706)
Published Article ‐0.056 ‐0.063 ‐0.203 ‐0.213 ‐0.41(0.043) (0.043) (0.133) (0.132) (0.254)
Citations Rank Index ‐0.003 ‐0.002 0.007 0.005 ‐0.005(0.004) (0.003) (0.012) (0.012) (0.024)
Number of Observations 352 352 857 857 352
Effect Size OLS Models Ordered Probit Models for Sign/Significance
Notes: Standard errors (clustered by study) in parentheses. Table entries are coefficient estimates for additional controls
included in models in Tables 5 and 6. Models in columns 1‐2 correspond to models in columns 2 and 4 of Table 5. Models
in columns 3‐5 correspond to models in columns 2, 4, and 5 of Table 7.

Table 8: Comparison of Relative Impacts for Different Participant Groups by Type of Program
All Job Search Private Sector Public Sector
Program Types Training Assistance Job/Subsidy Employment Theat/Sanctions
(1) (2) (3) (4) (5) (6)
Number of Estimates 352 217 36 46 32 21
Number of Studies 83 51 15 19 14 8
Mean Effect Size (×100) 9.77 9.73 3.82 21.17 ‐2.23 13.70
Constant 0.046 0.026 0.000 ‐0.117 0.039 0.213
(0.040) (0.040) (0.034) (0.102) (0.073) (0.058)
Medium Term 0.063 0.092 0.030 0.037 0.010 0.042
(0.022) (0.023) (0.029) (0.108) (0.065) (0.067)
Long Term 0.110 0.123 0.006 0.274 ‐0.050 ‐0.019
(0.040) (0.039) (0.025) (0.148) (0.089) (0.037)
Intake Group (Base=Regular UI Recipients)
Disadvantaged 0.003 ‐0.046 0.200 0.124 ‐‐ 0.157
(0.043) (0.043) (0.034) (0.068) (0.114)
Long Term Unemployment 0.190 0.306 0.060 0.274 0.143 ‐0.239
(0.077) (0.138) (0.039) (0.077) (0.049) (0.045)
Gender Group (Base=Mixed)
Male 0.040 0.060 (omitted) 0.234 ‐0.132 ‐0.075
(0.043) (0.054) (0.147) (0.062) (0.063)
Female 0.119 0.126 (omitted) 0.365 ‐0.081 ‐0.312
(0.050) (0.063) (0.113) (0.061) (0.099)
Age Group (Base=Mixed)
Youth ‐0.076 ‐0.047 0.016 0.100 ‐0.155 ‐‐
(0.045) (0.049) (0.022) (0.092) (0.066)
Older Participants ‐0.103 ‐0.113 0.029 ‐0.244 ‐0.134 0.114
(0.041) (0.053) (0.041) (0.119) (0.081) (0.006)
Controls for Program Typea Yes No No No No No
aFour dummies for different types of programs included.
Notes: standard errors, clustered by study, in parenthesis. See note to Table 5. Dependent variable in all models is estimated effect size.
Models in column 1 are fit to all available effect sizes. Models in columns 2‐6 are estimated on subsets of effect size estimates for program
types indicated in column heading.
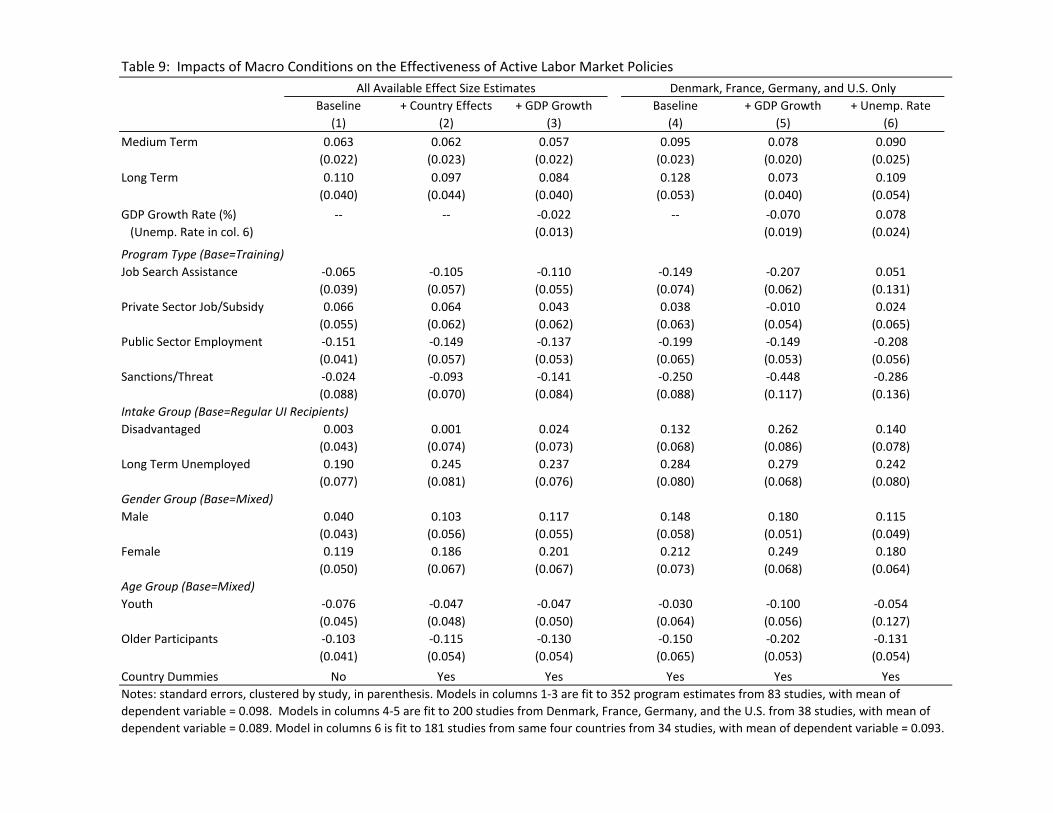
Table 9: Impacts of Macro Conditions on the Effectiveness of Active Labor Market Policies
Baseline + Country Effects + GDP Growth Baseline + GDP Growth + Unemp. Rate
(1) (2) (3) (4) (5) (6)
Medium Term 0.063 0.062 0.057 0.095 0.078 0.090
(0.022) (0.023) (0.022) (0.023) (0.020) (0.025)
Long Term 0.110 0.097 0.084 0.128 0.073 0.109
(0.040) (0.044) (0.040) (0.053) (0.040) (0.054)
GDP Growth Rate (%) ‐‐ ‐‐ ‐0.022 ‐‐ ‐0.070 0.078
(Unemp. Rate in col. 6) (0.013) (0.019) (0.024)
Program Type (Base=Training)
Job Search Assistance ‐0.065 ‐0.105 ‐0.110 ‐0.149 ‐0.207 0.051
(0.039) (0.057) (0.055) (0.074) (0.062) (0.131)
Private Sector Job/Subsidy 0.066 0.064 0.043 0.038 ‐0.010 0.024
(0.055) (0.062) (0.062) (0.063) (0.054) (0.065)
Public Sector Employment ‐0.151 ‐0.149 ‐0.137 ‐0.199 ‐0.149 ‐0.208
(0.041) (0.057) (0.053) (0.065) (0.053) (0.056)
Sanctions/Threat ‐0.024 ‐0.093 ‐0.141 ‐0.250 ‐0.448 ‐0.286
(0.088) (0.070) (0.084) (0.088) (0.117) (0.136)
Intake Group (Base=Regular UI Recipients)
Disadvantaged 0.003 0.001 0.024 0.132 0.262 0.140
(0.043) (0.074) (0.073) (0.068) (0.086) (0.078)
Long Term Unemployed 0.190 0.245 0.237 0.284 0.279 0.242
(0.077) (0.081) (0.076) (0.080) (0.068) (0.080)
Gender Group (Base=Mixed)
Male 0.040 0.103 0.117 0.148 0.180 0.115
(0.043) (0.056) (0.055) (0.058) (0.051) (0.049)
Female 0.119 0.186 0.201 0.212 0.249 0.180
(0.050) (0.067) (0.067) (0.073) (0.068) (0.064)
Age Group (Base=Mixed)
Youth ‐0.076 ‐0.047 ‐0.047 ‐0.030 ‐0.100 ‐0.054
(0.045) (0.048) (0.050) (0.064) (0.056) (0.127)
Older Participants ‐0.103 ‐0.115 ‐0.130 ‐0.150 ‐0.202 ‐0.131
(0.041) (0.054) (0.054) (0.065) (0.053) (0.054)
Country Dummies No Yes Yes Yes Yes Yes
All Available Effect Size Estimates Denmark, France, Germany, and U.S. Only
Notes: standard errors, clustered by study, in parenthesis. Models in columns 1‐3 are fit to 352 program estimates from 83 studies, with mean of
dependent variable = 0.098. Models in columns 4‐5 are fit to 200 studies from Denmark, France, Germany, and the U.S. from 38 studies, with mean of
dependent variable = 0.089. Model in columns 6 is fit to 181 studies from same four countries from 34 studies, with mean of dependent variable = 0.093.

Appendix Figure 1: Distribution of Program Estimates by Country
224
258
313241
1158
26
42253
11212443
192659
125
424
12388
213
84
166
6612
813
57
0 25 50 75 100 125 150 175 200 225 250 275
ArgentinaAustraliaAustriaBelgium
BrazilBulgariaCanadaChina
ColombiaCzech
DenmarkDominican
EstoniaFinlandFrance
GermanyHungary
IndiaIrelandIsraelItaly
JordanKoreaLatvia
MalawiMexico
NetherlandsNZ
NicaraguaNorwayPanama
PeruPoland
PortugalRomania
RussiaSerbia
SlovakiaSlovenia
South AfricaSpain
Sri LankaSweden
SwitzerlandTurkey
UKUS
Number of Program Estimates
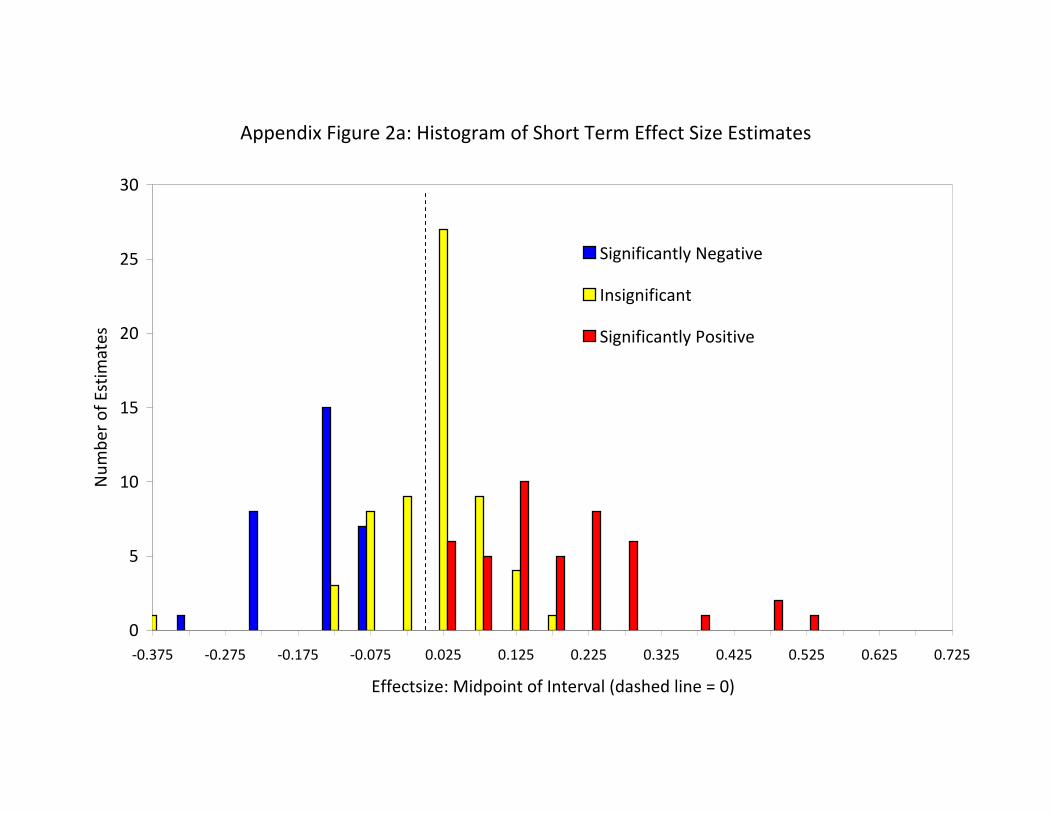
Appendix Figure 2a: Histogram of Short Term Effect Size Estimates
0
5
10
15
20
25
30
‐0.375 ‐0.275 ‐0.175 ‐0.075 0.025 0.125 0.225 0.325 0.425 0.525 0.625 0.725
Effectsize: Midpoint of Interval (dashed line = 0)
Number of Estimates
Significantly Negative
Insignificant
Significantly Positive

Appendix Figure 2b: Histogram of Medium Term Effect Size Estimates
0
5
10
15
20
25
30
‐0.375 ‐0.275 ‐0.175 ‐0.075 0.025 0.125 0.225 0.325 0.425 0.525 0.625 0.725
Effectsize: Midpoint of Interval (dashed line = 0)
Number of Estimates
Significantly Negative
Insignificant
Significantly Positive

Appendix Figure 2c: Histogram of Longer Term Effect Size Estimates
0
2
4
6
8
10
12
‐0.375 ‐0.275 ‐0.175 ‐0.075 0.025 0.125 0.225 0.325 0.425 0.525 0.625 0.725
Effectsize: Midpoint of Interval (dashed line = 0)
Number of Estimates
Significantly Negative
Insignificant
Significantly Positive

Appendix Figure 3: Effectsize Distributions Conditional on Sign/Significance ‐‐
Females vs. Other Participant Groups
0.00
0.10
0.20
0.30
0.40
0.50
0.60
0.70
<‐0.25 ‐0.25 /
‐0.20
‐0.20 /
‐0.15
‐0.15 /
‐0.10
‐0.10 /
‐0.05
‐0.05 /
0
0 /
0.05
0.05 /
0.10
0.10 /
0.15
0.15 /
0.20
0.20 /
0.25
0.25 /
0.30
0.30 /
0.35
0.35 /
0.40
0.40 /
0.45
0.45 /
0.50
0.50 +
Effectsize Range
Fraction
Males and Mixed Gender ‐ Sign. Negative Females ‐ Sign. Negative
Male and Mixed Gender‐ Insignficant Females ‐ Insignificant
Males and Mixed Gender ‐ Sign. Positive Females ‐ Sign. Positive

Appendix Table 1a: Transitions between Sign-‐ and Significance Categories, All Estimates
Short-‐term Estimates Significantly Positive Insignificant Significantly NegativeSignificantly Positive (N=80) 84 16 0Insignificant (N=95) 37 60 3Significantly Negative (N=50) 20 46 34
Short-‐term Estimates Significantly Positive Insignificant Significantly NegativeSignificantly Positive (N=39) 72 23 5Insignificant (N=39) 46 51 3Significantly Negative (N=22) 32 55 14
Medium-‐term Estimates Significantly Positive Insignificant Significantly NegativeSignificantly Positive (N=58) 88 10 2Insignificant (N=35) 14 83 3Significantly Negative (N=9) 22 33 44
Percent of Medium-‐term Estimates
Percent of Long-‐term Estimates
Percent of Long-‐term Estimates
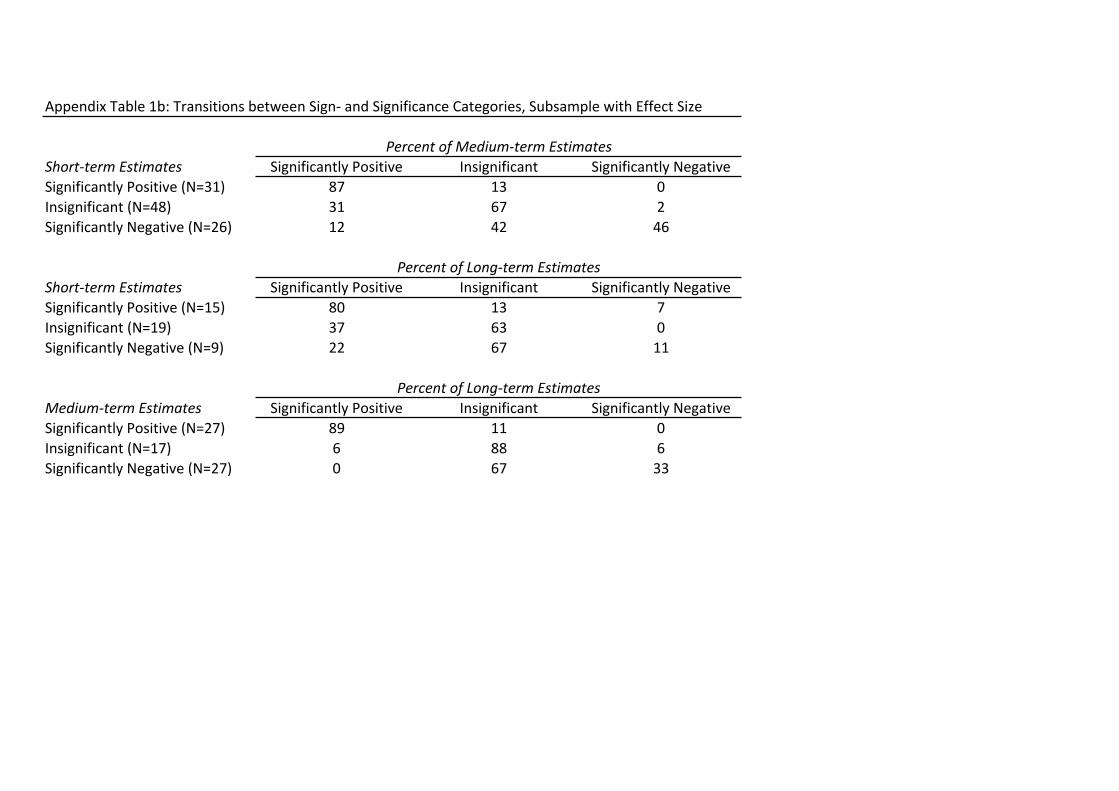
Appendix Table 1b: Transitions between Sign-‐ and Significance Categories, Subsample with Effect Size
Short-‐term Estimates Significantly Positive Insignificant Significantly NegativeSignificantly Positive (N=31) 87 13 0Insignificant (N=48) 31 67 2Significantly Negative (N=26) 12 42 46
Short-‐term Estimates Significantly Positive Insignificant Significantly NegativeSignificantly Positive (N=15) 80 13 7Insignificant (N=19) 37 63 0Significantly Negative (N=9) 22 67 11
Medium-‐term Estimates Significantly Positive Insignificant Significantly NegativeSignificantly Positive (N=27) 89 11 0Insignificant (N=17) 6 88 6Significantly Negative (N=27) 0 67 33
Percent of Medium-‐term Estimates
Percent of Long-‐term Estimates
Percent of Long-‐term Estimates

Appendix Table 2: Comparisons of Effect Size, Ordered Probit, and Probit Models
Effect Size Ordered Probit
(OLS) Sign/Significance Sign. Positive Sign. Negative
(1) (2) (3) (4)
Medium Term 0.056 0.489 0.429 ‐0.719
(0.021) (0.114) (0.137) (0.173)
Long Term 0.091 0.969 0.851 ‐1.365
(0.038) (0.221) (0.218) (0.437)
Program Type (Omitted = Training)
Job search Assist. ‐0.012 0.443 0.507 ‐0.531
(0.043) (0.436) (0.434) (0.528)
Private Subsidy 0.086 0.252 0.733 0.475
(0.057) (0.300) (0.314) (0.315)
Public Sector Emp. ‐0.152 ‐1.356 ‐1.239 1.349
(0.044) (0.287) (0.330) (0.335)
Other 0.007 0.550 0.987 0.595
(0.094) (0.542) (0.492) (0.628)
Age of Program Group (Omitted = Mixed)
Youths (<25) ‐0.062 ‐0.614 ‐0.643 1.052
(0.045) (0.282) (0.322) (0.499)
Older (>=25) ‐0.151 ‐0.735 ‐0.657 0.845
(0.044) (0.280) (0.272) (0.428)
Gender of Program Group (Omitted = Mixed)
Males only 0.029 ‐0.289 ‐0.591 ‐0.101
(0.049) (0.273) (0.310) (0.279)
Females only 0.107 0.043 ‐0.196 ‐0.476
(0.052) (0.251) (0.272) (0.315)
Country Group (Omitted = Nordic)
Germanic 0.107 1.033 1.043 ‐1.351
(0.073) (0.460) (0.498) (0.454)
Anglo ‐0.07 1.265 1.312 ‐‐
(0.081) (0.577) (0.625)
East Europe 0.04 0.615 0.644 ‐0.579
(0.072) (0.358) (0.447) (0.437)
Rest of Europe 0.019 0.825 0.909 ‐0.984
(0.060) (0.469) (0.560) (0.456)
Latin America ‐0.01 1.017 1.334 ‐1.075
(0.129) (0.826) (0.879) (1.170)
Remaining Countries 0.084 1.161 1.138 ‐‐
(0.091) (0.521) (0.618)
Type of Program Participant (Omitted = Registered Unemployed)
Disadvantaged 0.060 0.428 0.294 ‐0.990
(0.089) (0.618) (0.588) (1.022)
Long‐term Unemployed 0.217 0.436 0.481 ‐0.512
(0.076) (0.311) (0.325) (0.332)
Other Controls:
Program > 9 months ‐0.056 ‐0.599 ‐0.526 0.563
(0.042) (0.234) (0.265) (0.326)
Experiment ‐0.031 ‐0.312 ‐0.677 ‐0.950
(0.049) (0.330) (0.395) (0.461)
Square Root of Samplesize ‐0.039 0.471 0.796 0.817
(0.086) (0.689) (0.851) (0.719)
Published Article ‐0.056 ‐0.374 ‐0.41 0.328
(0.043) (0.252) (0.277) (0.298)
Citations Rank Index ‐0.003 ‐0.009 0.003 0.057
(0.004) (0.023) (0.024) (0.034)
Number of Observations 352 352 352 315
R Squared/ Log Likelihood 0.33 ‐288 ‐190 ‐92
Probit Models
Notes: Standard errors (clustered by study) in parentheses. Dependent variables are as follows: column (1) =estimated effect
size; column (2) = classification of sign and signficance of the program estimate; column (3) = indicator for significantly positive
program estimate; column (4) = indicator for significantly negative program estimate. Model in column (4) is estimated on
subset of 315 observations because of perfect predictability of responses for some observations.


![Meta R-CNN : Towards General Solver for Instance-level Low ... · meta 1. By replacing D meta with D novel, recent theories [1,23] present generalization bounds to the meta-learner,](https://img.dokumen.tips/doc/110x75/600d50a337188d64700e0aed/meta-r-cnn-towards-general-solver-for-instance-level-low-meta-1-by-replacing.jpg)