Embed Size (px)
Citation preview

What makes the French so unhappy?
The Role of Mentality and Culture
Claudia Senik
Paris School of Economics
OECD, July 6th

2
Beyond GDP … Happiness indicators
• Stiglitz-Sen-Fitoussi Commission (2009):
Measure Well-Being beyond GDP
Inter alia: use Happiness indicators as target for economic policy
• De facto: Important magnitude of country fixed-effects in
happiness estimates
• What is the composition of these fixed effects? Do governments
have leverage on them? What is the relevant sphere of
intervention?
• National cultures of happiness?
3
Income per Capita and Happiness: Country Differences
ESS data 2002-2008 (Happiness, 0-10 Scale) and Penn World Tables (GDP per capita)
4
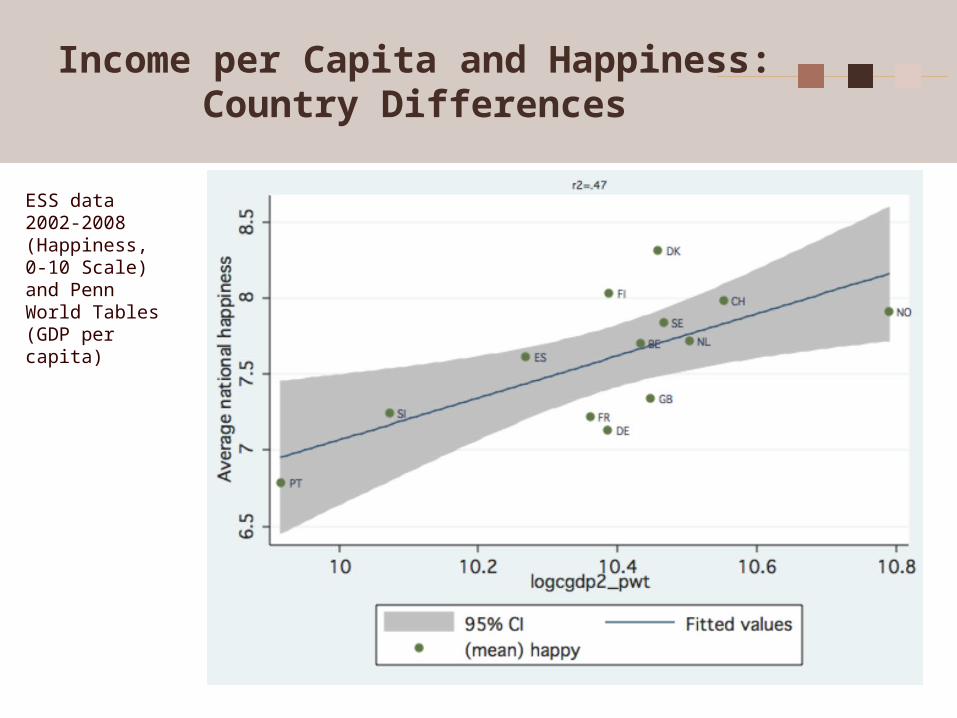
Cultural Clusters of Happiness
Source: Inglehart, Foa, Peterson, Welzel (2008), p.269
5
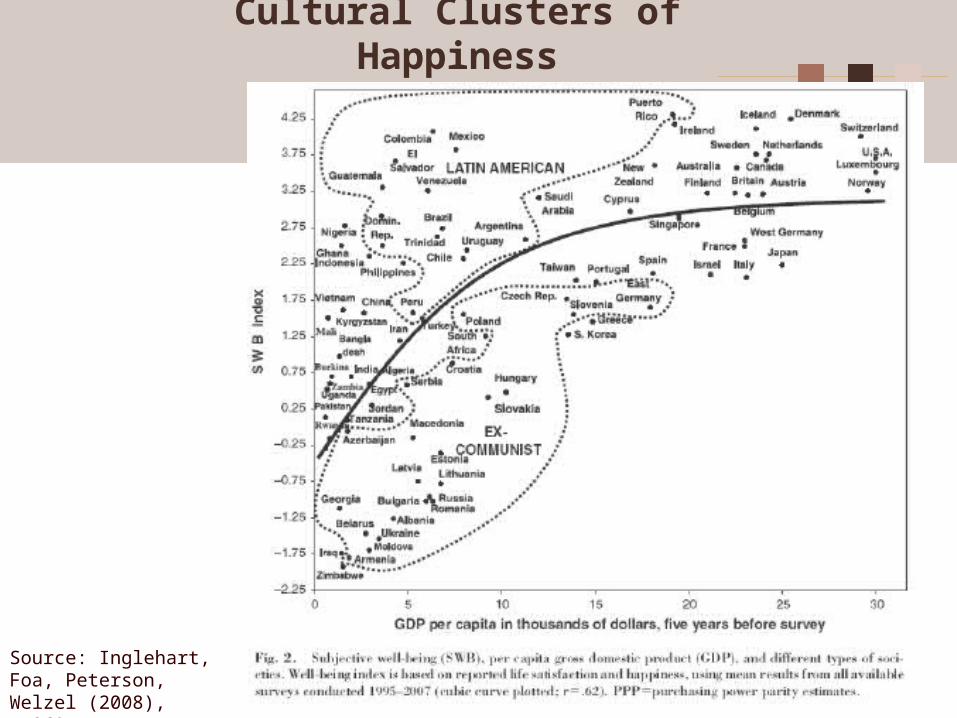
Average Happiness and the HDI (GDI = Income per head + Life Expectancy + Educational Attainment)
ESS data 2002-2008 (happiness 0-10 scale) and UNDP HDI

6
Cultural Differences Over Time
Life Satisfaction 0-4 scale

7
Cultural Differences Over Time
Life Satisfaction 0-10 scale

8
The Utility of Income is not the Same for all Countries
Life Satisfaction 0-10 scale

9
Estimates of Happiness and Country Fixed-Effects

10
What this paper does:
• Show evidence of the important role of Mentality and Culture in
Happiness
By decomposing country fixed effects
• Focus on the case of France as an illustration

11
Disentangle several possible factors explaining international heterogeneity in happiness:
External circumstances external institutions, regulations and general living conditions that inhabitants
of a country are confronted with
“Mentality”, defined as an internal, psychological idiosyncrasy set of specific attitudes, beliefs, ideals and ways of transforming events into
happiness that individuals engrain during their infancy and teenage in education and socialization instances such as school, firms and organizations
Persistent “Mentality” = Culture long-run persistent attitudes, beliefs and values that characterize groups of
people, following the terminology of (among others) Bisin and Verdier (2001, 2011), Fernandez and Fogli (2006, 2007, 2009), Fernandez (2008, 2011), Guiso et al. (2006), Algan et al. (2007, 2010).
Assume to start that these dimensions are separable (relax this assumption
later)

12
Empirical exercise
• European Social Survey of 13 different countries (ESS, waves 1 to 4;
2002-2008)
• I contrast the happiness of natives to that of immigrants of the first and
second generation in Europe.
For example, to the extent in which happiness is due to external
circumstances, the pattern of happiness of immigrants in Europe should be
the same as that of natives.

13
Assumptions:
• Circumstances of a country j are experienced by all its inhabitants
in the same way, independently of their geographical origin.
• Natives and 2nd generation immigrants of country j share the same
socialization experience, hence the same mentality.
• 1st generation immigrants have been socialized in a different
system.
• Immigrants of the first and second generation still share at least
part of the culture of their origin country k (k≠j ), while the natives of
country j share the culture of that country j.

14
Why Culture, why 2 generations?
• Cultural inertia as a stock that has the same value for immigrants
of the first and second general, and disappears after the second
generation.
• Cut-point imposed by the survey, which reports the origin of
individuals and of their parents, but not further.
• This convention probably correspond to the idea is that cultural
differences take time to dissipate (in the case of the culture of
origin) or to acquire (in the case of the culture of the destination
country), and vanishes after two generations.
15
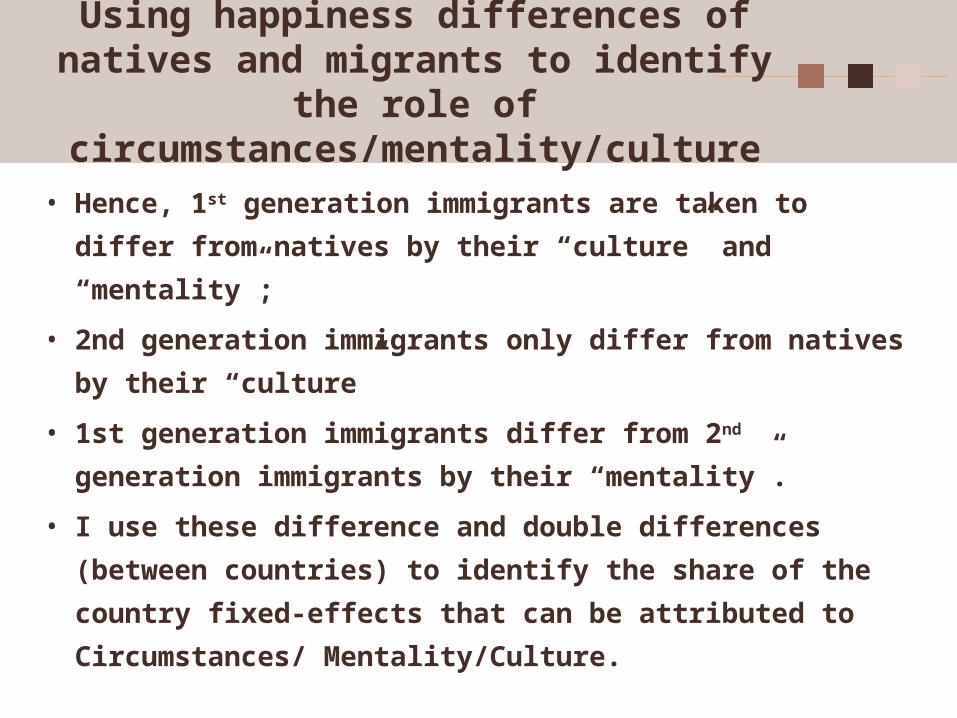
Using happiness differences of natives and migrants to identify the role of
circumstances/mentality/culture
• Hence, 1st generation immigrants are taken to differ from natives by
their “culture” and “mentality”;
• 2nd generation immigrants only differ from natives by their
“culture”
• 1st generation immigrants differ from 2nd generation immigrants by
their “mentality”.
• I use these difference and double differences (between countries)
to identify the share of the country fixed-effects that can be
attributed to Circumstances/ Mentality/Culture.

16
Estimation and Identification

17
These parameters measure the weight of Circumstances, Mentality and Culture in each country’s idiosyncratic happiness.

18
Focusing on the French mal-être
• France obtains high scores in negative dimensions of mental health, such as psychological
distress and mental disorders, as measured by the International Classification of Disease
(ICD10) or the American DSM IV (see Eugloreh, 2007).
• Exceptionally high consumption of psychotropes (especially anti-depression) by European
standards
See ESEMeD, a study of the general population, run in 2001-2003 over 21 425 individuals aged 18 and
over, see also CAS (2010).
• France is also one of the rare Western European countries where the prevalence of suicide as a
cause of death is higher than 13 for 100 000
it was of 16,3 for 100 000 inhabitants in 2007, i.e. 10 000 suicide deaths per year. This is much higher
than any of the “old European countries” except Finland (World Health Organization).
• In France, suicide is the second cause of mortality among the 15-44 years old (after road
accident), and the first cause among the 30-39 years old (CAS, 2010).
By contrast, the rate of suicide death is low in Italy, Portugal and Germany, as well as the consumption
of psychotropes.

19
Probit estimate of declaring oneself very happy (8-10 on a 0-10scale). Marginal effects of living in
country X rather than in France
Other controls: age, age square, gender, marital status, log(income), unemployed, year FE, cluster(country).
20
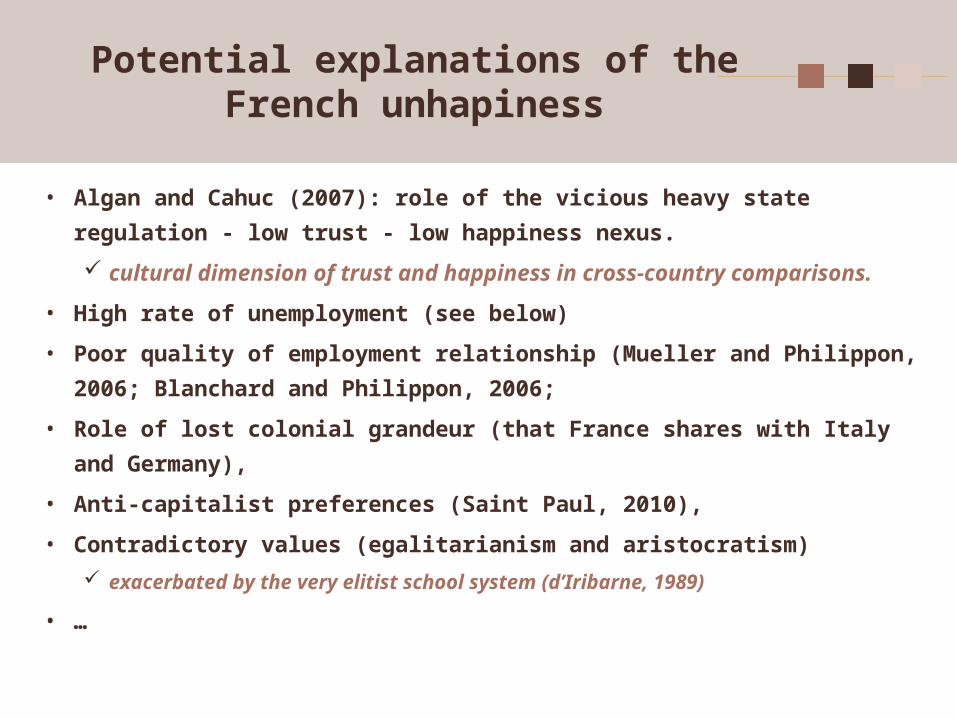
Potential explanations of the French unhapiness
• Algan and Cahuc (2007): role of the vicious heavy state regulation - low trust - low
happiness nexus.
cultural dimension of trust and happiness in cross-country comparisons.
• High rate of unemployment (see below)
• Poor quality of employment relationship (Mueller and Philippon, 2006; Blanchard and
Philippon, 2006;
• Role of lost colonial grandeur (that France shares with Italy and Germany),
• Anti-capitalist preferences (Saint Paul, 2010),
• Contradictory values (egalitarianism and aristocratism)
exacerbated by the very elitist school system (d’Iribarne, 1989)
• …
21
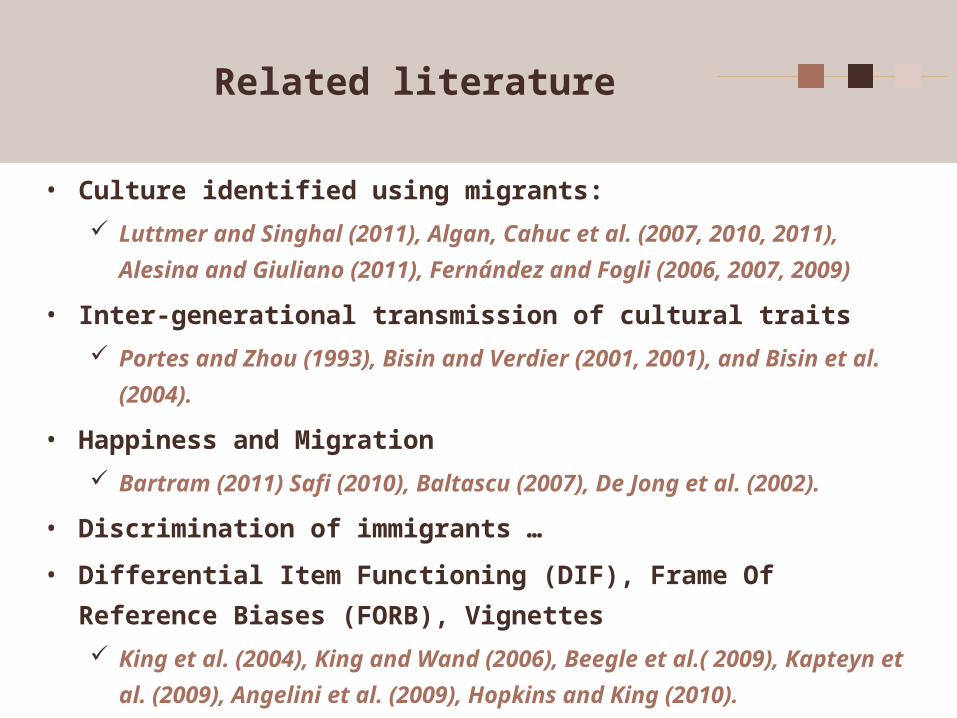
Related literature
• Culture identified using migrants:
Luttmer and Singhal (2011), Algan, Cahuc et al. (2007, 2010, 2011), Alesina and
Giuliano (2011), Fernández and Fogli (2006, 2007, 2009)
• Inter-generational transmission of cultural traits
Portes and Zhou (1993), Bisin and Verdier (2001, 2001), and Bisin et al. (2004).
• Happiness and Migration
Bartram (2011) Safi (2010), Baltascu (2007), De Jong et al. (2002).
• Discrimination of immigrants …
• Differential Item Functioning (DIF), Frame Of Reference Biases (FORB),
Vignettes
King et al. (2004), King and Wand (2006), Beegle et al.( 2009), Kapteyn et al. (2009),
Angelini et al. (2009), Hopkins and King (2010).

22
Data: European Social Survey, 4 waves: 2002-2008
• Regression sample:
Countries that are
present in the survey at
each wave: 13 countries
with about 1000
(Slovenia) to 2300
(Germany) observations
per wave.

23
Composition of migration flows to Europe
24
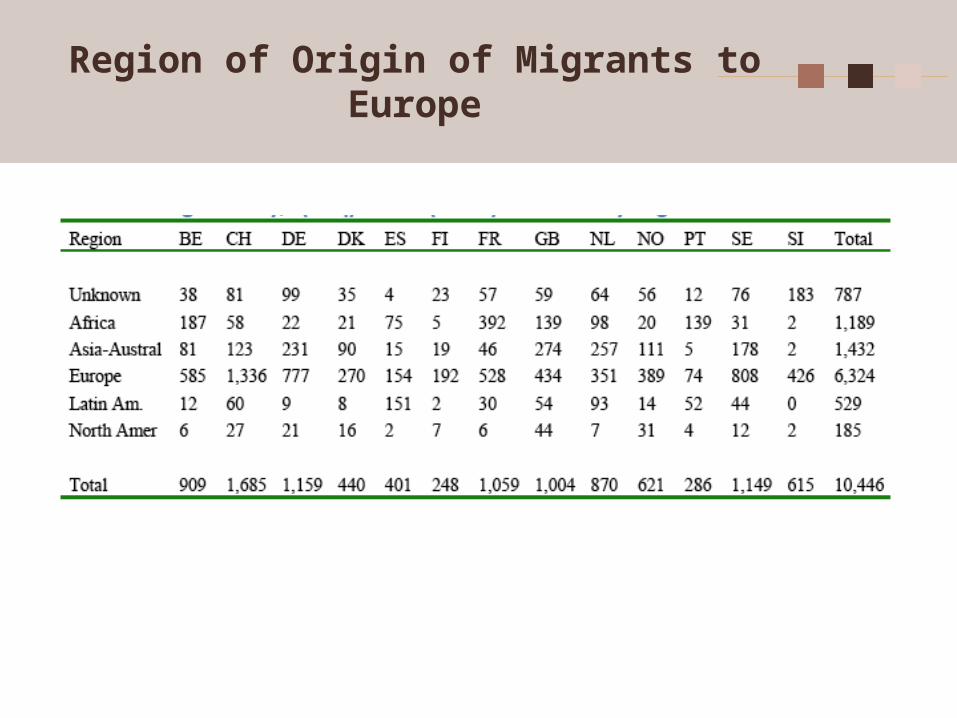
Region of Origin of Migrants to Europe

25
OLS Estimate of Happiness (0-10 scale)

26
Country Fixed-Effects by Migration Status
Whereas French natives score 22% lower on happiness than the average Europeans, first generation immigrants in France are in the average in terms of happiness. Second generation immigrants in France are about 19% lower than the average second generation immigrants.

27
Derivation of parameters based on the former estimates

28
Robustness
• Controlling for main effects and interactions of macroeconomic
circumstances with migration status does not alter the basic
findings (the structure of parameters)
• Share of government expenditure/GDP, national rate of
unemployment, GDP growth rate
• Migration status*country of destination
• Region of origin*country of destination
• Migration status*country of
destination*gender/age/income/unemployed/ transfer recipient

29
OLS Estimates of Happiness. Sub-
sample of 1st generation
immigrants.
Immigrants who went to school in France before the age of 10 are less
happy
Other controls: age, age square, income, unemployed, marital status, regions of origin, year fixed-effects. Cluster(country)

30
Probit estimate of happiness. Sub-sample of 1st generation immigrants
Other controls: age, age square, gender, log(income), marital status, unemployed, Region of origin, year fixed-effects. Cluster(country)
Immigrants who have lived in France for more than 20 years are less happy

31
French migrants are less happySub-sample of migrants from the 13 European countries of the ESS
OLS Estimate of Happiness
Other controls: age, age square, gender, log(income), marital status, unemployed, Region of origin, year fixed-effects. Cluster(country). Only waves 2-4 because no information about country of origin of immigrants in ESS wave 1.

32
Replicating Luttmer and Singhal (2010)OLS Estimates of Happiness
Sub-sample of migrants from countries of the ESS
The happiness level of immigrants is correlated with the average happiness of residents in their country of origin

33
Probit estimate to be very happy. Sample of residents in Belgium. Marginal effects displayed
French-speaking Belgians are less happy
34
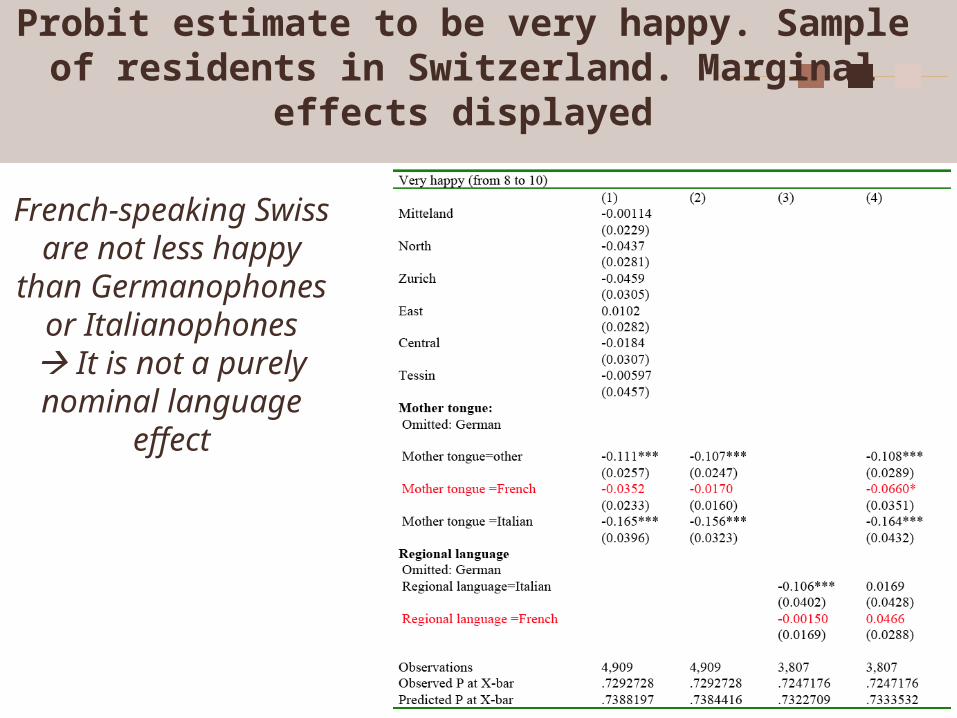
Probit estimate to be very happy. Sample of residents in Switzerland. Marginal effects displayed
French-speaking Swiss are not less happy than Germanophones or
Italianophones It is not a purely nominal
language effect