Embed Size (px)
Citation preview

1
WESTSIM : Groundwater conjunctive use, agricultural drainage and wetland return flow simulation on the west-side of the San Joaquin Basin
Nigel W.T. Quinn1and Jafar A. Faghih2 1Berkeley National Laboratory, Berkeley, CA, USA
2MWH Americas Inc. Sacramento, CA, USA [email protected]; [email protected]
Abstract WESTSIM is a detailed groundwater and surface water simulation model of the west-side of the San Joaquin Valley covering the entire federal service area. WESTSIM differs from previous regional groundwater models of the west-side of the San Joaquin Basin in its detailed depiction of irrigation hydrology, the use of a monthly time step to improve simulation of aquifer recharge and subsurface drainage and simulation of seasonally managed wetlands in the model domain. WESTSIM was the first application using the new IWFM model code, developed within California Department of Water Resources. WESTSIM results to date have demonstrated that the evapotranspiration (ET) values used in current hydrologic models of the west-side of the San Joaquin Basin are too high and fail to account for deficit irrigation practices on certain crops – it is impossible to produce realistic tile drainage estimates that match field data unless calculated ET values are reduced by up to 20%. A unique groundwater data management tool, named SHEDTOOL, which allows entry, storage, retrieval, and presentation of groundwater and surface water data, was enhanced to allow WESTSIM simulation results to be interpreted by a wide spectrum of stakeholders. Customized post-processing spreadsheet tools were also developed to elicit interaction with agency staff and water district managers. Background In early 2003 a model peer review of the Integrated Groundwater Surface Water Model (IGSM) code (Boyle Engineering Inc. 1990) by the California Water and Environmental Modeling Forum (CWEMF) revealed deficiencies in the code related to the linearization of the groundwater flow equations and the computation of subsurface tile drainage. An improved model code (IGSM2) was released publicly in early 2004 which addressed these and other deficiencies together with comprehensive theoretical documentation and a user manual. The model code was renamed IWFM (Integrated Water Flow Model) in September 2005 to reduce confusion with the original model code and subsequent improved versions of the original model code made by some of the original contributors to IGSM. The author of IWFM, Dr. Can Dogrul (DWR) was awarded the Fischer prize by CWEMF in 2003 for his work on the new model.
Table 1 – WESTSIM Model Characteristics
Characteristic Number Model Area 1,550,874 acres Subregions (Water Districts, Irrigation Districts, Cities, Refuges)
63
Elements 2,602 Groundwater Nodes 2,716 Crop Types 16 Aquifer Layers 7 Streams 11 Stream Nodes 351

2
The WESTSIM application of the IWFM model code uses finite element techniques to simulate the hydrologic cycle’s various components and how these components interact. The most important components are the stream/aquifer interaction, subsurface drainage simulation and soil moisture accounting. The model also simulates phenomena such as surface water reuse and seasonal wetland hydrology that have hitherto been ignored by regional groundwater models of the Basin. The model consists of 61 sub-regions that include both water districts and wildlife refuges (Table 1). The model is unique in its resolution at the water district level, the attention devoted to developing accurate land-use data and the graphical user interface and data management system Model applications The WESTSIM model was developed by U.S Bureau of Reclamation (Reclamation) for a number of applications that could not be addressed by existing regional groundwater models these applications included : 1. Impacts of reductions in contract water deliveries on aquifer subsidence.
The Central Valley Project (CVP)and State Water project (SWP) were authorized in the 1960’s to address pumping-induced aquifer subsidence throughout large areas within the western San Joaquin Valley. Surface water deliveries from the Delta began to reverse the rate of decline of pieziometric heads and helped to stabilize the irreversible decline in aquifer storage brought about by consolidation. The current regulatory climate and recent decline in annual snowpack storage have encouraged greater use of groundwater with the attendant increased risk of renewed subsidence. WESTSIM is being applied to determine the areas most vulnerable to subsidence impacts.
2. Increased competition for water – impacts to stream flow in the San Joaquin River
During dry and critically dry years flow in the San Joaquin River from east-side tributaries is significantly diminished and the role of groundwater contributions to the River becomes more important both in terms of the total flow volume at Vernalis and water quality. Low flows in the San Joaquin River create irrigation diversion problems in the South Delta due to insufficient head above the pumps, low flows through the Stockton Deep Water Ship Canal are the cause of low dissolved oxygen in the late summer. WESTSIM is being used to calculate the impact of groundwater conjunctive use on groundwater accretions to the San Joaquin River.
3. Climate change impacts on water supply reliability Climate change studies have suggested a trend of reduced annual Sierra snowpack, earlier snowmelt and increased winter season runoff due to increased atmospheric CO2 levels and warmer mean temperatures. WESTSIM and the basin-wide C2VSIM model (DWR) are being linked to CALSIM-II and CALSIM-III models to better understand the regional impacts of climate-induced changes in the hydrology of the San Joaquin Basin and resultant impacts on State and Federal water allocation. Since climate impacts affect the east-side tributaries and the east-side water districts that rely on river diversions as well as project water pumped from the Delta – WESTSIM shows the impacts on potential groundwater pumping patterns on the west-side of the San Joaquin Valley. Climate change will also impact the 180,000 acres of seasonal wetlands within the San Joaquin Valley. DWR is collaborating with Reclamation in improving the algorithms for both seasonal wetlands and rice hydrology (since they both require the ponding of water above the land surface). At the present time the Lake routine in IWFM is used to create wetland impoundments which are regulated using a weir structure that is simulated at the outlet of each Lake. A time series of weir elevations controls monthly surface drainage from each impoundment.
4. Technical assistance to water districts and refuges facing salt, boron and DO TMDL’s
Reclamation’s partner in WESTSIM development, MWH Americas Inc. (MWH), developed a spreadsheet post-processing tool, which works much like the MODFLOW zone-budget post-processor, and parses IWFM output from each simulation run into individual water district water budgets. The design of these water budget spreadsheets was development in partnership with two west-side water districts in order to convey the maximum of information in an intuitive format. These spreadsheets
3
have been used by managers within Reclamation’s Water Conservation Program to compare to water budgets required of Reclamation contactors as part of the Contract renewal process.
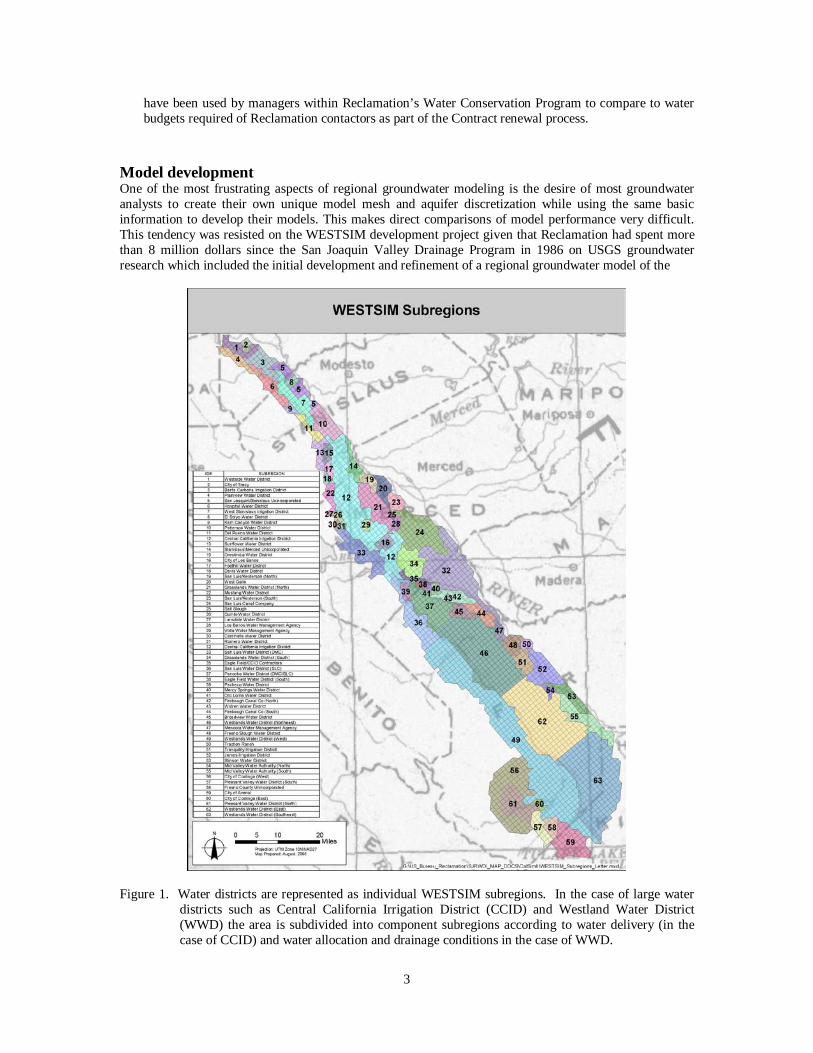
Model development One of the most frustrating aspects of regional groundwater modeling is the desire of most groundwater analysts to create their own unique model mesh and aquifer discretization while using the same basic information to develop their models. This makes direct comparisons of model performance very difficult. This tendency was resisted on the WESTSIM development project given that Reclamation had spent more than 8 million dollars since the San Joaquin Valley Drainage Program in 1986 on USGS groundwater research which included the initial development and refinement of a regional groundwater model of the
Figure 1. Water districts are represented as individual WESTSIM subregions. In the case of large water
districts such as Central California Irrigation District (CCID) and Westland Water District (WWD) the area is subdivided into component subregions according to water delivery (in the case of CCID) and water allocation and drainage conditions in the case of WWD.

4
south-west San Joaquin Basin (initially published by Belitz et al., 1991 and revised later by Brush et al., 2006). Reclamation determined that the USGS dataset was better than any other dataset for the area of common coverage. Reclamation’s resources during the development of WESTSIM were therefore applied to working collaboratively with the USGS improving and extending the existing model datasets (Brush et al, 2006). These included more attention to accurately representing water deliveries and diversions, improved accounting of crop acreage by water district which has led to more accurate estimates of crop evapotranspiration. WESTSIM has used the same six layer aquifer layering as used by the first update to the original Regional Groundwater Model (Belitz et. al.,1991) which divided the above-Corcoran aquifer into 5 distinct layers, (20ft, 50ft, and a ratio of 2:3:5 for the remainder of the semi-confined aquifer above the Corcoran Clay) with a single aquifer layer below the Corcoran Clay. In WESTSIM, a seventh aquifer layer was added to represent the Corcoran (Clay). IWFM simulates the hydraulic properties of both aquifers and aquitards whereas MODFLOW simulates only aquifers and uses an aquifer leakance parameter to describe flow between adjacent aquifers. WESTSIM used the same general alignment as the original Belitz et al (1991) model and has incorporated the texture based aquifer hydraulic properties first developed by Belitz and Phillips (1993) and later described in Brush et al. (2004) which were used in a revision to the original (Belitz et al, 1991) model. The alignment of the model to the north-east correctly follows the axis of the Basin and regional groundwater flow is roughly orthogonal to this alignment. Datasets for federal water deliveries, irrigation stream diversions, water district cropping and crop evapotranspiration were developed jointly and common datasets used in WESTSIM and the updated USGS south-western San Joaquin Basin model.
Figure 2. Aquifer texture-based hydraulic conductivity (white – highest) for the 7-layer WESTSIM model. WESTSIM crop-based water requirements One of the most significant features of WESTSIM has been its use of detailed water district crop data to improve monthly estimate of aquifer recharge and crop evapotranspiration. Crops were lumped into 19 proxy crop categories based on seasonal water requirements. These categories included fallow land and both seasonal and permanent wetland categories. Each proxy crop was assigned a mean monthly water

5
consumptive use estimate based on historic data. The proxy crop category was typically estimated by the crop grown most widely in the WESTSIM model domain. Because DWR and Reclamation have different crop categories – these were independently associated with the proxy crop categories. Data was obtained from Reclamation archives and directly from water districts. There were often discrepancies between the two estimates. Water districts provide Reclamation with provisional cropping estimates ahead of each growing season – these estimates can be changed at the time of planting. Although the Water Districts update their records this is not typically done within Reclamation – hence there can be errors in Reclamation database. Records for crops planted during the early 1970’s are very poor or non-existent from both Reclamation archives and local water districts. These data were estimated, where necessary using 5 year average cropping data or by emulating cropping trends from adjacent water districts. Every 5-7 years from the 1980’s onwards DWR has obtained remote sensing imagery and has developed cropping estimates on a 1 mile grid over the entire Central Valley. These data were used to verify the Reclamation and local water district data – these data were used preferentially for the year in which the surveys were taken if there were large discrepancies.
Figure 3. Cropping maps developed by DWR for the Central Valley on a 5-7 year cycle. Surface drainage – rivers and streams Surface drainage in the model study area is complex given the number of ways surface water can be intercepted as it flows across the Basin towards the San Joaquin River. In Westlands Water District (which has no drainage outlet) and in the Grasslands agricultural areas there has been a moratorium on surface drainage leaving each farm field since the late 1980’s (in the case of WWD) and since the Grassland Bypass Project, which commenced in 1996 (in the case of the Grasslands agricultural area). Tailwater is

6
typically collected in sumps located at the lowest corner of each field and returned to the head ditches for blending with surface water supply. The initial approach to determining surface drainage within the Basin utilized the Digital Elevation Model (DEM) data. A robot was developed within GIS which queried surrounding raster cells, within a defined search radius, finding the most likely flow path and the natural drainage of the region (Figure 4) based only on elevation data.
Figure 4. Euclidian point distance processing using a “robot” to determine likely surface drainage flow
paths. In WESTSIM every point in the watershed is connected to a river node. The Stream Characteristic File that was initially developed using this approach was subsequently modified after it was determined that this early termination of the west-side ephemeral streams, although physically accurate, caused problems with routing of the stream flow and with convergence of the groundwater model. Hence, each of the ephemeral stream reaches was extended to intersect the San Joaquin River, creating a more complete stream network. These extended reaches were assigned high streambed hydraulic conductivity to encourage the percolate into the groundwater, rather than contributing any significant amount of surface water to the San Joaquin River. Subsurface drainage Maps of subsurface tile drainage show the greatest density of drains in the vicinity of the west-side alluvial fans which extend eastwards from Little Panoche Creek, Panoche/Silver Creek, Cantua Creek, Salt Creek

7
and Los Gatos Creek on the west-side of the San Joaquin Valley. Only the alluvial fans of Panoche and Little Panoche Creek are underlain by tile drains (Figure 5) that discharge into sumps and through drainage canals into the san Joaquin River. One of the most valuable data sets that has been developed in the past decade has been the subsurface drainage monitoring database for the Grasslands agricultural area. Sumps were monitored for both flow and EC weekly in all seven participating water districts including Panoche, Pacheco, Broadview, Widren, Charleston, Firebaugh Canal and the Camp 13 portion of CCID. This data set has been invaluable in WESTSIM initial calibration and has helped to point out some possible flaws in the way ET is estimated for some west-side agricultural crops which results in lower than expected deep percolation rates within water districts in the Grasslands sub-basin and in WWD.
Figure 5. Subsurface tile drainage laterals in the Grasslands agricultural area and WWD as of 1990. Most
tile systems were installed in the 1960’s and 1970’s as a means of controlling soil salinity and to help reclaim soils to allow the cultivation of salt sensitive crops.
Model calibration WESTSIM model calibration is ongoing. Initial model calibration was completed in two phases : first water budget calibration, followed by groundwater level and streamflow calibration. The first phase was intended to ensure that the model was accurately simulating the key components of the groundwater basin's hydrologic water balance. This concept simply states that inflow minus outflow to the basin is equal to the change in storage within the groundwater basin. WESTSIM tracks the movement of all of the primary sources of water coming into and leaving the basin, including rainfall, streamflows, applied water, consumptive use, and subsurface inflows and outflows. The model output that is reviewed during this phase of calibration includes annual and monthly water budgets for groundwater, streamflow, soil moisture, and land and water use for the entire modeled area and selected subregions.

8
The water budgets developed for the project to encourage stakeholder review of the model have been especially useful in eliciting feedback from water district managers who would have difficulty digesting one of the typical IWFM output files but can relate to spreadsheet outputs such as water table rise/fall expressed in acre-ft/acre or drainage outflow summed for the entire water district in acre-ft/month. Figure 6 illustrates the water budget designed for stakeholder review.
Figure 6. Water budget spreadsheet customized for Reclamation Water Conservation Office use and to
elicit review by San Joaquin Basin water district managers. The preliminary water budget was further refined during the course of the study to take advantage of a revised hydraulic conductivity averaging algorithm applied to the USGS regional MODFLOW model of the southwest San Joaquin Basin. These revised hydraulic conductivity parameters, helped to improve the deep percolation of water – which was found to be insufficient to generate the required volumes of tile drainage. Secondly, the crop efficiencies, ET, soil moisture, specific yield, and porosity were all refined to better reflect physical conditions and to improve the overall water balance. Another model feature was to improve the representation of reuse water in WESTSIM – which required that changes be made to the IWFM code. Reuse of both surface and subsurface drainage water has become an important part of irrigation management since the late 1980’s and any model that attempts to realistically simulate irrigation hydrology needs to include this additional resource. In previous versions of IWFM, reuse water was

9
simply taken as a constant percentage of return flow. However, the eventual destination of this water was not clear in the original code. A clearer definition of irrigation reuse was developed and reuse was added as a time series variable allowing WESTSIM to simulate improvements in reuse technology over the 1970-2000 simulation period. Significant findings Significant findings to date include evidence that the crop coefficient-based ET estimates, commonly used in groundwater simulation models of the Basin, seem to over-predict evaporation losses by as much as 20%. This finding was confirmed through conversations with Jerry Robb (Westlands Water District) who has been reviewing ET estimates made using the SEBAL method within the District. The conclusions drawn from analysis of remotely sensed thermal data was that much of WWD was practicing deficit irrigation – essentially growing crops with lower volumes of water than the scientific literature suggests is needed. The WESTSIM finding, previously reported to DWR, was later confirmed by CH2M-Hill, who were tasked to calibrate the C2VSIM model. They discovered, what our team discovered during calibration – that the model generated insufficient deep percolation to allow the production of tile drainage. Current continuing model calibration is attempting to develop a deficit irrigation factor that can be applied in a consistent manner over the watershed to attempt to improve the model water balance. DWR has officially requested and received the current WESTSIM model and have made commitments to assist in further calibration efforts through the use of the PEST Inverse Modeling software. C2VSIM has undergone calibration using the same approach. The WESTSIM database has been extensively used in the development of the CALSIM III hydrology for the San Joaquin Basin. The mapping of drainage outflow from individual elements within each water district to the San Joaquin River has had great utility in reworking the more detailed CALSIM-III model network. Groundwater data management GUI WESTSIM model development was facilitated through the application of a unique groundwater data management tool, developed within MWH, named SHEDTOOL. SHEDTOOL recognizes that groundwater management depends on data accessibility and data sharing between models and analytical tools. SHEDTOOL is a stand-alone application, developed by Jonathan Goetz, which allows entry, storage, retrieval, and presentation of groundwater and surface water data, recognizing that groundwater data are generated in many forms, stored in various formats, and maintained by numerous private, local, state, and federal agencies. SHEDTOOL is being used by others such as the Sacramento Groundwater Authority to implement the objectives from its Groundwater Management Plan where the collected data is used to assess the progress of its various management projects and programs. Having the model interface with data analysis and storage, empirical relationships based on historical data can be used to develop, calibrate, and update groundwater models. Various improvements were made to the SHEDTOOL, such as the compiling of DWR, USGS, and Reclamation groundwater data in the region. Improved model interface features were added as well as other graphical data management tools. Also added was a “Z-Budget” Summary spreadsheet tool, that would display the output from DWR’s “Z-Budget” post-processor, in a graphical and tabular spreadsheet. These data were summarized in a way that were more user-friendly than the raw Z-Budget output, therefore they would be easier for water managers that were most concerned with the “bottom-line” and needed to make decisions based on the model’s recommendations, without having to sift through lines of data. This tool is useful for the user of the model as it provides a quick way to identify potential and obvious problems. Another analytical tool developed within SHEDTOOL is the Hydrograph Analysis Tool. This is a summary spreadsheet that can take actual groundwater elevation data stored in the SHEDTOOL and compare it against modeled groundwater elevations. This tool is essential for calibration and it brings together the main capabilities of SHEDTOOL, data management and model interface. The user is able

10
Figure 7. Representation of WESTSIM within SHEDTOOL. Native GIS within SHEDTOOL allows overlay of various parameter files as well as monitoring well locations.
Figure 8. Time series plot of 30 years of Salt Slough flow and stage data as depicted within SHEDTOOL.

11
Figure 9. Use of SHEDTOOL Hydrograph Analysis Tool for both single hydrograph and multiple
hydrograph analysis. This allows the statistical performance of the model to be plotted against historical data.
view individual hydrographs of groundwater elevations as well as comparing the statistical performance of the model versus the historical data. The model user can see if the model is performing within “acceptable” standards. Summary The WESTSIM model was developed to address a need within Reclamation to recognize the increasing importance of groundwater conjunctive use in meeting agricultural, wetland and municipal contract water supply requirements. Although WESTSIM is a water quantity model – developing a quantitative understanding of groundwater flow and water balance is a precursor to any comprehensive model of surface and groundwater quality. Water quality is becoming increasingly important constraint to all reclamation planning decisions in the State of California. Accomplishments to date of the WESTSIM development initiative include :
• WESTSIM simulations and water balance analyses suggest that evapotranspiration estimates within current water allocations and groundwater simulation models is too high leading to lower computed deep percolation beneath irrigated land on the Westside – particularly in the Grasslands
Hydrograph calibration
Difference – (model vs actual) histogram
Difference -histogram for all hydrographs

12
agricultural area and Westlands Water District and unrealistically low subsurface drainage volumes.
• The SHEDTOOL application was completed with WESTSIM to improve Reclamation’s
management of well log, water level and water quality data and allow more rapid processing of the data necessary for modeling purposes. The water balance post-processor was developed to be consistent with the format used by the Water Conservation Office - providing the Water Conservation Office with an enhanced tool for evaluating water district-level water conservation programs.
• Private wetlands are being considered for the first time in any west-side groundwater model as
distinct sub-regions within the WESTSIM model. Inclusion of wetlands results in a more realistic simulation of San Joaquin Basin hydrology and improves the simulation of stream-aquifer interactions and groundwater contribution to the San Joaquin River. A steady-state monthly wetland operations spreadsheet model (WETMANSIM) was developed and used to provide target hydrology for WESTSIM. The current WESTSIM model treats wetlands as small lakes – future work will add more control of wetland levels to better simulate wetland operations and allow year-to-year changes in wetland operations to be simulated.
• The new hydrology for CALSIM is utilizing WESTSIM hydrology. WESTSIM has established the drainage flow paths to the San Joaquin River which has allowed correct assignment of drainage flows to the new CALSIM nodes for the San Joaquin Basin. The new CALSIM hydrology has incorporated WETMANSIM to simulate wetlands in the San Joaquin Basin. It is envisaged that in the next hydrology upgrade of CALSIM output from WESTSIM will be used to replace the code based on WETMANSIM.
• Reclamation was invited to make a presentation on WESTSIM at the annual conference of the California Groundwater Association.
References Belitz, K. 1990. Character and evolution of the ground water flow system in the central part of the western San Joaquin Valley, California. United States Geological Survey, Water Supply Paper, 2348, 28 p.
Belitz, K. and S.P. Phillips. 1993. Simulation of water table response to management alternatives, central part of the western San Joaquin Valley, California, United States Geological Survey, Water Resources Investigation Report, 91-4193, 41 p.
Belitz, K., S.P. Phillips and J.M. Gronberg. 1991. Numerical Simulation of Groundwater Flow in the Central Part of the Western San Joaquin Valley, California, United States Geological Survey Open File Rept., 91-535, 71 p.
Brush, C.F., K. Belitz, and S.P. Phillips, 2004, Estimation of a water budget for 1972-2000 for the Grasslands Area, central part of the western San Joaquin Valley, California: U.S. Geological Survey Scientific Investigations Report 2004–5180, 51 p
Brush C.F., K. Belitz, S.P. Phillips, K.R. Burow, and D.L. Knifong. 2006. MODGRASS: Update of a Ground-Water Flow Model for the Central Part of the Western San Joaquin Valley, California
California Department of Water Resources. 1976 – 1990. Crop Water Use Reports for the Southern San Joaquin Valley.
Fio, J.L. and S.J. Deverel, 1991. Groundwater flow and solute movement to drain laterals, Western San Joaquin Valley, California, 2. Quantitative hydrologic assessment, Water Resources Research, 27 (9), 2247-2257
Narasimhan, T.N. and N.W.T Quinn. 1996. Agriculture, Irrigation and Drainage on the West Side of the San Joaquin Valley, California: Unified Perspective on Hydrogeology, Geochemistry and Management. Earth Sciences Division. Lawrence Berkeley National Laboratory. Topical Report No. 38498.

13
Quinn N.W.T. 1990a. Assessment of ground water pumping as a management option in drainage problem areas of the western San Joaquin Valley. Technical Information Record. August. San Joaquin Valley Drainage Program, Sacramento, CA 95825.
Quinn N.W.T. 1990b. Analysis of the long-term sustainability of water quality for irrigation from pumping wells used to manage high saline water tables. Technical Information Record. San Joaquin Valley Drainage Program, Sacramento, CA 95825.
Quinn N.W.T and D.G. Swain. 1990. San Joaquin Valley Hydrologic and Salt Load Budgets. Technical Information Record. San Joaquin Valley Drainage Program, Sacramento, CA 95825.
Quinn N.W.T. 2008. Sustainability of long-term groundwater conjunctive use pumping on the west-side of the San Joaquin Basin. UC Salinity Drainage Task Force Annual Meeting, Sacramento, CA . Mar. 26, 2008.
US Geological Survey. 1969. Ground-water pumpage on the west side of the San Joaquin Valley, California, 1962-66. By William Ogilbee and Maxine A. Rose. Water Resources Division, Menlo Park, California. Geological Survey.
US Geological Survey. 1975. Land Subsidence due to ground-water withdrawal in the Los Banos-Kettleman City area, California, Part 1. Changes in the hydrologic environment conducive to subsidence. Geological Survey Professional Paper 437-E. Government Printing Office.
US Geological Survey. 1975. Land subsidence due to ground-water withdrawal in the Los Banos-Kettleman City area, California, Part 2. Subsidence and compaction of deposits. Geological Survey Professional Paper 437-F. Government Printing Office.
US Geological Survey. 1975. Land subsidence due to ground-water withdrawal in the Los Banos-Kettleman City area, California, Part 3. Interrelations of water-level change, change in aquifer-system thickness, and subsidence. By William B. Bull and Joseph F. Poland. Geological Survey Professional Paper 437-G. Government Printing Office.