Embed Size (px)
Citation preview
RESULTS OF MONITORING SHALLOWGROUNDWATER IN MISSOURI FOR
FOUR AGRICULTURAL PESTICIDES,2001 - 2006
FINAL REPORT
State Fiscal Year 2006
Prepared byScotty D. Baumgartner, Hydrologist
Missouri Department of Natural ResourcesWater Resources Center
July 2006
Prepared forThe Missouri Department of Agriculture
Division of Plant IndustriesAnd
The United States Environmental Protection AgencyRegion VII-Water, Wetlands and Pesticides Division
Department of Natural ResourcesPO Box 176
Jefferson City, Missouri 65102-0176

Final Report to U.S.EPA Region VIIMissouri Department of Natural Resources - Water Resources Center
i
TABLE OF CONTENTS
INTRODUCTION ........................................................................................................................1Purpose and Scope ..................................................................................................................2Location ..................................................................................................................................2Agricultural Pesticide Use ......................................................................................................6
METHODS OF STUDY...............................................................................................................6Monitoring Point Selection.....................................................................................................8Water Sample Collection ......................................................................................................10Quality Assurance and Quality Control................................................................................11Laboratory Analyses for Pesticides ......................................................................................11
RESULTS AND DISCUSSION.................................................................................................11
SUMMARY AND CONCLUSIONS .........................................................................................13
ACKNOWLEGMENTS .............................................................................................................14
REFERENCES ...........................................................................................................................15
APPENDIX 1..............................................................................................................................17
FIGURES
Figure 1 .........................................................................................................................................3Figure 2 .........................................................................................................................................4Figure 3 .........................................................................................................................................7Figure 4 .........................................................................................................................................9Figure 5 .......................................................................................................................................14
TABLES
Table 1 ..........................................................................................................................................5Table 2 ..........................................................................................................................................6Table 3 ..........................................................................................................................................8Table 4 ........................................................................................................................................11

Final Report to U.S.EPA Region VIIMissouri Department of Natural Resources - Water Resources Center
1
INTRODUCTION
In recent years, pesticides in the environment and human exposure to pesticides have received anincrease in government and public attention. In response, both the federal Safe Drinking Water Actenacted in 1974 and the Food Quality Protection Act enacted in 1996 include measures to study andmitigate human exposure to pesticides in drinking water derived from surface water and groundwatersources.
In Missouri, groundwater is the source of drinking water for approximately 42 percent of thepopulation. Thirty-two percent of the drinking water supplied by public water systems and almost 100percent of the self-supplied domestic drinking water is obtained from groundwater sources (Hutsonand others, 2005). Much of the self-supplied drinking water is provided by shallow private wells thatare located in agricultural areas.
The most vulnerable areas of the state, such as the southeastern lowlands (Bootheel) and along majorrivers and streams, are characterized by permeable surficial and subsurface materials, a shallow watertable within 20 feet of the land surface, and intense row-crop agriculture. These factors are conducivefor contaminant migration into the groundwater. However, previous investigations of Missouri’sgroundwater by the Missouri Department of Natural Resources, Missouri Department of Health, U.S.Geological Survey (USGS), and University of Missouri-Columbia have shown that pesticides arepresent in groundwater in areas with relatively impermeable surficial and subsurface materials(Sievers and Fulhage, 1992; Wilkison and Maley, 1994; Bell and others, 1996; and Kolpin and others,1993.
In 1991, the U.S. Environmental Protection Agency (EPA) proposed a groundwater strategy inresponse to detections of commonly used corn and soybean pesticides in the nation’s groundwater. InJune 1996, as part of the strategy, the EPA published the proposed rule “Pesticides and Ground WaterState Management Plan.” This proposed rule implements a key component of the Agency’s 1991“Pesticides and Ground Water Strategy”. Through the development and use of State and TribalPesticide Management Plans (PMPs), the EPA proposed to restrict the use of certain pesticides byproviding States with the flexibility to protect groundwater in the most appropriate way for localconditions. A PMP outlines, in detail, how a state will manage a given pesticide such that its use willnot cause an unreasonable impact on groundwater. There are two types of PMPs: generic andspecific. Since 1990, the EPA has provided funds to States to help develop “generic” PMPs. The“generic” PMPs are designed to help States and Tribes prepare for the development of “specific”PMPs by providing basic, generalized information for each of the twelve components required in aSpecific Pesticide Management Plan (SPMP).
Pesticide is a general term used to describe chemicals used to control pests and includes herbicides,insecticides, and fungicides. Specifically, herbicides are used to control weeds, insecticides are used tocontrol insects, and fungicides are used to control fungi. The EPA designated the triazine herbicidesatrazine, simazine, cyanazine, and the acetanilide herbicides alachlor and metolachlor as the first fivepesticides that would require a SPMP. Cyanazine was removed from the list because the manufacturerannounced plans to cancel the product by the year 2002. All five of these herbicides are used primarilyfor weed control on agricultural crops. The EPA determined that without proper management thisgroup of herbicides posed a significant risk of groundwater contamination.

Final Report to U.S.EPA Region VIIMissouri Department of Natural Resources - Water Resources Center
2
The Missouri Department of Agriculture (MDA) is responsible for the regulation of pesticides inthe State of Missouri and has been designated by the EPA to coordinate the development of aSPMP for Missouri. The MDA submitted a generic PMP to, and received concurrence from, theEPA Region VII. In 1999, MDA began developing SPMPs for five pesticides (the currentspecific pesticides plus cyanazine) that the proposed rule indicated would require an SPMP. TheMDA, with assistance from the Missouri Department of Natural Resources’ Water ResourcesCenter (WRC), developed and submitted to the EPA Region VII the Monitoring Component(Baumgartner and Brookshire, 2001) of the SPMP for the current specific pesticides. Inanticipation of the EPA adopting the proposed SPMP rule as federal regulation in the future, theMDA in cooperation with the department began to monitor shallow groundwater for the currentspecific pesticides in the spring of 2002 (Baumgartner, 2002; Baumgartner, 2003; Baumgartner,2004; Baumgartner, 2005). This report summarizes the results of monitoring shallowgroundwater in Missouri for the specific pesticides over the past five years.
Purpose and Scope
The purpose of this project is to determine if agricultural pesticides are present in Missouri’sgroundwater. If present, this report will describe which pesticides were detected, where theywere detected, and at what concentrations they were detected. The data collected for anddiscussed in this report is intended to provide information necessary to develop and implementan effective statewide pesticide management plan.
The groundwater monitoring data presented in this report were collected from February 20, 2002through June 6, 2006. Monitoring focused primarily on the distribution and occurrence ofatrazine, simazine, alachlor, and metolachlor. These herbicides are used primarily on corn, butare also used on grain sorghum, soybeans, and for other purposes. The frequencies of detection,concentration, and spatial distribution of these herbicides are shown in this report. The analyticalmethod used to detect these herbicides also detects the presence of four additional pesticides.The four additional pesticides are cyanazine, metribuzin, propachlor, and butachlor. Data sets areavailable for these four pesticides; however, the data is not presented in this report.
The information and data in this report is intended to be a screening tool to identify areas in thestate where pesticides have entered the groundwater system as a result of normal field usage.Data presented in this report are not solely adequate, nor intended, to evaluate the state’sgroundwater with respect to federal and state drinking water or other human health standards.Groundwater from wells used as potable supplies (private or public) must still be tested todetermine if they meet drinking water and human health standards.
Location
The study area for this report includes the seventy-six counties shown in Figure 1. Shallowgroundwater in these counties is vulnerable to contamination from pesticide usage (Baumgartnerand Brookshire, 2001). This study focuses on aquifers near the surface that are sensitive tosurface activities. Several different aquifer types underlie the area of investigation. The

Final Report to U.S.EPA Region VIIMissouri Department of Natural Resources - Water Resources Center
3
0 20 40 Miles
N
Texas
Dent
Pike
Bates
Barry
Linn
Polk
Ray
Iron
Howell
Cass
Ozark
Henry
Saline
Pettis
Macon
Butler
Holt
Franklin
Vernon
Shannon
Miller
Wayne
Adair
Boone
Benton
Oregon
Carroll
Taney
StClair
Wright
Ripley
Knox
Douglas
Phelps
Johnson
Laclede
Clark
Ralls
Jasper
Dade
Nodaway
Callaway
Osage
Clay
Stoddard
Perry
Greene
Chariton
Barton
Audrain
Lincoln
Lewis
MonroeReynolds
Sto
ne
Dallas
Cole
Harrison
Camden
Scott
Newton
Sullivan
Cedar
Cra
wfo
rd
Carter
Morgan
Maries
Cooper
Pulaski
Jackson
Platte
Shelby
Gentry
Dun
klin
Jefferson
Bol
linge
r
Daviess
StLouis
Web
ster
Lafayette
PutnamMercer
Marion
Wash-ington
Christian
Atchison
Lawren
ce
NewMadrid
Howard
Clinton
StCharle
s
Grundy
Madison
Warren
DeKalbAndrew
Pem
isco
t
Hickory
McDonald
Living- ston
Ran-dolph
Caldwell
Scot-land
Gas
cona
de
Mon
iteau
Mont-gomery
Worth
StFrancois
Buch-anan
C
ape
Girardea
u
SteGenevieve
Schu- yler
Missis-sippi
Figure 1. Location of study area shaded gray.
Missouri Aquifer Classification Map (Miller and others, 1994) is shown in Figure 2. This mapclassifies the various aquifers in the state based on their susceptibility to contamination. Threeaquifer areas, with subdivisions, are delineated using the hydrologic and geologic parameters ofthe surficial materials, shallow bedrock, recharge potential for the aquifers, presence or absenceof an aquaclude, and the natural or existing groundwater quality. These major areas aredesignated by Roman numerals I, II, and III. Area I has the highest vulnerability or potential forcontamination and area III has the lowest. Alphabetic designations are used to identify thesubdivisions within each major area. A fourth aquifer area (IV) is shown in Figure 2, however, itis an undifferentiated area of aquifer types IB and IIID. See Appendix I of Baumgartner andBrookshire (2001) for a complete description of the aquifer areas. Table 1 presents a briefdescription of the geologic formations and their hydrologic characteristics.

Final Report to U.S.EPA Region VIIMissouri Department of Natural Resources - Water Resources Center
4
0 20 40 Miles
N
Texas
Dent
Pike
Bates
Barry
Linn
Polk
Ray
Iron
Howell
Cass
Ozark
Henry
Saline
Pettis
Macon
Butler
Holt
Franklin
Vernon
Shannon
Miller
Wayne
Adair
Boone
Benton
Oregon
Carroll
Taney
StClair
Wright
Ripley
Knox
Douglas
Phelps
Johnson
Laclede
Clark
Ralls
Jasper
Dade
Nodaway
Callaway
Osage
Clay
Stoddard
Perry
Greene
Chariton
Barton
Audrain
Lincoln
Lewis
Monroe
Reynolds
Sto
ne
Dallas
Cole
Harrison
Camden
Scott
Newton
Sullivan
Cedar
Cra
wfo
rd
Carter
Morgan
Maries
Cooper
Pulask
i
Jackson
Platte
Shelby
Gentry
Dun
klin
Jefferson
Bol
linge
r
Daviess
StLouis
Web
ster
Lafayette
PutnamMercer
Marion
Wash-ington
Christian
Atchison
Lawrenc
e
NewMadrid
Howard
Clinton
StCharl
es
Grundy
Madiso
n
Warren
DeKalbAndrew
Pem
isco
t
Hickory
McDonald
Living- ston
Ran-dolph
Caldwell
Scot-land
Gas
cona
de
Mon
iteau
Mont-gomery
Worth
StFrancois
Buch-anan
C
ape
Girarde
au
SteGenevieve
Schu- yler
Missis-sippi
Aquifer Area IV1B/3D Undifferentiated
Aquifer Area III3A-Glacial Drif t (sands < 25')3B-Glacial Drif t (sand 25'-100')3C-Glacial Drift (sand >100')3D-Glacial Drift Undifferentiated
Aquifer Area II2A-Pennsylvanian
Aquifer Area I1A-Cambro-Ordovician1B-Mississippian1C-Precambrian-Cambrian1D-Quaternary1E-Tertiary-Cretaceous1F-Paleozoic Undifferentiated
County Boundary
Legend
Figure 2. Missouri Aquifer Classification Map

Final Report to U.S.EPA Region VIIMissouri Department of Natural Resources - Water Resources Center
5
System Group or Formation Lithology Hydrology
Alluvium Clay, silt, sand and gravelMissouri and Mississippi River alluvium yields >1000
gpm. Southeastern lowland alluvium can yield up to 3000gpm.Quaternary
Glacial drift and preglacialvalley fill
Mixture of clay, silt, sand,gravel to boulder material
3-50 gpm available where clean, permeable sand andgravel is present. Preglacial valley alluvium may yield as
much as 500 gpm
Wilcox Sand, some clay. Containsthin beds of lignite. A major aquifer used mainly for municipal supply.
Porter’s Creek Clay Clay, light gray when dry,dark gray when wet.Tertiary
Clayton FormationCalcareous, glauconitic sand
& clay to fossiliferouslimestone.
Does not yield significant quantities of water to wells.Act as barriers to groundwater movement.
Owl Creek Formation Bluish-gray to brown sandyclay. Generally impedes groundwater flow.
Cretaceous McNairy Formation(Ripley Sand) Sand, sandy clay, and clay. A significant aquifer widely used for municipal supplies.
Kansas City GroupMassive limestone formations
with intervening shaleformations.
Small amounts of water (1-3 gpm) available fromlimestone near the outcrop line.
Pleasanton Group
Thick clastic shale with abasal siltstone or very fine-grained sandstone. Locally,
there are two other thickchannel sandstones in the
upper half.
Marmaton Group
Fewer sandstone bodies thanpreceeding group, with morethin limestone and thick shale
sequences.
Not considered to be water bearing. Locally, may yieldvery small amounts of water from sandstone beds. Water
may be poor in quality.Pennsylvanian
Cherokee Group and KrebsSubgroup
Thin sandstones and siltstoneswith intervening shales. The
shales locally have coalseams. Thin limestone beds
occur at widely scatteredintervals.
May yield small amounts of water from sandstones (3-20gpm). Water may be poor in quality.
Ste. Genevieve, St. Louis,Salem, Warsaw
FormationsLimestone and shale May yield 5-10 gpm where units are not deeply buried.
Mississippian Burlington –KeokukLimestone, Elsey/Reeds
Spring Formations, PiersonLimestone
Limestone and chertylimestone
Yield small amounts of water to wells locally. Innortheast, may contain highly mineralized water if deeply
buried.
Kimmswick, DecorahGroup, Plattin, and
Joachim.
Dolomite, limestone, andshale.
Kimmswick yields generally adequate for domesticsupplies. 5-10 gpm.
St. Peter Sandstone Sandstone and dolomite Good production for domestic, farm and small industry.25-75 gpmOrdovician
Powell, Cotter, JeffersonCity, and Roubidoux
Dolomite, chert, andsandstone
Produces sufficient water locally for domestic and farmuse. Up to 25 gpm.
Paleozoic Era(not a system)
Limestone, sandstone, anddolomite
Used for domestic supplies and municipal supplies whenclose to the Ozarks.
Table 1. Geologic formations in the areas monitored.(modified from Vandike, 1997).

Final Report to U.S.EPA Region VIIMissouri Department of Natural Resources - Water Resources Center
6
Agricultural Pesticide Use
Corn and soybeans are the dominant row-crops grown in Missouri and are especially importantto the northern and southeastern portions of the state. The Bootheel is the most intensivelycropped region of the state due to its high percentage of tillable, level land, long growing seasonand abundant irrigation water. Nationally, Missouri ranks seventh in soybean production, fifth ingrain sorghum production, and ninth in corn production (Missouri Agricultural Statistics Service(MASS, 2004). In 2003, approximately 41 percent (18,178,200 acres) of Missouri’s total landarea (44,594,262 acres) was used for crop production. About 27 percent (4,950,000 acres) ofthose acres used for crop production were planted with soybeans, about 16 percent (2,880,000acres) were planted in corn, and only 1 percent (210,000) was used for grain sorghum (MASS,2004).
All of the current specific pesticides are herbicides used to control grass and broadleaf weeds.According to National Agricultural Statistics Service (NASS) estimates of chemical usage forcrop years 2003 and 2004, all four specific pesticides were used on corn , three (atrazine,alachlor, and metolachlor) of the four specific pesticides were used on sorghum, and none of thefour specific pesticides were used on soybeans. Since all of the specific pesticides are used oncorn and there is much more acreage in corn production than sorghum production, cornproduction by county was used to determine where to monitor groundwater for the specificpesticides. Table 2 shows the percentage of land area planted in corn that received an applicationof one or more of the specific herbicides.
HerbicideName
Percent of CornCrop Applied in
2003Atrazine 89
Alachlor 5
Metolachlor 15
Simazine 3
Table 2. Percentage of corn crop applied with each specific pesticide.
Ninety-nine percent (3,057,000 acres) of the corn grown in Missouri during 2005 was planted inthe seventy-six counties that comprise the study area (MASS, 2004). Figure 3 shows thedistribution of corn production by county.

Final Report to U.S.EPA Region VIIMissouri Department of Natural Resources - Water Resources Center
7
0 20 40 Miles
N
Corn Acreage in County0 - 55005501 - 2000020001 - 4900049001 - 137400
Legend
Figure 3. Distribution of corn production by county.
METHODS OF STUDY
The goal of the monitoring network design is to determine whether or not agricultural pesticidesare impacting the quality of shallow groundwater. To make maximum use of resources, areas ofthe state were selected where agricultural pesticides are used most and where hydrogeologyindicates shallow groundwater is sensitive to surface activities. The approach used to achieve thisgoal was to first identify areas in the state where groundwater should be most vulnerable tocontamination from usage of the four specific pesticides. This assessment was completed inJanuary 2001 by the department and is titled “A Plan for Monitoring Pesticides in MissouriGroundwater.” In this assessment, a numerical rating was assigned to the four Aquifer Areas

Final Report to U.S.EPA Region VIIMissouri Department of Natural Resources - Water Resources Center
8
shown on the MACM (Figure 1) and to the four groupings or patterns, similar to those shown inFigure 3, determined in the total row-crop acreage for each county. An overall aquifer sensitivityand vulnerability rating (OR) was generated for each aquifer type, including aquifersubdivisions, in each county by multiplying the numerical rating of the Aquifer Area (or aquifersensitivity rating (ASR) by the corresponding row-crop acreage group (or row-crop rating(RCR). The rating scheme is designed to have the OR for an area with the highest ASR andlowest RCR similar to the OR for an area with the lowest ASR and the highest RCR.
The number of monitoring points originally proposed in each aquifer area of each county isbased on the average size of aquifer subdivisions in the counties and the OR. Low OR areas havefewer monitoring points per average aquifer subdivision than those areas with higher ORs.Similar to the ASR and RCR, the ORs are divided into four groups as shown in Table 3.
Overall Rating Number of Monitoring Pointsper Average AquiferSubdivision Size
0 01 to 2 13 to 6 1.57 to 9 2
Table 3. Number of proposed monitoring points per average aquifer subdivision size based on the OR.
As shown in Table 9 of Baumgartner and Brookshire (2001), a total of 288 monitoring pointswere estimated to be needed statewide to ensure adequate coverage based on aquifervulnerability and areal extent of various aquifer areas, including aquifer subdivisions. This tablealso shows the number of monitoring points proposed in each aquifer area of each county.
During the five year period from state fiscal year 2002 (FY02) to state fiscal year 2006 (FY06),the WRC used this assessment to identify and sample wells to be included in the pesticidemonitoring network. The WRC submitted annual work plans to the MDA based on availablefunding. Wells in areas with the highest ORs were identified and sampled during the first year.Up to FY06, wells were identified and sampled in areas with lower ORs until at least onemonitoring point was located in all areas vulnerable to pesticide usage. From FY04 to FY06, theWRC also re-sampled some of the wells. A total of 351 samples were collected from 190 wellsover the five-year period. Locations of the 190 pesticide monitoring network wells are shown inFigure 4. The wells are referred to in this report by their map labels (or numbers) as shown inFigure 4 and Appendix 1.
Monitoring Point Selection
The monitoring network wells sampled for this study are all private wells. These wells were usedbecause they were readily available, no cost was associated with their use, and the samplecollected from them would be representative of the aquifer in the area. These wells were selectedfrom either the department’s Well Information Management System (WIMS) or LOGMAINdatabases, or during field reconnaissance. One hundred eighteen wells (62 percent) were

Final Report to U.S.EPA Region VIIMissouri Department of Natural Resources - Water Resources Center
9
0 20 40 Miles
N#
#
#
##
#
# #
#
#
##
#
#
#
#
#
#
#
## #
#
#
#
#
#
#
#
#
#
##
##
# #
#
## #
#
#
#
##
#
#
#
#
# #
##
####
#
#
#
##
#
#
##
##
#
#
#
#
#
#
#
#
#
#
#
###
#
#
#
##
#
##
# #
#
#
#
#
##
##
#
##
#
# #
#
#
#
#
#
#
##
# ##
#
#
##
#
#
##
#
##
#
#
##
##
##
#
#
## ##
# ##
#
#
##
#
##
#
##
#
#
#
#
#
##
#
#
#
###
#
#
#
#
##
##
## ##
##
#
###
#
#
#
1
2
345
6
7 8
9
1011
1213
14
15
16
1718
19
2021 22 23
24
25
2627
2829
30
3132
33 35 36 3738
3940 41
42
43
44
454647
48
4950
51 525354555658
5960
616263
64
65 66676869
7071
72
73
7475
7677
78
79
808182
8485
86
87
8889
909192 93
94
95
96
97
9899
100
101
102
104106107
108
109
110
111112113
114115116
117119
120121122
123
124
125 126
127
128130
131133
134135
136137138
139
140141 142
143
144 145146
147148
149 150
151152153
154
155156
157
158160
161
162163164
165166
167 168169
170
171
172
173
174175
178181183
184
186
188
189
190
34
57
83
103105
118
129
132
159
176177
179 180
182185187
Figure 4. Location and report number of wells sampled.

Final Report to U.S.EPA Region VIIMissouri Department of Natural Resources - Water Resources Center
10
selected from the WIMS database. These wells are constructed to standards required by MissouriWell Construction Rules (2001). Four wells (2 percent) were selected from the LOGMAINdatabase. Construction details are available for these wells, however they are not constructed tocurrent department standards. Twenty-one wells (11 percent) are not in either database andconstruction details are unknown. Forty-seven wells (25 percent) in the alluvium of the MissouriRiver and Bootheel area are sand point type wells and are exempt from Missouri WellConstruction Rules (2001), including reporting requirements. These wells were found byconducting house to house surveys.
Three hundred fifty-one samples were collected from 190 private wells during the five yearperiod from spring 2002 to spring 2006. Eighty-six wells were sampled one time, 50 wells weresampled two times each, 51 wells were sampled three times each, and 3 wells were sampled fourtimes each. The wells range in total depth from 12 to 446 feet. Twenty-six wells in theOrdovician bedrock aquifer (Aquifer Area IA) range in total depth from 100 to 340 feet. Thirtywells in the Mississippian bedrock aquifer (Aquifer Area IB) range in total depth from 17 to 290feet. Two wells open to both the Ordovician and Mississippian bedrock aquifers are 200 and 446feet in total depth. Sixty-six wells in the alluvial aquifer (Aquifer Area ID) range in total depthfrom 12 to 101 feet. Six wells in the Tertiary-Cretaceous aquifer (Aquifer Area IE) range in totaldepth from 70 to 176 feet. Four wells completed in the Paleozoic Undifferentiated bedrockaquifer (Aquifer Area IF) range from 35 to 165 feet in total depth. The twelve wells in thePennsylvanian bedrock aquifer (Aquifer Area II) range from 60 to 290 feet in total depth and thethirty-one wells in the Glacial Drift aquifer (Aquifer Area III) range from 25 to 228 feet in totaldepth.
One hundred eleven wells are within 100 feet of a row-crop field. Ten of the wells are locatedwithin or immediately adjacent to row-crop fields. The wells ranged from 0 feet to about one-half mile from the nearest row-crop field. The average distance to the nearest field is about 291feet. Appendix 1 shows the depths of the wells, distance to the nearest field, and the geologicunits from which the well produces groundwater.
Water Sample Collection
Groundwater sample collection for this study began in spring 2002. Ideally, a well samplingprogram of this type would include sampling wells for pesticides multiple times a year or at leastseasonally. However, to adequately characterize all groundwater in the state that is vulnerable topesticide usage with the resources available, more wells will have to be sampled and fewer wellssampled frequently. The goal was to complete sampling activities for the new wells before thespring planting season. This would provide a sample that is more representative of backgroundgroundwater quality. Additionally, collecting samples before, or after, the spring planting seasoneliminates the possibility of samples being contaminated during collection due to drift ofpesticides in the air.

Final Report to U.S.EPA Region VIIMissouri Department of Natural Resources - Water Resources Center
11
Quality Assurance and Quality Control
The Missouri Department of Natural Resources’ Environmental Services Program (ESP) hasestablished comprehensive quality assurance protocols for ensuring quality environmental data,including groundwater data. All data generated by the department and presented in this reportwere collected according to these protocols. In addition, data were collected in accordance withthe department’s EPA-approved Quality Assurance Project Plan (QAPP) (Baumgartner, 2001)written specifically for this project. The QAPP includes quality assurance protocols formonitoring point selection, data collection, monitoring well installation, data storage, and samplehandling. Quality control measures included the collection of trip blanks and field duplicatesduring sampling. In addition, all laboratory analyses performed by the department’s ESPlaboratory were in accordance with the laboratory’s QAPP.
Laboratory Analyses for Pesticides
The department’s ESP laboratory in Jefferson City performed all the pesticide analyses presentedin this report. The laboratory used EPA-approved Drinking Water Method 507 to determine theconcentration of pesticides in the samples. The Method Detection Limits (MDL) for allcompounds detected by Method 507 are approximately 0.2 micrograms/liter (μg/L), however,the lab uses a Practical Quantitation Limit (PQL) of 0.5 μg/L (Lueckenhoff, 2001).Concentrations detected in the 0.2 to 0.5 μg/L range are reported as estimates and non-detects orconcentrations less than 0.2 μg/L are reported as less than (<) 0.5 μg/L. All of these limits arewell below the respective EPA drinking water standards (Table 3).
PesticideMDL/PQL
(μg/L)EPA MCL* or HAL**
(μg/L)Alachlor 0.2/0.5 2
Atrazine 0.2/0.5 3
Metolachlor 0.2/0.5 70
Simazine 0.2/0.5 4*Maximum Contaminant Level (EPA, 2000)
**Lifetime Health Advisory Level (EPA, 2000)
Table 4. EPA drinking water standards, health advisories,and limits of the analytical method.
RESULTS AND DISCUSSION
Appendix 1 contains data for the wells. Identification numbers are based on the well’s location.The latitude and longitude, in decimal degrees, of the well’s location were combined to create aunique, 12-digit identification number. The number begins with the 6-digit latitude and ends withthe 6-digit longitude. Appendix 1 also shows this report’s map label (or number) for each well.
Final Report to U.S.EPA Region VIIMissouri Department of Natural Resources - Water Resources Center
12
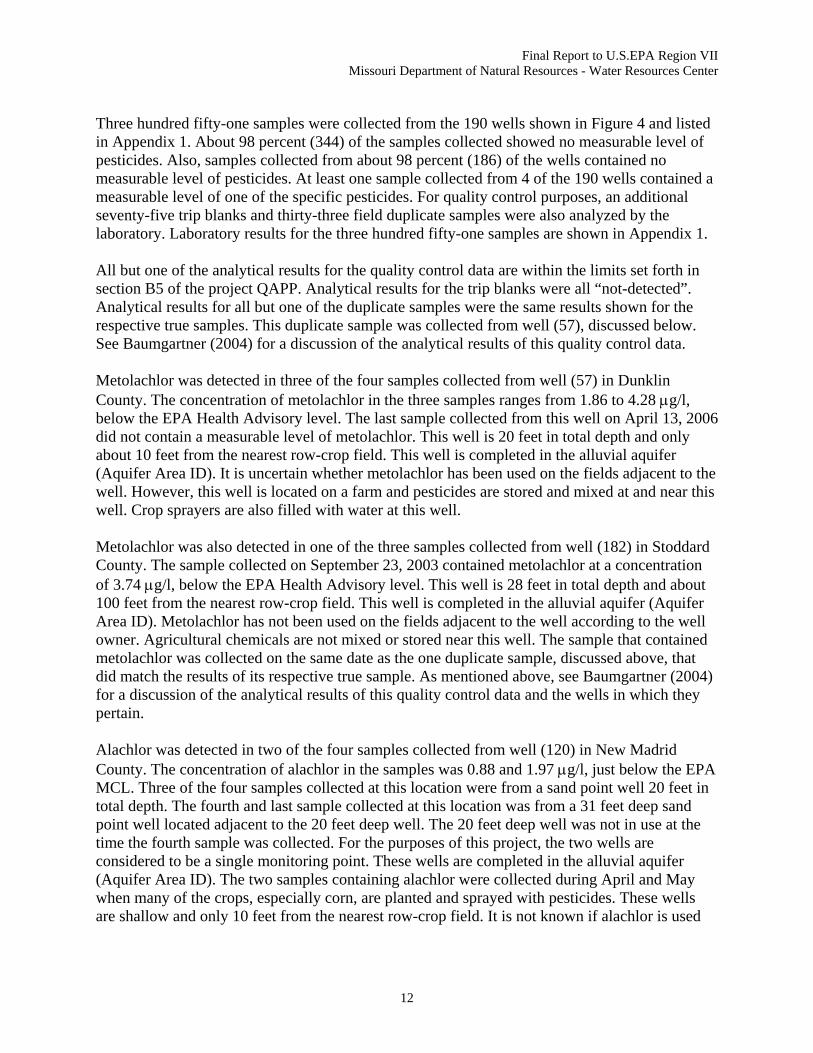
Three hundred fifty-one samples were collected from the 190 wells shown in Figure 4 and listedin Appendix 1. About 98 percent (344) of the samples collected showed no measurable level ofpesticides. Also, samples collected from about 98 percent (186) of the wells contained nomeasurable level of pesticides. At least one sample collected from 4 of the 190 wells contained ameasurable level of one of the specific pesticides. For quality control purposes, an additionalseventy-five trip blanks and thirty-three field duplicate samples were also analyzed by thelaboratory. Laboratory results for the three hundred fifty-one samples are shown in Appendix 1.
All but one of the analytical results for the quality control data are within the limits set forth insection B5 of the project QAPP. Analytical results for the trip blanks were all “not-detected”.Analytical results for all but one of the duplicate samples were the same results shown for therespective true samples. This duplicate sample was collected from well (57), discussed below.See Baumgartner (2004) for a discussion of the analytical results of this quality control data.
Metolachlor was detected in three of the four samples collected from well (57) in DunklinCounty. The concentration of metolachlor in the three samples ranges from 1.86 to 4.28 μg/l,below the EPA Health Advisory level. The last sample collected from this well on April 13, 2006did not contain a measurable level of metolachlor. This well is 20 feet in total depth and onlyabout 10 feet from the nearest row-crop field. This well is completed in the alluvial aquifer(Aquifer Area ID). It is uncertain whether metolachlor has been used on the fields adjacent to thewell. However, this well is located on a farm and pesticides are stored and mixed at and near thiswell. Crop sprayers are also filled with water at this well.
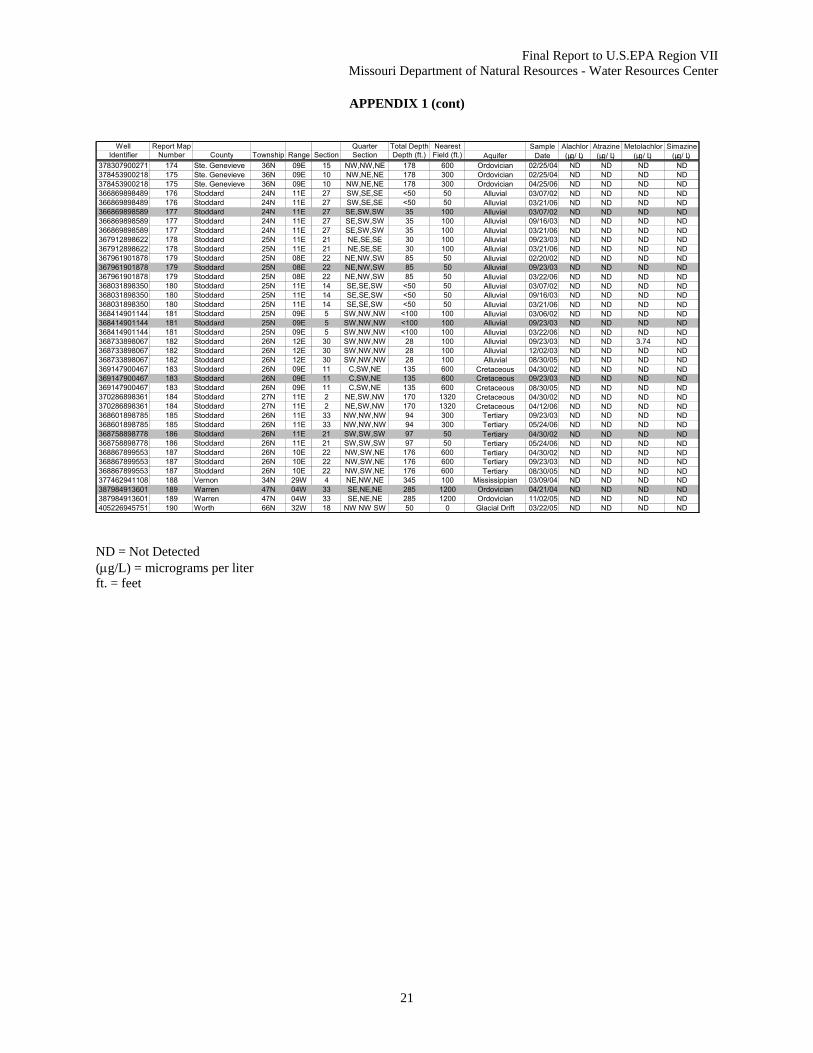
Metolachlor was also detected in one of the three samples collected from well (182) in StoddardCounty. The sample collected on September 23, 2003 contained metolachlor at a concentrationof 3.74 μg/l, below the EPA Health Advisory level. This well is 28 feet in total depth and about100 feet from the nearest row-crop field. This well is completed in the alluvial aquifer (AquiferArea ID). Metolachlor has not been used on the fields adjacent to the well according to the wellowner. Agricultural chemicals are not mixed or stored near this well. The sample that containedmetolachlor was collected on the same date as the one duplicate sample, discussed above, thatdid match the results of its respective true sample. As mentioned above, see Baumgartner (2004)for a discussion of the analytical results of this quality control data and the wells in which theypertain.
Alachlor was detected in two of the four samples collected from well (120) in New MadridCounty. The concentration of alachlor in the samples was 0.88 and 1.97 μg/l, just below the EPAMCL. Three of the four samples collected at this location were from a sand point well 20 feet intotal depth. The fourth and last sample collected at this location was from a 31 feet deep sandpoint well located adjacent to the 20 feet deep well. The 20 feet deep well was not in use at thetime the fourth sample was collected. For the purposes of this project, the two wells areconsidered to be a single monitoring point. These wells are completed in the alluvial aquifer(Aquifer Area ID). The two samples containing alachlor were collected during April and Maywhen many of the crops, especially corn, are planted and sprayed with pesticides. These wellsare shallow and only 10 feet from the nearest row-crop field. It is not known if alachlor is used
Final Report to U.S.EPA Region VIIMissouri Department of Natural Resources - Water Resources Center
13
on the field adjacent to the well; however, it is likely. Agricultural chemicals are not mixed orstored near these wells.
Atrazine, the most commonly used herbicide on corn, was only detected in one sample. Atrazinewas detected in one of the four samples collected from well (142) in Pike county at aconcentration of 0.78 μg/l, slightly below the EPA MCL. This well is 128 feet in total depth andabout 20 feet from the nearest row-crop field. This well is completed in the Ordovician bedrockaquifer. It is not known if atrazine is used on the field adjacent to the well, however it is likely.Agricultural chemicals are not mixed or stored near this well. The sample that contained atrazinewas collected on April 15, 2003, near the beginning of the spring planting season. Anothersample obtained from this well on June 11, 2003, only two months later and near the end ofspring planting season, did not contain a measurable concentration of any of the pesticides.
SUMMARY AND CONCLUSIONS
This report presents the results of monitoring shallow groundwater in Missouri for fouragricultural pesticides over the five-year period from 2002 to 2006. The study focused on thefour herbicides alachlor, atrazine, metolachlor, and simazine. These four herbicides are generallyused on corn and soybeans, however in Missouri, estimates of usage indicate they are usedprimarily on corn.
Data show that about 98 percent of the samples collected during the course of this project did nothave any detectable concentrations of any of the pesticides, including the four pesticides that arenot the focus of this project. Pesticides were detected in only 4 of the 190 wells (Figure 5).Metolachlor, the second most common herbicide used on corn, was herbicide detected mostoften. Alachlor was the second most common detected herbicide. Atrazine, the most commonherbicide used on corn in Missouri and one of the most frequently detected herbicides in groundwater, was detected in only one sample. Simazine, as well as the four pesticides (cyanazine,metribuzin, propachlor, and butachlor) that are not the focus of this project, was not detected inany of the samples. None of the pesticide concentrations exceed EPA MCLs or Health Advisory.
Three of the four wells in which pesticides were detected are shallow (20 to 28 feet in totaldepth) and completed in an alluvial aquifer. The fourth well produces water from the Ordovicianbedrock aquifer however it is relatively shallow for a bedrock well. All of the wells arecompleted in some of the most sensitive aquifer materials in Missouri, Aquifer Area I. All thesewells are within one hundred feet of a row-crop field and all are located in counties that have alarge amount of land area in row-crop production. In addition, Stoddard, New Madrid, and Pikeare three of the top corn producing counties (see Figure 3).
Pesticide detections correlate most strongly with well depth, aquifer type (Aquifer Area), andproximity to the nearest row-crop field; that is, shallow wells that are near row-crop fields andcompleted in the most sensitive aquifer materials have more detections. The number of pesticidedetections also appears to correspond with pesticide usage associated with major row-cropproduction. Additional work is needed to further evaluate how the concentration and distribution

Final Report to U.S.EPA Region VIIMissouri Department of Natural Resources - Water Resources Center
14
of pesticides are related to variables such as hydrogeology, soil characteristics, well depth,seasonal variations, land use, and pesticide use.
N
$
%
%
%
#
Legend$ alachlor# atrazine% metolachlor
0 20 40 Miles
Figure 5. Map showing location of wells in which a specific pesticide has been detected.
ACKNOWLEDGMENTS
Funding for this project was provided by the U.S. Environmental Protection Agency Region VII-Water, Wetlands and Pesticides Division through the Missouri Department of AgricultureDivision of Plant Industries. The author is grateful to the water well owners who grantedpermission to obtain water samples and those citizens who provided assistance in locating wellsin their area.

Final Report to U.S.EPA Region VIIMissouri Department of Natural Resources - Water Resources Center
15
REFERENCES
Baumgartner, Scotty D., 2005, Results of monitoring shallow groundwater in Missouri for fouragricultural pesticides, Missouri Department of Natural Resources, Geological Surveyand Resource Assessment Division, (unpublished) 14 p.
Baumgartner, Scotty D., 2004, Results of monitoring shallow groundwater in Missouri for fouragricultural pesticides, Missouri Department of Natural Resources, Geological Surveyand Resource Assessment Division, (unpublished) 15 p.
Baumgartner, Scotty D., 2003, Results of monitoring shallow groundwater in Missouri for fouragricultural pesticides, Missouri Department of Natural Resources, Geological Surveyand Resource Assessment Division, (unpublished) 14 p.
Baumgartner, Scotty D., 2002, Results of monitoring Missouri’s shallow groundwater forfour agricultural pesticides, Missouri Department of Natural Resources, GeologicalSurvey and Resource Assessment Division, (unpublished) 15 p.
Baumgartner, Scotty D., and Brookshire, Cynthia, 2000, A plan for monitoring pesticides in Missouri groundwater, Missouri Department of Natural Resources, Division of Geology and Land Survey, (unpublished) 28 p.
Baumgartner, Scotty D., 2001, Missouri Department of Natural Resources, Quality Assurance Project Plan for monitoring pesticides in Missouri ground water, (unpublished) 19 p.
Bell, Richard W., Joseph, R.L., and Freiwald, D.A., 1996, Water-quality assessment of the Ozarkplateaus study unit, Arkansas, Kansas, Missouri, and Oklahoma-summary of informationon pesticides, 1970-90, National Water Quality Assessment Program, U.s. GeologicalSurvey Water Resources Investigations Report 96-4003, 51 p.
Hutson, S.S., Barber, N.L., Kenny, J.F., Linsey, K.S., Lumia, D.S., and Maupin, M, 2004,Estimated use of water in the United States in 2000: U.S. Geological Survey Circular1268, accessed June 28, 2006 at http://pubs.usgs.gov/circ/2004/circ1268/
Kolpin, Dana W., Burkart, M.R., and Thurman, E.M., Hydrogeologic, water-quality, and land-use data for the reconnaissance of herbicides and nitrate in near-surface aquifers of themidcontinental United States, 1991, U.S. Geological Survey Open-File Report 93-114,61 p.
Lueckenhoff, Curt, 2001, Personal communication: Environmental Services Program, Missouri Department of Natural Resources, Division of Environmental Quality.
Miller, Don E., Vandike, J.E., and Brookshire, C., 1994, Aquifer classification based onvulnerability to contamination, Missouri Department of Natural Resources, Division ofGeology and Land Survey, (unpublished) 13 p.

Final Report to U.S.EPA Region VIIMissouri Department of Natural Resources - Water Resources Center
16
Missouri Department of Agriculture, 2002, Missouri farm facts 2002: Missouri Department of Agriculture, Missouri Agricultural Statistics Service, 81 p.
Missouri Department of Agriculture, 2004, Missouri farm facts 2004: Missouri Department of Agriculture, Missouri Agricultural Statistics Service, 81 p.
Missouri Department of Natural Resources, 2001, Missouri well construction rules: RSMo256.600, Geological Survey and Resource Assessment Division, Misc. Pub. 50, 93 p.
Sievers, D.M. and C.D. Fulhage, 1992, Survey of rural wells in Missouri for pesticides andnitrate. Ground Water Monitoring Review, v.12, no. 4, pp. 142-150.
Vandike, James E., 1997, Missouri state water plan series volume II, Groundwater Resources of Missouri: Missouri Department of Natural Resources, Division of Geology and Land Survey, Water Resources Report No. 46, 210 p.
U.S.D.A., 2005, http://usda.mannlib.cornell.edu/reports/waobr/weather/2005/crop/prog2205.txt, accessed: 13 July 2005.
U.S. EPA, Summer 2000, Drinking water standards and health advisories: U.S. Environmental Protection Agency, Office of Water, EPA-822-B-00-001, 12 p.
U.S. EPA, 1996a, Pesticides and ground water State Management Plan regulation: Proposedrule: Federal Register, v. 61, no. 124, pp. 33260-33301.
Wilkison, D.H. and R.D. Maley, 1994, Occurrence of herbicides, nitrite plus nitrate, and selectedtrace elements in ground water from northwestern and northeastern Missouri, July 1991and 1992: U.S. Geological Survey Open-File Report 94-332, 64 p.
Final Report to U.S.EPA Region VIIMissouri Department of Natural Resources - Water Resources Center
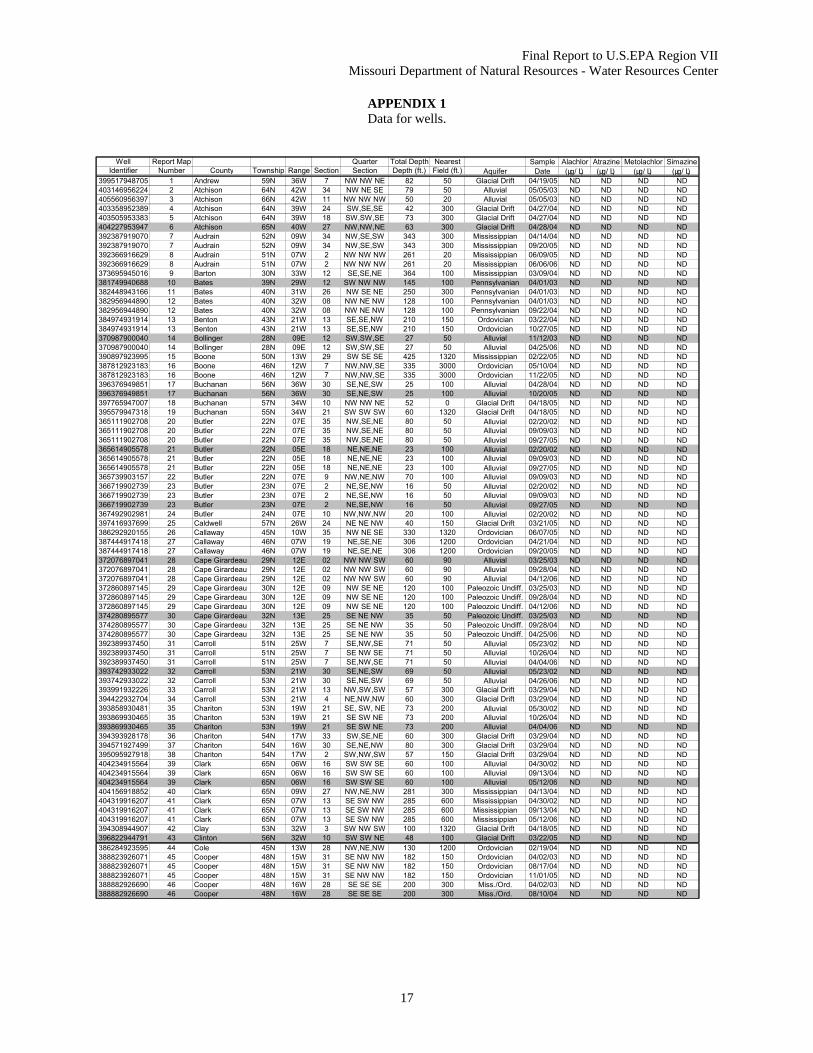
17
APPENDIX 1Data for wells.
Well Report Map Quarter Total Depth Nearest Sample Alachlor Atrazine Metolachlor SimazineIdentifier Number County Township Range Section Section Depth (ft.) Field (ft.) Aquifer Date (μg/ L) (μg/ L) (μg/ L) (μg/ L)
399517948705 1 Andrew 59N 36W 7 NW NW NE 82 50 Glacial Drift 04/19/05 ND ND ND ND403146956224 2 Atchison 64N 42W 34 NW NE SE 79 50 Alluvial 05/05/03 ND ND ND ND405560956397 3 Atchison 66N 42W 11 NW NW NW 50 20 Alluvial 05/05/03 ND ND ND ND403358952389 4 Atchison 64N 39W 24 SW,SE,SE 42 300 Glacial Drift 04/27/04 ND ND ND ND403505953383 5 Atchison 64N 39W 18 SW,SW,SE 73 300 Glacial Drift 04/27/04 ND ND ND ND404227953947 6 Atchison 65N 40W 27 NW,NW,NE 63 300 Glacial Drift 04/28/04 ND ND ND ND392387919070 7 Audrain 52N 09W 34 NW,SE,SW 343 300 Mississippian 04/14/04 ND ND ND ND392387919070 7 Audrain 52N 09W 34 NW,SE,SW 343 300 Mississippian 09/20/05 ND ND ND ND392366916629 8 Audrain 51N 07W 2 NW NW NW 261 20 Mississippian 06/09/05 ND ND ND ND392366916629 8 Audrain 51N 07W 2 NW NW NW 261 20 Mississippian 06/06/06 ND ND ND ND373695945016 9 Barton 30N 33W 12 SE,SE,NE 364 100 Mississippian 03/09/04 ND ND ND ND381749940688 10 Bates 39N 29W 12 SW NW NW 145 100 Pennsylvanian 04/01/03 ND ND ND ND382448943166 11 Bates 40N 31W 26 NW SE NE 250 300 Pennsylvanian 04/01/03 ND ND ND ND382956944890 12 Bates 40N 32W 08 NW NE NW 128 100 Pennsylvanian 04/01/03 ND ND ND ND382956944890 12 Bates 40N 32W 08 NW NE NW 128 100 Pennsylvanian 09/22/04 ND ND ND ND384974931914 13 Benton 43N 21W 13 SE,SE,NW 210 150 Ordovician 03/22/04 ND ND ND ND384974931914 13 Benton 43N 21W 13 SE,SE,NW 210 150 Ordovician 10/27/05 ND ND ND ND370987900040 14 Bollinger 28N 09E 12 SW,SW,SE 27 50 Alluvial 11/12/03 ND ND ND ND370987900040 14 Bollinger 28N 09E 12 SW,SW,SE 27 50 Alluvial 04/25/06 ND ND ND ND390897923995 15 Boone 50N 13W 29 SW SE SE 425 1320 Mississippian 02/22/05 ND ND ND ND387812923183 16 Boone 46N 12W 7 NW,NW,SE 335 3000 Ordovician 05/10/04 ND ND ND ND387812923183 16 Boone 46N 12W 7 NW,NW,SE 335 3000 Ordovician 11/22/05 ND ND ND ND396376949851 17 Buchanan 56N 36W 30 SE,NE,SW 25 100 Alluvial 04/28/04 ND ND ND ND396376949851 17 Buchanan 56N 36W 30 SE,NE,SW 25 100 Alluvial 10/20/05 ND ND ND ND397765947007 18 Buchanan 57N 34W 10 NW NW NE 52 0 Glacial Drift 04/18/05 ND ND ND ND395579947318 19 Buchanan 55N 34W 21 SW SW SW 60 1320 Glacial Drift 04/18/05 ND ND ND ND365111902708 20 Butler 22N 07E 35 NW,SE,NE 80 50 Alluvial 02/20/02 ND ND ND ND365111902708 20 Butler 22N 07E 35 NW,SE,NE 80 50 Alluvial 09/09/03 ND ND ND ND365111902708 20 Butler 22N 07E 35 NW,SE,NE 80 50 Alluvial 09/27/05 ND ND ND ND365614905578 21 Butler 22N 05E 18 NE,NE,NE 23 100 Alluvial 02/20/02 ND ND ND ND365614905578 21 Butler 22N 05E 18 NE,NE,NE 23 100 Alluvial 09/09/03 ND ND ND ND365614905578 21 Butler 22N 05E 18 NE,NE,NE 23 100 Alluvial 09/27/05 ND ND ND ND365739903157 22 Butler 22N 07E 9 NW,NE,NW 70 100 Alluvial 09/09/03 ND ND ND ND366719902739 23 Butler 23N 07E 2 NE,SE,NW 16 50 Alluvial 02/20/02 ND ND ND ND366719902739 23 Butler 23N 07E 2 NE,SE,NW 16 50 Alluvial 09/09/03 ND ND ND ND366719902739 23 Butler 23N 07E 2 NE,SE,NW 16 50 Alluvial 09/27/05 ND ND ND ND367492902981 24 Butler 24N 07E 10 NW,NW,NW 20 100 Alluvial 02/20/02 ND ND ND ND397416937699 25 Caldwell 57N 26W 24 NE NE NW 40 150 Glacial Drift 03/21/05 ND ND ND ND386292920155 26 Callaway 45N 10W 35 NW NE SE 330 1320 Ordovician 06/07/05 ND ND ND ND387444917418 27 Callaway 46N 07W 19 NE,SE,NE 306 1200 Ordovician 04/21/04 ND ND ND ND387444917418 27 Callaway 46N 07W 19 NE,SE,NE 306 1200 Ordovician 09/20/05 ND ND ND ND372076897041 28 Cape Girardeau 29N 12E 02 NW NW SW 60 90 Alluvial 03/25/03 ND ND ND ND372076897041 28 Cape Girardeau 29N 12E 02 NW NW SW 60 90 Alluvial 09/28/04 ND ND ND ND372076897041 28 Cape Girardeau 29N 12E 02 NW NW SW 60 90 Alluvial 04/12/06 ND ND ND ND372860897145 29 Cape Girardeau 30N 12E 09 NW SE NE 120 100 Paleozoic Undiff. 03/25/03 ND ND ND ND372860897145 29 Cape Girardeau 30N 12E 09 NW SE NE 120 100 Paleozoic Undiff. 09/28/04 ND ND ND ND372860897145 29 Cape Girardeau 30N 12E 09 NW SE NE 120 100 Paleozoic Undiff. 04/12/06 ND ND ND ND374280895577 30 Cape Girardeau 32N 13E 25 SE NE NW 35 50 Paleozoic Undiff. 03/25/03 ND ND ND ND374280895577 30 Cape Girardeau 32N 13E 25 SE NE NW 35 50 Paleozoic Undiff. 09/28/04 ND ND ND ND374280895577 30 Cape Girardeau 32N 13E 25 SE NE NW 35 50 Paleozoic Undiff. 04/25/06 ND ND ND ND392389937450 31 Carroll 51N 25W 7 SE,NW,SE 71 50 Alluvial 05/23/02 ND ND ND ND392389937450 31 Carroll 51N 25W 7 SE NW SE 71 50 Alluvial 10/26/04 ND ND ND ND392389937450 31 Carroll 51N 25W 7 SE,NW,SE 71 50 Alluvial 04/04/06 ND ND ND ND393742933022 32 Carroll 53N 21W 30 SE,NE,SW 69 50 Alluvial 05/23/02 ND ND ND ND393742933022 32 Carroll 53N 21W 30 SE,NE,SW 69 50 Alluvial 04/26/06 ND ND ND ND393991932226 33 Carroll 53N 21W 13 NW,SW,SW 57 300 Glacial Drift 03/29/04 ND ND ND ND394422932704 34 Carroll 53N 21W 4 NE,NW,NW 60 300 Glacial Drift 03/29/04 ND ND ND ND393858930481 35 Chariton 53N 19W 21 SE, SW, NE 73 200 Alluvial 05/30/02 ND ND ND ND393869930465 35 Chariton 53N 19W 21 SE SW NE 73 200 Alluvial 10/26/04 ND ND ND ND393869930465 35 Chariton 53N 19W 21 SE SW NE 73 200 Alluvial 04/04/06 ND ND ND ND394393928178 36 Chariton 54N 17W 33 SW,SE,NE 60 300 Glacial Drift 03/29/04 ND ND ND ND394571927499 37 Chariton 54N 16W 30 SE,NE,NW 80 300 Glacial Drift 03/29/04 ND ND ND ND395095927918 38 Chariton 54N 17W 2 SW,NW,SW 57 150 Glacial Drift 03/29/04 ND ND ND ND404234915564 39 Clark 65N 06W 16 SW SW SE 60 100 Alluvial 04/30/02 ND ND ND ND404234915564 39 Clark 65N 06W 16 SW SW SE 60 100 Alluvial 09/13/04 ND ND ND ND404234915564 39 Clark 65N 06W 16 SW SW SE 60 100 Alluvial 05/12/06 ND ND ND ND404156918852 40 Clark 65N 09W 27 NW,NE,NW 281 300 Mississippian 04/13/04 ND ND ND ND404319916207 41 Clark 65N 07W 13 SE SW NW 285 600 Mississippian 04/30/02 ND ND ND ND404319916207 41 Clark 65N 07W 13 SE SW NW 285 600 Mississippian 09/13/04 ND ND ND ND404319916207 41 Clark 65N 07W 13 SE SW NW 285 600 Mississippian 05/12/06 ND ND ND ND394308944907 42 Clay 53N 32W 3 SW NW SW 100 1320 Glacial Drift 04/18/05 ND ND ND ND396822944791 43 Clinton 56N 32W 10 SW SW NE 48 100 Glacial Drift 03/22/05 ND ND ND ND386284923595 44 Cole 45N 13W 28 NW,NE,NW 130 1200 Ordovician 02/19/04 ND ND ND ND388823926071 45 Cooper 48N 15W 31 SE NW NW 182 150 Ordovician 04/02/03 ND ND ND ND388823926071 45 Cooper 48N 15W 31 SE NW NW 182 150 Ordovician 08/17/04 ND ND ND ND388823926071 45 Cooper 48N 15W 31 SE NW NW 182 150 Ordovician 11/01/05 ND ND ND ND388882926690 46 Cooper 48N 16W 28 SE SE SE 200 300 Miss./Ord. 04/02/03 ND ND ND ND388882926690 46 Cooper 48N 16W 28 SE SE SE 200 300 Miss./Ord. 08/10/04 ND ND ND ND

Final Report to U.S.EPA Region VIIMissouri Department of Natural Resources - Water Resources Center
18
APPENDIX 1 (cont)
Well Report Map Quarter Total Depth Nearest Sample Alachlor Atrazine Metolachlor SimazineIdentifier Number County Township Range Section Section Depth (ft.) Field (ft.) Aquifer Date (μg/ L) (μg/ L) (μg/ L) (μg/ L)
388882926690 46 Cooper 48N 16W 28 SE SE SE 200 300 Miss./Ord. 11/01/05 ND ND ND ND389633929088 47 Cooper 48N 17W 05 NW NE NE 140 10 Mississippian 04/02/03 ND ND ND ND389633929088 47 Cooper 48N 17W 05 NW NE NE 140 10 Mississippian 08/17/04 ND ND ND ND389633929088 47 Cooper 48N 17W 05 NW NE NE 140 10 Mississippian 11/01/05 ND ND ND ND373749940769 48 Dade 30N 29W 1 SE,NW,NW 446 100 Miss./Ord. 03/09/04 ND ND ND ND400789938022 49 Daviess 61N 26W 14 SW NW SW 40 10 Glacial Drift 03/21/05 ND ND ND ND400022945291 50 Dekalb 60N 32W 19 NE NE SE 51 100 Glacial Drift 03/22/05 ND ND ND ND360606902111 51 Dunklin 16N 08E 4 NW,NW,NW 50 150 Alluvial 03/13/02 ND ND ND ND360606902111 51 Dunklin 16N 08E 4 NW,NW,NW 50 150 Alluvial 09/15/03 ND ND ND ND360606902111 51 Dunklin 16N 08E 4 NW,NW,NW 50 150 Alluvial 09/27/05 ND ND ND ND360614901325 52 Dunklin 17N 09E 31 SE,SE,SW 35 10 Alluvial 03/14/02 ND ND ND ND360614901325 52 Dunklin 17N 09E 31 SE,SE,SW 35 10 Alluvial 09/09/03 ND ND ND ND361696900876 53 Dunklin 18N 09E 28 NE,NE,SE 30 100 Alluvial 09/15/03 ND ND ND ND361696900876 53 Dunklin 18N 09E 28 NE,NE,SE 30 100 Alluvial 09/27/05 ND ND ND ND362153901078 54 Dunklin 18N 09E 8 SE,SE,NE 25 100 Alluvial 03/13/02 ND ND ND ND362153901078 54 Dunklin 18N 09E 8 SE,SE,NE 25 100 Alluvial 09/15/03 ND ND ND ND362153901078 54 Dunklin 18N 09E 8 SE,SE,NE 25 100 Alluvial 09/27/05 ND ND ND ND364082900367 55 Dunklin 20N 09E 1 SE,NW,SE 35 30 Alluvial 09/15/03 ND ND ND ND364082900367 55 Dunklin 20N 09E 1 SE,NW,SE 35 30 Alluvial 09/27/05 ND ND ND ND364305900498 56 Dunklin 21N 09E 26 SE NE SE 12 50 Alluvial 06/03/03 ND ND ND ND364305900498 56 Dunklin 21N 09E 26 SE NE SE 12 50 Alluvial 09/28/04 ND ND ND ND364305900498 56 Dunklin 21N 09E 26 SE NE SE 12 50 Alluvial 09/27/05 ND ND ND ND364406900481 57 Dunklin 21N 09E 25 NW,NW,NW 20 10 Alluvial 03/13/02 ND ND 1.86 ND364406900481 57 Dunklin 21N 09E 25 NW NW NW 20 10 Alluvial 03/25/03 ND ND 2.28 ND364406900481 57 Dunklin 21N 09E 25 NW,NW,NW 20 10 Alluvial 09/24/03 ND ND 4.28 ND364406900481 57 Dunklin 21N 09E 25 NW,NW,NW 20 10 Alluvial 04/13/06 ND ND ND ND364407900315 58 Dunklin 21N 09E 25 NE, NE, NE 15 100 Alluvial 05/24/06 ND ND ND ND366169900289 59 Dunklin 23N 10E 19 SW,SW,SW 50 100 Alluvial 03/07/02 ND ND ND ND366169900289 59 Dunklin 23N 10E 19 SW,SW,SW 50 100 Alluvial 05/24/06 ND ND ND ND365000900814 60 Dunklin 22N 09E 34 SE,SW,SW 70 1320 Tertiary 04/02/02 ND ND ND ND365000900814 60 Dunklin 22N 09E 34 SE,SW,SW 70 1320 Tertiary 09/27/05 ND ND ND ND385269912978 61 Franklin 44N 04W 30 SW,NE,SE 240 1200 Ordovician 02/18/04 ND ND ND ND385269912978 61 Franklin 44N 04W 30 SW,NE,SE 240 1200 Ordovician 09/20/05 ND ND ND ND386204913382 62 Franklin 45N 04W 26 NW,NW,SE 225 100 Ordovician 02/18/04 ND ND ND ND386204913382 62 Franklin 45N 04W 26 NW,NW,SE 225 100 Ordovician 09/20/05 ND ND ND ND386071915933 63 Gasconade 45N 06W 33 NW,NE,SE 270 150 Ordovician 02/18/04 ND ND ND ND386071915933 63 Gasconade 45N 06W 33 NW,NE,SE 270 150 Ordovician 09/20/05 ND ND ND ND400553945641 64 Gentry 61N 33W 25 SE SW SE 28 0 Glacial Drift 03/09/05 ND ND ND ND403298944057 65 Gentry 64N 31W 21 SW SW SW 52 150 Glacial Drift 03/22/05 ND ND ND ND402636934333 66 Grundy 63N 23W 13 SE NE NW 212 50 Glacial Drift 05/02/05 ND ND ND ND402320941220 67 Harrison 63N 29W 26 NE SE NE 40 100 Glacial Drift 03/21/05 ND ND ND ND403138938365 68 Harrison 64N 26W 28 NE NW SW 70 100 Glacial Drift 03/08/05 ND ND ND ND403273939366 69 Harrison 64N 27W 22 SW NW SW 35 100 Glacial Drift 03/08/05 ND ND ND ND383762939196 70 Henry 41N 27W 4 NW NW SW 230 1320 Pennsylvanian 05/17/05 ND ND ND ND384577939668 71 Henry 42N 28W 12 NW NE NW 250 200 Pennsylvanian 06/08/05 ND ND ND ND400708953216 72 Holt 61N 39W 29 SE NW NE 80 100 Alluvial 05/05/03 ND ND ND ND400708953216 72 Holt 61N 39W 29 SE NW NE 80 100 Alluvial 12/01/04 ND ND ND ND400708953216 72 Holt 61N 39W 29 SE NW NE 80 100 Alluvial 01/10/06 ND ND ND ND402347954457 73 Holt 63N 40W 29 SW SW SW 31 100 Alluvial 05/05/03 ND ND ND ND402347954457 73 Holt 63N 40W 29 SW SW SW 31 100 Alluvial 12/01/04 ND ND ND ND402347954457 73 Holt 63N 40W 29 SW SW SW 31 100 Alluvial 01/10/06 ND ND ND ND400275951847 74 Holt 60N 38W 8 SE SW SE 53 0 Glacial Drift 04/19/05 ND ND ND ND401299950928 75 Holt 61N 37W 5 NW NE NE 34 50 Glacial Drift 04/19/05 ND ND ND ND390120926244 76 Howard 49N 15W 29 NE,NE,SE 255 1200 Mississippian 05/10/04 ND ND ND ND390120926244 76 Howard 49N 15W 29 NE,NE,SE 255 1200 Mississippian 11/16/05 ND ND ND ND391340941849 77 Jackson 50N 30W 23 SE NW NE 101 1320 Alluvial 04/19/05 ND ND ND ND371958941256 78 Jasper 29N 29W 29 SW,SW,SW 200 100 Mississippian 03/08/04 ND ND ND ND388311937363 79 Johnson 47N 26W 36 SW NE NW 140 300 Pennsylvanian 08/17/04 ND ND ND ND400794921549 80 Knox 61N 11W 19 NE NE NE 100 10 Mississippian 04/30/03 ND ND ND ND401387923189 81 Knox 62N 13W 35 NE NE NW 302 200 Mississippian 03/28/05 ND ND ND ND401693921667 82 Knox 62N 11W 18 SW,SE,SW 162 1200 Mississippian 04/13/04 ND ND ND ND401901922234 83 Knox 62N 12W 10 NE NE SW 225 0 Mississippian 03/28/05 ND ND ND ND389584936172 84 Lafayette 48N 25W 13 SE NW NE 290 1320 Pennsylvanian 03/19/03 ND ND ND ND390224937616 85 Lafayette 49N 26W 27 NW NE NE 252 200 Pennsylvanian 03/19/03 ND ND ND ND369480940177 86 Lawrence 26N 28W 20 NE,SE,SW 156 1200 Mississippian 03/08/04 ND ND ND ND399616917057 87 Lewis 60N 07W 32 NW NE NW 200 1320 Mississippian 04/29/03 ND ND ND ND399616917057 87 Lewis 60N 07W 32 NW NE NW 200 1320 Mississippian 09/13/04 ND ND ND ND399616917057 87 Lewis 60N 07W 32 NW NE NW 200 1320 Mississippian 05/11/06 ND ND ND ND400070916550 88 Lewis 60N 07W 10 NE SE SE 90 100 Mississippian 04/29/03 ND ND ND ND400070916550 88 Lewis 60N 07W 10 NE SE SE 90 100 Mississippian 09/07/04 ND ND ND ND400354917995 89 Lewis 61N 08W 33 SW,SE,SW 204 150 Mississippian 04/13/04 ND ND ND ND400354917995 89 Lewis 61N 08W 33 SW,SE,SW 204 150 Mississippian 05/11/06 ND ND ND ND389751907399 90 Lincoln 49N 02E 25 SE SW SW 50 50 Alluvial 04/09/03 ND ND ND ND389751907399 90 Lincoln 49N 02E 25 SE SW SW 50 50 Alluvial 08/31/04 ND ND ND ND389624910780 91 Lincoln 49N 02W 36 SE SW SE 270 300 Mississippian 04/09/03 ND ND ND ND389624910780 91 Lincoln 49N 02W 36 SE SW SE 270 300 Mississippian 08/24/04 ND ND ND ND389624910780 91 Lincoln 49N 02W 36 SE SW SE 270 300 Mississippian 10/21/05 ND ND ND ND390190910380 92 Lincoln 49N 01W 17 NW NW NE 145 300 Mississippian 04/09/03 ND ND ND ND

Final Report to U.S.EPA Region VIIMissouri Department of Natural Resources - Water Resources Center
19
APPENDIX 1 (cont)
Well Report Map Quarter Total Depth Nearest Sample Alachlor Atrazine Metolachlor SimazineIdentifier Number County Township Range Section Section Depth (ft.) Field (ft.) Aquifer Date (μg/ L) (μg/ L) (μg/ L) (μg/ L)
390190910380 92 Lincoln 49N 01W 17 NW NW NE 145 300 Mississippian 08/31/04 ND ND ND ND390190910380 92 Lincoln 49N 01W 17 NW NW NE 145 300 Mississippian 10/21/05 ND ND ND ND390346908184 93 Lincoln 49N 02E 05 NW SW SW 160 50 Ordovician 04/09/03 ND ND ND ND390346908184 93 Lincoln 49N 02E 05 NW SW SW 160 50 Ordovician 06/05/06 ND ND ND ND397644930466 94 Linn 57N 19W 8 SE SE SE 50 300 Glacial Drift 05/02/05 ND ND ND ND399434936641 95 Livingston 59N 25W 12 NE SW NW 60 100 Pennsylvanian 05/02/05 ND ND ND ND397733923358 96 Macon 57N 13W 3 SE SW NE 73 200 Glacial Drift 03/28/05 ND ND ND ND399255915053 97 Marion 59N 06W 12 SE SE NE 78 50 Alluvial 04/29/03 ND ND ND ND399255915053 97 Marion 59N 06W 12 SE SE NE 78 50 Alluvial 09/07/04 ND ND ND ND399255915053 97 Marion 59N 06W 12 SE SE NE 78 50 Alluvial 05/11/06 ND ND ND ND397243917578 98 Marion 57N 08W 23 SE SW NE 100 30 Mississippian 04/15/03 ND ND ND ND397243917578 98 Marion 57N 08W 23 SE SW NE 100 30 Mississippian 09/07/04 ND ND ND ND397243917578 98 Marion 57N 08W 23 SE SW NE 100 30 Mississippian 05/12/06 ND ND ND ND397467917377 99 Marion 57N 08W 12 NW SE SE 85 20 Mississippian 04/15/03 ND ND ND ND397467917377 99 Marion 57N 08W 12 NW SE SE 85 20 Mississippian 09/07/04 ND ND ND ND402681935270 100 Mercer 63N 23W 7 NW SW SE 130 100 Glacial Drift 05/17/05 ND ND ND ND402712935340 101 Mercer 63N 23W 7 NE NW SW 100 0 Glacial Drift 05/17/05 ND ND ND ND366587892825 102 Mississippi 23N 16E 12 NW,NW,NW 53 50 Alluvial 04/25/02 ND ND ND ND366587892825 102 Mississippi 23N 16E 12 NW,NW,NW 53 50 Alluvial 09/10/03 ND ND ND ND367767892103 103 Mississippi 25N 17E 27 SW,SW,SW 40 50 Alluvial 04/24/02 ND ND ND ND367786893564 104 Mississippi 25N 16E 29 NW,SW,SW 30 50 Alluvial 04/17/02 ND ND ND ND367786893564 104 Mississippi 25N 16E 29 NW,SW,SW 30 50 Alluvial 09/10/03 ND ND ND ND367786893564 104 Mississippi 25N 16E 29 NW,SW,SW 30 50 Alluvial 03/08/06 ND ND ND ND368623893192 105 Mississippi 26N 16E 34 NW,NW,NW 25 200 Alluvial 09/10/03 ND ND ND ND368623893192 105 Mississippi 26N 16E 34 NW,NW,NW 25 200 Alluvial 03/08/06 ND ND ND ND369217894072 106 Mississippi 26N 15E 2 SE,SW,SW 23 50 Alluvial 04/24/02 ND ND ND ND369217894072 106 Mississippi 26N 15E 2 SE,SW,SW 23 50 Alluvial 09/16/03 ND ND ND ND369217894072 106 Mississippi 26N 15E 2 SE,SW,SW 23 50 Alluvial 03/08/06 ND ND ND ND369394892208 107 Mississippi 27N 17E 33 NW,SW,SE 50 100 Alluvial 04/24/02 ND ND ND ND386393927672 108 Moniteau 45N 17W 27 NE,NE,NE 160 300 Ordovician 03/22/04 ND ND ND ND386393927672 108 Moniteau 45N 17W 27 NE,NE,NE 160 300 Ordovician 11/16/05 ND ND ND ND396388918664 109 Monroe 56N 09W 23 SE SE NE 116 200 Glacial Drift 03/01/05 ND ND ND ND391010913160 110 Montgomery 50N 04W 14 SE NE SE 179 100 Mississippian 04/09/03 ND ND ND ND387474914633 111 Montgomery 46N 05W 15 SW NW SE 340 300 Ordovician 06/06/05 ND ND ND ND387474914633 111 Montgomery 46N 05W 15 SW NW SE 340 300 Ordovician 06/05/06 ND ND ND ND388121915052 112 Montgomery 47N 05W 29 SE SW NW 230 1200 Ordovician 06/06/05 ND ND ND ND388121915052 112 Montgomery 47N 05W 29 SE SW NW 230 1200 Ordovician 06/05/06 ND ND ND ND386631928569 113 Morgan 45N 18W 13 SW,SW,NW 213 1200 Ordovician 03/22/04 ND ND ND ND386631928569 113 Morgan 45N 18W 13 SW,SW,NW 213 1200 Ordovician 11/16/05 ND ND ND ND364381898089 114 New Madrid 21N 12E 24 SE,SE,SE 30 100 Alluvial 04/17/02 ND ND ND ND364381898089 114 New Madrid 21N 12E 24 SE,SE,SE 30 100 Alluvial 09/24/03 ND ND ND ND364719896822 115 New Madrid 21N 13E 7 NE,SE,SE 43 40 Alluvial 04/02/02 ND ND ND ND364719896822 115 New Madrid 21N 13E 7 NE,SE,SE 43 40 Alluvial 03/21/06 ND ND ND ND365522898214 116 New Madrid 22N 11E 13 Nw,NE,NW 35 700 Alluvial 04/16/02 ND ND ND ND365522898214 116 New Madrid 22N 11E 13 NW,NE,NW 35 700 Alluvial 09/24/03 ND ND ND ND365522898214 116 New Madrid 22N 11E 13 NW,NE,NW 35 700 Alluvial 03/07/06 ND ND ND ND365547896783 117 New Madrid 22N 13E 17 NE,NW,NW 50 100 Alluvial 04/03/02 ND ND ND ND365838898096 118 New Madrid 22N 12E 6 NW,NW,NW 22 100 Alluvial 09/24/03 ND ND ND ND366128896047 119 New Madrid 23N 13E 25 NW,NE,NW <50 100 Alluvial 04/16/02 ND ND ND ND367089896631 120 New Madrid 24N 13E 21 SW,SW,NW 20 10 Alluvial 04/16/02 0.88 ND ND ND367089896631 120 New Madrid 24N 13E 21 SW SW NW 20 10 Alluvial 03/25/03 ND ND ND ND367089896631 120 New Madrid 24N 13E 21 SW,SW,NW 20 10 Alluvial 09/16/03 ND ND ND ND367089896631 120 New Madrid 24N 13E 21 SW,SW,NW 31 10 Alluvial 05/23/06 1.97 ND ND ND367817895183 121 New Madrid 25N 14E 26 SW,SW,NW 22 50 Alluvial 04/16/02 ND ND ND ND367817895183 121 New Madrid 25N 14E 26 SW,SW,NW 22 50 Alluvial 09/16/03 ND ND ND ND367817895183 121 New Madrid 25N 14E 26 SW,SW,NW 22 50 Alluvial 03/21/06 ND ND ND ND367887896205 122 New Madrid 25N 13E 23 SW,SW,SE 25 100 Alluvial 09/16/03 ND ND ND ND367887896205 122 New Madrid 25N 13E 23 SW,SW,SE 25 100 Alluvial 03/07/06 ND ND ND ND369945940723 123 Newton 26N 29W 2 SW,NE,SW 140 200 Mississippian 03/08/04 ND ND ND ND401565948637 124 Nodaway 62N 35W 29 NE,NE,NW 48 300 Glacial Drift 04/27/04 ND ND ND ND403142949229 125 Nodaway 64N 36W 35 SE,NE,NW 57 100 Glacial Drift 04/27/04 ND ND ND ND403653946943 126 Nodaway 64N 34W 11 SE,SE,NW 25 100 Glacial Drift 04/27/04 ND ND ND ND384427917766 127 Osage 43N 08W 26 SW,SW,SE 150 150 Ordovician 02/18/04 ND ND ND ND360736898036 128 Pemiscot 17N 12E 31 NE,NW,NW 50 50 Alluvial 03/14/02 ND ND ND ND360736898036 128 Pemiscot 17N 12E 31 NE,NW,NW 50 50 Alluvial 09/15/03 ND ND ND ND360736898036 128 Pemiscot 17N 12E 31 NE,NW,NW 50 50 Alluvial 04/26/06 ND ND ND ND361174898450 129 Pemiscot 17N 11E 10 SW,SE,SE 47 200 Alluvial 09/15/03 ND ND ND ND361174898450 129 Pemiscot 17N 11E 10 SW,SE,SE 47 200 Alluvial 04/26/06 ND ND ND ND361533898703 130 Pemiscot 17N 11E 33 NE,NE,SW 20 30 Alluvial 03/27/02 ND ND ND ND361533898703 130 Pemiscot 17N 11E 33 NE,NE,SW 20 30 Alluvial 09/15/03 ND ND ND ND361533898703 130 Pemiscot 17N 11E 33 NE,NE,SW 20 30 Alluvial 03/07/06 ND ND ND ND362206897383 131 Pemiscot 18N 12E 3 SE,SE,SE <50 10 Alluvial 04/02/02 ND ND ND ND363400899343 132 Pemiscot 20N 10E 26 NE,SE,SE 20 20 Alluvial 03/26/02 ND ND ND ND363400899343 132 Pemiscot 20N 10E 26 NE,SE,SE 20 20 Alluvial 09/24/03 ND ND ND ND363400899343 132 Pemiscot 20N 10E 26 NE,SE,SE 20 20 Alluvial 03/07/06 ND ND ND ND363636897292 133 Pemiscot 20N 12E 23 NE,NE,NW 25 100 Alluvial 03/27/02 ND ND ND ND363636897292 133 Pemiscot 20N 12E 23 NE,NE,NW 25 100 Alluvial 04/26/06 ND ND ND ND376106898109 134 Perry 34N 11E 34 NE,SW,NW 125 1200 Paleozoic Undiff. 02/25/04 ND ND ND ND

Final Report to U.S.EPA Region VIIMissouri Department of Natural Resources - Water Resources Center
20
APPENDIX 1 (cont)
Well Report Map Quarter Total Depth Nearest Sample Alachlor Atrazine Metolachlor SimazineIdentifier Number County Township Range Section Section Depth (ft.) Field (ft.) Aquifer Date (μg/ L) (μg/ L) (μg/ L) (μg/ L)
376106898109 134 Perry 34N 11E 34 NE,SW,NW 125 1200 Paleozoic Undiff. 04/25/06 ND ND ND ND376587898385 135 Perry 34N 11E 8 SW,SE,SE 165 200 Paleozoic Undiff. 11/13/03 ND ND ND ND376587898385 135 Perry 34N 11E 8 SW,SE,SE 165 200 Paleozoic Undiff. 04/25/06 ND ND ND ND385948931390 136 Pettis 44N 20W 09 NW SW SW 110 200 Ordovician 05/21/03 ND ND ND ND385948931390 136 Pettis 44N 20W 09 NW SW SW 110 200 Ordovician 08/17/04 ND ND ND ND385948931390 136 Pettis 44N 20W 09 NW SW SW 110 200 Ordovician 10/27/05 ND ND ND ND386260932569 137 Pettis 45N 21W 32 SE SE SW 100 300 Ordovician 05/21/03 ND ND ND ND386260932569 137 Pettis 45N 21W 32 SE SE SW 100 300 Ordovician 08/10/04 ND ND ND ND387218931099 138 Pettis 46N 20W 34 SW NE NW 155 100 Ordovician 05/21/03 ND ND ND ND387218931099 138 Pettis 46N 20W 34 SW NE NW 155 100 Ordovician 08/10/04 ND ND ND ND387218931099 138 Pettis 46N 20W 34 SW NE NW 155 100 Ordovician 10/27/05 ND ND ND ND388216933872 139 Pettis 47N 23W 25 SE,SE,SE 140 300 Pennsylvanian 03/22/04 ND ND ND ND394740912971 140 Pike 54N 04W 12 SE NE NW 261 300 Ordovician 04/15/03 ND ND ND ND394740912971 140 Pike 54N 04W 12 SE NE NW 261 300 Ordovician 08/31/04 ND ND ND ND394740912971 140 Pike 54N 04W 12 SE NE NW 261 300 Ordovician 11/22/05 ND ND ND ND395033913405 141 Pike 55N 04W 34 SE NW NW 100 600 Ordovician 04/15/03 ND ND ND ND395033913405 141 Pike 55N 04W 34 SE NW NW 100 600 Ordovician 08/31/04 ND ND ND ND395033913405 141 Pike 55N 04W 34 SE NW NW 100 600 Ordovician 11/22/05 ND ND ND ND394974912610 142 Pike 55N 03W 32 NW NW SE 128 20 Ordovician 04/15/03 ND 0.78 ND ND394974912610 142 Pike 55N 03W 32 NW NW SE 128 20 Ordovician 06/11/03 ND ND ND ND394974912610 142 Pike 55N 03W 32 NW,NW,SE 128 20 Ordovician 04/13/04 ND ND ND ND394974912610 142 Pike 55N 03W 32 NW,NW,SE 128 20 Ordovician 11/22/05 ND ND ND ND395129947402 143 Platte 54N 34W 8 NW NW NE 55 5 Glacial Drift 04/18/05 ND ND ND ND405287933606 144 Putnam 66N 22W 15 NW NE NE 60 100 Glacial Drift 05/03/05 ND ND ND ND405400927731 145 Putnam 66N 17W 11 NE SW NE 50 100 Glacial Drift 05/03/05 ND ND ND ND405784931525 146 Putnam 67N 20W 28 SE SW NE 30 0 Glacial Drift 05/03/05 ND ND ND ND395711915151 147 Ralls 55N 06/ 01 SE SW SE 17 100 Mississippian 04/14/03 ND ND ND ND395711915151 147 Ralls 55N 06W 01 SE SW SE 17 100 Mississippian 09/13/04 ND ND ND ND395711915151 147 Ralls 55N 06/ 01 SE SW SE 17 100 Mississippian 05/11/06 ND ND ND ND396696913727 148 Ralls 56N 04W 08 NW NE NW 62 300 Mississippian 04/14/03 ND ND ND ND396696913727 148 Ralls 56N 04W 08 NW NE NW 62 300 Mississippian 09/13/04 ND ND ND ND396696913727 148 Ralls 56N 04W 08 NW NE NW 62 300 Mississippian 05/11/06 ND ND ND ND394346926989 149 Randolph 54N 16W 34 SE NW SW 115 300 Glacial Drift 05/02/05 ND ND ND ND393922923533 150 Randolph 53N 13W 15 NE NW NE 346 100 Mississippian 03/01/05 ND ND ND ND391984941680 151 Ray 51N 29W 28 SE NE SW 23 100 Alluvial 04/02/03 ND ND ND ND391984941680 151 Ray 51N 29W 28 SE NE SW 23 100 Alluvial 10/26/04 ND ND ND ND391984941680 151 Ray 51N 29W 28 SE NE SW 23 100 Alluvial 10/20/05 ND ND ND ND392724938547 152 Ray 52N 26W 31 NW NE SE 30 50 Alluvial 04/02/03 ND ND ND ND392724938547 152 Ray 52N 26W 31 NW NE SE 30 50 Alluvial 10/26/04 ND ND ND ND392724938547 152 Ray 52N 26W 31 NW NE SE 30 50 Alluvial 04/04/06 ND ND ND ND392795939233 153 Ray 52N 27W 27 SE SW SW 100 100 Pennsylvanian 04/18/05 ND ND ND ND365043907017 154 Ripley 22N 03E 36 SW,NW,SE 35 200 Alluvial 11/12/03 ND ND ND ND365043907017 154 Ripley 22N 03E 36 SW,NW,SE 35 200 Alluvial 09/27/05 ND ND ND ND391747934275 155 Saline 51N 23W 27 SW,SW,SW 60 100 Alluvial 05/30/02 ND ND ND ND391747934275 155 Saline 51N 23W 27 SW,SW,SW 60 100 Alluvial 04/26/06 ND ND ND ND391325929531 156 Saline 50N 19W 12 NW,NW,NW 250 300 Mississippian 05/23/02 ND ND ND ND392736931667 157 Saline 52N 21W 24 NE,SW,SW 290 100 Mississppian 05/30/02 ND ND ND ND404112923781 158 Schuyler 65N 13W 29 NW NW SE 188 0 Glacial Drift 03/28/05 ND ND ND ND405581926493 159 Schuyler 66N 16W 1 SW NE NW 60 300 Glacial Drift 05/03/05 ND ND ND ND403041920891 160 Scotland 64N 11W 35 SW SW SE 40 0 Glacial Drift 03/28/05 ND ND ND ND403907921688 161 Scotland 64N 11W 6 NE NE NW 228 0 Glacial Drift 03/28/05 ND ND ND ND369508895472 162 Scott 27N 14E 28 SW,SW,SE 35 1320 Alluvial 04/30/02 ND ND ND ND369508895472 162 Scott 27N 14E 28 SW,SW,SE 35 1320 Alluvial 04/12/06 ND ND ND ND369828896853 163 Scott 27N 13E 17 NW,NW,SW 35 100 Alluvial 04/30/02 ND ND ND ND369828896853 163 Scott 27N 13E 17 NW,NW,SW 35 100 Alluvial 11/12/03 ND ND ND ND369828896853 163 Scott 27N 13E 17 NW,NW,SW 35 100 Alluvial 04/12/06 ND ND ND ND370731894164 164 Scott 28N 15E 20 SW,NE,SE 40 20 Alluvial 04/25/02 ND ND ND ND370731894164 164 Scott 28N 15E 20 SW,NE,SE 40 20 Alluvial 09/23/03 ND ND ND ND370731894164 164 Scott 28N 15E 20 SW,NE,SE 40 20 Alluvial 04/12/06 ND ND ND ND399039919560 165 Shelby 59N 09W 24 NE,NE,NE 80 1200 Glacial Drift 04/14/04 ND ND ND ND399039919560 165 Shelby 59N 09W 24 NE,NE,NE 80 1200 Glacial Drift 05/11/06 ND ND ND ND397807918453 166 Shelby 58N 09W 36 NE NE SE 130 20 Glacial Drift 04/15/03 ND ND ND ND397807918453 166 Shelby 58N 09W 36 NE NE SE 130 20 Glacial Drift 05/11/06 ND ND ND ND388428904991 167 St. Charles 47N 05E 07 SW NW SE 28 50 Alluvial 04/08/03 ND ND ND ND388428904991 167 St. Charles 47N 05E 07 SW NW SE 28 50 Alluvial 11/16/04 ND ND ND ND388428904991 167 St. Charles 47N 05E 07 SW NW SE 28 50 Alluvial 11/02/05 ND ND ND ND388689904874 168 St. Charles 48N 05E 32 SE SW SW 50 100 Alluvial 04/08/03 ND ND ND ND388689904874 168 St. Charles 48N 05E 32 SE SW SW 50 100 Alluvial 08/24/04 ND ND ND ND388689904874 168 St. Charles 48N 05E 32 SE SW SW 50 100 Alluvial 11/02/05 ND ND ND ND388913904775 169 St. Charles 48N 05E 29 SW SE NE 78 200 Alluvial 04/08/03 ND ND ND ND388913904775 169 St. Charles 48N 05E 29 SW SE NE 78 200 Alluvial 08/24/04 ND ND ND ND388913904775 169 St. Charles 48N 05E 29 SW SE NE 78 200 Alluvial 11/02/05 ND ND ND ND385843908398 170 St. Charles 44N 02E 07 SE SW NE 170 1320 Ordovician 04/08/03 ND ND ND ND385843908398 170 St. Charles 44N 02E 07 SE SW NE 170 1320 Ordovician 06/05/06 ND ND ND ND388254909179 171 St. Charles 47N 01E 16 SW SE SW 118 300 Mississippian 04/08/03 ND ND ND ND388254909179 171 St. Charles 47N 01E 16 SW SE SW 118 300 Mississippian 11/02/05 ND ND ND ND379559939383 172 St. Clair 37N 27W 19 SW,SE,SE 225 100 Ordovician 06/03/04 ND ND ND ND381866938499 173 St. Clair 39N 27W 1 NW,NW,SW 210 200 Pennsylvanian 06/03/04 ND ND ND ND
Final Report to U.S.EPA Region VIIMissouri Department of Natural Resources - Water Resources Center
21
APPENDIX 1 (cont)
Well Report Map Quarter Total Depth Nearest Sample Alachlor Atrazine Metolachlor SimazineIdentifier Number County Township Range Section Section Depth (ft.) Field (ft.) Aquifer Date (μg/ L) (μg/ L) (μg/ L) (μg/ L)
378307900271 174 Ste. Genevieve 36N 09E 15 NW,NW,NE 178 600 Ordovician 02/25/04 ND ND ND ND378453900218 175 Ste. Genevieve 36N 09E 10 NW,NE,NE 178 300 Ordovician 02/25/04 ND ND ND ND378453900218 175 Ste. Genevieve 36N 09E 10 NW,NE,NE 178 300 Ordovician 04/25/06 ND ND ND ND366869898489 176 Stoddard 24N 11E 27 SW,SE,SE <50 50 Alluvial 03/07/02 ND ND ND ND366869898489 176 Stoddard 24N 11E 27 SW,SE,SE <50 50 Alluvial 03/21/06 ND ND ND ND366869898589 177 Stoddard 24N 11E 27 SE,SW,SW 35 100 Alluvial 03/07/02 ND ND ND ND366869898589 177 Stoddard 24N 11E 27 SE,SW,SW 35 100 Alluvial 09/16/03 ND ND ND ND366869898589 177 Stoddard 24N 11E 27 SE,SW,SW 35 100 Alluvial 03/21/06 ND ND ND ND367912898622 178 Stoddard 25N 11E 21 NE,SE,SE 30 100 Alluvial 09/23/03 ND ND ND ND367912898622 178 Stoddard 25N 11E 21 NE,SE,SE 30 100 Alluvial 03/21/06 ND ND ND ND367961901878 179 Stoddard 25N 08E 22 NE,NW,SW 85 50 Alluvial 02/20/02 ND ND ND ND367961901878 179 Stoddard 25N 08E 22 NE,NW,SW 85 50 Alluvial 09/23/03 ND ND ND ND367961901878 179 Stoddard 25N 08E 22 NE,NW,SW 85 50 Alluvial 03/22/06 ND ND ND ND368031898350 180 Stoddard 25N 11E 14 SE,SE,SW <50 50 Alluvial 03/07/02 ND ND ND ND368031898350 180 Stoddard 25N 11E 14 SE,SE,SW <50 50 Alluvial 09/16/03 ND ND ND ND368031898350 180 Stoddard 25N 11E 14 SE,SE,SW <50 50 Alluvial 03/21/06 ND ND ND ND368414901144 181 Stoddard 25N 09E 5 SW,NW,NW <100 100 Alluvial 03/06/02 ND ND ND ND368414901144 181 Stoddard 25N 09E 5 SW,NW,NW <100 100 Alluvial 09/23/03 ND ND ND ND368414901144 181 Stoddard 25N 09E 5 SW,NW,NW <100 100 Alluvial 03/22/06 ND ND ND ND368733898067 182 Stoddard 26N 12E 30 SW,NW,NW 28 100 Alluvial 09/23/03 ND ND 3.74 ND368733898067 182 Stoddard 26N 12E 30 SW,NW,NW 28 100 Alluvial 12/02/03 ND ND ND ND368733898067 182 Stoddard 26N 12E 30 SW,NW,NW 28 100 Alluvial 08/30/05 ND ND ND ND369147900467 183 Stoddard 26N 09E 11 C,SW,NE 135 600 Cretaceous 04/30/02 ND ND ND ND369147900467 183 Stoddard 26N 09E 11 C,SW,NE 135 600 Cretaceous 09/23/03 ND ND ND ND369147900467 183 Stoddard 26N 09E 11 C,SW,NE 135 600 Cretaceous 08/30/05 ND ND ND ND370286898361 184 Stoddard 27N 11E 2 NE,SW,NW 170 1320 Cretaceous 04/30/02 ND ND ND ND370286898361 184 Stoddard 27N 11E 2 NE,SW,NW 170 1320 Cretaceous 04/12/06 ND ND ND ND368601898785 185 Stoddard 26N 11E 33 NW,NW,NW 94 300 Tertiary 09/23/03 ND ND ND ND368601898785 185 Stoddard 26N 11E 33 NW,NW,NW 94 300 Tertiary 05/24/06 ND ND ND ND368758898778 186 Stoddard 26N 11E 21 SW,SW,SW 97 50 Tertiary 04/30/02 ND ND ND ND368758898778 186 Stoddard 26N 11E 21 SW,SW,SW 97 50 Tertiary 05/24/06 ND ND ND ND368867899553 187 Stoddard 26N 10E 22 NW,SW,NE 176 600 Tertiary 04/30/02 ND ND ND ND368867899553 187 Stoddard 26N 10E 22 NW,SW,NE 176 600 Tertiary 09/23/03 ND ND ND ND368867899553 187 Stoddard 26N 10E 22 NW,SW,NE 176 600 Tertiary 08/30/05 ND ND ND ND377462941108 188 Vernon 34N 29W 4 NE,NW,NE 345 100 Mississippian 03/09/04 ND ND ND ND387984913601 189 Warren 47N 04W 33 SE,NE,NE 285 1200 Ordovician 04/21/04 ND ND ND ND387984913601 189 Warren 47N 04W 33 SE,NE,NE 285 1200 Ordovician 11/02/05 ND ND ND ND405226945751 190 Worth 66N 32W 18 NW NW SW 50 0 Glacial Drift 03/22/05 ND ND ND ND
ND = Not Detected(μg/L) = micrograms per literft. = feet