Embed Size (px)
Citation preview

WESTFIELD RIVER CROSSING STUDY
Russell, MA
August 2019
PREPARED FOR
MassDOT Office of Transportation Planning
PREPARED BY
226 Causeway Street, 6th Floor Boston, MA 02114www.stantec.com
Cover Image: Massachusetts Historic Commission Bridge Street Bridge (Woronoco Village, Russell) Inventory Form
ACKNOWLEDGEMENTSThe preparation of this report has been funded in part through grant[s] from the Federal Highway Administration, U.S. Department of Transportation, under the State Planning and Research Program, Section 505 [or Metropolitan Planning Program, Section 104(b)] of Title 23, U.S. Code. The contents of this report do not necessarily reflect the official view or policies of the Massachusetts Department of Transportation or the Federal Highway Administration. This report does not constitute a standard, specification, or regulation.

CONTENTS
1.0 INTRODUCTION 5
2.0 EXISTING CONDITIONS 9
2.1 Population Trends and Forecasts 92.2 Housing Characteristics 112.3 Economic Conditions 112.4 Environmental Conditions 172.5 Traffic Conditions 172.6 Bridge Street Bridge History and Condition 212.7 Valley View Avenue Bridge History and Condition 22
3.0 WESTFIELD RIVER BRIDGE CROSSING SCENARIOS 23
3.1 Summary of Crossing Scenarios 25
4.0 REDEVELOPMENT OPPORTUNITIES AND CHALLENGES 27
4.1 Redevelopment Opportunities 274.2 Redevelopment Challenges 284.3 Necessary Infrastructure Improvements 294.4 Resources to Support Infrastructure Improvements 314.5 Potential Funding for Bridge Rehabilitation or Replacement 33
5.0 ECONOMIC AND TRAFFIC IMPACT OF DEVELOPMENT 37
5.1 Economic Impact 375.2 Forecast Traffic Volumes 37
6.0 CONCLUSION 45
APPENDIX A: BRIDGE AND HIGHWAY MEMO 47
APPENDIX B: BRIDGE INSPECTION REPORTS 53
APPENDIX C: CONCEPTUAL COST ESTIMATES 83
APPENDIX D: POTENTIAL ECONOMIC, SOCIAL, ANDCULTURAL BENEFITS OF THE BRIDGE REPLACEMENT 93
APPENDIX E: TRAFFIC DATA 115

4
FIGURES AND TABLES
FIGURES
Figure 1 Regional Location 6Figure 2 Woronoco Village 7Figure 3 Competitive Development Locations 13Figure 4 Rare Species Habitat 16Figure 5 Wetland and Water Resources 17Figure 6 2018 Existing Daily Volume 19Figure 7 2018 Existing Peak Hour Volumes 20Figure 8 Potential Intersection Improvements 34Figure 9 No Build Scenario 2038 Forecasted Peak Hour Volumes 39Figure 10 Warehousing Scenario 2038 Forecasted Peak Hour Volumes 42Figure 11 Manufacturing Scenario 2038 Forecasted Peak Hour Volumes 43
TABLES
Table 1 Current and Forecast Population (2017 - 2035) 10Table 2 Housing Units and Vacancy Rates 10Table 4 Income 14Table 5 Employment Trends, Hampden County (2015 - 2017) 15Table 6 Employment Forecasts, Hampden County (2019 - 2023) 15Table 7 Employment trends, Springfield ma-ct necta (2015 - 2018) 16Table 8 Base Year (2018) Traffic Volumes 18Table 9 Replacement Bridge Conceptual Cost Estimate 24Table 10 Replacement Bridge Location Summary 26Table 11 Potential Intersection Improvements 33Table 12 Mill #2 Industry Development Opportunities 38Table 13 Trip Generation Scenarios: Higher and Lower Generating Uses 41
5
1.0 INTRODUCTION
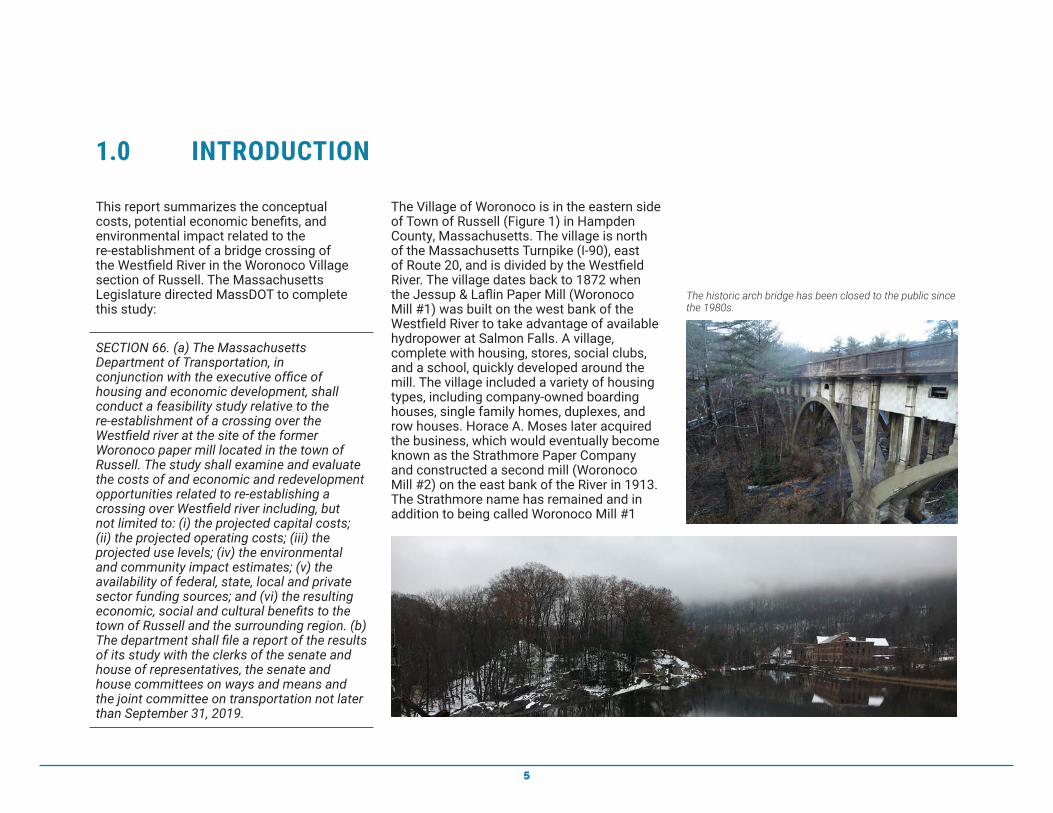
This report summarizes the conceptual costs, potential economic benefits, and environmental impact related to the re‑establishment of a bridge crossing of the Westfield River in the Woronoco Village section of Russell. The Massachusetts Legislature directed MassDOT to complete this study:
SECTION 66. (a) The Massachusetts Department of Transportation, in conjunction with the executive office of housing and economic development, shall conduct a feasibility study relative to the re‑establishment of a crossing over the Westfield river at the site of the former Woronoco paper mill located in the town of Russell. The study shall examine and evaluate the costs of and economic and redevelopment opportunities related to re‑establishing a crossing over Westfield river including, but not limited to: (i) the projected capital costs; (ii) the projected operating costs; (iii) the projected use levels; (iv) the environmental and community impact estimates; (v) the availability of federal, state, local and private sector funding sources; and (vi) the resulting economic, social and cultural benefits to the town of Russell and the surrounding region. (b) The department shall file a report of the results of its study with the clerks of the senate and house of representatives, the senate and house committees on ways and means and the joint committee on transportation not later than September 31, 2019.
The Village of Woronoco is in the eastern side of Town of Russell (Figure 1) in Hampden County, Massachusetts. The village is north of the Massachusetts Turnpike (I‑90), east of Route 20, and is divided by the Westfield River. The village dates back to 1872 when the Jessup & Laflin Paper Mill (Woronoco Mill #1) was built on the west bank of the Westfield River to take advantage of available hydropower at Salmon Falls. A village, complete with housing, stores, social clubs, and a school, quickly developed around the mill. The village included a variety of housing types, including company‑owned boarding houses, single family homes, duplexes, and row houses. Horace A. Moses later acquired the business, which would eventually become known as the Strathmore Paper Company and constructed a second mill (Woronoco Mill #2) on the east bank of the River in 1913. The Strathmore name has remained and in addition to being called Woronoco Mill #1
The historic arch bridge has been closed to the public since the 1980s.

6
§̈¦90
§̈¦91
§̈¦95
§̈¦93
§̈¦84
§̈¦90
§̈¦495
§̈¦195
§̈¦290
§̈¦190
§̈¦395
§̈¦391
§̈¦295
£¤6
£¤5
£¤20
£¤3
£¤202
£¤1
£¤7
£¤44
")3
")2
")24
")9
")8
")28
")25
")18
Åõ128
£20
§̈¦90
RUSSELL
BLANDFORD
HUNTINGTON
MONTGOMERY
WESTFIELD
GRANVILLE
³±
£20
£202
3
£20
£202
£20
£202
£20
")23
")10
")57")57
")10
Åõ112
")10
§̈¦90
§̈¦90
WORONOCOVILLAGE
WestfieldRiver
RUSSELLCENTER
BarnesMunicipal
Airport
WestfieldState
University
0 1
MileN
and Woronoco Mill #2, they are often referred to as the Strathmore Mills. To support the expanded plant operations, worker housing and other community facilities were also constructed on the east side of the river along Tekoa Avenue and Valley View Avenue (Figure 2).
Like many New England communities, transportation and technological changes in the second half of the 20th century led to reduced economic activity in Woronoco and the two mills eventually ceased operation. Mill #1 ended all papermaking operations in 1993 and Mill #2 followed in 1999. No commercial activity currently takes place at Mill #1, while limited lumber sorting operations occur in the area surrounding Mill #2 (no activities occur within the building itself). Many of the surrounding homes, stores, and community facilities have been demolished. The once‑bustling portion of the village east of the river now is now home to only about seventeen families.
Prior to the mills closing, the historic Strathmore Mill Bridge (also known as the Woronoco Bridge or the Bridge Street Crossing), which connects the east and west sides of Woronoco Village across the Westfield River, was closed in 1986 due to structural deficiencies. Though it has been closed for more than 30 years, the Bridge Street Bridge holds the sewer and water pipes that service residents on the east side of the river. To ensure continued access across the Westfield River for mill workers and residents, MassDOT constructed a single‑lane temporary bridge a quarter‑mile north of Bridge Street at Valley View Avenue in 1986. Today, this bridge is the only roadway access point to the eastern side of the river in Woronoco Village. Since this bridge was
FIGURE 1REGIONAL LOCATION

7
FIGURE 2WORONOCO VILLAGE
")23
£¤20
£¤20
§̈¦90
Woronoco
Road
Laure l Road
Old
Rou
te23
Hi l l Street
Pochassic Road
Va lley
Vi ew
Avenue
Mountain ViewTerrace
Bridge Street Tekoa Avenue
Ma ssachusetts Turnpike
Wes
tfi e
l dR
o ad
Blandford
Road
Br idge Street Bridge
Valley View Avenue Bridge
Wes
tfiel
dRi
ver
CSXRAIL
ROADTRACKS
Westfield
RiverPotash Brook Hydro
ElectricPlant
S:\1
794\
Activ
e\17
9410
572\
GIS
\mxd
\Fig
ure-
2 _W
oron
o Vi
llage
Map
.mxd
Rev
ised
: 201
9-05
-08
By:
wod
uwol
e
Figure 2: Woronoco Village Map
Notes1. Coordinate System: NAD 1983 StatePlane Massachusetts Mainland FIPS 20012. Data Sources: MassGIS3. Background: Source: Esri, DigitalGlobe, GeoEye, Earthstar Geographics, CNES/Airbus DS, USDA, USGS, AeroGRID, IGN, and the GIS User Community
($$¯
MILL 1
LegendBridge Street Bridge (Closed) Valley View Avenue Bridge(Single Lane Temporary)Eagle Creek Hydro ElectricPower Plant
InterstateU.S. HighwayMinor RoadCSX Rail Road Tracks
0 250 500125Feet
MILL 2
")23
£¤20
£¤20
§̈¦90
Woronoco
Road
Laure l Road
Old
Rou
te23
Hi l l Street
Pochassic Road
Va lley
Vi ew
Avenue
Mountain ViewTerrace
Bridge Street Tekoa Avenue
Ma ssachusetts Turnpike
Wes
tfi e
l dR
o ad
Blandford
Road
Br idge Street Bridge
Valley View Avenue Bridge
Wes
tfiel
dRi
ver
CSXRAIL
ROADTRACKS
Westfield
River
Potash Brook HydroElectricPlant
S:\1
794\
Activ
e\17
9410
572\
GIS
\mxd
\Fig
ure-
2 _W
oron
o Vi
llage
Map
.mxd
Rev
ised
: 201
9-05
-08
By:
wod
uwol
e
Figure 2: Woronoco Village Map
Notes1. Coordinate System: NAD 1983 StatePlane Massachusetts Mainland FIPS 20012. Data Sources: MassGIS3. Background: Source: Esri, DigitalGlobe, GeoEye, Earthstar Geographics, CNES/Airbus DS, USDA, USGS, AeroGRID, IGN, and the GIS User Community
($$¯
MILL 1
LegendBridge Street Bridge (Closed) Valley View Avenue Bridge(Single Lane Temporary)Eagle Creek Hydro ElectricPower Plant
InterstateU.S. HighwayMinor RoadCSX Rail Road Tracks
0 250 500125Feet
MILL 2

8
intended to be a temporary crossing and it is now approaching the end of its usable life, this feasibility study was conducted to assess the costs of and economic and redevelopment opportunities related to establishing a permanent bridge crossing over Westfield River. For the 17 families that live on the east side of Woronoco Village, roadway access across the river is essential.
This study examines two possible access alternatives:
• Rehabilitate the Valley View Avenue Bridge, and
• Construct a new 2‑lane bridge (either at the original Bridge Street crossing location or existing Valley View Avenue crossing).
A new bridge crossing could support economic development at the vacant Mill #2. However, economic development at this location would require more than a new bridge as there are numerous location and economic challenges that may limit redevelopment opportunities. These challenges include insufficient water capacity for fire suppression, a limited labor market, a lack of broadband internet access, a lack of easy access to an interstate highway, and a lack of targeted business incentives for site development.
Historic photograph of the Bridge Street crossing.

9
2.0 EXISTING CONDITIONS
To understand the potential economic, social, and transportation factors that will inform the decision to improve access over the Westfield River in Woronoco Village, the existing conditions in the Village were explored. This section summarizes the current demographics, economic status, and transportation conditions in Russell, with a focus on Woronoco Village.
2.1 Population Trends and ForecastsIn the early 1900s, the Village of Woronoco was comprised of a concentration of single‑family houses, apartments, stores, schools, social clubs, and other community facilities. Its growth and development centered primarily around the two paper mills operated by the Strathmore Paper Company. These mills ceased operations in 1993 (Mill #1) and 1999 (Mill #2). Both mills are currently abandoned and many of the surrounding homes, stores, and community facilities have been demolished. Leading up to the mills’ closure and continuing to today, Woronoco Village has had a decreasing population.
The demand for residential or commercial development at the Woronoco Mills in future years depends, in part, on the expected population growth. Population trends and forecasts were evaluated to complement employment data to better understand expected housing needs and growth in the surrounding labor market. The U.S. Census American Community Survey estimates
that Russell’s population decreased by 25% between 2010 and 2017, from 1,775 residents in 2010 to 1,330 residents in 2017. This decline is not matched by Hampden County, where the population remained relatively stable. Over the same period, the nearby city of Westfield has experienced marginal gains in population with a compounded annual growth rate (CAGR) of 0.2%. These low growth rates indicate slow growth in the surrounding labor market and likely mean there will be weak demand for additional housing.
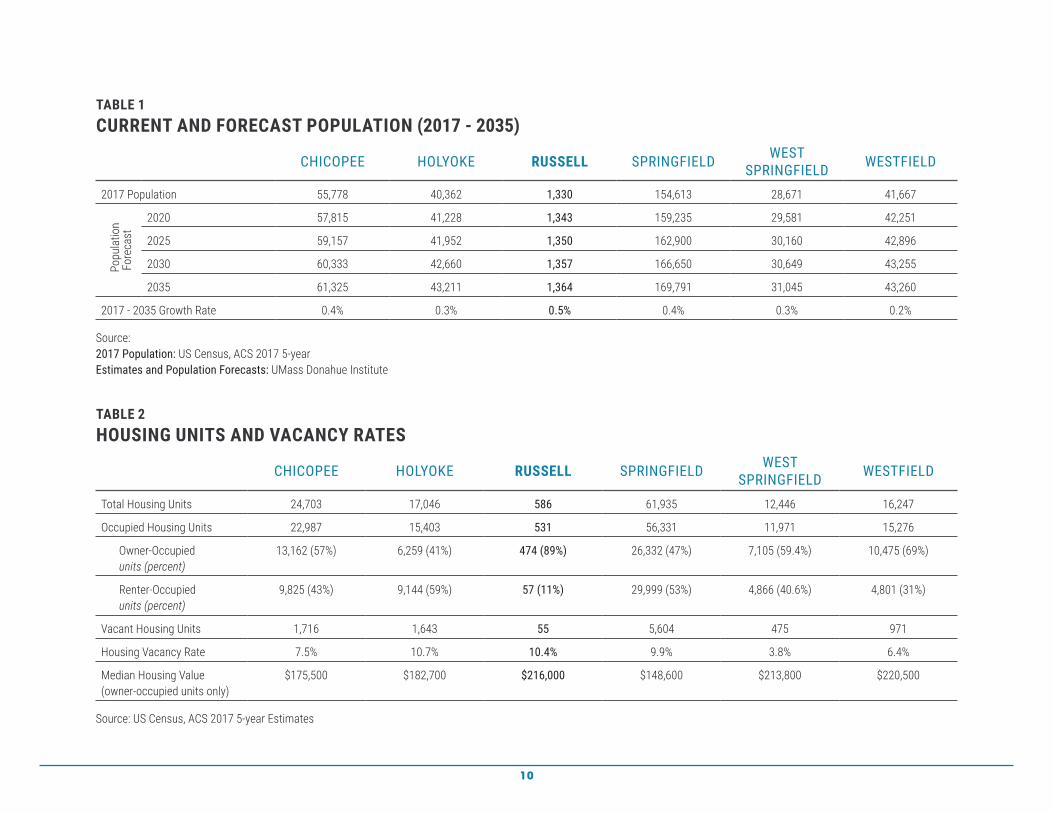
Population estimates for 2017 (American Community Survey) and future projections (developed by the UMass Donohue Institute) for Russell and the nearby cities of Chicopee, Holyoke, Springfield, West Springfield, and Westfield are presented in Table 1. Forecasted population growth is marginal across these cities and ranges from 0.2% to 0.5% annually between 2015 and 2035.
The expected future population growth does not preclude development at the Woronoco Mills but indicates that any residential development may need to serve niche markets such as student living or senior housing. Low population growth is likely to affect commercial development at Mill #1 or Mill #2 as businesses evaluate the surrounding labor market and workforce needs.
10
TABLE 1CURRENT AND FORECAST POPULATION (2017 - 2035)
CHICOPEE HOLYOKE RUSSELL SPRINGFIELD WEST SPRINGFIELD WESTFIELD
2017 Population 55,778 40,362 1,330 154,613 28,671 41,667
Pop
ulat
ion
Fo
reca
st
2020 57,815 41,228 1,343 159,235 29,581 42,251
2025 59,157 41,952 1,350 162,900 30,160 42,896
2030 60,333 42,660 1,357 166,650 30,649 43,255
2035 61,325 43,211 1,364 169,791 31,045 43,260
2017 - 2035 Growth Rate 0.4% 0.3% 0.5% 0.4% 0.3% 0.2%
Source: 2017 Population: US Census, ACS 2017 5-yearEstimates and Population Forecasts: UMass Donahue Institute
TABLE 2HOUSING UNITS AND VACANCY RATES
CHICOPEE HOLYOKE RUSSELL SPRINGFIELD WEST SPRINGFIELD WESTFIELD
Total Housing Units 24,703 17,046 586 61,935 12,446 16,247
Occupied Housing Units 22,987 15,403 531 56,331 11,971 15,276
Owner-Occupiedunits (percent)
13,162 (57%) 6,259 (41%) 474 (89%) 26,332 (47%) 7,105 (59.4%) 10,475 (69%)
Renter-Occupiedunits (percent)
9,825 (43%) 9,144 (59%) 57 (11%) 29,999 (53%) 4,866 (40.6%) 4,801 (31%)
Vacant Housing Units 1,716 1,643 55 5,604 475 971
Housing Vacancy Rate 7.5% 10.7% 10.4% 9.9% 3.8% 6.4%
Median Housing Value (owner-occupied units only)
$175,500 $182,700 $216,000 $148,600 $213,800 $220,500
Source: US Census, ACS 2017 5-year Estimates

11
2.2 Housing CharacteristicsHousing information was gathered to evaluate the current vacancy rate (e.g. excess supply) in the Westfield Area to assess the need for additional residential units in Woronoco. As of 2017, Westfield had a 6.4% residential vacancy rate. This rate is lower than the vacancy rates in Chicopee, Holyoke, Russell, and Springfield, where vacancy rates range from 7.5% to 10.7%. The state‑wide vacancy rate is 9.3%. If vacancy rates remain low in nearby communities and people are unable to find competitive options, there may be potential demand for housing at Mill #1. This potential demand is reflected in recent marketing efforts to redevelop Mill #1 for residential uses.
The mix of owner‑occupied to renter‑occupied housing in the area is highest in Russell, where 89% of occupied housing is owner‑occupied. Westfield has the next‑highest rate of owner‑occupied housing; in Westfield, 69% of housing is owner‑occupied. The extreme imbalance between renter‑ and owner‑occupied housing in Russell indicates that there may be unmet demand for rental housing in town.
Westfield has the highest median house value of $220,000 compared to other neighboring towns whose median home values range from $148,000 in Springfield to $216,000 in Russell. Any residential housing development at the Woronoco Mills would need to evaluate the revenue potential based on the surrounding housing market and its relatively low housing prices.
2.3 Economic ConditionsThe following section describes the economic conditions in Russell. This information provides a basis for understanding the strengths and weaknesses of the Mill #2 site in Woronoco in comparison to other sites in adjacent communities.
The portion of Woronoco Village on the eastern side of the Westfield River is isolated from the rest of Woronoco Village and Russell. A temporary, one‑lane bridge provides the only vehicular access to the former bustling village that now houses approximately seventeen families and a lumber sorting yard operating around the former paper mill. The one‑lane temporary bridge on Valley View Avenue is nearing the end of its useful life.
Replacing the temporary one‑lane bridge with a new bridge and providing two‑way vehicular access to Mill #2 could support redevelopment, but there are several other challenges to economic development that must also be addressed before the mill could be considered a desirable location for redevelopment. The following known challenges to economic development at Mill #2 include:
• insufficient water capacity for fire suppression,
• limited labor market, • a lack of broadband internet access, • a lack of easy access to an interstate
highway, and • a lack of targeted business incentives for
site development.
However, positive factors for the redevelopment of the Mill #2 site include

12
TYPE SITE NAME CITY USE MAXIMUM SQUARE FEET
AVAILABLE UTILITIES*
DISTANCE TO INTERSTATE
DISTANCE TO COMMERCIAL AIRPORT
Land Chicopee River Business Park Chicopee Industrial 826,000 E, N, S, W 0.5 mi (I-90) 20 mi
Building 77 Champion Drive Chicopee IndustrialWarehouseDistribution
72,295 E, N, S, W 2.5 mi (I-90) 27 mi
Building Open Square Holyoke Mixed Use 207,000 E, N, S, W 1.7 mi (I-91) 35 mi
Land Ludlow Mills Ludlow Office / Retail 500,000 E, N, S, W 1.5 mi (I-90) 20 mi
Building Springfield Technology Park Springfield Office / R&D 43,000 E, N, S, W^ 0.5 mi (I-291) 20 mi
Building Mill Site #2 Woronoco ManufacturingWarehouseDistribution
280,000 E, N 7.5 mi (I-90) 23 mi
* E = Electricity, N = Natural Gas, S = Sewer, W = Water^ Data on water service was not provided, but it is assumed that the site has adequate water service given its location.
TABLE 3
SELECTED COMPETITIVE LOCATIONS:INDUSTRIAL, WAREHOUSE, OFFICE, AND MIXED USE
existing rail access and electrical and sewer utility connections. Though these features are beneficial, substantial challenges remain.
Competing Commercial Development Locations
Several business parks and industrial sites in nearby communities have positive business development features such as vacant buildings or lots with a full range of available utilities, are located within 2.5 miles of a major interstate, and have been
designated as priority development sites. Priority development sites are parcels that have been locally identified for development or redevelopment and are eligible for streamlined local permitting.
Employment TrendsThe following sections describe employment trends in various geographical areas in the Russell area. The mean household income, median household income, per capita income, labor force participation rate,

13
and unemployment rate for Russell and surrounding communities are presented in Table 4. Employment values for residents within the Town of Russell are on the higher end of the ranges, however the information presented is based on location of residence, meaning that employed residents could be working in adjacent communities instead of within the boundaries of Russell.
Employment Trends in Hampden CountyA review of recent employment trends and regional economic forecasts highlight industry dynamics and the likelihood of
these trends continuing. The Springfield, MA Metropolitan Statistical Area (MSA) consists of the following three counties: Hampden, Hampshire, and Franklin. However, because the competitive sites and local labor market are concentrated primarily in the cities of Chicopee, Holyoke, Springfield, and Westfield, the following summary was limited to Hampden County. According to the Bureau of Economic Analysis (BEA), employment in manufacturing has grown slightly (0.2% annually) in Hampden County since 2015. There has been larger growth in the transportation and warehousing sectors
§̈¦391
§̈¦291
§̈¦291
§̈¦391
§̈¦391
§̈¦90
§̈¦91
§̈¦91
§̈¦91
§̈¦90
§̈¦90
§̈¦90
5
67
£¤5
£¤20
£¤202
£¤20
£¤5
£¤202
£¤202
£¤202
£¤202
£¤20
£¤20
£¤5
£¤202
£¤202
£¤202£¤20
£¤202
£¤20
£¤20
£¤5
£¤202
£¤202
£¤5
£¤5
£¤202
£¤5
£¤202£¤20
£¤20
§̈¦391
§̈¦291
§̈¦291
§̈¦391
§̈¦391
£¤5
£¤20
£¤202
£¤20
£¤5
£¤202
£¤202
£¤202
£¤202
£¤20
£¤20
£¤5
£¤202
£¤202
£¤202£¤20
£¤202
£¤20
£¤20
£¤5
£¤202
£¤202
£¤5
£¤5
£¤202
£¤5
£¤202£¤20
£¤20 9
")21
")10
")57
")33
")83")75
")47
")23
")47 ")21
")57
")10
")83
Åõ116
Åõ187
Åõ159
Åõ147
Åõ186Åõ220
Åõ20A
Åõ141
Åõ192
Åõ116
Åõ147
Åõ187
Åõ141
Åõ220
Åõ159
5Åõ116
Åõ187
Åõ159
Åõ147
ÅõÅõ
Åõ20A
Åõ141
Åõ116
Åõ147
Åõ187
Åõ141
Åõ220
Åõ159
")10
Åõ187
Sources: Esri, HERE, Garmin, Intermap, increment P Corp., GEBCO, USGS, FAO, NPS, NRCAN, GeoBase,IGN, Kadaster NL, Ordnance Survey, Esri Japan, METI, Esri China (Hong Kong), swisstopo, © OpenStreetMapcontributors, and the GIS User Community
3
4
13
17
16
15
8
Woronoco Mills #1 + #2
Barnes Municipal
Airport
WestoverAirport
1
2
34
5
1
2
3
4
5
Open Square (Holyoke)
77 Champion Drive (Chicopee)
Chicopee River Business Park (Chicopee)
Ludlow Mills (Ludlow)
Springfield Technology Park (Springfield)
FIGURE 3COMPETITIVE DEVELOPMENT LOCATIONS

14
(7.5%) during the same time period (see Table 5). The low growth rate for manufacturing indicates tepid demand for additional manufacturing sites. Past growth in transportation and warehousing employment seems to indicate that these may be viable options; however, forecasts indicate a decline in this industry sector.
Looking into the future, employment estimates for Hampden County for candidate industries at Mill #2 are presented in Table 6. Except for furniture manufacturing and other related products, all other manufacturing sectors as well as transportation and warehousing are expected to have a decline in employment in Hampden County between 2019 and 2023. These decreases range between ‑0.4% to ‑1.0% annually. The low growth rate for manufacturing and the expected decline in future employment could mean there will be a relatively limited market demand for re‑establishing these industries at
the Woronoco Mills.
Employment Trends in Springfield MA-CT New England City and Town AreaAnother regional economic boundary analogous to the MSA is the Springfield MA‑CT New England City and Town Area (NECTA) region, which is defined based on municipal boundaries rather than entire counties. The trends in the Springfield NECTA are similar to those of Hampden County. According to the Bureau of Labor Statistics (BLS), overall manufacturing employment in this area has experienced a slight decline (‑0.2%) annually from 2015 to 2018. While the manufacture of non‑durable goods grew slightly (0.3%), durable goods manufacturing declined by 0.5% annually over the same time period. These trends indicate that the manufacturing sector is not experiencing strong growth and may limit demand for redevelopment at Mill #2.
TABLE 4INCOME
CHICOPEE HOLYOKE RUSSELL SPRINGFIELD WEST SPRINGFIELD WESTFIELD
Median Household Income $48,866 $37,954 $66,985 $37,118 $51,735 $62,212
Mean Household Income $61,955 $56,014 $76,733 $52,246 $68,964 $77,055
Per Capita Income $26,432 $22,625 $30,928 $20,046 $29,344 $29,092
Labor Force Participation Rate 62.50% 57.30% 66.80% 58.50% 67.00% 65.40%
Unemployment Rate 8.00% 10.20% 3.90% 11.10% 7.60% 6.30%
Source: US Census, ACS 2017 5-year Estimates

15
Employment Trends in Westfield, MAIn Westfield, MA, the city closest to Russell, total employment grew by 1.6% from 20,808 jobs in 2015 to 21,145 jobs in 2016. Manufacturing jobs make up 13% of all employment in Westfield1. Major industries in Westfield include precision manufacturing (e.g. aviation and submarine), education (Westfield State University), medical (Bay State Medical and other hospitals), military (Barnes Air National Guard and Army), aviation (Westfield‑Barnes Region and Gulfstream), and distribution/warehousing.
1 Source: Census, 2016 ACS 5-Year Estimate
TABLE 5EMPLOYMENT TRENDS, HAMPDEN COUNTY (2015 - 2017)INDUSTRY DESCRIPTION 2015 2016 2017 COMPOUND
ANNUAL GROWTH RATE
Manufacturing 19,700 19,573 19,768 0.2%
Transportation and Warehousing 8,628 9,606 9,968 7.5%
Source: Bureau of Economic Analysis
TABLE 6EMPLOYMENT FORECASTS, HAMPDEN COUNTY (2019 - 2023)INDUSTRY DESCRIPTION 2019
EMPLOYMENT2023
EMPLOYMENTCOMPOUND ANNUAL
GROWTH RATEFood Products 1,824 1,749 -1.0%
Beverage and Tobacco 33 32 -0.9%
Wood Products 303 298 -0.4%
Furniture and Related Product 378 387 0.6%
Miscellaneous Manufacturing 1,309 1,263 -0.9%
Transportation and Warehousing 7,467 7,340 -0.4%
Subtotal 11,314 11,070 -0.5%
Source: Moody's Analytics (https://www.economy.com/)

16
TABLE 7EMPLOYMENT TRENDS, SPRINGFIELD MA-CT NECTA (2015 - 2018)INDUSTRY DESCRIPTION 2015
EMPLOYMENT2018
EMPLOYMENTCOMPOUND ANNUAL
GROWTH RATEDurable Goods Manufacturing 19,700 19,400 -0.5%
Non-Durable Goods Manufacturing 9,500 9,600 0.3%
Total Manufacturing 29,200 29,000 -0.2%
Transportation, Warehousing, and Utilities 13,300 13,600 0.7%
Source: Bureau of Labor Statistics
")23
£¤20
£¤20
§̈¦90
Woronoco
Road
Laure l Road
Old
Rou
te23
Hi l l Street
Pochassic Road
Va lley
Vi ew
Avenue
Mountain ViewTerrace
Bridge Street Tekoa Avenue
Ma ssachusetts Turnpike
Wes
tfi e
l dR
o ad
Blandford
Road
Br idge Street Bridge
Valley View Avenue Bridge
CSXRAIL
ROADTRACKS
Wes
tfiel
dRi
ver
Westfield
River
HydroElectricPlant
Potash Brook
S:\1
794\
Activ
e\17
9410
572\
GIS
\mxd
\Fig
ure-
4_R
are
Spec
ies
b.m
xd
R
evis
ed: 2
019-
05-0
8 B
y: w
oduw
ole
Figure 4: Rare Species
Notes1. Coordinate System: NAD 1983 StatePlane Massachusetts Mainland FIPS 20012. Data Sources: MassGIS3. Background: Source: Esri, DigitalGlobe, GeoEye, Earthstar Geographics, CNES/Airbus DS, USDA, USGS, AeroGRID, IGN, and the GIS User Community
($$¯
MILL 1
LegendNHESP Estimated Habitats of Rare WildlifeNHESP Priority Habitats of Rare Species
0 250 500125Feet
MILL 2
FIGURE 4RARE SPECIES HABITAT")23
£¤20
£¤20
§̈¦90
Woronoco
Road
Laure l Road
Old
Rou
te23
Hi l l Street
Pochassic Road
Va lley
Vi ew
Avenue
Mountain ViewTerrace
Bridge Street Tekoa Avenue
Ma ssachusetts Turnpike
Wes
tfi e
l dR
o ad
Blandford
Road
Br idge Street Bridge
Valley View Avenue BridgeW
estfi
eld
Rive
r
CSXRAIL
ROADTRACKS
Westfield
River
Potash Brook HydroElectricPlant
S:\1
794\
Activ
e\17
9410
572\
GIS
\mxd
\Fig
ure-
2 _W
oron
o Vi
llage
Map
.mxd
Rev
ised
: 201
9-05
-08
By:
wod
uwol
e
Figure 2: Woronoco Village Map
Notes1. Coordinate System: NAD 1983 StatePlane Massachusetts Mainland FIPS 20012. Data Sources: MassGIS3. Background: Source: Esri, DigitalGlobe, GeoEye, Earthstar Geographics, CNES/Airbus DS, USDA, USGS, AeroGRID, IGN, and the GIS User Community
($$¯
MILL 1
LegendBridge Street Bridge (Closed) Valley View Avenue Bridge(Single Lane Temporary)Eagle Creek Hydro ElectricPower Plant
InterstateU.S. HighwayMinor RoadCSX Rail Road Tracks
0 250 500125Feet
MILL 2
")23
£¤20
£¤20
§̈¦90
Woronoco
Road
Laure l Road
Old
Rou
te23
Hi l l Street
Pochassic Road
Va lley
Vi ew
Avenue
Mountain ViewTerrace
Bridge Street Tekoa Avenue
Ma ssachusetts Turnpike
Wes
tfi e
l dR
o ad
Blandford
Road
Br idge Street Bridge
Valley View Avenue Bridge
CSXRAIL
ROADTRACKS
Wes
tfiel
dRi
ver
Westfield
River
HydroElectricPlant
Potash Brook
S:\1
794\
Activ
e\17
9410
572\
GIS
\mxd
\Fig
ure-
4_R
are
Spec
ies
b.m
xd
R
evis
ed: 2
019-
05-0
8 B
y: w
oduw
ole
Figure 4: Rare Species
Notes1. Coordinate System: NAD 1983 StatePlane Massachusetts Mainland FIPS 20012. Data Sources: MassGIS3. Background: Source: Esri, DigitalGlobe, GeoEye, Earthstar Geographics, CNES/Airbus DS, USDA, USGS, AeroGRID, IGN, and the GIS User Community
($$¯
MILL 1
LegendNHESP Estimated Habitats of Rare WildlifeNHESP Priority Habitats of Rare Species
0 250 500125Feet
MILL 2

17
2.4 Environmental ConditionsAs shown on Figures 4 and 5, there are multiple environmental resources associated with the Westfield River. FEMA‑designated 100‑year floodplain, regulatory floodway, and bordering vegetated wetland exist adjacent to the river throughout the study area. The existing, temporary bridge on Valley View Avenue crosses through several flood hazard zones and a small area of wetland. The closed Bridge Street Bridge also crosses through flood hazard zones, but does not cross mapped bordering vegetated wetland.
The Westfield River corridor and adjacent Tekoa Mountain Wildlife Management Area are central to the area’s significant rare species habitat. With the exception of Mill #2 and a handful of the residential properties on the east side of the Westfield River, the Natural Heritage and Endangered Species Program has identified the eastern side of Woronoco Village as Estimated and Priority Habitats of Rare Wildlife. In some areas, this designation extends to Woronoco Road on the western side of the river.
Though these environmental constraints would trigger wetland permitting, they do not appear to be significant enough to pose a barrier to constructing a new bridge at either location.
2.5 Traffic ConditionsThe roadway network in Woronoco Village is typical of New England industrial villages. The main road, Woronoco Road, is a bypass road to State Highway Route 20. Woronoco Road is two lanes with varying shoulder width. Other roads in the Village are narrow local roadways. Though aerial imagery
")23
£¤20
£¤20
§̈¦90
Woronoco
Road
Laure l Road
Old
Rou
te23
Hi l l StreetPochassic Road
Va lley
Vi ew
Avenue
Mountain ViewTerrace
Bridge Street Tekoa Avenue
Ma ssachusetts Turnpike
Wes
tfi e
l dR
o ad
Blandford
Road
Br idge Street Bridge
Valley View Avenue Bridge
CSXRAIL
ROADTRACKS
HydroElectricPlant
AE
AE
AEAE
AE
AE
AE
AE
AE AE
Wes
tfiel
dRi
ver
Westfield
River
Potash Brook
S:\1
794\
Activ
e\17
9410
572\
GIS
\mxd
\Fig
ure
3_W
etla
nd a
nd W
ater
Res
ourc
es.m
xd
R
evis
ed: 2
019-
05-0
8 By
: wod
uwol
e
Figure 3: Wetland and Water Resources
Notes1. Coordinate System: NAD 1983 StatePlane Massachusetts Mainland FIPS 20012. Data Sources: MassGIS3. Background: Source: Esri, DigitalGlobe, GeoEye, Earthstar Geographics, CNES/Airbus DS, USDA, USGS, AeroGRID, IGN, and the GIS User Community
($$¯
MILL 1
LegendCold Water Fishery DamWestfield River
FEMA National Flood Hazard LayerAE: 1% Annual Chance of Flooding (with BFE)AE: Regulatory Floodway
Wetland TypeSHALLOW MARSH MEADOWSHRUB SWAMPWOODED SWAMP DECIDUOUS
0 250 500125Feet
MILL 2
FIGURE 5 WETLAND AND WATER RESOURCES
")23
£¤20
£¤20
§̈¦90
Woronoco
Road
Laure l Road
Old
Rou
te23
Hi l l Street
Pochassic Road
Va lley
Vi ew
Avenue
Mountain ViewTerrace
Bridge Street Tekoa Avenue
Ma ssachusetts Turnpike
Wes
tfi e
l dR
o ad
Blandford
Road
Br idge Street Bridge
Valley View Avenue Bridge
Wes
tfiel
dRi
ver
CSXRAIL
ROADTRACKS
Westfield
River
Potash Brook HydroElectricPlant
S:\1
794\
Activ
e\17
9410
572\
GIS
\mxd
\Fig
ure-
2 _W
oron
o Vi
llage
Map
.mxd
Rev
ised
: 201
9-05
-08
By:
wod
uwol
e
Figure 2: Woronoco Village Map
Notes1. Coordinate System: NAD 1983 StatePlane Massachusetts Mainland FIPS 20012. Data Sources: MassGIS3. Background: Source: Esri, DigitalGlobe, GeoEye, Earthstar Geographics, CNES/Airbus DS, USDA, USGS, AeroGRID, IGN, and the GIS User Community
($$¯
MILL 1
LegendBridge Street Bridge (Closed) Valley View Avenue Bridge(Single Lane Temporary)Eagle Creek Hydro ElectricPower Plant
InterstateU.S. HighwayMinor RoadCSX Rail Road Tracks
0 250 500125Feet
MILL 2
")23
£¤20
£¤20
§̈¦90W
oronocoRoad
Laure l Road
Old
Rou
te23
Hi l l Street
Pochassic Road
Va lley
Vi ew
Avenue
Mountain ViewTerrace
Bridge Street Tekoa Avenue
Ma ssachusetts Turnpike
Wes
tfi e
l dR
o ad
Blandford
Road
Br idge Street Bridge
Valley View Avenue Bridge
CSXRAIL
ROADTRACKS
HydroElectricPlant
AE
AE
AEAE
AE
AE
AE
AE
AE AE
Wes
tfiel
dRi
ver
Westfield
RiverPotash Brook
S:\1
794\
Activ
e\17
9410
572\
GIS
\mxd
\Fig
ure
3_W
etla
nd a
nd W
ater
Res
ourc
es.m
xd
R
evis
ed: 2
019-
05-0
8 By
: wod
uwol
e
Figure 3: Wetland and Water Resources
Notes1. Coordinate System: NAD 1983 StatePlane Massachusetts Mainland FIPS 20012. Data Sources: MassGIS3. Background: Source: Esri, DigitalGlobe, GeoEye, Earthstar Geographics, CNES/Airbus DS, USDA, USGS, AeroGRID, IGN, and the GIS User Community
($$¯
MILL 1
LegendCold Water Fishery DamWestfield River
FEMA National Flood Hazard LayerAE: 1% Annual Chance of Flooding (with BFE)AE: Regulatory Floodway
Wetland TypeSHALLOW MARSH MEADOWSHRUB SWAMPWOODED SWAMP DECIDUOUS
0 250 500125Feet
MILL 2
")23
£¤20
£¤20
§̈¦90
Woronoco
Road
Laure l Road
Old
Rou
te23
Hi l l Street
Pochassic Road
Va lley
Vi ew
Avenue
Mountain ViewTerrace
Bridge Street Tekoa Avenue
Ma ssachusetts Turnpike
Wes
tfi e
l dR
o ad
Blandford
Road
Br idge Street Bridge
Valley View Avenue Bridge
CSXRAIL
ROADTRACKS
HydroElectricPlant
AE
AE
AEAE
AE
AE
AE
AE
AE AE
Wes
tfiel
dRi
ver
Westfield
River
Potash Brook
S:\1
794\
Activ
e\17
9410
572\
GIS
\mxd
\Fig
ure
3_W
etla
nd a
nd W
ater
Res
ourc
es.m
xd
R
evis
ed: 2
019-
05-0
8 By
: wod
uwol
e
Figure 3: Wetland and Water Resources
Notes1. Coordinate System: NAD 1983 StatePlane Massachusetts Mainland FIPS 20012. Data Sources: MassGIS3. Background: Source: Esri, DigitalGlobe, GeoEye, Earthstar Geographics, CNES/Airbus DS, USDA, USGS, AeroGRID, IGN, and the GIS User Community
($$¯
MILL 1
LegendCold Water Fishery DamWestfield River
FEMA National Flood Hazard LayerAE: 1% Annual Chance of Flooding (with BFE)AE: Regulatory Floodway
Wetland TypeSHALLOW MARSH MEADOWSHRUB SWAMPWOODED SWAMP DECIDUOUS
0 250 500125Feet
MILL 2
18
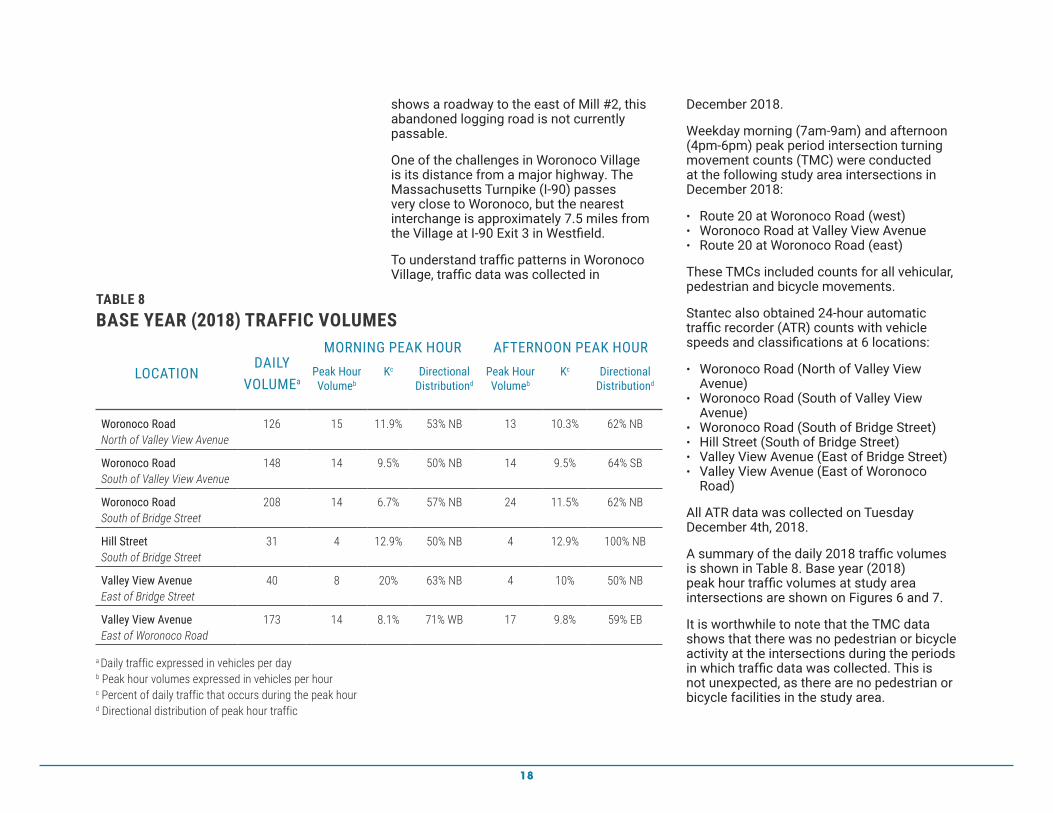
shows a roadway to the east of Mill #2, this abandoned logging road is not currently passable.
One of the challenges in Woronoco Village is its distance from a major highway. The Massachusetts Turnpike (I‑90) passes very close to Woronoco, but the nearest interchange is approximately 7.5 miles from the Village at I‑90 Exit 3 in Westfield.
To understand traffic patterns in Woronoco Village, traffic data was collected in
December 2018.
Weekday morning (7am‑9am) and afternoon (4pm‑6pm) peak period intersection turning movement counts (TMC) were conducted at the following study area intersections in December 2018:
• Route 20 at Woronoco Road (west)• Woronoco Road at Valley View Avenue• Route 20 at Woronoco Road (east)
These TMCs included counts for all vehicular, pedestrian and bicycle movements.
Stantec also obtained 24‑hour automatic traffic recorder (ATR) counts with vehicle speeds and classifications at 6 locations:
• Woronoco Road (North of Valley View Avenue)
• Woronoco Road (South of Valley View Avenue)
• Woronoco Road (South of Bridge Street)• Hill Street (South of Bridge Street)• Valley View Avenue (East of Bridge Street)• Valley View Avenue (East of Woronoco
Road)
All ATR data was collected on Tuesday December 4th, 2018.
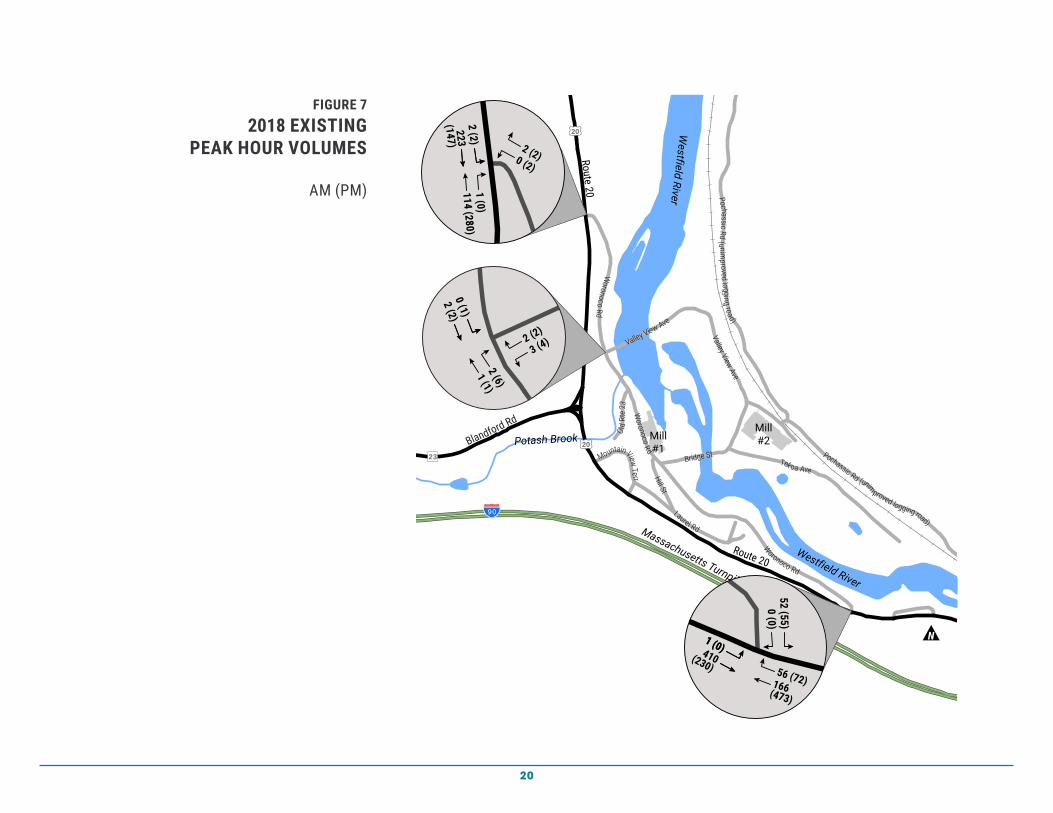
A summary of the daily 2018 traffic volumes is shown in Table 8. Base year (2018) peak hour traffic volumes at study area intersections are shown on Figures 6 and 7.
It is worthwhile to note that the TMC data shows that there was no pedestrian or bicycle activity at the intersections during the periods in which traffic data was collected. This is not unexpected, as there are no pedestrian or bicycle facilities in the study area.
TABLE 8BASE YEAR (2018) TRAFFIC VOLUMES
LOCATIONDAILY
VOLUMEa
MORNING PEAK HOUR AFTERNOON PEAK HOURPeak Hour Volumeb
Kc Directional Distributiond
Peak Hour Volumeb
Kc Directional Distributiond
Woronoco RoadNorth of Valley View Avenue
126 15 11.9% 53% NB 13 10.3% 62% NB
Woronoco RoadSouth of Valley View Avenue
148 14 9.5% 50% NB 14 9.5% 64% SB
Woronoco RoadSouth of Bridge Street
208 14 6.7% 57% NB 24 11.5% 62% NB
Hill StreetSouth of Bridge Street
31 4 12.9% 50% NB 4 12.9% 100% NB
Valley View AvenueEast of Bridge Street
40 8 20% 63% NB 4 10% 50% NB
Valley View AvenueEast of Woronoco Road
173 14 8.1% 71% WB 17 9.8% 59% EB
a Daily traffic expressed in vehicles per dayb Peak hour volumes expressed in vehicles per hourc Percent of daily traffic that occurs during the peak hourd Directional distribution of peak hour traffic

19
")23
£¤20
£¤20
§̈¦90
Westfield River
Westfield River
Potash BrookMill#2Mill
#1
Massachusetts Turnpike
Pochassic Rd (u nimp roved log ging road)
Pochassic Rd (unim
proved logging road)
Old R
te 2 3
Valley Vie w Ave
Valley View Ave
Woronoco Rd
Woronoco Rd
Mountain View Terr Hill St
Bridge StTek oa Ave
Route 20
Route 20
Laurel Rd
Blandford Rd
Woronoco Rd
N
59
67
8588
21
19
100
108
14
17
68
80
Daily Volume (24 hour counts)
2018 Existing Daily Volume
FIGURE 62018 EXISTING DAILY VOLUME
")23
£¤20
£¤20
§̈¦90
Westfield River
Westfield River
Potash BrookMill#2Mill
#1
Massachusetts Turnpike
Pochassic Rd (u nimp roved log ging road)
Pochassic Rd (unim
proved logging road)
Old R
te 2 3
Valley Vie w Ave
Valley View Ave
Woronoco Rd
Woronoco Rd
Mountain View Terr Hill St
Bridge StTek oa Ave
Route 20
Route 20
Laurel Rd
Blandford Rd
Woronoco Rd
N
59
67
8588
21
19
100
108
14
17
68
80
Daily Volume (24 hour counts)
2018 Existing Daily Volume
20
FIGURE 72018 EXISTING
PEAK HOUR VOLUMES
AM (PM)
")23
£¤20
£¤20
§̈¦90
Westfield River
Westfield River
Potash BrookMill#2Mill
#1
Massachusetts Turnpike
Pochassic Rd (u nimp roved log ging road)
Pochassic Rd (unim
proved logging road)
Old R
te 2 3
Valley Vie w Ave
Valley View Ave
Woronoco Rd
Woronoco Rd
Mountain View Terr Hill St
Bridge StTek oa Ave
Route 20
Laurel Rd
Blandford Rd
Woronoco Rd
Route 20
N
2 (2)0 (1)
3 (4)2 (2)
2 (6)
1 (1)
223(147)
2 (2)
0 (2)
2 (2)
1 (0)114 (280)
Turning Movement Count Locations
2018 Existing Peak Hour VolumesAM (PM)
1 (0)410(230)
1 (0)
0 (0)52 (55)
166(473)
56 (72)

21
2.6 Bridge Street Bridge History and Condition
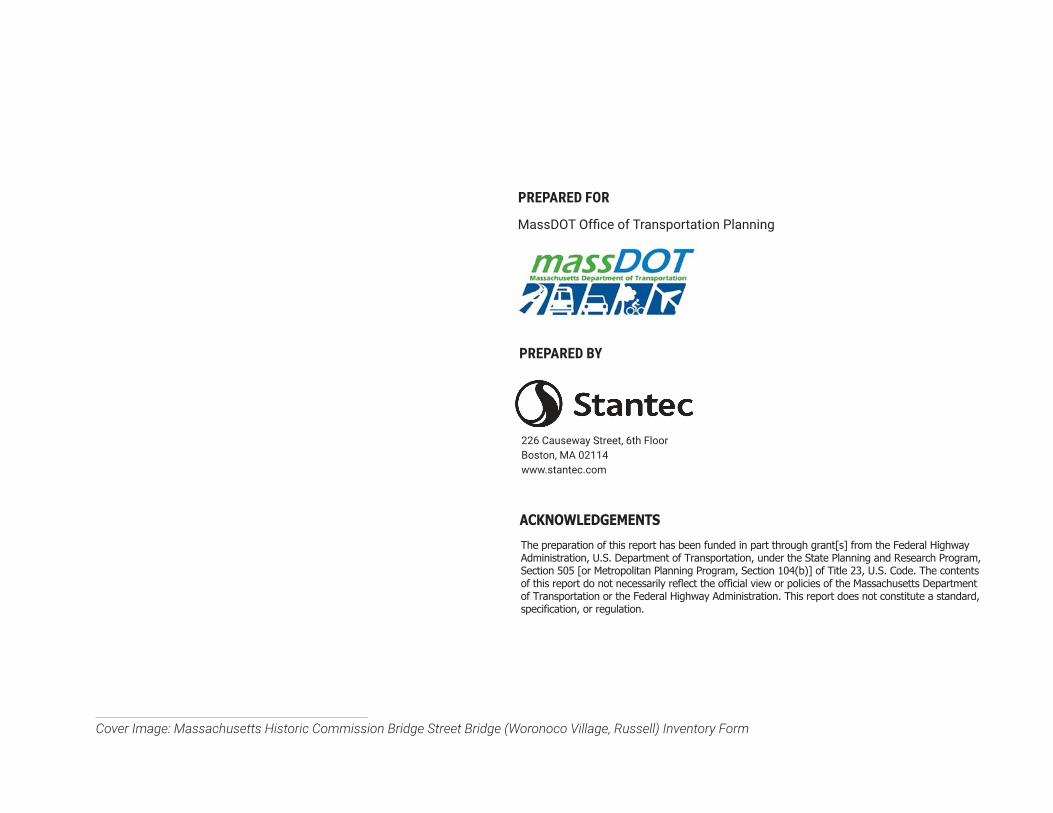
The Bridge Street Bridge was closed by MassDOT to all vehicular and pedestrian traffic in 1985. This historic open‑spandrel, rib‑arch was built in 1924 and is one of the few examples of this rare bridge type that remain. It is an arch bridge with a total length of 400 feet, consisting of two 65‑foot approach spans and three arch spans which are approximately 104 feet, 62 feet, and 104 feet, respectively. At this crossing, the Westfield River is in a rocky gorge approximately 50 feet below the bridge’s deck. The bridge’s middle piers are located on an island in the middle of the river.
The Massachusetts Historical Commission’s 1984 Inventory report states that “The Woronoco Bridge, although presently disfigured…has suffered few irreversible changes. It remains one of the least seriously altered [open‑spandrel, rib‑arch type bridges], and one of the most dramatically sited, examples of this relatively rare bridge type in Massachusetts.”
The bridge’s significance is noted on the MHC Inventory and on the bridge’s inclusion in the Library of Congress. Its listing is included because if its significance as an unusual or unique type that retains its integrity, the builder (Samuel M. Green Co.) is “known and important,” and because of the bridge’s significance to the area, noting that it is “one of only 8 presently‑known open‑spandrel, rib‑arch, reinforced concrete bridges in Massachusetts, with few structural changes. [The bridge] still retains its original deck and parapets. In a dramatic, rural setting in the Berkshire foothills.”1
1 Massachusetts Historical Bridge Inventory registration. Sum-mary of significance. Massachusetts Historical Commission
The Federal Highway Administration (FHWA) has concurred that the bridge is potentially eligible for the National Register of Historic Places. If removal of this bridge is chosen, a full structural analysis would be required prior to demolition. This analysis would need to demonstrate that rehabilitation is not feasible. Removal would also require specific documentation of the bridge (e.g. photos, historical narrative) and coordination between the Massachusetts Historical Commission, the Russell Historical Commission, MassDOT, and the Federal Highway Administration.
(MHC).
Bridge Street Bridge in 2018.

22
2.7 Valley View Avenue Bridge History and Condition
After the closure of the Bridge Street Bridge, the existing bridge at Valley View Avenue was constructed in 1986 as a temporary crossing to provide access to Mill #2 and the homes on the east side of the Westfield River. This temporary, prefabricated bridge has a total length of 420 feet, consisting of three spans of approximately 125 feet, 170 feet, and 125 feet, respectively. There are some minor deficiencies on the bridge that can be attributed to normal wear and usage over the last 30 years.
The bridge was last inspected in August 2018. This inspection found some deficiencies, but the structure is in overall fair condition. The bridge’s deck and superstructure were rated as fair (all primary structural elements are sound but may have minor section loss, cracking, spalling, or scour) and its substructure, channel, and
channel protection were rated as satisfactory (structural elements show some minor deterioration). Deficiencies were noted on the deck condition, floorbeams, and stems/webs/pierwalls. The deck condition and floorbeams deficiencies are “severe/major deficiency” and the urgency of repair was rated as prioritized, which means that MassDOT would prioritize the repair when funds and/or manpower is available. The full inspection report can be found in Appendix B.
Overall, the Valley View Avenue Bridge is adequate even though it has exceeded its expected life. According to rating values from the latest bridge rating, dated April 1, 2010 (bridges are not rated each time they are inspected), all bridge components rate above the statutory weight for all rating vehicles.
The bridge, in its current condition, is able to carry the load it is designed for and is supporting the amount of traffic and vehicle types the roadway is requiring of it.
Valley View Avenue Bridge in 2018.
23
3.0 WESTFIELD RIVER BRIDGE CROSSING SCENARIOS
This study evaluated three scenarios for providing access over the Westfield River in Woronoco Village to support economic development opportunities in Woronoco. These scenarios are: 1. Rehabilitate the Valley View Avenue Bridge, 2. Construct a new two‑lane bridge at either Valley View Avenue or Bridge Street, or 3. Remove the Valley View Avenue Bridge and have no bridge crossing of the Westfield River in Woronoco Village. In reviewing these scenarios, the following factors were considered: potential environmental effects, access, impact on existing residents.
Scenario 1: Rehabilitate Valley View Avenue BridgeA rehabilitated bridge would remain single‑lane (11.15 feet curb to curb) which is not desirable for several reasons. A rehabilitated one‑lane Valley View Avenue Bridge would still not provide bicycle or pedestrian infrastructure and would not improve emergency and utility vehicle access. Additionally, rehabilitation is not financially feasible. While utility and fire trucks can cross the existing Valley View Avenue Bridge, there is a very small margin of width between the bridge railings and vehicles. If development were to occur at Mill #2, the existing bridge would likely not be able to adequately process the increased traffic.
Further, rehabilitating the existing bridge would likely not support improved economic
development opportunities for Mill #2. Members of the Russell Board of Selectmen have indicated that the current bridge is a “non‑starter” for developers or businesses considering locating in Woronoco Village. Anecdotally, developers and businesses that have initially been considering redeveloping or locating in Mill #2 have abandoned any consideration of this location when they learn of the status and configuration of the Valley View Avenue Bridge.
Scenario 2: Construct a new two‑lane Bridge at either Valley View Avenue or Bridge StreetBased on recent interviews with local officials, the preference is to replace the existing Valley View Avenue Bridge with a new, two‑lane bridge at either Valley View Avenue or Bridge Street.
Permits Likely Required for New Bridge Construction:
• NEPA Categorical Exlusion• Section 106 ‑ Adverse Effect and
MOA• Section 4(f) of the DOT Act• Section 401 and 404 for Bridge
Projects
• Wetlands Protection Act Notice of Intent

24
TABLE 9REPLACEMENT BRIDGE CONCEPTUAL COST ESTIMATEDESCRIPTION ESTIMATED COST
(2019 Dollars)
ALTERNATIVE 1 - REPLACEMENT OF ARCH BRIDGE AT BRIDGE STREETDemolition of Bridge No. R-13-002 (07D) $600,000
Removal of Cellular Cofferdam Piers $120,000
Temporary Bridge No. R-13-02T (AAE) Removed and Stacked $70,000
Bridge Structure, Bridge No. R-13-002 (Bridge Street) $11,000,000
Subtotal30% Contingency
TOTAL
$11,790,000$3,537,000
$15,327,000
ALTERNATIVE 2 - REPLACEMENT OF TEMPORARY BRIDGE AT VALLEY VIEW AVENUEDemolition of Bridge No. R-13-002 (07D) $600,000
Removal of Cellular Cofferdam Piers $120,000
Temporary Bridge No. R-13-02T (AAE) Removed and Stacked $70,000
Bridge Structure, Bridge No. R-13-002 (Valley View Avenue) $9,300,000
Subtotal30% Contingency
TOTAL
$10,090,000$3,027,000
$13,117,000
traffic pass by the residential properties east of the river.
Based on a conceptual cost estimate, constructing a two‑lane bridge on Bridge Street is estimated to cost approximately $15.3 million (in 2019 dollars). A new two‑lane bridge at Valley View Avenue would cost 13.1 million in (2019 dollars). See Table 9 for detailed estimates. A new bridge on Bridge Street is more costly because, although it would have a shorter span than replacing the temporary bridge on Valley View Avenue, the river is in a deep gorge at this location, so the new bridge would require a larger, more costly substructure. These estimates do not address relocating utilities; further evaluation of the existing utilities will be necessary to estimate relocation costs.
A new, two‑lane crossing in either location would require widening both roadway approaches. If a new bridge was constructed at Valley View Avenue, there would be substantial wetland and floodplain impact as Valley View Avenue would need to be widened and realigned to with the new bridge. No substantial wetland resource impacts are anticipated if the new bridge were constructed along Bridge Street.
In either location, the proposed superstructure would have an overall width of 40 feet, providing two 5‑foot sidewalks and two 12‑foot travel lanes with 3‑foot shoulders. The preferred structure type for locations over water are precast concrete because they are not as susceptible to corrosion or deterioration as other materials. For the span lengths in question, prestressed New England Bulb Tee (NEBT) girders could be selected because they are capable of spanning up to 150 feet when designed as continuous.
Though a preferred bridge location was not discussed during stakeholder interviews, a new bridge replacing the historic Strathmore Bridge on Bridge Street is preferable for several reasons: access to the east side of the Westfield River via the existing Valley View Avenue Bridge could be maintained during construction of the new bridge; a crossing at Bridge Street would have a shorter span; this location would have fewer wetland resource impacts, and would more provide direct access to Mill #2, rather than having all

25
A replacement of the existing arch bridge at Bridge Street could have three spans arranged as 140 feet, 120 feet, and 140 feet. A replacement of the prefabricated bridge at Valley View Avenue could have three 140‑foot spans.
In both cases, the existing arch bridge at Bridge Street and prefabricated bridge at Valley View Avenue would need to be removed. A new bridge would then be constructed at either the Bridge Street location or the Valley View Avenue location.
Associated Roadway Improvements:To accommodate a new 2‑lane bridge, roadway approach improvements would be necessary.
Bridge Street Location: At the intersection of Valley View Avenue, Tekoa Avenue, and Bridge Street, the intersection is large enough to handle the larger vehicles associated with potential industrial activity at Mill #2, but the intersection should be resurfaced and striped. This work is estimated to cost between $742,000 and $1,590,000 (in 2019 dollars). The intersection of Bridge Street and Woronoco Road, on the west side of the river, would need to be widened to allow for the turning radii of larger trucks. The traffic volume would likely be low enough that allowing the turning vehicle to occupy the entire roadway would be permitted. This work is estimated to cost between $728,000 and $1,520,000.
Valley View Avenue Location: On the east side of the river at Valley View Avenue, the roadway would need to be resurfaced and widened to taper from the new bridge back to the roadway’s existing width. Valley View
Avenue is already two lanes but narrows to one lane as it approaches the bridge. This work is estimated to cost between $525,00 and $1,125,000. At the intersection of Valley View Avenue and Woronoco Road, on the west side of the river, the intersection and bridge approach would need to be widened to allow for required truck turning radii. This work is estimated to cost between $315,000 and $675,000.
Scenario 3: Remove Existing BridgeRemoving the existing bridge, without replacement, is an option but would have significant impacts to both the households on the east side of the Westfield River and Mill #2. A bridge removal would render these properties inaccessible, unless an old logging road (Pochassic Road) were improved. Interview participants indicated that Pochassic Road is not currently maintained and is likely inaccessible in some areas. Providing access for the residents east of the Westfield River to Russell Center, Westfield, or Montgomery would require very substantial improvements to Pochassic Road well beyond the study area. A diversion analysis was not conducted for this study, nor were the economic costs of relocating the existing households explored.
3.1 Summary of Crossing ScenariosBased on local preference and an engineering review of the existing Valley View Avenue Bridge, Scenario 1 (Rehabilitate Valley View Avenue Bridge) is not desirable because it would retain the existing one‑lane crossing which is a challenge for utility and fire truck access and would not be able to adequately process traffic if Mill #2 were redeveloped.
26
Scenario 3 (Remove Existing Bridge) is also not desirable because this scenario would result in substantial community disruption. Removing the bridge would likely require the relocation of residents on the east side of the Westfield River (or re‑establishing access to the neighborhood via Pochassic Road). This scenario would also exclude the redevelopment potential of Mill #2 on the east side of the river in Woronoco.
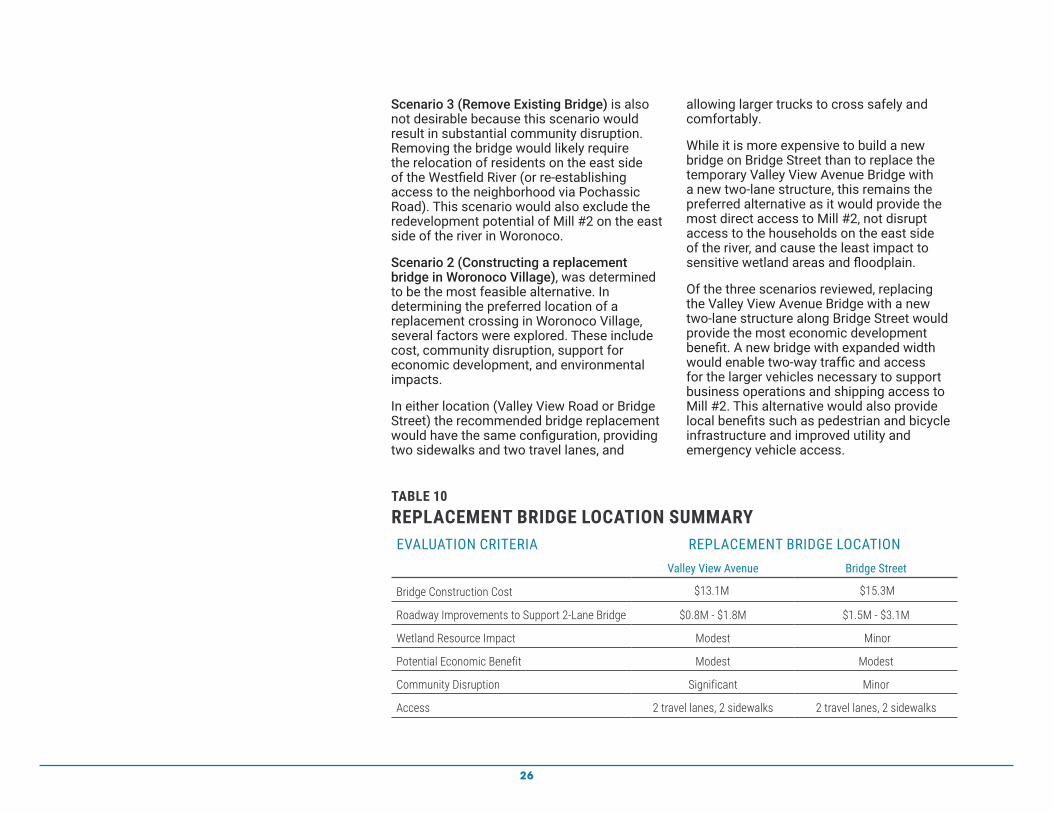
Scenario 2 (Constructing a replacement bridge in Woronoco Village), was determined to be the most feasible alternative. In determining the preferred location of a replacement crossing in Woronoco Village, several factors were explored. These include cost, community disruption, support for economic development, and environmental impacts.
In either location (Valley View Road or Bridge Street) the recommended bridge replacement would have the same configuration, providing two sidewalks and two travel lanes, and
allowing larger trucks to cross safely and comfortably.
While it is more expensive to build a new bridge on Bridge Street than to replace the temporary Valley View Avenue Bridge with a new two‑lane structure, this remains the preferred alternative as it would provide the most direct access to Mill #2, not disrupt access to the households on the east side of the river, and cause the least impact to sensitive wetland areas and floodplain.
Of the three scenarios reviewed, replacing the Valley View Avenue Bridge with a new two‑lane structure along Bridge Street would provide the most economic development benefit. A new bridge with expanded width would enable two‑way traffic and access for the larger vehicles necessary to support business operations and shipping access to Mill #2. This alternative would also provide local benefits such as pedestrian and bicycle infrastructure and improved utility and emergency vehicle access.
TABLE 10REPLACEMENT BRIDGE LOCATION SUMMARYEVALUATION CRITERIA REPLACEMENT BRIDGE LOCATION
Valley View Avenue Bridge Street
Bridge Construction Cost $15.3M$13.1M
Roadway Improvements to Support 2-Lane Bridge $0.8M - $1.8M $1.5M - $3.1M
Wetland Resource Impact Modest Minor
Potential Economic Benefit Modest Modest
Community Disruption Significant Minor
Access 2 travel lanes, 2 sidewalks 2 travel lanes, 2 sidewalks
27
4.0 REDEVELOPMENT OPPORTUNITIES AND CHALLENGES
A replacement bridge that enables two‑way traffic across the Westfield River is necessary for the successful redevelopment of Mill #2 but is not the only requirement for redevelopment in Woronoco. Site location challenges, existing site facilities, and poor economic trends for prospective industries may limit redevelopment opportunities at both mills. While many of these challenges and opportunities apply to both Mill #1 and Mill #2, Mill #2’s location on the east side of the Westfield River provides additional challenges.
Redevelopment of Mill #2 will depend on actions taken, primarily by the Town of Russell, to address these site location challenges and to prepare for any changes in expected industry growth within the region. Though there are numerous barriers to redevelopment, there are also opportunities that potential developers could take advantage of.
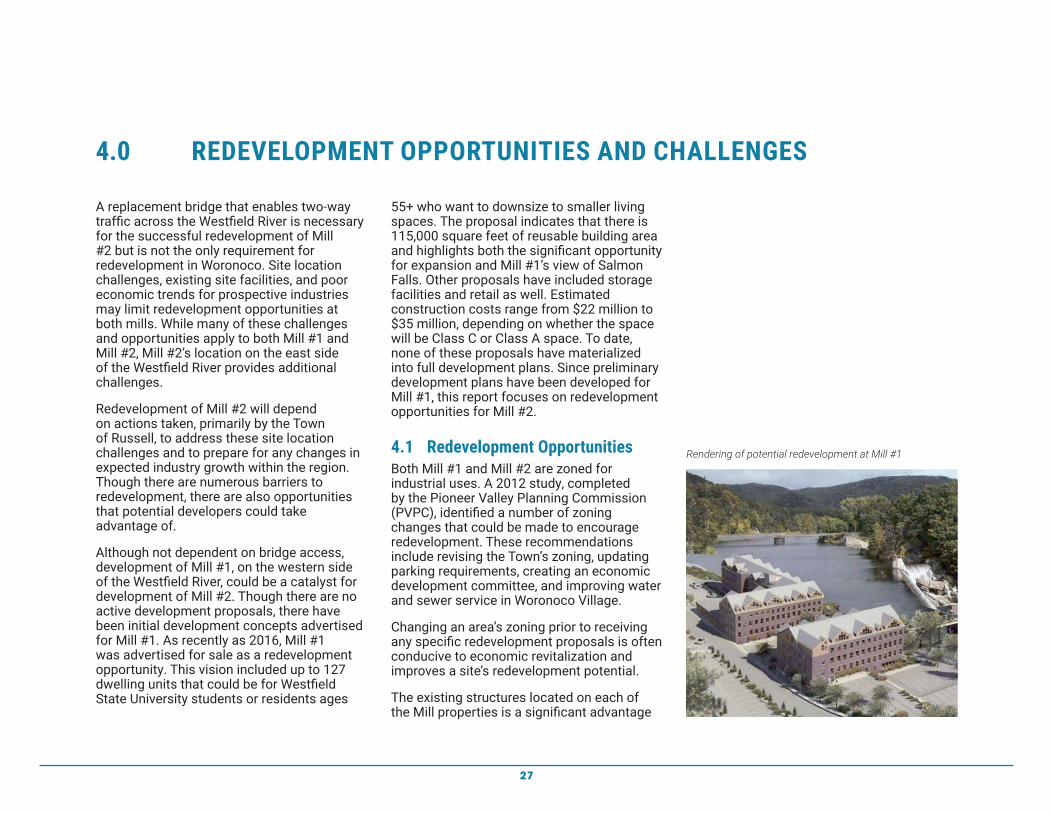
Although not dependent on bridge access, development of Mill #1, on the western side of the Westfield River, could be a catalyst for development of Mill #2. Though there are no active development proposals, there have been initial development concepts advertised for Mill #1. As recently as 2016, Mill #1 was advertised for sale as a redevelopment opportunity. This vision included up to 127 dwelling units that could be for Westfield State University students or residents ages
55+ who want to downsize to smaller living spaces. The proposal indicates that there is 115,000 square feet of reusable building area and highlights both the significant opportunity for expansion and Mill #1’s view of Salmon Falls. Other proposals have included storage facilities and retail as well. Estimated construction costs range from $22 million to $35 million, depending on whether the space will be Class C or Class A space. To date, none of these proposals have materialized into full development plans. Since preliminary development plans have been developed for Mill #1, this report focuses on redevelopment opportunities for Mill #2.
4.1 Redevelopment OpportunitiesBoth Mill #1 and Mill #2 are zoned for industrial uses. A 2012 study, completed by the Pioneer Valley Planning Commission (PVPC), identified a number of zoning changes that could be made to encourage redevelopment. These recommendations include revising the Town’s zoning, updating parking requirements, creating an economic development committee, and improving water and sewer service in Woronoco Village.
Changing an area’s zoning prior to receiving any specific redevelopment proposals is often conducive to economic revitalization and improves a site’s redevelopment potential.
The existing structures located on each of the Mill properties is a significant advantage
Potential for up to 127 dwelling units - 74 One Bedroom Units, 7 Two Bedroom Units, and 46 Efficiency Units
115,000 SF Reusable Building Area Beautiful views overlooking Salmon Falls on the
Westfield River Access to Public Sewer Located only 10 minutes from downtown Westfield Potential Senior Housing or Student Living Permitting Process Partially Completed Real Estate Taxes:
- 261 Woronoco 3.2 acres $183,000- 268 Woronoco 2.32 acres $78,6002018 associated value $262,100
Asking Price: $1,200,000
For Sale: Woronoco Mills Development OpportunityRussell, Massachusetts
The information contained herein has been provided to us by the owner of the property or other sources we deem reliable. We have no reason to doubt it’s accuracy, but we do not guarantee it. All the information should be verified prior to purchase or lease.
Rendering of potential redevelopment at Mill #1

28
because some competitive sites in the region would require expensive, ground‑up construction. Both mills provide significant space for redevelopment. Advertisements for Mill #1 indicate there are 115,000 square feet available for redevelopment and Mill #2 has approximately 280,000 square feet of vacant space that could support a variety of industrial uses. Based on interviews with local stakeholders and various organizations, several industries were identified as potentially viable reuses of Mill #2. Most of the industries considered as viable candidates for the reuse of Mill #2 are manufacturing‑oriented and include the following: food and beverage (microbrewery, cheese manufacturing, etc.), bio‑mass manufacturing (wood pellets and/or chips), and wood processing (lumber, furniture making, etc.). Additional, non‑manufacturing, uses that could be viable include distribution, warehousing, and general industrial uses.
One advantage Mill #2 has over Mill #1 is direct rail access; rail access is important to resource‑oriented manufacturing industries such as wood pellet/chips and furniture manufacturing and other light/heavy industrial uses. Both Mill #1 and Mill #2 have access to electrical service; hydro‑generated electricity is currently located near the Westfield River. The sewer utilities have additional capacity for expansion, and the mills appear to be capable of being developed for other uses. This would lower overall construction costs compared to building a new facility.
The Westfield River attracts outdoor enthusiasts and has been the site for the Westfield River Whitewater Races since 1953. Nearby trails and paths attract other recreational uses such as All‑Terrain‑Vehicles
(ATVs), snowmobiling, hiking, rock climbing, and fishing. Capitalizing on these uses would require hospitality‑oriented businesses including an outdoor outfitter to provide recreational equipment to visiting tourists or residents. Recreational opportunities for the Westfield River and the surrounding trails can be enhanced with additional investment in trail infrastructure and/or tourist‑themed retail.
4.2 Redevelopment ChallengesDespite these opportunities, redevelopment of Mill #2 is limited by more than the need for a new, two‑way bridge. Other challenges limiting redevelopment potential at both Woronoco Mills include insufficient water capacity for fire suppression, lack of broadband internet access, lack of nearby access to an interstate highway (e.g. interstate), limited labor market, and lack of targeted business incentives for site development. To meet fire suppression requirements and ensure enough pressure and volume capacity, the existing 4‑inch water lines need to be upgraded to 8‑inch lines. The lack of broadband internet access is limiting to business communication. Site observations and aerial photographs indicate that there may be a lack of parking surrounding the Woronoco Mills. This may limit the site use or require nearby areas to be converted to parking if required. Further, there has been no active discussion among regional and state agencies about coordinating available resources to leverage private development.
The 7.5 miles between the Strathmore Mills and Interstate 90 are a significant barrier to redevelopment. This distance is particularly challenging for any businesses who rely

29
on truck shipments and interstate access to receive needed production inputs or to transport finished goods to distant markets.
The economic development potential of Mills #1 and #2 is also affected by the availability and competitiveness of other industrial sites in the region. Information from the Massachusetts Alliance for Economic Development (MassEcon1) was used to identify available sites for similar industrial use and review how they compare with Mills #1 and #2. Many of the locations listed in Table 3 on page 12 are Market Ready Certified and classified for expedited permitting under Chapter 43D2, have a full range of available utilities, and are located within 2.5 miles of a major interstate (I‑90, I‑91, or I‑291).
Woronoco is in a relatively remote, rural area, while other competitive industrial sites are in metropolitan areas that are more accessible. Until market conditions change, prospective companies will likely prioritize these sites over the Woronoco Mills given their location, access, and available utilities. However, if there is growth in prospective industries and the number of available site locations does not increase, companies and developers may consider the Woronoco Mills.
4.3 Necessary Infrastructure Improvements
The condition of the existing temporary bridge on Valley View Avenue is not the only
1 https://massecon.com/services/readymass100/search/ Mass Econ provides site location services business looking to locate in Massachusetts
2 A program to guarantee local permitting decisions on priority development sites within 180 days https://www.mass.gov/service-details/chapter-43d-expedited-local-permitting
factor limiting the redevelopment potential of Mill #2. There are utility improvements that would be necessary for Woronoco Village to compete with nearby communities for development.
As referenced in the 2012 Pioneer Valley Planning Commission (PVPC) zoning study, a 2006 Water Distribution Study found that water distribution to was sufficient for both residences and businesses, but fire flows were severely deficient. These flows would need to be increased before significant development could occur in the Village. The same PVPC study reiterated the need for improved water service, noting that existing water volumes in Woronoco Village are insufficient for fire suppression needs and are likely insufficient to support redevelopment.
Chapter 43D – Expedited Local Permitting, commonly referred to as “Streamlined Permitting,” provides a transparent and efficient process for municipal permitting and guarantees local permitting decisions on priority development sites within 180 days. This opt‑in program enables municipalities to increase the visibility of their community and targeted development site(s). The benefits of participating in Chapter 43D include: priority consideration for MassWorks Infrastructure Program grants, brownfields remediation assistance, and other financing through quasi‑public organizations; online marketing for the site(s) and pro‑business regulatory climate; improved municipal planning and permitting efficiencies; and collection of special fees for priority development site permit applications.
30
This study also identified the need for increased sewer capacity.
The PVPC study identified zoning and roadway improvements that could be made to support economic development and help bring industry back to Woronoco Village. PVPC found that the current zoning in Woronoco was the “first and most critical action the town needs to undertake in order for robust economic activity to occur again in Woronoco.” The study recommended several zoning changes to make redevelopment more feasible. PVPC recommended that Russell adopt flexible, mixed‑use zoning districts that developers could use to permit the type of development previously proposed for Mill #1. PVPC also identified a need for revised parking requirements in Woronoco Village to standardize on‑street parking regulations and clarify the number of parking spaces new development must provide. Additionally, the study recommended that the Town of Russell consider creating public parking areas on town‑owned land in the area to support redevelopment and enhance recreational opportunities.
In addition to reviewing zoning regulations, the 2012 PVPC study identified roadway improvements that the Town could pursue to encourage economic development and redevelopment at Mills #1 and #2. As part of this study, the local roadways were reviewed. Four roadway improvements were recommended to support a new two‑lane crossing over the Westfield River and support any redevelopment activities. Two of these improvements echo recommendations made by PVPC in 2012. These improvements are shown on Figure 8 (on page 34) and construction estimates can be found in Table 11.
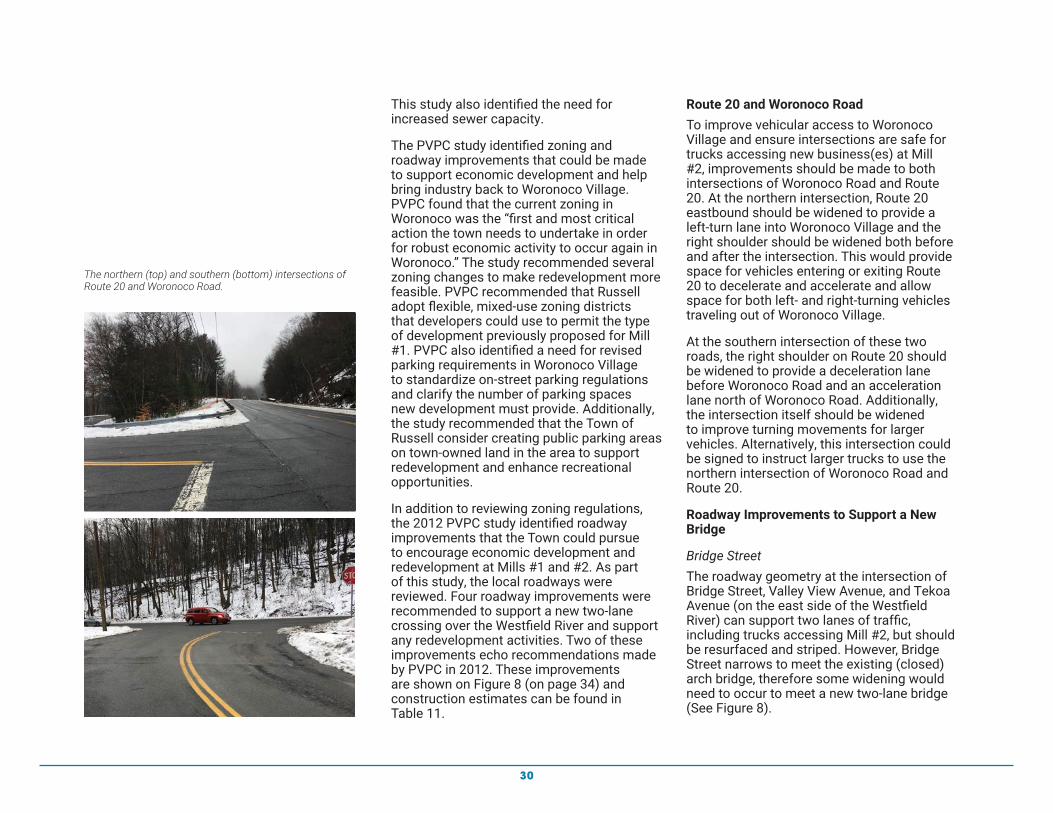
Route 20 and Woronoco RoadTo improve vehicular access to Woronoco Village and ensure intersections are safe for trucks accessing new business(es) at Mill #2, improvements should be made to both intersections of Woronoco Road and Route 20. At the northern intersection, Route 20 eastbound should be widened to provide a left‑turn lane into Woronoco Village and the right shoulder should be widened both before and after the intersection. This would provide space for vehicles entering or exiting Route 20 to decelerate and accelerate and allow space for both left‑ and right‑turning vehicles traveling out of Woronoco Village.
At the southern intersection of these two roads, the right shoulder on Route 20 should be widened to provide a deceleration lane before Woronoco Road and an acceleration lane north of Woronoco Road. Additionally, the intersection itself should be widened to improve turning movements for larger vehicles. Alternatively, this intersection could be signed to instruct larger trucks to use the northern intersection of Woronoco Road and Route 20.
Roadway Improvements to Support a New Bridge
Bridge StreetThe roadway geometry at the intersection of Bridge Street, Valley View Avenue, and Tekoa Avenue (on the east side of the Westfield River) can support two lanes of traffic, including trucks accessing Mill #2, but should be resurfaced and striped. However, Bridge Street narrows to meet the existing (closed) arch bridge, therefore some widening would need to occur to meet a new two‑lane bridge (See Figure 8).
The northern (top) and southern (bottom) intersections of Route 20 and Woronoco Road.

31
On the west side of the Westfield River, Bridge Street would also need to be widened to meet a new bridge. At the intersection of Bridge Street and Woronoco Road, the intersection should be widened to allow larger trucks to turn and the intersection’s edges should be defined to clearly identify the intersection. Even with redevelopment at Mill #2, traffic volumes are anticipated to be low enough that allowing one vehicle to occupy the entire roadway would be practical.
Valley View Avenue
If a new two‑lane bridge were constructed on Valley View Avenue, the roadway would need to be widened to meet the bridge. At Valley View Avenue and Woronoco Road, the intersection and bridge approach would need to be widened to allow for truck turning and traffic (See Figure 8).
4.4 Resources to Support Infrastructure Improvements
To become competitive with other existing site locations, there are resources available from regional and state agencies to support public infrastructure projects and incentivize private development. Information about the MassWorks infrastructure grant program was provided by the Executive Office of Housing and Economic Development (EOHED). EOHED identified important elements of the MassWorks program that could support revitalization efforts at Mill #2. MassWorks, started in 2011, is a competitive grant program that provides funding for municipalities and other public entities for public infrastructure projects that support housing and job growth within Massachusetts, especially for areas in need of economic growth. Since 2015, the program
has invested more than $358 million in 177 infrastructure projects in 128 municipalities3. MassWorks funding could be used within Woronoco Village to:
• Increase water capacity to meet fire suppression needs,
• Improve transportation performance,• Expand recreational or community
infrastructure, and/or• Modernize sewer operations (if necessary).
3 https://www.mass.gov/service-details/massworks-infrastruc-ture-grants
TABLE 11POTENTIAL INTERSECTION IMPROVEMENTSINTERSECTION DESCRIPTION ESTIMATED COST
(2019 Dollars)
Woronoco Road and Route 20 (north) • Provide a left-turn lane into Woronoco Village
• Widen shoulder to provide deceleration and acceleration lanes
$4.9M - $10.6M
Woronoco Road and Route 20 (south) • Widen intersection to allow trucks to turn• Widen shoulder to provide deceleration
and acceleration lane
$1.5M - $3.2M
New Bridge at Bridge Street • Widen intersection to allow larger trucks to turn and better define the intersection (Bridge Street and Woronoco Road)
• Resurface and widen to meet new bridge (Bridge Street)
• Resurface and stripe (Bridge Street, Valley View Avenue, and Tekoa Avenue)
$1.5M - $3.1M
New Bridge at Valley View Avenue • Widen intersection and bridge approach (Valley View Avenue and Woronoco Road)
• Resurface and widen to meet new bridge (Valley View Avenue)
$0.8M - $1.8M

32
")23
£¤20
£¤20
§̈¦90
Westfield River
Westfield River
Potash BrookMill#2Mill
#1
Massachusetts Turnpike
Pochassic Rd (u nimp roved log ging road)
Pochassic Rd (unim
proved logging road)
Old R
te 2 3
Valley Vie w Ave
Valley View Ave
Woronoco Rd
Woronoco Rd
Mountain View Terr Hill St
Bridge StTek oa Ave
Route 20
Route 20
Route 20
Laurel Rd
Blandford Rd
Woronoco Rd
N
Woronoco Road and Route 20 (south)• Widen shoulder to provide
deceleration lane.• Widen intersection to allow trucks
to turn
Bridge Street, Valley View Ave, and Tekoa Ave• Widen Bridge Street to meet
the width of the new bridge.• Mill and overlay the roadway.
Woronoco Road and Bridge Street• Widen Bridge Street to meet the
width of the new bridge.• Better define the intersection
beginning and end.• Mill and overlay the roadway,
widening as necessary.
Woronoco Road and Route 20 (north)• Widen Route 20 to provide a left turn
lane into Woronoco Road.• Widen shoulder south of Woronoco
Road to provide a deceleration lane.• Widen shoulder north of Woronoco
Road to provide an acceleration lane.
FIGURE 8POTENTIAL
INTERSECTION IMPROVEMENTS

33
The average MassWorks grant award is $2 million. To meet selection criteria, projects must demonstrate that they provide a public benefit. Though the program does not require a local match, program guidance states that “applications that include funding support from other government or local sources will be more competitive.”4 Some examples of MassWorks projects in the area include:
• Westfield, MA: $1.9 million award in 2016 for signalization and improved transportation access to Springfield Road5.
• Ludlow Mills, Ludlow, MA: $3.5 million award in 2017 to construct Riverside Drive, which opened 60 acres of pre‑permitted light industrial land up for redevelopment. This investment has enabled up to $300 million in additional private investment6.
• Ludlow Mills, Ludlow, MA: $492,000 awarded in 2016 for pedestrian lighting, historic signage, and safety improvements to the Ludlow Mills Riverwalk.
In addition to MassWorks, EOHED identified several other resources available such as low interest loans for developers provided by the Massachusetts Development Finance Authority and the Low‑Income Housing Tax Credit (LIHTC) Program managed by the Department of Housing and Community Development (DHCD).
The Massachusetts Technology Collaborative (www.masstech.org) helps rural communities
4 2019 MassWorks Infrastructure Program Request for Responses, Guidelines, and Application Information (https://www.mass.gov/files/documents/2019/05/13/2019%20MWIP%20GuidelinesRFP%20FINAL.pdf)
5 https://malegislature.gov/Bills/189/SD2785.pdf
6 https://www.mass.gov/service-details/massworks-2017-award-winners
connect to broadband internet access through middle and last mile programs.
In addition to funding potentially available from public and non‑profit sources, if a developer or business is interested in Mills #1 or #2, there is the potential for private funds to support infrastructure improvements.
In 2012, the Pioneer Valley Planning Commission identified some strategies that the Town of Russell could implement to both entice economic development and support local businesses. These recommendations include:
• Forming an economic development committee and working with local economic development and tourism organizations,
• Allowing businesses to place signage on town‑owned land along Route 20,
• Installing signage identifying the Village of Woronoco at both intersections of Route 20 and Woronoco Road,
• Coordinating with the Massachusetts Historical Commission to establish a National Register Historic District in Woronoco Village to make Federal and State Historic Tax Credits available to the owners of income‑generating buildings, and
• Connecting future recreational, retail, and dining opportunities to existing cultural institutions such as the Jacob’s Ladder Byway.
4.5 Potential Funding for Bridge Rehabilitation or Replacement
There are a variety of funding sources that could be used to support rehabilitation of the Valley View Avenue Bridge or
34
construction of a new bridge. Many projects of this scale utilize funding from multiple sources. The following is a description of the most common sources of funding for transportation improvements.
Inclusion on State Transportation Improvement Program (STIP)The State Transportation Improvement Program (STIP) is a list of projects prepared yearly by the Office of Transportation Planning. Local communities and Regional Planning Agencies (RPAs) partner with MassDOT’s Highway Division and the many state agencies that work together to plan, design, permit, and construct hundreds of highway, bridge, roadway, and intermodal investments annually. The STIP is the programming document used to allocate federal funding. The MBTA and the fifteen Regional Transit Authorities (RTAs) in Massachusetts, in cooperation with local officials and the MassDOT Rail and Transit Division, plan, develop, and implement transit investments. Together, these investments are listed in a single document that constitutes the STIP. The STIP includes projects such as: bicycle paths, bridges, roadways, sidewalks, and transit investments. Considering the cost of a new bridge and the necessary roadway improvements associated with a larger bridge, funding may need to be identified over multiple years.
Surface Transportation Block Program (STBG)The Surface Transportation Block Program (STBG) provides flexible funding that may be used by local municipalities, regions, and states for projects to preserve and improve the conditions on, and performance of, any
federal‑aid highway, bridge, or tunnel, as well as for projects on any public road (except local roads and rural minor collectors), pedestrian and bicycle infrastructure, and transit capital projects, including intercity bus terminals. Fifty percent of a state’s STBG funds are distributed in three categories based on population (urbanized areas with populations greater than 200,000, other areas with populations between 5,000 and 20,000, and areas with populations of 5,000 or less); funds allocated by population are distributed to the three categories in proportion to their relative shares of the state’s total population. The remainder of the STBG funds can be used in any area of the state. A portion of STBG funds (equal to 15% of a state’s FY 2009 Highway Bridge Program apportionment) is to be set aside for bridges not on federal‑aid highways, unless the Secretary determines the state has insufficient needs to justify this amount. These structures are called “off‑system bridges.” The Westfield River crossing in Woronoco Village would not qualify for traditional STBG funding but could be eligible funding through the off‑system bridge set‑aside.
Chapter 90Chapter 90 funds are allocated annually to each municipality in Massachusetts for capital improvement projects such as highway/roadway construction and preservation or improvement projects that create of extend the life of roads and bridges. The Town of Russell receives approximately $100,000 in Chapter 90 funding per year.
MassWorks Infrastructure ProgramThe MassWorks Infrastructure Program is a competitive grant program that provides

35
a flexible source of capital funds for municipalities and other eligible public entities to support and accelerate job growth and economic development throughout the Commonwealth. The program is administered by the Executive Office of Housing and Economic Development (EOHED). Funds can be used to pay for infrastructure work including, but not limited to, sewers, utility extensions, streets, roads, traffic signalization, demolition, pedestrian walkways, and water treatment systems.
In general, there is no set minimum or maximum amount that can be requested for a MassWorks grant, but there is a $1 million per award maximum for small communities seeking funds for roadway safety projects. The Town of Russell could apply for $1 million in roadway safety funding on top of requests made in other categories.
Projects are evaluated based on several factors including the extent to which the project unlocks major development and the amount of private investment leveraged.
Private Sector Funding It may also be possible for the Town to access private funding to assist with roadway improvements and/or bridge repair or replacement. Developers or companies that want to locate in Woronoco Village may be willing to make infrastructure improvements or contribute to funds that support infrastructure projects.

36
View of the Westfield River in Woronoco Village

37
5.0 ECONOMIC AND TRAFFIC IMPACT OF DEVELOPMENT
The three scenarios (Rehabilitate Valley View Ave Bridge, Construct New Bridge, and Remove Bridge) were each evaluated to determine the range of economic development opportunities based on an understanding of the regional economy, current trends, site visit observations, and insights gathered from interviews. These opportunities reflect the range of potential crossing outcomes and their potential effect on the redevelopment of the mill sites.
Our analysis indicated that construction of a new two‑lane bridge at Bridge Street would provide the best opportunity to increase the economic revitalization of Mill #2. However, this action alone would not solve the other challenges limiting development opportunities, including water service deficiencies, limited local labor market, declining industrial activity in the area, and the distance to interstate access. A new two‑way bridge would enable larger vehicles required to support business operations and shipments to cross.
5.1 Economic ImpactAn analysis of the economic development potential of Mill #2 was conducted based on the available square footage (approximately 280,000 square feet). This analysis is consistent with a “capacity study” and assumes full build‑out of Mill #2. This contrasts with a marketing analysis study
which evaluates the timing of development based on the demand and supply of nearby industrial parks, specific siting requirements, and expected growth in tenants given the current real estate market.
Based on market research and local input, these potential redevelopment opportunities focused on manufacturing and industrial reuses of Mill #2.
These job projections were used to develop two scenarios (high intensity and low intensity) traffic volume forecasts as discussed in the next section.
5.2 Forecast Traffic VolumesConducted using standard traffic and planning practices, this initial transportation impact evaluation provides a broad overview of the effects of the potential construction of a new permanent bridge over the Westfield River. Should the construction of a new bridge move forward, a more detailed engineering study would typically be completed in conjunction with the design of the bridge structure.
Various future alternatives were analyzed as part of this evaluation. Future No‑Build Conditions examine vehicular traffic conditions 20 years in the future (in 2038), assuming that a new bridge is not constructed and no other substantial

38
TABLE 12MILL #2 INDUSTRY DEVELOPMENT OPPORTUNITIESINDUSTRY SQUARE FEET
PER JOB*JOBS AT MILL #2
Manufacturing 892 314
Light / Heavy Industrial 892 314
Wood Pellet Manufacturing 1,091 256
Timber / Lumber Industry 1,091 256
Biomass – Wood Chips (CHP) 1,091 256
Microbrewery / Craft Beer Manufacturing 1,273 220
Marijuana Processing Plant 1,273 220
Furniture Manufacturing 1,558 180
Warehousing 2,306 121
Trucking / Distribution 2,306 121
Average 1,304 214
*NAIOP Research Foundation. “Stabilization of the U.S. Manufacturing Sector and Its Impact on Industrial Space.” P.29. Figure 18: “Manufacturing Industries (Square Feet per Employee)”
redevelopment activity occurs in the area. The Future Build Condition examines the impact that construction of a new bridge and substantial redevelopment of Mill #2 will have on traffic conditions in the study area.
Future No Build Traffic Operating ConditionsIn order to evaluate transportation conditions associated with the potential bridge construction, future 2038 No Build Condition traffic volumes were examined to provide a baseline condition for comparison. No Build Condition vehicular traffic volumes are those that are expected to use the roadway network in the future, assuming the bridge is not reconstructed and no other substantial redevelopment activity occurs in the area. No‑Build Condition traffic volumes were projected for a 20‑year time horizon (to the year 2038) based on traffic volumes collected in 2018.
General Background GrowthA general background growth rate of one‑half of one per cent (0.5%) per year was selected as the background growth rate and was applied to base year (2018) traffic volumes. This rate is consistent with the growth rates employed in studies conducted in Massachusetts in recent years. It is assumed that the one‑half of one percent annual background growth rate employed will also capture the trips associated with development projects that have yet to be identified. The selected background growth rate is expected to be high, given the expected population and employment growth rates in the region.
Potential job estimates were calculated using average square foot per job ratios developed by the National Association of Industrial and Office Properties (NAOIP) Research Foundation. Across all prospective industries, the average square footage per job is 1,300 square feet. Assuming full usage of the site, this would result in approximately 250 jobs. In addition to the jobs created by new industrial uses, Mill #2 has electrical facilities that could be renovated and reused to generate up to 500 mega‑watts of power using steam powered turbines. This would support between 5 and 15 additional jobs. Given the somewhat recent development proposal to convert Mill #1 to housing, Mill #1 was not included in this portion of the analysis.

39
FIGURE 9NO BUILD SCENARIO2038 FORECASTED PEAK HOUR VOLUMES
AM (PM)
")23
£¤20
£¤20
§̈¦90
Westfield River
Westfield River
Potash BrookMill#2Mill
#1
Pochassic Rd (u nimp roved log ging road)
Pochassic Rd (unimproved logging road)
Old R
te 2 3
Valley Vie w Ave
Valley View Ave
Woronoco Rd
Woronoco Rd
Mountain View Terr Hill St
Bridge StTek oa Ave
Route 20
Route 20
Laurel Rd
Blandford Rd
Woronoco Rd
N
2 (2)0 (1)
3 (4)2 (2)
2 (7)
1 (1)
246(162)
2 (2)
0 (2)
2 (2)
1 (0)126 (309)
Turning Movement Count Locations
No Build Scenario2038 Forecasted Peak Hour Volumes
AM (PM)
9497
Daily (24 hour)Bridge Crossings: 191
Massachusetts Turnpike
1 (0)410(230)
1 (0)
0 (0)7 (11)
166(473)
7 (10)
Route 20

40
Future No Build (2038) peak hour traffic volumes at study area intersections are shown on Figure 9.
Future Build Traffic Operating ConditionsThe Future Build scenario consists of the construction of a new bridge over the Westfield River and economic development that could occur as a result. Vehicle‑trips associated with this economic development were projected, distributed, and assigned to the adjacent roadway network. These incremental vehicle‑trips are added to No Build Condition traffic volumes to form the Build Condition traffic volume networks for the morning and afternoon commuter peak hours. The Build Condition also includes any travel pattern changes associated with the construction of a replacement bridge at Bridge Street and the elimination of the temporary bridge that is currently in use.
Estimated Trip GenerationThrough interviews and market data research, several scenarios were identified for potential redevelopment of Mill #2. As mentioned previously, these scenarios focused primarily on manufacturing and industrial uses. To estimate the number of trips expected to be generated with redevelopment at Mill #2, the lowest and highest generated uses were analyzed in order to provide a range of expected vehicle trips. To conduct this analysis, data contained in the Institute of Transportation Engineers Trip Generation (10th ed. 2017) was used. Trip Generation software provides projections for a number of land uses. The data contained in the Trip Generation Manual have been obtained from the research and experiences of transportation engineering and planning professionals and is based on over 3,700
trip generation studies submitted by public agencies, developers, consulting firms and associations.
The trips associated with the two Mill redevelopment scenarios were calculated using available trip generation rates contained in Trip Generation for corresponding land uses. The incremental trips associated with the two Mill redevelopment scenarios are shown in Table 13. Note that these uses are independent of one another.
Based on the results of this analysis for Mill #2, the higher generating use of the Mill is projected to add 227 trips (163 entering, 64 exiting) during the weekday morning peak hour and 221 trips (95 entering, 126 exiting) during the afternoon peak hour. On a daily basis, the higher generating use of the Mill is expected to add approximately 1,100 trips to the roadway network. This trip generation analysis assumes 100 percent of the trips are made by automobile and no mode split (including pedestrian or bicycle travel) has been applied.
Similarly, the lower generating use of the Mill is projected to add 62 trips (40 entering, 22 exiting) during the weekday morning peak hour and 67 trips (16 entering, 51 exiting) during the afternoon peak hour. On a daily basis, the lower generating use of the Mill is expected to add approximately 487 trips.
Trip Distribution and AssignmentTrip generation results quantify additional trips associated with a specific development proposal. In order to assess the impacts related to these additional traffic volumes, trips must be distributed on to the local roadway network.

41
The incremental trips expected to be generated by the two distinct Mill development scenarios were assigned to the roadway network based on existing travel patterns. These patterns were determined using data collected through 24‑hour traffic volume counts as well as peak hour traffic volume counts conducted at study area intersections.
Year 2038 Build peak hour traffic volumes for each of the Mill development scenarios, which consist of the addition of incremental peak hour mill site trips to 2038 No Build traffic volumes, are displayed in Figures 10 and 11. Year 2038 Build traffic volumes account for the changes in travel patterns due to the closure of the temporary bridge and the construction of a replacement bridge at Bridge Street.
The new bridge is expected to carry approximately 1,290 vehicles per day under the Manufacturing Mill development scenario or approximately 678 vehicles per day under the Warehousing Mill development scenario. Each estimate consists of a mix of traffic associated with the redevelopment of the mill and other general traffic.
TABLE 13TRIP GENERATION SCENARIOS: HIGHER AND LOWER GENERATING USES
WEEKDAY MORNING PEAK HOUR
(trips)
WEEKDAY AFTERNOON PEAK HOUR
(trips)
TOTAL DAILY TRIPS
Enter Exit Total Enter Exit Total Weekday
Proposed 280,000 sf Manufacturing*(Higher Generating Use Scenario)
163 64 227 95 126 221 1,100
Proposed 280,000 sf Warehousing^(Lower Generating Use Scenario)
40 22 62 16 51 67 487
* based on ITE Trip Generation (10th Ed. 2017) - LUC 140 - Manufacturing^ based on ITE Trip Generation (10th Ed. 2017) - LUC 150 - Warehousing

42
FIGURE 10WAREHOUSING SCENARIO
2038 FORECASTED PEAK HOUR VOLUMES
AM (PM)
")23
£¤20
£¤20
§̈¦90
Westfield River
Westfield River
Potash BrookMill#2Mill
#1
Pochassic Rd (u nimp roved log ging road)
Pochassic Rd (unim
proved logging road)
Old R
te 2 3
Valley Vie w Ave
Valley View Ave
Woronoco Rd
Woronoco Rd
Mountain View Terr Hill St
Bridge StTek oa Ave
Route 20
Laurel Rd
Blandford Rd
Woronoco Rd
N
2 (2)28 (7)
18 (22)9 (35)
14 (17)
1 (1)
246(162)
30 (8)
0 (2)
9 (35)
1 (0)126 (309)
Turning Movement Count Locations
337341
Daily (24 hour)Bridge Crossings: 678
Warehousing Scenario2038 Forecasted Peak Hour Volumes
AM (PM)
Massachusetts Turnpike
1 (0)410(230)
1 (0)
0 (0)22 (29)
166(473)
19 (20)
Route 20
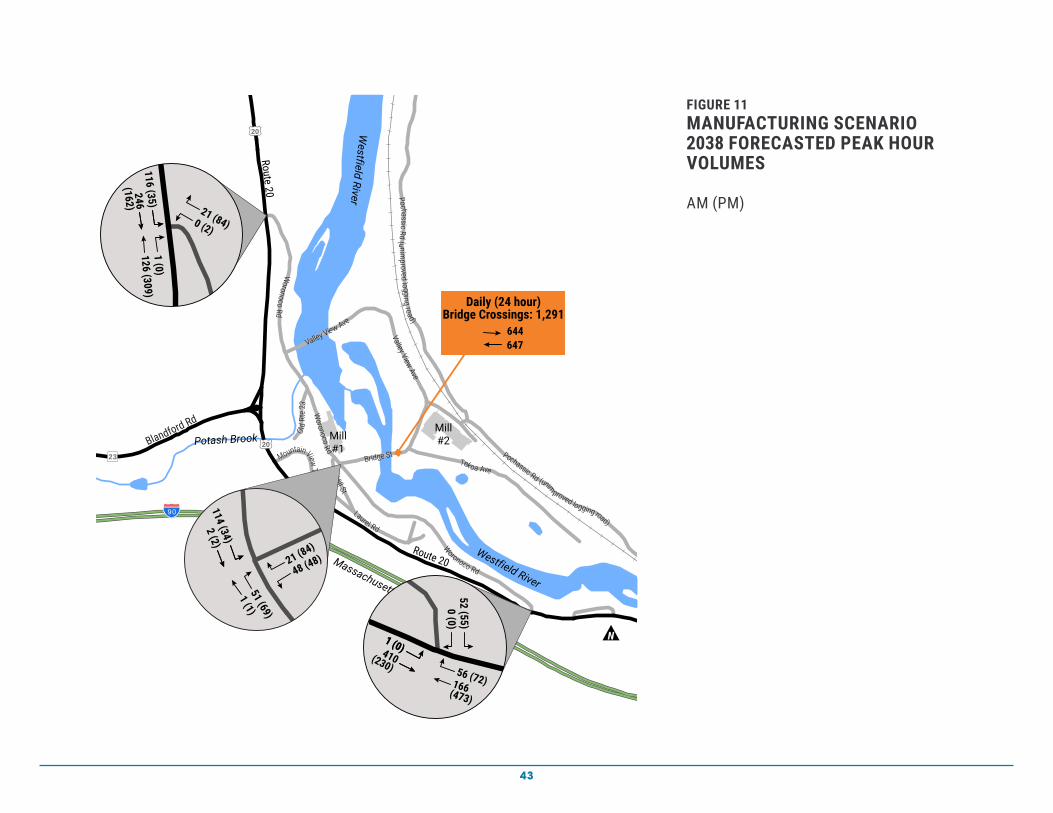
43
FIGURE 11MANUFACTURING SCENARIO2038 FORECASTED PEAK HOUR VOLUMES
AM (PM)
")23
£¤20
£¤20
§̈¦90
Westfield River
Westfield River
Potash BrookMill#2Mill
#1
Massachusetts Turnpike
Pochassic Rd (u nimp roved log ging road)
Pochassic Rd (unimproved logging road)
Old R
te 2 3
Valley Vie w Ave
Valley View Ave
Woronoco Rd
Woronoco Rd
Mountain View Terr Hill St
Bridge StTek oa Ave
Route 20
Laurel Rd
Blandford Rd
Woronoco Rd
Route 20
N1 (0)410(230)
1 (0)
0 (0)52 (55)
166(473)
56 (72)
2 (2)114 (34)
48 (48)21 (84)
51 (69)
1 (1)
246(162)
116 (35)
0 (2)
21 (84)
1 (0)126 (309)
Manufacturing Scenario2038 Forecasted Peak Hour Volumes
AM (PM)
Turning Movement Count Locations
644647
Daily (24 hour)Bridge Crossings: 1,291
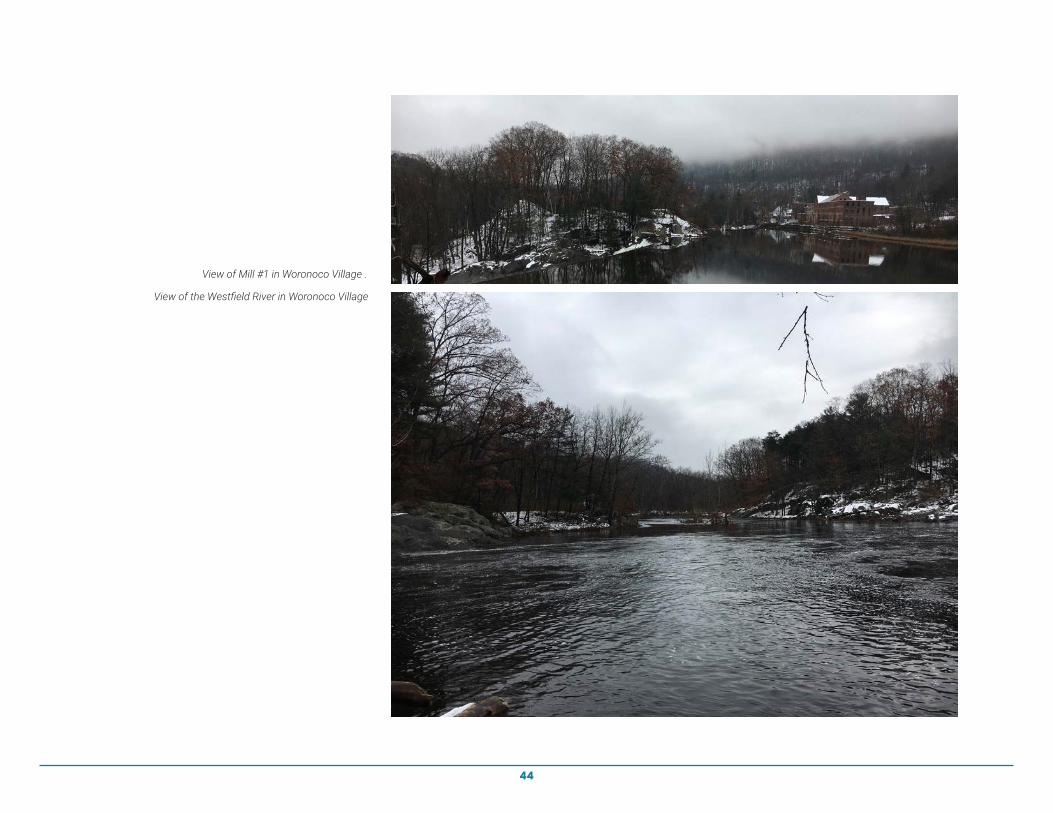
44
View of the Westfield River in Woronoco Village
View of Mill #1 in Woronoco Village .

45
6.0 CONCLUSION
Based on observations, socioeconomic trends and forecasts, and information gathered from interviews, meaningful economic development at Mill #2 will be very challenging without the construction of a new two‑way bridge over the Westfield River in Woronoco Village. However, there are additional barriers to the revitalization of Mill #2 beyond bridge access that should be addressed to encourage redevelopment. These include:
• Lack of broadband internet access,• Insufficient water service,• Lack of business incentives for site
development, and• Limited labor pool.
Historical trends and forecasts for employment in prospective industries and population changes indicate marginal or negative growth in the future; these conditions are not conducive to significant redevelopment opportunities in the area. Employment in industries identified as potential reuses for Woronoco Mill #2, including manufacturing, transportation, and warehousing, are forecast to decline in Hampden County from 2019 to 2023. Population growth is only expected to increase between 0.2% and 0.5% annually for Russell, Westfield, and other surrounding communities between now and 2035.
The revitalization potential of this area could depend on how well site location factors
are addressed and if there are changes in employment trends. Redevelopment of Mill #1, focused on residential housing, is not contingent on the condition of the current temporary bridge, but could serve as a catalyst for redevelopment at Mill #2 if other supporting infrastructure improvements are implemented and business incentives are available.
Whether or not the redevelopment of Mill #2 proceeds, there are households located on the east side of the river that require safe bridge access across the Westfield River to their homes. The current Valley View Avenue Bridge, while not in need of immediate repairs, is nearing the end of its anticipated useful life. The Town of Russell should initiate discussions with PVPC and MassDOT to begin the planning process to either construct a new bridge or identify alternative access for these residents.
The preferred location for a new Westfield River crossing in Woronoco Village is on Bridge Street. This location provides the most direct access to Mill #2 and would maintain access to the eastern side of the river during construction; however, a bridge a this location would cost more to construct compared to the Valley View Road location. A two‑lane new bridge on Bridge Street with needed approach roadway improvements would cost between $16,127,000 and $17,127,000. The additional potential roadway improvements
In a 2012 study, the Pioneer Valley Planning commission found that revising the zoning in Woronoco Village was the "first and most critical action the Town needs to undertake in order for robust economic activity to occur again in Woronoco."

46
within Woronoco Village would cost between $2,300,000 and $4,900,000.
The environmental resources in the Woronoco Area are primarily associated with the Westfield River and Tekoa Mountain Wildlife Management Area. A new Bridge Street bridge would have limited environmental impact, other than minor impact to 100‑year floodplain. A new bridge at Valley View Avenue would likely have substantially greater impact to environmental resources, including bordering vegetated wetland, floodplain, and wildlife habitat. Both sites are within Priority and Estimated Rare Species Habitat, but impacts at Valley View Avenue would likely be more significant due to the likelihood that a bridge in this location would require a pier in the water. This pier, combined with the floodplain and wetland impacts of the bridge approaches, might result in significant impacts at Valley View Avenue that would not be created with a new crossing at Bridge Street.
In reviewing the potential impacts, costs, and economic development potential, Bridge Street would be the best location for a new, two‑lane crossing in Woronoco Village. While the economic development potential would be very challenging without a new bridge over the Westfield River, a new crossing would not necessarily induce development without additional utility improvements and financial incentives . In addition to considering a permanent crossing to replace the temporary Valley View Avenue Bridge, the Town of Russell should begin implementing other strategies, such as rezoning Woronoco Village, improving water and sewer service, and creating an economic development committee to both support existing local businesses and help attract new development to Russell.


268
WESTFIELD RIVER CROSSING STUDY