Embed Size (px)
Citation preview

Teacher Guide
Western
Western Canadian
Unit 11: Probability
Cover Gr5 TG WCP U11 02/24/2005 10:39 AM Page 3

UNIT
“In the society for which we areeducating children, theavailability of information isexploding—computers are ableto store, sort, and analyzemassive amounts of data.Virtually all businesses,manufacturing firms, services,and professions requiredecision-making capabilitiesunder uncertain conditions.”
NCTM Addenda Series/Grades 5–8,
Dealing with Data and Chance
Mathematics Background
What Are the Big Ideas?
• The likelihood an outcome will occur can be described as impossible,unlikely, likely, improbable, probable, or certain.
• A fraction can describe the probability of an event occurring. Thenumerator is the number of outcomes favourable to the event; thedenominator is the total number of possible outcomes.
• The results of probability experiments often differ from theoreticalpredictions. As we repeat an experiment, actual results tend to comecloser to predicted probabilities.
• The results of probability experiments are not influenced by suchfactors as age, experience, or skill.
How Will the Concepts Develop?
Students use probability vocabulary (impossible, unlikely, likely,improbable, probable, certain) to describe the likelihood of differentoutcomes in a variety of situations.
Students find the number of possible outcomes of an event and describethe probability of a particular outcome as a fraction of all possibleoutcomes. They use organized lists and tables to record and count allpossible outcomes of an event.
Students predict the probability that an outcome will occur. They userandom draws and number cubes to conduct probability experimentsand compare actual results to predicted results.
Why Are These Concepts Important?
Throughout their lives, students will make decisions in situationsinvolving uncertainty. The abilities to understand, calculate, and predictprobabilities are valuable life skills that refine and extend basicintuitions about chance events. The work students do in this unit willhelp prepare them for later studies of probability theory, data analysis,and statistics.
FOCUS STRANDStatistics and Probability
SUPPORTING STRANDNumber: Number Concepts
Probability
ii Unit 11: Probability
11Gr 5 Unit 11 FM WCP 02/24/2005 10:40 AM Page ii

Unit 11: Probability iii
Lesson 1:The Likelihood of EventsLesson 2:Conducting ExperimentsLesson 3:Probability and FractionsLesson 4:Probability in GamesLesson 5:Strategies Toolkit
Curriculum Overview
General Outcomes• Students develop and implement a
plan for the collection, display, andinterpretation of data to answer aquestion.
• Students predict outcomes, conductexperiments, and communicate theprobability of single events.
• Students demonstrate a numbersense for whole numbers 0 to 100 000, and explore properfractions . . ..
Specific Outcomes• Students use a variety of methods to
collect and record data. (SP3)• Students list all possible outcomes of
an experiment involving a singleevent. (SP9)
• Students describe events, using thevocabulary of probability:best/worst; probable/improbable;always/more likely/equallylikely/less likely/never. (SP10)
• Students conduct probabilityexperiments, and explain the results,using the vocabulary of probability.(SP11)
• Students conduct probabilityexperiments to demonstrate thatresults are not influenced by suchfactors as the age, experiences, orskills of the participant. (SP12)
• Students demonstrate and describeequivalent proper fractionsconcretely, pictorially, andsymbolically. (N8)
LaunchAt the Pet Store!
Unit ProblemAt the Pet Store!
Show What You Know
Gr 5 Unit 11 FM WCP 02/24/2005 10:40 AM Page iii

iv Unit 11: Probability
Curriculum across the Grades
Materials for This Unit
Gather a collection of pennies.
Grade 4
Students identify anoutcome as possible,impossible, certain,uncertain.
Students compareoutcomes as equally likely,more likely, less likely.
Students design andconduct experiments toanswer one’s ownquestions.
Grade 5
Students use a variety ofmethods to collect andrecord data.
Students list all possibleoutcomes of anexperiment involving asingle event.
Students describe events,using the vocabulary ofprobability: best/worst;probable/improbable;always/more likely/equally likely/lesslikely/never.
Students conductprobability experiments,and explain the results,using the vocabulary ofprobability. Theydemonstrate that resultsare not influenced bysuch factors as the age,experiences, or skills ofthe participant.
Students demonstrate anddescribe equivalentproper fractionsconcretely, pictorially,and symbolically.
Grade 6
Students distinguishbetween experimental andtheoretical probability forsingle events. They makeconnections between thenumber of faces, forvarious dice, and theprobability of a singleevent.
Students calculatetheoretical probability,using numbers between 0 and 1. Theydemonstrate that differentoutcomes may occur whenrepeating the sameexperiment.
Students compareexperimental results withtheoretical results.
Gr 5 Unit 11 FM WCP 02/24/2005 10:40 AM Page iv

Unit 11: Probability v
Match My Meaning!For Extra Support (Appropriate for use after Lesson 1)Materials: Match My Meaning! (Master 11.7),construction paper, scissors, glue
The work students do: Students work in pairs. Theycut apart probability word and definition cards and usethem to play a “Concentration” game. Players who turnover matching word and definition cards keep thosecards and take another turn. The winner of each roundis the player with the most cards. After 5 rounds, theplayer who has won the most rounds is the “grandwinner.”
Take It Further: Students write statements aboutsituations that could be described using the probabilitywords on their cards.
Social/LinguisticPartner Activity
Fold Your Tents!For Extra Practice (Appropriate for use after Lesson 3)Materials: Fold Your Tents! (Master 11.9), smallsquares of paper, a tray
The work students do: Students work in pairs. Theyfold 20 small squares of paper (2 cm by 2 cm workswell) in half to form “tents.” They place the tents on atray and toss them so that all the tents land on the floor.Students record the number of tents that land fold up, onone side, and on one end.
Take It Further: Students predict the fraction of tentsthat will land fold up after the 10th and 20th tosses.
Kinesthetic/SocialPartner Activity
Animal DrawFor Extension (Appropriate for use after Lesson 2)Materials: Animal Draw (Master 11.8), scissors, a bag
The work students do: Students work with apartner. They cut apart a list of 12 animal names (4 cats, 4 insects, 2 birds, and 2 fish) and place thenames in a bag. In the experiment, students will draw acard from the bag, record the result, and replace thecard. Students predict the number of animal namesfrom each category they expect to draw from the bag in30 tries. They conduct the experiment and comparetheir actual results to their predictions.
Take It Further: Students find as many differentequivalent fractions as they can to express theprobability of drawing an insect.
KinestheticPartner Activity
Robot RoundupFor Extra Practice (Appropriate for use after Lesson 4)Materials: Robot Roundup (Master 11.10), pencilcrayons
The work students do: Students work alone. Theyimagine being in charge of a robot factory. Students listthe outcomes to figure out all the robots that couldpossibly be made from a given list of components:yellow or blue arms, green or purple wheels, and red,black, or grey bodies. They then draw and colour therobots. Students pick a component without looking, andcalculate the probability of creating a grey robot withblue arms and purple wheels.
Take It Further: Students add another component (forexample, a control panel in gold or silver) and figure outhow many different robots can now be produced.
Visual/SpatialIndividual
Additional Activities
Gr 5 Unit 11 FM WCP 02/24/2005 10:40 AM Page v

vi Unit 11: Probability
Planning for Unit 11
Planning for Instruction
Lesson Time Materials Program Support
Suggested Unit time: About 2 weeks
Gr 5 Unit 11 FM WCP 02/24/2005 10:40 AM Page vi
The right to reproduce or modify this page is restricted to purchasing schools. This page may have been modified from its original. Copyright © 2005 Pearson Education Canada Inc.
Unit 11: Probability vii
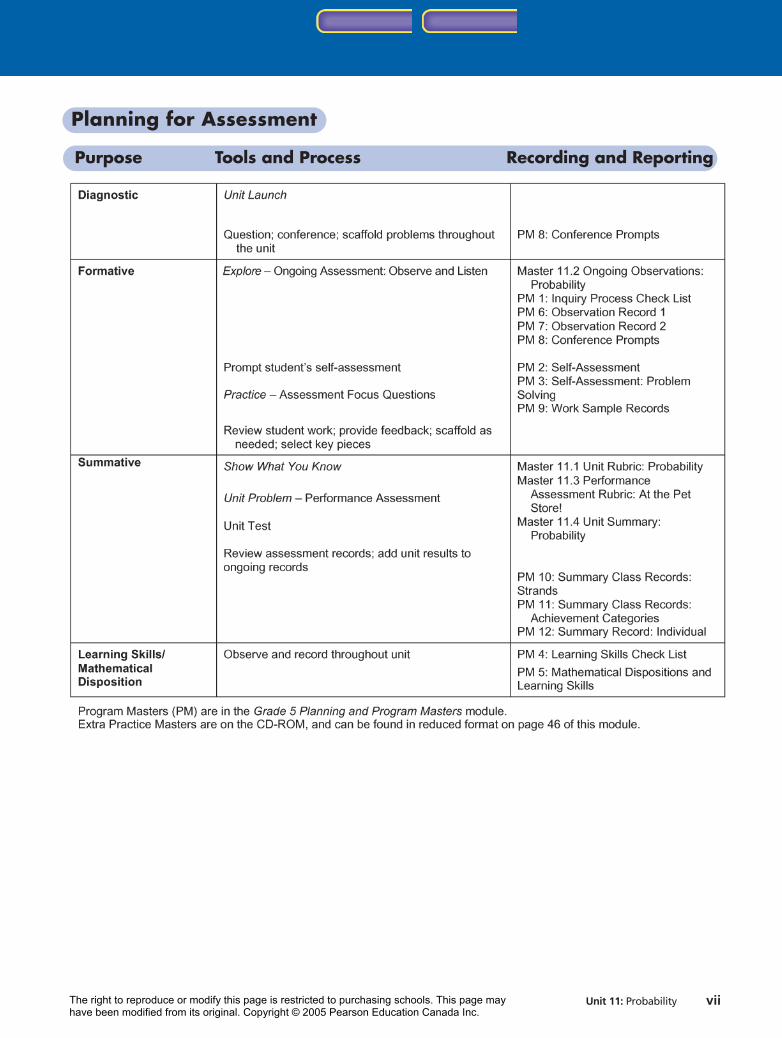
Purpose Tools and Process Recording and Reporting
Planning for Assessment
Gr 5 Unit 11 FM WCP 02/24/2005 10:40 AM Page vii
The right to reproduce or modify this page is restricted to purchasing schools. This page may have been modified from its original. Copyright © 2005 Pearson Education Canada Inc.
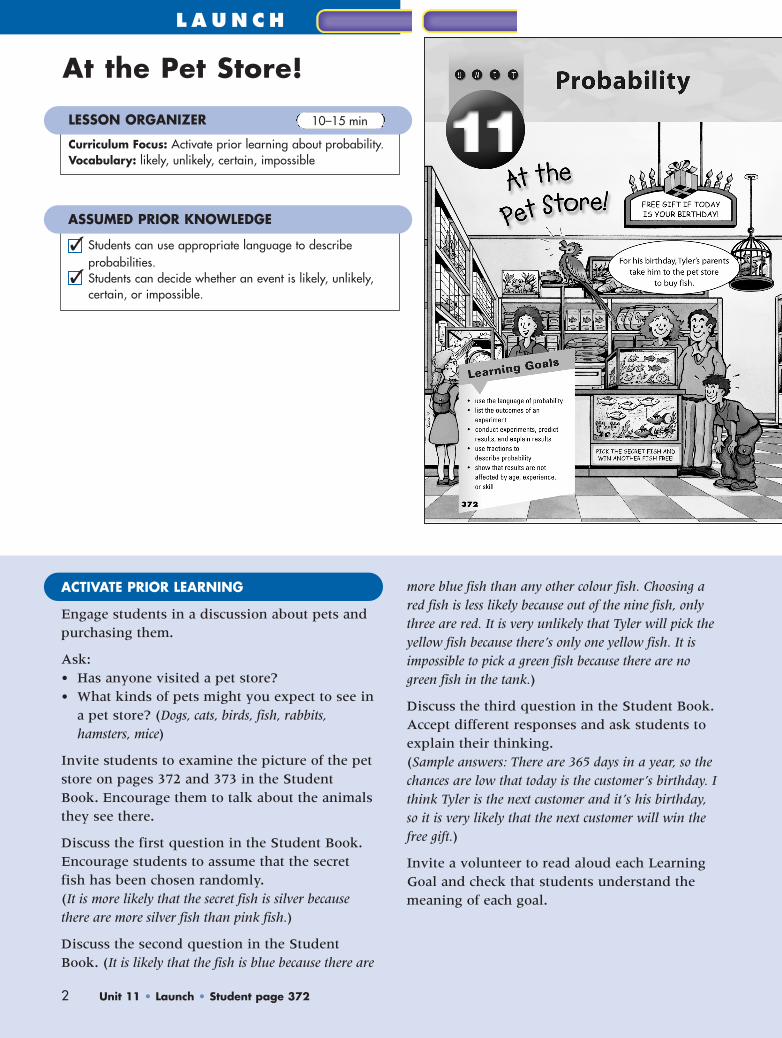
2 Unit 11 • Launch • Student page 372
At the Pet Store!
LESSON ORGANIZER
Curriculum Focus: Activate prior learning about probability.Vocabulary: likely, unlikely, certain, impossible
10–15 min
L A U N C H
ASSUMED PRIOR KNOWLEDGE
Students can use appropriate language to describeprobabilities.Students can decide whether an event is likely, unlikely,certain, or impossible.
�
�
ACTIVATE PRIOR LEARNING
Engage students in a discussion about pets andpurchasing them.
Ask:• Has anyone visited a pet store?• What kinds of pets might you expect to see in
a pet store? (Dogs, cats, birds, fish, rabbits,hamsters, mice)
Invite students to examine the picture of the petstore on pages 372 and 373 in the StudentBook. Encourage them to talk about the animalsthey see there.
Discuss the first question in the Student Book.Encourage students to assume that the secretfish has been chosen randomly.(It is more likely that the secret fish is silver becausethere are more silver fish than pink fish.)
Discuss the second question in the StudentBook. (It is likely that the fish is blue because there are
more blue fish than any other colour fish. Choosing ared fish is less likely because out of the nine fish, onlythree are red. It is very unlikely that Tyler will pick theyellow fish because there’s only one yellow fish. It isimpossible to pick a green fish because there are nogreen fish in the tank.)
Discuss the third question in the Student Book.Accept different responses and ask students toexplain their thinking.(Sample answers: There are 365 days in a year, so thechances are low that today is the customer’s birthday. Ithink Tyler is the next customer and it’s his birthday,so it is very likely that the next customer will win thefree gift.)
Invite a volunteer to read aloud each LearningGoal and check that students understand themeaning of each goal.
Gr 5 Unit 11 Launch WCP 02/24/2005 10:40 AM Page 2

LITERATURE CONNECTIONS FOR THE UNIT
The Number Devil: A Mathematical Adventure by Hans MagnusEnzenberger. New York: Henry Holt and Company, 1997.ISBN 0805062998In his dreams, 12-year-old Robert meets the “number devil” whoteaches him what math is all about. Chapter eight of thischallenging and thought-provoking book deals with findingpossible arrangements (permutations) of a row of children.
DIAGNOSTIC ASSESSMENT
What to Look For
✔ Students can useappropriatelanguageto describeprobabilities.
✔ Students can decidewhether an event islikely, unlikely,certain, orimpossible.
What to Do
Extra Support:
Students who are unable to use appropriate vocabulary to describe probabilities maybenefit from a review of the terms “likely,” “unlikely,” “impossible,” and “certain.”Work on this skill during Lesson 1.
Students who have difficulty predicting the probability of an outcome may benefitfrom a more direct approach. For example, have students roll a number cube, andlist the possible outcomes. Then, discuss the likelihood of each outcome.Work on this skill throughout the unit.
Unit 11 • Launch • Student page 373 3
Some students may benefit from using the virtualmanipulatives on the e-Tools CD-ROM. The
e-Tools appropriate for this unit include Probability.
REACHING ALL LEARNERS
Gr 5 Unit 11 Launch WCP 02/24/2005 10:40 AM Page 3
4 Unit 11 • Lesson 1 • Student page 374
The Likelihood ofEvents
L E S S O N 1
LESSON ORGANIZER
Curriculum Focus: Use the language of probability todescribe events. (SP10)Teacher Materials Optional� coloured tiles � weather forecast from a � paper bag newspaperStudent Materials Optional� copies of class list � coloured tiles� paper bags � Step-by-Step 1 (Master 11.11)� scissors � Extra Practice 1 (Master 11.17)� coloured pencils � Blank Spinners (Master 11.6)Vocabulary: outcome, impossible, certain, likely, unlikely,likelihood, probable, improbableAssessment: Master 11.2 Ongoing Observations: Probability
40–50 min
Key Math Learnings1. An outcome is unlikely or improbable when it occurs in
only a small number of the total possible outcomes, andlikely or probable when it occurs in most of the totalpossible outcomes.
2. An outcome is certain when it is the only possible outcome andimpossible when it is not included in the possible outcomes.
BEFORE Get S tar ted
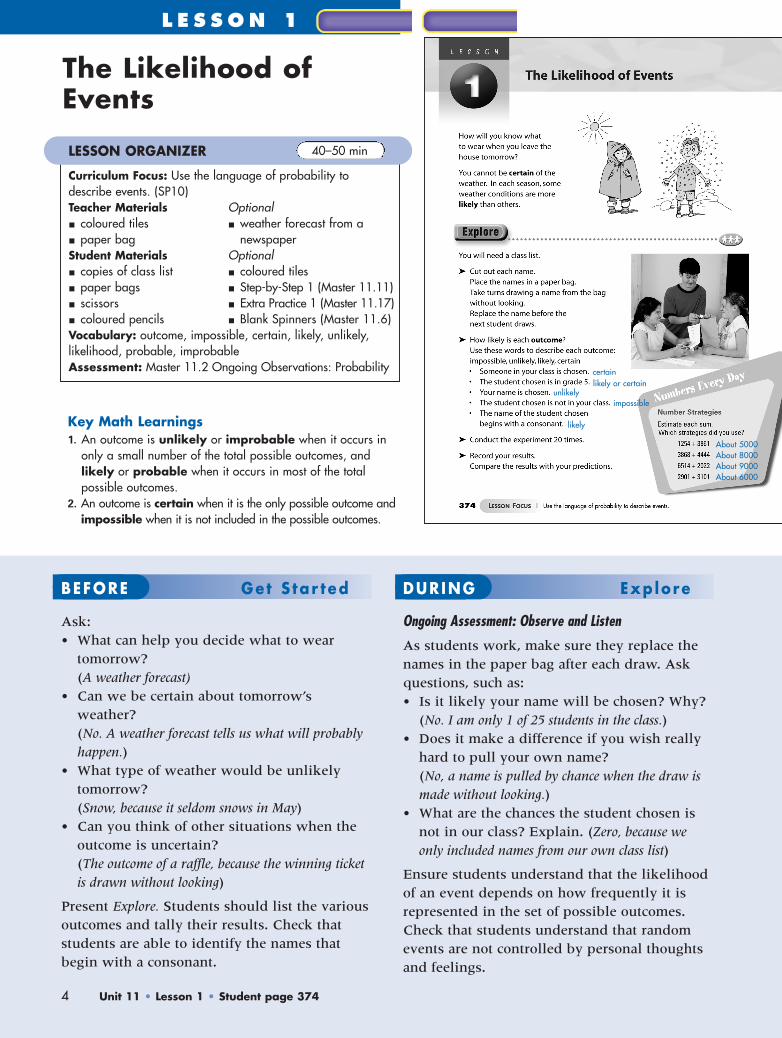
Ask:• What can help you decide what to wear
tomorrow? (A weather forecast)
• Can we be certain about tomorrow’sweather? (No. A weather forecast tells us what will probablyhappen.)
• What type of weather would be unlikelytomorrow?(Snow, because it seldom snows in May)
• Can you think of other situations when theoutcome is uncertain?(The outcome of a raffle, because the winning ticketis drawn without looking)
Present Explore. Students should list the variousoutcomes and tally their results. Check thatstudents are able to identify the names thatbegin with a consonant.
DURING Exp lore
Ongoing Assessment: Observe and Listen
As students work, make sure they replace thenames in the paper bag after each draw. Askquestions, such as:• Is it likely your name will be chosen? Why?
(No. I am only 1 of 25 students in the class.)• Does it make a difference if you wish really
hard to pull your own name?(No, a name is pulled by chance when the draw ismade without looking.)
• What are the chances the student chosen isnot in our class? Explain. (Zero, because weonly included names from our own class list)
Ensure students understand that the likelihoodof an event depends on how frequently it isrepresented in the set of possible outcomes.Check that students understand that randomevents are not controlled by personal thoughtsand feelings.
About 5000About 8000About 9000About 6000
likely
certainlikely or certain
unlikelyimpossible
Gr 5 Unit 11 Lesson WCP 03/02/2005 9:34 AM Page 4

Unit 11 • Lesson 1 • Student page 375 5
AFTER Connec t
Invite volunteers to share their descriptionsand the results of the experiments. Introduceprobable and improbable as synonyms forlikely and unlikely.
Ask questions, such as:• Did the results of your 20 draws match your
descriptions of the likelihood of eachoutcome? (Yes. The impossible outcome was neverpulled. The certain outcome happened every time.)
• How often did you pull a name that startedwith a consonant? (16 times out of 20. It was alikely outcome, because more than half of thestudents have a name that starts with a consonant.)
Discuss and model the situation in Connect. Ask:• Is it possible that Marius will draw a blue
tile? (Yes. It is possible, but unlikely, because only 1 of 7 tiles is blue.)
• Which outcomes are equally likely?(Drawing a blue tile or a yellow tile)
Ask a student volunteer to draw and replace atile 20 times while another student records theresults on the board. Compare the results withstudent predictions. Ensure students understandthat probability predictions are estimates thatare not expected to match actual results exactly.
Prac t i ceHave blank spinners and coloured pencilsavailable for question 6.
Assessment Focus: Question 6
Students should understand that if an outcomeis more likely than another, the sector for thatoutcome is bigger than the others. If theoutcomes are equally likely, then the 2 sectorsare the same size. If an outcome is certain, thenthe sector for that outcome covers the entirespinner. A colour can be separated into non-adjacent sectors provided the total area for thecolour meets the criteria.
Alternative ExploreMaterials: paper bag containing a collection of differentcoloured square tilesHave students perform the experiment in Explore but describethe likelihood of drawing each colour.
Early FinishersHave students test the spinners they designed for question 6.They should tally the results of 20 spins and compare them to theexpected probabilities.
Common Misconceptions➤Some students may feel they have a “lucky” number or colour
that is more likely to be chosen.How to Help: Encourage students to discuss the concept ofchance. Remind them that events are not controlled by thoughtsor feelings.
ESL StrategiesIllustrate a poster with tiles in a bag similar to the situation inConnect. Next to a single tile of each colour, print theappropriate probability statement: This outcome is likely. This outcome is unlikely, and so on.
REACHING ALL LEARNERS
Numbers Every DayStudents may round to either the nearest 1000, or the nearest 100to estimate. Students may also choose to use front-end addition.
The sun will rise.Pigs will fly.
Gr 5 Unit 11 Lesson WCP 03/02/2005 9:34 AM Page 5

Sample Answers1. a) Someone in our class has a birthday today.
b) I will fly to Brazil tomorrow.c) Spring will follow winter.d) A dog will turn into a tree.e) I will ride the schoolbus to school.f) I will grow 5 inches overnight.
3. a) Unlikelyb) Likelyc) Likely or unlikely, depending on the seasond) Likely or unlikely, depending on the teame) Likely or unlikely, depending on class routines
5. Rebecca is more likely to win, because there are more odd-numbered sections than even-numbered sections on thespinner.
6. Students should design spinners that meet these criteria:a) Yellow has the largest sector, followed by red, then blue.b) Yellow has the largest sector. Green and blue have equal-
sized sectors that are smaller than yellow.c) The spinner is completely yellow.
REFLECT: An impossible event will never happen. An unlikelyevent could happen, but it probably won’t. For example, it isimpossible that a guinea pig will become the next PrimeMinister. It is unlikely that my teacher will become the nextPrime Minister.
6 Unit 11 • Lesson 1 • Student page 376
ASSESSMENT FOR LEARNING
What to Look For
Reasoning; Applying concepts ✔ Students understand that the
likelihood of an outcome depends onits representation in the set of allpossible outcomes.
Communicating✔ Students can describe events as likely,
unlikely, probable, improbable,impossible, and certain.
What to Do
Extra Support: Students may benefit from the AdditionalActivity, Match My Meaning! (Master 11.7).Students can use Step-by-Step 1 (Master 11.11) to completequestion 6.
Extra Practice: Have students use probability vocabulary todescribe events in the school day. (We are likely to play outdoorsat lunch time today. We are unlikely to have a fire drill.)Students can complete Extra Practice 1 (Master 11.17).
Extension: Have students use words such as “highly likely” and“extremely unlikely” to describe probability more precisely.
Recording and ReportingMaster 11.2 Ongoing Observations:Probability
c, a, e, d, b
Gr 5 Unit 11 Lesson WCP 03/02/2005 9:34 AM Page 6

Unit 11 • Lesson 2 • Student page 377 7
L E S S O N 2
Conducting Experiments
Key Math Learnings1. The probability of an event is the number of times an
outcome favourable to the event occurs, divided by the totalnumber of possible outcomes.
2. A table or organized list helps us find all possible outcomes.
LESSON ORGANIZER
Curriculum Focus: Predict, then find, the probability ofoutcomes. (SP9, SP11)Teacher Materials Optional
� overhead transparency oftwo-column chart (PM 17)
Student Materials Optional� number cubes � coins� 1-cm grid paper (PM 23) � Step-by-Step 2 (Master 11.12)� 2-column charts (PM 17) � Extra Practice 1 (Master 11.17)� blank spinners (Master 11.6)Vocabulary: probability, results, outcomes, predicting, fair game, equally likelyAssessment: Master 11.2 Ongoing Observations: Probability
40–50 min
BEFORE Get S tar ted
Discuss games of chance that use numbercubes. Ask:• Are some numbers easier to roll than others
on a single number cube?(No, every number is equally likely.)
• What are the possible even sums when twonumber cubes are rolled? (2, 4, 6, 8, 10, 12)
• What are the possible odd sums when twonumber cubes are rolled? (3, 5, 7, 9, 11)
• What are the different ways you could get asum of 4? (Roll a 1 on the first cube and a 3 onthe second cube; a 3 on the first cube and a 1 on thesecond cube; a 2 on both cubes.)
Present Explore. Ask volunteers to read aloudthe rules for the Sum Fun game. Show studentshow to record their tosses using tally marks ona two-column chart. Make sure theyunderstand that players receive one point foreach winning toss.
DURING Exp lore
Ongoing Assessment: Observe and Listen
As students play the game, make sure they arerecording their results. Ask:• Who is winning your game? Can you
explain why? (Carla. It’s just by chance.)• Who do you think will have more points
after 36 turns? (It’s hard to say. The chances seemto be equal.)
• Is this game fair? (Yes, because an even sum andan odd sum are equally likely outcomes.)
AFTER Connec t
Invite volunteers to share the results of theirgames. Ask students to share their strategies forfiguring out all possible outcomes.
71710710071 000
2, 3, 4, 5, 6, 7, 8, 9, 10, 11, 12
Numbers Every DayThe first factor and product are both 10 times larger than theprevious one. Multiplying by 100 shifts each digit 2 places to theleft. So, the decimal point moves 2 places to the right.
Gr 5 Unit 11 Lesson WCP 03/02/2005 9:34 AM Page 7

Sample Answers1.
Ask questions, such as:• How did you know for sure that the game
was fair? (We listed all the ways to get an evensum and all the ways to get an odd sum. Both listshad 18 ways.)
• Is there another way you could keep track ofall the possible outcomes?(Yes. We could make a table of all the differentoutcomes.)
Present Connect. Ensure students understandthat this game is based on the products of thenumbers rolled. Direct students’ attention tothe table on page 378. Ask:• In how many ways can you get an even
product? (You can get an even product in 27 ways.)• In how many ways can you get an odd
product? (You can get an odd product in 9 ways.)• What is the probability of getting an even
product? (The probability of getting an evenproduct is 27 out of 36, or �
2376�.)
• What is the probability of getting an oddproduct? (The probability of getting an oddproduct is 9 out of 36, or �
396�.)
Prac t i ce
Question 1 requires grid paper. Question 4 requires blank spinners. For Question 1, have students make and addition table similarto the multiplication table in Connect.
Assessment Focus: Question 4
Students should understand that for Vicki to bemore likely to win, the spinners must providemore ways of landing on the same colour. ForAlistair to be more likely to win, the spinnersmust provide more ways of landing on differentcolours. The game will be fair if the spinnersprovide equal chances of landing on the samecolour and landing on different colours.
8 Unit 11 • Lesson 2 • Student page 378
Early FinishersHave students play the game described in Practice question 3.They should compare their actual results with predicted results.
Common Misconceptions➤Some students may not recognize that tossing 3 on the first
number cube and 4 on the second is a different outcome thantossing 4 on the first and 3 on the second.
How to Help: Use two different coloured number cubes todistinguish the different outcomes, and list the outcomes in a table.
➤Students think they are more likely to get an even sum than anodd sum when rolling 2 number cubes, because there are 6possible outcomes for an even sum, and only 5 for an odd sum.
How to Help: Explain to students that they must look for thedifferent ways of getting the outcome. Draw a table listing all thepossible sums when rolling 2 number cubes, and point out thatthere are 18 ways to roll an even sum, and 18 ways to roll anodd sum, so the likelihood of rolling an even or odd sum isequally likely.
REACHING ALL LEARNERS
�316�
�316� �
336�
�366�
Alexis
+123456
1234567
2345678
3456789
456789
10
56789
1011
6789
101112
Gr 5 Unit 11 Lesson WCP 03/02/2005 9:34 AM Page 8

3. a) Heads, heads; heads, tails; tails, heads; tails, tailsb) It is impossible to predict who will win, because Bob and
Dave have equal chances of winning.c) This is a fair game, because there are two ways to have the
same outcomes (heads, heads; tails, tails) and two ways tohave different outcomes (heads, tails; tails, heads).
4. a) Both spinners are �34
� green and �14
� red.
b) Both spinners are �14
� green, �14
� red, �14
� blue, and �14
� yellow.
c) Both spinners are �12
� red and �12
� blue.
5. Roll two number cubes labelled 1 to 6. Player A gets a point ifthe product of the two numbers is less than 10. Player B gets apoint if the product is more than 10. Both players get a pointif the product is 10. The player who reaches 20 first is thewinner. The game is fair, because the chance of the productbeing less than 10 is equal to the chance of the product beingmore than 10.
REFLECT: When two outcomes are equally likely, they have thesame chances of happening. For example, if you flip a coin,you are equally likely to get heads or tails.
Unit 11 • Lesson 2 • Student page 379 9
ASSESSMENT FOR LEARNING
What to Look For
Reasoning; Applying concepts ✔ Students understand that probability
predictions are based on analyzingall possible outcomes.
✔ Students understand that a fair gameis one where each player is equallylikely to win.
Accuracy of procedures✔ Students can use an organized list or
table to figure out all possibleoutcomes.
What to Do
Extra Support: Students can use Step-by-Step 2 (Master 11.12)to complete question 4.
Extra Practice: Have students list all the possible outcomes ofdrawing 2 coloured tiles from a bag holding one each of red,blue, green, and yellow tiles. What is the probability that thedraw will include a red tile?Students can do Extra Practice 1 (Master 11.17).
Extension: Students may benefit from the Additional Activity,Animal Draw (Master 11.8).
Recording and ReportingMaster 11.2 Ongoing Observations:Probability
�326�
�336�
0�346�
�316�
Making ConnectionsMath Link: A meteorologist uses previous weather records tofind patterns of behaviour in weather systems. These patternsenable her to predict the likelihood of future events such as ahurricane passing through an area.
Gr 5 Unit 11 Lesson WCP 03/02/2005 9:34 AM Page 9

10 Unit 11 • Lesson 3 • Student page 380
Probability andFractions
Key Math Learnings1. A fraction can be used to describe the probability of an event.2. A fraction displays the ratio of desired outcomes to all
possible outcomes.
LESSON ORGANIZER
Curriculum Focus: Interpret probabilities expressed asfractions. (SP10, SP11, N8)Teacher Materials Optional
� coloured cubes� paper bag
Student Materials Optional� 1-cm grid paper (PM 23) � Colour Tiles� coloured pencils � coins� coloured cubes � decahedron� paper bags � Blank Spinners (Master 11.6)� Pattern Blocks (PM 28) � Step-by-Step 3 (Master 11.13)
� Extra Practice 2 (Master 11.18)Vocabulary: probability, fractions, sectors, congruent,decahedronAssessment: Master 11.2 Ongoing Observations: Probability
40–50 min
L E S S O N 3
A fraction can be interpreted as a ratio. For example,�23
� means in the ratio 2 to 3.
Math Note
BEFORE Get S tar ted
Invite a volunteer to read the introduction onStudent Book page 380. Elicit that becausethere are 6 equal sectors, each sector is �
16
� of thewhole spinner. Ask:• What is the probability that the spinner will
land on a colour that is not yellow?(4 out of 6, or �
46
�)• What is another way to state the probability
of landing on blue? (�12
�)
Discuss the size of the game board in Explore.To match the given fractions, its area should bea multiple of 8. Side lengths of 8 cm or 16 cmare suitable.
DURING Exp lore
Ongoing Assessment: Observe and Listen
Make sure students understand the fractionalprobability for each colour must be matched bythat colour’s area on the board. Ask:
• How do you know the probability of landingon a red square is �
18
�?(My board has 64 squares, and I coloured 8 of themred. �
18
� of 64 is 8.)• How many squares will you colour yellow?
(4, because �116� of 64 is 4.)
• How many squares will you colour withyour fourth colour? (12)
Watch to see that students understand theprobability of landing on a colour is related tothe fraction of the whole board covered by that colour.
�136�
Gr 5 Unit 11 Lesson WCP 03/02/2005 9:35 AM Page 10

Unit 11 • Lesson 3 • Student page 381 11
AFTER Connec t
Display students’ game boards and ask them tocompare the designs. Have them check that theboards meet the criteria for probabilities givenin Explore.
Discuss and model the situation in Connect.Make sure students understand that many trialsare needed for the number of predictedoutcomes and the number of actual outcomes tobe close. Ask:• What does it mean to say that the probability
of drawing a blue cube is �25
�?(If I did 50 draws, I would probably pull the bluecube about 20 times.)
• If we did 5 draws, would we pull the bluecube 2 times?(We might, but it is not likely. We would need more trials.)
Prac t i ce
In question 4, you may need to remindstudents that the digit 1 is in the number 10.
Have Pattern Blocks available for question 5.
Assessment Focus: Question 2
Students should understand• The total of the two fractions (for heads and
tails) is one.• The actual results are close to the
probabilities based on fractions: �12
� are headsand �
12
� are tails.• Probability predictions are estimates. The
greater the number of trials, the closer theactual results will be to the predicted results.
Alternative ExploreMaterials: thumb tacks, plastic cupsProvide each pair of students with 10 thumb tacks and a plasticcup. Students should shake up and spill the tacks from the cup.They should record the fraction of all tacks landing point-down.Students should repeat the experiment 10 times. Based on theirexperimental results, students should use a fraction to give anestimated probability for a tack landing point-down in 50 trials.
Early FinishersHave students carry out the experiments described in Practicequestions 1, 2, 3, and 4. They should record their results andcompare them to those in the book.
Common Misconceptions➤Students may not understand that probabilities must be
between 0 (impossible) and 1 (certain).How to Help: Create a number line from 0 to 1. Label the endwith 0 “impossible” and the end with 1 “certain.” Ask studentsto place fractions such as �
12
�, �34
�, and �2107� on the line. Relate the
fractions to probability situations discussed in class.
REACHING ALL LEARNERS
Numbers Every DayStudents should estimate first to make sure their answers make sense.
13.02128.851287.15
�27
�
�47
�; �17
�
Gr 5 Unit 11 Lesson WCP 03/02/2005 9:35 AM Page 11

Sample Answers2. d) Yes. These results are what we would expect because 8 and
12 are both close to 10. �12
� of 20 is 10. Heads and tailsshould each show up about �
12
� of the time.e) I would expect the results to be closer to my predicted
results, because the number of trials is much greater. Iwould expect Dave to get about 50 heads and 50 tailsbecause heads and tails are equally likely outcomes. I knowhe probably wouldn’t get exactly 50 of each.
3. a) I counted the tally marks.d) Yes, because �
274� is close to �
264�, and �
264� is equivalent to �
14
�.One-fourth of the spinner is orange.
5. b) Students use Pattern Blocks or coloured pencils to create agame board that is �
14
� blue and �34
� yellow.
REFLECT: Fractions tell about probabilities that are betweenimpossible (0) and certain (1). The denominator tells howmany outcomes are possible. The numerator tells how many ofthe possible outcomes we want. For example, when we roll asingle number cube, there are 6 possible outcomes. There isone way to roll a 3. So, we say that the probability of rolling3 is 1 out of 6, or �
16
�.
12 Unit 11 • Lesson 3 • Student page 382
ASSESSMENT FOR LEARNING
What to Look For
Reasoning; Applying concepts✔ Students understand that fractions are
a way of stating probabilities.
Communicating✔ Students can describe particular
outcomes as fractions of the set of allpossible outcomes.
What to Do
Extra Support: Students may benefit from modelling question1 with Colour Tiles, question 2 with a coin, question 3 with aspinner, question 4 with a decahedron, and question 5 withPattern Blocks. They may need to be reminded that thedenominator of a fraction tells how many pieces are in the wholeobject or set.Students can use Step-by-Step 3 (Master 11.13) to completequestion 2.
Extra Practice: Students can do the Additional Activity, FoldYour Tents! (Master 11.9).Students can do Extra Practice 2 (Master 11.18).
Recording and ReportingMaster 11.2 Ongoing Observations:Probability
�150�, or �
12
�
8�2102�
�280�
�274�
1
24 times
�69
�, or �23
�
�1274�
Gr 5 Unit 11 Lesson WCP 03/02/2005 9:35 AM Page 12

Unit 11 • Lesson 4 • Student page 383 13
L E S S O N 4
Probability in Games
Key Math LearningA game of chance is fair when all players have an equalprobability of winning.
LESSON ORGANIZER
Curriculum Focus: Explore probability in games. (SP11, SP12)Teacher Materials� 2 number cubes� deck of playing cardsStudent Materials Optional� number cubes � Step-by-Step 4 (Master 11.14)� coins � Extra Practice 2 (Master 11.18)Vocabulary: fair, chance, predictionAssessment: Master 11.2 Ongoing Observations: Probability
40–50 min
BEFORE Get S tar ted
Hold up 2 number cubes. Elicit the idea that inmost games a player rolls both cubes and addsthe numbers to get points. Explain thatstudents will be playing a game in which 2 players each roll one cube and use thedifference rather than the sum to determinetheir points.
Present Explore. Have volunteers read aloud therules for What’s the Difference?
Ask:• Who do you think is likely to win this
game? (I think both players have an equal chance.The difference can be 0, 1, 2, 3, 4, or 5, and 3 is inthe middle. So, each player has �
36
�, or �12
� chances ofwinning.)
DURING Exp lore
Ongoing Assessment: Observe and Listen
As students work, make sure they are correctlyfiguring out their points. Ask questions, such as:
• Who has won the most rounds? Why do youthink that might be?(Emma has won nearly every round. I think theremight be more ways to get a difference of less than 3.)
• Is there a way you could figure out who hasthe best chances of winning?(I could make a chart of all the differences possiblewith 2 number cubes, and count how many of thosedifferences are less than 3, and how many are 3 or greater.)
AFTER Connec t
Invite students to share the results of theirgames.
Gr 5 Unit 11 Lesson WCP 03/02/2005 9:35 AM Page 13
14 Unit 11 • Lesson 4 • Student page 384
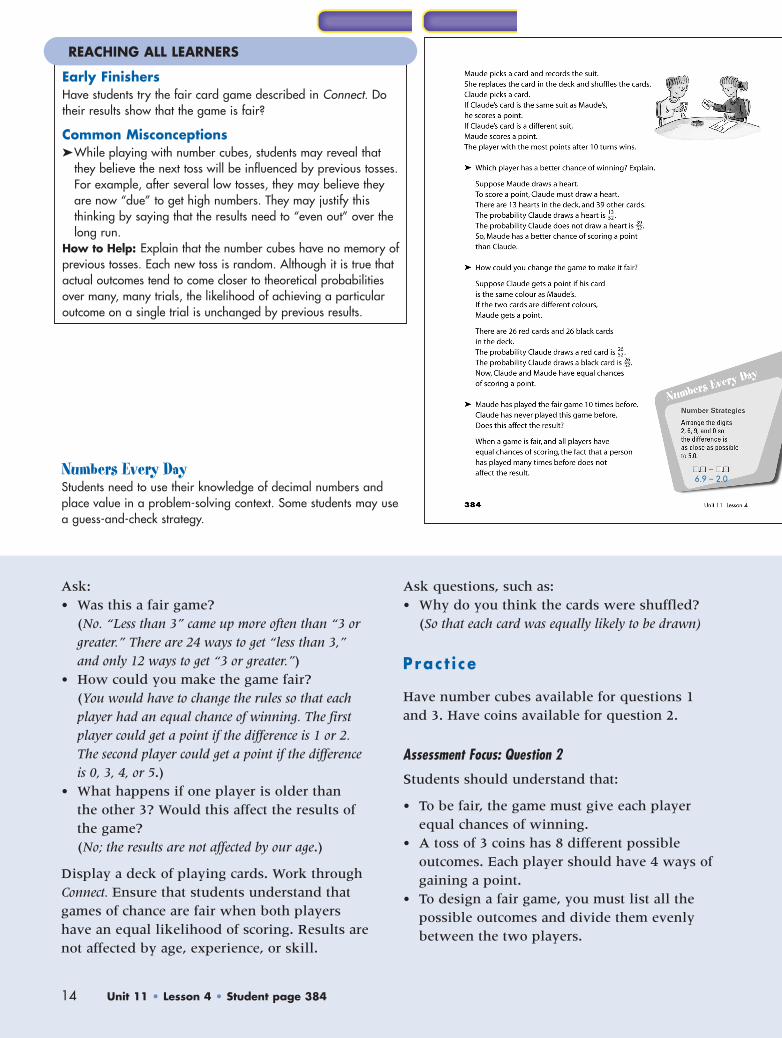
Ask:• Was this a fair game?
(No. “Less than 3” came up more often than “3 orgreater.” There are 24 ways to get “less than 3,”and only 12 ways to get “3 or greater.”)
• How could you make the game fair?(You would have to change the rules so that eachplayer had an equal chance of winning. The firstplayer could get a point if the difference is 1 or 2.The second player could get a point if the differenceis 0, 3, 4, or 5.)
• What happens if one player is older than the other 3? Would this affect the results ofthe game? (No; the results are not affected by our age.)
Display a deck of playing cards. Work throughConnect. Ensure that students understand thatgames of chance are fair when both playershave an equal likelihood of scoring. Results arenot affected by age, experience, or skill.
Ask questions, such as:• Why do you think the cards were shuffled?
(So that each card was equally likely to be drawn)
Prac t i ce
Have number cubes available for questions 1and 3. Have coins available for question 2.
Assessment Focus: Question 2
Students should understand that:
• To be fair, the game must give each playerequal chances of winning.
• A toss of 3 coins has 8 different possibleoutcomes. Each player should have 4 ways ofgaining a point.
• To design a fair game, you must list all thepossible outcomes and divide them evenlybetween the two players.
Early FinishersHave students try the fair card game described in Connect. Dotheir results show that the game is fair?
Common Misconceptions➤While playing with number cubes, students may reveal that
they believe the next toss will be influenced by previous tosses.For example, after several low tosses, they may believe theyare now “due” to get high numbers. They may justify thisthinking by saying that the results need to “even out” over thelong run.
How to Help: Explain that the number cubes have no memory ofprevious tosses. Each new toss is random. Although it is true thatactual outcomes tend to come closer to theoretical probabilitiesover many, many trials, the likelihood of achieving a particularoutcome on a single trial is unchanged by previous results.
REACHING ALL LEARNERS
Numbers Every DayStudents need to use their knowledge of decimal numbers andplace value in a problem-solving context. Some students may usea guess-and-check strategy.
6.9 – 2.0
Gr 5 Unit 11 Lesson WCP 03/02/2005 9:35 AM Page 14

Sample Answers1. Carla. There are 21 ways to make a fraction less than or
equal to 1, but only 15 ways to make a fraction greater than1. My results agreed with my prediction because we rolled afraction less than or equal to 1 more often.
2. a) Players take turns tossing 3 coins. Player A wins a point ifthere are 2 or more heads. Player B wins a point if thereare 2 or more tails.
b) This game is fair because there is a total of 8 possibleoutcomes: 4 ways for each player to win a point.
c) No; Jennifer’s age does not affect the outcome of the game.She won by chance.
3. The probability I will roll a double and lose my turn is �366�, or
�16
�. The probability I will score points is �3360�, or �
56
�. So, I wouldkeep rolling to get as many points as I can. I have a higherprobability of scoring a point than losing a turn.
REFLECT: The game of Monopoly involves strategy andprobability. You use strategy to decide which properties to buyand when to add houses and hotels. You depend on chancewhen you roll the number cube and move around the board.
Unit 11 • Lesson 4 • Student page 385 15
ASSESSMENT FOR LEARNING
What to Look For
Reasoning; Applying concepts ✔ Students understand that a fair game
offers both players equal chances ofwinning.
Accuracy of procedures✔ Students can use a list or table of
outcomes to identify all possibleoutcomes, and determine whichcombinations of outcomes are equally likely.
What to Do
Extra Support: Students may benefit from reviewing the chartsof number cube outcomes in Lesson 2.Students can use Step-by-Step 4 (Master 11.14) to completequestion 2.
Extra Practice: Students can invent fair games using 3 ormore number cubes.Students can do the Additional Activity, Robot Roundup(Master 11.10).Students can do Extra Practice 2 (Master 11.18).
Extension: Have students design a fair game for 3 playersusing 2 number cubes.
Recording and ReportingMaster 11.2 Ongoing Observations:Probability
Gr 5 Unit 11 Lesson WCP 03/02/2005 9:35 AM Page 15
16 Unit 11 • Lesson 5 • Student page 386
Strategies Toolkit
Key Math Learnings1. Using a model can help you solve a problem.2. A tree diagram is one way to find all the possible outcomes in
a compound event. Another way is to make an organized list.
LESSON ORGANIZER
Curriculum Focus: Interpret a problem and select anappropriate strategy. (N8, SP9, SP3)Teacher Materials Optional
� green, red, blue, and yellowsheets of paper
� photos or student drawingsof basketball, volleyball,cross-country, and track-and-field athletes
Student Materials Optional� cards numbered 1, 2, and 3
Vocabulary: tree diagramAssessment: PM 1 Inquiry Process Check List,PM 3 Self-Assessment: Problem Solving
40–50 min
L E S S O N 5
BEFORE Get S tar ted
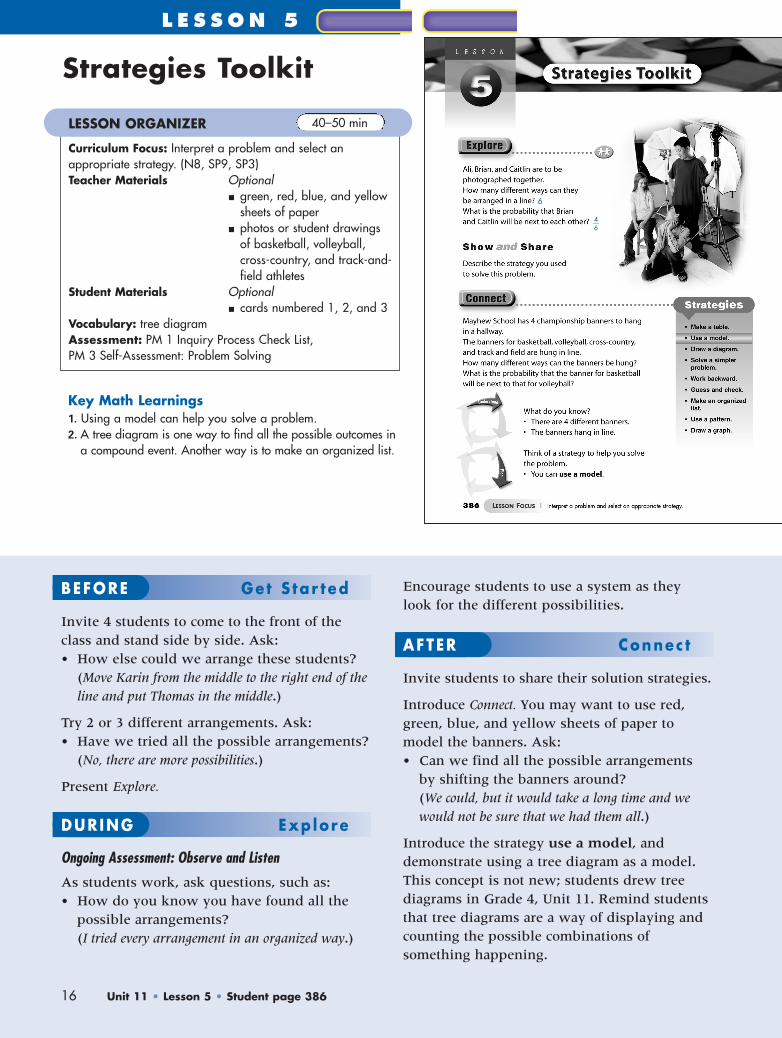
Invite 4 students to come to the front of theclass and stand side by side. Ask:• How else could we arrange these students?
(Move Karin from the middle to the right end of theline and put Thomas in the middle.)
Try 2 or 3 different arrangements. Ask:• Have we tried all the possible arrangements?
(No, there are more possibilities.)
Present Explore.
DURING Exp lore
Ongoing Assessment: Observe and Listen
As students work, ask questions, such as:• How do you know you have found all the
possible arrangements?(I tried every arrangement in an organized way.)
Encourage students to use a system as theylook for the different possibilities.
AFTER Connec t
Invite students to share their solution strategies.
Introduce Connect. You may want to use red,green, blue, and yellow sheets of paper tomodel the banners. Ask:• Can we find all the possible arrangements
by shifting the banners around?(We could, but it would take a long time and wewould not be sure that we had them all.)
Introduce the strategy use a model, anddemonstrate using a tree diagram as a model. This concept is not new; students drew treediagrams in Grade 4, Unit 11. Remind studentsthat tree diagrams are a way of displaying andcounting the possible combinations ofsomething happening.
6
�46
�
Gr 5 Unit 11 Lesson WCP 03/02/2005 9:35 AM Page 16
REFLECT: Using a model helps me keep my ideas organized. I can see what possibilities I have already considered and addother possibilities to them. The model lets me check that I havenot left anything out or used anything more than once.
Unit 11 • Lesson 5 • Student page 387 17
ASSESSMENT FOR LEARNING
What to Look For
Problem solving✔ Students can select an appropriate
strategy for solving a problem.✔ Students can justify their solutions.
Communicating✔ Students can describe their strategy
clearly, using appropriate language.
What to Do
Extra Support: Students could use numbered cards to modelthe situation in question 2.
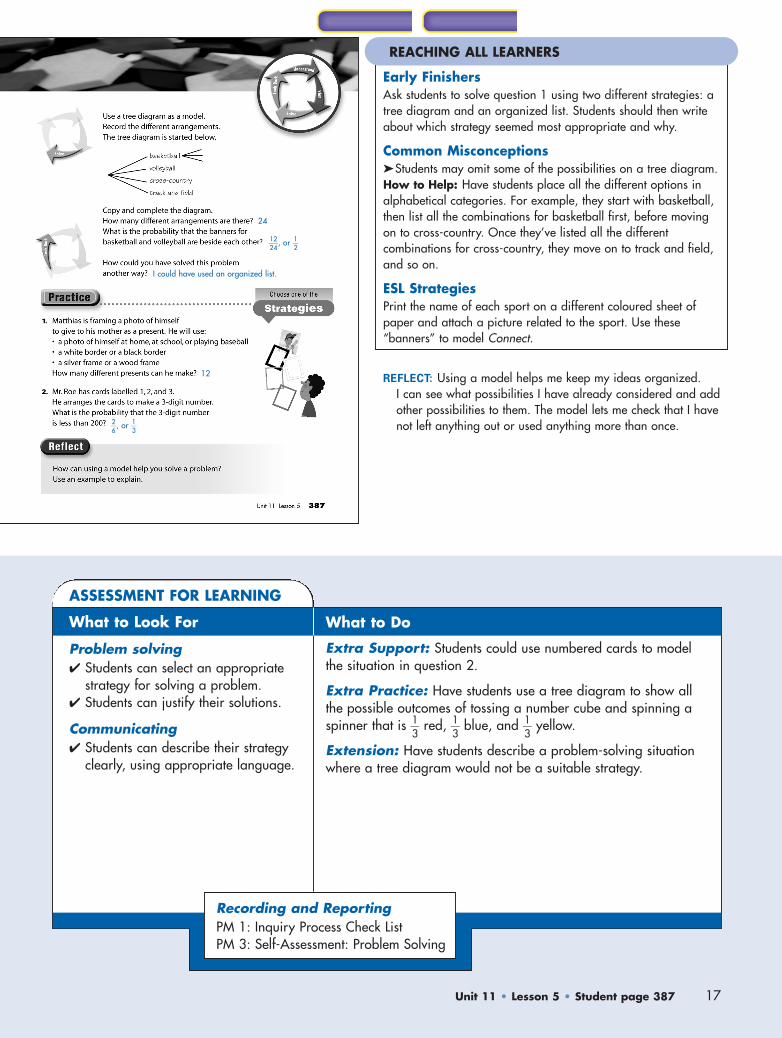
Extra Practice: Have students use a tree diagram to show allthe possible outcomes of tossing a number cube and spinning aspinner that is �
13
� red, �13
� blue, and �13
� yellow.
Extension: Have students describe a problem-solving situationwhere a tree diagram would not be a suitable strategy.
Recording and ReportingPM 1: Inquiry Process Check ListPM 3: Self-Assessment: Problem Solving
Early FinishersAsk students to solve question 1 using two different strategies: atree diagram and an organized list. Students should then writeabout which strategy seemed most appropriate and why.
Common Misconceptions➤Students may omit some of the possibilities on a tree diagram.How to Help: Have students place all the different options inalphabetical categories. For example, they start with basketball,then list all the combinations for basketball first, before movingon to cross-country. Once they’ve listed all the differentcombinations for cross-country, they move on to track and field,and so on.
ESL StrategiesPrint the name of each sport on a different coloured sheet ofpaper and attach a picture related to the sport. Use these“banners” to model Connect.
REACHING ALL LEARNERS
�2142�, or �
12
�
�26
�, or �13
�
I could have used an organized list.
24
12
Gr 5 Unit 11 Lesson WCP 03/02/2005 9:35 AM Page 17

Sample Answers2. b, a, d, c3.
5. c) The results are different from what I would expect. It isunlikely Troy would roll 6 so many times. It is alsounlikely he would roll the other numbers exactly 5times each. The probability of being rolled is �
16
� foreach number. So, in 36 rolls, each number willprobably be rolled about 6 times.
6. a) I know the probability of rolling a double is �366�, or �
16
�,because there are 6 ways to roll a double and 36 possible outcomes altogether.
b) Experience does not affect the probability of rolling a double.
c) Age does not affect the probability of rolling a double.
18 Unit 11 • Show What You Know • Student page 388
LESSON ORGANIZER
Student Materials Optional� cards with each letter of the
word MATHEMATICS writtenon a card
� 2 number cubes� deck of playing cards
Assessment: Masters 11.1 Unit Rubric: Probability, 11.4 Unit Summary: Probability
40–50 min
S H O W W H AT Y O U K N O W
M, A, or T
�13
�
�12
�
�1532�
�316�
�16
�
�326�
�1306�
�2326�
�5226�, or �
12
�
�542�, or �
113�
�512�
123456
1123456
22468
1012
3369
121518
448
12162024
55
1015202530
66
1218243036
123456
1 2 3 4 5 61st2nd
✔
✔
✔
✔
✔
✔
M, A, T, H, E, I, C, S
H, E, I, C, or SM, A, T: �
121�; H, E, I, C, S: �
111�
�
Gr 5 Unit 11 Lesson WCP 03/02/2005 9:35 AM Page 18

Unit 11 • Show What You Know • Student page 389 19
ASSESSMENT FOR LEARNING
What to Look For
Reasoning; Applying concepts✔ Questions 2 and 6: Student can predict probability in simple experiments and use fractions to describe
probability.
Accuracy of procedures✔ Questions 3 and 6: Student can use a table or organized list to solve a probability problem.
Communication✔ Questions 4, 5, and 6: Student can connect real-life statements with probability concepts.
Problem solving✔ Questions 1, 3, 4, and 5: Student can use a knowledge of probability to solve simple problems.
Recording and ReportingMaster 11.1 Unit Rubric: ProbabilityMaster 11.4 Unit Summary: Probability
�356�
�2316�
No
No
�366�, or �
16
�
Gr 5 Unit 11 Lesson WCP 03/02/2005 9:35 AM Page 19

Sample ResponseStudent work should include specific answers and explanations usingwords, numbers, and pictures where appropriate. For example:
Part 1
We think there are 20 red fish in the tank. �25
� of 50 is 20. Wethink there are 5 silver fish. �
110� of 50 is 5. If you subtract the silver
and red fish, you have 25 fish left. The chances of picking one ofthe remaining orange, blue, black, white, and pink fish are equal,so there must be 5 of each of those colours in the tank.
20 Unit 11 • Unit Problem • Student page 390
At the Pet Store!
LESSON ORGANIZER
Student Grouping: Groups of 2Student Materials� Snap Cubes� paper bags� Bristol board� coloured markersAssessment: Masters 11.3 Performance Assessment Rubric:At the Pet Store!, 11.4 Unit Summary: Probability
40–50 min
U N I T P R O B L E M
Have students turn to the Unit Launch on pages372 and 373 of the Student Book.
Review the Learning Goals of the unit anddiscuss the meanings of the Key Words. Tellstudents they will use these skills and conceptsas they complete the Unit Problem.
Have Snap Cubes, paper bags, and Bristolboard available.
Present the Unit Problem. Invite volunteers toread the guidelines and instructions for theproblem aloud. Ensure students understandwhat they are expected to do in each of the threeparts. Tell students where you would like themto record their responses to Part 1 and Part 2.Remind students that the poster for Part 3 needsto include clear explanations of their procedures.
Have one student read the Check List aloud.Ask volunteers to explain each of the criteria.Ensure students are aware of the need toexplain their thinking in all their responses.Remind students that they should use theCheck List to assess their work before theyhand it in. You may also wish to providestudents with copies of Master 11.3Performance Assessment Rubric: At the PetStore! to show how their work will be assessed.
Set a reasonable time for the completion of thetasks. Allow 15 min for Parts 1 and 2, and about20 min for Part 3. Encourage students tocomplete the written components of Part 3 beforethey begin their illustrations of the fish tank.
Teaching notes for the Cross Strand Investigation: The Domino Effectappear in the Grade 5 Additional Assessment Support module.
Gr 5 Unit 11 Lesson WCP 03/02/2005 9:35 AM Page 20

Part 2
We put 4 yellow cubes, 4 blue cubes, and 12 red cubes in thebag. There should be the same number of blue and yellowbecause the probability of picking these colours is the same. Therehad to be more red cubes because the probability of picking redis greater. Altogether, we drew 20 times. Our results were: Yellow – 3; Blue – 4; Red – 13These results are close to the stated probabilities. We don’t expectthe actual results to be exactly the same as the probabilities butthey are close.
Part 3
We decided to have 30 fish in our tank. We chose 3 types of fish:red, green, and yellow. We wanted the probability of picking a redfish to be �
12
�. This is the same as 15 out of 30, so we put 15 red fishin the tank. We wanted the probability of picking a green fish to be�15
�. This is the same as 6 out of 30 so we put 6 green fish in the tank.We now had 21 fish in the tank, so we knew there needed to be 9 yellow fish to make the total add up to 30. The probability ofpicking a yellow fish is 9 out of 30. We could write this as �
390� or �
130�.
Reflect on the Unit When events happen by chance, I need to figure out all thepossible outcomes. Then, I decide what fraction of the possibleoutcomes matches the outcome I am looking for. For example, if I have a bag with 10 red marbles and 5 blue marbles, there are15 marbles altogether. The probability I will pick a red marble is�11
50� and the probability I will pick a blue marble is �
155�. The
probability I will pick a yellow marble is zero; it’s impossible topick a yellow marble when there are none in the bag!
Unit 11 • Unit Problem • Student page 391 21
ASSESSMENT FOR LEARNING
What to Look For
Reasoning; Applying concepts ✔ Students understand that the
probability of an event depends onhow often it is represented in the set ofall possible outcomes.
✔ Students use fractions to describeprobability.
Accuracy of procedures✔ Students use tables and diagrams to
determine and record probability.
Communicating✔ Students use language effectively to
describe probability and explain theirreasoning.
What to Do
Extra Support: Make the problem accessible. Suggest thatstudents start Part 1 with the simpler problem of a tankcontaining 10 fish. Encourage the use of Snap Cubes or othermanipulatives to model the problem.Some students may have difficulty explaining their thinking inwriting. Assess these students verbally. Are they able tocommunicate their ideas orally, using appropriate mathematicallanguage?
Recording and ReportingMaster 11.3 Performance Assessment Rubric: At the Pet Store!Master 11.4 Unit Summary: Probability
Gr 5 Unit 11 Lesson WCP 03/02/2005 9:35 AM Page 21

Cumulative Review
22 Unit 11 • Cumulative Review • Student page 394
LESSON ORGANIZER
Student Materials� calculators� 1-cm grid paper (PM 23)� square dot paper (PM 25)
U N I T S 1 - 1 1
Sample Answers1. a) Input: 87, 84, 81
Output: 29, 28, 27b) Input � 3 = Output
4. No, because it does not have all angles equal (unless itis a square).
5. a) No sides are equal.b) 2 sides are equal.c) 2 sides are equal.
8. I chose a bargraph, becausethe differences inthe data areeasier to see.
11. Monique should have gotten $8.71 in change. She got $8.81 in change, which is 10¢ too much.
12. a)
b)
c)
Canadia
n V
isitors
(th
ousands)
800
700
600
500
400
300
200
100
Country
Canadian Visitors to Other Countries
2002
Aust
ralia
Chin
a
Cuba
Fra
nce
Germ
any
Mexi
coU
nite
d
Kin
gdom
3191 85 32211752 976 3608
$102
Scalene
Isosceles
Isosceles
1.48 4.87 15.39 9.37468 7.82 6.16 203.1
2.01, 2.49, 1.99
No
Gr 5 Unit 11 Lesson WCP 03/02/2005 9:35 AM Page 22

13. a), b)
c) Reflect Polygon B in a vertical mirror line runningbetween Polygon A and B. Translate Polygon B 3 dots to the left.
d) Yes, the polygon tessellates because congruent copiesof it cover a surface with no gaps or overlaps.
14.
The new figure is symmetrical. The broken line is theline of symmetry.
A B
Unit 11 • Cumulative Review • Student page 395 23
09:43:3709:44 14 cm3; 14 mL
No
Gr 5 Unit 11 Lesson WCP 03/02/2005 9:36 AM Page 23

17. a) 0.4
b) 0.35
c) 0.9
d) 0.25
20. a) 20 cm2; 24 cm; 2.4 dmb) About 21 m2; 20.8 m; 2080 cm
Students can round the length and width to 7 m and3 m. They can then draw a grid on the rectangle tocount the number of squares for the area.
21. a) 12 cm by 9 cm; 10 cm by 11 cm; 14 cm by 7 cmb) 6 m by 6 m; 2 m by 18 m; 3 m by 12 m
23.
I used a square and an isosceles triangle.
24 Unit 11 • Cumulative Review • Student page 396
$9.85
4.26 9.08 27.1817.26
�140�, �
25
� �13050
�, �270� �
190�, �
19000
� �12050
�, �14
�
3.75, 0.8, 0.3, 4.5, 2.10.3, 0.8, 2.1, 3.75, 4.5
2�45
� �190� �
45
� �147�
Gr 5 Unit 11 Lesson WCP 03/02/2005 9:36 AM Page 24

24.
Unit 11 • Cumulative Review • Student page 397 25
0�336� or �
112�
�326� or �
118�
120
5 81130
345678
39
1215182124
4121620242832
5152025303540
6182430364248
7212835424956
8243240485664
+345678
36789
1011
4789
101112
589
10111213
69
1011121314
7101112131415
8111213141516
�
Gr 5 Unit 11 Lesson WCP 03/02/2005 9:36 AM Page 25
26
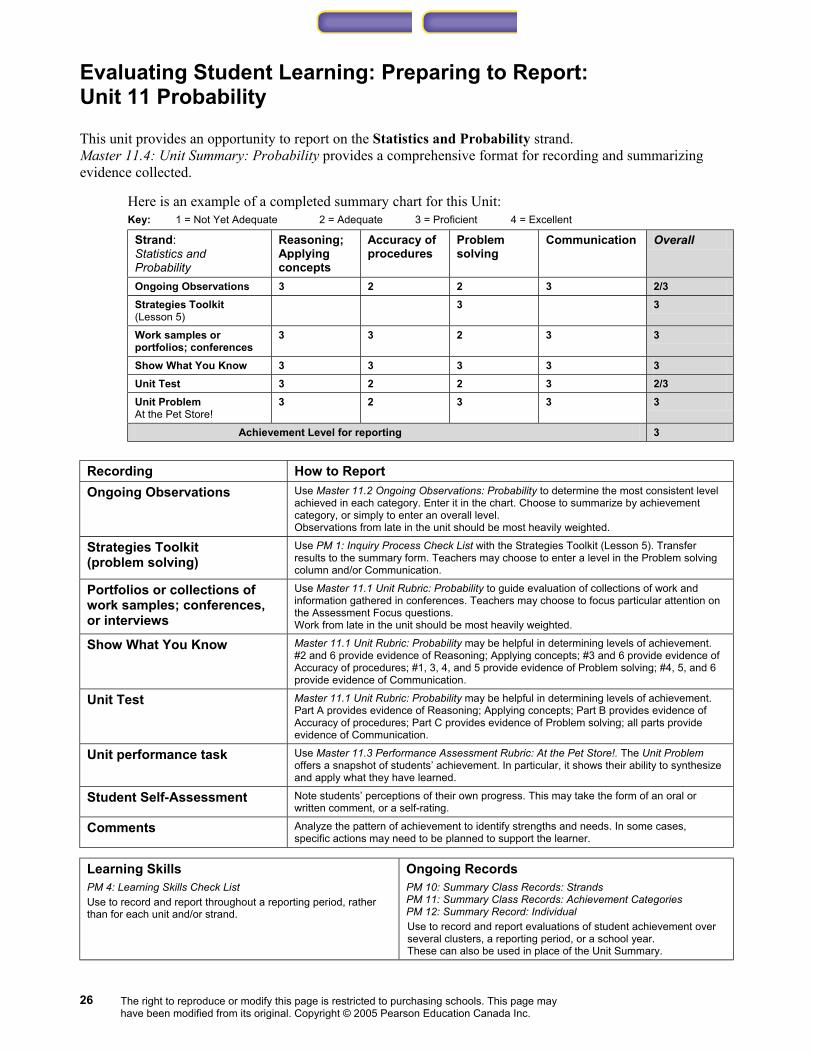
Evaluating Student Learning: Preparing to Report: Unit 11 Probability This unit provides an opportunity to report on the Statistics and Probability strand. Master 11.4: Unit Summary: Probability provides a comprehensive format for recording and summarizing evidence collected.
Here is an example of a completed summary chart for this Unit: Key: 1 = Not Yet Adequate 2 = Adequate 3 = Proficient 4 = Excellent
Strand: Statistics and Probability
Reasoning; Applying concepts
Accuracy of procedures
Problem solving
Communication Overall
Ongoing Observations 3 2 2 3 2/3 Strategies Toolkit (Lesson 5)
3 3
Work samples or portfolios; conferences
3 3 2 3 3
Show What You Know 3 3 3 3 3 Unit Test 3 2 2 3 2/3 Unit Problem At the Pet Store!
3 2 3 3 3
Achievement Level for reporting 3
Recording How to Report Ongoing Observations
Use Master 11.2 Ongoing Observations: Probability to determine the most consistent level achieved in each category. Enter it in the chart. Choose to summarize by achievement category, or simply to enter an overall level. Observations from late in the unit should be most heavily weighted.
Strategies Toolkit (problem solving)
Use PM 1: Inquiry Process Check List with the Strategies Toolkit (Lesson 5). Transfer results to the summary form. Teachers may choose to enter a level in the Problem solving column and/or Communication.
Portfolios or collections of work samples; conferences, or interviews
Use Master 11.1 Unit Rubric: Probability to guide evaluation of collections of work and information gathered in conferences. Teachers may choose to focus particular attention on the Assessment Focus questions. Work from late in the unit should be most heavily weighted.
Show What You Know Master 11.1 Unit Rubric: Probability may be helpful in determining levels of achievement. #2 and 6 provide evidence of Reasoning; Applying concepts; #3 and 6 provide evidence of Accuracy of procedures; #1, 3, 4, and 5 provide evidence of Problem solving; #4, 5, and 6 provide evidence of Communication.
Unit Test Master 11.1 Unit Rubric: Probability may be helpful in determining levels of achievement. Part A provides evidence of Reasoning; Applying concepts; Part B provides evidence of Accuracy of procedures; Part C provides evidence of Problem solving; all parts provide evidence of Communication.
Unit performance task Use Master 11.3 Performance Assessment Rubric: At the Pet Store!. The Unit Problem offers a snapshot of students’ achievement. In particular, it shows their ability to synthesize and apply what they have learned.
Student Self-Assessment Note students’ perceptions of their own progress. This may take the form of an oral or written comment, or a self-rating.
Comments Analyze the pattern of achievement to identify strengths and needs. In some cases, specific actions may need to be planned to support the learner.
Learning Skills
PM 4: Learning Skills Check List Use to record and report throughout a reporting period, rather than for each unit and/or strand.
Ongoing Records
PM 10: Summary Class Records: Strands PM 11: Summary Class Records: Achievement Categories PM 12: Summary Record: Individual Use to record and report evaluations of student achievement over several clusters, a reporting period, or a school year. These can also be used in place of the Unit Summary.
The right to reproduce or modify this page is restricted to purchasing schools. This page may have been modified from its original. Copyright © 2005 Pearson Education Canada Inc.

27
Name Date
Unit Rubric: Probability
Not Yet Adequate Adequate Proficient Excellent
Reasoning; Applying concepts
• shows understanding of probability by appropriately: – using concepts and
language of probability to describe events and predictions (e.g., best/worst; more/equally/less likely)
– explaining the results of probability experiments
– demonstrating that results of an experiment are not affected by such factors as age, skill, and experience
limited understanding; may be unable to: – use concepts and
language of probability to describe events (e.g., best/worst; more/equally/less likely)
– explain and justify the results of probability experiments
– demonstrate that results of an experiment are not affected by such factors as age, skill, experience
some understanding; partially able to: – use concepts and
language of probability to describe events (e.g., best/worst; more/equally/less likely)
– explain and justify the results of probability experiments
– demonstrate that results of an experiment are not affected by such factors as age, skill, experience
shows understanding; able to: – use concepts and
language of probability to describe events (e.g., best/worst; more/equally/less likely)
– explain and justify the results of probability experiments
– demonstrate that results of an experiment are not affected by such factors as age, skill, experience
thorough understanding; in various contexts, able to: – use concepts and
language of probability to describe events (e.g., best/worst; more/equally/less likely)
– explain and justify the results of probability experiments
– demonstrate that results of an experiment are not affected by such factors as age, skill, experience
Accuracy of procedures
• accurately: – lists all possible
outcomes of an experiment (single event)
– makes reasonable predictions about the likelihood of events
– uses fractions to describe probability
limited accuracy; often makes major errors/omissions in: – listing possible
outcomes – predicting outcomes – using fractions to
describe probability
partially accurate; makes frequent minor errors/ omissions in: – listing possible
outcomes – predicting outcomes – using fractions to
describe probability
generally accurate; makes few errors/ omissions in: – listing possible
outcomes – predicting outcomes – using fractions to
describe probability
accurate; rarely makes errors/omissions in: – listing possible
outcomes – predicting outcomes – using fractions to
describe probability
Problem-solving strategies
• conducts experiments to solve problems involving the probability of single events and predicts the results
may be unable to use appropriate strategies to conduct experiments and solve problems involving probability
with limited help, uses some appropriate strategies, with partial success, to conduct simple experiments and solve problems involving probability
successfully uses appropriate strategies to conduct experiments and solve problems involving probability
successfully uses appropriate, often innovative, strategies to conduct experiments and solve problems involving probability; may introduce some complexity into the experiment
Communication
• explains reasoning and procedures clearly using appropriate vocabulary (e.g., certain, outcome, probable, experiment)
unable to explain reasoning and procedures clearly
partially explains reasoning and procedures
explains reasoning and procedures clearly
explains reasoning and procedures clearly, precisely, and confidently
• presents work clearly (including recording experimental results)
work is often unclear presents work with some clarity
presents work clearly presents work clearly and precisely
Master 11.1
The right to reproduce or modify this page is restricted to purchasing schools. This page may have been modified from its original. Copyright © 2005 Pearson Education Canada Inc.

28
Name Date
Ongoing Observations: Probability The behaviours described under each heading are examples; they are not intended to be an exhaustive list of all that might be observed. More detailed descriptions are provided in each lesson under Assessment for Learning.
STUDENT ACHIEVEMENT: Probability * Student Reasoning;
Applying concepts Accuracy of procedures
Problem solving Communication
Uses concepts and language of probability to describe events Explains results of
probability experiments Demonstrates that
results of an experiment are due to chance
Lists all possible outcomes of an experiment Makes reasonable
predictions Uses fractions
correctly to describe probability
Successfully uses appropriate strategies to conduct experiments and solve problems involving probability (single event)
Explains procedures and reasoning clearly Records results
clearly
* Use locally or provincially approved levels, symbols, or numeric ratings.
Master 11.2
The right to reproduce or modify this page is restricted to purchasing schools. This page may have been modified from its original. Copyright © 2005 Pearson Education Canada Inc.

29
Name Date
Unit Problem: At the Pet Store! Not Yet
Adequate Adequate Proficient Excellent
Reasoning; Applying concepts
• shows understanding by analyzing and explaining: – differences between
predicted probabilities and actual events
– procedures used to determine probabilities and calculate the number of each kind of fish
shows little understanding; may be unable to analyze or explain: – differences between
predicted probabilities and actual events
– procedures used to determine probabilities and calculate the number of each kind of fish
shows partial understanding; offers some reasonable analysis and explanation of: – differences between
predicted probabilities and actual events
– procedures used to determine probabilities and calculate the number of each kind of fish
shows understanding by offering reasonable analyses and explanation of: – differences between
predicted probabilities and actual events
– procedures used to determine probabilities and calculate the number of each kind of fish
shows thorough understanding by giving in-depth and insightful analyses and explanations of: – differences between
predicted probabilities and actual events
– procedures used to determine probabilities and calculate the number of each kind of fish
Accuracy of procedures
• accurately determines: – the number of fish of
each colour, given the probability fractions and total number (Part 1)
– the number of fish (cubes) needed to represent the listed probabilities (expressed in fractions) (Part 2)
– the number of fish of each type needed to match the probabilities chosen (Part 3)
limited accuracy; major errors or omissions in determining: – the number of fish of
each colour – the number of
fish/cubes of each colour that are needed to match given probabilities
– the number of fish of each type needed to match the probabilities chosen
somewhat accurate; frequent minor errors/ omissions in determining: – the number of fish of
each colour – the number of
fish/cubes of each colour that are needed to match given probabilities
– the number of fish of each type needed to match the probabilities chosen
generally accurate; few errors/ omissions in determining: – the number of fish of
each colour – the number of
fish/cubes of each colour that are needed to match given probabilities
– the number of fish of each type needed to match the probabilities chosen
accurate; rarely makes errors/omissions in determining: – the number of fish of
each colour – the number of
fish/cubes of each colour that are needed to match given probabilities
– the number of fish of each type needed to match the probabilities chosen
Problem-solving strategies
• chooses and carries out appropriate strategies, including using tables and diagrams, to: – solve problems
involving probability – use probabilities to
design the composition of a fish tank
may be unable to choose and use appropriate strategies to: – solve problems
involving probability – use probabilities to
design the composition of a fish tank
with limited help, uses some appropriate strategies, with partial success, to: – solve problems
involving probability – use probabilities to
design the composition of a fish tank
successfully uses appropriate strategies to: – solve problems
involving probability – use probabilities to
design the composition of a fish tank
successfully uses appropriate, and often innovative, strategies to: – solve problems
involving probability – use probabilities to
design the composition of a fish tank (may introduce some complexity)
Communication • explains reasoning and
procedures clearly, including appropriate terminology (e.g., more/equally/less likely; outcome)
unable to explain reasoning and procedures clearly
partially explains reasoning and procedures
explains reasoning and procedures clearly
explains reasoning and procedures clearly, precisely, and confidently
• records data and presents work clearly
work is presented with little clarity
work is presented with some clarity
presents work clearly presents work clearly and precisely
Master 11.3
The right to reproduce or modify this page is restricted to purchasing schools. This page may have been modified from its original. Copyright © 2005 Pearson Education Canada Inc.

30
Name Date
Unit Summary: Probability Review assessment records to determine the most consistent achievement levels for the assessments conducted. Some cells may be blank. Overall achievement levels may be recorded in each row, rather than identifying levels for each achievement category. Most Consistent Level of Achievement*
Strand: Statistics and Probability
Reasoning; Applying concepts
Accuracy of procedures
Problem solving
Communication Overall
Ongoing Observations
Strategies Toolkit (Lesson 5)
Work samples or portfolios; conferences
Show What You Know
Unit Test
Unit Problem At the Pet Store!
Achievement Level for reporting
*Use locally or provincially approved levels, symbols, or numeric ratings. Self-Assessment:
Comments: (Strengths, Needs, Next Steps)
Master 11.4
The right to reproduce or modify this page is restricted to purchasing schools. This page may have been modified from its original. Copyright © 2005 Pearson Education Canada Inc.

31
Name Date
To Parents and Adults at Home … Your child’s class is starting a mathematics unit on probability. As adults, we use ideas of probability in everyday life when we estimate the likelihood of risks and predict future events. Many decisions, from carrying an umbrella to buying extra life insurance, are based on our understanding of probability. In this unit, your child will:
• Use the language of probability. • Conduct experiments and predict results. • Use fractions to describe probability. • Use probability to pose and solve problems.
Probability concepts can be practised at home as well as at school. Here are some suggestions for activities you can do at home:
• Listen to weather forecasts with your child. Use words such as likely, unlikely, probable, and improbable to talk about the next day’s weather. Compare the actual weather to the forecast weather. Help your child understand that meteorologists use past weather patterns to tell us what is probable, rather than certain, in the future.
• Play board and card games with your child. Compare games that depend on
chance (for example, snakes and ladders) with games that depend on skill (for example, chess). Look for games that combine chance and skill.
• Talk with your child about superstitions. For instance, you might help your child
realize that wishing hard or having a “lucky number” does not influence the cards you are dealt in a game.
Master 11.5
The right to reproduce or modify this page is restricted to purchasing schools. This page may have been modified from its original. Copyright © 2005 Pearson Education Canada Inc.

32
Name Date
Blank Spinners
Master 11.6
The right to reproduce or modify this page is restricted to purchasing schools. This page may have been modified from its original. Copyright © 2005 Pearson Education Canada Inc.

33
Name Date
Additional Activity 1: Match My Meaning! Work with a partner. Carefully cut apart these cards.
certain will definitely happen
impossible cannot happen
possible could happen
probable is likely to happen
improbable is unlikely to happen
Place all the cards face down. Take turns flipping over 2 cards. If the cards match (word and meaning), keep them and take another turn. The winner is the player who collects the most cards. Play 5 rounds. The grand winner is the player who wins the most rounds.
Take It Further: Write about a situation that can be described using the words on the cards.
Master 11.7
The right to reproduce or modify this page is restricted to purchasing schools. This page may have been modified from its original. Copyright © 2005 Pearson Education Canada Inc.

34
Name Date
Additional Activity 2: Animal Draw Work with a partner.
Look at the animal names listed here. What fraction of the list are cats? Insects? Birds? Fish?
Cougar Lion Tiger Panther
Beetle Fly Mosquito Ladybug
Crow Eagle Salmon Tuna
Cut apart the animal names and place them in a bag.
You will pull out an animal name without looking, then replace it in the bag.
Make a prediction. In 30 tries, about how many times do you expect to draw a
cat? An insect? A fish? A bird?
Shake up the bag. Reach in and pull out a name without looking. Record your result and replace the name. Make 30 draws in all.
Did your actual draws match your prediction? Explain.
Take It Further: Find as many different equivalent fractions as possible to express the probability of drawing an insect.
Master 11.8
The right to reproduce or modify this page is restricted to purchasing schools. This page may have been modified from its original. Copyright © 2005 Pearson Education Canada Inc.

35
Name Date
Additional Activity 3: Fold Your Tents! Work with a partner. You will need 20 matching squares of paper about 2 cm by 2 cm and a tray.
Fold each piece of paper in half to make a small “tent.”
Stand all your tents on a tray. Each tent should have the fold facing up.
Shake the tray so that all the tents fall off and land on the floor.
What fraction of the tents have landed fold up? What fraction landed lying on one side? What fraction landed standing on one end? Repeat the experiment 4 more times.
Record your results each time.
Based on your results, predict what fraction of the tents will land fold up after
your next toss. Toss the tents once more. Count the tents that landed fold up.
Did your actual results match your prediction? Explain. Take It Further: Predict the fraction of the tents that will land fold up after the 10th and 20th tosses.
Master 11.9
The right to reproduce or modify this page is restricted to purchasing schools. This page may have been modified from its original. Copyright © 2005 Pearson Education Canada Inc.

36
Name Date
Additional Activity 4: Robot Roundup Imagine you are in charge of a robot factory. Each robot needs 2 arms, 2 wheels, and a box-shaped body. Both arms must be the same colour. Both wheels must be the same colour. For each component, you have the colour choices shown here: Arms: yellow or blue Wheels: green or purple Body: red or black or grey
List the outcomes to find out how many different robots you can make.
Draw and colour one of the robots.
If you picked the components without looking, what are the chances you would create a grey robot with blue arms and purple wheels?
Take It Further: Add another component (for example, a control panel in gold or silver) and work out how many different robots can now be produced.
Master 11.10
The right to reproduce or modify this page is restricted to purchasing schools. This page may have been modified from its original. Copyright © 2005 Pearson Education Canada Inc.

37
Name Date
Step-by-Step 1 Lesson 1, Question 6 Step 1 Yellow is more likely, so there are more __________ sectors than red.
Red is more likely, so there are more ___________ sectors than blue. Look at the first spinner on Master 11b. It has 8 sectors. How many sectors will you colour yellow? ____ red? ____ blue? ____ Colour the spinner. Is there a different way to colour the spinner? Explain. _______________________________________________________
Step 2 Blue and green are equally likely.
They cover _______ sectors. Yellow is more likely. It covers _______ sectors. Look at the second spinner on Master 11b. It has 5 sectors. How many sectors will you colour blue? ___ green? ___ yellow? ___ Colour the spinner. Is there a different way to colour the spinner? Explain. _______________________________________________________
Step 3 Yellow is certain.
Are there any blue sectors? _____ Are there any red sectors? _____ Look at the third spinner on Master 11b. It has 10 sectors. Yellow covers _____ of the sectors. Colour the spinner. Is there a different way to colour the spinner? Explain. _______________________________________________________
Master 11.11a
The right to reproduce or modify this page is restricted to purchasing schools. This page may have been modified from its original. Copyright © 2005 Pearson Education Canada Inc.

38
Name Date
Spinners for Lesson 1, Question 6
Master 11.11b
The right to reproduce or modify this page is restricted to purchasing schools. This page may have been modified from its original. Copyright © 2005 Pearson Education Canada Inc.

39
Name Date
Step-by-Step 2 Lesson 2, Question 4
Vicki scores a point if the pointers land on the same colour. Alastair scores a point if the pointers land on different colours.
Make the spinners identical for each case. Step 1 Vicki will win if the spinners are mostly one colour. Choose 2 colours.
Colour the spinners so that Vicki is more likely to win.
Step 2 Alastair will win if each spinner has 4 different colours. Choose 4 colours. Colour the spinners so that Alastair is more likely to win.
Step 3 The game is fair if the pointers are equally likely to land on the same colour or a different colour. Choose 2 colours. Colour the spinners so that Vicki and Alastair have equal chances of winning.
Master 11.12
The right to reproduce or modify this page is restricted to purchasing schools. This page may have been modified from its original. Copyright © 2005 Pearson Education Canada Inc.

40
Name Date
Step-by-Step 3 Lesson 3, Question 2 Step 1 What are the possible outcomes when Dave tosses a coin?
_________________ or _________________
Step 2 Dave tosses heads 12 times out of 20.
So, Dave got tails 20 – _______ = _______ times
Step 3 What fraction of the tosses were heads? 20
What fraction of the tosses were tails? 20
Step 4 How many times would you expect Dave to get heads
in 20 tosses? _____
What fraction of the tosses would be heads? _____
How do Dave’s results compare with what you expected?
_______________________________________________________
_______________________________________________________
Master 11.13
The right to reproduce or modify this page is restricted to purchasing schools. This page may have been modified from its original. Copyright © 2005 Pearson Education Canada Inc.

41
Name Date
Step-by-Step 4 Lesson 4, Question 2 Step 1 What are the possible outcomes of tossing 3 coins?
Complete this table.
First Coin Second Coin Third Coin Heads Heads Heads
Heads Heads Tails
Heads Tails
Heads
Tails Tails Tails
Tails
Tails
Tails Step 2 How many different outcomes are possible? ________
Step 3 If a game is fair, each player has an equal chance of winning.
How can we divide the number of possible outcomes into 2 equal parts? _______________________________________________________ Step 4 Look at the table in Step 1.
How many outcomes include at least 2 heads? ________
How many outcomes include at least 2 tails?________
Make up a fair game with 3 coins.
Player A gets a point if ____________________________________.
Player B gets a point if ____________________________________.
How do you know this game is fair?
_______________________________________________________
Master 11.14
The right to reproduce or modify this page is restricted to purchasing schools. This page may have been modified from its original. Copyright © 2005 Pearson Education Canada Inc.

42
Name Date
Unit Test: Unit 11 Probability Part A 1. Use the words likely, unlikely, probable, improbable, impossible, or certain to
describe each event. a) The sun will rise tomorrow. ______________________
b) You will dig to the centre of the Earth. ______________________
c) You will win a gold medal at the Olympics. ______________________
d) You will sleep tonight. ______________________
2. Eric has red, green, yellow, and blue marbles.
He wants to give Andrea 2 marbles. What possible colour combinations can he give her?
3. Colour this spinner so that green is more likely than blue and blue is more likely than red.
Master 11.15a
The right to reproduce or modify this page is restricted to purchasing schools. This page may have been modified from its original. Copyright © 2005 Pearson Education Canada Inc.
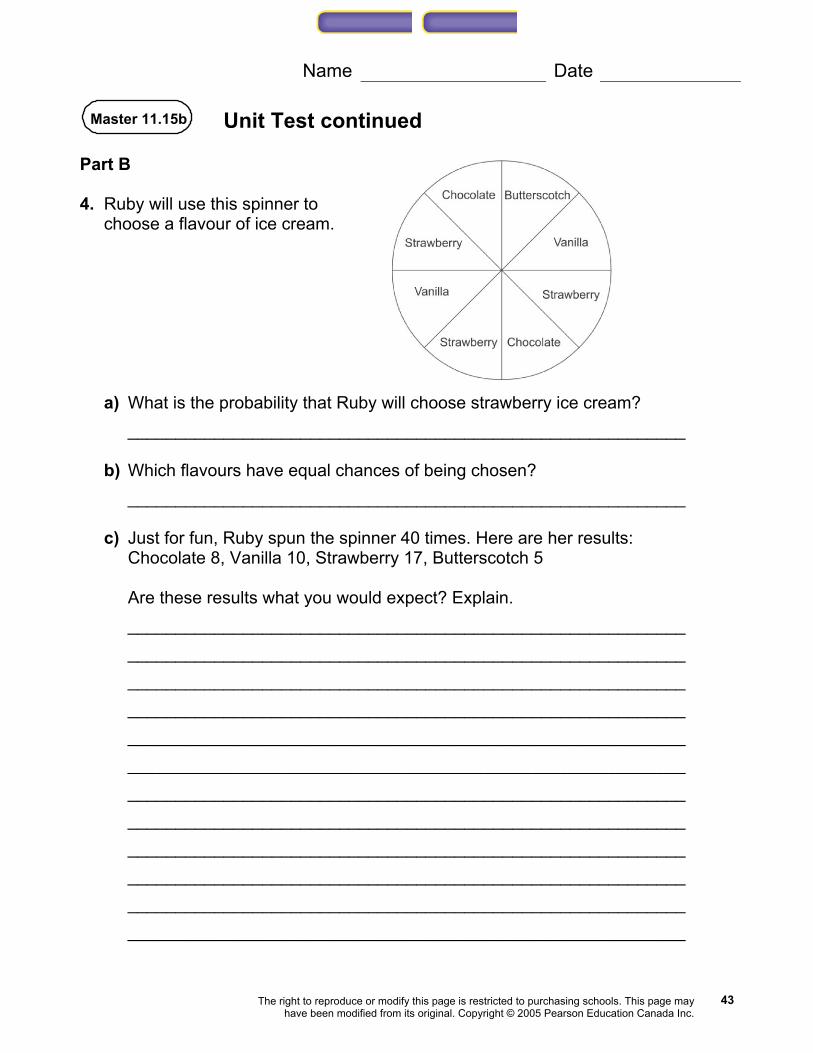
43
Name Date
Unit Test continued Part B 4. Ruby will use this spinner to
choose a flavour of ice cream.
a) What is the probability that Ruby will choose strawberry ice cream? __________________________________________________________ b) Which flavours have equal chances of being chosen? __________________________________________________________ c) Just for fun, Ruby spun the spinner 40 times. Here are her results:
Chocolate 8, Vanilla 10, Strawberry 17, Butterscotch 5 Are these results what you would expect? Explain.
__________________________________________________________ __________________________________________________________ __________________________________________________________ __________________________________________________________ __________________________________________________________ __________________________________________________________ __________________________________________________________ __________________________________________________________ __________________________________________________________ __________________________________________________________ __________________________________________________________ __________________________________________________________
Master 11.15b
The right to reproduce or modify this page is restricted to purchasing schools. This page may have been modified from its original. Copyright © 2005 Pearson Education Canada Inc.

44
Name Date
Unit Test continued Part C 5. Design a fair game of chance for 2 players. Use a 2-colour counter and a number
cube. Each player should have a different way of scoring a point. Explain how you know your game is fair. _________________________________________________________________
_________________________________________________________________
_________________________________________________________________
_________________________________________________________________
_________________________________________________________________
_________________________________________________________________
_________________________________________________________________
_________________________________________________________________
Master 11.15c
The right to reproduce or modify this page is restricted to purchasing schools. This page may have been modified from its original. Copyright © 2005 Pearson Education Canada Inc.
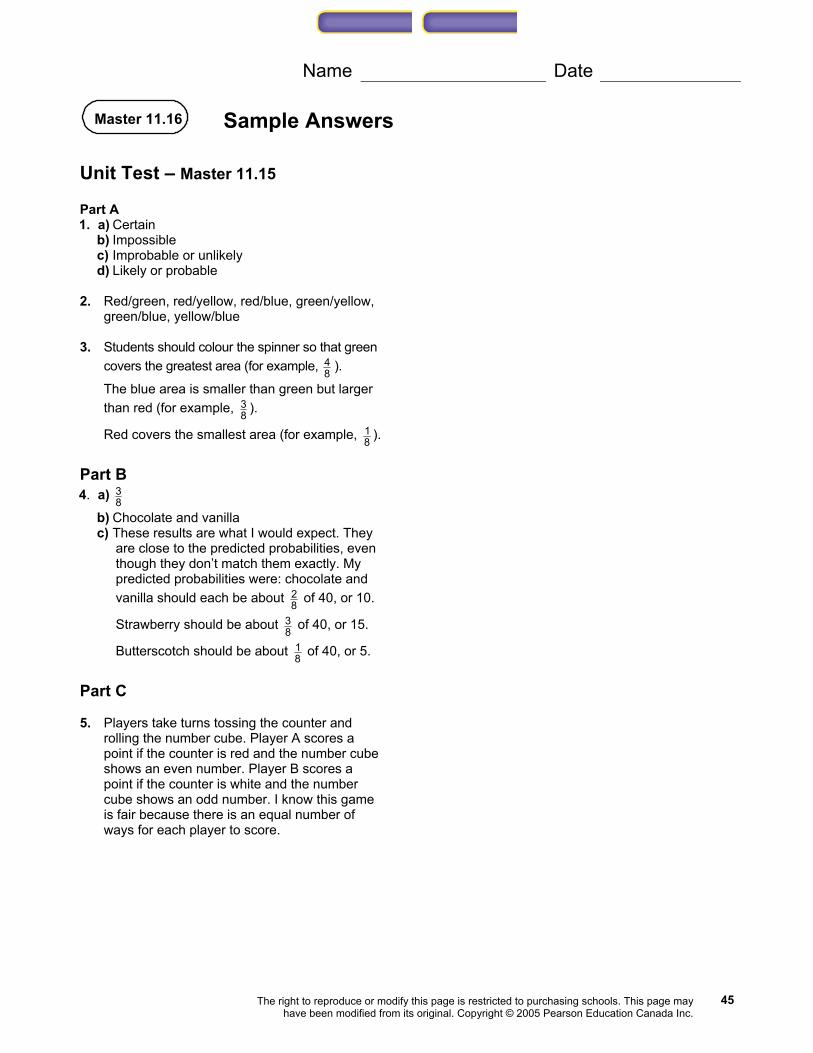
45
Name Date
Sample Answers Unit Test – Master 11.15 Part A 1. a) Certain
b) Impossible c) Improbable or unlikely d) Likely or probable
2. Red/green, red/yellow, red/blue, green/yellow,
green/blue, yellow/blue 3. Students should colour the spinner so that green
covers the greatest area (for example, 48 ).
The blue area is smaller than green but larger than red (for example, 3
8 ).
Red covers the smallest area (for example, 18 ).
Part B 4. a) 3
8
b) Chocolate and vanilla c) These results are what I would expect. They
are close to the predicted probabilities, even though they don’t match them exactly. My predicted probabilities were: chocolate and vanilla should each be about 2
8 of 40, or 10.
Strawberry should be about 38 of 40, or 15.
Butterscotch should be about 18 of 40, or 5.
Part C 5. Players take turns tossing the counter and
rolling the number cube. Player A scores a point if the counter is red and the number cube shows an even number. Player B scores a point if the counter is white and the number cube shows an odd number. I know this game is fair because there is an equal number of ways for each player to score.
Master 11.16
The right to reproduce or modify this page is restricted to purchasing schools. This page may have been modified from its original. Copyright © 2005 Pearson Education Canada Inc.

46
Extra Practice Masters 11.17–11.19 Go to the CD-ROM to access editable versions of these Extra Practice Masters.
The right to reproduce or modify this page is restricted to purchasing schools. This page may have been modified from its original. Copyright © 2005 Pearson Education Canada Inc.

Program Authors
Peggy Morrow
Ralph Connelly
Ray Appel
Daryl M.J. Chichak
Cynthia Pratt Nicolson
Jason Johnston
Bryn Keyes
Don Jones
Michael Davis
Steve Thomas
Jeananne Thomas
Angela D’Alessandro
Maggie Martin Connell
Sharon Jeroski
Jim Mennie
Trevor Brown
Nora Alexander
Copyright © 2005 Pearson Education Canada Inc.
All Rights Reserved. This publication is protected by copyright,and permission should be obtained from the publisher prior toany prohibited reproduction, storage in a retrieval system, ortransmission in any form or by any means, electronic, mechanical,photocopying, recording, or likewise. For information regardingpermission, write to the Permissions Department.
Printed and bound in Canada
1 2 3 4 5 – TC – 08 07 06 05
Cover Gr5 TG WCP U11 02/24/2005 10:39 AM Page 2