Embed Size (px)
Citation preview

High-Throughput Sequencing CourseWelcome
Biostatistics and Bioinformatics
Summer 2018

Welcome from HTS Course Faculty and StaffI Biology and Computational
BiologyI David CorcoranI Holly DressmanI Raluca GordanI Josh GranekI Kathleen Miglia
I ComputingI Cliburn ChanI Janice McCarthy
I StatisticsI Andrew AllenI Yi-Ju LiI Kouros OwzarI Jichun Xie
I Program EvaluationI Ed Neal
I TranslationalBioinformaticsI Anna-Maria MasciI Jessica Tenenbaum
I Teaching AssistantsI Jeremy GreshamI Kuei (Clint) Yueh KoI Benji WagnerI Paul ZweckI C?
I Resource specialistI Sharon Updike
I AdministrationI Tasha AllisonI Tim DurningI Dawn HailsI James Thomas
I Special Thanks: Liz Delong, Tim Reddy
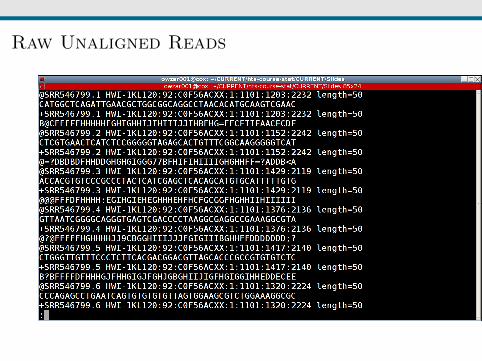
Raw Unaligned Reads

Aligned Reads

Counts

Downstream Statistical Analysis

Summer 2015 Student Data0
1020
3040
50
●
8A_N
●
8A_K
●
8B_K
●
8C_K
●
8C_E
●
8A_E
●
8B_E
●
8B_N
●
8C_N
●
8B_P
●
8A_P
●
8C_P
●
8A_G
●
7B_G
●8B
_G●
7A_G
●
7C_G
●
8C_G
●
7B_N
●
7A_N
●
7C_N
●
7A_K
●
7B_K
●
7C_K
●
7B_E
●
7A_P
●
7B_P
●
7C_P
●
7A_E
●
7C_E

Summer 2015 Student Data0
1020
3040
50
●
8A_N
●
8A_K
●
8B_K
●
8C_K
●
8C_E
●
8A_E
●
8B_E
●
8B_N
●
8C_N
●
8B_P
●
8A_P
●
8C_P
●
8A_G
7B_G
●8B
_G7A
_G7C
_G
●
8C_G
7B_N
7A_N
7C_N
7A_K
7B_K
7C_K
7B_E
7A_P
7B_P
7C_P
7A_E
7C_E

Summer 2015 Student Data0
1020
3040
50
●
8A_N
●
8A_K
●
8B_K
●
8C_K
●
8C_E
●
8A_E
●
8B_E
●
8B_N
●
8C_N
●
8B_P
●
8A_P
●
8C_P
●
8A_G
7B_G
●8B
_G7A
_G7C
_G
●
8C_G
7B_N
7A_N
7C_N
7A_K
7B_K
7C_K
7B_E
7A_P
7B_P
7C_P
7A_E
7C_E

Summer 2015 Student Data0
1020
3040
50
●
8A_N
●
8A_K
●
8B_K
●
8C_K
●
8C_E
●
8A_E
●
8B_E
●
8B_N
●
8C_N
●
8B_P
●
8A_P
●
8C_P
●
8A_G
7B_G
●8B
_G7A
_G7C
_G
●
8C_G
7B_N
7A_N
7C_N
7A_K
7B_K
7C_K
7B_E
7A_P
7B_P
7C_P
7A_E
7C_E

Beyond the mechanics of data analysis
I Proper lab practices for building sequencing libraries
I Computational Biology concepts and algorithms
I Introduction to ”tidy” programming
I Pre-processing and QC of raw sequencing data
I Statistics: Concepts, limitations, abuse
I Simulation and noise discovery
I Distributions for counts
I Reproducible analysis and literate programming
I Virtual computing
I Translational bioinformatics

The tidyverse approach (Data analysis task)
Task: Summarize the mean expression levels for genes 1 and 2by mutation status (WT vs MT)
## # A tibble: 20 x 3
## mutation gene1 gene2
## <fct> <dbl> <dbl>
## 1 MT -0.381 -0.722
## 2 MT 0.202 -1.37
## 3 MT -0.124 -0.773
## 4 WT -0.0492 -1.06
## 5 WT -0.227 -0.192
## 6 WT -0.0440 0.00387
## 7 MT 1.72 -0.108
## 8 MT -1.10 -0.288
## 9 WT 0.696 1.81
## 10 WT 2.22 0.103
## 11 MT 1.95 -0.226
## 12 MT -1.18 -1.18
## 13 WT -1.18 -0.281
## 14 WT -0.874 1.12
## 15 WT 0.865 0.0713
## 16 MT -0.268 0.277
## 17 WT 0.341 -0.00142
## 18 MT -0.452 -0.430
## 19 MT 0.102 0.0960
## 20 WT 1.11 0.975

The tidyverse approach (Messy programming)
x0 <- mydat[mydat$mutation == "WT", ]
x1 <- mydat[mydat$mutation == "MT", ]
# Mean expression of gene 1 in WT
mean(x0$gene1)
## [1] 0.2865462
# Mean expression of gene 1 in MT
mean(x1$gene1)
## [1] 0.04775764
# Mean expression of gene 2 in WT
mean(x0$gene2)
## [1] 0.2550259
# Mean expression of gene 2 in MT
mean(x1$gene1)
## [1] 0.04775764
Find the error!

The tidyverse approach (Tidy programming)
mydat %>% group_by(mutation) %>% summarize_at(vars(gene1, gene2), mean)
## # A tibble: 2 x 3
## mutation gene1 gene2
## <fct> <dbl> <dbl>
## 1 MT 0.0478 -0.472
## 2 WT 0.287 0.255
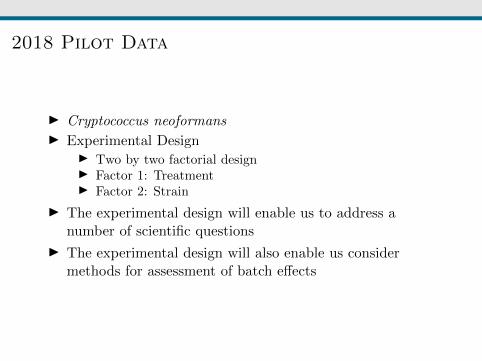
2018 Pilot Data
I Cryptococcus neoformans
I Experimental DesignI Two by two factorial designI Factor 1: TreatmentI Factor 2: Strain
I The experimental design will enable us to address anumber of scientific questions
I The experimental design will also enable us considermethods for assessment of batch effects

2018 Pilot Data: Sequencing Depth

2018 Pilot Data: Proportion of unique mappedreads

2018 Pilot Data: Dendrogram

2018 Pilot Data: DE with respect to Media

2018 Pilot Data: DE with respect to Strain

2018 Pilot Data: Strain by Treatmentinteraction

Overview: Format
I Weeks 1, 3-5: Lectures and Workshops (Statistics,Computing, Bioinformatics, Translational BiomedicalInformatics)
I Week 2: Wet lab work (build RNA library)
I Week 6: Group work/poster: data analysis, preparationand presentation
I Most statistical lectures (taught in the morning) arefollowed by a computing workshop (in the afternoon)
I Weekly assessments (Weeks 1-5)

Locations
1. CRTP Classroom (Hock 2nd floor; present location)
2. B&B Classroom (Hock 11025; 11th floor)
3. B&B Breakroom
4. BioSci Lab 0032/0066 (Directions have been provided)
B&B: Department of Biostatistics and Bioinformatics

Overview: Schedule
I Week 1: Thu-Fri (two days)
I Week 2: Mon-Fri (five days)
I Weeks 3-6: Mon-Thu (four days per week)
I Four sessions per day (0900-1015; 1030-1145; 1315-1430;1445-1600)
I Lunch 1145-1315
I Locations:I Lectures and computing workshops: Hock CRTP ClassroomI Wet lab work: 0032/0066 Biosci Lab
I Exceptions: 07/07 (this Friday) and 07/27 (Thursday week4) will be moved to Hock 11025

Weekly Assessment
1. Format: 10 multiple choice or True/False questions
2. Administered during last 35 minutes of the last day of theweek
3. 20 minutes for completion + 15 minutes for group feedback
4. Purpose: To help instructors and students identify topicsand issues that need clarification
5. Improve course content and delivery for this and next year
6. A formal assessment is a requirement of the grant fundingthis course

Changes from 2017
I The course structure has been substantially revised inresponse to comments from student evaluations
I A two session workshop on microbiome sequencing studieshas been added to the curriculum
I The data analysis practicum has been substantiallyexpanded and revised:I The data analysis component will start earlier (in Week 2)I A workshop on pathway analysis (in addition to lectures on
the topic) will be heldI A four session guided analysis worskhop of the 2018 pilot
dataI An advanced bioinformatics workshop will be held (using
packages from the Bioconductor project)

Week 1
I Virtual computing environment setup
I Introduction to the R statistical environment, Jupyter(iPython) notebooks and UNIX (the main computingframework for the course)
I Introduction to statistical consideration of Design ofExperiments (DOE)
I Introduction to sequencing technologies
I Wetlab reproducibility
I Location: CRTP classroom

Week 2
I Lab work (RNA, library prep)
I Libraries sent to sequencing core
I Day 1:I Option 1: Lab: basics (0032/0066)I Option 2: Computing Lab (CRTP classroom)

Week 3
I Design of experiments
I Elements of statistical inference
I Unsupervised learning
I Supervised learning (aka machine learning)
I R graphics

Week 4
I Models for counts
I Generalized linear model for RNA-Seq
I Multiple testing
I Gene expression networks
I Reproducible analysis
I Bioinformatics computing/Computational biology
I Big Data and distributed computing

Week 5
I Translational bioinformatics
I Microbiome case study
I Human Genetics: Resources and Examples
I HTS pre-processing
I HTS pipeline
I Downstream analysis using the DESeq2 package
Week 6
I Analysis of team data
I If time allows: Analysis of course data and pilot data
I Poster preparation
I Final presentation

Course Certificate
I There are 19 days of lectures or workshops in weeks 1through 5
I The criteria for earning a course certificateI Complete all online quizzes on or before 08/09I The passing score for each quiz is 80% and you can retake
each quiz as many times as needed.I Attend at least 17 out of 19 days in weeks 1 through 5I Fully attend the last day (08/09)I Actively participate in the team presentation

Dinner
I Optional group dinner on Wednesday (08/08)
I Location to be determined

Additional Resources (Hock 11th floor)
I Coffee and filtered water
I Kitchen sink
I Refigerator, microwave, toaster oven

Plan for today
I Quick Introduction (all)
I Questions
I Review of 2015 and 2016 experiments (Josh Granek)
I Preview of 2017 experiment (Josh Granek)
I Setup of virtual computing environment (Cliburn Chanand Janice McCarthy)
I Introduction to R and UNIX (Cliburn Chan and JaniceMcCarthy)
I Pizza lunch 1145-1315 (in CRTP classroom)

Acknowledgement
I A hands-on, integrative next-generation sequencing course:design, experiment, and analysis
I National Institute of Biomedical Imaging andBioengineering (NIBIB)
I Education Projects (R25)
I 1R25EB023928-01

From all of us: Welcome!