Embed Size (px)
DESCRIPTION
Watershed Monitoring and the RMP. Lester McKee and Meg Sedlak Presentation to North Bay Watershed Association September 10 th , 2010. Regional Monitoring Program. 17 th Year Budget and structure Status and Trends Storm water monitoring activities at SFEI. Budget and Fees. - PowerPoint PPT Presentation
Citation preview

RMP
NOV 08
Watershed Monitoring and the RMP
Lester McKee and Meg SedlakPresentation to North Bay Watershed Association
September 10th, 2010

Regional Monitoring Program
• 17th Year• Budget and structure• Status and Trends• Storm water monitoring
activities at SFEI

Budget and Fees
• Funded by NPDES dischargers and dredgers• Total budget 2010: $3.2 million
Percent of Allocation
Municipal, 44.00%
Industrial, 11.00%
Stormwater, 23.50%
Cooling Water, 4.00%
Dredgers, 17.50%

Technical Review Committee
Steering Committee
Sources Pathways& Loading
ContaminantFate
Exposure &Effects
Emerging Contaminants
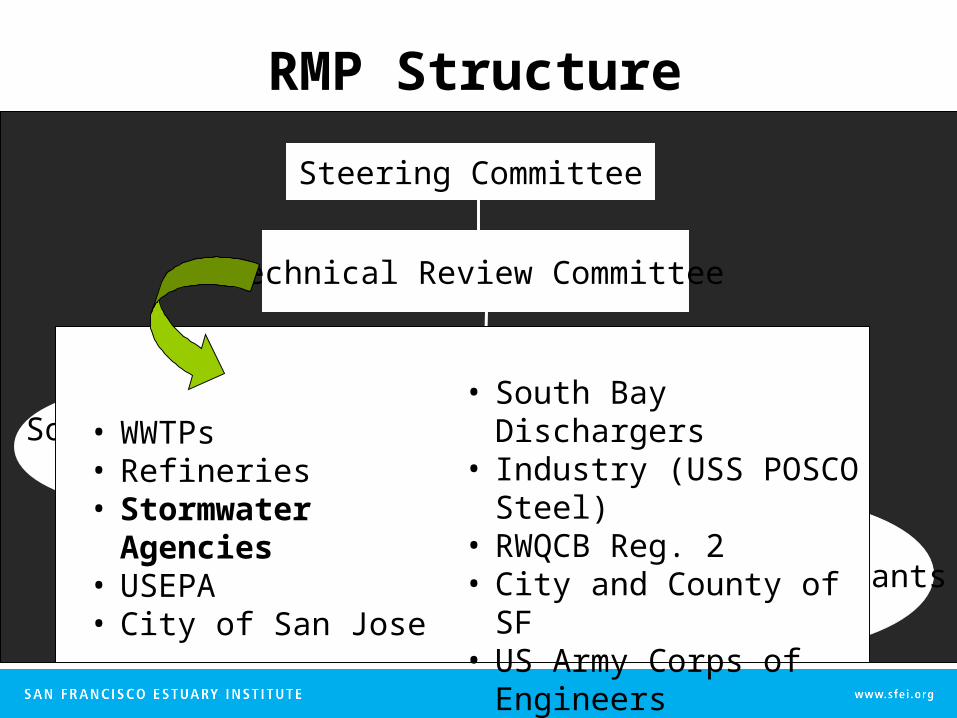
RMP Structure
Technical Review Committee
Steering Committee
Sources Pathways& Loading
ContaminantFate
Exposure &Effects
Emerging Contaminants
RMP Structure
• WWTPs• Refineries• Stormwater Agencies • USEPA • City of San Jose
• South Bay Dischargers • Industry (USS POSCO
Steel)• RWQCB Reg. 2• City and County of SF • US Army Corps of
Engineers
Technical Review Committee
Steering Committee
Sources Pathways& Loading
ContaminantFate
Exposure &Effects
Emerging Contaminants
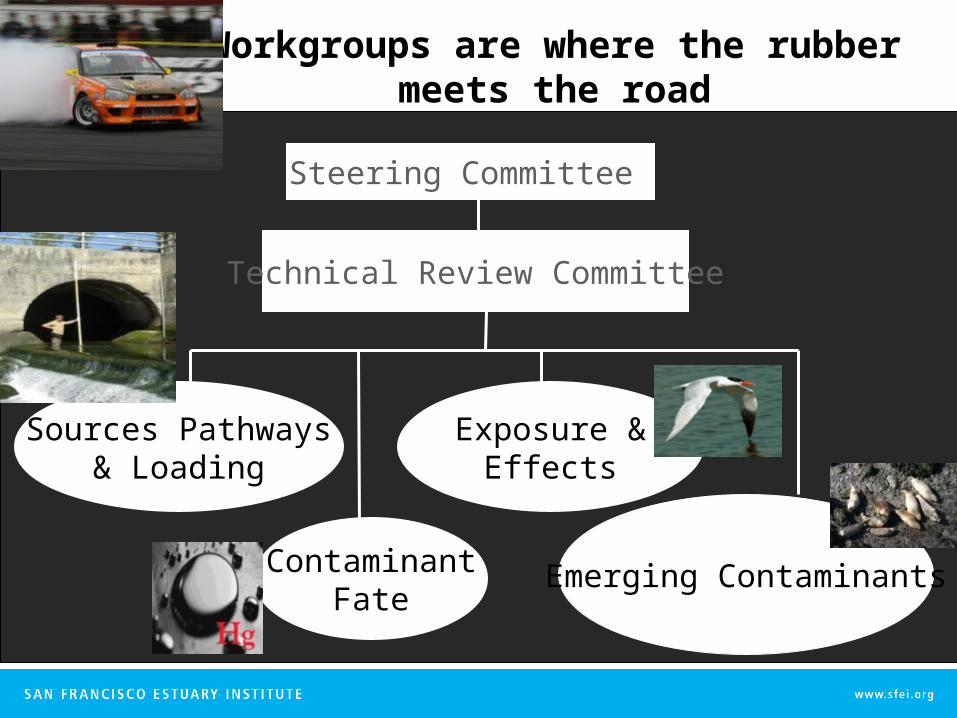
Workgroups are where the rubbermeets the road

Technical Review Committee
Steering Committee
Sources Pathways& Loading
ContaminantFate
Exposure &Effects
Emerging Contaminants
Workgroups are where the rubbermeets the road
SPLWG Advisory Panel
Dr. Barbara Mahler, USGS
Dr. Eric Stein, SCCWRP
Dr. Mike Stenstrom, UCLA

RMP Strategies
• TRC • SC • WGs
STRATEGIES

Strategies focusing on Policy needs & Priorities

Small Tributary Loading Strategy
Q1. Which are the high leverage small tributaries that contribute or potentially contribute most to Bay impairment by pollutants of concern?
Q2. What are the loads or concentrations of pollutants of concern from small tributaries to the Bay?
Q3. How are loads or concentrations of pollutants of concern from small tributaries changing on a decadal scale?
Q4. What are projected impacts of management actions on load or concentrations of POC from high leverage small tributaries?
Q5. Where should management actions be implemented in the region to have the greatest impact?

RMP Mission
• Collect data and communicate information about water quality in the San Francisco Estuary to support management decisions

Guided by Management Questions
• MQ1: Are chemical concentrations in the Estuary potentially at levels of concern and are associated impacts likely?
• MQ2: What are concentrations and masses of contaminants in the Estuary and its segments?
• MQ3: What are sources, pathways, loading, and processes leading to contaminant related impacts in the Estuary?
• MQ4: Have the concentrations, masses, and associated impacts of contaminants in the Estuary increased or decreased?
• MQ5: What are the projected concentrations, masses and associated impacts of contaminants in the Estuary?

How does the RMP answer MQs?
Status & Trends Monitoring (1993 - )
• Sediment and water (annually)• Bivalves (every 2 years)• Sport fish (every 3 years)• Bird eggs (every 3 years)
Pilot and Special Studies• Provides framework for
adaptive management• Responsive to changing needs

Status & Trends:Water and Sediment
• 22 Water sites
• Metals, PAHs, PBDEs, pesticides, & PCBs
• Aquatic toxicity
• Summer only
• 47 Sediment sites
• Metals, PAHs, PBDEs, pesticides and PCBs
• Sediment toxicity
• Wet/dry weather
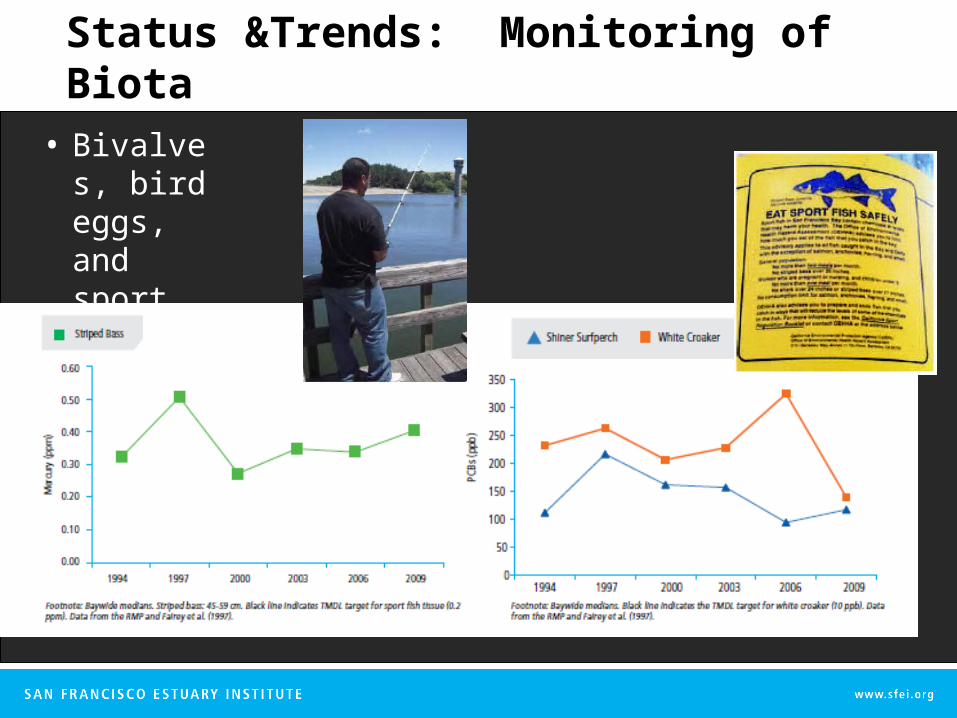
Status &Trends: Monitoring of Biota
• Bivalves, bird eggs, and sport fish

Information Dissemination
• Pulse • Annual Meeting
– October 5th, register on-line• Technical reports• Journal articles • Workshops

Easy access to data
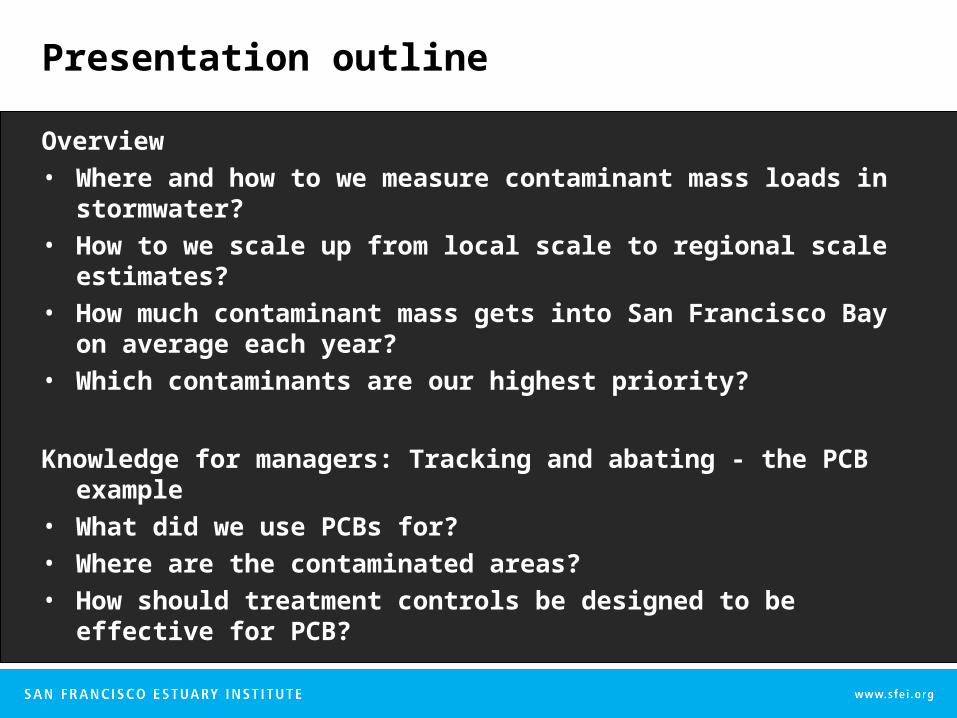
Presentation outline
Overview• Where and how to we measure contaminant mass
loads in stormwater?• How to we scale up from local scale to regional scale
estimates?• How much contaminant mass gets into San Francisco
Bay on average each year?• Which contaminants are our highest priority?
Knowledge for managers: Tracking and abating - the PCB example
• What did we use PCBs for?• Where are the contaminated areas?• How should treatment controls be designed to be
effective for PCB?

Overview – Where have we been monitoring?• Sacramento River at Mallard
Island – 154,000 km2 – WY 2002-2006, 2010
• Guadalupe River at Hwy. 101– 400 km2
– WY 2003-2006, 2010
• Zone 4 Line A at Cabot Blvd.– 4.5 km2
– WY 2007-2010
• North Richmond Pump Station – 1.4 km2
– WY 2011
• San Pedro Road Stormdrain– 1 km2
– WY 2005
• Gellert Park Recreational Facility
– 0.016 km2
– WY 2010
Guadalupe River
San Pedro Stormdrain
Zone 4 Line A
North RichmondSacramento
River
Gellert Park

0.01
0.1
1
10
100
0.01 0.1 1 10 100 1000 10000 100000 1000000
Watershed area (Sq. km)
Res
pons
e tim
e (h
rs)
Overview – Challenges of scale in monitoring?
(40 acres)
Guadalupe R.(8 hrs)
Zone 4 Line A(1.6 hrs)
(4 acres)
North RichmondPump Station
(1.1 hrs)
San PedroStormdrain(54 mins)
Gellert ParkRec Facility(12 mins)
Sacramento RiverAt Mallard Island
(3-4 days)

Overview – How have we been monitoring?
Sacramento River at Mallard Island
• USGS 15 minute Turbidity
• Sampling over 5-15 days during storms
• Sampling 4-7storms per year
• Dayflow dailydischarge

Overview – How have we been monitoring?
Guadalupe River at Hwy 101
• 15 minute Turbidity• Sampling over
3 -30 hours during storms
• Sampling 7-10
storms per year
• 15 minute discharge

Overview – How have we been monitoring?
Zone 4 Line A in Hayward
• 5 minute Turbidity
• Sampling over 1-3 hours during storms
• Sampling 10-15storms per year
• 5 minute discharge

Overview – How have we been monitoring?
North Richmond Pump Station
• 5 minute Turbidity
• Sampling over 1-2 hours during storms
• Sampling 2 storms per year
• 5 minute discharge

Overview – How do we scale up from local to
regional?• PCB TMDL
– Used loads measurements from Coyote Creek (WY 2005) and Guadalupe River (WY 2003-06), extrapolated them in time using monthly runoff data to derive a long term annual average load and scale up for urban area.
• Future– Presently developing a
spreadsheet model that will incorporate:
• Rainfall• Land use / contaminant source• Impervious based runoff coefficients
adjusted for slope and soil type• Land use / contaminant source specific
contaminant concentrations• Hydrologic calibration for a range of Bay
Area watershed types• Loads calibrated to measurements

Overview – Average annual mass load to San Francisco Bay?
Mercury
PCBs
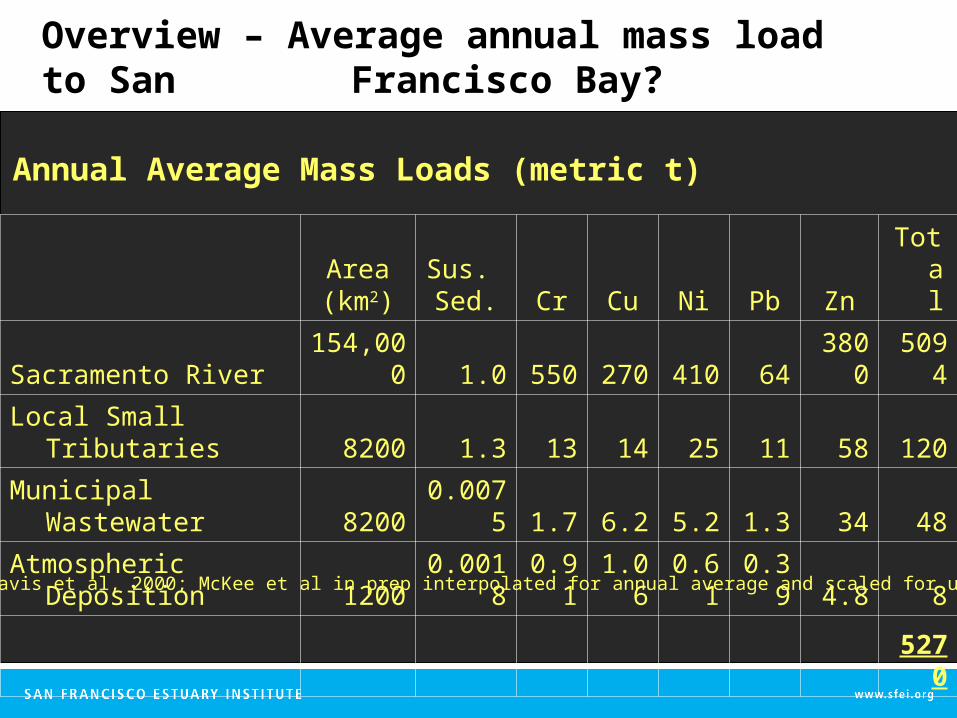
Overview – Average annual mass load to San Francisco Bay?
Area(km2)
Sus. Sed. Cr Cu Ni Pb Zn Total
Sacramento River 154,000 1.0 550 270 410 64 3800 5094
Local Small Tributaries 8200 1.3 13 14 25 11 58 120
Municipal Wastewater 8200 0.0075 1.7 6.2 5.2 1.3 34 48
Atmospheric Deposition 1200 0.0018 0.91 1.06 0.61 0.39 4.8 8
5270
Annual Average Mass Loads (metric t)
Source: Davis et al, 2000; McKee et al in prep interpolated for annual average and scaled for urban area

Overview – Which contaminants are our highest priority?
Substance PriorityMercury and PCBs Top
Polybrominated diphenylethers (PBDEs) High
Current use pesticides (pyrethroids), dioxins, selenium, OC pesticides, copper, nickel, PAHs Medium
Silver, arsenic, cadmium, chromium, lead, zinc, organophosphate pesticides, nutrients Low

Knowledge for managers:
Tracking and abating - the PCB example
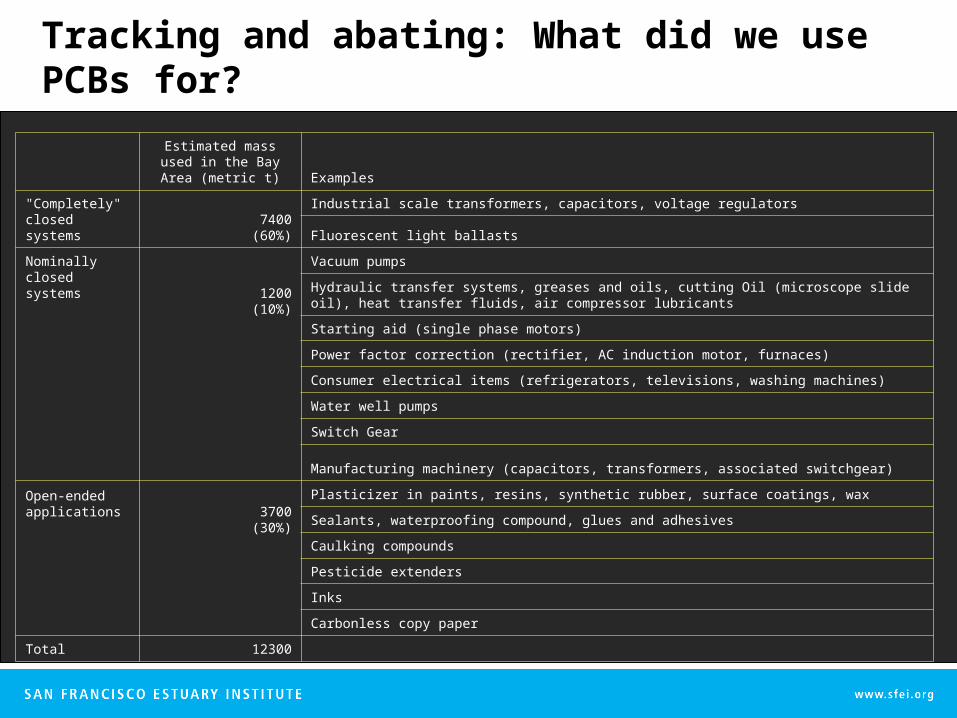
Tracking and abating: What did we use PCBs for?
Estimated mass used in the Bay Area (metric t) Examples
"Completely" closed systems
7400(60%)
Industrial scale transformers, capacitors, voltage regulators
Fluorescent light ballasts
Nominally closed systems 1200
(10%)
Vacuum pumps
Hydraulic transfer systems, greases and oils, cutting Oil (microscope slide oil), heat transfer fluids, air compressor lubricants
Starting aid (single phase motors)
Power factor correction (rectifier, AC induction motor, furnaces)
Consumer electrical items (refrigerators, televisions, washing machines)
Water well pumps
Switch Gear
Manufacturing machinery (capacitors, transformers, associated switchgear)
Open-ended applications 3700
(30%)
Plasticizer in paints, resins, synthetic rubber, surface coatings, wax
Sealants, waterproofing compound, glues and adhesives
Caulking compounds
Pesticide extenders
Inks
Carbonless copy paper
Total 12300
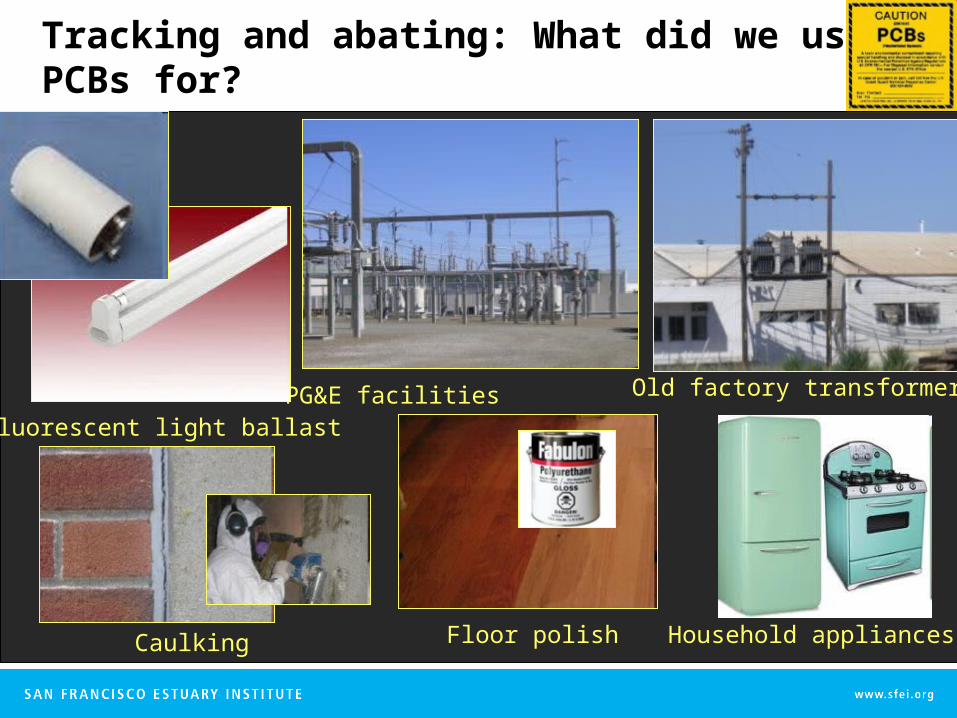
Tracking and abating: What did we use PCBs for?
Old factory transformersPG&E facilitiesFluorescent light ballast
Household appliancesFloor polishCaulking

Tracking and abating: Mapping sediment / soil contamination
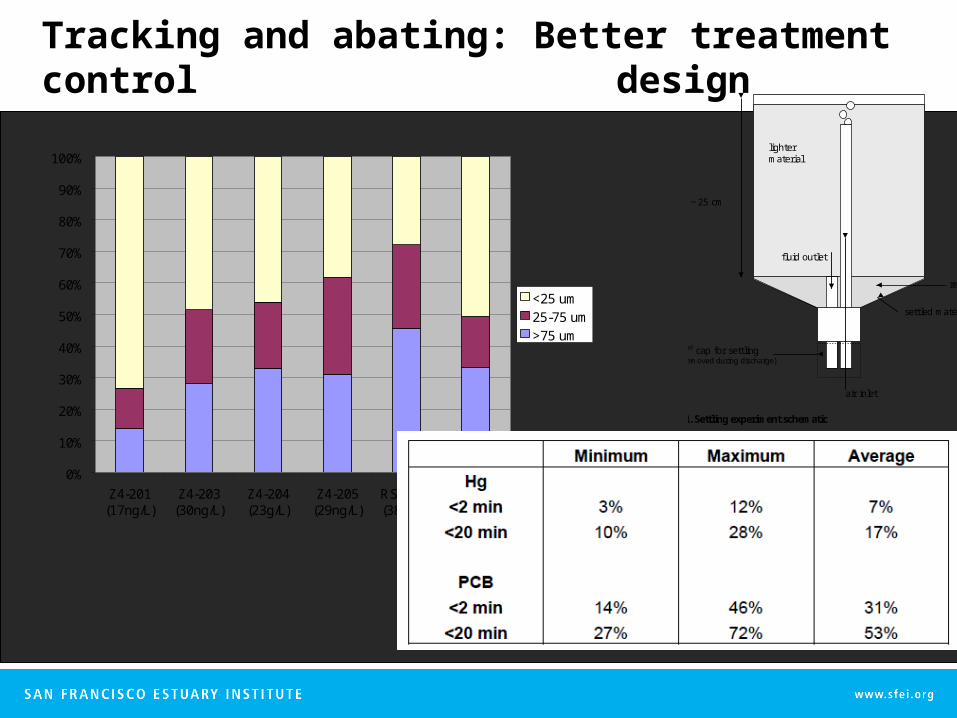
Tracking and abating: Better treatment control design
0%
10%
20%
30%
40%
50%
60%
70%
80%
90%
100%
Z4-201(17ng/L)
Z4-203(30ng/L)
Z4-204(23g/L)
Z4-205(29ng/L)
RS-1003(38ng/L)
RS-1004(17ng/L)
<25 um25-75 um>75 um
Figure 1. Settling experiment schematic
air inlet
fluid outlet
settled material
lighter material
remnant fluid
2nd cap for settling (removed during discharge)
~25 cm

Summary and next steps
• Municipal Regional Stormwater NPDES Permit (MRP) calls for:– Incorporate PCB-containing equipment inspection into exiting
industrial inspections– Conduct pilot projects to evaluate managing PCB-containing
waste materials during building demolition and renovation– Investigate on-land locations with contaminated soils– Conduct pilot studies to evaluate and enhance municipal
sediment removal and management practices– Conduct pilot projects to evaluate on-site stormwater retrofit– Investigate diversion of dry-weather and stormwater flows to
wastewater treatment
• BASMAA EPA grant: “Clean Watersheds for a Clean Bay”– Select five watersheds an locate contaminated areas and refer
these sites to regulatory agencies for cleanup and abatement – develop methods to enhance removal of sediment with PCBs
during municipal sediment management activities– retrofit eight to 10 urban runoff treatment facilities into existing
infrastructure– facilitate development and implementation of a regional risk
reduction program