Embed Size (px)
Citation preview

Lake Decatur Watershed
15-year Monitoring:
Nitrates and Trends
Laura L. Keefer, Erin Bauer & Momcilo MarkusIllinois State Water Survey
Prairie Research Institute
University of Illinois
Champaign, Illinois

• City of Decatur, Keith Alexander
• ISWS Staff
Acknowledgements
Field staff Data processing Lab analysis
Louis Arighi Ben Bromiel Sue Bachman
Bill Bogner Brian Chaille Saada Hamdy
Kevin Rennels Brad Chapin Troy Foster
Amy Russell Robert Gardner Sofia Lazovski
Susan Shaw Sandy Jones Matt Lowell
James Slowikowski David Preston RuthAnn Nicols
Josh Stevens Mary Richardson Todd Peters
Marguerite Tan Amy Russell Lavany Reddy
Ryan Williams Susan Shaw Lauren Sievers
Loretta Skowron
Kay Surratt
Dan Webb

Overview
• Watershed background
– Historical nitrate-N levels in Lake Decatur
– Change in land cover
• Summary of 15-year monitoring data
• Spatial and temporal observations
• Nitrate-N trends

Lake Decatur Watershed

Lake Decatur Nitrate Levels (1967-2008)
ISWS Monitoring
Period

Lake Decatur Nitrate Levels (1967-2008)
1965 1970 1975 1980 1985 1990 1995 2000 2005 2010
Water Year
0
2
4
6
8
10
12
14
16
18N
itra
te-N
Co
ncentr
atio
n (
mg/L
)Annual Maximum Concentration
Annual Mean Concentration
Annual Minimum Concentration
MCL
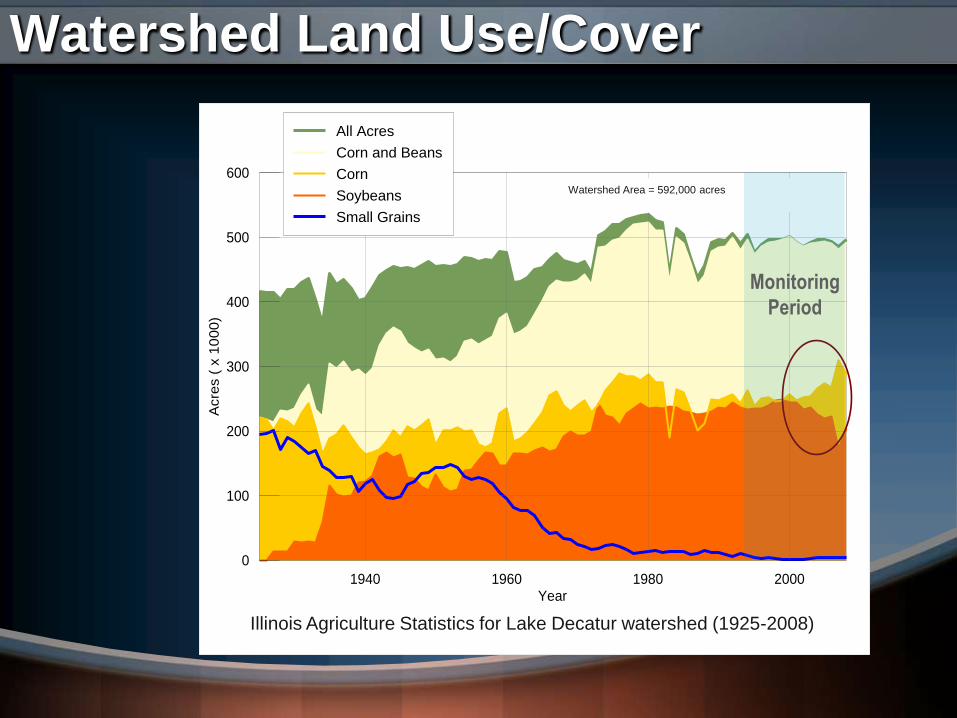
Watershed Land Use/Cover
0
100
200
300
400
500
600
Acre
s (
x 1
00
0)
1940 1960 1980 2000Year
All Acres
Corn and Beans
Corn
Soybeans
Small Grains
Illinois Agriculture Statistics for Lake Decatur watershed (1925-2008)
Watershed Area = 592,000 acres
Monitoring
Period

Watershed Land Use/Cover
0
100
200
300
400
500
600
Acre
s (
x 1
00
0)
1940 1960 1980 2000Year
All Acres
Corn and Beans
Corn
Soybeans
Small Grains
Illinois Agriculture Statistics for Lake Decatur watershed (1925-2008)
Watershed Area = 592,000 acres
Monitoring
Period
Change in percent watershed area by NASS land cover categories
between 1999 & 2008

Location and
monitoring period
of stations
!.
!.
!.
!.
!.
!.
!.
!.
!<
!<
!<
!<
!<
!<
!<
!<
!<
!<
CHAMPAIGN
FORD
MCLEAN
DEWITT
PIATT
MACON
MOULTRIECHRISTIAN
BIG/LONG CREEK
Sangamon Rive
r
GOOSE CREEK
CAMP CREEK
FRIENDS CREEK
BIG DITCH
FISHER
Sangamon River
102
103
112
101
111104
106
105
Lake
Deca
tur
ClintonUrbana
±
0 3 6 9 121.5Miles
Decatur
Monticello
Rantoul
Gibson City
Sub-watershed Boundary
Major Stream
!. Stream Monitoring Station
!< Precipitation Station
101: WY 1993-2008
102: WY 1993-2008
103: WY 1993-2000
104: WY 1993-2002
105: WY 1993-2003
106: WY 1993-2003
111: WY 1993-2008
112: WY 1993-2000

Nitrate-N Concentrations
1993 1995 1997 1999 2001 2003 2005 2007Water Year
0
5
10
15
20
0
5
10
15
20
Nit
rate
Co
nc
en
trati
on
(m
g/L
)
b) Mean Concentration
0
5
10
15
20
Long Creek
Friends Creek
Sangamon River at Monticello
Lake Decatur
a) Minimum Concentration
c) Maximum Concentration
MCL
MCL
MCL

Nitrate Loads (lb/acre)
0
5
10
15
20
25
30
35
40
45
50
55
An
nu
al N
itra
te-N
Lo
ad
( lb
/acre
)
2001 2002 2003 2004 2005 2006 2007 2008
1993 1994 1995 1996 1997 1998 1999 2000
0
5
10
15
20
25
30
35
40
45
50
55
An
nu
al N
itra
te-N
Lo
ad
(lb
/acre
)
Long Creek
Friends Creek
Camp Creek
Figure ??. Annual nitrate-N load for tributary stations during Water Year 1993 - 2008.
WYannualNO3Tribs.grf
+ Data only during May 1993 - Sept 1993
+
+
0
5
10
15
20
25
30
35
40
45
50
55
An
nu
al N
itra
te-N
Lo
ad
( lb
/acre
)
2001 2002 2003 2004 2005 2006 2007 2008
1993 1994 1995 1996 1997 1998 1999 2000
0
5
10
15
20
25
30
35
40
45
50
55
An
nu
al N
itra
te-N
Lo
ad
(lb
/acre
)
Long Creek
Friends Creek
Camp Creek
Figure ??. Annual nitrate-N load for tributary stations during Water Year 1993 - 2008.
WYannualNO3Tribs.grf
+ Data only during May 1993 - Sept 1993
+
+
Monticello

Flow-weighted Nitrate-N Concentrations
1993 1994 1995 1996 1997 1998 1999 2000 2001 2002 2003 2004 2005 2006 2007 2008
Water Year
0
10
20
30
40
50
An
nu
al R
un
off
(in
ch
es)
an
d N
itra
te-N
Yie
ld (
lb/a
cre
/ye
ar)
4
8
12
16
20F
low
We
igh
ted
Ave
rag
e
Nitra
te-N
Co
nce
ntra
tion (m
g/L
)Runoff: Long Creek
Runoff: Friends Creek
Runoff: Sangamon River
Load per acre: Long Creek
Load per acre: Friends Creek
Load per acre: Sangamon River
Flow-weighted Concentration: Long Creek
Flow-weighted Concentration: Friends Creek
Flow-weighted Concentration: Sangamon River
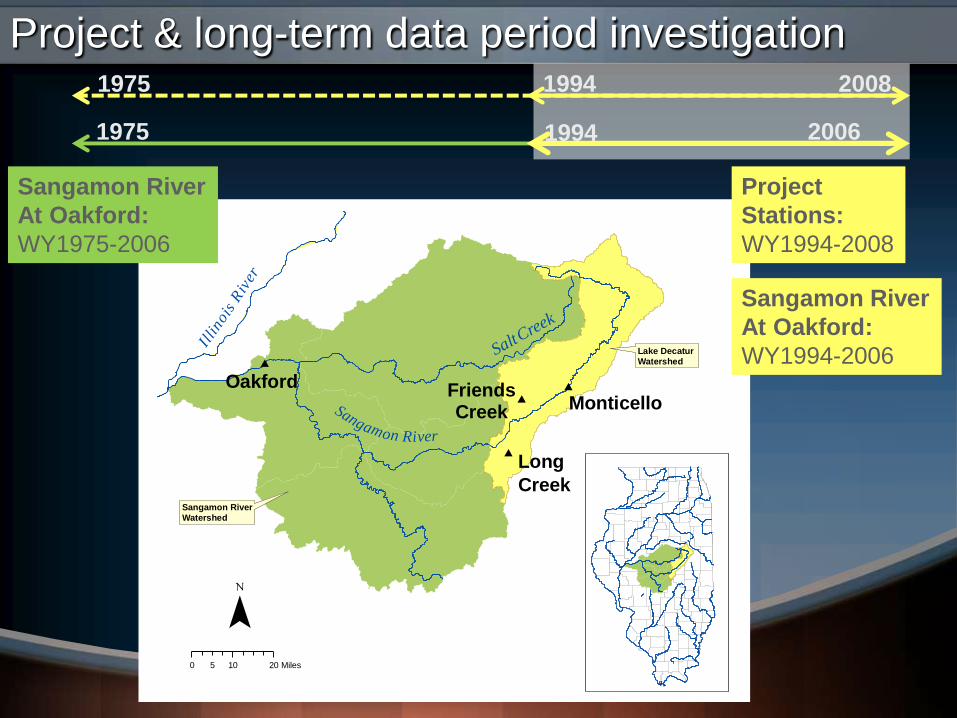
Project & long-term data period investigation
Illi
noi
s R
iver
Lake Decatur Watershed
Sangamon RiverWatershed
Sangamon River
OakfordMonticello
FriendsCreek
Long
Creek
Salt Creek
0 10 205 Miles
Project
Stations:
WY1994-2008
1994 2008
Sangamon River
At Oakford:
WY1975-2006
1975 2006
Sangamon River
At Oakford:
WY1994-2006
1994
1975
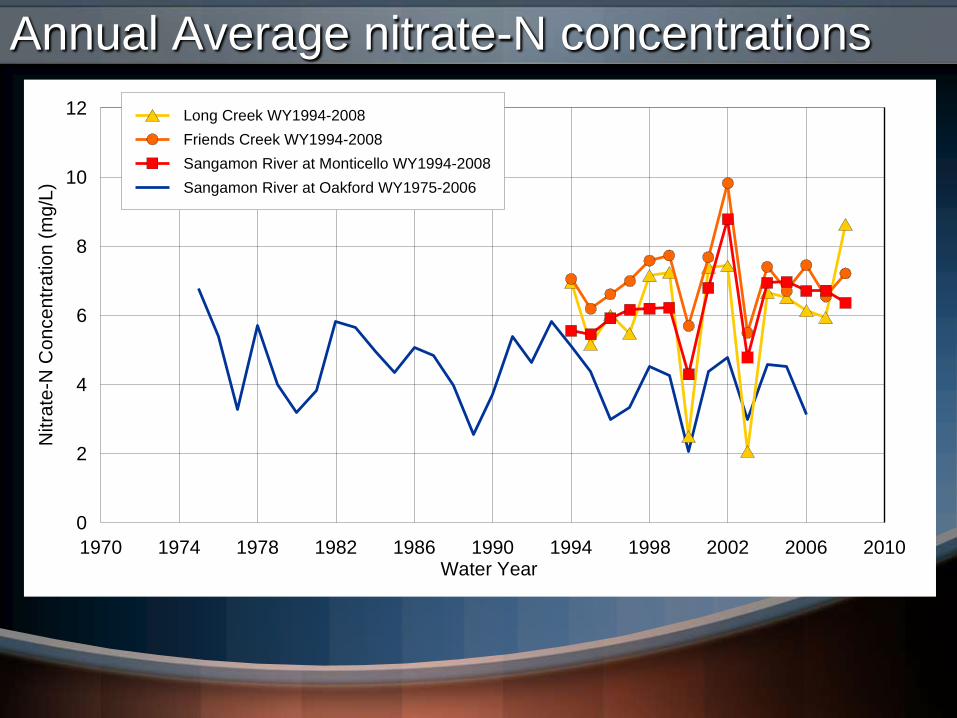
Annual Average nitrate-N concentrations
1970 1974 1978 1982 1986 1990 1994 1998 2002 2006 2010Water Year
0
2
4
6
8
10
12
Nitra
te-N
Co
nce
ntr
ation
(m
g/L
)
Long Creek WY1994-2008
Friends Creek WY1994-2008
Sangamon River at Monticello WY1994-2008
Sangamon River at Oakford WY1975-2006
Figure 30. Annual average nitrate-N concentrations at project and regional stations

Average Monthly Nitrate Runoff and Yield
OCT NOV DEC JAN FEB MAR APR MAY JUN JUL AUG SEP
Month
0.0
0.5
1.0
1.5
2.0
2.5
3.0
Run
off
(in
ch
es)
Long Creek WY1994-2008
Friends Creek WY1994-2008
Sangamon River at Monticello WY1994-2008
Sangamon River at Oakford WY1994-2006
Sangamon River at Oakford WY1975-2006
OCT NOV DEC JAN FEB MAR APR MAY JUN JUL AUG SEP
Month
0
1
2
3
4
5
6
Nitra
te-N
Yie
ld (
lbs/a
cre
)
Long Creek WY1994-2008
Friends Creek WY1994-2008
Sangamon River at Monticello WY1994-2008
Sangamon River at Oakford WY1994-2008
Sangamon River at Oakford WY1975-2006
MMGraphFig36.grf
Figure 36. Long-term mean monthly nitrate-N load per acre for the
project and regional stations
Runoff
Load

1830 1850 1870 1890 1910 1930 1950 1970 1990 2010
Year
25
30
35
40
45
50
55
60
65
Pre
cip
ita
tio
n (
inch
es)
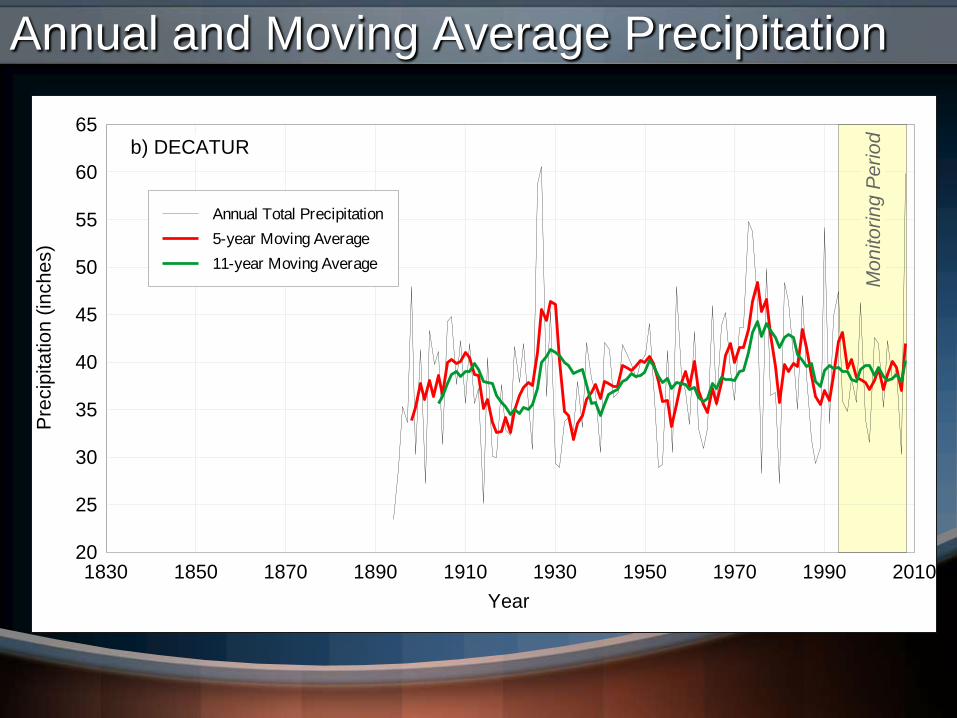
Annual Total Precipitation
5-year Moving Average
11-year Moving Average
a) ILLINOIS
Mo
nito
rin
g P
eri
od
Annual and Moving Average Precipitation
1830 1850 1870 1890 1910 1930 1950 1970 1990 2010
Year
20
25
30
35
40
45
50
55
60
65
Pre
cip
ita
tio
n (
inche
s)
Annual Total Precipitation
5-year Moving Average
11-year Moving Average
Figure TITLE
MMGraphPrecipFigs.grf
b) DECATUR
Mo
nito
rin
g P
eri
od
Annual and Moving Average Precipitation

Discharge, Concentration, & Yield Trends
Significant Trends Based on Kendall-Tau Test (Orange), T-Test (Blue),
and Hotelling-Pabst Test (Grey), for Variable Confidence Levels

Observations
• Monitoring period was wet:
– 8 of 15 years above 30-yr mean annual precipitation
– Monticello 100-yr streamflow record shows 4 of top 11 total annual discharges occurred during monitoring
• Nitrate-N
– Concentrations decreased as drainage area increased
– Loads were disperse around watershed and varied from year to year
• Project stations had no significant trends in discharge and yields
• Based on trends during project and long-term data analysis, possible no significant change in nitrate yields for Lake Decatur watershed since 1975

http://www.isws.illinois.edu/pubdoc/
CR/ISWSCR2010-07.pdf
Thank you!