Embed Size (px)
Citation preview

WATERSHED APPROACH TO TOXICS ASSESSMENT AND RESTORATION
DEPARTMENT OF NATURAL RESOURCES & ENVIRONMENTAL CONTROL
DIVISION OF WATERSHED STEWARDSHIP DIVISION OF WASTE AND HAZARDOUS SUBSTANCES
April 23, 2012 Revised March 27, 2013

2

3
TABLE OF CONTENTS
EXECUTIVE SUMMARY ....................................................................................................... 7
INTRODUCTION ..................................................................................................................... 7
STATEMENT OF NEED ....................................................................................................... 10
OBJECTIVES ......................................................................................................................... 10
EXPECTED BENEFITS......................................................................................................... 11
PROJECT PARTICIPANTS .................................................................................................. 12
ACTION ITEMS ..................................................................................................................... 12
TIMETABLE .......................................................................................................................... 17
BUDGET ................................................................................................................................. 19
REFERENCES ........................................................................................................................ 25
APPENDICES ......................................................................................................................... 35

4
LIST OF TABLES
Table 1. Proposed Schedule for Toxics Monitoring in Impaired Delaware Watersheds .... 14
Table 2. Preliminary Estimates for Ambient Monitoring of Toxics under WATAR .......... 21
Table 3. Site-Related Sampling Costs by Watershed in Support of WATAR ..................... 22
Table 4. Funding Needs to Implement WATAR by Action Item, Program and Calendar Year .................................................................................................................. 24

5
LIST OF FIGURES
Figure 1. Delaware Watersheds and Basins .......................................................................... 31
Figure 2. Christina Basin Pennsylvania, Maryland and Delaware ...................................... 33

6

7
EXECUTIVE SUMMARY This document presents a five (5) year plan to integrate and coordinate DNREC Watershed and Site Investigation and Restoration Programs with the goal of restoring Delaware watersheds impacted by toxic pollutants. The name of the plan is WATAR, which is an acronym for Watershed Approach to Toxics Assessment and Restoration. Key elements of the plan include compilation, assessment, and access to toxics data; assessing the need for, and if appropriate, developing total maximum daily loads (TMDLs) for toxics; preparation of guidance for the assessment and remediation of contaminated sediment through HSCA; site remediation and prioritization; and technology transfer. The total cost to implement the tasks outlined in this plan is approximately $1.57 million dollars to be derived from various funding sources over the course of the project. The cost to implement actual remediation and restoration actions at given sites within specific watersheds is not included in this plan. While the project is proposed to last for five (5) years, the process that will be implemented will become part of the way the Department addresses toxics in the environment for years to come. INTRODUCTION A watershed represents the area drained by a river, stream, or creek — in simplest terms, the area “shedding the water” (sources) to a given water body (sink). Because watersheds are defined by topographic and hydrologic boundaries, they represent the most natural and logical basis for assessing and managing the physical, chemical, and biological resources within the aquatic environment. Beginning in 1995, several programs within the Delaware Department of Natural Resources and Environmental Control (Department) began to utilize a watershed-based approach to assessing and managing Delaware’s environment through the Whole Basin initiative. That work focused on conventional water quality parameters such as dissolved oxygen, temperature, nutrients, and bacteria, as well as improvements to physical habitat. Here we propose to build upon that work by applying the same approach to toxic substances. One hallmark of the watershed approach is to consider the cumulative effect of all pollutant sources within a watershed. This not only provides a broader and more complete picture of conditions within a watershed, but the approach also permits an assessment of the relative importance of the individual sources or groups of sources which contribute to impacts. Having a more complete picture and knowing the relative importance of sources can lead to more effective problem solving. Numerous programs benefitted from the Whole Basin watershed approach and continue to operate utilizing its fundamental principles and practices for assessing and managing the environment. One such program, DNRECs Total Daily Maximum Load (TMDL) program, has been utilizing the watershed approach to address the requirements of the Federal Clean Water Act (CWA) since the late 1990s. Like the Whole Basin initiative, efforts under Delaware’s TMDL program have focused primarily on conventional water quality parameters. Delaware’s experience with toxics TMDLs is far less extensive but noteworthy in that those TMDLs addressed long-standing, major contamination issues in Delaware waters (see text box below for examples of TMDLs for conventional and toxic pollutants in Delaware).

8
In addition to zinc and PCBs, other contaminants that have impacted Delaware surface waters include chlorinated pesticides (e.g., chlordane, DDT, and dieldrin), mercury, and dioxins and furans (DxF). These last three contaminants or contaminant groups, plus PCBs, are classified as persistent, bioaccumulative, and toxic (PBT). PBTs concentrate and accumulate in the aquatic food chain, thereby posing a health risk to people, birds and wildlife that consume the tainted fish and other aquatic life. Indeed, the primary line of evidence that PBTs affect Delaware’s surface waters is fish tissue contaminant data. Those data have been used by the Delaware DNREC and the Delaware Department of Health and Social Services to issue fish consumption advisories (http://www.dnrec.delaware.gov/fw/Fisheries/Pages/Advisories.aspx). Those advisories, which are generally more restrictive in the northern, more industrialized part of the State, are used in turn as a basis for listing the affected waterways on Delaware’s impaired waters list, also referred to as the Clean Water Act Section 303(d) list. This list is updated every two years. Delaware’s most recent list was compiled in 2012. Although it is certainly not good that our waterways are impaired by these contaminants, there is reason for hope. Our best available scientific information suggests that the levels of several PBTs in the environment are decreasing with time (Greene, 2006, 2008a; Church et. al., 2006; Velinsky et. al., 2007, 2010, and 2011). Radiodated sediment cores indicate that the concentration of many PBTs peaked in the late 1970s/early 1980s and that concentrations have steadily decreased ever since. Furthermore, Delaware has been able to make several of the fish advisories less restrictive over the last half decade, signaling tangible evidence that conditions are trending in a positive direction. We believe these improvements are the result of a combination of broad-reaching statutory and regulatory bans and phase outs, source controls, site remediation, and natural attenuation. The fact remains, however, that these contaminants continue to persist in Delaware’s environment and that additional work in needed to hasten improvement.
Noteworthy examples of the watershed approach for conventional pollutants include nutrient TMDLs for the Delaware Inland Bays, the Murderkill watershed, and the Saint Jones watershed (DNREC 1998, 2005, 2006). The Department has also participated in interstate TMDLs that also took a watershed approach for conventional pollutants. Examples of these include the low and high flow TMDLs for nutrients and oxygen-demanding substances in the tri-state (PA, DE, and MD) Christina Basin (EPA 2006a and 2006b).
With regard to toxics, the Department has established TMDLs for zinc in the Red and White Clay Creeks (DNREC 1999a, 1999b, and 2008). The Department also played a critical role in the development of the TMDL for polychlorinated biphenyls (PCBs) for the tidal Delaware River (EPA 2003) and the TMDL for PCBs for the Delaware Bay (EPA 2006c). Those TMDLs, developed jointly by the Delaware River Basin Commission (DRBC) and Basin States and formally established by the EPA, are arguably among the most scientifically robust in the United States, and are highlighted in the EPA publication “Integrating Water and Waste Programs to Restore Watersheds (EPA 2007).

9
To provide focus for our efforts, it is instructive to consider watersheds appearing on Delaware’s 2012 303(d) list for toxics (DNREC, 2013). They include: Delaware River (Zone 5), Delaware Bay (Zone 6), Christina River, Brandywine Creek, Red Clay Creek, White Clay Creek, Shellpot Creek, Army Creek, Red Lion Creek, the Chesapeake & Delaware Canal, the Appoquinimink River, the Saint Jones River, Slaughter Creek, Prime Hook Creek, and Waples Pond. All of the listed waters are part of the Delaware Estuary proper or are tributaries that drain to the Delaware Estuary. Further, in nearly every case, the primary risk driver and contaminant of concern is PCBs. This is based upon elevated concentrations in edible fish. Based on a determination by the EPA, tributaries that drain to the Delaware Estuary were considered during the development of the existing PCB TMDLs for the mainstem Delaware Estuary (EPA 2003 and 2006). Hence, individual PCB TMDLs for those tributaries may not be necessary. EPA has suggested, and DNREC agrees, that a decision to develop individual TMDLs for these tributaries can be informed by considering existing data, trends, and management programs which are providing for controls. Few of the tributaries have up-to-date, comprehensive data on PCBs. We propose to fill that gap through implementation of this work plan. The collection of new data will permit comparison to older data and hence will provide for trend assessment. Finally, there are management programs in place and new initiatives being implemented which are focusing heavily on the assessment and control of PCBs in Delaware. The success of some of these programs is well documented, while others need broader public circulation. One noteworthy and highly relevant management program addressing PCBs in Delaware waters is the development of the Stage 2 PCB TMDL for the Delaware Estuary. That TMDL is being cooperatively developed by the DRBC, EPA, and the bordering States. It will use a uniform PCB criterion derived by the DRBC and DNREC using estuary-specific bioaccumulation factors and estuary-specific fish consumption rates (Fikslin and Greene, 2013). It will also provide specific allocations for the tributaries draining to the Estuary. The existing PCB TMDLs do not provide watershed-specific allocations but rather aggregate those loads among tributaries. The new approach will provide tighter geographic focus and a better way to track improvements going forward. In support of the existing Stage 1 PCB TMDLs and the planned Stage 2 PCB TMDL for the Delaware Estuary, DNREC is proposing, through this work plan, to compile existing PCB data for the above-listed watersheds and to collect new, comprehensive, state-of-the-science ambient data in order to determine the status and trends in PCB contamination in the subject watersheds. The existing and new data, along with information on sources and programs in place to address them, will be used to update future 303(d) lists as appropriate. This may lead to the conclusion that separate PCB TMDLs are needed for individual watersheds in order to effectively control remaining sources. In addition to PCBs, chlorinated pesticides, dioxins and furans, and mercury also contribute to the fish contamination problem for several of the watersheds noted above. Hence, those contaminants also appear on Delaware’s 303(d) list and may therefore also need TMDLs. Before that conclusion is reached, however, we are proposing to examine the current status and trends for those pollutants. Radio-dated sediment cores, historic fish tissue data, and national trends all indicate that concentrations of these additional pollutants are falling. Further, the risk associated with these pollutants is generally marginal compared to PCBs. Hence, given the

10
lower risk and expected trend, these pollutants may no longer be contaminants of concern worthy of continued listing and TMDL development. The only way to find out is to collect new data, as proposed. STATEMENT OF NEED The Department has been successfully assessing ambient conditions in the State’s watersheds and has been remediating hazardous substances at individual sites for over two decades. The Department’s regulatory programs have met their primary charge of dealing with toxics by focusing on evaluating, maintaining and controlling contaminants of concern within the impacted site’s boundaries or areas proximal to the contaminant source. The risk of exposure to hazardous substances has been significantly reduced or eliminated by remedial actions implemented at sites across the State. Therefore, the Department’s efforts continue to contribute to improvements to human health, welfare and environment in upland areas, and to an extent in the waterways of the First State. Still more can be done at Sites and in waterways utilizing the currently exist within the Department’s well-established programs. Just as traditional water resource management has focused heavily on individual point source discharges, traditional hazardous substance management programs have focused on remediating individual sites. Both programs individually fall short of acting on the broader cumulative effect of multiple intermingling sources that discharge to water bodies. Therefore, toxics continue to be released from upland source sites and impact surface water, sediment and biota within the State’s waterways. What the Department is lacking is a more rigorous and quantitative accounting of the links between the contamination in the State’s waterways, transport pathways, and the source sites within a watershed. Quantitatively linking source sites with waterway receptors for toxics is not a trivial exercise. The evolution of existing programs towards this approach is essential to address remaining toxics problems in the State in a timely manner. The approach will require a refocus of some program priorities, the development of tools that will provide information useful for multiple regulatory programs and continued monitoring of the impacts. The goal of the WATAR approach is to remediate sources along with historically impacted waterways using a prioritized stepwise plan in order to achieve fishable, swimmable and eventually potable water in all of Delaware’s waterways. OBJECTIVES This initiative, a Watershed Approach to Toxic Assessment and Restoration (WATAR), intends to rekindle the watershed-based approach that once flourished within the Department but with a specific focus on toxics. While this effort recognizes that there are current limitations to the levels to which programs can become involved, the linking of some key programs will result in significant improvements to the Department’s ability to assess and restore areas plagued by unacceptable and unaddressed levels of contamination.

11
Key objectives of this initiative will be to:
• Formalize the Watershed Approach to Toxic Assessment and Restoration through implementation of this work plan;
• Compile existing toxics data for the State’s surface waters, sediments, and biota with the intent of providing access to Department staff and the public;
• Create a mechanism to maintain the data in “a clearing house” in order to continue use for remedial decision making and prioritization;
• Acquire new, comprehensive data on the concentrations of PBTs in priority watersheds; • Assess the need for, and if appropriate, establish TMDLs for toxic substances in
accordance with the State’s CWA Section 303(d) list; • Develop guidance for the assessment and management of contaminated sediments in the
State under HSCA, which incorporates modern principles of bioavailability; • Identify high priority remediation projects that have the potential to significantly address
toxics problems in State waterways; • Facilitate technology transfer from experienced senior staff to junior staff within the
Department to allow the WATAR initiative to become a well-established and permanent part of the way the Department does business into the future.
EXPECTED BENEFITS This project is expected to yield numerous benefits to the public, the Department, water purveyors, and businesses. Benefits to the public will include better access and understanding of toxics in the environment, a cleaner environment, lower exposure to toxic substances, and better health. Benefits to the Department will include greater efficiency in locating and processing environmental data and data requests, a staff with a broader perspective and expanded skills, and the ability to make informed decisions on permits and clean-up plans. Benefits to water purveyors will include cleaner surface source water and improved customer satisfaction. Businesses that are likely to benefit from WATAR include ecotourism, the fishing and boating sector, and those with processes that require high purity water.
Recent efforts that informally used this approach to meet multiple regulatory goals include: NVF groundwater remediation; Christina Basin PCB Site Loading Report; Christina Basin Sediment Coring Report; PCB cleanups at Diamond State Salvage, Howard Street, Former Carney Harris, and Meco Drive sites; Shellpot Creek Iron Rich evaluation and control; Mirror Lake restoration and remediation project; Burton Island Ash Landfill evaluation; Little Mill Creek Flood Abatement Project; City of Wilmington/NCC PCB PMP trackdown study; and ongoing work at the AMTRAK Wilmington Shops.

12
Additional specific benefits to the Department will include:
• Completion of TMDLs for toxics as necessary and justified by new, comprehensive ambient and site related data;
• An increase in regulatory scope to assess and remediate legacy contaminants in sediments within the State’s waterways;
• Completion of the link between contaminant source and sink with the intent of using this as a compelling argument to require remediation of source areas on an accelerated schedule;
• A broader approach to the evaluation of contaminant sources, transport pathways, and receptors with the intent on implementing management actions to mitigate and/or eliminate the levels of toxins at individual sites and the levels of toxins that individual sites release to the State’s waterways to acceptable Department and EPA standards;
• A mechanism to justifiably and transparently implement restoration actions (including Natural Resource Damage restoration) based upon site prioritization that considers the level of threat to public health, welfare and the environment and the expected resulting benefit to its watershed;
• Incorporation of state-of-the-art remediation and restoration technologies and methods that provide for long-term, cost effective solutions (e.g. sediment stabilization, carbon sequestration, etc.);
• Identification and engagement of key programs and/or personnel from within and outside the Department that are needed to define success;
• A shorter timeframe for removal of fish advisories throughout the State, which will serve as a positive and highly visible indicator to the public of successful Department efforts.
PROJECT PARTICIPANTS The primary participants in this project include the Division of Watershed Stewardship’s Watershed Assessment & Management Section and the Division of Waste & Hazardous Substance’s Site Investigation and Restoration Section. Through the distribution and implementation of this work plan, we are soliciting the interest and participation of other groups within DNREC. There is no requirement or deadline for participation. Even without active participation, we believe that other groups within DNREC have the potential to benefit from this collaboration. ACTION ITEMS Specific actions that are proposed under this work plan are described below.
1. Compile Existing Toxics Data: Readily available and existing toxics data for surface water, sediment, and biota will be assembled and entered into the DNREC-SIRS Environmental Quality Information System (EQuIS) database. Data sources to be considered include: DNREC, EPA, DRBC, NOAA, USFWS, USGS, USCOE, USCG, USDA, DDA, UD, DGS, and County and Municipal government. Primary data sources

13
within DNREC will include: SIRS, Watershed Assessment Section, Solid and Hazardous Waste Management Section, NPDES Program, the Delaware Emergency Planning and Community Right-to-Know Program, and others. Data will first be compiled for toxics appearing on Delaware’s 303(d) list for the affected watersheds. Data will be organized by watershed name, waterbody ID, and segment name per Delaware’s 303(d) list. As a related activity, a catalogue of reports containing the toxics data and any associated technical evaluations of the data will also be produced. In a related task, SIRS has already coordinated with the UD-WRA and the DNREC –WAS as they develop a Delaware Watershed Website that includes environmentally relevant information for each watershed in the State. SIRS has completed contaminant narratives for each of the basins and watersheds. This narrative includes a compilation of SIRS sites in the State organized by watershed, contaminants that drove the 303(d) listing, as well as fish advisories for each watershed (see http://www.delawarewatersheds.org/)
The ultimate goal is to develop a web-based interactive mapping tool that will link to the EQuIS database of sediment, surface water and biota toxics data, associated reports, and assessments, by stream reach. This tool will be available for DNREC staff and the public and can function as a clearinghouse of data and information for multi-scale analysis. DNREC will choose a pilot watershed to develop the web-based tool. Depending upon the success of the pilot, funding will be sought to carry the effort forward for other watersheds.
2. Monitoring to Assess the Need for Toxics TMDLs or Other Management Actions: The foundation of meaningful pollution control is high quality, up-to-date field data. Such data serve several purposes, including: a) characterization of current conditions; b) characterization of changes since previous sampling; c) understanding spatial patterns of contamination; d) understanding partitioning behavior and bioavailability; e) evaluating relationships between sources and in-stream response; f) filling critical data gaps; and g) calibrating/validating water quality models. The WATAR team proposes to collect data on the current concentrations of PCBs, DxF, organochlorine pesticides, and mercury (Hg) in water, sediment, and fish in impaired waters appearing on Delaware’s 2012 CWA 303(d) list over the next five years. In certain waters, additional toxic pollutants will also be considered on a case-by-case basis (e.g., chlorobenzenes in Red Lion Creek and PAHs in the Saint Jones watershed). Table 1 that follows lists the watersheds, contaminants, and media to be monitored by calendar year and fiscal year during the period beginning in 2012 and ending in 2017.

14
Table 1. Proposed Schedule for Toxics Monitoring in Impaired Delaware Watersheds
Watershed Contaminant(s) Media Calendar Year
Fiscal Year
Del Est. Zone 5 Hg Water, sediment, biota
2012 2013
Del Est. Zones 5&6 PCBs, DxF, OC Pest, Hg Biota only (striped bass)
2012 2013
Red Lion Creek
PCBs, DxF, OC Pest, Hg, Chlorobenzenes
Water, sediment, biota
2013
2013
C&D Canal PCBs, DxF, OC Pest, Hg, Chlorobenzenes, PAHs
Water, sediment, biota
2013 2013
Saint Jones PCBs, DxF, OC Pest, Hg, PAHs
Water, sediment, biota
2013 2014
Army Creek PCBs, DxF, OC Pest, Hg, PAHs
Water, sediment, biota
2014 2014
Appoquinimink PCBs, DxF, OC Pest, Hg, PAHs
Water, sediment, biota
2014 2015
Shellpot Creek PCBs, DxF, OC Pest, Hg, PAHs
Water, sediment, biota
2015 2015
Christina Basin PCBs, DxF, OC Pest, Hg, PAHs
Water, sediment, biota
2015 2016
Slaughter Creek PCBs, DxF, OC Pest, Hg Water, sediment, biota
2016 2016
Waples Pond & Primehook Creek
Hg Water, sediment, biota
2016 2017
Saint Jones Hg (if needed) Water, sediment, biota
2017 2017
Del Est. Zones 5&6 PCBs, DxF, OC Pest, Hg Biota only (striped bass)
2017 2017
As shown in the table above, mercury monitoring was performed in Zone 5 of the Delaware Estuary during 2012. Although that monitoring was initiated prior to the official start of the WATAR program, it is worth discussing here because it is a prime example of the science-driven, collaborative approach embraced by WATAR. Furthermore, that work will have a direct impact on the Zone 5 303(d) listing decision for mercury during the 2014 listing cycle. Mercury contributes to the fish consumption advisory for Zone 5, primarily based on concentrations detected in striped bass (Greene, 2011a). In an effort to gain further insight into the situation, an international expert on mercury, Dr. Robert Mason from the University of Connecticut, was contracted to investigate the sources, cycling and fate of methylmercury in Zone 5 (Mason, 2011). Sampling was conducted at multiple stations within Zone 5 and during multiple seasons. Dr. Celia Chen from Dartmouth University, another mercury expert, piggybacked on the Mason study by sampling lower trophic level aquatic life in the Delaware Estuary during the summer 2012 sampling campaign. That work was funded by the Federal Superfund

15
Basic Research Program. The UCONN and Dartmouth work was further supplemented by mercury analyses performed by DNREC on adult striped bass and mercury analyses performed by the DRBC on adult channel catfish and white perch from the Estuary. All of the mercury data just mentioned is expected to be available by the summer of 2013. Collectively, these data should place Delaware in an excellent position to assess whether mercury should be retained on its 303(d) list for Zone 5 of the Delaware Estuary as part of its 2014 303(d) listing cycle. Additional work performed by Delaware during 2012 included the analysis of striped bass samples from Zones 5 and 6 of the Delaware Estuary for PCBs, DxF, and OC pesticides. That work is part of the longest running monitoring program for organic contaminants in striped bass in the Delaware Estuary. The PCB data collected on the 2012 striped bass samples helps to support implementation of the existing PCB TMDL for the Delaware Estuary and sets the stage for the Stage 2 PCB TMDL. The DxF data and OC pesticide data, in conjunction with other available information on these contaminants, will be used to affirm or remove these contaminants from Delaware’s 2014 303(d) list. For CY2013, the WATAR team intends to collect comprehensive data on organic contaminants in water, sediment, and biota from the Red Lion Creek watershed, the Chesapeake & Delaware Canal watershed, and the Saint Jones watershed. Biota samples collected from all three of these watersheds will also be analyzed for mercury to maximize the use of the biota samples. To spread costs over time, the Red Lion Creek and C&D Canal sampling will be conducted in FY2013, while the Saint Jones sampling will be conducted in FY2014. A brief description of each of these three watersheds and the nature of toxics impairments appears in Appendix 1 of this work plan. Appendix 2 presents the tentative locations, types of samples, parameters, and sample matrices to be monitored in these three watersheds under WATAR. Because of the unique nature of the monitoring to be conducted, a project-specific Quality Assurance Project Plan (QAPP) will be prepared to guide the work. Other toxics-related monitoring to be implemented during CY2013 includes an enhancement to Delaware’s Surface Water Quality Monitoring Program (SWQMP) for divalent metals. The enhancement will include the addition of parameters needed to run the Biotic Ligand Model (BLM). The additional parameters primarily include major cations, major anions, and alkalinity. The use of this state-of-the-science model will improve predictions of potential aquatic life impacts associated with divalent metals and will become part of a more transparent protocol for interpreting metals data under Delaware’s SWQMP. A decision concerning the locations and frequency of this enhanced monitoring will be made by July 1, 2013. For CY2014, the WATAR team intends to collect toxics data in the Army Creek and Appoquinimink watersheds. Again to spread costs, the Army Creek sampling will be conducted during the end of FY2014, while the Appoquinimink sampling will be conducted during the first half of FY2015. In CY2015, we propose to collect toxics data from the Shellpot Creek watershed and the Christina Basin (includes the Christina

16
watershed, Brandywine Creek watershed, White Clay Creek watershed, Red Clay Creek watershed, and Little Mill Creek watershed). The Shellpot will be sampled during the last half of FY2015 and the Christina Basin will be sampled during the first half of FY2016. In CY2016, we plan to investigate toxics in Slaughter Creek (part of the Cedar Creek watershed), as well as Waples Pond and Primehook Creek (both in the Broadkill River watershed). Slaughter Creek will be sampled during FY2016 and Waples/Primehook Creek will be sampled during FY2017. Finally, if mercury concentrations in fish from the Saint Jones watershed remain elevated (based on 2013 monitoring), we will do more extensive mercury sampling in the Saint Jones watershed in 2017. Regardless of conditions, we will cycle back to the Delaware Estuary mainstem in 2017 to collect updated information on toxics in striped bass. Descriptions of the watersheds to be sampled between 2014 and 2017 appear in Appendix 1. Figures 1 and 2 also show where these watersheds are located within the State. Sampling stations and parameters will be finalized prior to each field season. This information will be incorporated into annual QAPP updates, as will any necessary adjustments based upon prior years’ experience.
3. Sediment Quality Guidance: There has been growing awareness of the magnitude of the sediment contamination problem in the U.S. and the challenge this represents to restoring the integrity of the nation’s waters (Bridges, et.al. 2011). Many toxic pollutants, particularly PBTs, strongly partition to sediments where they can serve as an on-going source or long-term sink of contamination in a watershed. Assessing the consequences of contaminants in sediments has been hampered by the lack of an overall evaluation framework, including sediment quality guidelines that account for site-specific bioavailability and bioaccumulation. Currently, the DNREC Surface Water Quality Standards (June 11, 2011) are limited to general narrative criteria to protect surface waters from contaminants that may be present in sediments. HSCA regulations, although broadly applicable to sediments, lack specific reference to sediment sample collection methods, data quality requirements, and data interpretation. DNREC Watershed Assessment and SIRS personnel are actively involved in utilizing advanced, modern techniques for evaluating the risks posed by contaminated sediments (e.g., Greene, 2010a; Ghosh and Greene, 2012; Burton and Greene, 2013). Although the science of sediment contamination will continue to evolve, the time has come to develop and implement Delaware-specific guidance which reflects the current state of practice in sample collection, assessment, and remediation. We propose to do this under the umbrella of HSCA over the next three years (2013 through 2015). We have taken the first administrative step in this process by commissioning a review of State sediment guidance that incorporates bioavailability concepts (Louis Berger, 2013).
4. Tech Transfer: The science of toxic contamination is highly specialized requiring detailed knowledge of physical/chemical property estimation, advanced sampling and laboratory methods, chemical fingerprinting, fate and transport mass balance modeling, plus traditional and emerging treatment and control technologies. DNREC staff acquire the knowledge and skills through various means, including: participation in training

17
seminars/webinars; enrollment in an accredited degree program; attendance at State, regional, and national conferences; participation in committees and workgroups such as the ITRC, ASTSWMO, and the DRBC Toxics Advisory Committee; and finally, through one-on-one or small group interactions among colleagues. Mentoring between less experienced and more experienced staff members is an example of this final means of tech transfer. All of the above approaches of tech transfer are being employed by the core group of staff members involved in advancing WATAR. We propose to continue, and actually expand the approach as interest and participation in WATAR grows with time. In short, we believe that tech transfer through WATAR represents a great opportunity for staff to grow and acquire the knowledge, skills and ability needed to understand and effectively address toxic contamination in Delaware’s watersheds and communities.
5. Public Awareness/Partnerships: An important part of this initiative will be outreach to varied audiences across the State. There are many non-governmental agencies with goals similar to the Department that may want to support the WATAR approach. It will be important to engage these groups early and make them part the Department’s solution. As progress is made in specific watersheds and basins, the Department will need to find ways to supplement funding for additional sampling and analysis and monitoring of effectiveness.
TIMETABLE Five (5) years are required to fully implement this work plan. Key activities by year are listed below.
• 2012 � Secure buy-in and support by senior DNREC management of the WATAR
approach � Begin compiling existing toxics data and associated information into EQuIS � Measure status of PCB concentrations in striped bass from the Delaware Estuary
to assess progress on Delaware Estuary PCB TMDLs � Continue methylmercury study in the Delaware Estuary � Begin researching sediment guidance that exist in other States in the US,
especially those that incorporate bioavailability considerations � Complete the Meco Drive ditch remediation and Little Mill Creek flood risk
mitigation projects (supports Delaware Estuary PCB TMDL implementation) � Provide technical assistance to the City of Wilmington and New Castle County
Special Serves on the City of Wilmington’s PCB trackback monitoring � Advance the Mirror Lake contaminant sequestration project through the design
and permitting stages (supports Delaware Estuary PCB TMDL implementation) � Foster tech transfer � Progress Report and Accounting for items listed above

18
• 2013 � Create WATAR “road show” for presentations to potential partner groups � Continue data compilation � Prepare a project-specific QAPP for 2013 toxics monitoring � Complete methylmercury study of the Delaware Estuary and compile additional
mercury data for Zone 5 � Perform toxics monitoring in the Red Lion Creek, C&D Canal, and Saint Jones
watersheds in accordance with the QAPP � Enhance routine monitoring of divalent metals in Delaware surface water to
include parameters needed to run the Biotic Ligand Model � Draft HSCA Sediment Guidance � Define and implement SIRS Brownfield policy to require high resolution
sediment sampling at sites along waterways (reimbursable through HSCA fund � Continue to provide technical assistance to the City of Wilmington and New
Castle County Special Services on the City’s PCB trackback � Begin development of pilot watershed web-based mapping utility � Proceed to construction on the Mirror Lake remediation/restoration project � Continue tech transfer � Progress Report and Accounting for items listed above
• 2014 � Prioritize sites in pilot watershed for remediation � Continue data compilation � Update/clarify 303(d) listing protocols for toxics in advance of 2014 listing
decisions. Use protocols and readily available and existing toxics data to update list of watersheds impaired by toxics.
� Update QAPP for 2014 toxics monitoring � Perform toxics monitoring in the Appoquinimink and Army Creek watersheds in
accordance with the QAPP � Conduct public workshop(s) on draft HSCA Sediment Guidance and prepare
summary of public comments received � Continue to provide technical assistance to the City of Wilmington and New
Castle County Special Services on the City’s PCB trackback � Continue development of web-based mapping utility � Continue tech transfer � Progress Report and Accounting for items listed above
• 2015 � Continue data compilation � Update QAPP for 2015 toxics monitoring � Perform toxics monitoring in the Christina Basin and Shellpot watershed in
accordance with the QAPP � Continue to provide technical assistance to the City of Wilmington and New
Castle County Special Services on the City’s PCB trackback

19
� Finalize HSCA Sediment Guidance � Roll out pilot web-based mapping utility � Continue tech transfer � Progress Report and Accounting for items listed above
• 2016
� Continue data compilation � Update QAPP for 2016 toxics monitoring � Use existing and readily available toxics data to update list of watersheds
impaired by toxics � Perform toxics monitoring for Slaughter Creek, Waples Pond, and Prime Hook
Creek in accordance with the QAPP. If Saint Jones fish tissue mercury concentrations remain elevated (based on 2013 samples), perform more extensive, specialized mercury sampling in the Saint Jones watershed. This will be incorporated into the QAPP as necessary.
� Continue tech transfer � Progress Report and Accounting for items listed above
• 2017 � Continue data compilation � Update QAPP for 2017 toxics monitoring � Perform Delaware Estuary striped bass sampling to assess progress on Delaware
Estuary PCB TMDL � Assess overall status of WATAR program and develop a work plan to carry
forward � Continue tech transfer � Progress Report and Accounting for items listed above
BUDGET The total cost to implement this plan is $1.57 million dollars to be derived from various funding sources over the course of the project. Funds needed to fully implement this work plan are detailed below and are organized based upon the major action areas.
1. Funding to Compile Existing Toxics Data:
A large body of data currently exists in varying degrees of quality and from varied multiple sources. The process of determining the value of the data, relevant analysis and reports then placing it into an organized accessible database is a multi-year task that would consume the time of a full time employee. SIRS intends to hire a “limited term employee” to compile the existing data into the established EQuIS (or equivalent) database. This limited term employee would work on WATAR data compilation as an

20
employee at SIRS. This funding structure has already been approved for 2012 with money routed through HSCA. Two more years of approvals would be sought as needed. Half of the employee’s time would be committed to WATAR tasks so the funding need would be around $17, 000 for each year for three years Therefore, total =$54,000.
In order to properly serve the data that will be compiled we propose hiring an outside web design service or to fund UD or other State agency to provide web design service to develop a web-based mapping system pilot. The utility would be used by DNREC first during testing but the intent is to eventually release it to the general public for use and analysis across the state. Estimated cost: $10,000/year beginning in 2012 and ending in 2017. Therefore, total = $50,000. Over the 5 years of the plan the total cost for compilation of existing toxics data is $104,000.
2. Funding to Monitor Toxics on a Watershed Basis:
To support the WATAR initiative, we propose to perform monitoring of toxics in water, sediment, fish tissue and upland areas on a watershed-scale basis during the period of 2013 through 2017. Final costs are still being negotiated with the laboratories and will not be finalized until purchase orders are executed. The following preliminary estimates are provided for planning purposes and include labor, laboratory services, and miscellaneous equipment and supplies. Further details concerning the tentative locations to be monitored, the types of samples to be collected, and the parameters to be analyzed by watershed can be found in Appendix 2 of this work plan. Again, a Quality Assurance Project Plan (QAPP) will be developed to guide the overall conduct of the WATAR monitoring.

21
Table 2. Preliminary Estimates for Ambient Monitoring of Toxics under WATAR
Watershed Sampling/Analysis Cost Calendar Year Fiscal Year
Red Lion Creek Watershed $98,781 2013 2013
C&D Canal Watershed $144,425 2013 2013
Saint Jones Watershed $185,803 2013 2014
Army Creek Watershed $98,781 2014 2014
Appoquinimink Watershed $185,803 2014 2015
Shellpot Creek Watershed $98,781 2015 2015
Christina Basin $200,000 2015 2016
Slaughter Creek $50,000 2016 2016
Waples Pond/Primehook Mercury
$34,000 2016 2017
Saint Jones Watershed Mercury
$38,000 2017 2017
Delaware Estuary $50,000 2017 2017
3. SIRS Supplemental Sediment Sampling
SIRS proposes to collect additional sediment samples in the areas of HSCA sites within each watershed impaired by toxics. Knowing that the vast majority of sediment samples historically collected during Remedial Investigations or Brownfield Investigations under HSCA (if collected at all) are only analyzed for bulk sediment concentrations, it is anticipated that numerous data quantity and certainly data quality gaps will exist within each watershed. These data quantity and quality gaps associated with HSCA sites will become very apparent during the database development work highlighted in Item #1 above and, along with institutional knowledge about HSCA site related activities, will direct the need for additional sample collection. Aside from filling data gaps as described, other benefits of collecting HSCA site related samples in conjunction with the watershed samples are improvement of the cumulative sediment dataset, and most importantly the potential identification of links to sources of PBT contaminants within a watershed. Once potential sources are identified, SIRS will be able to more effectively engage responsible parties and require sediment cleanup
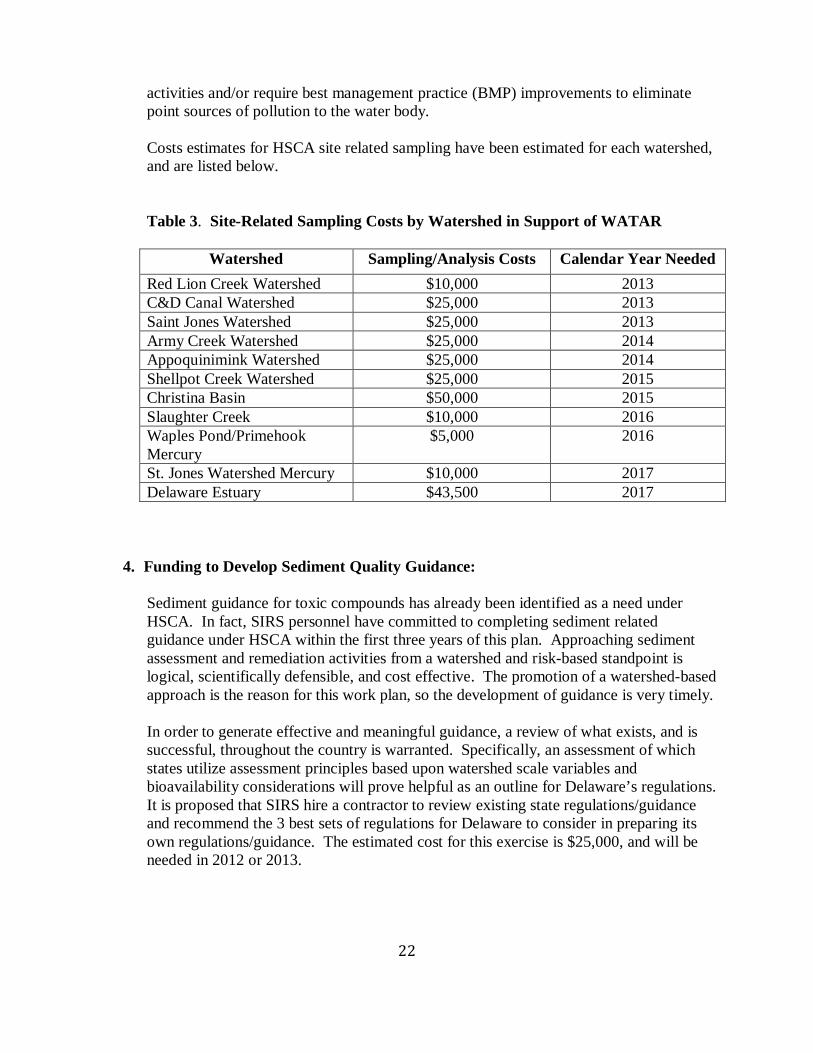
22
activities and/or require best management practice (BMP) improvements to eliminate point sources of pollution to the water body. Costs estimates for HSCA site related sampling have been estimated for each watershed, and are listed below. Table 3. Site-Related Sampling Costs by Watershed in Support of WATAR
Watershed Sampling/Analysis Costs Calendar Year Needed
Red Lion Creek Watershed $10,000 2013 C&D Canal Watershed $25,000 2013 Saint Jones Watershed $25,000 2013 Army Creek Watershed $25,000 2014 Appoquinimink Watershed $25,000 2014 Shellpot Creek Watershed $25,000 2015 Christina Basin $50,000 2015 Slaughter Creek $10,000 2016 Waples Pond/Primehook Mercury
$5,000 2016
St. Jones Watershed Mercury $10,000 2017 Delaware Estuary $43,500 2017
4. Funding to Develop Sediment Quality Guidance: Sediment guidance for toxic compounds has already been identified as a need under HSCA. In fact, SIRS personnel have committed to completing sediment related guidance under HSCA within the first three years of this plan. Approaching sediment assessment and remediation activities from a watershed and risk-based standpoint is logical, scientifically defensible, and cost effective. The promotion of a watershed-based approach is the reason for this work plan, so the development of guidance is very timely. In order to generate effective and meaningful guidance, a review of what exists, and is successful, throughout the country is warranted. Specifically, an assessment of which states utilize assessment principles based upon watershed scale variables and bioavailability considerations will prove helpful as an outline for Delaware’s regulations. It is proposed that SIRS hire a contractor to review existing state regulations/guidance and recommend the 3 best sets of regulations for Delaware to consider in preparing its own regulations/guidance. The estimated cost for this exercise is $25,000, and will be needed in 2012 or 2013.

23
5. Funding for Tech Transfer:
Many of the tasks associated with tech transfer do not require a separate allocation of funding beyond existing programmatic funds since knowledge is often transferred though direct project work. This method is effective for the staff members involved on those projects but falls short of being able to create a global change in knowledge base and programmatic effectiveness within DNREC and other agencies tasked with addressing toxics in Delaware watersheds. Funding for tech transfer would be for formalized training through participation in local seminar series often hosted by individual programs in DNREC, training courses in methods to evaluate and address toxics as well as continued participation in regional and national workgroups. Beginning in 2013, the WATAR “roadshow” will reach out to a broader audience for the purposes of peer review and knowledge sharing. This funding would also be used for education by staff members that have expressed interest and commitment to being an active part of the WATAR. The funding request is $20,000 / year for three years for the purposes of travel, conference registration and, presentation materials. Therefore the total = $60, 000.
6. Funding for Public Awareness/Partnerships Public awareness and partnerships are an important part of the WATAR because communities and businesses will be given the tools to understand what is going on in their area. Also, public outreach will increase the positive pressure from the communities to encourage dischargers to lessen their impacts. For example, DNREC has partnered with the City of Wilmington, New Castle County, the DRBC and other organizations in order to provide technical assistance for the PCB trackback effort being implemented as part of the City of Wilmington’s PCB Pollutant Minimization Plan (City of Wilmington, 2010). As part of public awareness, WATAR should be presented at Envirothon and the DE State Fair on an annual basis, with a focus on different watersheds each year. It will be possible to create kits for each watershed that can easily be distributed to communities as well as educators. The funding request is $10,000 / year for five years for educating and partnering with dischargers to decrease their impacts, creating watershed specific kits for distribution, and being involved with Envirothon and the DE State Fair. The total will be $50,000.
The combined funding needs (from Items 1 thorough 6 above) are summarized in Table 4 below.

24
Table 4. Funding Needs to Implement WATAR by Action Item, Program and Calendar Year Action 2012 2013 2014 2015 2016 2017 Compile Data
WAS SIRS
$27,000
$27,000
$27,000
$10,000
$10,000 Toxics Monitoring
WAS SIRS
$35,000
$417,779 $99,780
$256,879 $62,705
$256,879 $116,902
$77,000 $15,000
$38,000 $10,000
Sediment Guidance
WAS SIRS
$25,000
Tech Transfer WAS SIRS
$20,000
$20,000
$20,000
Public Outreach WAS SIRS
$10,000
$10,000
$10,000
$10,000
$10,000 Totals
$60,000
$574,559
$376,584
$430,781
$112,000
$68,000
The total financial need for the WATAR program for the period CY2013 through CY2017 is $1,569,924, or roughly $1.57M. This does not include CY2012 which has already past. Note that the greatest need exists in the first three calendar years, with a particularly large need in CY2013. This front end demand will be spread out over fiscal years to dampen the initial annual peak. Also note that the total expected contribution from the Watershed Assessment Section is approximately $1M, while that from the Site Investigation and Restoration Section is approximately $0.57M, again not counting CY2012.

25
REFERENCES Bridges, T.S., S.C. Nadeau, and M.C. McCulloch. 2011. Accelerating Progress at Contaminated Sediment Sites: Moving from Guidance to Practice. Integ. Environ. Assess. Manag. 8(2): 331-338. Brightfields. 2009. PCB Mass Loading from Hazardous Substance Release Sites to Surface Waters of the Christina River Basin. Report prepared by Brightfields, Inc. for the Delaware Department of Natural Resources and Environmental Control, Dover, DE. Burton, W. and R. Greene. 2013. Natural Resource Damage Assessment Baseline Study, Delaware Estuary Polycyclic Aromatic Hydrocarbon (PAH) Pilot Study. Report prepared for Delaware Department of Natural Resources and Environmental Control. Berger. 2013. Review of State Sediment Guidance Incorporating Bioavailability Concepts. Report prepared by The Louis Group, Inc., Morristown, NJ, for the Delaware Department of Natural Resources and Environmental Control, Site Investigation and Restoration Section, New Castle, DE. Church, T.M., C.K. Sommerfield, D.J. Velinsky, D. Point, C. Benoit, D. Amouroux, D. Plaa, and O.F.X. Donard. 2006. Marsh sediments as records of sedimentation, eutrophication and metal pollution in the urban Delaware Estuary. Mar. Chem. 102: 72-95. City of Wilmington. 2010. Pollution Minimization Plan (PMP) for Polychlorinated Biphenyls, City of Wilmington Wastewater Treatment Plant NPDES Permit Number DE-0020320, July 2010. City of Wilmington Department of Public Works, Wilmington, DE. DNREC. 1998. Total Maximum Daily Load (TMDL) Analysis for Indian River, Indian River Bay, and Rehoboth Bay, Delaware, December, 1998. Delaware Department of Natural Resources and Environmental Control, Dover, DE. DNREC. 1999a. Total Maximum Daily Load (TMDL) for Zinc in the Red Clay Creek New Castle County, Delaware, Technical Background and Basis Document, August 1, 1999. Delaware Department of Natural Resources and Environmental Control, Dover, DE. DNREC. 1999b. Total Maximum Daily Load (TMDL) for Zinc in the White Clay Creek New Castle County, Delaware, Technical Background and Basis Document, August 1, 1999. Delaware Department of Natural Resources and Environmental Control, Dover, DE. DNREC, 2004. State of Delaware Surface Water Quality Standards. Delaware Department of Natural Resources and Environmental Control, Dover, DE. DNREC. 2005. Technical Analysis for Amendment of the 2001 Murderkill River TMDLs, March 1, 2005. Delaware Department of Natural Resources and Environmental Control, Dover, DE.

26
DNREC. 2006. St. Jones River Watershed Proposed TMDLs, August 2006. Delaware Department of Natural Resources and Environmental Control, Dover, DE. DNREC. 2008. Amended Total Maximum Daily Load (TMDL) for Zinc in the Red Clay Creek New Castle County, Delaware, Technical Background and Basis Document, September 15, 2008. Delaware Department of Natural Resources and Environmental Control, Dover, DE. DNREC. 2010. Methodology for Estimating the Mass Loading of Zinc from the NVF Yorklyn Site to the Red Clay Creek based on Upstream/Downstream Flow and Concentration Data Pairs. Delaware Department of Natural Resources and Environmental Control, Dover, DE. DNREC. 2012a. 2012 Delaware Fishing Guide. Delaware Department of Natural Resources and Environmental Control, Dover, DE. DNREC. 2012b. State of Delaware Toxics in Biota Monitoring Plan, FY 2011, March 1, 2012. Prepared by the Delaware Fish Contaminants Committee, Dover, DE. DNREC. 2013. Final Determination for the State of Delaware 2012 Clean Water Act Section 303(d) List. Delaware Department of Natural Resources and Environmental Control, Dover, DE. EPA. 1992. National Study of Chemical Residues in Fish Volume 1 (EPA 823-R-92-006a). United States Environmental Protection Agency, Office of Science and Technology, Washington, D.C. EPA. 1995. EPA Superfund Record of Decision: Standard Chlorine of Delaware, Inc. (EPA/ROD/R03-95/193). United States Environmental Protection Agency Region II, Philadelphia, PA. EPA. 2003. Total Maximum Daily Loads for Polychlorinated Biphenyls (PCBs) for Zones 2 – 5 of the Tidal Delaware River, December 15, 2003. United States Environmental Protection Agency Regions II and III, Philadelphia, PA and New York, NY. EPA. 2006a. Total Maximum Daily Loads of Nutrients and Dissolved Oxygen Under Low-Flow Conditions In the Christina River Basin, Pennsylvania, Delaware and Maryland, August 23, 2006. United States Environmental Protection Agency Region 3, Philadelphia, PA. EPA. 2006b. Revisions to Total Maximum Daily Loads for Nutrient and Low Dissolved Oxygen Under High-Flow Conditions Christina River Basin, Pennsylvania, Delaware, and Maryland, September 2006. United States Environmental Protection Agency Region 3, Philadelphia, PA. EPA. 2006c. Total Maximum Daily Loads for Polychlorinated Biphenyls (PCBs) for Zone 6 of the Delaware River, December 14, 2006. United States Environmental Protection Agency Regions II and III, Philadelphia, PA and New York, NY.

27
EPA. 2007. Integrating Water and Waste Programs to Restore Watersheds, A Guide for Federal and State Project Manager (EPA 540K07001). Office of Water and Office of Solid Waste and Emergency Response, United States Environmental Protection Agency, Washington, DC. EPA. 2012. Dioxin web page: http://cfpub.epa.gov/ncea/CFM/nceaQFind.cfm?keyword=dioxin. Accessed April 6, 2012. United States Environmental Protection Agency, Washington, DC. EPA, USGS, and USFWS. 2012. Toxic Contaminants in the Chesapeake Bay and its Watershed: Extent and Severity of Occurrence and Potential Biological Effects. United States Environmental Protection Agency, Chesapeake Bay Program Office, Annapolis, MD. Fikslin, T.J. and R.W. Greene. 2012. Reanalysis of Human Health Criterion for PCBs in the Delaware Estuary using Recent Data. Summary report prepared by Thomas J. Fikslin, Delaware River Basin Commission, West Trenton, NJ, and Richard W. Greene, Delaware Department of Natural Resources and Environmental Control, Dover, DE. Ghosh, U. and R.W. Greene. 2012. In-Situ Treatment of Mirror Lake Sediments to Reduce Uptake of Pollutants in the Food Chain. Proposal dated May 7, 2012. Ghosh, U., N. Andrade, R. Greene, and J. Cargill. 2013. Evaluating Impacts of Ongoing Inputs of PCBs and PAHs after Full Scale Remediation with Activated Carbon Amendment. SERDP Proposal dated March 11, 2013. Greene, R.W. 1999. Chemical Contaminants in Finfish from the Chesapeake & Delaware Canal and Implications to Human Health Risk. Delaware Department of Natural Resources and Environmental Control, Dover, DE. Greene, R.W. 2006. Trends in Contaminants of Concern in Delaware Estuary Fish. Presentation at the Delaware Estuary Fish Consumption Summit, May 31, 2006. Temple University, Philadelphia, PA. Greene, R.W. 2007a. Assessment of Zinc Monitoring Data for the White Clay Creek Collected Upstream and Downstream of the Former NVF Newark Site (DE-199). Spreadsheet analysis dated November 30, 2007. Delaware Department of Natural Resources and Environmental Control, Dover, DE. Greene, R.W. 2007b. Prime Hook Fish Contamination Study. Presentation dated March 28, 2007. Delaware Department of Natural Resources and Environmental Control, Dover, DE. Greene, R.W. 2008a. Dioxins and Furans in Fish from the Delaware Estuary. Presentation dated January 25, 2008. Delaware Department of Natural Resources and Environmental Control, Dover, DE. Greene, R.W. 2008b. DRBC PCB Water Column Data for DE Tribs to the Delaware Estuary. Spreadsheet analysis dated December 5, 2008.

28
Greene, R.W. 2009a. Persistent, Bioaccumulative, and Toxic (PBT) Pollutants in Surface Water, Sediment, and Biota of the Christina Basin and Shellpot Creek Watershed, DE. Presentation dated February 2009. Delaware Department of Natural Resources and Environmental Control, Dover, DE. Greene, R.W. 2009b. Dissolved Zinc Concentration in the Red Clay Creek Before and After Startup of Groundwater Zinc Recovery System. Powerpoint presentation dated November 2009. Delaware Department of Natural Resources and Environmental Control, Dover, DE. Greene, R,W. 2009c. The Chemical, Physical and Biological Fate of Polychlorinated Biphenyls in the Tidal Christina Basin. Ph.D. Dissertation. University of Delaware, Newark, DE. Greene, R.W. 2010a. An Evaluation of Toxic Contaminants in the Sediments of the Tidal Delaware River and Potential Impacts Resulting from Deepening the Main Navigation Channel in Reach C. Delaware Department of Natural Resources and Environmental Control, Dover, DE. Greene, R.W. 2010b. Methodology for Estimating the Mass Loading of Zinc from the NVF Yorklyn Site to the Red Clay Creek based on Upstream/Downstream Flow and Concentration Data Pairs. Delaware Department of Natural Resources and Environmental Control, Dover, DE. Greene, R.W. 2011a. Mercury in Delaware Estuary Zone 5. Presentation dated July 13, 2011. Delaware Department of Natural Resources and Environmental Control, Dover, DE. Greene, R.W. 2011b. Little Mill Creek Flood Control Project Summary of June 2011 sampling Results. Presentation dated August 18, 2011. Delaware Department of Natural Resources and Environmental Control, Dover, DE. Greene, R.W. 2011c. Saint Jones & Mirror Lake PCB Time Response without Carbon Treatment. Spreadsheet analysis dated September 19, 2011. Delaware Department of Natural Resources and Environmental Control, Dover, DE. Greene, R.W. 2012a. AMTRAK Wilmington Yards PCB PMP Assessment & Eastern Drainage Ditch Assessment. Presentation dated March 15, 2012. Delaware Department of Natural Resources and Environmental Control, Dover, DE. Greene, R.W. and Stangl, M. 2012b. Feasibility of Stocking Red Clay Creek with Trout. Report dated February 1, 2012. Delaware Department of Natural Resources and Environmental Control, Dover, DE. Greene, R.W. 2012c. Evaluation of DDT Exceedances in the Red Clay Creek Watershed. Presentation dated September 14, 2012. Delaware Department of Natural Resources and Environmental Control, Dover, DE.

29
Greene, R.W. 2012d. Evaluation of Lead & Copper Chronic Aquatic Life Criteria Exceedances in the White Clay Creek Watershed. Presentation dated September 5, 2012. Delaware Department of Natural Resources and Environmental Control, Dover, DE. Greene, R.W., D.M. Di Toro, K.J. Farley, K.L. Phillips, and C. Tomey. 2013a. Modeling water column partitioning of polychlorinated biphenyls to natural organic matter and black carbon. Accepted for publication, Environmental Science & Technology. Greene, R.W. 2013b. Polychlorinated Biphenyls in BSAF Batch Wastewater Discharge to New Castle County Sewer. Presentation dated January 10, 2013. Delaware Department of Natural Resources and Environmental Control, Dover, DE. Greene, R.W. 2013c. Polychlorinated Biphenyls in DSWA Cherry Island Landfill Leachate. Presentation dated February 5, 2013. Delaware Department of Natural Resources and Environmental Control, Dover, DE. MacGillivray, A.R., D.E. Russell, S.S. Brown, T.J. Fikslin, R. Greene, R.A. Hoke, C. Nally, and L. O’Donnell. Monitoring the Tidal Delaware River for Ambient Toxicity. Integ. Environ. Assess. Manag. 7(3): 466-477. Mason, R. 2011. The Cycling and Fate of Mercury and Methylmercury in the Sub-Tidal Reaches of the Delaware Estuary. A Proposal to the Delaware River Basin Commission and the Delaware Department of Natural Resources and Environmental Control. Sommerfield, C.K. 2005. Radioisotope Geochronology of St. Jones River Marsh Sediments, Delaware. Final Report prepared by the University of Delaware, College of Marine Studies for the Delaware Department of Natural Resources and Environmental Control, Dover, DE. Velinsky D., D. Charles, and J. Ashley. 2007. Contaminant Sediment Profiles of the St. Jones River Marsh, Delaware: A Historical Analysis. Final Report prepared by the Academy of Natural Sciences, Philadelphia, PA and Philadelphia University for the Delaware Department of Natural Resources and Environmental Control, Dover, DE. Velinsky, D., C. Sommerfield, and D. Charles. 2010. Vertical Profiles of Radioisotopes, Contaminants, Nutrients and Diatoms in Sediment Cores from the Tidal Christina River Basin: A Historical Analysis. Final Report prepared by the Academy of Natural Sciences, Philadelphia, PA and University of Delaware for the Delaware Department of Natural Resources and Environmental Control, Dover, DE. Velinsky, D., D. Charles, C. Sommerfield, R. Greene, and T. Fikslin. 2011. Tidal Marshes in the Delaware Estuary: Historical Reconstruction of Chemical Loadings. Presentation given Feb 1, 2011 at the Delaware Estuary Science & Environmental Summit, Cape May, NJ. Versar. 1998. Water Quality and Sediment Chemical Testing for C&D Canal Planning, Engineering, and Design Delaware and Maryland. Report prepared by Versar, Inc. for the U.S. Army Corps of Engineers, Philadelphia District, Philadelphia, PA.

30

31
Figure 1. Delaware Watersheds and Basins

32

33
Figure 2. Christina Basin Pennsylvania, Maryland and Delaware (map adapted from University of Delaware Water Resources Agency)

34

35
Appendix 1
Profiles for Delaware Watersheds Impaired by Toxics

36

37
Red Lion Creek Watershed: The Red Lion Creek watershed (~28 sq. km) is located in New Castle County, DE where it empties into the Delaware River through a tide gate structure. Its lower reach forms the northern border of the Delaware City industrial complex. It has been impacted by multiple Federal Superfund Sites and other industrial facilities. The primary contaminants of concern in the Red Lion Creek are PCBs, dioxins/furans, and chlorinated benzenes. PCBs and dioxins/furans are drivers for elevated human health risk through fish consumption (DNREC, 2012a), while chlorinated benzenes are drivers for ecological risk to benthic aquatic life (EPA, 1995).
A catastrophic spill at the now shuttered MetaChem (a.k.a. Standard Chlorine of Delaware) chemical manufacturing facility in 1986 released approximately 650,000 gallons of chlorinated benzenes to the environment, including to Red Lion Creek and associated wetlands. Following an immediate fish kill and closure, testing revealed some of the highest concentrations of chlorinated benzenes in fish in the entire United States (EPA, 1992). Subsequent testing over the years showed that concentrations of these compounds have fallen in the fish but that levels of PCBs and dioxins/furans are still sufficient to warrant a fish advisory. As an aside, the Red Lion Creek is one of the only tributaries to the Delaware Estuary between the head of tide at Trenton, NJ and the top of Delaware Bay at Liston Point, DE that was confirmed to be toxic to aquatic life in multiple surface water bioassay tests (MacGillivray, et.al. 2011). Although not certain, it is certainly possible that the toxicity observed in the water column bioassays is associated with elevated concentrations of chlorobenzenes in the sediments along with pore water to surface water exchange.
The MetaChem property is now a Federal Superfund site. EPA and the State of Delaware have spent a staggering amount of money cleaning up this site. Initial efforts focused on dismantling process equipment and containing the spread of contamination from the upland plant area to groundwater resources. One of the final challenges is how best to deal with the contamination that has entered the adjacent Red Lion Creek wetlands. The EPA has conducted extensive testing of the sediments in an effort to define the extent of the contamination, its fate, and whether it may be amenable to bioremediation.
Key members of the WATAR team are working closely with EPA Superfund personnel on additional testing and appropriate cleanup goals for the wetlands and Red Lion Creek. The EPA is planning to do additional testing of PCBs, chlorobenzenes, and dioxins and furans in 2013. That work, as proposed, is limited to wetlands sediments in a fairly small geographic area. The WATAR team is proposing to supplement the EPA testing with samples of surface water, sediment, and fish from locations upstream and downstream from the EPA’s sampling to provide a watershed-scale perspective on toxics in the Red Lion watershed. It is our intent to coordinate the substance and timing of EPA’s and DNREC’s sampling.
Locations tentatively targeted for sampling under WATAR include: Route 7; Route 1; Route 9; and the pool immediately upstream of the tide gate at the confluence with the Delaware River. In addition, we intend to collect sediment samples at two headwater locations within the Red Lion Creek watershed: one in the vicinity of Porter Road and one in the vicinity of Road 384. These locations are typically wet in the spring but may not be in the summer when sampling is planned. At a minimum, sediment samples will be collected at these two headwater locations. If there is sufficient water, water samples will also be collected.

38
Finally, Delaware is also coordinating with the DRBC who has expressed interest in collecting water samples from the Red Lion Creek for toxicity bioassays to compliment the sampling planned by the EPA and DNREC.
The estimated cost for the Red Lion Creek watershed ambient toxics monitoring is $98,781 ($80,231 from WAS and $18,550 from SIRS). In addition, $10,000 is budgeted for SIRS to collect and analyze samples associated with sites under their purview within the Red Lion Creek watershed. This brings the estimated cost associated with the Red Lion sampling and analyses to $108,781. These funds will be needed in CY2013.
Chesapeake & Delaware Canal: The C&D Canal (~159 sq. km in Delaware) is a man-made waterway that connects the upper Chesapeake Bay and the tidal Delaware River. The portion of the Canal in Delaware separates northern New Castle County from southern New Castle County. There are several Delaware HSCA sites in the C&D Canal watershed and one Delaware NPDES point source discharge. The principal contaminants of concern in the C&D Canal are PCBs, DDT, dieldrin and chlordane based on elevated concentrations in fish (Greene, 1999). Dioxins and furans are also known to be present in the fish, although they aren’t believed to be major risk drivers. Finally, sediments collected from the C&D Canal are known to contain PAHs (Versar, 1998).
Based on the available information, target analytes for the 2013 C&D Canal survey will include PCBs, DxF, OC pesticides, and PAHs in water, sediment and fish. Furthermore, to assess the possible spread of chlorobenzenes away from the Red Lion Creek and into the C&D, water, sediment, and fish samples will also be collected at some but not all of the C&D Canal sampling locations. As currently planned, 5 separate ambient stations will be sampled, including 1 from the lower Delaware River and 4 from the C&D Canal proper between Reedy Point and the DE/MD border. Both a bottom feeding fish (e.g., channel catfish) and a pelagic species (e.g., white perch) will be separately collected at each station. As a goal, each fish sample will consist of 5 similarly-sized individual fish at the station. Sediment samples will consist of a cross-sectionally averaged composite of 3 to 5 surface grabs to ensure representative results.
In addition to the sampling at the 5 ambient stations, a single small volume municipal NPDES discharge (Lums Pond State Park) will also be sampled during the survey, as will selected samples associated with hazardous substance sites located within the C&D Canal drainage area. Further, because the C&D Canal is an interstate waterway, we will contact our counterparts in Maryland to determine if they have an interest in supplementing Delaware’s sampling with sampling on the Maryland side of the Canal.
The estimated cost for the C&D Canal watershed ambient toxics monitoring is $144,425 ($132,350 from WAS and $12,075 from SIRS). An additional $25,000 is also allocated for SIRS to collect and analyze samples associated with sites under their purview within the C&D Canal drainage. This brings the estimated cost associated with the C&D Canal sampling and analyses to $169,425. These funds will be needed in CY2013. New data for the C&D Canal will not only help to support TMDL efforts for the Delaware Estuary, but should also be of interest to our Federal partners who have recently assessed the

39
extent and severity of toxic contamination in the Chesapeake Bay and its watershed (EPA et. al., 2012). WATAR sampling of the C&D Canal is tentatively scheduled for the summer of 2013. Saint Jones Watershed: The Saint Jones watershed (~233 sq. km) is located in Kent County, DE. It flows through the City of Dover, the State’s capital, and eventually empties into the Delaware Bay. The Saint Jones watershed has extensive freshwater wetlands in its upper reaches and extensive tidal wetlands in its lower reaches. Several Federal Superfund Sites and Delaware HSCA sites are located in the Saint Jones watershed. There is one individual NPDES permitee in the Saint Jones watershed. The primary contaminant of concern in the Saint Jones is PCBs based on fish contamination. Dioxins and furans, mercury, and DDT also contribute to the fish contamination problem in several reaches of the Saint Jones watershed. Monitoring for organic contaminants is proposed for 2013, while monitoring for mercury, which will involve different sampling considerations, is proposed for 2016. Monitoring for organics is discussed below while monitoring for mercury is covered later in this work plan.
Fairly extensive monitoring for parts of the Saint Jones watershed is already being proposed as part of an innovative restoration/remediation project being advanced for Mirror Lake in Dover, DE (Ghosh and Greene, 2012). That project involves using activated carbon to sequester contaminants in sediments with the intent of reducing bioavailability and food chain bioaccumulation. Delaware will be the first State in the country to implement this type of project, which we believe holds great promise for reducing the adverse effects of residual legacy contaminants in sediments and watersheds. For planning purposes, this work plan assumes that monitoring for the Mirror Lake project area, which encompasses the area between Division Street and Court Street, is covered by separate funding. Additional funds under WATAR will be needed to cover areas beyond the Mirror Lake project area.
Toxics sampling for the Saint Jones under the WATAR program will involve the collection of surface water, surface sediment, and biota at the following locations: Fork Branch; McKee Run; Silver Lake; the Saint Jones mainstem at Route 13, Route 10, Route 1, and Bowers Beach (confluence with Delaware Bay); Wyoming Mill Pond; and Moores Lake. PCBs, DxF, OC pesticides, and PAHs will be measured in all media from all stations following methods previously described. In order to assess the effect of the carbon treatment, baseline data on the contaminants of concern in water, sediment, and biota will be collected in the Fall of 2013 immediately prior to a November 1, 2013 Mirror Lake remediation/restoration project.
Some HSCA funds have also been allocated for post-remediation monitoring. We have also submitted a grant application to the Federal Strategic Environmental Research and Development Program (SERDP) to evaluate the impact of any ongoing residual contaminant inputs on Mirror Lake following activated carbon amendment (Ghosh, et.al., 2013). Sediment cores will not be collected from the Saint Jones watershed as a part of the WATAR work since coring work has already been performed in the Saint Jones watershed (Sommerfield, 2005; Velinsky et. al., 2007). Those data are reviewed elsewhere (Greene, 2011c).
We have estimated that $185,803 will be needed to cover sampling and analysis of the ambient samples for the Saint Jones watershed ($176,648 from WAS and $9,155 from SIRS). An additional $25,000 is allocated for SIRS to collect and analyze samples associated with sites under their purview within the Saint Jones watershed. This brings the estimated cost associated

40
with the Saint Jones toxics sampling and analyses to $210,803. These funds will be needed in CY2013, but will be drawn down in FY2014. As a final note, the single NPDES point source in the Saint Jones watershed, McKee Run, has already been directed to monitor for PCBs in their stormwater discharge.
Army Creek: Army Creek drains a small (~26 sq. km) watershed in New Castle County, DE south of the historic Town of New Castle. It flows into the Delaware River through a tide gate. There are several federal and Delaware HSCA sites located within the Army Creek watershed. The primary contaminants of concern for Army Creek are PCBs and dioxins/furans based upon elevated concentrations in fish. Sites tentatively targeted for sampling include: Route 13; Army Pond; the reach to the west of Route 9; and the area between Route 9 and the tide gate. Surface water, sediment, and biota (if available) will be sampled at each site.
The estimated cost for the Army Creek ambient toxics monitoring is $98,781 ($80,231 from WAS and $18,550 from SIRS). This estimate is based on that for the Red Lion Creek watershed, which is of similar size and complexity to the Army Creek watershed. In addition, $25,000 is budgeted for SIRS to collect and analyze samples associated with sites under their purview within the Army Creek watershed. This brings the estimated cost associated with the Army Creek watershed to $123,781. These funds will be needed in CY2014.
Appoquinimink Watershed: The Appoquinimink watershed (~120 sq. km) is located in southern New Castle County, DE. The watershed encompasses the Middletown, Odessa, Townsend (MOT) development region. The drainage pattern of the Appoquinimink watershed is complex with several impoundments located in headwater tributaries and extensive braided tidal wetlands in its lower reaches. The Appoquinimink is a tributary to the Delaware Estuary. There are several State HSCA sites within the Appoquinimink watershed. There is also a single NPDES point source discharge which discharges on a seasonal basis. The primary contaminants of concern, based on fish contamination, are PCBs, dioxins and furans, and organochlorine pesticides.
We propose to collect surface water and surface sediment from seven ambient stations located throughout the Appoquinimink watershed. The locations targeted for sampling include: Noxontown Pond, Silver Lake, Shallcross Lake (outflow only), Dove Nest Branch (at Brick Mill Rd or Marl Pit Rd), Drawyers Creek at Route 13, Appoquinimink mainstem at Route 299, Appoquinimink mainstem at Route 9, and Appoquinimink mainstem at its confluence with the Delaware River. Largemouth bass will be collected from Noxontown Pond and Silver Lake, while channel catfish and white perch will be collected from the Drawyers Creek and three Appoquinimink mainstem stations. In addition, we will also collect a sample of the NPDES discharge. All of the samples will be analyzed for PCBs, dioxins and furans, organochlorine pesticides, and ancillary parameters using methods previously described.
In addition to the samples discussed above, we also propose to collect a single (36” or 91.4 cm) deep sediment core from the low tidal marsh adjacent to the Appoquinimink mainstem near

41
Route 299. The purpose of this core is to confirm the expected long-term time trend of contaminant loading in the watershed. Obtaining pollution histories from sediment cores normally entails age-dating small increments or slices along a core using cesium and lead isotopes and then analyzing the individual slices for contaminants. This is considered the best way to determine the relationship between sediment depth, date, contaminant concentration, and past loading. However, this approach is quite time consuming and expensive. Fortunately, we have a reasonable idea of sediment accretion rates and down core PCB distributions for tide marshes throughout the entire Delaware Estuary (Velinsky et.al. 2011). We know for instance that the average accretion rate is 0.65 cm/yr (± 0.22 cm/yr). We also know from these cores that the onset of PCB appearance generally occurred in the 1930s to early 1940s; a peak PCB concentration typically falls between 1960 and 1980; and that concentrations generally decrease gradually to the sediment/water interface.
We hypothesize a similar profile in the Appoquinimink marsh. To test this hypothesis, we propose to analyze the following intervals of a sediment core collected from the low marsh adjacent to the Appoquinimink River at Route 299. The computed intervals and dates in Table 2 assume an average accretion rate of 0.65 cm/yr and that sampling will occur in 2013.
Table 1_A. Proposed Depth Intervals for Sediment Core at Appoquinimink Marsh
Depth Interval (inches)
Expected Period of Sediment Accumulation
Comment
0 -2 2005 – 2013 Biologically active layer 2 – 8.5 1980 – 2005 Decreasing gradient to surface
8.5 – 13.5 1960 – 1980 Expected peak 13.5 - 20 1935 – 1960 Increasing gradient to peak 20 - 36 Pre- 1935 Expected onset
Each of the five intervals will be analyzed for PCBs, dioxins and furans, organochlorine pesticides, and ancillary parameters. To provide sufficient sediment to analyze all parameters and to create a representative sample, multiple cores will be collected at the site with like intervals being composited.
The estimated cost for the Appoquinimink Creek watershed ambient toxics monitoring is $185,803 ($176,648 from WAS and $9,155 from SIRS). This estimate is based on that for the Saint Jones watershed, which is of similar size and complexity to the Saint Jones watershed. In addition, $25,000 is budgeted for SIRS to collect and analyze samples associated with sites under their purview within the Appoquinimink watershed. This brings the estimated cost associated with the Appoquinimink watershed to $210,803. These funds will be needed in CY2014, but will be drawn down in FY2015.
Shellpot Creek: The Shellpot Creek watershed drains approximately 39 sq. km of land in northeastern New Castle County, DE. Most of the watershed is located in the Piedmont Province and is characterized by steep slopes, rocky bottom, and flashy hydrology. Land use in this part

42
of the watershed is primarily medium to high density residential. The very lower end of the watershed is in the Coastal Plain Province and is subject to the tides. This part of the watershed is highly industrialized and impacted by PCBs and other contaminants. The Shellpot discharges to Zone 5 of the Delaware Estuary through a tide gate. Detailed sampling of water, sediment, and fish within the Shellpot watershed was last performed in 2007 (Greene, 2009a). We propose to revisit the Shellpot for intensive sampling of toxics in CY2015/FY2015. At a minimum, all stations sampled in 2007 will be resampled in 2015.
The estimated cost for the Shellpot Creek watershed ambient toxics monitoring is $98,781 ($80,231 from WAS and $18,550 from SIRS). This estimate is based on that for the Red Lion Creek watershed, which is of similar size and complexity to the Shellpot Creek watershed. In addition, $25,000 is budgeted for SIRS to collect and analyze samples associated with sites under their purview within the Army Creek watershed. This brings the estimated cost associated with the Army Creek watershed to $123,781. These funds will be needed in CY2015.
Christina Basin: The Christina Basin originates in southeastern Pennsylvania and northeastern Maryland and flows into northern New Castle County, Delaware. The total drainage area of the basin is approximately 1464 sq. km, which includes the Christina River proper (197 sq. km), the Brandywine Creek (847 sq. km), the White Clay Creek (280 sq. km), and the Red Clay Creek (140 sq. km). The Red Clay Creek is a tributary of the White Clay Creek which is a tributary to the Christina River. The Brandywine Creek is also a tributary of the Christina River. These tributaries and the Christina River flow into Zone 5 of the Delaware Estuary in the vicinity of Wilmington, DE. Approximately two-thirds of the total area of the basin lines in Pennsylvania and Maryland, with the balance falling in Delaware. All but the lower part of the basin is within the Piedmont Physiographic Province. The lower portion of the basin lies in the Atlantic Coastal Plain, where it is subject to tidal flows from the Delaware Estuary. Land use/land cover in the Christina Basin consists of a mixture of rural, residential, agricultural, urban, commercial and industrial with the lower reaches consisting largely of urban use associated with the City of Wilmington. The primary contaminant of concern in the Christina Basin is PCBs based upon elevated concentrations in fish. Other contributors to the fish contamination problem include dioxins and furans and organochlorine pesticides.
A detailed study of PBTs in the Delaware portion of the Christina Basin was conducted in the Fall of 2007 (Greene, 2009a). Since that time, the following noteworthy and relevant efforts have occurred to better understand and control toxics in Delaware’s part of the basin:
• An assessment of PCB mass loading from tributaries in the Christina Basin to the Delaware Estuary (Greene, 2008b);
• An assessment of PCB mass loading from hazardous substance release sites to surface waters of the Christina Basin (Brightfields, 2009; Greene, 2012a);
• Assessment and remediation of PCBs and PAHs in Meco Ditch adjacent to the Meco Drive site (Greene, 2011b);

43
• Assessment and remediation of PCBs at the Howard Street and the Former Carney-Harris waste sites in Wilmington, DE;
• Development of a procedure to document compliance with the Red Clay Creek Zinc TMDL (Greene, 2010b) and demonstration of compliance (Greene, 2009b).
• Radiodating and chemical analysis of sediment cores to assess long-term trends in PBTs in the Christina Basin (Velinsky, et.al., 2010);
• Fundamental research on the chemical partitioning behavior of PCBs in water, sediment, and the foodchain in the Christina Basin (Greene, 2009c).
• Development of a new water quality model describing the role of black carbon in binding PCBs in the water column using data from the tidewater portion of the Christina Basin (Greene et.al., 2013a);
• An assessment of PBT uptake in stocked trout in the Red Clay Creek (Greene and Stangl, 2012b);
• An evaluation of contemporary DDT exceedances in the Red Clay Creek (Greene, 2012c);
• An evaluation of lead and copper chronic aquatic life criteria exceedances in the White Clay Creek watershed (Greene, 2012d).
• Technical assistance to the City of Wilmington and New Castle County Special Services on the City’s NPDES sewershed PCB trackback (Greene, 2013b and 2013c).
The Christina Basin continues to be a high priority for the WATAR team. We propose to cycle back into the Christina Basin in the Fall of 2015 for intensive sampling of water, sediment, biota, and sites. The estimated cost for the ambient portion of the toxics monitoring is $200,000 ($176,648 from WAS and $23,352 from SIRS). This estimate is based on and slightly higher than that for the Saint Jones watershed, which is of similar size and complexity. In addition, $50,000 is budgeted for SIRS to collect and analyze samples associated with sites under their purview within the Christina Basin watershed. This brings the estimated cost associated with the Christina Basin toxics monitoring to $250,000. Sampling will be done in the Fall of 2015 but funds will be drawn during FY2016.
Slaughter Creek: Slaughter Creek is a tributary of the Cedar Creek watershed in northeastern Sussex County, DE. Fish sampling performed in 2006 at a single location had a PCB concentration marginally above a level of concern (Greene, 2007b). The WATAR team proposes to resample Slaughter Creek in CY2016/FY2016, including surface water, sediment, and fish samples at multiple locations. Because of the marginal nature of the toxics problem in Slaughter Creek, it has been placed toward the end of the five year WATAR work plan.

44
The estimated cost for the Slaughter Creek ambient toxics monitoring is $50,000 ($40,000 from WAS and $10,000 from SIRS). In addition, $10,000 is budgeted for SIRS to collect and analyze samples associated with sites under their purview within the Slaughter Creek watershed. This brings the estimated cost associated with the Slaughter Creek toxics sampling to $60,000. These funds will be needed in CY2016/FY2016.
Monitoring to Assess the Need for Mercury TMDLs: As discussed previously, DNREC is currently overseeing a major study within the tidal Delaware River to quantify the seasonal release of methyl mercury from subtidal, nearshore sediments (Mason, 2011). The study is a collaboration between the Watershed Assessment Section, SIRS, the Environmental Laboratory Section, the DRBC, the University of Connecticut, and Dartmouth University. SIRS provided funding for the study and the Watershed Assessment Section is providing technical oversight and logistical support for sample collection. Information from the study will be available in the summer of 2013 in time to be used for Delaware’s 2014 CWA 303(d) listing cycle.
a.) Waples Pond/Prime Hook Creek: Fish samples collected at several locations in 2006 revealed mercury concentrations above Delaware’s criterion of 0.3 ug/g (Greene, 2007b). All organic contaminants were low. We propose to collect new mercury data in the Fall of 2016 under this work plan. Surface water, sediment, and fish samples will all be collected. Target sampling stations include: Outflow of the private pond at Route 30 (Isaacs Road); Cedar Creek Road; Waples Pond; Prime Hook Creek near the shooting range; Prime Hook Creek near the “shop”, and Prime Hook Creek at the end of Turkle Pond Road. The last 3 stations are located within the Prime Hook Wildlife Refuge. We will coordinate with refuge personnel on obtaining samples. Total and dissolved mercury will be analyzed in the water samples by a specialty lab using Method 1631E with an MDL on the order of 0.15 ng/L. Total and dissolved methylmercury will also be analyzed in the surface water samples by a specialty lab, in this case using Method 1630. We propose to use an ultra-low level procedure for the methylmercury analyses (MDL = 0.01 ng/L). Ancillary measures for the surface water samples will include: TSS, POC, DOC, and sulfate. Specific conductivity, dissolved oxygen, temperature and pH will be measured in the field. Surface sediment will be collected at all stations, access permitting, and will be analyzed for total mercury, moisture, grain size and acid volatile sulfide (AVS). Finally, biota will also be collected at all stations, again, access permitting. To more fully utilize fish that are sacrificed, archives will be saved for possible future analysis of organic contaminants.
For Waples Pond/Prime Hook Creek watershed mercury sampling and analysis, we estimate a need of $34,000. An additional $5,000 is budgeted for SIRS to collect and analyze samples associated with sites under their purview within the Waples Pond/Prime Hook Creek watershed. This brings the estimated cost associated with the Waples Pond/Prime Hook Creek watershed mercury sampling and analyses to $39,000. These funds will be needed in CY2016/FY2017. Training of sampling personnel on the proper methods for collecting mercury samples for low-level analysis is also needed. We will attempt to arrange that training through the United States Geological Survey (USGS), who has extensive experience in “clean hands – dirty hands” sampling methods for mercury. A nominal amount of $3,000 is set aside to cover travel and

45
other miscellaneous expenses for the training. This brings the total cost associated with the Waples Pond/Prime Hook Creek mercury monitoring to $42,000.
b) Saint Jones watershed: Mercury concentrations in fish from some but not all locations within the Saint Jones watershed exceed Delaware’s criterion of 0.3 ug/g. We propose to review the fish tissue mercury results for samples collected in the Fall of 2013 to decide whether a more detailed study of mercury in water, sediment, and fish is needed. If it is, that work will be done in 2017. Field and lab procedures will follow those just outlined for Waples Pond/Prime Hook Creek. The Saint Jones mercury sampling, if needed, will be done at the following locations: Fork Branch at State College Road; McKee Run; Silver Lake; and the Saint Jones mainstem at Court Street, Route 10, Route 1, and at Bowers Beach (confluence with Delaware Bay).
We estimate the cost of mercury sampling and analysis in the Saint Jones watershed at $38,000, again provided there is a need to proceed with this work. An additional $10,000 is budgeted for SIRS to collect and analyze samples associated with sites under their purview within the Saint Jones watershed. This brings the estimated cost associated with the Saint Jones mercury sampling and analyses to $48,000.
Delaware Estuary Zones 5 and 6: In support of the PCB TMDLs for the Delaware Estuary, Delaware will cycle back into the mainstem Delaware Estuary to collect striped bass for PBT analyses in the spring and summer of 2017. Based on similar efforts in the past, we estimate this work to cost roughly $50,000. An additional $43,500 is budgeted for SIRS to collect and analyze samples associated with sites under their purview within Zones 5 and 6 of the Delaware Estuary.

46

47
Appendix 2
2013 WATAR Samples

48

49
Ta
ble
2a.
2
013
WA
TA
R S
am
ple
s, R
ed L
ion
Cre
ek
Wat
ersh
ed
S
ee
No
tes
belo
w T
ab
le 2
c.
Wa
ters
he
dS
tati
on
Surface Water, Field Parameters
Surface Water, General Parameters
Surface Water, PCB Congeners, 20-L
Surface Water, Dioxins & Furans, 20-L
Surface Water, OC Pesticides, 20-L
Surface Water, PAHs & Alkyl Homologs, 20-L
Surface Water, PCB Congeners, 2.5-L
Surface Water, Chlorobenzenes, 2.5-L
Surface Sediment, General Parameters
Surface Sediment, PCB Congeners
Surface Sediment, Dioxins & Furans
Surface Sediment, OC Pesticides
Surface Sediment, PAHs & Alkyl Homologs
Surface Sediment, Chlorobenzenes
Fish Tissue, PCB Congeners
Fish Tissue, Dioxins & Furans
Fish Tissue, OC Pesticides
Fish Tissue, PAHs & Alkyl Homologs
Fish Tissue, Chlorobenzenes
Fish Tissue, Total Mercury
Fish Tissue, Lipids
Red
Lio
nU
pstr
eam
of T
ide
Gat
e√
√√
√√
√√
√√
√√
√√
√√
√√
√√
Rou
te 9
√√
√√
√√
√√
√√
√√
√√
√√
√√
√
Rou
te 1
√√
√√
√√
√√
√√
√√
√√
√√
√√
Rou
te 7
√√
√√
√√
√√
√√
√√
√√
√√
√√
Rd
384
√√
√√
√√
Por
ter
Rd
√√
√√
√√
Equ
ipm
ent
Bla
nk√
√√
√√
√√
√√
Lab
Dup
licat
e√
√√
√√
√√
√√
√√
√√
Tota
ls4
59
99
49
88
88
85
55
55
55

50

51
Ta
ble
2b.
2
013
WA
TA
R S
am
ple
s, C
hesa
pe
ake
& D
ela
wa
re
Ca
nal W
ate
rshe
d
Wat
ersh
ed
Sta
tio
n
Surface Water, Field Parameters
Surface Water, General Parameters
Surface Water, PCB Congeners, 20-L
Surface Water, Dioxins & Furans, 20-L
Surface Water, OC Pesticides, 20-L
Surface Water, PAHs & Alkyl Homologs, 20-L
Surface Water, PCB Congeners, 2.5-L
Surface Water, Chlorobenzenes, 2.5-L
Surface Sediment, General Parameters
Surface Sediment, PCB Congeners
Surface Sediment, Dioxins & Furans
Surface Sediment, OC Pesticides
Surface Sediment, PAHs & Alkyl Homologs
Surface Sediment, Chlorobenzenes
Fish Tissue, PCB Congeners
Fish Tissue, Dioxins & Furans
Fish Tissue, OC Pesticides
Fish Tissue, PAHs & Alkyl Homologs
Fish Tissue, Chlorobenzenes
Fish Tissue, Total Mercury
Fish Tissue, Lipids
C &
D
Can
al
Del
R, E
ast o
f R
eedy
Poi
nt
√
√
√
√
√
√
√
√
√
√
√
√
√
√
√√
√√ √√ √√ √√ √√ √√
R
eedy
Poi
nt B
ridge
√
√
√
√
√
√
√
√
√
√
√
√√
√√ √√ √√
√√ √√
S
aint
Geo
rges
Brid
ge
√
√
√
√
√
√
√
√
√
√
√
√√
√√ √√ √√
√√ √√
S
umm
it B
ridge
√
√
√
√
√
√
√
√
√
√
√
√√
√√ √√ √√
√√ √√
M
D/D
E B
orde
r √
√
√
√
√
√
√
√
√
√
√
√
√
√
√√
√√ √√ √√ √√ √√ √√
E
quip
men
t Bla
nk
√
√
√
√
√
√
√
√
√
√
√
Lab
Dup
licat
e
√
√
√
√
√
√
√
√
√
√
√
√
√
T
otal
s 5
6 11
11
11
11
4
5 7
7 7
7 7
3 11
11
11
11
5
11
11
Se
e N
ote
s be
low
Ta
ble
2c.

52

53
Ta
ble
2c.
2
013
WA
TA
R S
am
ple
s, S
ain
t Jo
nes
Wa
ters
hed
S
ee
No
tes
belo
w.
Wa
ters
he
dS
tatio
n
Surface Water, Field Parameters
Surface Water, General Parameters
Surface Water, PCB Congeners, 20-L
Surface Water, Dioxins & Furans, 20-L
Surface Water, OC Pesticides, 20-L
Surface Water, PAHs & Alkyl Homologs, 20-L
Surface Water, PCB Congeners, 2.5-L
Surface Water, Chlorobenzenes, 20-L
Surface Sediment, General Parameters
Surface Sediment, PCB Congeners
Surface Sediment, Dioxins & Furans
Surface Sediment, OC Pesticides
Surface Sediment, PAHs & Alkyl Homologs
Surface Sediment, Chlorobenzenes
Fish Tissue, PCB Congeners
Fish Tissue, Dioxins & Furans
Fish Tissue, OC Pesticides
Fish Tissue, PAHs & Alkyl Homologs
Fish Tissue, Chlorobenzenes
Fish Tissue, Total Mercury
Fish Tissue, Lipids
Sai
nt J
ones
For
k B
ranc
h, S
tate
Col
lege
Rd
√√
√√
√√
√√
√√
√√
√√
√√
√
McK
ee R
un√
√√
√√
√√
√√
√√
√√
√√
√√
Silv
er L
ake,
Ups
trea
m o
f Dam
√√
√√
√√
√√
√√
√√
√√
√√
√√
St.
Jon
es,
Rou
te 1
3√
√√
√√
√√
√√
√√
√√
√√
√√
√
St.
Jon
es,
Rou
te 1
0√
√√
√√
√√
√√
√√
√√
√√
√√
Sai
nt J
ones
, R
oute
1√
√√
√√
√√
√√
√√
√√
√√
√√
Sai
nt J
ones
, M
outh
√√
√√
√√
√√
√√
√√
√√
√√
√
Wyo
min
g M
ill P
ond
√√
√√
√√
√√
√√
√√
√√
√√
√
Moo
res
Lake
√√
√√
√√
√√
√√
√√
√√
√√
√
Equ
ipm
ent
Bla
nk√
√√
√√
√√
√√
Lab
Dup
licat
e√
√√
√√
√√
√√
√√
√
Tota
ls9
1019
1919
194
1111
1111
1110
1010
1010
10

54

55
Appendix 2 Notes:
1. Surface water field measurements include: water temperature, dissolved oxygen, pH, specific conductivity, and salinity. These measurements will be made by the DNREC ELS. 2. Surface water general lab parameters include: total suspended solids (TSS), particulate carbon (PC), particulate organic carbon (POC), dissolved organic carbon (DOC), and chlorophyll-a. These analyses will be performed by the DNREC ELS. 3. High volume (20-L) surface water samples will be analyzed by AXYS for polychlorinated biphenyls (PCBs), dioxins and furans (DxF), and organochlorine pesticides (OC pesticides). Twenty liter (20-L) water samples will be collected into stainless steel soda cans that have been pre-proofed by AXYS. The 20 liters will be formed by combining two 10-L Niskin grab samples. Following sample collection, the soda cans will be stored in DNREC's walk-in cooler and will be shipped to AXYS as soon as practicable, but no more than 1 week after collection. AXYS will use a benchtop Infiltrex system to remove particles on a 1 micron quartz fiber filter and then pass the filtrate through XAD-2 resin. Solid phase contaminants will be co-extracted from the filter and the dissolved phase will be co-extracted from the resin. Hence, each 20-L water sample will be analyzed for solid phase PCBs, dissolved phase PCBs, solid phase DxF, dissolved phase DxF, solid phase OC pesticides, and dissolved phase OC pesticides. The extracts will be analyzed using high resolution gas chromatography/high resolution mass spectrometry (HRGC/ HRMS). The combination of the patented Infiltrex system for phase separation, co-extraction of target analytes, and high resolution analytical methods makes the overall analytical approach unique among environmental laboratories and will provide DNREC with data of unparalleled quality and utility. 4. Prior to extracting the filter as described in 3 above, AXYS will cut the filter in half, retaining one-half for their contaminant analysis and shipping the other half to TestAmerica in Burlington, VT for total organic carbon (TOC) and black carbon (BC) analysis. 5. PAHs shall include: parent and alkyl homologs per AXYS' List 2. AXYS will analyze PAHs in water, sediment, and fish tissue samples collected from the C&D Canal and Saint Jones watersheds but not the Red Lion Creek. 6. To provide an independent check on the efficiency of the Infiltrex system at separating and retaining particulate phase and dissolved phase PCB, a limited number of 2.5-L water samples will be collected at selected stations at the same time that the 20-L samples are collected. For shallow water sites, two 2.5-L samples will be collected directly into factory-sealed, certified amber glass bottles equipped with Teflon screw caps. For deep water sites, water will be collected into a 20-L Niskin and then transferred into two separate 2.5-L glass bottles. In both cases, the 2.5-L samples will be handled, stored, and shipped in an identical fashion as the 20-L samples. Upon receipt, AXYS will extract one of the 2.5-L samples for the station on a whole water basis. AXYS will filter the other 2.5-L sample for the station through a 1 micron quartz fiber filter identical to the type used for the 20-L samples. A separate extract will be produced for the filtrate. AXYS will analyze the whole water extract and the extract from the filtrate for PCB congeners using method 1668A. 7. Chlorobenzenes shall include: monochlorobenzene; dichlorobenzenes (1,2-DCB, 1-3-DCB, and 1,4-DCB); trichlorobenzenes (1,2,3-trichlorobenzene, 1,2,4-trichlorobenzene, 1,3,5-trichlorobenzene); tetrachlorobenzenes (1,2,3,4-tetrachlorobenzene, 1,2,3,5-tetrachlorobenzene, 1,2,4,5-tetrachloro- benzene); pentachlorobenzene; and hexachlorobenzene. Chlorinated benzenes in surface water, sediment, and biota shall be analyzed by Test- America using GC/MS. All water samples from the Red Lion Creek will be analyzed for chlorobenzenes, while only 2 water samples from the C&D Canal will be analyzed for chlorobenzenes. No samples from the Saint Jones watershed are to be analyzed for chlorobenzenes. For the stations where water samples are to be analyzed for chlorobenzenes, two, 2.5-L water samples will be collected in a manner described above in note 6. Upon receipt, TestAmerica will extract one of the 2.5-L samples for the station on a whole water basis. TestAmerica will filter the other 2.5-L sample for the station through a 1 micron quartz fiber filter of the same specification as used at AXYS for their filtrations. 8. Surface sediment general parameters include: TOC and BC, moisture content, grain size, bulk density, and specific gravity of solids. These analyses will be performed by TestAmerica. 9. Total mercury in fish tissue will be analyzed by DNREC's ELS. 10. A rinsate (equipment) blank will be prepared for the 10-L Niskin bottle by pouring hi-purity lab water supplied by AXYS into the Niskin bottle and then from the Niskin bottle back into the original bottle. The resulting rinsate blank will be analyzed by AXYS for PCBs, dioxins and furans, and organo- chlorine pesticides on a whole water basis. The source of the hi-purity lab water used for the rinsate will be the same as that used for laboratory method blank analyses. A separate rinsate blank of the Niskin bottle will be analyzed by TestAmerica for chlorobenzenes. In this case however the source of the rinsate water shall be hi-purity lab water supplied by TestAmerica. Equipment blanks will also be prepared for the sediment grab sampling equipment, one for PCBs, dioxins and furans, and organochlorine pesticides to be analyzed by AXYS and one for chlorobenzenes to be analyzed for chlorobenzenes. 11. A lab duplicate will be analyzed for all target organic compounds for 1 sediment sample and 1 fish sample per watershed. A lab duplicate will also be analyzed for mercury for 1 fish sample per watershed.