Embed Size (px)
Citation preview

0
TOXICS IN NEW HAMPSHIRE: A TOWN-BY-TOWN PROFILE
30 South Main Street, Suite 301-B, Concord, NH 03301
603-229-1331 (ph), 603-229-3221 (fax) [email protected], www.toxicsaction.org

1
Toxics in New Hampshire: A Town-by-Town Profile
May 2008
Report and Map Advisor Alyssa Schuren, Executive Director of Toxics Action Center
Report Authors
Meredith Small, Organizing Director of Toxics Action Center Sara Deon, Community Organizer with Toxics Action Center
GIS Mapping Specialist
Katie Budreski, GIS Specialist for Stone Environmental, Inc.
Toxics Action Center 30 South Main, Suite 301-B
Concord, NH 03301 Phone: (603) 229-1331
Fax: (603) 229-3221 [email protected] www.toxicsaction.org
About the Toxics Action Center Toxics Action Center provides assistance to residents working to prevent and clean up toxic hazards in their communities. Since 1987, Toxics Action Center has helped over 550 communities in New England clean up hazardous waste sites, reduce the use of industrial toxins, decrease industrial pollution, curb pesticide spraying, and oppose the siting of dangerous facilities. When the government won’t take action and the polluting company denies that there is a problem, Toxics Action Center is a resource for residents concerned with toxic hazards to get the solutions they desire. We provide residents with information about environmental laws, strategies for organizing, a network of activists throughout the state, and access to legal and technical experts. Toxics Action Center is funded by donations from concerned citizens and grants from private foundations. This financial support enables us to provide our services free of charge to communities facing the threats of toxic pollution.

2
Index Acknowledgements and Preface.................................................................................................... 3 Introduction......................................................................................................................................... 4 Recommendations.......................................................................................................................... 5-7 Taking Action...................................................................................................................................... 8 Overviews, Explanations, and Detailed Maps Power Plants............................................................................................................................... 9 Toxic Users and Superfund Sites...........................................................................................10 Map: Power Plants, Toxic Users, Superfund Sites............................................................. 11 Water Pollution Point Sources............................................................................................. ..12 Map: Water Pollution Point Sources..................................................................................... 13 Solid Waste Sites, Underground Storage Tanks, and Air Stationary Sources........... 14-16 Map: Solid Waste Sites, Underground Storage Tanks, Stationary Air Pollutants.......... 17 Combined Hazards.................................................................................................................. 18
Cancer Incidence..................................................................................................................... 19 Maps: Cancer Incidence.................................................................................................... 20-22
Data Summary
State Totals............................................................................................................................... 23 County Totals..................................................................................................................... 23-24

3
Acknowledgements
Toxics Action Center would like to thank the Samuel P. Pardoe Foundation and our members for their generous support of our work to cleanup and prevent pollution in New Hampshire and especially for supporting the publication of this report. We would also like to thank the citizen activists we work with who advocate tirelessly every day to make their communities safe and healthy places to live. Our special thanks goes to Katie Budreski for compiling the GIS maps for this report.
Preface Toxics in New Hampshire: A Town-by-Town Profile is an easy-to-use source of information about many types of hazardous sites in New Hampshire. For each town this report lists applicable • Fossil Fuel Power Plants • Nuclear Plant • Superfund Sites • Toxic Users • Water Point Pollution Sources • Solid Waste Sites, including those with
o Underground Storage Tanks o Hazardous Waste Generators o Air Stationary Sources
Toxics in New Hampshire: A Town-by-Town Profile contains the most current data available and obtainable at the time of printing; therefore readers must keep in mind that the information presented in the report may not be completely up to date. More information about specific communities or types of toxic pollution can be found by contacting the sources of this information directly or by calling Toxics Action Center at 603-229-1331 or [email protected].

4
Introduction to New Hampshire Toxics New Hampshire is a beautiful and generally rural state, but the landscape is littered with a toxic legacy. Over 160 unlined landfills dot the state, over 900 air pollution point sources threaten our air quality, and more than 300 toxic users threaten public health and the environment. The land application of and exposure to sewage sludge that contains toxins and pathogens threatens the safety of farmers, their soil, livestock, and surrounding groundwater supplies. Mercury pollution has lead to advisories for limiting fish consumption in all of the lakes, rivers, and streams in New Hampshire. Exposure to toxic pollution from industrial facilities and contaminated sites has been increasingly linked to birth defects, genetic damage, and cancer. Tiny amounts of mercury, dioxins, PCBs or other chemical residues, which may have little to no impact on an adult, can greatly harm a developing fetal brain, immune and nervous system. Twenty years ago when people thought of protecting the environment they thought of picking up litter and about protecting our wilderness and wildlife. It wasn’t until the late 1970s that toxic contamination at Love Canal near Niagara Falls, New York, a nuclear accident at Three Mile Island in Pennsylvania, and a leukemia cluster in Woburn, Massachusetts made headlines in the national news. Unfortunately, these tragedies were not isolated incidents and New Hampshire has its own toxic legacy that will take decades to fully clean up.
Despite significant toxic threats to public health and the environment, we have an opportunity to protect and improve the quality of life in New Hampshire. The good news is that do resources exist in the Granite State to protect public health. Additionally, local decision-making powers in towns and cities can allow communities to take action when state bureaucracy is unresponsive. The follow pages outline actions that the government and citizens should take to make New Hampshire a safer and healthier place to live.

5
Recommendations Move Towards Zero-Waste The solid waste problem in New Hampshire is intense and persistent. In 2005, New Hampshire produced 1,845,969 tons, about 1.4 tons per person, of municipal solid waste. Approximately one-third of that (465,616 tons) was recycled or composted. 878,429 tons was land filled or incinerated. The remaining 7% was exported. With few exceptions, the amount of municipal solid waste produced in New Hampshire grows each year. For example, New Hampshire produced 6,285,479 tons more garbage in 2005 than it did in 2002. New Hampshire is home to 155 inactive unlined landfills, 8 active landfills, and 7 incinerators; these facilities carry significant threats to public health and the environment. The Environmental Protection Agency (EPA) states that all landfills eventually leak, and what they leak, both into groundwater supplies and into the air, is toxic. Landfill gas consists of methane and carbon dioxide which form inside the landfill as the waste decomposes. Incinerating waste produces more than 200 dangerous byproducts, including lead, mercury and dioxins. These toxins are known to cause learning disabilities, birth defects, reproductive and nervous system damage, and can promote cancers. New Hampshire needs new solutions to our waste problems. In addition to increasing recycling, the state agencies must reduce waste at its source. Governor Lynch and the bipartisan coalition of legislators made a step in the right direction when they permanently banned the incineration of construction and demolition debris in 2007. Now, New Hampshire should implement a “zero waste” plan that includes aggressive recycling, commercial composting programs, and education programs focused on reducing waste. Zero waste includes 'recycling' but goes beyond it by taking a 'whole system' approach to the vast flow of resources and waste through society. Zero waste maximizes recycling, minimizes waste, reduces consumption and ideally ensures that products are made to be reused, repaired or recycled back into nature or the marketplace. Economic incentives should promote closed-loops, bringing consumers’ discards back to manufacturers and contractors to reprocess and reuse. New Hampshire’s largely public sector waste management system provides a unique opportunity for transition to a zero waste program. New Hampshire should retire its incinerators and create a goal of zero waste and an implementation plan for how to reach it. Advance Clean Renewable Energy Technologies As global warming quickly becomes one of the most serious environmental problems of the 21st century, the United States needs to lead the way in ending reliance on dirty and dangerous sources of energy and drastically reduce greenhouse gas emissions across the country. One of the largest sources of greenhouse gas emissions is fossil fuel power plants that burn coal, oil, or natural gas to create electricity. These facilities pollute our air and water with toxic air emissions like sulfur dioxide, nitrogen oxides, carbon monoxide, carbon dioxide, and lead. New Hampshire needs a new approach focusing on long-term energy planning that requires utilities to purchase low-cost energy, starting with all available cost-effective resources for energy efficiency. After energy efficiency, utilities should be required to purchase all cost-effective clean energy. Rhode Island has incredible potential for wind, solar and ocean energy, and should take every advantage to promote it. This plan will save money for Rhode Island ratepayers, stimulate jobs growth in green industry, and protect public health and the environment.

6
Ensure a Safe, Nuclear-Free Future The Seabrook Nuclear Plant is located on an 889-acre site near Portsmouth and has the largest reactor in New England. Nuclear power is dirty, dangerous and expensive. It creates millions of tons of highly radioactive waste and there are not any good treatment or storage solutions for this waste. The radiation created by the waste and other nuclear plant functions is a dangerous health hazard because it can destroy cells in the human body, which can later cause cancer and other health problems. Nuclear power is expensive due to the high cost of building, maintaining, insuring, securing and decommissioning nuclear reactors. In addition, the nuclear industry is highly subsidized by taxpayers. There are also grave concerns surrounding the safety of nuclear power plants, especially in a post September 11th world. An accident or terrorist attack on a nuclear plant could be catastrophic. An increasing imperative to solve global warming, coupled with rising oil prices has breathed new life into the dormant U.S. nuclear industry. Nuclear power is not the answer to our energy needs, however. It is not a carbon dioxide-free form of power generation. Especially not when one considers the energy required to build, fuel, run and dismantle a nuclear plant. True solutions can be found in energy conservation and in renewable energy sources. Phase Out Persistent Toxic Chemicals Modern chemistry has done wonders to improve industrial capacity and extend human life. But too often, the chemicals used in pesticides, cleaning products and manufacturing processes also threaten our health and environment. Chemicals such as DDT and PCBs are reported to be a problem of the past, but these hazards have been replaced with other pesticides, plasticizers and flame retardants. And these chemicals often end up in household products such as lotions, pans, cell phones and fabrics. These chemicals can be absorbed into our bodies and remain for years. Every year, the EPA reviews an average of 1,700 new chemical compounds. The 1976 Toxic Substances Control Act only requires that these compounds be tested for any ill effects before approval if evidence of potential harm exists. Frequently, this type of information is not yet available for new chemicals, which leads to the approval of about 90 percent of new chemicals without restriction. Only a quarter of the approximately 85,000 chemicals used in the U.S. have been tested for toxicity. Unnecessary chemical exposure is a regulatory problem: currently our government is not protecting us from toxic exposures. New Hampshire agencies should protect the public from toxic chemicals and ensure the safety of all products on the market through comprehensive chemical reform. During the phase-out of persistent toxic chemicals, New Hampshire agencies should assist businesses in identifying and switching to safer alternatives. New Hampshire agencies should also require that manufacturers prove their products are safe before they go on the market, and should use their authority to ban or restrict the use of a chemical if it poses a risk of environmental contamination or can harm human health, and if safer alternatives are available. All chemicals on the market should be tested and approved from a precautionary viewpoint. We must ensure that unnecessary chemical use does not occur and that all chemicals used are the safest options.

7
Ensure Appropriate Clean Up of Hazardous Waste Hazardous waste sites can pose a health threat due to direct exposure or contamination of water or soil. According to the New Hampshire Department of Environmental Services (NHDES), there are over 850 hazardous waste projects in the state, and 20 sites on the EPA National Priority List. The EPA and the State of New Hampshire oversee the identification, listing, storage, and cleanup of hazardous waste sites. The EPA and State should establish shorter timelines to ensure that these sites are cleaned up in a manner that fully protects public health and the environment. Contaminated sites often go for years and sometimes decades without being fully cleaned up. For example, in Gilford, New Hampshire, residents have lived for decades in homes that sit on top of 121,000 tons of coal tar contamination. The major manufacturing facility explosion causing the contamination occurred in 1952, but the toxic soil was not discovered until 2004. The community is pushing the State of New Hampshire and the EPA to release a final cleanup plan. Meanwhile residents are essentially trapped in their homes. The State must ensure that there are proper resources and oversight for effective cleanups. To help that oversight, a public participation program should be established that provides essential oversight in the program to ensure that cleanups are done right the first time. In addition, more money should be allocated and prioritized for NHDES’s use in fully cleaning up hazardous waste sites. Reduce Pesticide Exposures In New Hampshire, one of the most common uses for pesticides is aquatic weed-control. Invasive plants like Eurasian water milfoil, curly leaf pondweed, and water chestnut clog our lakes and ponds, choking out native species and preventing boating and swimming in certain areas. These plants aggressively take over water bodies and move from lake to lake when plant particles, clinging to the hulls of boats, are deposited in new locations. In its report updated January 2007, the NHDES found invasive species in 37 lakes and ponds since 2000, including the Winnipesauke River and Sunapee Lake. Even though non-toxic alternatives exist, the state’s current policy prioritizes applying pesticides for weed control. The two most common are diquat dibromide (trade name Reward) and 2,4-D (trade names Aqua Kleen and Navigate). These chemicals have been linked to brain damage in children and an increased development of tumors in adults. The State of New Hampshire Exotic Species Program should rework their recommendations for aquatic weed control so that herbicides are a last resort option. Non-toxic alternatives such as artificial aeration and circulation, herbivorous fish and insects, and mechanical removal should be prioritized.

8
Take Action with a Local Environmental Organization
Toxics Action Center provides assistance to residents working to prevent or clean up toxic hazards in their communities. Since 1987, Toxics Action Center has helped over 550 communities in New England clean up hazardous waste sites, reduce the use of industrial toxins, decrease industrial pollution, curb pesticide spraying, and oppose the siting of dangerous facilities. When the government won’t take action and the polluting company denies that there is a problem, Toxics Action Center is a resource for residents concerned with toxic hazards to get the solutions they desire. We provide residents with information about environmental laws, strategies for organizing, a network of activists throughout the state, and access to legal and technical experts. For more information on the programs available through Toxics Action Center visit: http://www.toxicsaction.org/ The organizations listed below offer additional opportunities to learn about and get involved with environmental, environmental justice and community action issues. The listed organizations represent a sampling of environmental organizations in New Hampshire.
Advocates for Community Empowerment Citizens for Sludge-Free Land
Citizens Leading for Environmental Action and Responsibility (C.L.E.A.R.) – Claremont & Newport Clean Water Action
Concerned Citizens of Dunbarton Concerned Citizens of Hinsdale
Concerned Citizens for a Safe Windham Environment New Hampshire
Environmental Action for Northern New Hampshire – Bethlehem Friends of Mount Sunapee
Granite State Conservation Voters Green Mountain Conservation Group
Mink Hills Sustainability Center – Henniker New England Grassroots Environmental Fund
New Hampshire Audubon Society New Hampshire Lakes Association
New Hampshire Public Interest Research Group New Hampshire Rivers Council
New Hampshire Sierra Club Oxbow Initiative – Canterbury
Raymond Citizens for Clean Energy REACH for Tomorrow – Hopkinton & Contoocook
Seabrook Anti-Pollution League Society for the Protection of New Hampshire Forests
The Nature Conservancy White River Toxics Action Committee – White River Junction, VT
Working on Waste – Claremont
9
Power Plants Nuclear power facilities generate large quantities of toxic, radioactive waste that is difficult to store safely for the long-term. In the event of a waste or operation accident, nuclear emissions release harmful radioactivity into the air and water. Increased rates of thyroid cancer, blood disorders, miscarriages and birth defects have been linked to radiation exposure.
Fossil fuel power plants burn coal, oil and natural gas, which are finite in supply. These fuels cause a variety of environmental problems when burned such as acid rain, which has left hundreds of lakes unable to sustain life, soot and smog pollution that causes asthma and respiratory problems, and mercury contamination, a neurotoxin that is now found in all our waterways.
The State of New Hampshire’s industrial energy generation as of 2006 can be broken down as follows:
42.6% Nuclear 27.2% Natural Gas 17.6% Coal 6.9% Hydroelectric 3.7% Other (Municipal solid waste incineration, biomass, renewables, etc.) 2.0 Petroleum
(Information taken from http://www.eia.doe.gov/cneaf/electricity/st_profiles/sept05nh.xls)
Toxic Map: Nuclear and Fossil Fuel Power Plants
Points indicating electric plants, the majority of which pollute the air quality in New Hampshire, are located on the map on page 11. These plants are primarily internal combustion, gas turbines, and steam turbines. They mostly utilize fuel oil, natural gas, and coal as their fuel sources. As a result, many emit pollutants such as:
Carbon dioxide Carbon monoxide Unburned hydrocarbons Sulfur dioxide Particle pollution Lead
Operating nuclear power plants release large quantities of low-level radiation that have been linked to cancer, genetic defects, and immune deficiencies, and create long-lived, high-level radioactive waste.
Sources used for Fossil Fuel and Nuclear Power Plants points on Map:
www.eia/doe/gov/cneaf/electricity/page/eia860.html and NHDES One Stop Data Retrieval Program: http://www2.des.state.nh.us/OneStop/

10
Toxic Users and Superfund Sites The Environmental Protection Agency (EPA) and the New Hampshire Department of Environmental Services (NHDES) document the release of toxic chemicals into our environment through the Toxic Release Inventory and through tracking Large and Small Quantity Hazardous Waste Generators Toxics Release Inventory (TRI) facilities include hazardous waste generators of any of 650 specified toxic chemicals used, manufactured, treated, transported, or released into the environment. The locations and quantities of chemicals stored are reported to the EPA and are listed in the TRI database. There are more than 85,000 chemicals on the market today that are used in consumer products, a tiny minority of which are tested fully for effects on human health. The National Superfund Program grew out of citizen concern in the late 1970s regarding health and environmental effects of intensive or continuous waste dumping practices across the nation. The concern led Congress to establish the Comprehensive Environmental Response Compensation and Liability Act (CERCLA) in 1980 (commonly known as Superfund) to locate, investigate, and clean up the worst sites nationwide. These sites are discovered by various parties including citizens, state agencies, and EPA Regional offices. Once discovered, sites are entered into the Comprehensive Environmental Response Compensation and Liability Information System (CERCLIS), EPA’s computerized inventory of potential hazardous substance release sites. EPA then evaluates the potential for a release of hazardous substances from the site. National Priorities List (NPL): Sites that pose a significant threat to human health and the environment are listed on the NPL and cleaned up by Potentially Responsible Parties, such as a polluting corporation, EPA, the State of New Hampshire, or a tribe. The NPL is a list of the worst hazardous waste sites that have been identified by Superfund. The criteria for choosing which these sites include the financial inability of the property owner to conduct a site cleanup, the proximity of the site to a water supply, and the volume of hazardous waste that has been disposed of improperly. Technical Assistance Grants (TAGs) provide money to community groups so they can pay for technical advisors to interpret and explain technical reports, site conditions, and EPA's proposed cleanup proposals and decisions at Superfund sites. An initial TAG of up to $50,000 is available for any NPL site or proposed for listing on the NPL where a response action has begun. Additional funds may be available for very large or complex sites. You are eligible if members of your group meet these three criteria:
1. Live near and may be affected by an NPL or by a site that is proposed for listing on the NPL (the response action at the site must be underway).
2. Your group is representative of the affected community. 3. Your group is nonprofit and incorporated (made into a legal corporation in your state) or in the
process of incorporating. (Information from: http://www.epa.gov/oerrpage/superfund/about.htm, http://www.des.state.nh.us/hwrb/supfun.asp, and http://www.epa.gov/superfund/community/tag/)
Sources for the Superfund Site and Toxic User points on Map: www.epa.gov/superfund/sites/query/advquery.htm, http://oaspub.epa.gov/enviro/ef_home2.waste, and
http://www.epa.gov/tri-efdr/

11

12
Water Pollution Point Sources Congress passed the Clean Water Act in 1972. This piece of legislation set a goal of eliminating pollution for all of the country’s lakes, rivers, and coastal waters. The Environmental Protection (EPA) estimates that this law keeps more than 900 million pounds of sewage and a billion pounds of toxic chemicals out of our waterways each year. Many of these bodies of water provide drinking water to residents throughout the United States. The EPA sets national standards for tap water through a three-year process:
1. Identifying contaminants that may adversely affect public health and occur in drinking water with a frequency and at levels that pose a threat to public health.
2. Determining a maximum contaminant level goal for contaminants it decides to regulate. 3. Specifying the maximum permissible level of a contaminant in drinking water that is delivered to any
user of a public water system. This process works to ensure consistent quality in the nation’s water supply. However, in 2003 the EPA decided not to regulate any new contaminants in tap water. The EPA has set standards for approximately 90 contaminants in drinking water under seven major categories:
Microbes - Microbes include Coliform bacteria and E. coli bacteria, among others. Radionuclides – Radionuclides include radioactive materials (alpha, beta/photon emitters), Radium
226 and 228, and Radon. Inorganic Contaminants – Inorganic contaminants include asbestos, mercury, copper, cadmium, lead,
arsenic and flouride, among others. Synthetic Organic Contaminants – Synthetic Organic Contaminants include pesticides and herbicides. Volatile Organic Contaminants – Volatile Organic Contaminants include benzene, vinyl chloride,
toluene and styrene, among others. Disinfectants – Disinfectants include those found in household cleaners such as chlorine and chlorine
dioxide. Byproducts of Disinfectants – Byproducts of disinfectants include bromate, chlorite, and haloacetic
acids, among others. (For more complete information about these categories, visit http://www.epa.gov/OGWDW/hfacts.html). Toxic Map: Permitted Water Pollution Point Sources: The Water Permits Division of the EPA’s Office of Wastewater Management leads and manages the National Pollutant Discharge Elimination System permit program in partnership with EPA Regional Offices, states, tribes, and other stakeholders. The sites identified on the map on page 13 refer to sites with permits that are major dischargers of one or more of the contaminants listed above.
Sources used for Water Pollution Point Sources Map: http://www.epa.gov/enviro/html/pcs/pcs_query_java.html

13

14
Solid Waste Sites, Underground Storage Tanks and Stationary Air Pollutants
For most of this century, New Hampshire towns have operated dumps or landfills as centers for disposal of industrial as well as household waste. Over time concern about waste management practices has increased, following an increase in contamination of surface water, groundwater supply wells, and soils. Some of the contamination was linked to New Hampshire’s waste disposal sites. In response, there are now stricter controls on disposal of household and industrial waste including construction and demolition debris, improved landfill design, and improved construction and operating standards for waste facilities. In 1990, the New Hampshire Legislature adopted a hierarchy of preferred methods for solid waste management. From most to least preferred, they are: source reduction; recycling and reuse; composting; waste-to-energy technologies (including incineration); incineration without resource recovery; and landfilling. In 2005, New Hampshire produced 1,845,969 tons, about 1.4 tons per person, of municipal solid waste. Approximately one-third of that (465,616 tons) was recycled or composted. 878,429 tons were land filled or incinerated. The remaining 7% was exported. With few exceptions, the amount of municipal solid waste produced in New Hampshire grows each year. For example, New Hampshire produced 6,285,479 tons more garbage in 2005 than it did in 2002. New Hampshire is home to 155 inactive unlined landfills, 8 active landfills, and 7 incinerators; many of these facilities carry significant threats to public health and the environment. Landfills pose a threat to groundwater and their air emissions can be harmful to human health. The Environmental Protection Agency (EPA) has claimed that all landfills, including those with liners, will eventually leak, and so claims that “state of the art technology” will protect our groundwater and our communities are never true. In addition to threats to groundwater, landfills give off potentially harmful gases, and odors will often permeate neighborhoods. Landfills can be separated into two categories:
Active Solid Waste Landfills – Active solid waste landfills are landfills that currently accept waste. Items banned from New Hampshire solid waste disposal facilities include: hazardous waste (includes but is not limited to, waste that is reactive, toxic, corrosive, ignitable, irritants, strong sensitizers and those which generate pressure through decomposition, heat or other means), cut or uprooted stumps, radioactive materials, septage, sludge, yard waste, or bodies of deceased persons. Currently landfill capacity is projected to fill up in 2019.
Inactive/Closed Solid Waste Landfills – Because unlined landfills can negatively impact groundwater quality, over 90 of the 155 municipally-owned solid waste landfills in New Hampshire have been closed or are in the process of closing. In 1995 the New Hampshire Department of Environmental Services (NHDES) Solid Waste Management Division launched a program to help municipalities cover the costs of closing down inactive landfills by reimbursing them at 20% of the eligible capital costs. An additional 65 inactive landfills are scheduled for closure by 2011.
(Information taken from RSA 147 A:1 http://www.gencourt.state.nh.us/rsa/html/x/147-a/147-a-mrg.htm, NH Code of Administrative Rules Env-Sw100 http://www.des.state.nh.us/rules/env-sw100.pdf, and the NHDES 2005 Solid Waste Report to the Legislature.) Incinerators do not eliminate waste; they simply redistribute toxic chemicals into the air and produce toxic ash which needs to be landfill. Waste incineration is a technology that is virtually impossible to regulate. Incinerators release toxic chemicals, such as lead and mercury, from smoke stacks, and even produce additional byproducts, such as dioxins and furans, in the stacks at certain temperatures. Because of a constantly changing waste stream and the need to maintain very high temperatures, incinerators can rarely

15
maintain a specific constant combustion rate over time. They may pass a stack test one day, and be out of compliance the next day. The Wheelabrator solid waste incinerator in Claremont is one example. For 22 years Wheelabrator has been operating in Sullivan County and exposing residents of Claremont to toxic chemicals. Emissions from the Wheelabrator incinerator contain more than 200 known chemicals including mercury, dioxin, lead and cadmium. Quarterly Excess Emissions Reports filed with the New Hampshire Department of Environmental Services (NHDES) Air Resources Division show emissions violations for every quarter from 1987 until 2002. Two years ago, Wheelabrator installed “retrofit” equipment designed to reduce mercury pollution from the incinerator smokestack. However, the 2005 data, submitted by Wheelabrator to DES show increased emissions for cadmium, dioxin, particulates, sulfur dioxide, and lead. Lead emissions, in particular, increased 22 times post-retrofit. Increasingly residents have complained of respiratory illnesses, auto-immune diseases, learning disabilities and cancer. (For more information on incineration: http://www.no-burn.org/resources/index.html.) Trash Transfer Stations are temporary holding and sorting incinerators that have been developed in recent decades to allow for waste disposal to operate on larger economies of scale – the transition from small town dumps to fewer, larger landfills has increased the amount and distances that waste must be hauled. Transfer stations are designed to facilitate better sorting and transport of waste, and they pose less of a threat to human health than landfills or incinerators, but have the potential to harm some communities when they are poorly sited, constructed when they are not actually needed, or when waste is mismanaged on site. Underground Storage Tanks (USTs) containing petroleum, benzene, toluene, heavy metals or other hazardous substances pose a significant threat to public health and the environment. Gas stations and industrial facilities use USTs to contain toxic materials on site. Until the mid-1980s most USTs were made of bare steel, which is known to corrode over time, allowing the hazardous substances to eventually seep into soil and contaminate groundwater, the source of drinking water for nearly half of all Americans. In addition, faulty installation or inadequate operating and maintenance procedures can cause USTs to release their contents quickly into the environment. One tiny hole in an UST can leak 400 gallons of fuel per year, and one gallon of petroleum can contaminate one million gallons of water. There are 705,000 underground storage tank systems nationwide, with 6,277 of them in New Hampshire. 43 of New Hampshire’s 481 solid waste site’s have underground storage tanks on site. While leaking USTs are a national concern, it’s a major concern in New Hampshire, especially the Lakes Region, because of all of the waterways. Air Stationary Pollution Sources – The EPA has set national air quality standards for six common pollutants. These six “criteria pollutants” and, according to the Agency for Toxic Substances and Disease Registry, their related human health effects, are listed below:
Carbon Monoxide – Cardiovascular effects, vision problems with repeated exposure or high concentration, premature death related to extremely high concentrations.
Nitrogen Dioxide – Respiratory effects, lung disease, and emphysema related to nitric acid and other particles; asthma and lung disease related to ground level smog; visibility impairment.
Sulfur Dioxide – Breathing difficulty and respiratory symptoms related to sulfate particulates. Lead – Kidney, brain, liver, nerve damage, and reproductive damage; high blood pressure especially
in men related to lead exposure; seizures, mental retardation and behavioral problems associated with very high concentrations.
Ozone – Respiratory problems, wheezing, coughing associated with ozone exposure; permanent lung damage related to repeated exposure.
Particulate matter – Aggravated asthma, chronic bronchitis and other respiratory problems associated with particulate matter.

16
Ambient Air Quality Standards are set for pollutants considered harmful to public health and the environment. The Clean Air Act established two types of national air quality standards:
1. Primary standards set limits to protect public health, including the health of sensitive populations such as asthmatics, children, and the elderly.
2. Secondary standards set limits to protect public welfare, including protection against decreased visibility damage to animals, crops, vegetation, and buildings.
NHDES defines toxic air pollutants as those pollutants that, at sufficient concentrations and exposure, are known or suspected to cause cancer or other serious health effects such as neurological damage, birth defects, or to cause adverse environmental impacts. NHDES regulates the emissions of over 750 toxic air pollutants, which have a health-based risk to humans and are likely to be used by business and industry in the state. The regulation, established in the NH Code of Administrative Rules, Chapter Env-A 1400, affects all stationary sources in the state that may emit any of the 750 toxic air pollutants into the ambient air. There are 1504 air stationary pollution sources in New Hampshire. Of the 481 solid waste sites, 160 of them qualify as stationary air pollution sources. (Information taken from http://www.epa.gov/air/urbanair/6poll.html and http://www.des.state.nh.us/ard/airtoxics/what_are_air.htm.)
Sources for Toxic Map: Solid Waste Sites with Hazardous Waste Generators, Underground Storage
Tanks, and Air Stationary Sources New Hampshire One Stop Data Retrieval Program:
http://www2.des.state.nh.us/onestop/DES_Master_Query.aspx

17

18

19
Cancer Incidence in New Hampshire
In the United States, nearly one in two men and more than one in three women will be diagnosed with cancer at some point in his or her lifetime. Cancer is the leading cause of death for U.S. adults under the age of 85, and is the leading cause of death in children. Scientific evidence continues to emerge linking the environment and occupational exposures to cancer. Most of the more than 85000 chemicals on the market today have not been fully tested for human health impacts, and many chemicals found in everyday consumer products are probable carcinogens or known carcinogens. Studies link exposures to arsenic, asbestos, pesticides, vinyl chloride, chlorination byproducts, metalworking fluids, benzene and other solvents, petrochemicals and combustion products, and ionizing radiation to many different types of cancers. Genetics and lifestyle also contribute to the development of cancer. For example, tobacco use remains the most significant preventable cause of cancer. Overall, New Hampshire has higher rates of cancer than the rest of the country. The American Cancer Society (ACS) estimates that in 2004 there were 1,368,030 new cancer cases in the U.S., including 6,290 in New Hampshire. Additionally, ACS estimates that 563,700 people died of cancer in the U.S. in 2004, including 2,590 in New Hampshire. The average annual age-adjusted death rate for cancer per 100,000 persons is 205.2 for New Hampshire and 199.8 for the U.S. According to the New Hampshire Department of Health and Human Services (NHDHHS), the five most common types of cancer diagnosed in New Hampshire are female breast cancer (15% of all cancer cases in 2002), prostate cancer (15%), lung cancer (13%), colorectal cancer (11%), and bladder cancer (6%). Information taken from: http://www.cdc.gov/cancer/CancerBurden/nh.htm and http://www.dhhs.nh.gov/DHHS/HSDM/LIBRARY/Data-Statistical+Report/cancer-mortality98-99.htm. Toxic Map: Cancer Incidence Rates for New Hampshire counties The maps on the following pages show a county-by-county comparison of age-adjusted average annual cancer incidence rates during 2001-2004. Cancer rates in each county are color-coded by the amount that they vary from the national average annual cancer incidence rate adjusted for age during the same time period. Thus, a county is shown to be either above or below the average for the rest of the country. A cancer incidence rate is the number of new cancers of a specific site/type occurring in a specified population during a year. In this case, this is expressed as the number of cancers per 100,000 population at risk. An age-adjusted rate is a weighted average of the age-specific rates, where the weights are the proportions of person in the corresponding age groups of a standard population. The potential confounding effect of age is reduced when comparing age-adjusted rates computed using the same standard population. For more information: http://surveillance.cancer.gov/statistics/types/incidence.html The Map on page 20 is a comparison of cancer incidences for all cancers in both sexes. The Maps on page 21 are for female breast cancer and male prostate cancer. The Maps on page 22 are for leukemia in both sexes and lung and bronchus cancer in both sexes.
Sources for Cancer Incidence Rates in United States and New Hampshire counties: Center for Disease Control and Prevention’s (CDC) National Program of Cancer Registries Cancer
Surveillence System’s (NPCR-CSS) data submitted in 2007 http://apps.nccd.cdc.gov/uscs/ and the New Hampshire Department of Health and Human Services Cancer Registry
http://www.dhhs.state.nh.us/DHHS/HSDM/cancer-data.htm

20

21

22
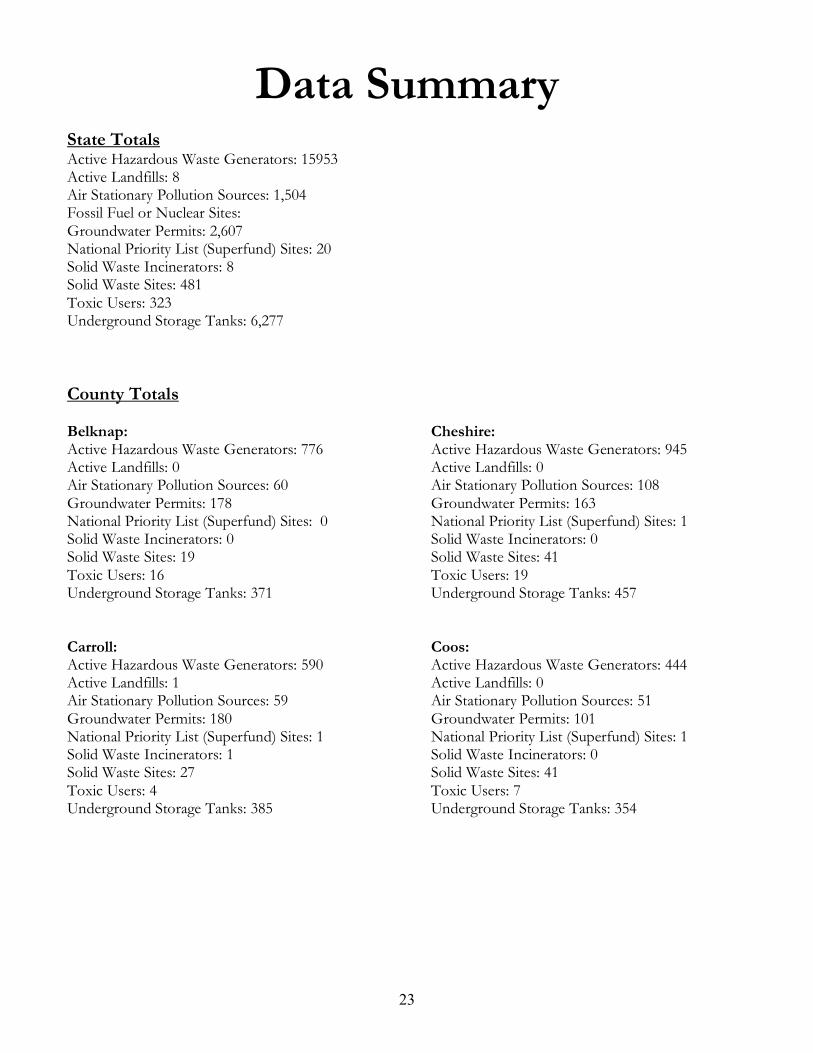
23
Data Summary State Totals Active Hazardous Waste Generators: 15953 Active Landfills: 8 Air Stationary Pollution Sources: 1,504 Fossil Fuel or Nuclear Sites: Groundwater Permits: 2,607 National Priority List (Superfund) Sites: 20 Solid Waste Incinerators: 8 Solid Waste Sites: 481 Toxic Users: 323 Underground Storage Tanks: 6,277 County Totals Belknap: Active Hazardous Waste Generators: 776 Active Landfills: 0 Air Stationary Pollution Sources: 60 Groundwater Permits: 178 National Priority List (Superfund) Sites: 0 Solid Waste Incinerators: 0 Solid Waste Sites: 19 Toxic Users: 16 Underground Storage Tanks: 371 Carroll: Active Hazardous Waste Generators: 590 Active Landfills: 1 Air Stationary Pollution Sources: 59 Groundwater Permits: 180 National Priority List (Superfund) Sites: 1 Solid Waste Incinerators: 1 Solid Waste Sites: 27 Toxic Users: 4 Underground Storage Tanks: 385
Cheshire: Active Hazardous Waste Generators: 945 Active Landfills: 0 Air Stationary Pollution Sources: 108 Groundwater Permits: 163 National Priority List (Superfund) Sites: 1 Solid Waste Incinerators: 0 Solid Waste Sites: 41 Toxic Users: 19 Underground Storage Tanks: 457 Coos: Active Hazardous Waste Generators: 444 Active Landfills: 0 Air Stationary Pollution Sources: 51 Groundwater Permits: 101 National Priority List (Superfund) Sites: 1 Solid Waste Incinerators: 0 Solid Waste Sites: 41 Toxic Users: 7 Underground Storage Tanks: 354

24
Grafton: Active Hazardous Waste Generators: 1363 Active Landfills: 2 Air Stationary Pollution Sources: 123 Groundwater Permits: 228 National Priority List (Superfund) Sites: 0 Solid Waste Incinerators: 1 Solid Waste Sites: 74 Toxic Users: 19 Underground Storage Tanks: 671 Hillsborough: Active Hazardous Waste Generators: 4382 Active Landfills: 1 Air Stationary Pollution Sources: 396 Groundwater Permits: 460 National Priority List (Superfund) Sites: 6 Solid Waste Incinerators: 2 Solid Waste Sites: 79 Toxic Users: 106 Underground Storage Tanks: 1506 Merrimack: Active Hazardous Waste Generators: 1778 Active Landfills: 1 Air Stationary Pollution Sources: 202 Groundwater Permits: 321 National Priority List (Superfund) Sites: 0 Solid Waste Incinerators: 1 Solid Waste Sites: 65 Toxic Users: 35 Underground Storage Tanks: 721
Rockingham: Active Hazardous Waste Generators: 3932 Active Landfills: 0 Air Stationary Pollution Sources: 308 Groundwater Permits: 678 National Priority List (Superfund) Sites: 9 Solid Waste Incinerators: 1 Solid Waste Sites: 80 Toxic Users: 66 Underground Storage Tanks: 1082 Strafford: Active Hazardous Waste Generators: 1133 Active Landfills: 2 Air Stationary Pollution Sources: 140 Groundwater Permits: 207 National Priority List (Superfund) Sites: 3 Solid Waste Incinerators: 0 Solid Waste Sites: 31 Toxic Users: 36 Underground Storage Tanks: 450 Sullivan: Active Hazardous Waste Generators: 610 Active Landfills: 1 Air Stationary Pollution Sources: 57 Groundwater Permits: 91 National Priority List (Superfund) Sites: 0 Solid Waste Incinerators: 1 Solid Waste Sites: 28 Toxic Users: 16 Underground Storage Tanks: 280
Town Totals
The New Hampshire Department of Environmental Service’s (NHDES) One Stop Data Retrieval Program is the easiest way to find the toxic data summary for your particular town. In addition to listing out town-by-town totals for above ground storage tanks, groundwater permits, hazardous waste generators, initial response spill sites, public water systems, site remediation, solid waste sites, and underground storage tanks, the One Stop Program also offers information on ordering sample equipment for environmental testing, permit statuses, and information on local businesses that provide various environmental services ranging from hazardous waste transportation to well designers. You can access this site here: http://www2.des.state.nh.us/OneStop/.