Embed Size (px)
Citation preview

GEOLOGICAL SURVEY CIRCULAR 273
WATER RESOURCES OF THE
KANSAS CITY AREA
MISSOURI AND KANSAS


UNITED STATES DEPARTMENT OF THE INTERIOR Douglas McKay, Secretary
GEOLOGICAL SURVEY W. E. Wrather, Director
GEOLOGICAL SURVEY CIRCULAR 273
WATER RESOURCES OF THE KANSAS CITY AREA
MISSOURI AND KANSAS
By V. C. Fishel, J. K Searcy, and F. H. Rainwater
Washington, D. 0,1953Free on application to the Geological Survey* Washington 25, D. C.

PREFACE
This report is one of a series concerning water re sources of certain selected industrial areas of nation al importance and is intended to provide information of value for national defense and the orderly planning of municipal and industrial expansion. The series is prepared with the technical guidance of the Water Uti lization Section of the Technical Coordination Branch. The report was prepared under the direct supervision of P. C. Benedict, regional engineer, Missouri River basin (Quality of Water); H. C. Bolon, district engi neer in Missouri (Surface Water); and V. C. Fishel, district engineer in Kansas (Ground Water). Some of the data on the use of water were collected'by Prescott Underwood, Jr. , formerly of the Ground Water Branch.
Many of the data summarized in this report were collected over a period of many years by the U. S. Geological Survey in cooperation with Federal, State, and local agencies. In Kansas the surface-water in vestigations have been carried on by the U. S. Geolog ical Survey largely with the cooperation of the Division of Water Resources of the State Board of Agriculture. In Missouri the surface-water investigations in the area are carried on largely in cooperation with the Missouri Division of Geological Survey and Water Resources and the Corps of Engineers, United States Army. In Kansas the ground-water investigations are made in cooperation with the State Geological Survey, the Division of Sanitation of the State Board of Health, and the Division of Water Resources of the State Board of Agriculture. The Missouri Division of Geological Survey and Water Resources supplied ground-water
data for that part of the Kansas City area that is in Missouri.
Chemical data were supplied by the U. S. Public Health Service, the Missouri Division of Geological Survey and Water Resources, the Division of Sanitation of the Kansas State Board of Health, the water depart ments of Kansas City, Mo., Kansas City, Kans. , and North Kansas City, Mo. , and by some industrial companies.
Data pertaining to the use of water were furnished by the Kansas City, Mo. , Water Department; the Board of Public Utilities of Kansas City, Kans.; the North Kansas City Water Department; the Kansas City Power & Light Co. ; and the industries in the Kansas City area.
Special acknowledgment is due E. L. Clark, director, J. G. Grohskoff, and Frank Greene, Mis souri Division of Geological Survey and Water Re sources; L. E. Ordelheide, director, Bureau of Public Health Engineering, Missouri Division of Health; J. C. Frye and R. C. Moore, directors. State Geological Survey of Kansas; Dwight Metzler, director, Division of Sanitation of the Kansas State Board of Health; Robert Smrha, chief engineer, Division of Water Re sources of the Kansas State Board of Agriculture; G. J. Hopkins, U. S. Public Health Service; M. P. Hatcher, director, Kansas City, Mo., Water Depart ment; R. J. Duvall, manager of production and dis tribution and A. W. Rumsey, chemist, Kansas City, Kans. , Department of Water, Light and Power.
II

CONTENTS
Summary..................................................Introduc tion ..............................................
Purpose ................................................Description of area.................................Climate.................................................Importance of area..................................Significance of the chemical and physical
characteristics of water........................Occurrence of water...................................Surface water............................................
Records available ...................................Missouri River at Kansas City, Mo............
Navigation..........................................Discharge...........................................Floods...............................................Qual i ty...............................................
Chemical quality................................Effect of Kansas River on quality of
Missouri River water.......................Tempe r a ture.....................................
Kansas River at Bonner Springs, Kans. ......Navigation..........................................Discharge ..........................................Floods ...............................................Quality...............................................
Blue River near Kansas City, Mo. .............D ischarge...........................................Floods ...............................................Quality...............................................
Little Blue River near Lake City, Mo.........Discharge...........................................Floods ...............................................Quality...............................................
Page122224
99
101010101212
161618191919202323242525252628
Ground water ............................................C onsolida ted formations...........................Unconsolidated deposits ...........................
Fairfax district, North Kansas City,and northeast district........................
Independence area................................East Armourdale and central districts.....Argentine and West Armourdale
districts..........................................Kansas River valley west of Kansas
City ...............................................Public water supplies..................................
Kansas City, Mo.....................................Kansas City, Kans ..................................North Kansas City, Mo............................Independenee, Mo...................................Olathe, Kans..........................................Liberty, Mo...........................................Bonner Springs, Kans..............................Parkville, Mo........................................Lees Summit, Mo...................................Blue Springs, Mo....................................
Water Demands..........................................Public water supplies ..............................Industrial water supplies..........................Conflicting uses......................................
Potentialities ............................................Surface water.........................................Ground water..........................................Quantity................................................Effect of induced infiltration on
temperature and quality.........................Wa te r laws ...............................................Selected bibliography..................................
Page 28 28 28
283536
37
3838384043434343434343434646464749494949
- 505152
ILLUSTRATIONS
Page Plate 1. Map of Kansas City area showing stream-gaging stations and the'areas flooded in
1951 and 1952...................................................................................................... In pocket2. Map of Kansas City area showing the alluvium and the chemical quality of
municipal water supplies....................................................................................... In pocketFigure 1. Selected climatological data for Kansas City, Mo.......................................................... 3
2. Water treatment and usage by industry (From the Conservation Foundation and theNational Assoc. Manufacturers, 1950)..................................................................... 5
3. Duration of published records at gaging stations in the Kansas City area........................... 94. Maximum, minimum, and average monthly discharge of Missouri River at
Kansas City, Mo. , 1897-1951................................................................................5. Flood-stage frequencies on the Missouri River at Kansas City, Mo..................................6. Water-surface profile for selected floods on the Missouri River, mile 367. 3 to
mile 390. 0..........................................................................................................7. Relation between streamflow and chemical composition of the water, Missouri
River, 1951 ........................................................................................................8. Hardness of untreated Missouri River water at Kansas City, Mo. , water-treatment
plant, 1946-51.....................................................................................................9. Monthly average turbidity and departure from mean turbidity of Missouri River water
at Kansas City, Kans., water and light plant, 1942-51................................................ 16
1011
12
12
12
III

Page Figure 10. Maximum daily deviations from monthly averages for several physical and chemical
characteristics, Missouri River water, 1951 ............................................................ 1711. Temperature characteristics of Missouri River water at northeast plant of
Kansas City Power & Light Co. , 1951 ..................................................................... 1812. Maximum, minimum, and average monthly discharge of the Kansas River at Bonner
Springs, Kans. , 1917-51....................................................................................... 1813. Flood-stage frequencies on the Kansas River at Bonner Springs, Kans., 1917-51................ 1914. Water-surface profile for selected floods on the Kansas River, Bonner Springs
to the mouth ....................................................................................................... 2015. Relation of streamflow to quality of Kansas River water at the Intercity Viaduct ................. 2116. Cumulative frequency graph of water temperature, Kansas River at Kansas City................. 2317. Duration curve of daily flows, Blue River near Kansas City, Mo., 1939-51........................ 2418. Discharge available without storage, Blue River near Kansas City, Mo.,
1939-51 .............................................................................................................. 2519. Flood-stage frequencies on Blue River near Kansas City, Mo. , 1939-51 ................... ........ 2620. .Duration curve of daily flows, Little Blue River near Lake City, Mo., 1948-51................... 2721. Cross sections showing the Missouri and Kansas River alluvium and hardness
and ion content of the water encountered................................................................... 3022. Thickness of the saturated alluvium in the Kansas and Missouri River valleys
in the Kansas City area.......................................................................................... 3f23. Average concentration of chemical constituents in ground water from the
Independence and Little Blue River area................................................................... 3624. Areas served by the water departments of Kansas City, Mo., and Kansas City, Kans............ 3925. Hardness of treated and untreated water from the public supply of Kansas City, Mo............. 4026. Hydrographs of three wells in the alluvium of the Kansas River valley,
Kansas City, Kans................................................................................................ 4827. Effect of stage and quality of Missouri River on quality of ground water in the alluvium........ 5028. Effect of pumpage on chemical composition of water from Missouri River alluvium............. 51
TABLES
Page Table 1. Suggested water-quality tolerance in industry........................................................................ 7
2. Suggested water-quality tolerance for boiler feed water .......................................................... 83. Selected major floods on the Missouri River at Kansas City, Mo.............................................. 114. Chemical quality of Missouri River water, 1951.................................................................... 135. Maximum, minimum, and average concentrations found in semimonthly analyses of Missouri
River water Kansas City, Kans. , 1942-51........................................................................ 146. Selected major floods on the Kansas River at Bonner Springs, Kans. , 1917-51........................... 207. Mineral constituents and related physical measurements, Kansas, Blue, and Little Blue Rivers... 228. Selected major floods on the Blue River near Kansas City, Mo., 1939-51.................................. 269. Chemical quality of water from unconsolidated material in the Kansas City area......................... 32
10. Summary of the chemical characteristics of water from the alluvium in the Kansas and MissouriRiver valleys.............................................................................................................. 35
11. Use of water from the public supply of Kansas City, Mo......................................................... 4012. Maximum, minimum, and average concentration found in monthly analyses of composite daily
samples of water from the public water supply of Kansas City, Mo., May 1946 to April 1951.... 4113. Average and maximum daily use of water by the Kansas City.Kans. , Water Department............... 4314. Maximum, minimum, and average concentrations found in semimonthly analyses of treated
water, Kansas City, Kans. , 1942-51............................................................................... 4415. Chemical quality of public water supplies of small municipalities in the Kansas City area............ 4616. Summary of municipal use of water in the Kansas City area.................................................... 4617. Summary of industrial use of water from private sources in the Kansas City area....................... 47
IV

WATER RESOURCES OF THE KANSAS CITY AREA
MISSOURI AND KANSAS
By V. C. Fishel, J. K. Searcy, and F. H. Rainwater
SUMMARY
The water supply available to the Kansas City area exceeds the requirements for any foreseeable indus trial expansion. Surface water is used for the munic ipal supply by Kansas City, Mo. , and Kansas City, Kans. , and is also distributed by these cities to many suburban areas. Lakes or surface reservoirs supply the water to Blue Springs, and Lees Summit, Mo. The Kansas City Power & Light Co. uses more than 500 mgd (million gallons per day) for cooling. The com bined daily use of surface and ground water for munic ipal and industrial use in the Kansas City area is about 700 million gallons. About 100 mgd is used for munic ipal supplies and about 600 mgd is used for industrial supplies.
The flow of the Missouri River at Kansas City (downstream from the Kansas River) has ranged from a minimum of about 1, 500 cfs (970 mgd) to a maximum of 625, 000 cfs (cubic feet per second). The average flow for the 54-year period 1897 to 1951 was 57,660 cfs (37, 270 mgd). Minimum flows in the Missouri River normally occur during the winter, at a time when cooling requirements are at a minimum. Low- flow conditions during the winter may be aggravated by ice jams that may cause a sudden reduction in stage and discharge.
The flow of the Kansas River has ranged from a minimum of 260 cfs (168 mgd) to a maximum of 510, 000 cfs. The average flow for the 34-year period 1917-51 was 6,867 cfs (4,438 mgd).
Large supplies of ground water are available from the alluvium of the Kansas and Missouri River valleys; moderate supplies are available from the alluvium of Blue and Little Blue River valleys. Bedrock aquifers in the Kansas City area generally supply sufficient water for farm and domestic needs but are not gener ally considered adequate sources of water for munic ipal and industrial needs.
Wells in the Missouri River valley alluvium for which records are available have average yields of about 980 gpm (gallons per minute). The water table lies from about 6 to 20 feet below the land surface. In much of the Missouri River valley the alluvium has a saturated thickness of more than 80 feet; in some places it is more than 100 feet.
In Kansas River valley the water table ranges from 20 to 30 feet below the land surface. The water bearing materials have a maximum saturated thickness
of about 80 feet, 'but generally it is less than 60 feet. Some wells have yields of more than lf 000 gpm, but the average yield is less than 800 gpm.
Large quantities of ground water from the alluvium are used for industrial supplies in the Kansas City area and for municipal supplies by North Kansas City, Liberty, and Parkville, Mo., and Bonner Springs, Kans.
Only a small part of the available ground-water sup ply in the Kansas City area has been developed. The available ground-water supply is largely dependent on infiltration from the Missouri and Kansas Rivers, and it seems probable that, as long as there is stream- flow available for induced infiltration, the available ground-water supply will be high.
Several factors regarding water quality present problems in the maximum utilization of the water re sources of the Kansas City area. High turbidity and relatively high hardness values are characteristic of the water in the Missouri and Kansas Rivers. Ground water from the alluvium of these rivers is somewhat harder than the river water and generally contains troublesome quantities of iron. Recent advances in the uses of phosphates as iron stabilizing agents may add appreciably to the usability of ground water in the area. Untreated water from rivers and wells is gen erally used by industry for cooling and condensing. The advantages of ground water in this area for cool ing are its relatively low and uniform temperature.
The quality of the water in the alluvium of the Missouri and Kansas River valleys is affected by the mixing of water from bedrock with the more dilute river water. River stage, chemical quality of the river water, and amount of ground water withdrawn may change the temperature and chemical concentra tion of the ground water and the relative percentage of the ions in solution.
The few samples collected from the Blue River, Little Blue River, and the alluvium along the Little Blue River indicate that these waters are generally of a better quality than those found in the major rivers and their alluvial beds. Water from the alluvium of Lake City valley has the best quality of waters sam pled in the Kansas City area, except the water in a few isolated wells in consolidated material in Jackson County.
The municipalities considered in this report supply water of better quality than the minimum requirements prescribed in the U. S. Public Health Service

WATER RESOURCES OF THE KANSAS CITY AREA
standards (1946) for potable water to be used by com mercial carriers in interstate commerce. Treatment plants at Kansas City and North Kansas City, Mo., improve the quality of water served to both domestic and industrial consumers by softening. This treatment has greatly increased the industrial utility of the water.
Where it is practical, induced infiltration of river water into wells drilled in the alluvium is suggested as a method of improving the chemical quality of the ground water. Particularly the concentration of iron in the ground water may be decreased by induced in filtration. However, induced infiltration will cause a greater fluctuation in water temperatures.
INTRODUCTION
Purpose
The purpose of this report is to present the available information on water for the Kansas City area in order to aid the further proper development, control, and use of the water resources in this industrial region. An understanding of the use, availability, occurrence, and quality of the water is necessary for the proper guidance in the location or expansion of water facilities for defense and nondefense industries. The water supply potential of the area is given as an aid to further municipal and industrial development of the area and to provide information for defense planning.
Records indicate a large increase in the use of water in the Kansas City area in the past half century and particularly in the last 20 years. The prospects are that the requirements for water for municipal and in dustrial use will increase considerably. Each new in dustry will require water and some industries will re quire enormous quantities. Flood protection is also a vital issue in the Kansas City area because of the vast industrial development in the flood plains of the Kansas and Missouri Rivers.
This report summarizes the available streamflow data in the area, contains information on the magnitude and frequency of floods, evaluates insofar as informa tion is available the quantity and quality of ground- water supplies, and furnishes data on chemical quality of public water supplies.
Description of area\
The area considered in this report has no definite political boundaries. It includes the Cities of Kansas City, Mo. , North Kansas City, Mo., and Kansas City, Kans., and adjacent areas in Missouri and Kansas. It includes parts of the following counties Clay, Jackson, and Platte Counties, Mo. , and Wyandotte and Johnson Counties, Kans. and comprises about 1, 330 square miles which is about 34 miles north-south and about 40 miles east-west (pi. 1).
Kansas City, Mo., is the second largest city in Mis souri, and Kansas City, Kans. , is the second largest city in Kansas. The cities are at the confluence of the Kansas and Missouri Rivers. The railroads and much of the industrial area are on the Kansas and Missouri valley flood plains. The residential sections are on the uplands.
The first permanent settlement within the present limits of Kansas City, Mo. , was established by French fur traders about 1821. It was first called Westport Landing and became an important trade and travel cen ter. Westport Landing was the headquarters of the wagon trains starting west over the Santa Fe, Old Salt Lake, and Oregon trails.
In 1838 lots were surveyed and the name Town of Kansas was adopted. It was incorporated as a town in 1850 and chartered under its present name in 1853. Wyandotte, the first permanent settlement in the Kan sas City, Kans., area, was made in 1843 by the Wyan dotte Indians from Ohio. Wyandotte was settled by white people in 1857, and in 1858 was incorporated as a city with a population of 1, 259. In 1869 a town called Kansas City was founded on the bottom lands between the Kansas River and the Missouri State line. In 1872 Rosedale was platted about a mile south of the Kansas River and about a mile west of the State line. In 1880 Argentine was laid out on the south bank of the Kansas River and about 2 miles west of the State line. About the same time Armourdale was established on the north bank of the river. The modern Kansas City, Kans., was formed in 1886 by the consolidation of Wyandotte, Armourdale, and the original Kansas City. Argentine was annexed in 1910; Rosedale in 1922.
The industrial districts of the Kansas City area are shown on plate 1.
In 1950 the population of Kansas City, Mo., was 453,290, and the population of Kansas City, Kans., was 129,583.
Climate
The United States Weather Bureau has collected weather data at Kansas City since July 1, 1888. Ac cording to the Weather Bureau, Kansas City has a modified continental climate as no natural obstructions are present in the vicinity to prevent the free sweep of air currents from all directions. Some of the climatic features that might ordinarily prevail at this latitude are almost obscured by the inflow of warm or cold air from source regions many hundreds of miles away. Both the moist air currents from the Gulf of Mexico and the dry air currents from the semiarid regions of the southwest affect the climate of Kansas City. Often the warm moist Gulf currents and the cold Polar con tinental currents from the north conflict in this area. The rapid changes of weather in the Kansas City area result largely from the continuous conflict of the air currents from other parts of the country.
The highest temperature ever recorded at Kansas City was 113 F in August 1936; the lowest recorded temperature was -22 F in February 1899. The mean annual temperature is about 55 F; the mean daily max imum is about 65 F; and the mean daily minimum is about 46 F. July is the warmest month and has an av erage temperature of 79' F; January is the coldest month and has an average temperature of 30 F (fig. 1).

INTRODUCTION
1920 1930 ANNUAL PRECIPITATION
JAN. FEB. MAR. APR. MAY JUNE JULY AUG. SEPT. OCT. NOV. DEC. MONTHLY AIR TEMPERATURE
JAN. FEB. MAR. APR. MAY JUNE JULY AUG. SEPT. OCT. NOV. DEC. MONTHLY PRECIPITATION
Figure 1. Selected climatological data for Kansas City, Mo.

WATER RESOURCES OF THE KANSAS CITY AREA
Precipitation is distributed throughout the seasons as follows: Spring, 30 percent; summer, 34 percent; fall, 25 percent; and winter, 12 percent. Nearly 75 percent of the annual precipitation falls during the growing season. The monthly distribution of the pre cipitation is shown in figure 1. The greatest annual precipitation on record in this area was 50.25 inches in 1898. The normal precipitation is 36.61 inches (fig. 1).
Measurable snow may fall between October and March, but snowfalls of 10 inches or more are com paratively rare.
The average date of the last killing frost in the spring is April 9, but killing frosts have occurred as late as May 25. The first killing frost in the fall has occurred as early as September 30, but the average date is October 28. The average length of the growing season is 202 days.
Importance of area
The Kansas City metropolitan area is within 200 miles of the geographical center of the United States, is at the intersection of two major rivers, and is a natural connection between the eastern and western parts of the country. Kansas City is served by 12 major trunkline railroads, 6 airlines, 14 buslines, and 148 trucklines. It is served by a. network of excellent highways, including U. S. Highways 24, 40, 50, 69, 71, 73, and 169.
Favored by a geography and transportation facilities, Kansas City is a terminus and reshipping point for livestock and is a center for the processing and packing of meat products. About l£ million head of cattle and more than 2 million hogs are shipped into the city an nually. It ranks first in the country as a cattle and calf market and as a stocker-feeder market,and it ranks second as a meatpacking center.
Kansas City, which is on the eastern boundary of the Nation's largest wheat producing State, ranks first in the country as a wheat market and second in grain- elevator capacity, second as a feed-producing center, and second as a sorghum grains market. In 1951 a total of 193, 831, 320 bushels of grain was received in Kansas City.
The wholesale business in Kansas City amounts to about 3 million dollars annually. More than 1, 300 manufacturing establishments are in the Kansas City metropolitan area.
The many industries in Kansas City include meat packing, flour milling, grain storage, walnut lumber milling, dairying, soap manufacturing, petroleum re fining and distribution, fiber box and bag manufac turing, and steel fabricating.
Significance of the chemical and physical characteristics of water
The uses of water are many and to devise a single standard that would meet all physical, chemical, or sanitary specifications is generally impossible. Water that meets the requirements of one user may be un satisfactory for another. Water consumption in the Kansas City metropolitan area may be roughly divided into two classes, domestic and industrial. Bacterial and sanitary characteristics, hardness, iron, manga nese, fluoride, sulfate, and nitrate contents are of primary concern to the domestic consumer. The total mineral content, hardness, alkalinity, hydrogen-ion concentration, organic and inorganic impurities, color, corrosiveness, and temperature are primary factors in determining the value of water for industrial use. The terms "concentrated" and "dilute" are used in this report to denote the relative amount of dissolved material in the water.
Maximum concentration limits have been established for some of the chemical constituents commonly found in water. These concentration limitations for potable water as prescribed by the U. S. Public Health Service (1946) standards are as follows:
ppm Iron and manganese (Fe + Mn)...................... 0. 3Magnesium (Mg)........................................ 125Sulfate (SO4)............................................. 250Chloride (Cl)............................................ 250Fluoride (F). 1.5Nitrate (NO3 )........................................... 44Dissolved solids....................................... b 500
a National Research Council, 1950. b 1, 000 ppm permissible when water of better
quality is not available.
High concentrations of iron and manganese are ob jectionable for domestic purposes because they stain porcelain, enamel, clothing, and other fabrics. Iron is often present in solution in ground water but is rap idly oxidized by contact with the air and precipitates as a rust-colored deposit. Calcium and magnesium are the principal constituents that make water hard. Water containing large quantities of magnesium in conjunction with sulfate (epsom salts) has saline ca thartic properties. Drinking water containing more than 500 ppm chloride has a salty taste.
High fluoride concentration in water is associated with mottled dental enamel if the water is used for drinking by children during calcification, or formation, of the teeth. However, the consumption of water that contains small quantities of fluoride during the same period is widely believed to build stronger and health ier teeth. The American Dental Association and many State and local health agencies recommend about 1. 0 ppm fluoride in drinking water for children during the period of calcification.

INTRODUCTION
INDUSTRYPERCENTAGE OF PLANTS WHICH HAVE FACILITIES
FOR TREATING WATER, BY INDUSTRY 0 10 20 30 40 50 60 70 80 90 100
Apparel and textiles
Autos and aircraft Chemicals and drugs
Electrical
Food, beverages and tobacco Iron and steel
Leather
Lumber and furniture
Machinery and tools
Nonferrous metals
Optical, medical and scientific supplies
Paper and paper pulp
Petroleum products Plastics
Stone and glass
Toys, novelties and sporting goods Miscellaneous and unspecified
All plants combined
PU
A.-Percentage of plants which have facilities for treating water
lOOr-
Less than More than 10 10*
Other purposes
Sanitary and service
Boiler feed
Cooling
Process
Daily consumption (million gallons)
Total exceeds 100% because of inclusion of reused water by some reporting plants.
B.-Percentage of water intake used for various purposes, average ofall plants
Figure 2. Water treatment and usage by industry (From the Conservation Foundation and the National Assoc.Manufacturers, 1950).

WATER RESOURCES OF THE KANSAS CITY AREA
Excess of nitrate in water may indicate contamina tion by sewage or other organic matter as it repre sents the final stage of oxidation in the nitrogen cycle. Cyanosis in infants caused by mathemoglobinemia has resulted from drinking water that has a high nitrate content.
Hardness is that property of water generally recog nized by the increased quantity of soap required to produce a lather or by the deposits of insoluble salts formed when the water is heated or evaporated. Hard ness does not make the water unusable but may be troublesome. Constituents other than calcium and magnesium, such as iron, aluminum, strontium, bar ium, zinc, or free acid, also cause hardness; how ever, these constituents are not present in sufficient quantities, as a rule, to have an appreciable effect. Hard water is objectionable in the home because it increases soap consumption. Specific limits are not placed on hardness of water for domestic use, but it is generally agreed that water with more than 200 ppm hardness is very hard.
The quality of the water is often of more concern to industry than the quantity, for it may often cost more to treat the water than to develop the original supply. The Conservation Foundation and the National Associ ation of Manufacturers (1950) have conducted a Nation wide survey of water usage by industry. Extracts from this report concerning the extent of treatment practiced by industry and the percentage of water intake used for various purposes show the importance of chemical and physical properties of water to industry (fig. 2).
Process water is water that comes in close contact with the product and includes wash water. The quality of process water is often critical and must be modified to suit the particular requirement. Often uniformity in quality of the water is as necessary as special chem ical characteristics. The requirements of water quality for various types of industry are given in table 1.
The turbidity of water is due to suspended material, such as silt, clay, finely divided organic material, microscopic organisms, and similar materials. In addition to the obvious objections to turbidity, the ab rasive action on pumps, valves, and turbine blades may be very costly.
Carbonate, or temporary hardness, is caused by the calcium and magnesium equivalent of the bicarbon ate in a water; the remainder of the hardness is non- carbonate, or permanent, hardness. Temporary hard ness may be removed by boiling. The bicarbonate is decomposed and most of the calcium corresponding to the bicarbonate is precipitated as calcium carbonate. Hard water is objectionable because it forms a scale in boilers, water heaters, radiators, and pipes, and causes boiler failure and a reduction in flow and heat transfer. However, some calcium carbonate in water does have the advantage of forming a protective coat ing on pipes and other equipment. Hardness is often added to water in the brewing industry.
Iron and manganese are objectionable in water for several reasons. Oxidized iron and manganese are very slightly soluble in alkaline solutions; consequent ly, the precipitation of these oxides may interfere with a process by producing turbidity. Furthermore, the precipitation of iron from solution on the intake screens of wells may greatly reduce the yield of a well and re quire acidizing or other treatment to restore the water- yielding capacity of the well. Iron and manganese also form colored complexes with several organic and in organic substances. Aluminum, iron, and certain other metals are objectionable for the manufacture of photographic film.
Total solids or residue on evaporation indicate the total mineralization of the water. High total solids concentration may be closely associated with the cor rosive property of a water, particularly if chloride is present in appreciable quantities. Water containing high concentrations of magnesium chloride may be very corrosive because the hydrolysis of this unstable salt yields hydrochloric acid.
Water to be used for boiler feeding must meet the most exacting quality requirements. The character istics of water desired for boiler operation are given in table 2. High-pressure steam boilers demand water from which almost all organic and inorganic solids have been removed. Even traces of silica are objectionable.

INTRODUCTION
o «»
equirements
Si 0)
6
OJD "°O £
P
0 "
Mt*s O.- uc cd3 Urt3 S
nJ .20 -QH w
4)"a g
cdfi W>o aSi cd
0)to4) c
cd Stup
rt «2
c£d o}1-1 cd
So?D rjG M"° r )SH
M S* < CO
SiO
U
o42
3H
0)
Industry or us
0
rtsSio«w
0)s0303*
03
o corrosiven otable water.l
5? d,
.
0 0
i i
i ii i
in csio
m csi0
m csio
i ii i
1 O1 TH
1 Ot TH
Air condition in Baking...........
S a acrt
03 03 0)
U I
rt i £ m0) tO
'o """'a,
0
in
o o in
TH
,_,
TH
*
11
1
0
Brewing:
Light beer...
in t-<N
(^rt
03 030) ^. ' 0)
i SiU o
0
^ a0) ""*
S Srt Q. oa,
.
o
0m
0o0
TH
TH
,_,
TH
11
11
oiH
Si0) 0)
Sirt Q
otable water.- otable water.
PH (X,
TH TH
o o
1 1
1 1 1 1
CSI CSI
CSI CSI
CSJ CSJ
int- i
i i
i |i i
0 0
Canning:
Legumes..... General ......
« 13 Q.r=! aa o
2 a o nJ o J3
.2 MC U3rt 0) W)-1A -o O a)sotable water.l oxygen consi
0,
m
|
0oi
0in00
*
CSJ
(M
0in
0TH
CSI
Carbonated
beverages.
Si
o c~0)sJ2rtK a
^ si5 -o*rt C> S5-a£ Sirt rt0 *
a,
,
|
i t
0 0
CSI
cs.
cs.
11
11
11
Confectionery.
a c0 0
rt cg rtS £o '*"'
<w 03
« S S ^ £ CM 03 O
03- S (0
», Si Si Si J) 0) 0) 0)'r! rt rt rt
U3 ^ > ;> 0 > > >J-1 0) 0) .0) Si i ,-t r; i 0 J2 J2 C J2o rt rt O- rt 0^0^^
S3 CXi PU PH
II 1 1mil i i
[ o o [ [
iii i i iii i i
0 III 1 0 III 1 CSI
CSIin csi csi csi o
IO CSI CSI CSI O
in CM csi csi o
Oil O Iin i i in i
i i in i csi
o o in i <Min TH i
2 rt T) rt t a) d)a5 OB'0 o
tf & ? S |.S - "0 i 3 ^ -o c ^§ Sg SiU fa ^ J PH
-i^ in
9 *
i 5]C Q, _ 0) 3 & 00 (J
'03 C .
!i J3 C coSi " a .0 03 0-000 w * o
Si s~\ Cti *ofl O jj t-
^1 < a
ii i i i ii
00 . 00
A" 0) « 0)tn *^ *^
II I 1 i X I _j Xrt o Trt O si 2 si° TJ O T)
O O O O 1 O O O O II
inO CSI TH TH O CSI
TH
m m co m TH o o o o csi
m o csi TH TH o o csiTH
inCO
o o o o oo m THoo o o m m iTH TH rH O
m
o0
o m o in ift i THCSI TH rH II
0
CO
o >n in in in oin c» TH csi
IU MH *?! 1/1 5 2- |S 2§ C « X , &£.& C " M . g tt3a!3jC.S0 rt 3.2 <2C Jjgg-g-n.SP-gO'- gfi Q-OWco K ^ § g
P^ tf S H
rt3 . -0 g
1!c °'
2§ 55 0 ,
onstant comp alumina less
U
i
i i
i
0o
inCSI
in
in
ii
oi
in
in
C
Textiles:
General Dye
i
i
i
i
oTH
o*-l
0
TH
11
or-
i
Wool scouring
o
i
i i
CSI
cs,
cs,
11
in
in
;
Cotton bandage

WATER RESOURCES OF THE KANSAS CITY AREA
Table 2. Suggested water-quality tolerance for boiler feed water (after Moore, E. W., 1940, p. 263)
[Allowable limits in parts per million]
Pressure (pounds per square inch)
Turbidity..........................................Color...............................................
Hydrogen sulfide (H2 S) 2 . .....................Total hardness as CaCOs. ...... ....,,... .....Sulfate -carbonate ratio (A. S. M. E. )
(Na9 SO4:NaoCOo)............. ...............
Silica (SiO2 )......................................Bicarbonate (HCOo)lCarbonate (COs).. ..............................Hydroxide (OH).................................Total solids 3 ....................................
0-150
208015
1.45
80
1:15
4050
20050
3,000-5008.0
150-250
104010
. 143
40
2:1. 5
2030
10040
2, 500-5008.4
250-400
554.0
010
3:1.5
55
4030
1, 500-1009.0
Over 400
123.0
02
3:1. 1
10
2015509.6
1 Limits applicable only to feed water entering boiler, not to original water supply.2 Except when odor in live steam would be objectionable.3 Depends on design of boiler.
Industry uses enormous quantities of water for cool ing. Therefore, the temperature of the water supply is of considerable economic importance, often out weighing the chemical quality considerations. How ever, the quality of the water supply cannot be com pletely ignored because certain dissolved salts, gases, or byproducts will corrode heat exchangers.
OCCURRENCE OF WATER
Precipitation is the source of fresh water. Part of the water that falls as rain or snow flows into surface streams and part of it evaporates directly from the land surface. The larger part of the water that falls as precipitation infiltrates into the soil. Most of the water that is absorbed by the soil is returned to the atmosphere by transpiration and evaporation; the re maining small amount percolates down to the water table and recharges the ground-water reservoir.
The water reaching the water table percolates slowly through the rocks in directions determined by the topog raphy and geologic structure until it is discharged eventually through springs or wells, through seepage into streams, or by evaporation and transportation in bottom lands adjacent to the streams.
The eirculation of water from the atmosphere to the earth and back to the atmosphere is called the hydro- logic cycle. The significance of the hydrologic cycle is that through it fresh water becomes a renewable resource. Water available today, whether used or not, follows the cycle and will become available again. Data are not available for the Kansas City area to show the amount of each component part of the hydrologic cycle, but the magnitude of each part can be inferred from comparable areas where the hydrologic components are better known. The component amounts of the hy drologic cycle in the Kansas City areas are estimated as follows:
Precipitation (36 inches)
Interception-
Infiltration-Soil moisture
Ground water (1 inch)
Direct runoff-
Evaporation and transpiration (28 inches)
Runoff (8 inches)

SURFACE WATER
The interconnection between surface and ground water is demonstrated in the Fairfax district and in North Kansas City where protection from floods re quires not only protection from a rise in the river but also protection from the simultaneous rise of ground- water levels. During flood stages of the Missouri River sand boils form behind the levees because of increased hydrostatic pressure caused by ground- water recharge from the river. In recent years the Corps of Engineers has constructed a line of relief wells near the levees. These wells discharge water during high flood stages of the river, and thus reduce the hydrostatic pressure of the ground water in the areas where sand boils would cause much damage to the buildings and the airport runways.
Except for small quantities of dissolved atmospheric gases, rain water is relatively pure and devoid of con tamination. However, as soon as the water strikes the earth, it begins to dissolve materials in the earth's crust. The water may quickly run off into streams and dissolve little material, or it may slowly percolate to the ground-water reservoirs. The percolation of the water through the soil affords greater opportunity for solution of soluble materials, and the resultant water is generally more mineralized than water that runs off immediately.
All the fresh water in the Kansas City area does not come from local precipitation. In small streams and in most of the ground-water reservoirs the water comes largely from precipitation falling in and near the area. Most of the water in the large streams comes from precipitation falling on the river basins upstream and outside the area.
The Missouri and Kansas Rivers are the source of large quantities of water. Other sources of water are the Blue River, Little Blue River, and the smaller streams and lakes. The alluvial material underlying the flood plains of the Kansas and Missouri Rivers will yield large quantities of water. The alluvial de» posits in the valley of the Blue and Little Blue Rivers also will yield a large quantity of water. The locations of these sources are shown on plate 2.
SURFACE WATER
The impact of two major floods in successive years has focused attention on the destructive power of the Missouri and Kansas (Kaw) Rivers. When one thinks of the destruction caused by the floods of July 1951 and April 1952, the presence of two large rivers in the Kansas City area might seem to be a liability. However, the two rivers are important to the residents of the area because they are the source of water supply for Kansas City, Mo. , and Kansas City, Kans. , and furnish recharge for the North Kansas City ground- water supply. The Missouri River provides large quantities of cooling water needed for electric power generation and water for the refineries. The rivers also carry away domestic and industrial wastes.
Within the area considered in this report, the Mis souri River is about 58 miles long and the Kansas River about 27 miles long. The drainage area of the Missouri River above the mouth of the Kansas River is over 14 percent of the total area of the United States. The Kansas River basin is about 2 percent of the total area of the States.
Although the flow from a large drainage area is available to the Kansas City area, on at least one oc casion operation of the Kansas City Power & Light Co. steam power plant was suspended because the Missou ri River stage was below the cooling water intakes of the plant.
Records available
The Geological Survey is currently operating stream-gaging stations on the Missouri River at Kansas City, Mo. , on the Kansas River at Bonner Springs, Kans. , on the Blue River near Kansas City, Mo. , and on the Little Blue River near Lake City, Mo. The locations of these gaging stations are shown on plate 1, and the published streamflow records availa ble for the area are shown in figure 3. In addition to the streamflow records shown in figure 3, gage heights for the period April 1887 to December 1889 for the Missouri River at Randolph (Avondale), Mo., and at
WATER YEARS ENDING SEPT. 30 170 I860 1890 1900 1910 1920 1930 1940 I95C
E 77777, \, '/&//
&
'/////;
<$&$&
'////*
£££££*
'&$&&.
I
xxxxx
&££^
&&88
g
xj
<
4
I
DRAINAGE AREA, IN
)SQUARE MILES
59,890
489,200
188
184
GAGING STATION
Kansas River at Bonner Springs,Kans.
Missouri River at Kansas City,Mo.
Blue River near Kansas City,Mo.
Little Blue River near Lake City, Mo.
EXPLANATION
IXXXXXXXXX>3 Y//////////A ________ Daily discharge Monthly discharge Gage heights

10 WATER RESOURCES OF THE KANSAS CITY AREA
Sibley, Mo., are contained in reports of the Missouri River Commission. Gage heights for the Kansas River at Kansas City from 1901 to 1919 are contained in re ports of the Kansas Water Commission and the Kansas State Board of Agriculture.
Missouri River at Kansas City, Mo.
The Missouri River at the Kansas City gage, 377. 5 miles above the mouth, has a drainage area of 489, 162 square miles.
The Missouri River is formed by the confluence of the Jefferson, Madison, and Gallatin Rivers at Three Forks in southwestern Montana. From Three Forks the river flows through a part of the Northern Rocky Mountains province, then enters the Great Plains province and flows a total of 2, 088 miles before reach ing the gage at Kansas City. The Missouri River drains all or part of the States of Montana, Wyoming, North Dakota, South Dakota, Nebraska, Colorado, Kansas, Minnesota, Iowa, and Missouri.
Average annual precipitation in the drainage basin above Kansas City varies from about 6 inches near the upper part of the basin to about 36 inches at Kansas City. Average annual runoff varies from less than one-half inch in the central part of the basin to about 20 inches in the western part and about 8 inches at Kansas City.
The normal regimen of the stream is low flows dur ing the winter, due to the low temperatures of the northern and western parts of the basin; a minor rise in April, due to melting of the snow blanket over the Interior Plains area; and a much greater rise in June, due to the May and June rains in the lower part of the basin.
Navigation
The Missouri River has a project depth of 9 feet from Sioux City, Iowa, to its mouth. At present the controlling depth below Kansas City is 6 feet through out the navigation season, which is from March 15 to November 30. Above Kansas City the present control ling depth decreases from 6 feet at Kansas City to 3i feet at Sioux City; the navigation season is from April 1 to November 15. The annual river traffic between 1939 and 1948 ranged from a low of 322, 345 tons in 1944 to a high-of 797,214 tons in 1948.
The Federal Barge Line operates on the Missouri River from Kansas City to the mouth. A new company has been formed to operate a private barge line be tween Omaha and St. Louis, primarily to transport liquid petroleum products. The name, permit, and charter of the dormant Sioux City-New Orleans Barge Line Co., which disposed of its last equipment in 1941, has been purchased by the new company. Service is expected to begin in the spring of 1953.
Discharge
The average discharge of the Missouri River at Kansas City, Mo. , for the 54 years 1897-1951, for which the Geological Survey has computed record, is 57, 660 cfs. The maximum, minimum, and average monthly discharges are shown in figure 4.
JAN. FEB. MAR. APR. MAY JUNE JULY AUG. SEPT. OCT. NOV. DEC.
Figure 4. Maximum, minimum, and average monthly discharge of Missouri River at Kansas City, Mo., 1897-1951.
The minimum discharge for the periods 1905-06 and 1928-49 is about 970 mgd (1, 500 cfs) on January 9, 10, 1937. The water-surface elevation at the gage corre sponding to the minimum discharge is 713. 09 feet above mean sea level, datum of 1929.
Floods
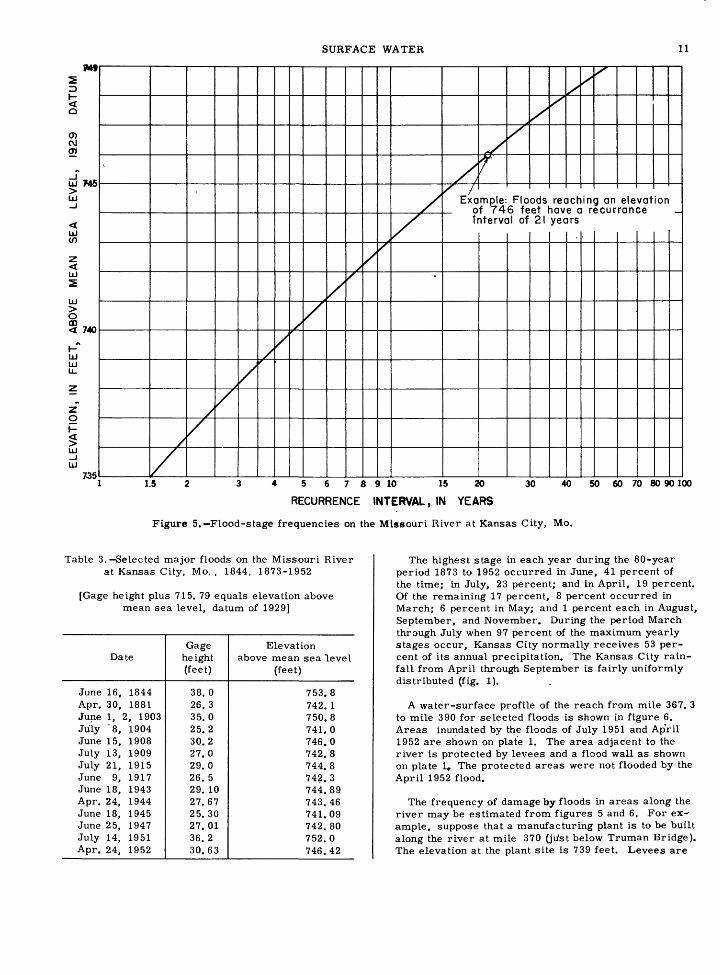
Records of floods at Kansas City include the 1844 flood and are continuous since 1873. According to the U. S. Weather Bureau, the flood stage at the gaging station is 22 feet. The maximum flood known reached a stage of 38. 0 feet on June 16, 1844. The discharge was about 625, 000 cfs. Selected major floods are list ed in table 3 and a flood-stage frequency graph based on continuous records is shown in figure 5. The water- carrying capacity of the reach of the Missouri River through the Kansas City area has changed little during the 20th century except for some increase in capacity in recent years due to the Liberty Bend cutoff. Thus floods at Kansas City having equal stages have more nearly the same discharge than is usual for a stream with an alluvial bed.
SURFACE WATER 11
w sID
< O
0) CM CO
UJ 745 >UJ_l
UJto
zLUS
LU
1< 740I-"
LU LU U_
Z
z.O
L̂J_l LJ
73S
^
/
/
/
/
/
/
Xf
/
/
/
/
'
/
/
XExa
0t
Sr//'
.//
mple: Floods reaching an elevation f Y46 feet, have a recurrence _ iterval of 21 years
1.5 30456789 10 15 20
RECURRENCE INTERVAL, IN YEARS
Figure 5. Flood-stage frequencies on the Missouri River at Kansas City, Mo.
40 50 60 70 80 90100
Table 3. Selected major floods on the Missouri River at Kansas City, Mo. , 1844, 1873-1952
[Gage height plus 715. 79 equals elevation above mean sea level, datum of 1929]
Date
June 16, 1844Apr. 30, 1881June 1, 2, 1903July '8, 1904June 15, 1908July 13, 1909July 21, 1915June 9, 1917June 18, 1943Apr. 24, 1944June 18, 1945June 25, 1947July 14, 1951Apr. 24, 1952
Gageheight (feet)
38. 026.335.025.230.227.029. 026. 529. 1027.6725.3027.0136. 230.63
Elevation above mean sea level
(feet)
753.8742. 1750.8741.0746.0742.8744.8742.3744. 89743. 46741.09742. 80752.0746.42
The highest stage in each year during the 80-year period 1873 to 1952 occurred in June, 41 percent of the time; in July, 23 percent; and in April, 19 percent. Of the remaining 17 percent, 8 percent occurred in March; 6 percent in May; and 1 percent each in August, September, and November. During the period March through July when 97 percent of the maximum yearly stages occur, Kansas City normally receives 53 per cent of its annual precipitation. The Kansas City rain fall from April through September is fairly uniformly distributed (fig. 1).
A water-surface profile of the reach from mile 367. 3 to mile 390 for selected floods is shown in figure 6. Areas inundated by the floods of July 1951 and Ap'ril 1952 are shown on plate 1. The area adjacent to the river is protected by levees and a flood wall as shown on plate ! The protected areas were not flooded by the April 1952 flood.
The frequency of damage by floods in areas along the river may be estimated from figures 5 and 6. For ex ample, suppose that a manufacturing plant is to be built along the river at mile 370 (jiist below Truman Bridge). The elevation at the plant site is 739 feet. Levees are

12 WATER RESOURCES OF THE KANSAS CITY AREA
757
Exomple: Estimated profile of a floor reaching on elevation of
39 feet at mile 370. This flood has a recurrence interval of 21 years
80 375 MILES ABOVE MOUTH Of MISSOURI RIVER
370 367
Figure 6. Water-surface profile for selected floods on the Missouri River, mile 367. 3 to mile 390. 0.
not to be built to protect the area. The frequency of flooding at the plant can be estimated as follows: Plot elevation 739 at mile 370. (See example, fig. 6. ) Draw an estimated flood profile approximately paral leling the profile of the other floods shown and pas sing through elevation 739 feet at mile 370. This estimated profile shows that a flood whose crest ele vation is 739 feet at mile 370 could be expected to have a crest elevation of about 746 feet at mile 377. 5 (th,e U. S. Geological Survey gage). A flood with a crest of 746 feet at the U. S. Geological Survey gage has a recurrence interval of 21 years (fig. 5). There fore, there will be an average interval of 21 years between damaging floods at the plant site. The plant site will not be flooded at regular intervals of 21 years, but during a long period of time the average interval between floods exceeding 739 feet would be about 21 years. That is, the plant site would be flooded about 10 times in 210 years.
Quality
Chemical quality
The chemical quality of the Missouri River water at Kansas City is the result of a composite of many types of water from hundreds of tributaries that drain areas having widely diversified climate, geology, soil type, and culture.
Semimonthly analyses of daily composites of Missou ri River water for 1951 are given in table 4. Little change is observed in the annual maximum, minimum, and average chemical concentrations of the river water over a 10-year period (table 5). The percentage com position of the water is also relatively uniform through out the year, although total concentration fluctuates with the streamflow. The waters are more dilute during the late spring and summer months when streamflow is increased by snowmelt and precipitation in the uplands; conversely, the higher chemical con centrations are associated with low streamflow during the winter (fig. 7).

Tab
le 4
. C
hem
ical
qu
alit
y o
f M
isso
uri
Riv
er w
ater
, 19
51
[Anal
yse
s by K
ansa
s C
ity
, K
ans.
,
Wat
er a
nd
Lig
ht
Dep
artm
ent,
re
sult
s in
part
s p
er
mil
lio
n]
Dat
e
Jan
. 1
-15
16-3
1F
eb.
1-1
516-2
8M
ar.
1-1
516
-31
Apr.
1-1
51
6-3
0M
ay
1-1
516
-31
Jun
e 1-1
516-3
0
July
1
-15
16-3
1A
ug.
1-1
516
-31
Sep
t.
1-1
516-3
0
Oct
. 1-1
516
-31
Nov
. 1-1
516-3
0D
ec.
1-1
516
-31
Sil
ica
(Si0
2)
16
.815.0
17.4
15.
012
., 4
14.2
8.2
9.0
11.4
12.
25
.21
4.2
9.0
12.4
7.8
12
.412
. 0
15.
8
12.
513.6
11
.81
3.4
14
.41
7.4
Iron a
nd
al
um
inum
1.2
1.6
1.0
1.2 .8 1.0
1.2 .6 1-4
1.2
2.2
2.2
1.0 .4 1.2
1. 2
1.4
2. 2
1.2 .8 1.2
2.0
2.2 1.4
Cal
cium
(C
a)
74.7
71.6
74
.462
. 7
49
.357
. 5
55.
547.7
52.2
59.2
51.6
44.
0
41
.952.6
48.
544
. 8
46.6
56.
9
65.
86
3.7
63
.964
. 1
70.6
89.2
Mag
nes
ium
(M
g) 26.2
25.
12
6.4
20.7
15.2
18.7
14.
714.2
13.6
17.6
14.7
11,8
11.5
14.9
13.6
13.
113.9
17.
3
20.4
20.6
21.
921.8
25
.429
. 1
Sodiu
m a
nd
p
ota
ssiu
m
(Na
+ K
)
68 61 70 66 41 45 28 31 29 43 35 28 26 34 43 28 32 46 44 51 49 51 55 59
Bic
arb
on
ate
(HC
Oa) 24
923
224
820
716
519
8
144
153
171
195
161
144
140
174
162
143
154
190
201
205
210
216
235'
325
Sulf
ate
(S0
4)
200.
7188.2
20
0.0
178.2
10
3.7
128.2
118.3
104.5
93.
9131.7
117.0
86.2
95.
010
3. 5
103.
59
5.4
99.6
13
6.0
155.
016
2. 0
16
0.0
156.
8179.0
163.
9
Ch
lori
de
(Cl) 20
. 9
20.7
24.
12
1.5
21.
516.4
6.9
7.2
8.2
11.0
8.5
7.7
7.2
11.3
14
.48.2
9.3
10.8
12.4
13.
113
. 1
14.0
14.
723
. 5
Dis
solv
ed
soli
ds
(at
103°
C)
566
528
541
501
380
420
363
365
320
405
389
290
317
337
362
310
336
418
442
445
467
477
484
624
To
tal
har
dnes
s (C
aC0
3)
296
284
295
243
187
222
201
185
188
222
192
161
140
197
179
163
175
216
250
245
251
252
283
344
Nonca
r-
bo
nat
e hard
ness 92 94 92 73 52 60 83 58 48 62 60 43 25 54 46 46 49 60 85 80 79 75 90 77

Tab
le 5.
Max
imu
m,
min
imum
, an
d a
ver
age
con
centr
atio
ns
foun
d in
sem
imo
nth
ly a
nal
yse
s of
Mis
souri
Riv
er w
ater
at
Kan
saa
Cit
y,
Kan
s.,
19
42
-51
[Chem
ical
an
aly
ses
by K
ansa
s C
ity
, K
ans.
,
Wat
er a
nd
Lig
ht
Dep
artm
ent,
re
sult
s in
part
s p
er m
illi
on
]
Yea
r
1942
1943
1944
1945
1946
1947
1948
1949
1950
1951
Co
nce
n
trat
ion
Max
imu
mM
inim
um
Av
erag
eM
axim
um
Min
imum
Av
erag
eM
axim
um
Min
imu
mA
ver
age
Max
imum
Min
imum
Av
erag
eM
axim
um
Min
imum
Av
erag
eM
axim
um
Min
imum
Av
erag
eM
axim
um
Min
imum
Av
erag
eM
axim
um
Min
imu
mA
ver
age
Max
imu
mM
inim
um
Av
erag
eM
axim
um
Min
imum
Av
erag
e
Sil
ica
(Si0
2)
18
.010
.01
3.7
20
.46.
81
2.2
24
.69
.012
. 6
16.
87
.41
1.4
19.
09.
01
2.3
21
.28
.41
2.4
17
.66
.61
1.8
18
.08
.011
. 5
20
.24
.212
. 5
17
.45
.21
2.6
Iron a
nd
al
um
inum
(R2
°3) 4
.01.2
2.4
3.0 .6 1.7
3.2 .4
2.0
5.4 .4 2.2
3.2 .8 1.8
3.4 .6 1. 7
3.8 .2
2.4
5.6 .4 1.9
3.2 .6 1.8
2.2 .4 1.3
Cal
cium
(C
a) 84.
54
5.7
63.
592.6
40
.558.6
84
.042.3
61.
996.8
43
.461
. 9
86.6
47.
560
. 1
100.8
41
.061
. 7
82.
136.6
59.4
82
.042.2
58.9
94.4
37.6
57.4
89.2
41.
958
. 7
Mag
nes
ium
(M
g)
25.
710.6
18.0
30.2
10.9
17.
72
7.7
11.6
19.2
31.8
12.
119.9
27.
314.6
19.6
34.2
12.0
20.2
30.0
12.8
19.8
27
.912.4
19.0
31.6
10.0
18.2
29.
111
. 5
18.4
Sod
ium
an
d
pota
ssiu
m
(Na
+ K
)
75 29 52 79 35 54 78 24 53 89 17 51 72 33 56 83 16 58 88 23 55 72 17 45 84
.028.0
51 70 26 44
Car
bo
nat
e (C
03
)
18 0 2 8 0.
77 0 1
12.0
0 .80 0 0 2 0 .
10 0 0 0 0 0 0 0 0 0 0 0
Bic
arbonat
e (H
C0
3)
270
128
179
288
138
181
287
129
184
333
134
186
289
132
186
339
120
193
265
132
179
304
120
167
309
124
186
325
140
193
Sulf
ate
(S0
4)
226.0
131.
61
65
.623
3. 9
92.
91
58
.022
6. 1
10
9.4
170.8
26
2.8
95.
116
4. 4
203.0
110.9
17
3.9
24
4.3
87.6
173.4
252.9
10
8.8
174.6
200.9
78.8
155.6
249 79
. 6
149.4
200.
786.2
13
5.6
Ch
lori
de
(Cl)
33
.07
.817
.030
. 1
6.6
15
.429
.66.3
15
.232
.07.
515
. 5
26.
79.0
16.
643
. 5
4.6
16.
128
.78
.215
.029
.67
.215
.932
.47.0
15
.724
. 1
6.9
13
.6
Dis
solv
ed
soli
ds
(at
103°
C)
566
376
473
698
300
453
626
306
462
711
276
450
623
368
468
839
256
478
652
321
458
614
234
431
701
231
432
624
290
420
To
tal
har
dnes
s (C
aCO
3)
314
165
236
357
149
221
321
157
238
375
167
239
332
184
233
296
159
239
331
147
233
326
166
228
368
136
220
344
140
224
Nonca
rbonat
e har
dnes
s 116 56 85 116 29 71 139
£50
H
OR
W
86
£,no
yO
O
|rj
84
Q10
8 c|
63
^84
M
118 53
§
81
H12
0 a
39
M86
W
118
g56
£
90
124
o34
H
68
^94
> P
Qct
D
|rj
66
>
Su
mm
ary
fo
r 1
0-Y
ear
Per
iod
Max
imu
mM
inim
um
Aver
age
24.
64
.212
. 3
5.6 .2 1.9
100.8
36.6
60.2
34.2
10.0
19.0
89 16 52
18 00.
5
339
120
183
26
2.8
78.8
16
2.2
42.
54
.615
.6
839
231
452
396
136
231
139 25 80

SURFACE WATER 15
Sodium and potassium Magnesium Calcium
0 10 20 31 10 20 28 10 20 31 10 20 30 10 20 31 10 20 30 10 20 31 10 20 -31 10 20 30 10 20 31 10 20 30 10 20 31 JANUARY FEBRUARY MARCH APRIL MAY JUNE JULY AUGUST SEPTEMBER OCTOBER NOVEMBER DECEMBER
Figure 7. Relation between streamflow and chemcial composition of the water, Missouri River, 1951.
The reacting values of the various constituents, or concentration expressed in equivalents per million, were used in preparation of the bar diagrams in figure 7. Such expression represents the true chemical re lations of the ions in solution where the sum of the pre
dominant positively charged ions (calcium, magnesium, sodium, and potassium) is equal to the sum of the pre dominant negatively charged ions (carbonate, bicarbon ate, sulfate, and chloride). Figure 8 shows the hard ness of the river water for the period 1946-51.
JANUARY FEBRUARY AUGUST SEPTEMBER OCTOBER NOVEMBER DECEMBER
Figure 8.-Hardness of untreated Missouri River water at Kansas City, Mo. , water-treatment plant, 1946-51.
16 WATER RESOURCES OF THE KANSAS CITY AREA
o
-2000
Figure
1942 1945 1946 1947 1948 I960 1951
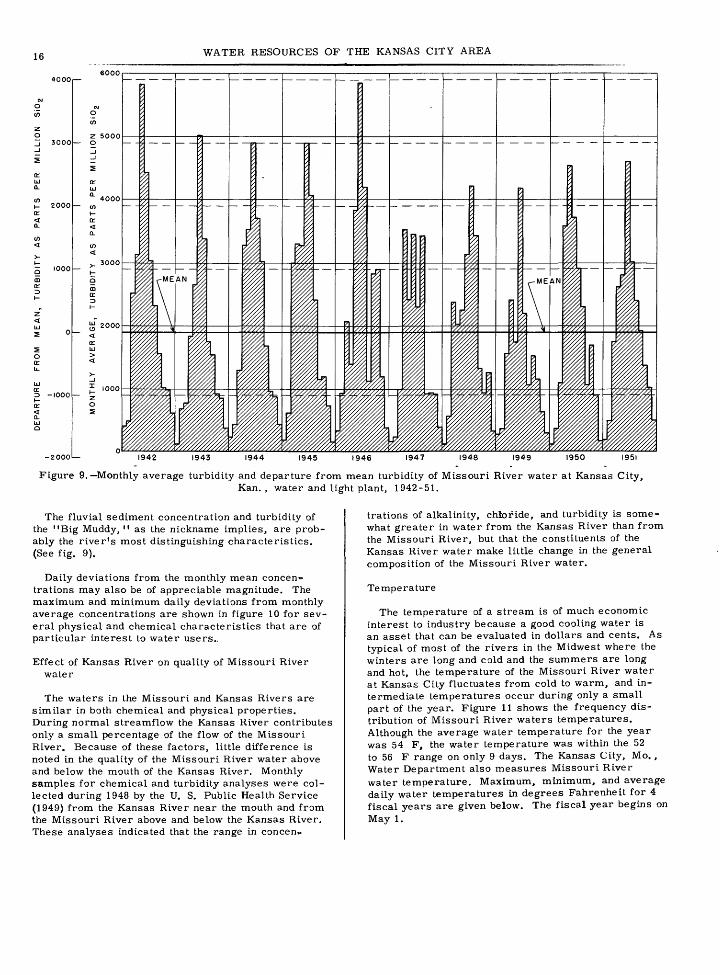
9. Monthly average turbidity and departure from mean turbidity of Missouri River water at Kansas City,Kan. , water and light plant, 1942-51.
The fluvial sediment concentration and turbidity of the "Big Muddy, " as the nickname implies, are prob ably the river's most distinguishing characteristics. (See fig. 9).
Daily deviations from the monthly mean concen trations may also be of appreciable magnitude. The maximum and minimum daily deviations from monthly average concentrations are shown in figure 10 for sev eral physical and chemical characteristics that are of particular interest to water users..
Effect of Kansas River on quality of Missouri River water
The waters in the Missouri and Kansas Rivers are similar in both chemical and physical properties. During normal streamflow the Kansas River contributes only a small percentage of the flow of the Missouri River. Because of these factors, little difference is noted in the quality of the Missouri River water above and below the mouth of the Kansas River. Monthly samples for chemical and turbidity analyses were col lected during 1948 by the U. S. Public Health Service (1949) from the Kansas River near the mouth and from the Missouri River above and below the Kansas River. These analyses indicated that the range in concen
trations of alkalinity, chloride, and turbidity is some what greater in water from the Kansas River than from the Missouri River, but that the constituents of the Kansas River water make little change in the general composition of the Missouri River water.
Temperature
The temperature of a stream is of much economic interest to industry because a good cooling water is an asset that can be evaluated in dollars and cents. As typical of most of the rivers in the Midwest where the winters are long and cold and the summers are long and hot, the temperature of the Missouri River water at Kansas City fluctuates from cold to warm, and in termediate temperatures occur during only a small part of the year. Figure 11 shows the frequency dis tribution of Missouri River waters temperatures. Although the average water temperature for the year was 54 F, the water temperature was within the 52 to 56 F range on only 9 days. The Kansas City, Mo., Water Department also measures Missouri River water temperature. Maximum, minimum, and average daily water temperatures in degrees Fahrenheit for 4 fiscal years are given below. The fiscal year begins on May 1.

SURFACE WATER 17
10,000TURBIDITY COLOR
1000
° -1000
-10,000
VT////,
/77.Y//Y7/,
772.
777 2Z
\\\
777
y//
y/7.
Figures denote monthly overage
Y/7 V//y/7.YZ,
Figures denote monthly average
-35
ALKALINITY HYDROGEN ION CONCENTRATION
Figures denote monthly overage
+ 0.6
+ 0.5
+ 0.4
+ 0.3
+0.2
+ 0.1
S. C
-O.I
-0.2
-0.3
-0.4
-0.5
-0.6
Figures denote monthly average
Figure 10. Maximum daily deviations from monthly averages for several physical and chemical characteristics,Missouri River water, 1951,

18 WATER RESOURCES OF THE KANSAS CITY AREA
120
al mean, 54
32to3637to4l42to4647to 5l52ta5657to 61 62to66 67to 7 72to7677to 8l82to86
TEMPERATURE RANGE, IN DEGREES FAHRENHEIT
Figure 11. Temperature characteristics of Missouri River water at northeast plant of Kansas City Power & LightCo. , 1951.
MaximumMinimumAverage
1947-48
823255
1948-49
803457
1949-50
793455
1950-51
733352
Kansas River at Bonner Springs, Kans.
The Kansas River at the Bonner Springs gage, 20. 2 miles above the mouth, has a drainage area of 59, 890
square miles. At the mouth the drainage area is 60, 060 square miles. The river is formed by the con fluence of the Republican and Smoky Hill Rivers near Junction City, Kans. The Kansas River basin includes parts of northeast Colorado, southern Nebraska, and nearly all the northern half of Kansas. The basin is about 480 miles long, its average width is 140 miles, and it is entirely within the Great Plains province.
The average annual precipitation over the Kansas River basin varies from about 15 inches in the western
JAN. FEB. MAR. APR. MAY JUNE JUL AUG. SEPT. OCT. NOV. DEC.
Figure 12. Maximum, minimum, and average monthly discharge of the Kansas River at Bonner Springs, Kan. ,1917-51

SURFACE WATER 19
ELEVATION, IN FEET, ABOVE MEAN SEA LEVEL, (929 DATUM -j ~-j >sj >
a
-*! 00 Q O O (
S
Z^/
/
/'/
//
/
/'//
///
JfC
^*
/
^^^^
^,^
\ 1.5 2 3 4 5 6 7 8 9 10 15 20 30 40 50 60 70 80 90 1(
RECURRENCE INTERVAL, IN YEARS Figure 13. Flood-stage frequencies on the Kansas River at Bonner Springs, Kan. , 1917-51.
part to about 36 inches in the eastern part. The annual runoff ranges from about 8 inches in the eastern part of the basin to less than 0. 5 inch in the western part.
The runoff of the Kansas River basin is little affected by snow. Heavy general rains are the cause of floods in the basin and are also the cause of comparatively high flows typical of spring and early summer runoff. The period of heavy rainfall in the basin is generally from about May 16 to July 15 although floods of con siderable size can occur at any time between the end and the beginning of winter.
Navigation
The Kansas River was navigated by regular passen ger and freight steamboats during the period 1850 to 1866, but only through necessity and with great diffi culty. At present it is used only for navigation incident to sand-dredging operations.
Discharge
The average discharge of the Kansas River at Bonner Springs, Kans. , for the 34 years of Geological Survey
record (1917-51) is 6,867 cfs. The maximum, mini mum, and average monthly discharges are given in figure 12. The minimum discharge since the gaging
() station was established in July 1917 is 168 mgd (260 cfs) on February'20, 1939. The water-surface eleva tion at the gage corresponding to the minimum dis charge is 748. 45 feet above mean sea level, datum of 1929.
Floods
Continuous records of floods at Bonner Springs began in July 1917 with the establishment of the U. S. Geological Survey gaging station. The flood stage at the gaging station is 21 feet. The maximum flood known reached a stage of 38. 58 feet on July 13, 1951, discharge 510,000 cfs (U. S. Geological Survey, 1952, p. 111). Selected major floods are given in table 6, and a flood-stage frequency graph is shown in figure 13.
The highest stage during the year in the 34-year period 1917 to 1951 has occurred one or more times in every month except January and December.

20 WATER RESOURCES OF THE KANSAS CITY AREA
Table 6. Selected major floods on the Kansas River at Bonner Springs, Kans. , 1917-51
[Gage height plus 747. 01 equals elevation above mean sea level, datum of 1929]
Date
Mar. 17, 1919Apr. 21, 1929June 6, 1935Oct. 11, 1941June 18, 1943Apr. 24, 1944Apr. 18, 1945July 13, 1951
Gageheight(feet)
22. 2022. 2023. 0521.6025. 2324. 3523. 9038. 58
Elevationabove mean sea level
(feet)
769. 21769. 21770. 06768.61772. 24771. 36770. 91785. 59
The highest stage in the year occurred once (3 percent of the time) in each of the following months February, March, August, and November. The highest stage during the year occurred in June, 26 percent of the time; in May, 17 percent; in each of April and July, 15 percent; in October, 9 percent; and in September, 6 percent.
A water-surface profile of the Kansas River between Bonner Springs and the mouth during selected floods is shown in figure 14. Areas inundated by the floods of July 1951 and April 1952 are shown on plate 1. The area adjacent to the river is protected by levees and a flood wall. (See plate 1. )
Quality
Kansas River water at Kansas City, like that of the Missouri River, is a composite of diversified water
74020 19 18 15 14 13. 12 11 10 9 8 7
MILES ABOVE MOUTH OF KANSAS RIVER
Figure 14. Water-surface profile for selected floods on the Kansas River, Bonner Springs to the mouth.

300
SURFACE WATER
ALKALINITY and CHLORIDE
21
1000 10,000
DISCHARGE, IN CUBIC FEET PER SECOND
100,000
TURBIDITYJ,UUU
1000
100
10 10
V
/f ///
/ f-
'
/
/.
///
//
'
/y-
^
/
s+ s/'
/
/I 9
_^ff^^^^
^S" *
00 10,000 100,
DISCHARGE, IN CUBIC FEET PER SECOND
Figure 15. Relation of strearnflow to quality of Kansas River water at the Intercity Viaduct.

22 WATER RESOURCES OF THE KANSAS CITY AREA
Table 7. Mineral constituents and related physical measurements, Kansas, Blue and Little Blue Rivers
[Analyses in parts per million except as indicated]
Kansas Riverat
Bonner Springs, Kans.
Blue Rivernear
Kansas City, Mo.
Little Blue Rivernear
Lake City, Mo.
Date of collection.............. 10-18-45Discharge (cfs)................. 2,800Temperature (°F)..............Silica (SiO2 )..................... 18Iron (Fe)......................... . 12Calcium (Ca).................... 95Magnesium (Mg)............... 24Sodium (Na)..................... 100Potassium (K)..............,... 7.0Bicarbonate (HCO3 )........... 293Carbonate (CO3)............... 0Sulfate (SO4).................... 114Chloride (Cl).................... 137Fluoride (F)..................... ,2Nitrate (NO3 )................... 4.3Boron (B)........................ .02Dissolved solids:
Parts per million........... 658Tons per acre-foot.........
Hardness as CaGO,:Total........................... 336Noncarbonate................ 96
Percent sodium................ 39Specific conductance
(micromhos)................. 1, 080pH.................................. 7. 4Turbidity.........................
7-7-52 6,850
78 13
. 04 43 7.4
43
1290
4353
.45.3.05
310
1383240
4767. 5
350
5-10-52 99 59 9.7
. 04 84
8. 1
14
2570
476. 5
. 25.6.04
314
2433211
4968.0
25
7-10-525. 5
86 11
.02 51 7.3
25
1620
5411
.48.6
. 10
276
1572426
4137. 5
15
5-10-52 121
58 11
.04 79
7. 1
14
2280
508.0.2
5.9.05
318
2263912
4705. 1
120
7-11-52 16. 2 78 14
. 04 71
6. 1
12
2110
388.0.2
4. 9.06
310
2022912
4387. 5
140
types. In the Republican River, which is the main stem of the Kansas River, calcium, bicarbonate, and sulfate are the predominant ions in solution. On the other hand, the Dakota sandstone in north-central Kansas discharges appreciable quantities of ground water high in sodium chloride to the Smoky Hill River and some of its tributaries.
The Kansas River water has a wider range in quality than Missouri River water because the drainage area of the Kansas River is smaller and therefore variation in climatic and meterologic conditions within the basin have a greater effect. Figure 15 shows the relation of streamflow to alkalinity, chloride, and turbidity for samples analysed in 1948 by the U. S. Public Health Service (1949). Although the alkalinity and chloride curves are approximately parallel, a positive devi ation from one curve is generally accompanied by a negative deviation from the other for discharges less than 5, 000 cfs. This relation illustrates the effect of local conditions on the quality of the river water. Above 5, 000 cfs the deviation from both curves is in the same direction, which merely indicates the extent of dilution of the ions in solution. River water is gen erally more mineralized during a rising stage than during a falling stage.
Maximum, minimum, and mean concentrations of selected chemical characteristics and related physical measurements of Kansas River water near Holliday, Kans., 1907-08, are given below (Parker, 1911):
Mean discharge (cfs) Calcium (Ca) Magnesium (Mg) Sulfate (S04 ) Chloride (Cl) Dissolved solids Alkalinity
Maximum (ppm)
87,00011046
119123672388
Minimum (ppm)
3, 04044
2. 328
6. 5217
66
Mean (ppm)
8,69973166141
372261
1 Gaging station at Topeka, Kans.
These analyses represent composites of daily samples over approximately 10-day periods. Table 7 gives concentrations for several constituents in recent samples collected during low flow from the Kansas River.
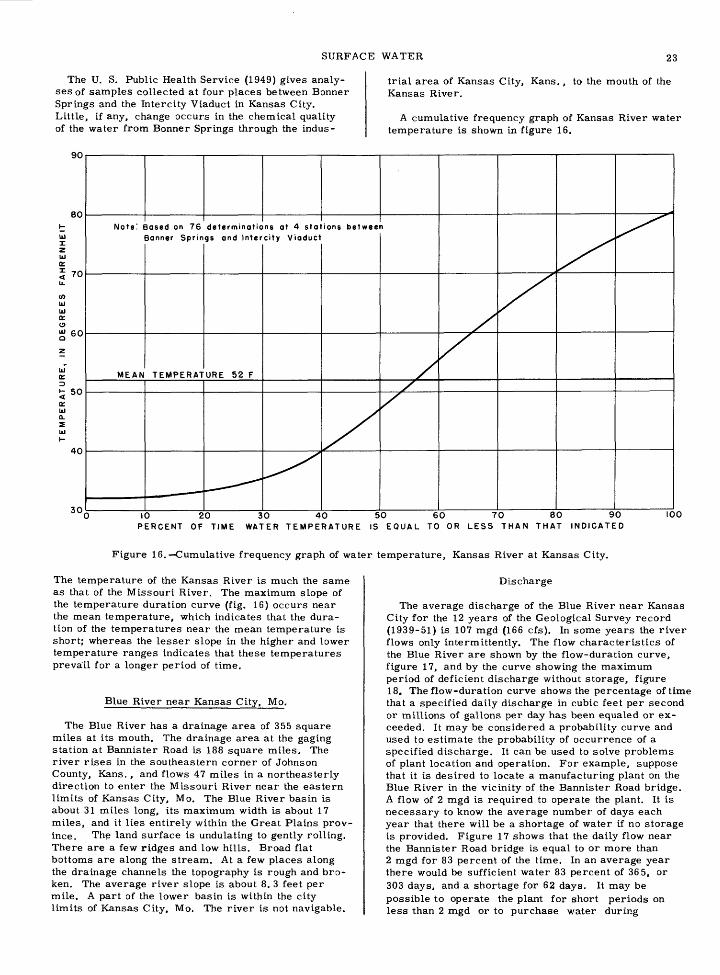
SURFACE WATER 23
The U. S. Public Health Service (1949) gives analy ses of samples collected at four places between Bonner Springs and the Intercity Viaduct in Kansas City. Little, if any, change occurs in the chemical quality of the water from Bonner Springs through the indus
trial area of Kansas City, Kans., to the mouth of the Kansas River.
A cumulative frequency graph of Kansas River water temperature is shown in figure 16.
90
80
70
60
50
40
30
Note! Based on 76 determinations at 4 stations between Banner Springs and Intercity Viaduct
MEAN TEMPERATURE 52 F
10 20 30 40 50 60 70 80 90 PERCENT OF TIME WATER TEMPERATURE IS EQUAL TO OR LESS THAN THAT INDICATED
100
Figure 16. Cumulative frequency graph of water temperature, Kansas River at Kansas City.
The temperature of the Kansas RLver is much the same as that of the Missouri River. The maximum slope of the temperature duration curve (fig. 16) occurs near the mean temperature, which indicates that the dura tion of the temperatures near the mean temperature is short; whereas the lesser slope in the higher and lower temperature ranges indicates that these temperatures prevail for a longer period of time.
Blue River near Kansas City, Mo,
The Blue River has a drainage area of 355 square miles at its mouth. The drainage area at the gaging station at Bannister Road is 188 square miles. The river rises in the southeastern corner of Johnson County, Kans. , and flows 47 miles in a northeasterly direction to enter the Missouri River near the eastern limits of Kansas City, Mo. The Blue River basin is about 31 miles long, its maximum width is about 17 miles, and it lies entirely within the Great Plains prov ince. The land surface is undulating to gently rolling. There are a few ridges and low hills. Broad flat bottoms are along the stream. At a few places along the drainage channels the topography is rough and bro ken. The average river slope is about 8. 3 feet per mile. A part of the lower basin is within the city limits of Kansas City, Mo. The river is not navigable.
Discharge
The average discharge of the Blue River near Kansas City for the 12 years of the Geological Survey record (1939-51) is 107 mgd (166 cfs). In some years the river flows only intermittently. The flow characteristics of the Blue River are shown by the flow-duration curve, figure 17, and by the curve showing the maximum period of deficient discharge without storage, figure 18. The flow-duration curve shows the percentage of time that a specified daily discharge in cubic feet per second or millions of gallons per day has been equaled or ex ceeded. It may be considered a probability curve and used to estimate the probability of occurrence of a specified discharge. It can be used to solve problems of plant location and operation. For example, suppose that it is desired to locate a manufacturing plant on the Blue River in the vicinity of the Bannister Road bridge. A flow of 2 mgd is required to operate the plant. It is necessary to know the average number of days each year that there will be a shortage of water if no storage is provided. Figure 17 shows that the daily flow near the Bannister Road bridge is equal to or more than 2 mgd for 83 percent of the time. In an average year there would be sufficient water 83 percent of 365, or 303 days, and a shortage for 62 days. It may be possible to operate the plant for short periods on less than 2 mgd or to purchase water during

24 WATER RESOURCES OF THE KANSAS CITY AREA
10,000-
8000-6000- 5000-
4000 :3000-
2000-
1000- 800 :
600- 500- 400 :
300-
200
100- 80-
5 50- o 40-
20-J
10- 8'-
6- 5- 4:
2_
10,0008000' 6000
50004000'
SOOOi
2000
1000 800
600 500 400
300,
200
ic " 100
2 80
j 60 § 50
5 40
d so1 : 20L?
3C
J 1005 8
6 5 4
3
2
1.8
.6
.5
.4
.3
.2
.1
v--vsv\
KV-
v v\\\\
\Sr
-V
AV\
\s\\\ ^v\
\>v\\\ *
xample; The daily flow may b expected to equal or exceed 2 mgd 83 percent af the ti
\\\\\\\
'
\-
e
ne
0.05 0.1 0.2 0.5 12 5 10 20 30 40 50 60 70 80 90 95
PERCENT OF TIME DISCHARGE EQUALED OR EXCEEDED THAT SHOWN
98 99 99.5 99.8 99.9
Figure 17.-Duration curve of daily flows, Blue River near Kansas City, Mo. , 1939-51.
periods of shortages. Therefore, it is necessary to know the maximum number of consecutive days, even in unusual years, that the flow will be less than 2 mgd. The flow at the Bannister Road bridge may be expected to be less than 2 mgd for not more than 6 consecutive months (fig. 18). Figure 18 also shows that the aver age flow for any 8-month period will not be less than 2 mgd.
Floods
Records of floods at the Blue River gaging site in clude the flood of November 17, 1928, and are contin
uous since May 1939. The flood stage at the gaging site is 14 feet. The maximum stage known was about 39 feet above gage datum or 793 feet above mean sea level on November 17, 1928. The maximum stage since the gaging station was established is 38. 30 feet July 11, 1951, or an elevation of 792. 03 feet above mean sea level. Selected major floods are given in table 8, and a flood-stage frequency graph is shown in figure 19.

SURFACE WATER 25
800-
600-
500-
400-
300-
200-
100-
Q 80-Og 60-
2] 50H
o 30- m
8-
6-
5-
4-
3-
500
400
200
100
80
Q 50 a: S 40
O 30Maximum period of deficient discharge'
Example: The daily flow may be expected to be less than 2 mgd for not more than 6 consecutive months
Average discharge"
[.Lowest average discharge for indicated period
Example: The average flow. far any 8-month period may be expected to be not less than 2 mgd
5 678 10 20 5 6 7 8 9 10 12 18 24 36 48
CONSECUTIVE DAYS CONSECUTIVE MONTHS
Figure 18. Discharge available without storage, Blue River near Kansas City, Mo., 1939-51.
Quality
Chemical analyses of samples collected from the Blue River are given in table 7. The water is the calcium carbonate type.
Temperatures of the water of Blue River fluctuates with the mean daily air temperature.
Little Blue River near Lake City. Mo.
The Little Blue River at the gaging station at State Route 78 has a drainage area of 184 square miles. At the mouth the drainage area is 207 square miles. The basin is about 33 miles long with a maximum width of about 12 miles, and it lies within the Great Plains province. The topography is gently rolling, and there
are a few hills. Along the stream beds the topography is rough and broken. The main stream and the chief tributaries meander through broad flat bottoms.
Discharge
The average discharge of the Little Blue River for the 3 years of Geological Survey record (1948-51) is 95. 7 mgd (148 cfs). The minimum discharge of record is 1. 1 mgd (1. 7 cfs) June 11, 12, 1948. The low-flow characteristics of the Little Blue River are shown by the flow-duration curve, figure 20. This curve shows the percentage of time that a specified daily discharge in cubic feet per second or millions of gallons per day has been equaled or exceeded. It may be considered a probability curve and used to estimate the probability of occurrence of a specified discharge. Caution should
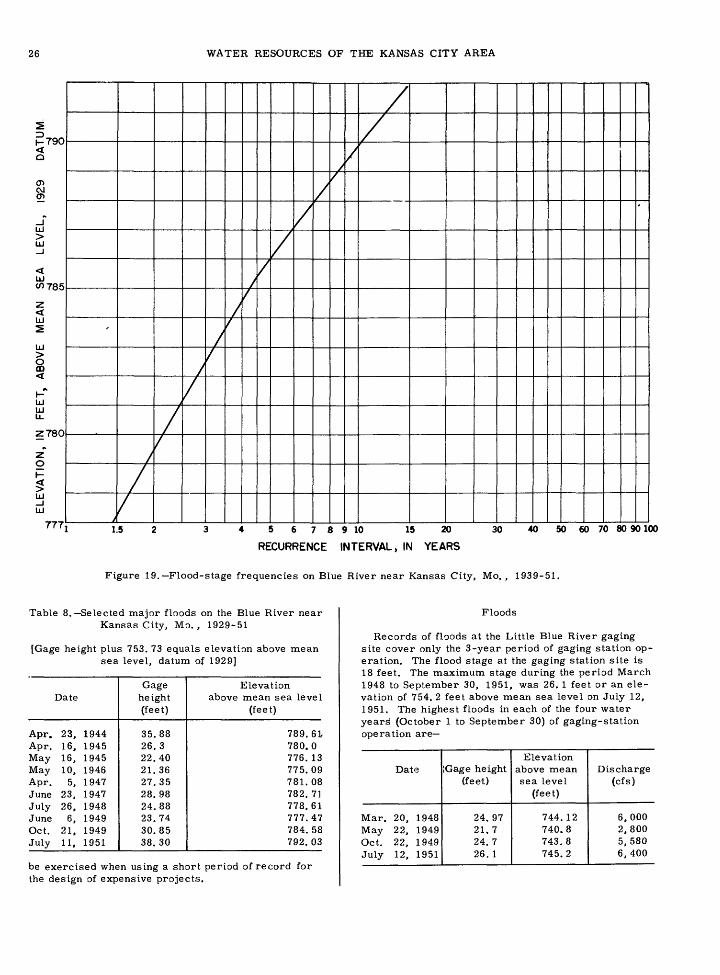
26 WATER RESOURCES OF THE KANSAS CITY AREA
H790
O
(Mcn
_j"LU
UJ_j
UJ
2
Ul
Ul
1Ul Ulu_
2780z"
o
Ul_JUl
777
'
f
/
/
/
/
>
/
//
//
y '
/
/
/
/
//
/
/
/
1.5 2 3 4 5 6 7 8 9 10 15 20 30 40 50 60 70 80 90 1(
RECURRENCE INTERVAL, IN YEARS
Figure 19. Flood-stage frequencies on Blue River near Kansas City, Mo. , 1939-51.
Table 8. Selected major floods on the Blue River near Kansas City, Mo., 1929-51
[Gage height plus 753. 73 equals elevation above mean sea level, datum of 1929]
Date
Apr. 23, 1944Apr. 16, 1945May 16, 1945May 10, 1946Apr. 5, 1947June 23, 1947July 26, 1948June 6, 1949Oct. 21, 1949July 11, 1951
Gageheight(feet)
35.8826.322.4021.3627.3528.9824.8823.7430.8538. 30
Elevationabove mean sea level
(feet)
789.61780.0776. 13775.09781.08782. 71778.61777.47784. 58792.03
be exercised when using a short period of record for the design of expensive projects.
Floods
Records of floods at the Little Blue River gaging site cover only the 3-year period of gaging station op eration. The flood stage at the gaging station site is 18 feet. The maximum stage during the period March 1948 to September 30, 1951, was 26. 1 feet or an ele vation of 754. 2 feet above mean sea level on July 12, 1951. The highest floods in each of the four water years (October 1 to September 30) of gaging-station operation are
Date
Mar. 20, 1948May 22, 1949 Oct. 22, 1949July 12, 1951
IGage height (feet)
24. 9721. 7 24. 726. 1
Elevationabove mean sea level
(feet)
744. 12740.8 743.8745.2
Discharge (cfs)
6,0002,800 5, 5806,400

10000
8000
OU
UU
5000
40
00
2000
o
1000
u3
800
C/3
Uj
DU
U°-
500
tj
40
0-
u_
pnn
53
o
200
z UJ a: <
10
0
o
80 _
Q
60-
50
40
20
10
8
6
5
4
2
10
0U
U
80
00
6000
cnnn
40
00
OU
UU
20
00
1 U
UU
<
800
o:
600
ol
500
£
400
O J
300
S z
200
O i z
100
<
60o
50
Q
40 20 10 6 5 4 3 2 1
V>
\^S
\\
\\
~\ \"v \̂\\
^ \
\
X \ \
s > . x \̂^ \s \
^ \\
~^^_ >. >^
NyX
. ^^^
t>
^^i
^.^V
^ ^%
"
"̂*>"^
* ̂
w c| V
> O
W > w &
0.01
0.05
0.1
0.
2 0.
512
5 10
20
30
40
50
60
70
80
90
95
PE
RC
EN
T O
F T
IME
D
ISC
HA
RG
E
EQ
UA
LED
O
R
EX
CE
ED
ED
TH
AT
SH
OW
N
98
99
99.5
99
.8 9
9.9
99.9
9
Fig
ure
20.-
Dura
tion c
urv
e of
dai
ly f
low
s,
Lit
tle
Blu
e R
iver
near
Lak
e C
ity,
Mo.
,
19
48
-51
.

28 WATER RESOURCES OF THK KANSAS CITY AREA
Quality Consolidated f ormations
Chemical analyses of samples collected from the Little Blue River are given in table 7. The water is the calcium carbonate type.
Temperatures of the waters of the Little Blue River fluctuate with the mean daily air temperature.
GROUND WATER
Ground water occurs throughout the Kansas City area; however, it is not available everywhere in such quantity or quality as to be an important resource for industrial and municipal use. The nature and position of the geologic formations exert an important control over the occurrence, quantity, and quality of ground water. A brief description of the geology with empha sis on the principal water-bearing deposits follows.
The Kansas City area is underlain by relatively old consolidated rocks. The consolidated rocks (bedrock) crop out in the uplands, but in the flood plains they are overlain by alluvium deposited by the streams. This alluvial material in the valleys of the larger streams is the only important source of large quan tities of ground water in the Kansas City area.
In general water obtained from a well in consolidated rock is relatively constant in chemical quality and temperature. No comparable constancy exists, how ever, for wells in the alluvium in the Kansas City area. The chemical quality of water in the alluvium is dependent upon the quantity of water drawn from the bedrocks, the quantity of more dilute river water moving into the alluvium from the river, and the quan tity of material dissolved from the alluvium. Under natural conditions the balance between inflow of water from bedrock and water from the river is dependent on the hydraulic gradient, the permeability of the bed rock as well as the alluvium, the river stage, and the position of the well in the alluvium in relation to the bedrock and the river. Any shift in the balance by changes of the river stage or in the quality of the river water will be reflected in the chemical quality and to a lesser extent in the temperature of water from wells in the alluvium near the river.
Because of the relatively high permeability of the alluvium of the Kansas and Missouri Rivers and the lower permeability of the bedrock, pumpage of a well, or wells, in the vicinity may displace the balance in favor of increased inflow from the river, which re sults in a decrease in mineral concentration of the water. An example is evident at a well on a narrow stretch of alluvium at the foot of Grand Avenue in Kansas City, Mo. The dissolved solids in the water in this well decreased from 548 ppm when not oper ating to 492 ppm when pumped at 175 gpm during a test in 1952. The effect of pumping on other charac teristics of the water from this well is shown in figure 28.
Observed chemical quality of water in the alluvium and the effect of river stage and pumpage on the chem ical quality of the water are presented in the sections on ground-water quality and induced infiltration. Geo logic and hydrologic conditions are too variable to predict in detail the quality of water from the alluvium; however, the analyses do indicate variations in chem ical quality.
The rocks of this region consist of beds of limestone, shale, and sandstone dipping gently to the northwest about ten feet to the mile. This dip is prevalent over all of eastern Kansas and the adjacent area in Missou ri. The land surface is not parallel to the dipping rock layers, but slopes downward to the east, which ac counts for the cropping out of the older rocks in the eastern part of the area and the younger rocks in the western part.
Bedrock aquifers of Wyandotte and Johnson Counties, Kans. , supply sufficient water for farm and domestic needs but are no't generally considered sources of good quality water. Information from the Missouri Division of Geological Survey and Water Resources indicates small yields of mineralized water from the rock for mations in Platte and Clay Counties, Mo. , and small yields of fresh water in wells to depths of 500 feet from consolidated material in Jackson County, Mo. Although many of the water-bearing materials yield brines and water otherwise unfit for domestic or in dustrial utilization, some of the better quality water in the Kansas City area is also available from bedrock formations.
Unconsolidated deposits
Alluvium occurs in the Kansas and Missouri River valley and some of their larger tributaries including Blue and Little Blue River valleys. The alluvium con sists of stream-laid deposits that range in texture from clay and silt to sand and very coarse gravel. The character of the alluvium differs greatly from place to place depending on its origin and mode of deposition. Much of the alluvium in the Kansas River valley near Kansas City is probably of glacial origin, having been deposited as glacial outwash by the swollen streams that emanated from the melting ice sheets just north of the area. Test holes were drilled along 5 lines across the Kansas River valley and along 2 lines a- cross the Missouri River valley to determine the thickness and character of the alluvium in the 2 valleys. A cross section of the Missouri River valley and 3 cross sections of the Kansas River valley are shown in figure 21. The locations of the cross sections are shown on plate 2, and the logs of the test holes are given by Fishel (1948, p. 58-106).
The Kansas City area has been divided into 5 sub- areas for purposes of discussion. These subareas are 1, the Fairfax district, North Kansas City and north east district; 2, Independence and Little Blue River area; 3, East Armourdale and central districts; 4, Argentine and west Armourdale districts; and 5, Kan sas River valley, west of Kansas City. (See plate 1. ) The availability and quality of the ground water will be discussed for each area.
Fairfax district, North Kansas City, and rnortheast district
The flood plain of the Missouri River valley adjacent to Kansas City is divided by the river into 3 industrial districts. The Fairfax district is in a loop south of the river and is in Kansas. Across the river to the east is the North Kansas City area and across the river to the southeast from North Kansas City is the northeast in dustrial district. The flood plain of the Missouri River comprising the 3 districts is about 2 miles wide and about 5 miles long.

GROUND WATER 29
The alluvial deposits in this area average about 95 feet in thickness. The deposits consist of clay, silt, sand, and gravel. Over much of the area the material near the surface consists of fairly impermeable clay and silt; however, at some places the upper material consists of fairly permeable silt and sand. The under lying material down to bedrock consists of beds of fairly well-sorted sand and gravel interbedded with layers of silt and clay. The material in the lower part of the deposits is generally very permeable. The following log of a test hole drilled by the State Geolog ical Survey of Kansas in 1944 is typical of the material found in much of the area. The test hole is in the south east corner NE? NEj sec. 28, T. 10 S. , R. 25 E., near the south end of the bridge on Seventh Street Trafficway (Fishel, 1948, p. 61, log 8).
Alluvium: Silt, partly clayey, yellow
gray; contains some fine sand.. Sand, medium to fine; containing
very little fine gravel (water level, 13. 8 feet below land surface)...............................
Sand, coarse to fine, and some
Gravel, fine to coarse, and
Gravel, medium to fine, medium
Gravel, fine to medium, and
Gravel, coarse to fine, and
Bedrock: Shale, light gray-green,
Thickness (feet)
10
10
10
20
10
10
34
2
Depth (feet)
10
20
30
50
60
70
104
106
The water table in this part of the Missouri River valley lies from about 6 to 20 feet below the land sur face, but it may be considerably lower in cones of de pression near pumped wells. The approximate thick ness of the saturated alluvium is shown in figure 22. The Missouri River valley includes a large area where the alluvium has a saturated thickness of more than 80 feet; in some places it is more than 100 feet.
The alluvial deposits in this area are very permeable. Pumping tests were made on 2 wells in the Fairfax dis trict to determine permeability (Fishel, 1948, p. 25). The 2 tests indicate that the water-bearing materials in the Fairfax district have a permeability of about 3, 000 measured in Meinzer's units which give the per meability in gallons per day, conducted laterally through each mile of the water-bearing bed under in vestigation (measured at right angles to the direction of flow) for each foot of thickness of the bed and for each foot per mile of hydraulic gradient and at 60 F. Thus, the quantity of water that theoretically can move
in 1 day through an area 1 mile wide underlain by 100 feet of saturated sand and gravel is 3 million gallons when the gradient of the water table is 10 feet per mile.
Wells on which records were collected have an av erage yield of 980 gpm (gallons per minute) and an av erage specific capacity of 60. The specific capicity of a well is its rate of yield in gallons per minute per foot of drawdown. A well drilled for North American Avi ation Co., Inc. (now owned by General Motors Corp. ) had a yield of 1, 500 gpm with a drawdown of about 5 feet.
Chemical analyses of water from the Missouri River alluvium are given in table 9. High hardness and iron concentrations characterize these waters. Bicarbonate is present in near equivalent proportion to hardness- forming calcium and magnesium in most of the water. In general, water of this type is limited to cooling and other industrial uses that do not require soaps or drastic changes in temperature of the water. An in crease in temperature favors the decomposition of cal cium bicarbonate to the relatively insoluble calcium cfarbonate. At high temperature calcium carbonate is very insoluble. Iron, when present in the concen trations found in the majority of these samples, is likely to precipitate in pipes, coils, and radiators; this results in loss of flow and heat exchange capacity.
A summation of the concentrations of a few of the more important chemical constituents of the ground- water samples from the Fairfax and North Kansas City areas is given in table 10.
A cross section showing hardness and iron concen trations of water from wells in the Missouri River alluvium in the Fairfax district is shown in figure 21. The lower hardness of water near the river shows the effect of recharge from the river. Differences in the iron content of samples from these wells are not significant.
Ground water of the best quality in the Fairfax and North Kansas City area is within the bends of the great gooseneck of the Missouri River. As indicated in figure 21, wells adjacent to the river and farthest from the outer alluvium fringe will yield the better quality water.
Temperature of the ground water fluctuates between a much narrower range than the temperature of the air. This fluctuation is particularly characteristic of wells near the river that are affected by seasonal re charge of the ground-water reservoir with river water. The average temperature of the water from wells sampled in this area was 58 F; the minimum, 53 F; and the maximum, 64 F.

800
780
H 760
LJ E 74
0
- 720
zf 2 700
H < > 680
LJ _i u 660
640
620
BED
R
OC
K
OF
PE
NN
SY
LVA
NIA
N
AGE
Fa
irfa
x
Dis
tric
t
IOO
O I_H
orizo
nta
l sc
ale
780
t- UJ
760
UJ u_
740
Z Z
720
g 5
70°
> UJ _i
680
UJ
660
800
780
,_
760
LJ £
740
-
720
700
t- >
680
660
640
620
''
('' '
' ' '
-''*
-' -
*£**
"
BED
R
OC
K
OF
PE
NN
SY
LVA
NIA
N
AG
E
Arg
en
tin
e
Dis
tric
t
_
B
BED
R
OC
K
OF
PE
NN
SY
LVA
NIA
N
AG
E
East
Arm
ourd
ale
D
istr
ict
Fig
ures
ab
ove
we
lls
refe
r to
to
tal
hard
ness
as
C
aC0
3 in
p
art
s per
mill
ion
an
d fig
ure
s in
pare
nth
ese
s re
fer
to
iron
as
Fe
in
pa
rts
per
mill
ion
.
Kansa
s R
ive
r V
alle
y
west
of
Kansa
s C
ity
w
>
w O
H
Pre
pa
red
fr
om
S
tate
G
eolo
gic
al
Surv
ey
of
Kansa
s B
ull.
71,
pi.
I, by
V.
C.
F
ishe
l
Fig
ure
21. C
ross
sec
tions
show
ing
the
Mis
souri
and
Kan
sas
Riv
er a
llu
viu
m a
nd h
ardnes
s an
d io
n co
nte
nt
of t
he w
ater
enco
unte
red.

GROUND WATER 31
Thickness of saturated material
PENNSYLVANIA ROCKS
More than 80
Test hole
Figure 22. Thickness of the saturated alluvium in the Kansas and Missouri River valleys in the Kansas City area.

Tab
le 9
. -C
hem
ical
qual
ity
of w
ater
fro
m u
ncon
soli
date
d m
ater
ial
in t
he
Kan
sas
Cit
y ar
ea
[Res
ults
in
part
s pe
r m
illi
on e
xce
pt
as i
nd
icat
ed]
Wat
er-b
eari
ng
mat
eria
l an
d lo
cati
on
Dep
thD
ate
Tem
p
era
tu
re
(T)
Sou
rce
of
dat
aS
ilic
a (S
iOj)
Iron
(F
e)
Cal
ci
um
(C
a)
Mag
ne
sium
(M
g)
Sod
ium
and
po
tass
ium
(N
a +
K)
Bic
ar
bonat
e (H
CQ
,)
Car
b
on
ate
(CO
,)
Sul
fate
(8
04)
Chlo
ri
de
(Cl)
Ni
tr
ate
(NO
,)
Dis
so
lved
so
lids
Har
dnes
s as
C
aCO
a
Tota
lN
on-
car-
bonat
e
PH
Fai
rfax
and
Nor
th K
ansa
s C
ity
Are
a
Mis
sour
i R
iver
all
uv
ium
:N
E'/N
Wy
sec.
22
, T
. 10
S.,
R
. 25
E.
NW
^ST
W%
sec.
22
, T
. 10
S..
R
. 25
E.
y, s
ec.
27,
T.
10 S
.,
R.
25 E
.
flo
...
swys
wy
se'
27,
T.
10 S
.27
, T
. 10
S.
27,
T.
10 S
.
R.
25 E
. R
. 25
E.
R.
25 E
..
27,
T.
10 S
. ,
R.
25 E
. .
27,
T.
10 S
. ,
R.
25 E
.
NE
VjN
Eii
sec.
28
, T
. 10
S.,
R.
25 E
.SE
/WE
"t
sec.
28
, T
. 10
S.,
R.
25 E
.N
E^W
V4
sec.
34
, T
. 10
S.,
R
. 25
E.
NE
l/SE
'/
sec.
34
, T
. 10
S.,
R
. 25
E.
NW
yN
Ei/
sec.
34
, T
. 10
S..
R.
25 E
.
I,..,,,..
,»~
c.
34,
T.
10 S
.,
R.
25 E
.N
W'/N
Wfc
ec.
34,
T.
10 S
. ,
R.
25 E
.N
W'N
W'/s
ec.
34,
T.
10 S
. ,
R.
25 E
.N
W&
E1/,
se
c.
34,
T.
10 S
.,
R.
25 E
.iy
se
c,
34,
T.
10 S
.,
R.
25 E
.
NW
yNW
'/sec
. 35
, T
. 10
S.,
R
. 25
E.
SW
ySW
y se
c.
2,
T.
US
.,
R.
25 E
. Se
c."
14,4
T.
50 N
. ,
R.
33 W
1...
....
....
Sec
. 27
, T
. S
ON
.,
R.
33 W
....
....
....
Sec
. 27
, T
. 50
N.,
R
. 33
W............
SE'/^
sec.
28
, T
. 50
N.,
R.
33 W
....
....
89 105 95.5
95.5
95.5
102
115
105 73.2
104
124 35
.577 71 85
» 10
0
8-1
9-4
48
-19
-44
11-
2-4
31
-24
-44
2-
2-4
4
2-1
8-4
4
8-1
0-4
410-1
4-4
3
8-1
1-4
4
8-
3-4
411-2
3-4
3
8-1
5-4
4
8-1
4-4
4
8-
4-4
4
8-
7-4
4
11-2
3-4
3
7-2
9-4
48-
9
-44
8
-21
-44
8-
8-4
4
11-
2-4
3
11-2
3-4
3
11-
2-4
39-
7-50
7
-15
-32
4-2
0-5
0
(a)
(a)
(a)
(a)
(a)
(a)
(a)
(a)
(a)
(a)
(a)
(a)
(a)
(a)
(<0
(a)
(a)
(<0
(a)
(a)
(a)
(a)
(b)
(c)
(d)
(e)
12
8.0
11 12 9.2
12
.0
8.3
18.0
17 9.7
6.8
19 7.5
6
.4
14 16 24
.01
8.0
8.2
11 14 19 8.3
5.0
6.9
11
.15
.0
105
131
115 96 118 94 141
161
134
140
168 95 96 205
174
153
207
183
129
252
194
150 96 58 78
.87
7.8
84
.5
28 43 31 24 28 23 36 44 32 35 45 22 22 44 47 41 42 40 42 65 54 42 28 25 9.3
11.5
20.0
34 27 22 35 35 34 19 34 37 41 14 40 34 35 22 28 36 20 39 20 25 46 50 12
.0
61
429
655
427
309
342
318
495
637
458
478
617
349
365
456
548
614
527
575
583
47
364
4
680
320
232
230.7
12.6
251.9
0 5.6
72 7.8
91 127
168
115 97 59 137 14
2
100 82 291
152 46 211
130 37 493
174 24 150
140 22
.89
0.2
91
.5
64 15 55 27 12 24 25 21.5
16
.51
4.0
2.0
1
.9
1.8
2.1
2
.5
1.3
2
.3
2.5
2.5
2.1
1.8
2.2
2.2
2.3
2.4
1
.5
2.8
2.1
1.3
2.7
2
.2
1.5
1
.5
4.9
2
480
560
498
466
555
450
583
686
600
635
672
458
437
869
732
538
761
544
1,1
54
807
614
514
392.0
220
541
377
504
414
338
410
329
500
582
466
494
604
328
330
692
627
550
621
494
47
370
6
680
354
248
235.1
304
25 0 64 84 130 68 94 60 90 102
98 42 30 318
177 46 257
149 16 55 178 12 92 58 45.
7.0
7.0
7.3
7.5
Ind
epen
den
ce a
nd L
ittl
e B
lue
Riv
er A
rea
Lit
tle
Blu
e R
iver
all
uviu
m:
NW
yNE
y.
sec.
10
T.
48 N
. ,
R.
31 W
.S
ec.
26,
T.
48 N
..
R.
32 W
.S
ec.
2,
T.
50 N
. ,
R.
31 W
.N
W^s
ec.
11,
T.
50 N
. ,
R.
31 W
.
Gla
cial
dep
osit
s:S
Wv
sec.
11
, T
. 50
N.
, R
. 30
W.
Lak
e C
ity
Val
ley a
lluviu
m:
Sec
. 19
, T
. 50
N.
, R
. 30
W.
Sec
. 29
, T
. 50
N.
, R
. 30
W.
Sec
. 30
, T
. 50
.N.
, R
. 30
W.
SW
yNW
ysec
. 32
, T
. 50
N.
, R
. 30
W.
Lit
tle
Blu
e R
iver
and/ o
r L
ake
Cit
yV
alle
y a
lluviu
m:
sec.
31
, T
. 50
N.
, R
. 30
W.
Lak
e C
ity
Ars
enal
sM
isso
uri
Riv
er a
lluviu
m:
NW
'/.se
c.
29.
T.
50 N
. ,
R.
32 W
4S
ec.
29,
T.
51 N
. ,
R.
21 W
>.
2 28
8 22 92 168
160 76 118 95 66
.5
9079
-98
100 70
10-
4-3
74
-25
-34
4-3
0-3
63
-30
-34
2-1
6-3
4
4-3
0-3
64
-30
-36
6-2
3-3
78
-23
-34
7-1
9-3
411
- 5-
46
4-2
8-5
0-
- - - - - - _ . _ - . . -
(c)
(c)
(c)
(c)
(c)
(c)
(c)
(c)
(c)
(c) (g) $ (f)
10
.01
4.4
20.0
20.0
11
.6
14
.0194.
14. *
14.4
20 15.2
32 30 20.0
5.6
21.1
614.1
81.1
6
. 1.9
51
.12
2.0
010.5
1
1.2
07.0
9 7.0
85.7
91
.4114.4
45
.6
53.7
39
.36
5.1
22
.84
3.3
62
.171 18
6134.5
8.9
9.0
25.7
14.4
8.0
7.7
8.8
6.0
7.3
8.6
8.5
44 26
.4
35
.218.3
18
.712
0.7
21
.2
15
.622.5
16.5
18.4
17
.07.4 .
15
.9
37
1.9
26
6.3
50
5.4
41
6.9
226.8
20
5.0
30
0.4
125.6
173.8
158.5
235
732
47
3.2
0.0
4.0 0 1
5.0
8.2 .0 .0 .0 5.5
4.1
0 0 0
1.9
38
.3 1.6
10.1
3.7 .2 .0 1.2
12.8
47
.530 65 5
3.5
8.8
11
.86.3
50.8
5.4
1.8
6.3
4.4
2.7
28
.02.9
30 12
.6
0.0
05.1
5.2
5.2
5
2.0
1
.00
2.2
114.7
6.5
6
.28
.3 . -
576.0
340.0
445.0
542.0
266.0
190.0
280.0
198.0
237.0
307.0
277
753
575
250.7
265.4
391.4
171.5
167.1
129.8
198.8
81
.6138.1
190.5
212
640
344
0 47
.00 0 0 0 0 0 0 60
.519 40
0
- - - - _ - - - - - 7.4
7.2
6.8
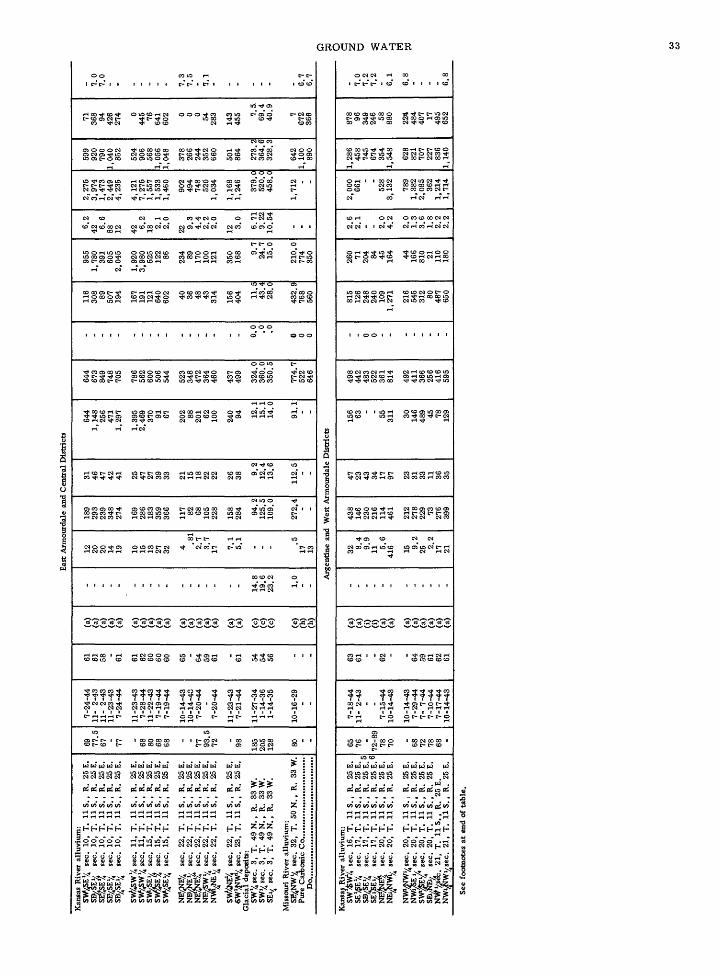
Eas
t A
rmou
rdal
e an
d C
entr
al D
istr
icts
Kan
sas
Riv
er a
lluv
ium
:SW
/SE
1/,
sec.
10
, T
. 11
S.,
R.
25 E
.SB
/SE
y se
c.
10,
T.
11 S
.,
R.
25 E
.SE
%SE
%
sec.
10
, T
. 11
S.,
R.
25 E
.SE
/SE
1/ se
c.
10,
T.
11 S
.,
R.
25 E
.SB
/|SEy
4 se
c.
10,
T.
11 S
., R
. 25
E.
SWV
«SW
y, s
ec.
11,
T.
11 S
., R
. 25
E.
SW/^
W1/
sec.
11
, T
. 11
S.
, R
. 25
E.
SWyS
Ey
sec.
15
. T
. 11
S..
R.
25 E
.SW
^SE%
se
c.
15,
T.
11 S
., R
. 25
E.
SWy4S
E'/4
sec.
15
. T
. 11
S..
R.
25 E
.
NP/
NE1/
sec.
22
. T
. 11
S.,
R.
25 E
.N
B/N
Ey
sec.
22
. T
. U
S.,
R
. 25
E.
NE^
NE1
/;4
sec.
22
, T
. 11
S., R
. 25
E.
NE
/SW
y se
c.
22.
T.
11 S
. .
R.
25 E
.N
W^N
Ei^
sec
. 22
, T
. 11
S., R
. 25
E.
SWV«
NEV4
se
c.
22,
T.
11 S
., R
. 25
E.
SW
'^W
y, s
ec.
23.
T.
11 S
..
R.
25 E
. G
laci
al d
epos
its:
SW
'/ise
c.
3,
T.
49 N
.. R
. 33
W.
SW1/
sec.
3,
T.
49 N
., R
. 33
W.
SEi/4
se
c.
3.
T.
49 N
., R
. 33
W.
Mis
sour
i R
iver
all
uviu
m:
SEf/4N
Wy
sec.
32
, T
. 50
N.,
R.
33 W
. Pu
re C
arbo
nic
Co
....
....
....
....
....
....
....
.
69 77.5
67 77 93.5
72 98 185
205
128
7-24
-44
11-
2-43
11
- 2-
43
11-2
3-43
7-24
-44
11-2
3-43
7-
28-4
411
-22-
43
7-19
-44
7-19
-44
10-1
4-43
10
-14-
43
7-20
-44
11-2
3-43
7-
21-4
4
11-2
7-34
1-
14-3
6 1-
14-3
5
10-1
6-29
61 61 58 61 61 62 60 60 60 65 64 59 61 54 54 56
(a)
(a)
(a)
(a)
(a)
(a) S3 (a)
(a)
(a)
(a)
(a)
(a)
(a)
(a)
(a)
(c)
(c)
(c)
(e)
(h)
(h)
14.8
19.6
23.2
1.0
12 20 20 14 19 10 15 13 27 32 4.8
12.
73.7
17 7.1
5.
1
189
293
239
348
274
169
286
183
359
366
117 82 68 105
228
158
284 94
.212
5.5
109.
0
272.
4
31 46 47 42 41 25 47 27 39 33 21 15 18 22 22 26 38 9.2
12.4
13.6
112.
5
644
1,14
825
647
11,
297
1,39
52,
469
370 91 67 202 88 201 62 100
240 94 12
.115
.114
.0
91.1
644
673
849
748
705
786
562
600
506
544
523
348
472
364
460
437
499
324.
036
0.0
350.
5
774.
752
264
6
0.0
.0
.0
116
308 89 507
194
167
191
121
640
602 40 36 48 43 314
156
404 11
.43.4
28.0
432.
976
856
0
955
1,78
039
160
52,
045
1,92
03,
980
525
122 86 234 89 170
100
121
350
168 9
.724
.715
.0
210.
077
435
0
6.2
42 6.6
88 12 42 6.2
18 2.1 2.0
22 9.3
4.4
2.2 2.0
12 3.0
6.71
9.22
10.5
4
2,27
53,
974
1,47
32,
449
4,23
5
4.12
17,
275
1,55
71,
533
1,46
0
902
494
748
520
1,03
4
1,16
81,
246
379.
052
0.0
458.
0
1,71
2
599
920
790
1,04
085
2
524
906
568
1,05
61,
048
378
266
244
352
660
501
864
273.
236
4.6
328.
3
642
1,10
089
0
71 368 94 426
274 0
445 76 641
602 0 0 0 54 283
143
455 7.
5.
69
.4
40.9 7
672
360
7.0
7.0 7.3
7.5 7.1 6.7
6.7
Arg
enti
ne a
nd W
est
Arm
ourd
ale
Dis
tric
ts
Kan
sas
Riv
er a
lluv
ium
: SW
/fcW
/i se
c.
16.
T.
11 S
. ,
R.
25 E
.SE
'^E
1/,
sec.
17
. T
. 11
S. .
R.
25 E
. SB
/SE
1/ se
c.
17,
T.
11 S
. ,
R.
25 E
.5SE
iSE
y se
c.
17,
T.
US
.,
R.
25
E.6
NE#
NE%
se
c.
20,
T.
11 S
. ,
R.
25 E
. N
EyN
Wy
sec.
20
, T
. 11
S.
, R
. 25
E.
NW
WW
'/sec
. 20
, T
. U
S.,
R.
25 E
. N
Wi/S
Ei/
sec.
20
, T
. U
S.,
R.
25 E
. SW
/gE
1/4
sec.
20
, T
. U
S.,
R.
25 E
.SE
yNEy
se
c.
20,
T.
11 S
. ,
R.
25 E
. N
WV
.sec
. 21
, T
. 11
S.
, R
. 25
E.
NW
yNW
ysec
. 21
, T
. 11
S.
, R
. 25
E.
65 76 78
70 68 78
68
11-
2-43
7-15
-44
10-1
4-43
10-1
4-43
7-
29-4
4
7-10
-44
10-1
4-43
63 61 62 64
59 61 61
(a)
(a)
(i)
(i)
(a)
(a)
(a)
(a)
(a)
(a)
(a)
(a)
- - - -
8.4
9
9
5.6
41
6 15 9.2
25 2
.2
21
146
114
461
212
278
229 73 399
23 17
97 23
31
33 11
36 35
156 63 55
31
1 30
146
489 45
78 129
498
442
483
522
361
814
492
411
366
256
416
595
0 - -
815
126
248
240
109
1,27
1
216
545
312 80
48
765
0
260 71
204 84 45
164 44
166
810 21
11
018
0
2.6
2.1 _ 2.0
4.2 2.0
1.
3 3.6 1.8
2.2
2.2
2,00
066
1 .52
8 3,
132
789
1.38
2 2,
085
362
1.21
41.
714
1,28
645
8 74
567
435
4 1,
548
628
821
707
227
836
1,14
0
878 96
349
246 58
88
0
224
484
407 17
49
565
2
7.0
7.2
7.2 6.1
6.8 - 6.8
See
foo
tnot
es a
t en
d of
tab
le.

Tab
le 9
. -C
hem
ical
qua
lity
of
wat
er f
rom
unc
onso
lida
ted
mat
eria
l in
the
Kan
sas
Cit
y ar
ea-C
onti
nued
[Res
ults
in
part
s pe
r m
illi
on e
xcep
t as
ind
icat
ed]
Wat
er-b
eari
ng m
ater
ial
and
loca
tion
Dep
thD
ate
Tem
per
a
ture
(
F)
Sour
ce
of
data
Sil
ica
(SiO
j)Ir
on
(Fe)
Cal
ci
um
(Ca)
Mag
ne
sium
(M
g)
Sodi
um a
nd
pota
ssiu
m
(Na
+ K
)
Bic
ar
bona
te
(HC
Oj)
Car
bo
nate
(C
O,)
Sul
fate
(S
Ctf
Chl
o
ride
(C
l)
Ni
tr
ate
tNO
»)
Dis
so
lved
so
lids
Har
dnes
s as
C
aCO
j
Tot
alN
on-
car
bo
nate
PH
Kan
sas
Riv
er V
alle
y W
est
of K
ansa
s C
ity
Kan
sas
Riv
er a
lluv
ium
:S
W'J
W/s
ec.
27,
T.
US
.,
R.
23 E
. N
B/S
Wy
sec.
28
, T
. U
S.,
R
. 23
E.
NEJ
JSW
Y1
sec.
28
, T
. 11
S. ,
R
. 23
E.
NW
ySE
'/ se
c.
28,
T.
11 S
. ,
R.
23 E
. N
W^S
E?,
sec
. 28
, T
. 11
S. ,
R
. 23
E.
NW
teE
1/, s
ec.
28,
T.
US
.,
R.
23 E
.S
E'^
W/
sec.
28
, T
. 11
S.
, R
. 23
E.
SEvS
Ei/
sec.
29
, T
. 11S
.T R
. 23
E.
SE&
E1,?1
se
c.
29,
T.
11 S
. ,
R.
23 E
.SW
/4NE
y4 s
ec.
32,
T.
11 S
. ,
R.
23 E
.
SWif
iWy
sec.
32
, T
. 11
S.
. R
. 23
E. '
SW
$W
#se
c.
32.
T.
US
.. R
. 23
E.a
SWyS
Wy
sec.
32
, T
. 11
S.
, R
. 23
E.8
NEK
fcW
/J1 s
ec.
33,
T.
11 S
. .
R.
23 E
.N
W^N
E'^
sec.
33
, T
. 11
S.
, R
. 23
E.
NW
/NE
'/sec
. 33
, T
. U
S.,
R
. 23
E.
NW
/SE
y se
c.
33.
T.
11 S
. ,
R.
23 E
.S
W-^
ftse
c.
33,
T.
IIS
^R
. 23
E.
Nw
lSE
y se
c.
21,
T.
11 S
. .
R.
24 E
.N
Wip
^se
c.
21,
T.
US
..
R.
24 E
.
SW/S
Wy
sec.
22
. T
. 11
S.
. R
. 24
E.
SWJS
Wi/
sec.
22
. T
. U
S..
R
. 24
E.,
SVW
SVW
sec
. 22
, T
. 11
S.
, R
. 24
E.
Ng
ftlW
^sec
. 27
, T
. U
S..
R
. 24
E..
NE
WW
y.se
c.
27.
T.
US
..
R.
24 E
. ;
NE
ySW
y se
c.
28,
T.
US
., R
. 24
E. !
80 85.5
71
68 68 55 63 72.5
57 44 85 85 41.5
55 52 51 56 74 61 67.5
54.5
55 76 48
69.9
11-2
2-43
10
-25-
436-
24-4
46-
21-4
4 6-
22-4
4
6-23
-44
6-27
-44
6-24
-44
6-26
-44
1944
6-27
-44
- -7-
3-4
46-
28-4
4
6-29
-44
7-
1-44
7-
1-44
6-15
-44
6-20
-44
6-16
-44
6-16
-44
7-
5-44
6-17
-44
6*19
-44
11-2
2-43
61 66 65
59 66 60 60 59 - 60 - - 60 60 58 59 62 - 61 . . 60 59 -
8 (a)
(a)
(a)
(a)
(a)
(a)
W (a) 8t) )
0) (a)
(a)
(a)
(a)
(a)
(a)
(a)
(a)
(a)
(a)
(a)
(a)
- - - - - - - - . 15 15 . - . - - - - . - - _ -
0.48
.2
121 20
11 2
.816 52 14 - 58
.1 .13
4.2
12 25 10 10 11 16 14 8.6
2.8
15 5.3
12
157
127
104
158
189
149
140
131
138
113 85 155
146
128
108
127
102
129
126
138
145
133 74 288
154
197
21
16 8.8
14
18 14 14 10 12 16 13 12 11 14 13 11 14 13 13 12 12 11 16 22 17
18
5.5
36 25 49
15 35 18 2.5 1.6
5.5
25 16 13 3.2
24 14 6.7 8
0
. O
24 26 4.8
9.9
51 18 64 21
407
281
240
332
346
306
425
312
334
331
317
306
307
348
368
377
265
337
334
337
377
351
266
338
445
465
- - - - - - - - - 0.0 .0 - - - - - - - - - - - -
128
135
108
218
239
184 72 86 90 70 31 177
138 73 51 62 82 91 87 128 91 88 116
533 84
14
9
13
61 27 42
32 44 14 18 20 9.0
15 16 18 15 14 12 16 15 39 27 12 12 15 10 9.0
44
5.8
5.3 1.5
1.3 .9
7
.66
2.4
2.4
2.1
2.6
6.6
15 20 1.5
1.5
1.8
1.3
1.5
1.2 1.7
1.3
1.7
1.8
2.4
2.5
15
534
521
416
668
678
583
489
458
445
435
392
602
534
413
408
442
365
436
468
517
469
440
410
1,05
850
1 68
9
478
383
296
452
546
430
407
368
394
348
266
436
409
377
323
362
312
376
368
394
412
377
250
809
454
566
144
153 99 180
262
179 59 112
120 77 6
185
157 91 21 53 94 100 94 118
103 89 32 532 89
184
7.0 - - . - - - - . 6.6
7.0 - - . - - - - - - - - -
* C
ompo
site
of
3 w
ells
.*
Wat
er h
oriz
on 3
5 to
42
feet
.
Com
posi
te o
f al
l w
ells
.4
Com
posi
te s
ampl
e.s
Wel
l 4.
« C
ompo
site
of
wel
ls 1
. 2.
3.
6. 7
, 8,
9.
10.
1 W
ell
1.
Wel
l 2.
a F
ishe
l. V
. C
.,
1948
.b
Cit
y of
Nor
th K
ansa
s C
ity,
Mo.
c M
isso
uri
Sta
te G
eol.
Surv
ey.
d K
ansa
s C
ity,
Mo.
, M
unic
ipal
Air
port
.e
Kan
sas
Cit
y Po
wer
& L
ight
Co.
f C
ity
of L
iber
ty,
Mo.
g U
. S.
G
eol.
Surv
ey.
h Pu
re C
arbo
nic
Co,
i P
roct
or &
Gam
ble
Co.
j C
ity
of B
onne
t Sp
ring
s, K
ans.

GROUND WATER 35
Table 10.-Summary of the chemical characteristics of water from the alluvium in the Kansas and Missouri River valleys
Range (ppm)
Number of samples in range
Fairfax and North Kansas
City area (27 samples)
East Armourdale
and central
districts (22 samples)
Argentine and West
Armourdale districts
(12 samples)
Kansas Valley west of
Kansas City Kansas
(26 samples)
Dissolved Solids
300-500501-750751-1,000
1,001-2,5002,501-5,000
More than 5, 000
813
4100
331841
121510
1510
1000
Hardness
0-100101-200201-400401-600601-1.000
More than 1, 000
009
1070
007474
002163
00
1510
10
Iron
0-0. 50.6-1.01. 1-5.05. 1-2021-50
More than 50
003
2210
016
1110
001731
403
1422
Chloride
0-2526-5051-100
101-500501-1,000
More than 1, 000
1854000
303934
122610
1772000
Independence area
The Independence area is composed of the alluvium in Blue River valley, the alluvium in Little Blue River valley, and the Missouri River flood plain extending from Kansas City on the west to about the Clay-Ray County line on the east (plate 2).
The flood plain of the Missouri River in this area is about 3 miles wide and about 15 miles long. The alluvi al deposits average about 95 feet in thickness and con sist of clay, silt, sand, and gravel. The lower part of the alluvium is permeable and furnishes large sup plies of water to wells.
The water table is generally less than 25 feet below the land surface, and in much of the area the water bearing materials have a saturated thickness of at least 80 feet.
In places the alluvium in the Blue River valley is re ported to have a thickness of more than 75 feet. The alluvium consists of medium gravel, sand, silt, and clay and is generally less permeable than the alluvium of the Missouri River valley. A well at the American Asphalt Roofing Co. at 7600 East 15th Street was re ported to have a yield of about 125 gpm. Yields of more than 100 gpm cannot be obtained generally except in a few favorable locations.
The alluvial deposits in Little Blue River valley near Lake City yield moderately large ground-water sup plies. Available data indicate that the Little Blue River once flowed eastward past Lake City and Buckner. At that time there probably was a low divide several miles northwest of Lake City separating a small stream flow ing southeastward and one flowing northward. Glacial till found at several places between Atherton and Sibley lends ample support to the theory that, for a short time

36 WATER RESOURCES OF THE KANSAS CITY AREA
at least, a lobe of a glacier dammed the newly diverted Missouri River at some point along the northern part of the area and that the river found a new outlet from Atherton past Lake City and Buckner. Following the retreat of the ice, the Missouri River resumed its present course past Sibley. In the process of the Mis souri River and Little Blue River changing their courses, a comparatively deep channel was cut and later filled in the vicinity of Lake City (Lake City valley). The thickness and character of the material are shown by the following test hole drilled in 1941 by Layne-Western Co. for the Lake City Ordnance Plant. The test hole is 45 feet east of Missouri State Route 7 and 85 feet south of an old railroad bed.
Soil......................................Clay.....................................
Sand, yellow, dry....................Sand, fine, blue......................Sand, medium fine ....................Sand and gravel, loose.............Sand, coarse, few boulders,
Sand, fine..............................Sand, coarse, yellow; some
Shale , gree n. .........................Bedrock
Thickness (feet)
26
1314111313
103
6.51
Depth (feet)
28
2135465972
8285
91. 592. 5
Ground-water levels in the vicinity of Lake City range from about 20 to 25 feet below the land surface. In June 1942, seven wells at the Lake City Ordnance Plant had an average yield of 360 gpm with an average drawdown of 6. 7 feet. The specific capacity of the wells averaged 57 gpm per ft of drawdown.
Table 9 gives the results of chemical analyses of water samples collected in the area. The major dif ferences between waters from different aquifers is in the dissolved solids, hardness, and sulfate concen trations. The water from the Little Blue River alluvi um is generally more dilute and softer and contains smaller amounts of sulfate ion than that of the Missouri River alluvium. Alluvial deposits of glacial origin in Lake City valley yield the best quality of water found in unconsolidated material in the Kansas City area. None of the samples from the glacial deposits con tained hardness in excess of 200 ppm nor dissolved solids greater than 280 ppm. In general, the iron con tent was appreciably less than that in water from the alluvial deposits. Average concentrations of mineral constituents of water from the three sources expressed graphically as equivalents per million are shown in figure 23.
East Armourdale and central districts
The area comprising these districts lies in the Kan sas valley from about 10th Street in Kansas City, Kans., to the mouth of the river. The flood plain of the Kansas River in this area is about 1^ miles wide; the area of the districts is about 3 miles long.
The alluvium consists of stream-laid deposits that range in texture from clay and silt to sand and very coarse gravel. Much of the alluvium in these districts is probably of glacial origin, having been deposited as glacial outwash by the swollen streams that emanated from the melting ice sheets. Test holes were drilled along 2 lines across the Kansas River valley (fig. 21). In the 2 cross sections the alluvium has an average width of 1. 3 miles and an average thickness of 77 feet. The log of a test hole near the intersection of Ewing Avenue and State Street (Fishel, 1948, p. 85) is typical of the alluvium in this area.
EXPLANATION
i iSodium ond potassium Magnesium Calcium
Chloride ond nitrate Sulfate Carbonate and bicarbonate
MISSOURI ALLUVIUM
LITTLE BLUE LAKE CITY ALLUVIUM VALLEY ALLUVIUM
Figure 23. Average concentration of chemical constituents in ground water from the Independence and Little BlueRiver area.

GROUND WATER 37
Fill.......................................Alluvium:
Silt, clayey, buff-gray.........
Sand, coarse, gravel, fine, and gray silt, (water level, 21. 7 feet below land sur face )...............................
Gravel, coarse to fine, coarse and sand..........................
Gravel, coarse to fine, coarse sand, and blue -gray silt.....
Gravel; contains some pebbles,
Bedrock: Limestone, very hard, grey....
Thickness (feet)
2
810
20
17
3
19
0. 5
Depth (feet)
2
1020
40
57
60
79
79. 5
The water table ranges from about 20 to 30 feet be low ,the land surface. The water-bearing materials have a maximum saturated thickness of about 80 feet but generally it is less than 60 feet (fig. 22).
A well drilled in 1919 at the Armour Packing Co. had a reported yield of 1, 260 gpm with a drawdown of 13. 5 feet. Some wells at Swift & Co. had reported yields ranging from 1, 000 to 1, 400 gpm. A well at Wilson & Co. had a reported yield of 1, 800 gpm with a drawdown of 29 feet. A well at the Midwest Cold Storage & Ice Corp. at 5th and Kaw Streets had a reported yield of 870 gpm with a drawdown of 7. 3 feet. Yields as much as 1,000 gpm can be expected generally, but several wells have yields of considerably less than 1, 000 gpm.
Analyses of water from wells in this area are given in table 9. The high hardness and iron contents that characterize the water from the Missouri River alluvi um are also evident in ground water from the Kansas River alluvium. Pollution increases the average in sodium chloride from about 350 ppm in the East Armourdale district to about 2, 700 ppm in the central district. A cross section of the chemical quality in the East Armourdale district (fig. 21) shows the distribu tion of hardness and iron in the water. Hardness con centrations in this cross section are somewhat higher than in the cross section of the Missouri River alluvium in the Fairfax area,and in the East Armourdale district the increase in hardness and iron is greater as the distance between the well and the river increases. Better quality ground water from the alluvium in the Central and East Armourdale districts is found in the East Armourdale district adjacent to the Kansas River.
Calcium bicarbonate type water of relatively low dis solved solids content is pumped from glacial alluvium in an old river channel in the heart of Kansas City, Mo. (table 9).
A summation of a few of the more prominent chemi cal constituents of water from wells in the East Armourdale and central districts is given in table 10.
Temperature of ground water from the alluvium fluc tuates over narrow ranges with temperature of the air. Fluctuations are greatest for wells near the river that are affected by seasonal recharge of the ground-water reservoir with river water. The average temperature of sampled water from wells in the alluvium was 61 F; the minimum, 58 F; and the maximum, 65 F.
Argentine and West Armourdale districts
The area comprising these districts lies in the Kan sas valley from about 10th Street on the east to the city limits of Kansas City, Kans., on the west. The flood plain of the Kansas River in this area is about 1^ miles wide; the area of the district is about 2 miles long.
The alluvium consists of stream-laid deposits that range in texture from clay and silt to sand and very coarse gravel. The character of the alluvium differs greatly from place to place depending on its origin and mode of deposition. Test holes were drilled along one line across the Kansas valley in this area (figure 21, Argentine district). The alluvium has a width of 1. 6 miles at this cross section and an average thickness of 71 feet. In much of this area the water-bearing materials have a saturated thickness of about 60 feet; at some of the test holes it was only about 40 feet. The water table ranges from about 12 to 30 feet below the land surface. The log of a test hole near the inter section of Osage Avenue and Nineteenth Streets (Fishel, 1948, p. 93) is typical of the alluvium in this area.
Fill.......................................Alluvium:
Silt, gray-buff and gray.........Sand, coarse to fine and some
Silt, gray and buff, inter - bedded with some coarse to fine sand (water level, 26.6 feet below land surface)......
Gravel, fine to medium, and
Gravel, fine, and sand, medium...........................
Silt, light-gray....................Gravel, coarse to fine, and
Gravel, fine, medium sand,
Gravel, medium to fine, and
Bedrock: Shale, micaceous, laminated, light blue-gray..
Thickness (feet)
2
7
7
14
10
70. 5
2. 5
10
25
3
Depth (feet)
2
9
16
30
40
4747. 5
50
60
85
88
A well at the Colgate-Palmolive Peet Co. had a re ported yield of 500 gpm with a drawdown of 7. 7 feet. Another well at this plant had a reported yield of 765 gpm. Two wells at the Proctor & Gamble Manufactur ing Co. had reported yields of 900 and 730 gpm with drawdowns of 8. 5 and 7. 5 feet. A well at the Sinclair Refining Co. had a reported yield of 550 gpm with a drawdown of 24 feet.
Ground water sampled in the Argentine and West Armourdale districts is somewhat harder than the water in other areas of the Kansas River alluvium, al though water containing 200 to 400 ppm hardness is pumped from wells adjacent to the river (table 9). The increase in calcium and magnesium averages is accom panied by a proportional increase in sulfate concen tration, which indicates inflow of water that has a high concentration of these ions. Bicarbonate ion concen-

38 WATER RESOURCES OF THE KANSAS CITY AREA
tration remains approximately uniform throughout the Kansas River alluvium.
A summation of some of the ground-water chemical characteristics is given in table 10. The highest con centration of iron (416 ppm) in water in the Kansas City area was found in this district. Figure 21 shows the trend in concentration along the cross section at the time of sampling.
The average temperature of the ground water in the Argentine and West Armourdale districts was 62 F; the maximum, 64 F; and the minimum, 59 F.
Kansas River valley west of Kansas City
This area extends from the western edge of Kansas City, Kans. , westward to Bonner Springs. The flood plain of the river here is generally a little more than a mile in width, and the area considered is about 13 miles long.
The alluvium ranges in texture from clay and silt to sand and very coarse gravel. Logs of wells and test holes indicate that the material above the water table is not as permeable as that at greater depth. Several feet of the surficial material is composed largely of silt and clay, but most of it is slightly sandy. The surficial material is underlain by gravel and sand in- terbedded with lenses of silt and clay. Test holes were drilled along a line across the valley between Morris and Turner and along a line across the valley just east of Bonner Springs. The alluvium had an average width of 1. 1 miles at these two cross sections and an average thickness of 56 feet. The log of a test hole in the NWiNEi sec. 33, T. 11S. , R. 23 E. (Fishel, 1948, p. 103) is typical of the alluvium in this area.
Alluvium: Silt, gray-brown and
Sand, medium to fine, brown, and some light to gray-buff silt.................................
Sand, coarse to fine, brown (water level, 14. 2 feet
Gravel, fine to medium, and
Gravel, medium to fine, medium sand, and some
Gravel, coarse to fine, and
Bedrock: Limestone, hard, buff and
Shale, hard, calcareous, f fossiliferous, yellow to buff
Thickness (feet)
6
4
9
11
10
103
0. 5
1.5
Depth (feet)
6
10
19
30
40
5053
53. 5
55
The water table ranges from about 10 to 30 feet be low the surface and averages about 20 feet. The water bearing mateuials have a maximum saturated thickness of about 60 feet and an average of about 40 feet. Prop erly constructed wells in this area should have yields ranging from about 400 to 800 gpm.
The chemical quality of the ground water in the al luvium becomes more favorable west of the city limits of Kansas City and away from the industrial area. Chemical analyses of ground water, as presented in table 9, indicate that water just west of the city limits and in the vicinity of Bonner Springs has an average hardness of 453 and 390 ppm, which is about half the average hardness concentration in the Argentine and West Armourdale districts. Bicarbonate is the prin cipal negatively charged ion, and sulfate is present in smaller concentrations than in the water in the eastern section of the Kansas River valley. A summation of some of the major chemical constituents is presented in table 10.
The average temperature of the ground water at the time of sampling was 61 F; the minimum, 58 F; and the maximum, 66 F.
PUBLIC WATER SUPPLIES
Large quantities of water are obtained from the Missouri River for the public supply in Kansas City, Mo. , and Kansas City, Kans. The smaller public supplies are obtained from wells and surface reser voirs or lakes. The quality of the water used for public supplies is shown graphically, in equivalents per mil lion, on plate 2.
Kansas City, Mo.
The raw water supply for Kansas City, Mo., is obtained from the Missouri River (fig. 24). During 1941, 23. 0 billion gallons of water was pumped from the river. After treatment 20. 8 billion gallons was pumped by the secondary lift pumping station to the two pumping stations in the city. The East Bottoms pump ing station received about 6. 8 billion gallons for dis tribution; the Turkey Creek pumping station received about 14. 6 billion gallons. The amount of water used during selected years between 1896 and 1951 is given in table 11.
The Kansas City, Mo., Water Co. furnishes water for the municipal supply at Independence, Mo. , and for adjacent areas in Clay and Jackson Counties, Mo. , and in Johnson County, Kans. (fig. 24). The Kansas City, Mo., Water Department delivers annually about 1. 5 billion gallons to consumers in Clay and Jackson Counties outside the city limits and about 250 million gallons to consumers in Johnson County, Kans. The treatment plant has a capacity of 150 mgd. Sedi mentation, application of lime, soda ash, alum, ferric sulfate, carbon dioxide, ammonium sulfate, activated carbon, filtration, and chlorination result in clarifi cation, color removal, softening, and purification of the water. Table 12 shows the maximum, minimum, and average concentrations of constituents reported in monthly analyses of daily composites for both raw river water and treated water for a 5-year period. The effectiveness of the softening process is shown in figure 25, for the period 1942-51. The goal has been to supply a softened water in the hardness range of 90 to 100 ppm. From May 1950 to April 1951, the hardness of river water was reduced from an average of 229 ppm to an average of 102 ppm. Color of the finished water was less than 5, for more than 95 percent of the time and never exceeded 10.

PUBLIC WATER SUPPLIES 39
KANSAS CITY, KANS.MUNICIPAL WATERAND LIGHT PLANT I /KANSAS CITY, MO
WATER, PLANT /
NORTH KANSA
EAST BOTTOMS PUMPING STATION
TURKEY CHEEK PUMPING STATION
WYANDOTTE CO. JOHNSON CO
Area served by Kansas City, Mo.
Area served by Kansas City, Kan
Area served by both cities
IO 0 4O mg
Diameter oi circle shows amount of water used far public supply Solid circles indicate use of less than 2 million gallons per doy Number by circle gives use in million gallon per doy
JACKSON CO CASS CO
Figure 24.-Areas served by the water departments of Kansas City, Mo., and Kansas City, Kans.

40 WATER RESOURCES OF THE KANSAS CITY AREA
Table 11. Use of water from the public supply of Kansas City, Mo.
Year
1896......1900......1910......1920......1930......1940.....1951......
Population within city (estimated)
140,000163,752248,381324,410410,000405,000456,600
Average daily use (gallons)
9,342,2909,958,973
24,324,63444,556,31959,117,81858,834, 73972,090,000
Maximum daily use (gallons )
12,670,90215,800,00031,700,00055,649,84485, 778,00086, 128,43097,800,000
Per capita within city
(gallons per day)
66.760.798.0
137.4144. 1145.3159. 1
Water mains (miles)
148214438650806874908.9
400
300 -
Figure 25. Hardness of treated and untreated water from the public supply of Kansas City, Mo.
The river pumping station of Kansas City, Mo., is being enlarged. The capacity will be increased to 135 mgd by summer of 1953 and 210 mgd by mid-1954.
Kansas City, Kans.
The water production facilities are on the right bank of the Missouri River at North 12th Street in Kansas City, Kans. (fig. 24).

Tab
le 1
2.
Max
imu
m,
min
imum
, an
d a
ver
age
con
cen
trat
ion
s fo
und
in m
onth
ly a
nal
yse
s of
co
mp
osi
te d
aily
sam
ple
s of
wat
er
from
the
publi
c w
ater
supply
of
Kan
sas
Cit
y,
Mo.
,
May
194
6 to
Apri
l 19
51
[Chem
ical
an
aly
ses
by K
ansa
s C
ity
, M
o. ,
W
ater
Dep
t.
Res
ult
s in
part
s per
mil
lio
n]
Yea
rC
once
n
trat
ion
Sil
ica
(Si0
2)
Iron a
nd
al
um
inum
(R2°
3)C
alci
um
(C
a)M
agn
esiu
m
(Mg)
So
diu
m a
nd
p
ota
ssiu
m
(Na
+ K
)B
icar
bonat
e (H
C0
3)
Car
bo
nat
e (C
03
)S
ulf
ate
(S0
4)
Chlo
ride
(Cl)
Tota
l so
lids
Tu
rbid
ity
Mis
sou
ri R
iver
Wat
er
1946-4
7
1947-4
8
1948-4
9
1949-5
0
1950
-51
Max
imu
mM
inim
um
Aver
age
Max
imu
mM
inim
um
Aver
age
Max
imum
Min
imum
Aver
age
Max
imum
Min
imum
Aver
age
Max
imum
Min
imum
Aver
age
16
.47
.81
1.6
13
.67
.91
0.2
17
.99.
312
. 1
18
.89
.31
3.1
15
.39
.011
. 9
6.0 .
02.5
2.2 .4 1.4
2.2 .6 1. 1
3.8 .4 1.3 1.2 .6 .8
95.4
48.
76
1.8
74.5
39.8
57.0
71.3
42
.053.6
92.6
45.
56
1.4
83.
546.6
59.2
28..
813.2
19.8
25.7
10.
518
. 5
23.9
13.7
18.3
26.6
11.3
18.
1
23.3
9.9
16.
5
84.
545
. 3
59.
5
87
.018.2
55.
2
80
.029.7
56.
5
91.0
25.3
51.6
57.0
17.
737
. 7
310
132
191
259
124
185
251
133
177
304
148
190
285
138
187
4 0 1 1 0 1 0 0 0 0 0 0 2 0 1
240
140
.81
75
.6
220
.46
2.4
157.
1
20
1.6
91
.21
59
.4
23
2.8
76
.815
6. 3
151.
755
.21
11
.2
30.0
12.6
18.2
25.4
10.0
17.6
24.6
11.4
16.4
35.3
11.
520.2
29.3
11.8
17.9
5,8
79
734
2,6
16
5,0
00
928
2, 1
66
5,1
10
839
2,3
73
3,4
31
704
1,7
28
4,2
89
702
1,9
44
7,0
00
115
2,5
30
3,7
00
140
1,6
63
4,0
00
310
2, 1
70
5, 1
00 130
1,8
08
5,8
00
200
2,2
00
Sum
mar
y f
or
5-Y
ear
Per
iod
Tre
ated
Wat
er
Max
imum
Min
imum
Aver
age
18
.87
.81
1.8
6tO
.0 1.4
95.4
39.8
58.6
28.8
9.9
18.2
91
.017
. 7
52.1
310
124
186
4 0 1
240 55
.215
1. 9
35.
310.0
18.1
5,8
79
702
2, 1
65
7,0
00
115
2,0
74
1946-4
7
1947-4
8
1948
*49
Max
imu
mM
inim
um
Aver
age
Max
imum
Min
imum
Aver
age
Max
imum
Min
imum
Aver
age
11.
56
.48
.7
10
,05.
,87
,7
14
.06
.69.
5
2.2 .0 1. 2
2.0 .2 1.0
2.4 .4 1.0
47.
722.6
27.2
28.2
21.2
23.9
25.
920.6
23.6
15.9
6.0
9.2
16.
14.0
7.8
9.3
6.1
7.2
11
2.0
47.
570.7
98.
517.9
64.4
85
.037.6
66.
1
123 39 55 55 38 41 50 34 40
8 4 7 1 0 1 8 5 5
24
4.8
142.
118
1. 1
228
.069
.61
64
.6
20
8.8
100
.81
67
.9
31.
513.3
19.4
26.2
10.
518.1
24.4
11.
516.8
418
288
357
392
205
311
344
211
306
1. 1 .
1.4 .9 .0 .
3
.4 .0 .2

42 WATER RESOURCES OF THE KANSAS CITY AREA
>f"3.§ MS-i<uri 5
o r-* i-<
3̂ft<U.a
ao5-i
<M
In<U"cO
£<w O
M<u"a.
a)
11 £D g
S o
iso "-1"o ^
M Q<
M _5»S"ctf
£ «#CO oj
£ CO5fi § o ^a - s °
3 > >o s
S nO CO
^° CO
1°
Oo<utuD CO 5-i <U
f5T3
CO
a3a gc
rH
as3a'isTCM'i-H
<U
1
H
rH
T3
^r^
3EH
M"cO T3O t"H
H QQ
'O rH ^.^
,2 uj3 *~^
U
(!) -^CO Qi s
"cO -^e co o o ^ oCO *" '
u
V"cOn *^
^3 O
o Si r-l ^^
m
Sodium and potassium (Na + K)
a3
<U 3?fi S^
CO
a3 -^ i-* nj^ ucd ^^u
c !~o "a ^?_, ^ K^ 5^
CO -^O CM
3 O r-* -rH
^"^
C C d) Oo 53C rriO siU "
cd
*
-o<u
g ^oD
|
'reated Water
H
CO O CM
CO C- (VIen (vi oCO (VI CO
IN c- inin i-i oCO ,-H (VI
co CM enCM en oCO C- CO(VI T-l
c- in in
m co en"tf CO CO
0 -tf 0
D- CO COo evj coi-H
CT> evj eoCT> "*" CO
eo c- (viC- 00 CO(M ,-H evi
"*" >-l CO
(M m eo(vi c- en j-i
Maximum Minimum Average
o men "* en »-H
CO i-H (VI
m co m m o ooCO (M (M
"* (M "*
en (M oo(VI t-( i-H
c- oo coen ^t1 enm co 1-1i-H i-H
o ̂ m
co evj en^F CO CO
0 "* CO
C- (M C-co evj -tf
l-H O O
00 CO CO
O 03 CO
CO O CO <N (M (M
oo -*1 in
CO (VI CO
»-( c- en
Maximum Minimum Average
»-H m
i o m en »-H
oo m evjO i-H(M CO
evi m co in o oo*
II I

PUBLIC WATER SUPPLIES 43
The raw water supply is obtained from the Missouri River by two intake structures. Six pumps having a combined capacity of 250 mgd deliver raw water to the electric power station where it is utilized for condens ing. Upon leaving the condensers a sufficient amount of water is diverted to the settling basins at the water plants to supply the city distribution system; the re mainder is returned to the river. The amount of water delivered annually from 1934 to 1951 is given in table 13.
The treatment plant, which has a rated capacity of 31. 75 mgd, clarifies, decolorizes, and purifies the water by means of the application of alum, silica, chlorine, carbon, and filtration. Table 14 shows the maximum, minimum, and average concentrations of chemical constituents as reported in semimonthly anal yses of daily composites of treated water supplied to Kansas City and outlying areas for the period 1942-51.
During 1950 about 5. 3 billion gallons of water was sold to industrial users, about 1.4 billion to commer cial users, and about 1. 3 billion for residential use.
Table 13. Average and maximum daily use of water by the Kansas City, Kans., Water Department
Year
1934............1935............1936............1937............1938............1939............1940............1941............1942............1943............1944............1945............1946............1947............1948............1949....... . .1950............1951............
Average (mgd)
15.914.416.516.415.416. 517.918.820.222.824.423.422.425.024.225. 525.025.4
Maximum (mgd)
__
_21.323.426.025.829.930.029.232.233.330. 934.032.438. 2
North Kansas City, Mo.
North Kansas City, Mo., obtains water for munic ipal supply from three wells in the Missouri River al luvium about a quarter of a mile from the river near the western city limits. During 1951 about 643 million gallons of water was pumped from these wells. Changes in river stage affect both the water level in the wells and the chemical quality of the raw water. The water is softened, purified, and the iron removed by the addition of lime and alum, precipitation, filtra tion, and chlorination. The maximum hardness as
calcium carbonate of the treated water in 1951 was 186 ppm, and the minimum was 124 ppm. Chemical analysis of treated water from North Kansas City, Mo. , is shown in table 15.
Independence, Mo.
The city of Independence obtains its water supply from the Kansas City, Mo, Water Department. An average of about 2. 7 mgd is used within the city.
Qlathe, Kans.
Olathe obtains its water supply from Lake Olathe. The city uses an average of about 500, 000 gpd.
Liberty, Mo.
Liberty obtains its water supply from two .wells in the alluvium of the Missouri River valley. The wells are 70 and 61 feet deep and each yields about 600 gpm. The city uses an average of about 400, 000 gpd.
Bonner Springs, Kans.
Before the Kansas River flood in 1951 the city of Bonner Springs was supplied by wells in the alluvium on the south side of the river. These wells were de stroyed by the flood; the city then had two wells drilled in the alluvium on the north side of the river just east of the city limits. The two wells are about 85 feet deep, and each will yield about 450 gpm. The average daily use of water is about 216, 000 gallons. Analysis of a sample of the Bonner Springs water supply collected in 1952 is given in table 15.
Parkville. Mo.
Parkville obtains its water supply from two wells drilled in the alluvium of Missouri River valley. The wells are about 75 feet deep, and each yields about 200 gpm. The average daily consumption is about 200,000 gallons. Analysis of a sample of the Parkville water supply collected in 1951 is given in table 15.
Lees Summit, Mo.
Lees Summit obtains its water supply through the Unity Farm water department from Unity Lake. The city uses an average of about 50, 000 gpd.
Blue Springs, Mo.
Blue Springs obtains its water supply from Lake Tapawingo. The city uses an average of about 45, 000 gpd. Analysis of a sample of the Blue Springs water supply collected in 1951 is given in table 15.

44 WATER RESOURCES OF THE KANSAS CITY AREA
Non- carbo^kte hardness
Total hardness (CaC03)
Dissolved solids (at 103° C)
cu 2
E~0) o^ n
U
S *->
p COCO *"*
Carbonate (C03)
03
Bicarbor (HC03
Sodium and potassium (Na + K)
BCO W)<l) 5!
03§
sS3cti ^~* U
1 3 "To03 .S O d d co*"* "oS
HdFco'S
Concen tration
SH03 (USi
CO CO COo in co, i
to to m o c- coCO i-H CO
i-H CO O3to to t- m co *
O 00 00
CM O 00
oo to c-CO CO CO CO CO tOCO i-H i-H
i-H O * i-H
to ^* c*- to co c-
c- co in
03 ^ in^* i-H C
co o oCO O3 ^oo ^* to
«.«toin ,-H co
o o to00 C- i-H
Maximum M inimum Average
CO
03
in *
CO C-m inCO i-H
i-H COin cot- CO
^* O
o o
O3 CO
to mCO O CO i-H
o o
i-H C- C- CO
OO CO
co toO3 O
CO O3
CO CO 03 ^*
«coCO
co toco to
Maximum Minimum
CO
O3
COc-
coCO
c-to
CO
c-
t-
coto
i-H
in c-
m in
toc-
03
03in
CO
o1-1
Average
03o
inCOCO
oCOto
too
c-
oCO
CO
CO CO
03c-
mc-
03
CO CO
CO
CO
CO
Maximum
03
^* CO C- O3
C- CO
i-i CO
co toCO ^*
O ̂ H
O3 CO
03 ^*
CO C-co t-CO i-H
O CO
CO C-co c-
to to co in
CO O
CO O3
o t-03 ^f* ^* tO
to ^*CO
co toC- i-H
M inimum Average
in co I-H in
in co c- toeo I-H
00 ^*i 1 i-H C- CO
O CO
CSI O3
CO O
CO O3to oCSI i-H
CO O
00 O3 CO CO
O3 CO 00 CO
t- ,-H
i-H CO
O C-
t- COO3 ^*
to oin ,-H
to coto to
Maximum Minimum
m03
O3CO
inCO
03to
«.CO
^fO3to
CO
CO CO
O3
COin
CO
O3
«
to
«CO
CO
o
Average
CO Oo c-
O ,-H CO O3CO ,-H
^H CO O3 COm co
«oC- CO
CO 5O
to inO CO CO ,-t
o o
CO 00oo es>
in toC- CO
c- o
to ^*
,-H CO
C- COco in
to toCO
to coCO CO
Maximum Minimum
to03
c-00
toCO CO
oCO
CO
CO
inO3c-i-H
o
toCO
O3in
CO
CO
oCOto
t-
c-rH
Average
00 COI-H in
in 03CO i 1
in CMt- 00 C- CSI
t- CO
o
co mCO 00
t- O3
CO
00 O
CO CO
CO * CO CO
to t--H ^H
^*i-H O3 O CO i-H
«coCO
CO CO
,-H in
Maximum Minimum
c-O3
t-co
toCO
COO3
in
CO
CO
03
to c-^H
O3
O3in
^o
in
to
oCO
c-
^H
Average
CO C-
t- O3co toCO ,-H
CO *o mto co
t- CO
in c-i-H i-H
C- 00
O3 ^* * CO CO i-H
o o
C- CO
CO i-H 03 ^*
« *03 ^
C- O3
in co
to ^CO
CO «
00 C-
Maximum Minimum
00
03 i-H
00 00
toCO CO
COto
in
CO
CO
CO
COt-
o
en t-
00in
CO
O5
t-
to
CO
CO
i-H
Average
CO CO CO C-i-H
in 03CO t-CO i-H
O3 tOo c-to co
c- ««
^,*i-H i-H
CO O3
CO O O O3 CO
o o
CO i-H O3 CO
CO COtO ^H
to enC- i-H
TjH tO
CO CO
* co
CO CO
c- to
Maximum Minimum
03
03i-H
CO03
oCO CM
3
in
00
00
toO3in
o
00to
03
t-
00
t-
oto
00
c-o
Average
03 C-^H mi-H
O 00to inCO i-H
en 03 to co
to co
.-i ento o
^f -H
in T}<CO O3 CO
o o
C- i-H
O CO
CO 03 CO CO
co e-1-1 O
,-H 00
CO * O3 ^*
CO tO
CO
co toO3 tO
Maximum Minimum
o in03
CO CO
inCO CO
COin
in
oen
c-
03 Ifti-H
O
inCO
in
CO
CO
^H
COto
en
in-I
Average
03 C- 03o m t-
CO ,-H tOin c- coCO i-H CO
O3 CO O3 CO O COto co *
CO CO *
C- O CO
C- ,-H t-
to c- coin 03 oCO i-H
o o o
in en oCO CO O3
oo co in c- co *
* *c-en t-H oo
03 m ooi-H O3 CO O3 "^ tD
o to inCO i-H
to oo cotO ^ i-H
Maximum Minimum Average
en

10
-Yea
r P
eri
od
Max
imum
Min
imum
Av
erag
e
Sil
ica
(Si0
2)
22.2
4.8
11.3
Iron a
nd
alu
min
um
(R2°
s) 5.6 .
22.0
Cal
cium
(Ca)
101.1
39
.462.3
Mag
nes
ium
(Mg) 31
. 7
10.6
18.8
Sod
ium
an
dp
ota
ssiu
m(N
a +
K)
92 18 54
Bic
arbonat
e(H
CO
3) 34
211
818
1
Car
bo
nat
e(C
03
)
13 0 1. 1
Su
lfat
e(S
04
)
26
2.3
79.
7166.8
Chlo
ride
(Cl) 36
. 1
8. 5
18.3
Flu
ori
de
(F) 0
.7 .3 . 5
Dis
solv
edso
lids
(at
103°
C)
775
276
464
To
tal
har
dnes
s(C
aCO
3)
385
149
237
No
n-
carb
on
ate
hard
ness 12
444 86

46 WATER RESOURCES OF THE KANSAS CITY AREA
Table 15. Chemical quality of public water supplies of small municipalities in the Kansas City area
[Analyses by the Department of Public Health and Welfare of Missouri, except as indicated.Results in parts per million]
Date...............................Silica (SiO2 )... .................Iron (Fe).. ......................
Magnesium (Mg). ....... ......
Sodium and potassium (Na + K)....... ...............
Bicarbonate (HCO3 ).... ......Carbonate (CO3 ). ..............Sulfates (SO.,)... ...............X «/...............
Chlorides (CTL)......... ........Nitrates (NOo) ................
Hardness as CaCO3: Total.........................Noncarbonate.. ............
Turbidity........................
North Kansas, City, Mo.
a-6-5i8.0
.2
.227. 216.0
43.489.2
0121.418.0
0375.0
134.061. 0
. 1
Bonner Springs, 1 Kans.
9-6-51
0.10_
15. 512
16306
0117
15
436185
Parkville, Mo.
9-24-5114.0
. 14. 1
15.530.4
48. 565.435. 199.244. 9
0386.0
164.052.0
. 1
Blue Springs, Mo.
1-18-5214
. 12
. 121. 77.4
17. 579.0
_37.2
9. 7.9
167. 0
85.020.0
.4
1 Analysis by H. A. Stoltenberg, Division of Sanitation, Kansas State Board of Health.
WATER DEMANDS
The combined daily use of surface water and ground water for municipal and industrial use in the Kansas City area is about 700 million gallons. About 627 million gallons is obtained from surface water and about 88 million gallons from ground water.
Public water supplies
The use of public water supplies in the Kansas City area averages about 100 mgd. About 97. 5 mgd is from surface sources and 2. 5 mgd is from ground-water sources (table 16).
Table 16. Summary of the municipal use of water in the Kansas City area
[In gallons per day]
Cities using public water supply
Kansas City, Mo..........Kansas City, Kans.......North Kansas City, Mo.Olathe, Kans..............Liberty, Mo...............Bonner Springs, Kans..Parkville, Mo............Lees Summit, Mo.......Blue Springs, Mo........
Total..................
Ground water
1,760,000
400, 000216,000200, 000
2, 576,000
Surface water
72,090,00025,000,000
500, 000
50, 00045,000
97,685,000Total use of
ground water and surface water........... 100, 261, 000
Industrial water supplies
Large quantities of water are used for private indus trial supplies in the Kansas City area. Available data indicate that about 600 million gallons of water ob tained from private sources is used daily in the Kansas City area. Of this amount about 85 mgd is obtained from wells; the remainder is obtained from the Mis souri River.
The chief industrial use of water is for cooling and condensing. -Ground water is used at the Standard Rendering Co. for scrubbing and cleaning the plant. Ground water was formerly used in large quantities by the packing plants for washing meat, but this practice has been discontinued because the iron in the water discolored the meat, and also because of the possibility of contaminating the meat with polluted ground water.
The industrial use of water in the Kansas City area has been compiled by subareas.
The Fairfax industrial district has 17 industrial users of ground water. The largest users are as follows:
Organization
General Motors Corp..... Phillips Petroleum Co.... Owens Corning Fiberglass
Sunshine Biscuit Co.......Federal Cold Storage Co.
Approximatequantity
(mgd)
12 4.8
3.22.31.3
Numberof
wells
7 10
543

WATER DEMANDS 47
The North Kansas City area has 16 industrial users of ground water. The principal users are as follows:
Organization
Corn Products Refinirig Co...........................
Cook Paint & Varnish Co.. U. S. Gypsum Co............
Approximate quantity
(mgd)
10.9 .8
Number of
wells
1521
The .northeast industrial district has 9 users of ground water and 2 users of surface water. The principal users are as follows:
Organization
Schenley Distillers, Inc M . Kansas City Power &
Light Co. Northeast station......
Do...................
Grand Avenue Station Do...................
Hawthorn Station...... Sheffield Steel Co...........
Approximate quantity
(mgd)
4.3
2.1 180
.9 176
144 29
Source
5 wells.
4 wells.
River. 3 wells.
River. Do.
Blue River.
The users of surface water return the water to the streams after use without appreciable change in quan tity or chemical quality.
In the Independence area there are only 3 industrial users of ground water. The Lake City Ordnance Plant uses about 2. 8 mgd from 10 wells in the alluvium of Little Blue River valley. The Sugar Creek refinery of the Standard Oil Co. uses large quantities of ground water for cooling.
The East Armourdale and central districts have 14 industrial users of ground water. The principal users are as follows:
Organization
Swift & Co...................Midwest Cold Storage &
Ice Co....................Liquid Carbonic Corp....Kansas City Dressed
Beef Co..................
Approximatequantity
(mgd)
4
.9
.9
. 5
Numberof
wells
4
25
2
In the Kansas River valley between Kansas City and Bonner Springs the Lone Star Cement Co. uses about 350 thousand gallons of ground water daily. The Ar gentine and'West Armourdale districts have two users of ground water. Proctor & Gamble Manufacturing Co. uses about 2. 9 mgd, and the Colgate Palmolive Peet Co. uses about 3. 6 mgd.
The industrial use of water obtained from private sources in the Kansas City area is summarized in table 17.
Table 17. Summary of industrial use of water from private sources in the Kansas City area
[In gallons per day]
District or area
Northeast district..
East Armourdale and central
Kansas River valley west of Kansas City
Argentine and West Armourdale dis tricts...............
Total............
Use of ground water
26,772,00013,890,000
9, 189,000 19,485,000
9,236,000
350, 000
6,480,00085,402,000
Use of surface water
529,200,000
529,200,000Total use of
ground water and surface water....... 614,602,000
Conflicting uses
The chief source of surface water in the Kansas City area is the Missouri River. The program for the de velopment of the Missouri River basin as now planned (Missouri Basin Inter-agency Committee and Missouri River State Committee, 1952) includes
1. Construction of more than 100 multipurpose res ervoirs on the Missouri River and its tributaries with a capacity of 110, 000, 000 acre-feet of water.
2. Irrigation of more than, 5, 000, 000 additional acres of land, and supplemental water for about 2, 000, 000 acres now receiving an inadequate supply.
3. Application of soil and moisture conservation measures on nearly 340, 000, 000 acres.
4. Construction of hydroelectric plants having an ultimate installed generating capacity of 3, 200, 000 kilowatts and an annual output of more than 13, 000, 000, 000 kilowatt hours.
5. Other projects relating to flood control, navi gation up to Sioux City, Iowa, improvement of fish and wildlife, and recreation.
The above program for development of the river basin presents several conflicts in water use. Certain features of the program are designed to distribute the flow of the river more uniformly throughout the year and thus provide a higher usable flow. Other features, particularly increased irrigation, will make less water available in the Kansas City area.
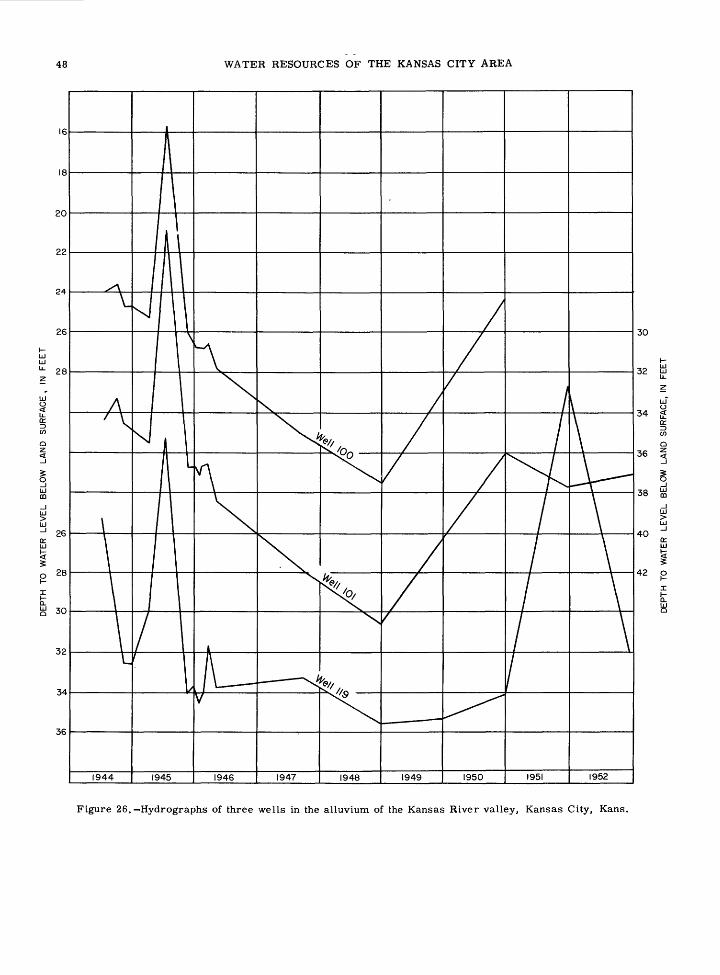
48 WATER RESOURCES OF THE KANSAS CITY AREA
32
34
36
Figure 26. Hydrographs of three wells in the alluvium of the Kansas River valley, Kansas City, Kans.

POTENTIALITIES 49
Barnes (1952) estimated that by 1975 the Nation's water requirements will be nearly double the present usage. Increased development of the Missouri River basin leads to increased population with consequent increase in water use. Evaporation of water from the reservoirs and stock ponds in the basin will be an ad ditional water loss.
The direct conflict between water requirements for irrigation and water requirements for hydroelectric power, navigation, municipal and industrial supplies, sanitation, recreation, and other purposes requires accurate inventories of both ground and surface-water supplies and, wise planning and careful management to insure that all water uses receive consideration com mensurate with their relative importance.
Conflicts in the use of the reservoirs between rec reational and other purposes must be resolved on an individual reservoir basis. Certainly recreation, and fish and wildlife conservation, will receive more con sideration and greater emphasis as the population den sity of the area increases.
POTENTIALITIES
Surface water
The average daily water use from the Kansas City, Mo. , municipal supply was 72. 1 mgd in 1951; the max imum daily use was 97. 8 mgd. For the same year the average daily use of the municipal water supply of Kansas City, Kans., was 25. 5 mgd; the maximum daily use was 38. 2 mgd. The average daily use of both systems is less than 0. 3 percent of the average com bined flow of the Missouri and Kansas Rivers. Should the greatest daily use by the two municipal systems occur on the same day, the water use of the two systems would remain less than 0. 4 percent of the av erage available flow.
The Missouri River discharge measuring station lies downstream from the intakes for the municipal water supplies of both Kansas City, Mo., and Kansas City, Kans. Therefore, the minimum flow of record, 970 mgd, or 1, 500 cfs, was the flow of the river after with drawals for the public water supplies had been made. The minimum flow of record, occurred in January 1937; the average daily withdrawals by the two munic ipal systems in 1937, plus 970 mgd is 1, 045 mgd. The 1951 average use of nearly 100 mgd for public water supplies is nearly 10 percent of the minimum available flow of record. If a low flow, such as occurred in 1937, were to occur with the present rate of with drawals there would be 945 mgd (1045-100) to supply the cooling water requirements of the three Kansas City Power & Light Co. steam power plants. In 1952 the three plants required 500 mgd. As the power com pany requirements are largely nonconsumptive, almost all the flow could be utilized with little effect on the flow of the Missouri River below Kansas City, Mo. Although the quantity of water at minimum flow is suf ficient for the steam power plants, it is questionable that the flow could be utilized on account of the eleva tion of the river intakes. Fortunately, both the mini mum water demands and the minimum supply occur during the winter.
The often-repeated charge that the planned use of water in the basin exceeds the available supply was investigated by a subcommittee of the Missouri Basin Inter-Agency Committee. Their findings, presented in April 1951, showed that the regulated water supply of the Missouri River is adequate to
1. Provide for irrigation and agriculture as planned above Sioux City, but with tolerable shortages in extreme droughts.
2. Supply the downstream requirements for water for domestic, industrial, and sanitation purposes.
3. Provide for satisfactory navigation from Sioux City to the mouth but with a shortened navi gation season during a drought equal to that of the 1930's.
Practically all the small streams in the area have periods of zero or very low flow that make their uti lization subject to interruptions unless adequate stor age is provided.
The average daily water use in Kansas City, Mo., is about 50 percent of the treatment plant capacity and the maximum daily use is about 65 percent. The Kan sas City, Kans. , treatment plant has a capacity about one-fourth greater than the average daily use and slightly less than the maximum daily use.
Ground water
Quantity
Only a small part of the available ground water in the Kansas City area has been developed. The present use of ground water is an appreciable part of the a- vailable supply in 2 small areas. These 2 areas are the East Armourdale and central districts and a small area in the West Armourdale and Argentine districts. In these 2 districts the depletion of ground water has not been serious. Some observation wells were started in these districts in 1944. The hydrographs of 3 wells are shown in figure 26. Well 100 is at the intersection of Shawnee Avenue and Adams Street; well 101 is on the south side of Kansas River near the Kansas City Terminal Railway high-line viaduct; and well 119 is at the intersection of Osage Avenue and Nineteenth Street. The water levels in wells 101 and 119 are lower than they were in 1944, but they are higher than they were in 1946.
The water table in the Fairfax district is generally less than 20 feet below the land surface and generally rises during flood stages of the Missouri River. Be cause the water-bearing materials in this area are very permeable and because conditions are excellent for induced infiltration from the river, the present use of ground water in this district is only a small part of the available supply. The situation is essen tially the same in North Kansas City and in the north east industrial district.
In the Missouri and Kansas River valleys outside the Kansas Cities the present use of ground water is neg ligible in comparison to the available supply.

50 WATER RESOURCES OF THE KANSAS CITY AREA
The ground-water potential in the Missouri and Kan sas valleys is dependent on the streamflow of these rivers. As long as there is streamflow available for induced filtration, the available ground-water supply will be high and several times the present withdrawal of 88 mgd is possible. Pumping from these ground- water sources will reduce the streamflow by the amount of the induced infiltration. If the streams dry up, the potential supply will be greatly diminished.
Effect of induced infiltration on temperature and quality
The effect of river stage and chemical quality of river water on the quality of the ground water in the alluvium is indicated in figure 27. Figure 27 shows the stage and hardness of Missouri River water and hard ness of softened ground water at the North Kansas City, Mo. , treatment plant during the flood period of April 1952. The plant is about a quarter of a mile from the river. It is significant that the quality and stage of the Missouri River are reflected in the treated water in spite of the well-controlled treatment process. The minimum hardness of ground water occurred 2 days later than the minimum hardness of river water but concurrently with the peak river stage.
In areas of heavy pumping of ground water, as in parts of the Kansas River area in Kansas City, Kans. , the water table may be lower than the water surface in the river and the aquifer may receive recharge from the river. The decrease in average concentration of calcium, magnesium, and sulfate in the Armourdale district is probably the result of induced infiltration of river water in this area.
Two short duration pumping tests were completed with the cooperation of the Kansas City Power & Light Co. One test was conducted at well 1 of the Grand Av enue plant, which is about 75 feet from the Missouri River on a narrow stretch of alluvium. The other test was made at the Hawthorn plant, which is about 1, 200 feet from the Missouri River on a wide expanse of the alluvium between the Missouri and the Blue Rivers.
The well at the Grand Avenue plant was pumped at 175 gpm, and the well at the Hawthorn plant was pumped at 1, 500 gpm. Figure 28 shows the specific conduct ance, total hardness, and iron content of samples col lected during these tests.
The rapid change in chemical quality of the water with pumping at the Grand Avenue plant is probably characteristic of the delicate balance between the hy- drologic variables in narrow reaches of alluvium in the Kansas City area. Even a small amount of pumpage from a well adjacent to the river results in an appre ciable improvement in the quality of the water.
The increase in specific conductance, hardness, and iron observed at the Hawthorn test indicates that the equilibrium was slightly shifted in favor of more con centrated water. Whether the shift in this direction was caused by local permeability conditions, the nat ural hydraulic gradient of the water table, or local differences in mineral content of water within the al luvium is not known. The test clearly indicates that induced infiltration of river water was not achieved under the conditions of the test but does not necessar ily indicate that it could not be accomplished by pro longed pumpage or increased pumping rate. Although no correlation can be made between conditions in the Missouri and Ohio River valleys, Gidley (1952) has shown that about 8 weeks were required for river in filtration to reach 1 well in the Ohio River alluvium.
Where it is practical, induced infiltration of river water results in an improvement of the chemical qual-? ity of the ground water in the alluvium. The iron con tent of the ground water will be particularly affected, because the river water contains but small amounts of iron whereas a high iron content is characteristic of the ground water from the alluvium. Further develop ment of the alluvium as a source of water to the extent of promoting induced infiltration of river water should result in a general improvement of the water in the vicinity of the developed area. The quality of water that is obtainable by means of induced infiltration is
30
29
28
27
26
25
24
23cr
22
21
20
IQ
- 190z o
_l Z C
ocUJ
<ni- <r , sn£L
cTS 130o
</> i on
(0_ <n i i n
z0
I ,
an
i.f
\
^
Riv er w oter
H 1 /Riv
^/
..- '
XXJ^J
HPer s
1
tage
»
/
s<
* rY
J\
2Y
Treated grour L _ 1 woter^^
NrrN
i.
i
M
d
^"~"~""
^
+ ' *
i
;t
i / /(k
H
P-*
v )
->/
H .
~
r
S
\APRIL 1952
Figure 27. Effect of stage and quality of Missouri River on quality of ground water in the alluvium.

WATER LAWS 51
-,°=!300
2 3PUMPING TIME IN HOURS
Grand Ave. pumping test
is
"16
14
12
10
8
23456 PUMPING TIME IN HOURS
Hawthorn pumping test
Figure 28. Effect of pumpage on chemical composition of water from Missouri River alluvium.
dependent on the extent to which existing equilibrium conditions may be shifted as well as the chemical qual ity of the river water.
Induced infiltration of river water will cause a tem perature change in the ground water. The extent of the change and accompanying time lag is dependent on the distance of the well from the riv.er and the amount of river water that infiltrates.
WATER LAWS
The principal sources of surface-water supply in the Kansas City area are the Missouri and Kansas Rivers. Use of water from the Missouri and Kansas Rivers and from other sources in the area is regulated to some extent by municipal, State, and Federal legislation.
The O'Mahoney-Milliken amendment to the Flood Control Act of 1944 specifies that of the waters arising in the States lying wholly or partly west of the 98th meridian, the use of such water for navigation should be only such as would not conflict with any ben eficial consumptive use for domestic, municipal, stock water, irrigation, mining, or industrial purposes.
The Missouri Basin Inter-Agency Commission passed a resolution stating that it would be the policy of the committee "to recognize the necessity of making available adequate quantities of water for present and
potential requirements for domestic, municipal, sani tation, and sewage purposes east of the 98th meridian."
Navigable streams are under the jurisdiction of Con gress through its constitutional powers to "regulate commerce * * * among the several States. " This power extends to nonnavigable tributaries of navigable streams if the navigable capacity of the navigable waterway or interstate commerce is affected. Flood control is also recognized as a Federal responsibility.
Deposit of refuse matter in a navigable stream "other than that flowing from streets and sewers and passing therefrom in a liquid state" is prohibited if navigation is affected. This prohibition extends to nonnavigable tributaries if the refuse may be washed into the naviga ble stream.
Permission must be obtained from the Missouri Conservation Commission to impound any flowing stream in Missouri. The State Division of Health in Missouri has some control over stream pollution.
The use of surface and ground waters in Kansas is controlled and regulated by an act of the State Legisla ture that has been in effect since June 28, 1945. All water within the State is declared to be dedicated to the use of the people and it is provided that subject to vest ed rights water may be appropriated for beneficial uses. A vested right is defined as being the right to continue the use of water having actually been applied to beneficial use at the time of the passage of the act

52 WATER RESOURCES OF THE KANSAS CITY AREA
or within the preceding 3 years. The act makes it the duty of the chief engineer of the Division of Water Re sources to control, conserve, regulate, and allot the water resources of the State for beneficial uses in ac cordance with the rights or priority of appropriation. Where appropriations of water for different purposes conflict, the act provides that they shall take preced ence in the following order: domestic, municipal, irrigation, industrial, recreational, and water power uses. The Kansas State Board of Health has control over stream pollution.
SELECTED BIBLIOGRAPHY
Anderson, K. E. , and Grohskopf, J. G. , 1946, Ground water in agriculture, 1, Ground water in Missouri: Mo, Div. Geol. Survey and Water Res. Inf. Circ. 2; reprinted from Agr. Eng. v. 27, p. 465-468 and 470.
Barnes, J. R. , 1952, Report 9, Water for United States industry, in Resources for freedom, v. 5, p. 83-98.
Clark, E. L, , 1939, Geological map of Missouri: Mo. Div. Geol. Survey and Water Res.
Congressional Documents, 1934, 73 Cong. , 2d sess. , H. Doc. 195, U. S. Army, Corps of Engineers, Kansas River, Colorado, Nebraska, and Kansas.
1935, 73d Cong. , 2d sess. . H, Doc. 238, U. S. Army, Corps of Engineers, Missouri River.
Conservation Foundation and National Association of Manufacturers, 1950, Water in industry.
Fishel, V. C. , 1948, Ground-water resources of the Kansas City, Kansas area: Kans. Geol. Survey Bull. 71.
Gidley, H. K. , 1952, Installation and performance of radial collector wells in Ohio River gravels: Am. Water Works Assoc. Jour. , v. 44, no. 12.
Jewett, J. M. , and Newell. N. D. , 1935, Geology of Wyandotte County: Kans. Geol. Survey Bull. 21, pt. 2, p. 151-205.
Kansas City Water Department, 1951, Statistical re port of the operation of the Kansas City Water De partment, fiscal year ending Apr. 30, 1951: p. 28-30. Kansas City. Mo.
McCourt, W. E. , Albertson, M. , and Bennett, J. W. , 1917, The geology of Jackson County: Mo. Bur. Geology and Mines, v. 14, 2d ser. , p. 1-152.
Missouri Div. of Resources and Devel. , Water re sources map of Missouri.
Missouri River Basin Inter-Agency Committee and the Missouri River States Committee, 1952, The Mis souri River Basin development program.
Missouri River Basin Inter-Agency Committee, 1951, Report on adequacy of flows in the Missouri River.
Moore, E. W. , 1940, Progress report of the commit tee on quality tolerances of water for industrial uses: Jour. New England Water Works Assoc. , v. 54.
Moore, R. C. , and others, 1940, Ground-water re sources of Kansas: Kans. Geol. Survey Bull. 27.
National Research Council, 1950, Comm. on Sanitary Engineering and Environment. [Mimeographed. ]
Newell, N. D. , 1935, The geology of Johnson and Miami Counties, Kana: Kans. Geol. Survey Bull. 21, pt. 1, p. 7-150.
Oilman, R. E. , and Tracy, H. J., 1951, Trends in climate and in precipitation-runoff relation in Mis souri River basin: U. S. Geol. Survey Circ. 98.
Parker, H. N. , 1911, Quality of water supplies of Kansas: U. S. Geol. Survey Water-Supply Paper 273, p. 243-245.
Stevens, G. C. , and Hard is on, C. H. , 1951, Monthly and annual discharge of Missouri River between Fort Benton, Mont. , and Hermann, Mo., and principal tributaries: U. S. Geol. Survey Circ. 108.
United States Department of the Army, 1949, Annual report of the Chief of Engineers, U. S. Army, pt. 2.
United States Geological Survey Water-Supply Paper, issued annually, Surface water supply of the United States, part 6, Missouri River basin.
1952, Kans as-Missouri floods of July 1951: U. S. Geol. Survey Water-Supply Paper 1139.
United States Public Health Service, 1946, Drinking water standards: Reprint 2697, 14 p., from Public Health Service Repts. , v. 61, no. 11, p. 371-384.
1949, Kansas River basin water pollution inves tigation: Federal Security Agency, p. 241-248.
1953, Report on lower Mississippi Riverinvestigation.
INT.-DUP. SEC., »ASH., D.C.U72K