Embed Size (px)
Citation preview

Molecular and Biochemical Parasitology, 40 (1990) 269-278 269 Elsevier
MOLBIO 01330
Water and urea transport in human erythrocytes infected with the malaria parasite Plasmodium falciparum
M a r y A n n Z a n n e r 1, Wi l l i am R . G a l e y 2, J o s e p h V. Scale t t i 3, J e s p e r B r a h m 4 and D a v i d L. V a n d e r Jag t 1
Departments of 1Biochemistry, 2physiology, and 3Microbiology, University of New Mexico, School of Medicine, Albuquerque, NM, U.S.A., and 4Department of General Physiology and Biophysics, University of Copenhagen, The Panum Institute,
Copenhagen, Denmark
(Received 23 October 1989; accepted 18 December 1989)
The permeability properties of the human red cell membrane to various solutes are altered by malarial infection. In the present work we show that the permeability of the red cell membrane to water is also affected by the intraerythrocytic growth of the malaria parasite Plasmodium falciparum, whereas urea permeability appears unchanged. The data from infected cells show de- creases in membrane surface area, cell volume, the osmotically active water fraction (W~n), and osmotic water permeability (Pf) as measured by stopped-flow spectroscopy. On the other hand, the data suggest an increase in diffusive water permeability (Pd) in infected cells with no change in urea permeability when measured by the continuous flow method. The decreased Pf/Pd ratio of infected cell membranes and its implications in the geometry of the red cell membrane water channel or pore are discussed.
Key words: Plasmodium falciparum; Red cell membrane; Water permeability; Urea permeability
Introduction
The growth of the malarial parasite Plasmo- dium falciparum in human red cells results in nu- merous biochemical, structural and functional changes in the host cell membrane. Previous studies have shown that the selective permeabil- ity of the red cell membrane is altered by malar- ial infection resulting in an increased transport of several solutes including amino acids [1-3], an- ions [4,5], cations [6,7], and polyols [8,9]. In re- cent years, Ginsburg et al. [9-11] and Kutner et al. [5] have provided evidence for the existence of pore-like permeation pathways in P. falcipa- rum-infected human red cell membranes which
Correspondence address: David L. Vander Jagt, Department of Biochemistry, University of New Mexico, School of Med- icine, Albuquerque, NM, 87131, U.S.A.
Abbreviations: Pf, osmotic water permeability; Pd, diffusive water permeability; P . . . . urea permeability; W~n, osmotically active water fraction; Vis o isotonic red cell volume.
appear to facilitate the transport of various an- ions and non-electrolytes into and out of the cell. In light of the observed parasite-induced altera- tions in red cell membrane permeability proper- ties, it was of interest to investigate the possibil- ity that the permeation pathways could contribute to an increased transport of water across infected human red cell membranes.
In normal red cells the major mechanism for net water transport through the membrane is the bulk flow of water through channels or pores. This ac- counts for 80-90% of the osmotic water flux, with the movement of water through the lipid bilayer accounting for about 10-20% of the total flux [12,13]. These conclusions were based on studies on artificial and normal biological membranes which showed that the ratio between the water permeability measured under an osmotic pres- sure gradient (Pf) and that measured under a dif- fusion gradient (Pd) is greater than unity [14,15]. Since the process of water transport across the red cell membrane is of considerable importance, es- pecially in the regulation of cell volume, the pres-
0166-6851/90/$03.50 t~) 1990 Elsevier Science Publishers B.V. (Biomedical Division)

270
ent study measured the transport of water across infected and uninfected red cell membranes un- der both isotonic and anisotonic conditions in or- der to determine if infection by P. falciparum al- ters the diffusive and/or the osmotic water permeability characteristics of the erythrocyte membrane. The transport of urea across infected and uninfected red cell membranes was also stud- ied since it is a small non-electrolyte only slightly larger than water which should easily pass through the proposed permeation pathways.
Materials and Methods
Materials. Radioisotopes [3H]H20 and [14C]urea were purchased from Dupont NEN Research Products, Boston, MA. All other chemicals were purchased from Sigma Chemical Company, St. Louis, MO.
Preparation of erythrocytes. Blood was drawn from healthy donors by venipuncture into sterile heparinized tubes. After centrifugation, the plasma and buffy coat were removed and the packed cells were washed twice in sterile phos- phate-buffered saline (PBS), pH 7.4, 20°C. Sam- ples of the packed erythrocytes were used in the following procedures, and consisted of: (a) ma- laria-infected cells; (b) uninfected-incubated cells carried through the same experimental procedure as the infected cells; and (c) uninfected, fresh cells drawn on the day of the experiment.
Cultivation of parasites. P. falciparum, Colom- bian strain FCB1 (clone NC-I), was grown in hu- man erythrocytes at 37°C [16]. Culture dishes contained 2-3% erythrocytes in RPMI-1640 me- dium supplemented with 5 mM glutamine, 35 mM 4-(2-hydroxyethyl)-l-piperazine-ethanesulfonic acid (Hepes), 24 mM sodium bicarbonate, gen- tamicin, 33 mg 1-1 and 10% (v:v) horse serum (Hyclone), pH 7.2. When parasitemia reached 8-10%, the parasitized cells were concentrated to >95% by flotation on Plasmagel [17] to provide a trophozoite-rich sample of erythrocytes.
Determination of osmotic water permeability (t f). Pf was determined using the stopped-flow method previously described by Galey [18]. In this method
osmotic volume changes induced by mixing cells with hypertonic solutions are followed by changes in light scattering by the cells.
The resulting experimental cell volume versus time curve was fitted to the predicted Pf derived from the integration of the following equation:
dv/dt = PfAVw [Ci (Vo - b')(Vt - b') - C,n] (1)
where A=cell surface area in cm2; Vw=:partial molar volume of water (approx. 18 cm 3 mol-1; Ci--osmolality before mixing of solution in which cells are suspended; Cm=osmolality after mixing of solution in which cells are suspended; Vo=cell volume before mixing at time=0; Vt--cell volume at time t; b'--red cell volume osmotically inactive in cm 3 and is equal to (1-Weff)V. War is the frac- tion of the cellular water volume which is osmot- ically active [19]. The experimental data curve was fitted to a Runga-Kutta integration [20] of the dv/dt equation by estimating the Pf in a Fibbon- acci search program. The minimum least squares fit of the experimental curve to the integrated theoretical curve was taken to be the value of Pf for a given set of data.
Determination of the osmotically active water fraction (WefO. The isotonic volume Viso is made up of an osmotically inactive volume consisting of intracellular molecules and bound water and an osmotically active fraction [21]. When the osmo- lality of the extracellular medium is altered, the cell responds with a change in its volume of os- motically active water to obtain osmotic equilib- rium. The osmotically active fraction of the cell volume is known as the Well. The War of non-in- fected and infected red cells was determined us- ing the hematocrit method for calculation of red cell volume under anisotonic conditions as de- scribed by Savitz et al. [21]. A plot of Hcto/Hctiso versus "rriso/'rr o yielded a straight line with a slope of Weff and an intercept of 1-Wef f or b, where HCto=hematocrit at each of the various osmolal- ities; Hcti~o=hematocrit at isotonicity; -rro=varlous solution osmolalities and ~riso=isotonic osmolal- ity. Giemsa-stained cell samples at all osmolali- ties showed intact red cells with or without par- asites.
The value of Waf is also used in the determi-

nation of the total cell volume at isotonicity (Viso) as shown in the following equation:
V o = Vi~ o [1 - Wen +Weff ('a'i~dXro) ] (2)
where Vo=volume at various osmolalities [21].
Determination of surface area. Samples of ma- laria-infected and uninfected red blood cells were suspended in a series of buffers of progressively decreasing osmolality. These samples were then fixed with 2.5% glutaraldehyde in cacodylate buffer (0.075 M), pH 7.2. Aliquots (0.1 ml) of fixed cell suspensions were placed on poly-(L-lys- ine) (1 mg/ml) coated coverslips and incubated for 1 h. After treatment with 1% osmium tetroxide for 30 min the cells were dehydrated through graded concentrations of ethanol (50-100%), air- dried and coated with gold. A comparison with critical-point freeze-dried preparations showed no improvement in ultrastructural details over the air- dried preparations. Specimens were observed and photographed utilizing a Hitachi $800 scanning electron microscope equipped with a field emis- sion source. Cell diameters of the spherically swollen cells at the lowest pre-lytic osmolality were measured for all cell samples and the cor- responding cell surface areas were calculated.
Determination of cell solvent water. Solvent water content of malaria-infected and uninfected red cells was determined by weighing known volumes of packed cell samples before and after drying to constant weight. In all calculations of volume, the extracellular medium trapped between the packed cells was assumed to be about 2% [22]. The cel- lular solvent volume was then calculated by di- viding the water content by the number of cells in the sample which was determined by Coulter counting.
Calculation of permeability coefficients Pd and Purea" The permeability coefficient P (cm s -1) is determined from the equation:
P = kV/A (3)
where V/A is the ratio of intracellular solvent water to cell membrane area. Cell volumes and
271
surface areas of all cell samples were calculated as described above.
Determination of the rate constants for efflux of water and urea. Washed red cells were resus- pended to a hematocrit of approximately 60% and radioactively labeled urea ([14C]urea) and water ([3H]H20) were added to give a concentration of 0.2-1 txCi m1-1 of each tracer in the suspension. The rate of tracer efflux from cell samples la- beled with radioactive water and urea was deter- mined at room temperature by the continuous flow method as described by Brahm [13].
Results
Osmotic water permeability (P~) The osmotically active water fraction: Weft. The determination of osmotic water permeability or P~ depends on the rate of red cell volume change created by alteration of the extracellular osmotic environment. When the osmolality of the extra- cellular medium is altered, the cell responds with a change in its volume of osmotically active water, or effective water fraction (Wen). The value of Wef f is included in Eqn. 1 which fits the cell vol- ume vs. time curve and is used to calculate Pf. Therefore it was necessary to determine if in- fected red cells had the same effective water vol- ume as normal cells. The data in Table I show a significant decrease in the infected cell Weee when compared to incubated-uninfected cells (P<0.001). The infected cells have a Wef t of 0.27---0.02 vs. 0.65---0.03 and 0.62---0.03 for the uninfected fresh cells and uninfected incubated cells respectively. The numbers in Table I represent the average Wen values of eight samples from two separate exper- iments with two different donors. Although the uninfected WCf~ values in Table I are somewhat higher than the 0.58 reported in the literature for normal cells [18,21], all values were reproduci- ble, with the plots yielding correlation coeffi- cients of 0.98 or better. The results in Table I in- dicate that the infected red cells have less than half of the osmotically active water fraction of uninfected cells.
Analysis of the experimental data derived from the stopped-flow method requires that the rela- tionship between red cell volume and light scat-

272
T A B L E I
Determinat ion of osmotic water permeabili ty of uninfected and malaria-infected red cells
Cells Diameter (ixm) Area Wen Visa (× 10 -12 cm 3) Cell count ( x 106 ~1-1) Pc (× 10-2 X 10 -6 cm 2 cm s - l )
Fresh uninfected 7.06-+0.04 1.56 0.65-+0.03 117 7.80-+0.38 2.61-+0.08 Incubated unin- 6.96---0.03 1.52 0.62-+0.03 114 7.84-+0.46 2.60-+0.08 fected Malaria infected 6.06-+0.06 1.15 0.27-+0.02 80 11.18-+0.43 0.99-+0.03
Plus and minus values represent the s tandard error of the mean for N values of each determination; N = 9 for cell count; N = 8 for Wef f and N = 9 for Pf. Calculations for area and Viso and are described in the text.
tering be known. Galey [18] has shown that a lin- ear relationship exists between volume and light scattering for normal uninfected red cells. Our results indicate that a linear relationship also ex- ists between red cell volume and light scattering for red cells infected with P. falciparum (Fig. 1). As can be seen, there is an inverse relationship between cell volume and the amount of light scattered by suspensions of infected and unin- fected cells, with the cell volumes at various ton- icities (Vo) calculated from Eqn. 2.
Cell surface area. Determinat ion of the osmotic water permeability, Pf, requires that the cell membrane area be known. The membrane sur- face area was estimated by measuring the diam- eters of swollen infected and uninfected cells at their lowest pre-lytic osmolality of 160 mOsm 1-1. Examples of swollen uninfected and infected cells are shown in Fig. 2. Calculation of surface area was made from the measured mean diameters of
5000 / [ • malaria-infected l • uninfected
i--- ...J i.d ¢.9r~ r 4000
2000
~J n- 2000
1000 70 80 go 100 1 I0 120 130
RBC VOLUME
Fig. 1. Resul ts of a typical exper iment exhibiting the inverse linear relationship between red cell volume and 90 ° light scat- tering at 535 n m for uninfected and malaria-infected red cells.
Details of exper iment described in text.
7.06---0.04 i~m, 6.96---0.03 ~m, and 6.06___0.06 I~m for fresh-uninfected, incubated-uninfected and malaria-infected cells respectively. The infected mean cell diameter was significantly less than that of infected cells (P<0.01) and yielded a 24% de- crease in surface area with a value of 1.15 × 10 - 6
cm 2 (Table I). Our calculated surface area values of 1.56 × 10 -6 cm 2 and 1.52 x 10 -6 cm 2 for fresh- uninfected cells and incubated-uninfected cells respectively, are in good agreement with the pub- lished value of 1.42 x 10 -6 cm 2 for normal red blood cell surface area [23-25].
Isotonic red cell volume (Visa). Isotonic red cell volume (Visa) is also a factor in the calculation of Pf. The cell volume at isotonicity (Vi~o) for unin- fected incubated cells was calculated from Eqn. 2 incorporating the measured diameter approxi- mated at pre-lytic osmolality to estimate 1/o. This resulted in a Viso value of 114 × 10 -12 cm 3 for the uninfected incubated cells (Table I), which is in close agreement with the published value for red cell volume of 104 × 10 -12 cm 3 [26]. From our coulter determinations we found the number of infected cells per unit volume of packed cells to be significantly greater than uninfected cells (P<0.01) as shown in Table I. From these data we can see that the infected cells are about 70% as large as uninfected cells, assuming extracellu- lar space is the same as for normal uninfected packed cells. Since infected cells have volumes which are 70% of normal cells as described above, a Viso o f 80 X 10 -12 c m 3 (70% of 114 × 10 -12 C:TI 3)
was estimated for the infected cells (Table I).
Calculation of Pf. The incorporation of the cor- rect values for cell volume, surface area and Wen into Eqn. 1 results in a significant decrease in the

273
Fig. 2. Scanning electron micrographs of P. falciparum-infected and uninfected human red cells at isotonic and pre-lytic osmo- lalities. (a) Uninfected red cells, 300 mOsm; (b) Malaria-infected red cells, 300 mOsm; (c) Uninfected red cell, 160 mOsm; (d)
Malaria-infected red cell, 160 mOsm. Bar, 2.0 p,m.

274
TABLE If
Determination of permeability coefficients for diffusive water (P0) and urea (Pur~a)
Diffusive water
Fresh uninfected Incubated uninfected Malaria-infected
k (s -1) ed a k (S - l) ed a k (s -1) ed a
Donor 1 48.50 2.02 45.60 1.95 81.40 3.21 Donor 2 103.00 4.27 105.30 4.51 118.20 4.66
Urea
Fresh uninfected Incubated uninfected Malaria-infected
k (s -1) Purea a k (S -1) Purea a k (s 1) pu~eaa
Donor 1 11.40 0.47 12.80 0.54 12.30 0.49 Donor 2 13.00 0.53 11.30 0.48 11.70 0.46
apermeability coefficients (x 10 -3 cm s -1) calculated from V/A ratios of 4.15, 4.28 and 3.94 x 10 -5 cm for fresh-uninfected, in- cubated-uninfected and malaria-infected red cells, respectively.
osmotic water permeability of red cells infected with P. falciparum as compared to uninfected cells (P<0.001) as shown in Table I. The results of nine determinations from several donors yield mean Pf values of 2.61---0.06 × 10 -2 cm s - I , 2.60---0.04 x 10 -2 cm s -1, and 0.99---0.03 × 10 -2 cm s -1 for uninfected-fresh cells, uninfected-incubated cells and malaria-infected red cells respectively.
Urea and diffusive water permeability The permeability coefficient, P, in the equa-
tion P=kV/A, represents the true permeability of the membrane to a solute and incorporates the solvent water volume (V) of the red cell which has been determined to be 64.70 × 10 -12 cm 3 under isotonic conditions [13]. Since our data for ma- laria-infected red cells show a 30% decrease in isotonic volume (Table I), we must assume that the solvent water volume of infected red cells is also decreased by 30%. This results in a solvent water volume of 45.29 x 10 -12 cm 3 and a V/A ra- tio of 3.94 x 10 -5 cm for malaria-infected cells (Table II). We also found that the amount of water in a given packed cell volume is approxi- mately the same for infected cells and uninfected cells. This was determined by the fact that the wet weight minus dry weight is 0.69 g water m1-1 packed cells and 0.71 g water m1-1 packed cells for infected cells and uninfected cells respec- tively. This supports the assumption that the amount of cell water is reduced in each infected cell since the number of infected cells is increased
per unit volume as compared to uninfected cells. Inasmuch as urea is a small non-electrolyte, it
was of interest to determine if the membrane transport of this molecule is increased by malarial infection via the proposed permeation pathways. Permeability coefficients for u r e a (/°urea) trans- port from uninfected and infected cells were cal- culated from the V/A ratios described above and the rate constants of tracer effiux (Table II). There appears to be little difference in urea permeability between infected and uninfected cells, or between the individual donors (Table II). However, the data from two separate donors sug- gest an increase in diffusive water permeability of malaria-infected cells as compared to uninfected cells, with donor 1 exhibiting a larger increase in Pa than donor 2. The reasons for these differ- ences between donors are unclear. This is partic- ularly interesting since both the diffusive water permeability and urea permeability determina- tions were done simultaneously.
The P~/Pd ratio. Bulk flow through a channel, dri- ven by a pressure difference, is represented by the Poiseuille equation where flow is proportional to the pore radius raised to the fourth power (r4). Diffusive flow is proportional to the square of the pore radius (r 2) since it is related to the area available for diffusion (,rrr2). The ratio Pf/Pd re- lates to a geometric property of the pore, and there are two interpretations of this relationship in the literature at present. In the analyses of

275
TABLE III
PflPd ratios of infected and uninfected cells and possible interpretations
Ceils Pe/Pd ratio S Equivalent pore radius b Water molecules per (x 10 -a cm) single-file channel c
Fresh-uninfected Donor 1 12.9 11.7 13 Donor 2 6.1 7.2 6
Incubated-uninfected Donor 1 13.3 11.9 13 Donor 2 5.7 6.9 6
Malaria-infected Donor 1 3.1 4.2 3 Donor 2 2.1 2.8 2
apf and Pd values are from Tables I and II and both are in units of x 10 -2 cm s -1. bThe equivalent pore radii were calculated from equations of Solomon [33]. CAccording to the interpretations of Levitt [29] and Rosenberg and Finkelstein [30].
Renkin [27] and Solomon [28], the Pf/Pd ratio is interpreted to be directly proport ional to the square of the pore radius of some equivalent pore. On the other hand, in small channels such as the gramicidin channel where water permeates by single-file diffusion, the P(Pd ratio has been shown to be equal to the number of water mol- ecules aligned single file in the pore [29-32].
Whichever interpretat ion is used, the funda- mental relationship between the physical param- eters of the Pf/Pd ratio can be used to evaluate the characteristics of the membrane pores. The data f rom Tables I and II were used to calculate the Pe/Pd ratios listed in Table III. As can be seen, the malaria-infected cells have a decreased ratio as compared to uninfected cells regardless of the differences between the donors, with values of 2.1 and 3.1 as compared to 12.9, 6.1 and 13.3, 5.7 for fresh-uninfected and incubated-uninfected cells respectively. The equivalent pore radii were cal- culated f rom the Pf/Po ratios according to Solo- mon [28] and the data show a decrease in the pore radius of infected cell membranes as compared to non-infected cell membranes (Table III) . The values of the pore radii of uninfected cells f rom donor 2 are in good agreement with the equiva- lent pore radius of 6.5---0.6 x 10 -8 cm calculated for normal red cells by Solomon [33]. When the Pf/Po ratio is interpreted in this manner , the data indicate that the size of the water channel is de- creased in malaria-infected cell membranes .
If we interpret the Pe/P d ratio to relate to the number of water molecules diffusing through the
pore single-file, the infected cells show a decrease with values of 2 and 3 molecules as compared to 6 and 13 for the uninfected cells (Table III). These results indicate a decrease in the thickness of the membrane and/or in the length of the channel. It should be noted that the estimated values of 6 and 13 water molecules diffusing through the pore in a single-file fashion in uninfected cell membranes are in good agreement with the 5 to 9 water mol- ecules per water channel reported by Levitt [29], Rosenberg and Finklestein [30], Brahm [34] and Macey [35].
Discussion
The development of the malaria parasite, P. falciparum, in red cells requires that the red cell membrane play a major role in maintaining a physiologically and biochemically stable intraer- ythrocytic environment by providing routes for the access of metaboli tes and removal of catabolites [2]. Various transport mechanisms in the ma- laria-infected cell have been studied, and it ap- pears that the alteration of intrinsic red cell mem- brane propert ies is a prominent modification induced by the parasite to accommodate to its needs. It has been shown that infected cells uti- lize f rom 10 to 50 times more glucose than unin- fected cells [2,36,37]. The uptake of exogenous amino acids is also accelerated in malaria-in- fected cells, and these increases have been attrib- uted to both changes in diffusion and cart ier-me- diated transport propert ies of the red cell

276
membrane [1,38]. In addition, increases in intra- cellular sodium and calcium have been reported in malaria-infected cells [6,7].
In recent years a number of studies have pro- posed that pore-like pathways in malaria-infected cells provide transmembrane routes for various solutes, some of which are normally impermea- ble to uninfected red cells [5,9,10]. The number of such pores at the trophozoite stage of infection has been reported to be 8-16 per cell, each with an estimated radius of 7A [10,11]. These conclu- sions were based on the results of solute-induced hemolysis experiments and size exclusion data, methods which have been recently questioned by Sherman [39]. On the other hand, Ginsburg and Stein [40] have suggested that the permeability characteristics of the infected cell membrane do not fit a pore model, but follow the mode of non- Stokesian diffusion. The validity of the non- Stokesian biophysical model has been challenged by Silfen et al. [41] on the grounds that the model is based on transport data acquired through sub- strate-induced hemolysis experiments which they believe do not reflect the true permeability of the membrane to the solute.
To our knowledge there have been no studies concerning the permeability of the infected cell membrane to water. Regarding the pore-like characteristics of the proposed permeation path- ways, and the fact that the majority of water flux occurs through membrane channels or pores, it seemed possible that the transport of water across infected cell membranes would be increased as compared to uninfected cells. Another stimulus for this investigation was the belief that water permeability measurements of malaria-infected cells as compared to uninfected cells would result in further insight concerning the routes of water and solutes through the red cell membrane and perhaps characteristics of the membrane itself.
We have taken a fundamental approach to the concepts of channels based on the principles of hydrodynamics initially used by Renkin [27] and subsequently applied to pores in the red cell membrane by Paganelli and Solomon [14] and Solomon [28]. This approach is based on the dif- ference between the bulk flow (P0 and diffusive flow (Pd) of water through membrane channels or pores, and the interpretation of the ratio of these
two parameters. The decrease in osmotic water permeability (P0 observed in malaria-infected cells (Table I) indicates a net loss of water permeability resulting from bulk flow through membrane channels in these cells. However, the data in Table II suggest an increase in diffusive water permeability in infected cells which could relate to changes in the infected cell membrane matrix as suggested by Ginsburg and Stein [42]. When comparing the Pf/Pd ratios of infected cells to uninfected cells, the data show a significant de- crease in the ratio and in the corresponding equivalent pore radius of infected cells (Table III). Both of these results indicate that malarial infec- tion decreases the size of the red cell membrane water channel or pore and thus decreases the bulk flow of water through the infected cell mem- brane. Alternatively, malarial infection of the red cell can be said to decrease the thickness of the membrane or the length of the water channel if the Pf/Pd ratio is interpreted according to the sin- gle-file theory [29,30]. Regardless of interpreta- tion, a decrease in bulk water transport across the infected cell membrane in vivo could result in the inability of the infected cell to traverse small ves- sels by not decreasing its cell water volume.
The transport of urea across red cell mem- branes is thought to follow asymmetric carrier ki- netics [43--45]. On the other hand, Solomon et al. [46] have proposed that urea, anions and water share a common path through the integral mem- brane protein Band 3. Nevertheless, urea, a small nonelectrolyte, is a useful probe for membrane channels since it has a radius of about 2A. There- fore, urea should traverse the 7A pathway with ease, and one would expect the urea permeability of infected cell membranes to be increased. How- ever, the data show this not to be the case, since there are little differences in urea permeability between uninfected and infected cells (Table II). Since the malaria-infected cells do show changes in both osmotic and diffusive water permeabili- ties with no corresponding change in urea perme- ability, the data suggest independent pathways for the transport of urea and water across red cell membranes.
In summary, we conclude the following: (1) The data do not support the existence of 7~
pores in the malaria-infected cell membranes as
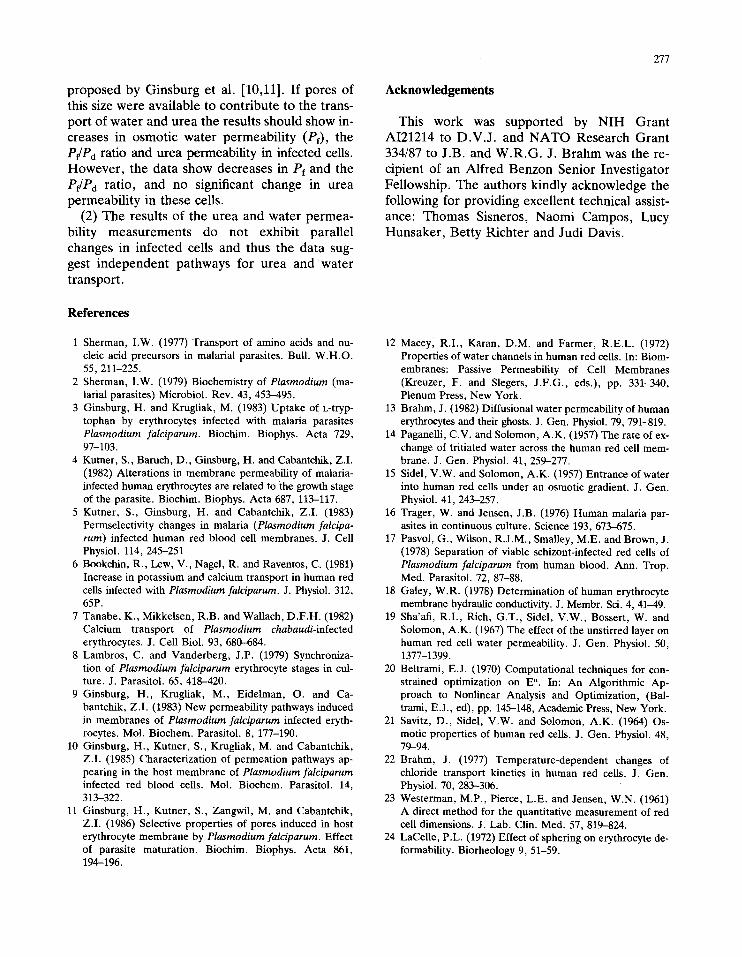
proposed by Ginsburg et al. [10,11]. If pores of this size were available to contribute to the trans- port of water and urea the results should show in- creases in osmotic water permeability (Pf), the P~/Pd ratio and urea permeability in infected cells. However, the data show decreases in Pf and the Pf/Pa ratio, and no significant change in urea permeability in these cells.
(2) The results of the urea and water permea- bility measurements do not exhibit parallel changes in infected cells and thus the data sug- gest independent pathways for urea and water transport.
References
1 Sherman, I.W. (1977) Transport of amino acids and nu- cleic acid precursors in malarial parasites. Bull. W.H.O. 55,211-225.
2 Sherman, I.W. (1979) Biochemistry of Plasmodium (ma- larial parasites) Microbiol. Rev. 43,453--495.
3 Ginsburg, H. and Krugliak, M. (1983) Uptake of L-tryp- tophan by erythrocytes infected with malaria parasites Plasmodium falciparum. Biochim. Biophys. Acta 729, 97-103.
4 Kutner, S., Baruch, D., Ginsburg, H. and Cabantchik, Z.I. (1982) Alterations in membrane permeability of malaria- infected human erythrocytes are related to the growth stage of the parasite. Biochim. Biophys. Acta 687, 113-117.
5 Kutner, S., Ginsburg, H. and Cabantchik, Z.I. (1983) Permselectivity changes in malaria (Plasmodium falcipa- rum) infected human red blood cell membranes. J. Cell Physiol. 114,245-251
6 Bookchin, R., Lew, V., Nagel, R. and Raventos, C. (1981) Increase in potassium and calcium transport in human red cells infected with Plasmodium falciparum. J. Physiol. 312, 65P.
7 Tanabe, K., Mikkelsen, R.B. and Wallach, D.F.H. (1982) Calcium transport of Plasrnodium chabaudi-infected erythrocytes. J. Cell Biol. 93,680--684.
8 Lambros, C. and Vanderberg, J.P. (1979) Synchroniza- tion of Plasmodium falciparum erythrocyte stages in cul- ture. J. Parasitol. 65,418-420.
9 Ginsburg, H., Krugliak, M., Eidelman, O. and Ca- bantchik, Z.I. (1983) New permeability pathways induced in membranes of Plasmodium falciparum infected eryth- rocytes. Mol. Biochem. Parasitol. 8, 177-190.
10 Ginsburg, H., Kutner, S., Krugliak, M. and Cabantchik, Z.I. (1985) Characterization of permeation pathways ap- pearing in the host membrane of Plasmodiurn falciparurn infected red blood ceils. Mol. Biochem. Parasitol. 14, 313-322.
11 Ginsburg, H., Kutner, S., Zangwil, M. and Cabantchik, Z.I. (1986) Selective properties of pores induced in host erythrocyte membrane by Plasmodium falciparum. Effect of parasite maturation. Biochim. Biophys. Acta 861, 194-196.
277
Acknowledgements
This work was supported by NIH Grant AI21214 to D.V.J. and NATO Research Grant 334/87 to J.B. and W.R.G.J . Brahm was the re- cipient of an Alfred Benzon Senior Investigator Fellowship. The authors kindly acknowledge the following for providing excellent technical assist- ance: Thomas Sisneros, Naomi Campos, Lucy Hunsaker, Betty Richter and Judi Davis.
12 Macey, R.I., Karan, D.M. and Farmer, R.E.L. (1972) Properties of water channels in human red cells. In: Biom- embranes: Passive Permeability of Cell Membranes (Kreuzer, F. and Slegers, J.F.G., eds.), pp. 331-340, Plenum Press, New York.
13 Brahm, J. (1982) Diffusional water permeability of human erythrocytes and their ghosts. J. Gen. Physiol. 79, 791-819.
14 Paganelli, C.V. and Solomon, A.K. (1957) The rate of ex- change of tritiated water across the human red cell mem- brane. J. Gen. Physiol. 41,259--277.
15 Sidel, V.W. and Solomon, A.K. (1957) Entrance of water into human red cells under an osmotic gradient. J. Gen. Physiol. 41,243-257.
16 Trager, W. and Jensen, J.B. (1976) Human malaria par- asites in continuous culture. Science 193,673-675.
17 Pasvol, G., Wilson, R.J.M., Smalley, M.E. and Brown, J. (1978) Separation of viable schizont-infected red cells of Plasmodium falciparum from human blood. Ann. Trop. Med. Parasitol. 72, 87-88.
18 Galey, W.R. (1978) Determination of human erythrocyte membrane hydraulic conductivity. J. Membr. Sci. 4, 41-49.
19 Sha'afi, R.I., Rich, G.T., Sidel, V.W., Bossert, W. and Solomon, A.K. (1967) The effect of the unstirred layer on human red cell water permeability. J. Gen. Physiol. 50, 1377-1399.
20 Beltrami, E.J. (1970) Computational techniques for con- strained optimization on E". In: An Algorithmic Ap- proach to Nonlinear Analysis and Optimization, (Bal- trami, E.J., ed), pp. 145--148, Academic Press, New York.
21 Savitz, D., Sidel, V.W. and Solomon, A.K. (1964) Os- motic properties of human red cells. J. Gen. Physiol. 48, 79-94.
22 Brahm, J. (1977) Temperature-dependent changes of chloride transport kinetics in human red ceils. J. Gen. Physiol, 70, 283-306.
23 Westerman, M.P., Pierce, L.E. and Jensen, W.N. (1961) A direct method for the quantitative measurement of red cell dimensions. J. Lab. Clin. Med. 57,819-824.
24 LaCelle, P.L. (1972) Effect of sphering on erythrocyte de- formability. Biorheology 9, 51-59.

278
25 Funder, J., Tosteson, D.C. and Wieth, J.O. (1978) Ef- fects of bicarbonate on lithium transport in human red cells. J. Gen. Physiol. 71,721-746.
26 Jay, A.W.L. (1975) Geometry of the human erythrocyte. I. Effect of albumin on cell geometry. Biophys. J. 15, 205-222.
27 Renkin, E.M. (1954) Filtrating diffusion and molecular sieving through pourous cellulose membranes. J. Gen. Physiol. 38, 225-243.
28 Solomon, A.K. (1968) Characterization of biological membranes by equivalent pores. J. Gen. Physiol. 51, 335S-364S.
29 Levitt, D.G. (1974) A new theory of transport for cell membrane pores, I. General theory and application to red cell. Biochim. Biophys. Acta 373, 115-131.
30 Rosenberg, P.A. and Finkelstein, A. (1978) Water permeability of gramicidin A-treated lipid bilayer mem- branes. J. Gen. Physiol. 72, 341-350.
31 Moura, T.F., Macey, R.I., Chien, D.Y., Karan, D. and Santos, H. (1984) Thermodynamics of all-or-none water channel closure in red cells. J. Membr. Biol. 81,105--111.
32 Galey, W.R. and Brahm, J. (1985) The failure of hydro- dynamic analysis to define pore size in cell membranes. Biochim. Biophys. Acta 818, 425-428.
33 Solomon, A.K. (1986) On the equivalent pore radius. J. Membr. Biol. 94,227-232.
34 Brahm, J. (1983) Water transport through the red cell membrane. Period. Biol. 85, 109-115.
35 Macey, R.I. (1984) Transport of water and urea in red blood cells. Am. J. Physiol. 246, C195-C203.
36 Sherman, I.W. and Tanigoshi, L. (1974) Glucose trans- port in the malarial (Plasmodium lophurae) infected erythrocyte. J. Protozool. 21,603-607.
37 Sherman, I.W. (1985) Membrane structure and function of malaria parasites and the infected erythrocyte. Parasi- tology 91,609-645.
38 Sherman, I.W. and Tanigoshi, L. (1974) Incorporation of 14C-amino acids by malarial plasmodia (Plasmodium lo- phurae), VI. Changes in the kinetic constants of amino acid transport during infection. Exp. Parasitol. 35, 369-373.
39 Sherman, I.W. (1988) The Wellcome Trust Lecture. Mechanisms of molecular trafficking in malaria. Parasitol- ogy. 96, $57-$81.
40 Ginsburg, H. and Stein, W.D. (1987) Biophysical analysis of novel transport pathways induced in red blood cell membranes. J. Membr. Biol. 96, 1-10.
41 Silfen, J., Yanai, P. and Cabantchik, Z.I. (1988) Biofla- vonoid effects on in vivo cultures of Plasmodium falcipa- rum. Inhibition of permeation pathways induced in the host cell membrane by the intraerythrocytic parasite. Biochem. Pharmacol. 37, 4269-4276.
42 Ginsburg, H. and Stein, W.D. (1987) New permeability pathways induced by the malarial parasite in the mem- brane of its host erythrocyte: potential routes for targeting of drugs into infected cells. Biosci. Rep. 7, 455-463.
43 Levitt, D.G. and Mlekoday, H.J. (1983) Reflection coef- ficient and permeability of urea and ethylene glycol in the human red cell membrane. J. Gen. Physiol. 81,239-254.
44 Mayrand, R.R. and Levitt, D.G. (1983) The urea and ethylene glycol facilitated transport systems in the human red cell membrane: saturation, competition, and asym- metry. J. Gen. Physiol. 81,221-238.
45 Brahm, J. (1983) Urea permeability of human red cells. J. Gen. Physiol. 81, 1-24.
46 Solomon, A.K., Chasan, B., Dix, J.A., Lukacovic, M.F., Toon, M.R. and Verkman, A.S. (1983) The aqueous channel in the red cell membrane: band 3 as a channel for anions, cations, nonelectrolytes, and water. Ann. NY Acad. Sci. 414, 97-124.