Embed Size (px)
Citation preview

Portugaliae Electrochimica Acta 26 (2008) 15-46 PORTUGALIAE
ELECTROCHIMICA
ACTA
Wastewaters by Electrochemical Advanced Oxidation
Processes Using a BDD Anode and Electrogenerated H2O2
with Fe(II) and UVA Light as Catalysts
E. Brillas,* J.A. Garrido, R.M. Rodríguez, C. Arias, P.L. Cabot, F. Centellas
Laboratori d’Electroquímica dels Materials i del Medi Ambient, Departament de Química
Física, Facultat de Química, Universitat de Barcelona, Martí i Franquès 1-11, 08028
Barcelona, Spain
Received 18th July 2007
Abstract
This paper reports the mineralization of an aromatic pharmaceutical as clofibric acid and the dye indigo carmine in 0.05 M Na2SO4 of pH 3.0 by electrochemical advanced oxidation processes such as anodic oxidation without and with electrogenerated H2O2, electro-Fenton and photoelectro-Fenton using a boron-doped diamond (BDD) anode. These procedures produce the strong oxidant hydroxyl radical in the form of BDD(•OH) from water oxidation at BDD and/or •OH from Fenton’s reaction between added Fe2+ and H2O2 generated at the cathode by two-electron O2 reduction. Comparative degradation of both compounds is performed with an undivided electrolytic cell of 100 mL with an O2-diffusion cathode. The effect of current density and pollutant concentration on the degradation rate and current efficiency of the different methods is discussed. The decay kinetics of clofibric acid and indigo carmine and the evolution of their aromatic by-products and final carboxylic acids like oxalic and/or oxamic are described to clarify their reaction sequences. Anodic oxidation is able to completely mineralize both compounds mainly with BDD(•OH). Aromatic pollutants are more rapidly destroyed in electro-Fenton due to their faster reaction with •OH, but final Fe(III)-oxalate and Fe(III)-oxamate can only be oxidized with BDD(•OH). The most efficient method is photoelectro-Fenton due to the parallel photolysis of Fe(III)-oxalate complexes with UVA light, although Fe(III)-oxamate complexes are not photodecomposed. Under these conditions, the degradation rate can be enhanced using Cu2+ as co-catalyst because Cu(II)-oxalate and Cu(II)-oxamate complexes are quickly destroyed by •OH. Results on the fast mineralization of 2.5 L of cresols solutions of pH 3.0 by solar photoelectro-Fenton using a flow plant coupled to a solar photoreactor are also reported. The high efficiency and very low operational cost found for this procedure make it useful for the treatment of industrial wastewaters Keywords: clofibric acid, indigo carmine, cresols, anodic oxidation, electro-Fenton, photoelectro-Fenton, solar photoelectro-Fenton.
* Corresponding author. E-mail address: [email protected].

E. Brillas et al. / Portugaliae Electrochimica Acta 26 (2008) 15-46
16
Introduction Pharmaceuticals and dyes are found as common contaminants of the aquatic environment. Thousands of tons of pharmaceutical drugs are consumed yearly worldwide in human and veterinary medicine and agricultural products. Since their wastewaters are inefficiently destroyed in municipal sewage treatment plants (STPs), a fairly large number of these compounds have been recently detected in surface, ground and even drinking waters at low contents up to micrograms per liter [1-5]. The possible interactions of these emerging pollutants with living beings in the environment are not well documented, although it is known that some drugs can affect the endocrine system of fishes, can exert toxic effects on algae and invertebrates and can favor the development of multi-resistant strains of microorganisms [6]. On the other hand, dyes consumed in large amounts by textile industries are lost up to fifteen percent during the dyeing process and disposed out in their effluents [7-9]. These colored industrial wastewaters are a dramatic source of esthetic pollution and perturbation of the aquatic life. Most dyes are toxic and recalcitrant to biodegradation, causing decay in the efficiency of biological plants currently used for the treatment of wastewaters containing such compounds [9,10]. The need of avoiding the possible adverse effects of the accumulation of pharmaceuticals and dyes in the aquatic environment on the health of living beings makes necessary to search powerful oxidation methods to decontaminate their industrial wastewaters, thus restoring the quality of natural and drinking waters. This paper reports the mineralization of common aromatic drugs and dyes such as clofibric acid, indigo carmine and cresols by means of different electrochemical advanced oxidation processes (EAOPs) using a boron-doped diamond (BDD) anode and different catalysts. These methods are promising technologies for wastewater remediation based on the electrogeneration of hydroxyl radical (•OH), which is a very strong oxidizing species due to its high standard potential (Eº = 2.80 V vs. NHE). This species is able to react non-selectively with most organic pollutants yielding dehydrogenated or hydroxylated products up to their total mineralization, i.e. their conversion in carbon dioxide, water and inorganic ions. EAOPs are environmentally friendly electrochemical techniques of great efficiency, relatively low energy cost and easily applicable [11]. The most useful EAOPs are anodic oxidation (AO), electro-Fenton (EF) and photoelectro-Fenton with UVA irradiation (PEF) and all them have been assessed for the destruction of pollutants considered in this work. The beneficial use of sunlight in the so-called solar photoelectro-Fenton (SPEF) treatment is also tested. Clofibric acid (2-(4-chlorophenoxy)-2-methylpropionic acid) is the bioactive metabolite of clofibrate, etofibrate and etofyllineclofibrate, which are drugs widely used as blood lipid regulators [12]. It has an estimated environmental persistence of 21 days [13] and has been found up to 10 µg L-1 in STPs, effluents, rivers, lakes, North Sea, ground waters and drinking waters [14]. However, clofibric acid is poorly degraded by ozonation [15,16], sunlight and UV photolysis [17] and biological methods in STPs [12], as well as by advanced oxidation processes (AOPs) like H2O2/UV [16] and TiO2/UV [18] systems.

E. Brillas et al. / Portugaliae Electrochimica Acta 26 (2008) 15-46
17
Indigo carmine (3,3'-dioxo-2,2'-bi-indolinylidene-5,5'-disulfonic acid or Acid Blue 74) is the soluble derivative of indigo produced from its reaction with sulfuric acid. Indigo is one of the oldest and most important industrial dyes, widely used in the dyeing of clothes (blue jeans) and other blue denim [7]. Indigo carmine is also a common dye, also being used as food coloring, as indicator in analytical chemistry and as a microscopic stain in biology. Recent studies described that it can be destroyed in a discharge plasma reactor [19], with chemical oxidants such as peroxodisulfate ion [19], H2O2 catalyzed with transition metal ions [8] and ozone [20], and by H2O2/UV [21] and TiO2/UV [7]. Phenolic compounds are widely used in the manufacture of antioxidants, biocides, disinfectants, insecticides, herbicides, dyes, pulp, paper and other synthetic chemicals. They are common pollutants in natural waters due to their high aqueous solubility and weak adsorption to most soils [22]. Among them, cresols are toxic and biorefractory products that can cause health chronic effects at contents ≥ 12 mg L-1 [23]. Several authors reported the quick removal of o-cresol, m-cresol and/or p-cresol from waters by AOPs as H2O2/Fe
2+ (Fenton’s reagent) [23] and TiO2/UVA [24-26]. Recently, Rajkumar and Palanivelu [27] reported the comparative treatment of alkaline solutions with 500 mg L-1 of o-cresol, m-cresol and p-cresol and up to 4.5 g L-1 of chloride ion at 30 ºC using an undivided cell with a Ti/TiO2-RuO2-IrO2 anode and a graphite cathode. Low total organic carbon (TOC) removal values between 50 and 60% after the consumption of high specific charges of 40-50 A h L-1 were found. Nava et al. [28] studied the efficient direct anodic oxidation of 2 mM o-cresol and p-cresol solutions in 1 M H2SO4 using a one-compartment flow filter-press FM01-LC electrochemical cell with a BDD anode and a Ti/Pt cathode, both of 64 cm2 area. After 3 h of electrolysis at 10 mA cm-2, o-cresol attained 84% mineralization, with 67% current efficiency and an energy cost of 6.56 kWh m−3, whereas p-cresol reached 90% mineralization, with 71% current efficiency and an energy cost of 7.84 kWh m−3. This paper describes initially the main characteristics of the degradation of organics by EAOPs with a BDD anode. Comparative treatment of acidic aqueous solutions of clofibric acid and indigo carmine by such procedures using an undivided electrolytic cell with a stainless steel or O2-diffusion cathode is further presented. Their intermediates products were also determined to propose plausible reaction sequences for their mineralization process. Finally, the oxidation power of solar photoelectro-Fenton to destroy cresols is examined using a flow plant coupled to a solar photoreactor.
Degradation of organics by EAOPs The most popular EAOP is anodic oxidation that is based on the destruction of organics in an electrolytic cell under the action of hydroxyl radical formed as intermediate from water oxidation to O2 at a high O2-overvoltage anode. In last years, AO has attracted great attention for wastewater remediation due to the use of a boron-doped diamond (BDD) thin-film as anode in which takes place the reaction [29-31]:

E. Brillas et al. / Portugaliae Electrochimica Acta 26 (2008) 15-46
18
BDD + H2O → BDD(OH) + H+ + e− (1)
where BDD(OH) denotes the hydroxyl radical physisorbed or remaining near the BDD surface. This anode has technologically important characteristics such as a very large electrochemical window (up to ca. 3 V in 1 M H2SO4), much higher O2-overvoltage than metallic oxides anodes, high stability and chemical resistance in acid and alkaline media and weak adsorption properties of interaction with •OH and organic pollutants, so that, most reactions between these species occur in the vicinity of its surface [30]. These properties confer to the BDD anode a high oxidation power to yield overall mineralization of organics, as experimentally confirmed for several aromatics and carboxylic acids degraded by AO with BDD in aqueous medium [10,29,32-51]. BDD then seems the most adequate anode for the AO treatment of organic wastewaters. In sulfate media, however, other weaker oxidants as S2O8
2−, H2O2 and O3 can be competitively produced as follows [30]:
2 SO42− → S2O8
2− + 2 e− (2)
2 H2O → H2O2 + 6 H+ + 6 e− (3)
3 H2O → O3(g) + 6 H+ + 6 e− (4)
More potent EAOPs are indirect electrooxidation methods with hydrogen peroxide electrogeneration. In these techniques H2O2 is continuously supplied to the contaminated solution from the two-electron reduction of O2 usually at carbon-felt [52-62] and carbon-polytetrafluoroethylene (PTFE) O2-diffusion [40,62-73] cathodes:
O2(g) + 2 H+ + 2 e− → H2O2 (5)
When an undivided electrolytic cell with a Pt anode is used, H2O2 is oxidized to O2 with formation of hydroperoxyl radical (HO2
•) as intermediate, a much weaker oxidant than •OH [31,63,65]:
H2O2 → HO2• + H+ + e− (6)
HO2• → O2 + H
+ + e− (7)
Hydrogen peroxide is then accumulated in the medium and attains a steady concentration directly proportional to the current density, just when the rates of reactions (5) and (6) become equal. The direct use of this method, so-called anodic oxidation with electrogenerated H2O2 (AO-H2O2), involves the

E. Brillas et al. / Portugaliae Electrochimica Acta 26 (2008) 15-46
19
destruction of organics mainly by BDD(•OH) formed from reaction (1), also being possible their reaction with weaker oxidants like H2O2 and HO2
•. In acidic medium the oxidation power of H2O2 is strongly enhanced using the electro-Fenton method, where a small quantity of Fe2+ is added as catalyst to the contaminated solution to generate Fe3+ and •OH from Fenton’s reaction with a second-order rate constant k2 = 53 M
-1 s-1 [74-76]:
Fe2+ + H2O2 → Fe3+ + •OH + OH− (8)
Reaction (8) can be propagated due to the catalytic behavior of the Fe3+/Fe2+ system. Thus, Fe2+ is continuously regenerated in small extent from the reduction of Fe3+ at the cathode by reaction (9) or in the medium with electrogenerated H2O2 by reaction (10) with k2 = 3.1 x 10
-3 M-1 s-1 [77], with hydroperoxyl radical (HO2
•) by reaction (11) with k2 < 1 x 10³ M-1 s-1 [78] and/or with organic radical
intermediates R• by reaction (12). However, •OH produced in the medium can also be rapidly destroyed with Fe2+ to give Fe3+ via reaction (13) with a k2-value of 4.3 x 10⁸ M-1 s-1 [76], which is seven orders of magnitude higher than that of Fenton’s reaction (8).
Fe3+ + e− → Fe2+ (9)
Fe3+ + H2O2 → Fe2+ + H+ + HO2• (10)
Fe3+ + HO2• → Fe2+ + H+ + O2 (11)
Fe3+ + R• → Fe2+ + R+ (12)
Fe2+ + •OH → Fe3+ + OH− (13)
Our group has tested the behavior of this method using an undivided cell with a BDD anode and has found that pollutants are simultaneously oxidized with BDD(•OH) produced from reaction (1) and by •OH formed from Fenton’s reaction (8) [40]. Another EAOP is the photoelectro-Fenton process in which the solution treated under EF conditions is simultaneously irradiated with UVA light. The action of this irradiation is complex and can be accounted for by: (i) the production of higher amount of •OH from photoreduction of Fe(OH)2+, the predominant Fe3+ species in acid medium [74], by reaction (14) and (ii) the photodecarboxylation of complexes of Fe(III) with generated carboxylic acids, as shown in reaction (15) for oxalic acid [79]. This acid is generated during the oxidation of most organics and the fast photolysis of Fe(III)-oxalate complexes (Fe(C2O4)
+, Fe(C2O4)2
− and Fe(C2O4)33−) favors the decontamination process [59,63,65].

E. Brillas et al. / Portugaliae Electrochimica Acta 26 (2008) 15-46
20
Fe(OH)2+ + hν → Fe2+ + •OH (14)
2 Fe(C2O4)n(3-2n) + hν → 2 Fe2+ + (2n-1) C2O4
2- + 2 CO2 (15) In PEF the alternative use of sunlight as inexpensive source of UVA light is also feasible. This method so-called solar photoelectro-Fenton can also enhance photolytic processes taking place in the visible region, as in the case of reaction (14) that occurs between 300 and 480 nm.
Materials and methods
Clofibric acid, 4-chlorophenol, hydroquinone, p-benzoquinone, indigo carmine (disodium salt), indigo, isatin (1H-indole-2,3-dione), isatin 5-sulfonic acid (sodium salt), o-cresol, m-cresol, p-cresol, 2-methylhydroquinone and 2-methyl-p-benzoquinone were reagent grade from Aldrich, Fluka and Merck. 4-chlorocatechol was synthesized by chlorination of pyrocatechol with SO2Cl2 [65]. Pure standards for detected carboxylic acids were reagent or analytical grade from Sigma, Fluka, Merck, Panreac and Avocado. Anhydrous sodium sulfate, used as background electrolyte, and heptahydrated ferrous sulfate and pentahydrated cupric sulfate, both used as catalysts, were analytical grade from Fluka. All solutions were prepared with high-purity water obtained from a Millipore Milli-Q system with resistivity > 18 MΩ cm at 25 ºC. The initial pH of each solution was adjusted with analytical grade sulfuric acid from Merck. Organic solvents and other chemicals employed were either HPLC or analytical grade from Fluka and Panreac. The solution pH was determined with a Crison 2000 pH-meter. Aliquots withdrawn from treated solutions were filtered with Whatman 0.45 µm PTFE filters before analysis. The concentration of accumulated H2O2 in electrolyzed solutions was determined from the light absorption of the titanic-hydrogen peroxide colored complex at λ = 408 nm [80]. Fe2+ and Fe3+ contents in the same solutions were obtained by measuring the light absorption of their colored complexes with 1,10-phenantroline at λ = 508 nm [81] and SCN− at λ = 466 nm [82], respectively. Colorimetric determinations were made with a Unicam UV/Vis UV4 spectrophotometer thermostated at 25 ºC. The degradation of all solutions was monitored from the removal of their TOC, measured on a Shimadzu 5050 or VCSN TOC analyzer using the standard non-purgeable organic carbon method. Several electrolyses of clofibric acid and indigo carmine solutions of pH 3.0 were made to extract the intermediates with 30 mL methylene chloride or diethyl ether. The collected organic solutions were either concentrated or completely evaporated. In the latter case derivatization was made by dissolving the remaining solid in 100 µL of N,O-bis-(trimetylsilyl)acetamide, followed by heating at 60 ºC and stirring for 10 min. The resulting intermediates or its silylated products were then analyzed by GC-MS with a Hewlett-Packard system composed of a HP 5890 Series II gas chromatograph fitted with a HP-5 0.25 µm column (30 m x 0.25 mm (i. d.)), coupled with a HP 5989A mass spectrometer operating in EI mode at 70 eV. The temperature ramp was 120 ºC for 4 min, 8 ºC min-1 up to 300 ºC and hold time 4
E. Brillas et al. / Portugaliae Electrochimica Acta 26 (2008) 15-46
21
min. The temperature of the inlet, transfer line and detector was 250 ºC, 250 ºC and 300 ºC, respectively. The decay of pollutants and the time-course of its aromatic products were followed by reversed-phase HPLC chromatography using a Waters 600 high-performance liquid chromatograph fitted with a Waters 996 photodiode array detector. For clofibric acid, a Spherisorb ODS2 5 µm column (150 mm x 4.6 mm (i. d.)) at room temperature was used circulating a 50:47:3 (v/v/v) methanol/phosphate buffer (pH = 2.5)/pentanol mixture at 1.0 mL min-1 as mobile phase. In the case of indigo carmine, the column was a Phenomenex Luna 5 µm C18 (250 mm x 4.6 mm (i. d.)) operating at room temperature and the mobile phase was a mixture of 70:30 (v/v) 0.05 M phosphate buffer (pH 7.2) + 0.01 M tetrabutylammonium hydrogensulfate/acetonitrile at 0.8 mL min-1. For each product, the photodiode detector was selected at the maximum wavelength of its UV-absorption band. Generated carboxylic acids were identified by ion-exclusion HPLC chromatography using the above chromatograph fitted with a Bio-Rad Aminex HPX 87H column (300 mm x 7.8 mm (i. d.)) at 35 ºC. In these measurements the photodiode detector was selected at 210 nm and the mobile phase was 4 mM H2SO4 at 0.6 mL min-1. NH4
+ concentration in treated indigo carmine solutions was determined from the standard colorimetric method with Nessler's reagent. NO3
− concentration in the same solutions was obtained by ion chromatography using a Shimadzu 10Avp HPLC chromatograph fitted with a Shim-Pack IC-A1S anion column (100 mm x 4.6 mm (i. d.)) at 40 ºC and coupled with a Shimadzu CDD 10Avp conductivity detector under circulation of an aqueous mobile phase containing 1.0 mM p-hydroxybenzoic acid and 1.1 mM N,N-diethylethanolamine at 1.5 mL min-1. Cl− content in treated solutions of clofibric acid was also obtained by ion chromatography using the above system with a mixture of 2.5 mM phtalic acid and 2.4 mM tris(hydroxymethyl)- aminomethane) of pH 4.0 at 1.5 mL min-1 as mobile phase. EAOPs treatments were studied using an undivided electrolytic cell of 100 mL and a flow plant coupled to a solar photoreactor of 2.5 L under galvanostatic conditions. Fig. 1a shows a scheme of the first system described elsewhere [31]. The cell contained 100 mL of a contaminated solution at 35.0 ºC vigorously stirred with a magnetic bar and the cathode was a 3 cm2 carbon-PTFE electrode from E-TEK, fed with pure O2 at a flow rate of 12 mL min-1 to electrogenerate H2O2 from reaction (5), while O2 in excess was released to the atmosphere through the open top of the holder. In anodic oxidation a 3 cm2 stainless steel (AISI 304) was used as alternative cathode. The anode was a 3 cm2 BDD thin film deposited on a conductive single crystal p-type Si (100) wafers from CSEM, although some comparative experiments were made with a 3 cm2 Pt sheet of 99.99% purity from SEMPSA. In this way, EAOPs with BDD/steel, Pt/O2 and BDD/O2 cells were tested by applying a constant current density (j) supplied by an Amel 2053 potentiostat/galvanostat. The interelectrode gap was maintained at about 1 cm. The PEF method became operative when the solution was irradiated with UVA light of λmax = 360 nm emitted by a Philips 6-W fluorescent black light blue tube, yielding a photoionization energy input to the solution of 140 µW cm-2, as detected with a NRC 820 laser power meter working at 514 nm.
E. Brillas et al. / Portugaliae Electrochimica Acta 26 (2008) 15-46
22
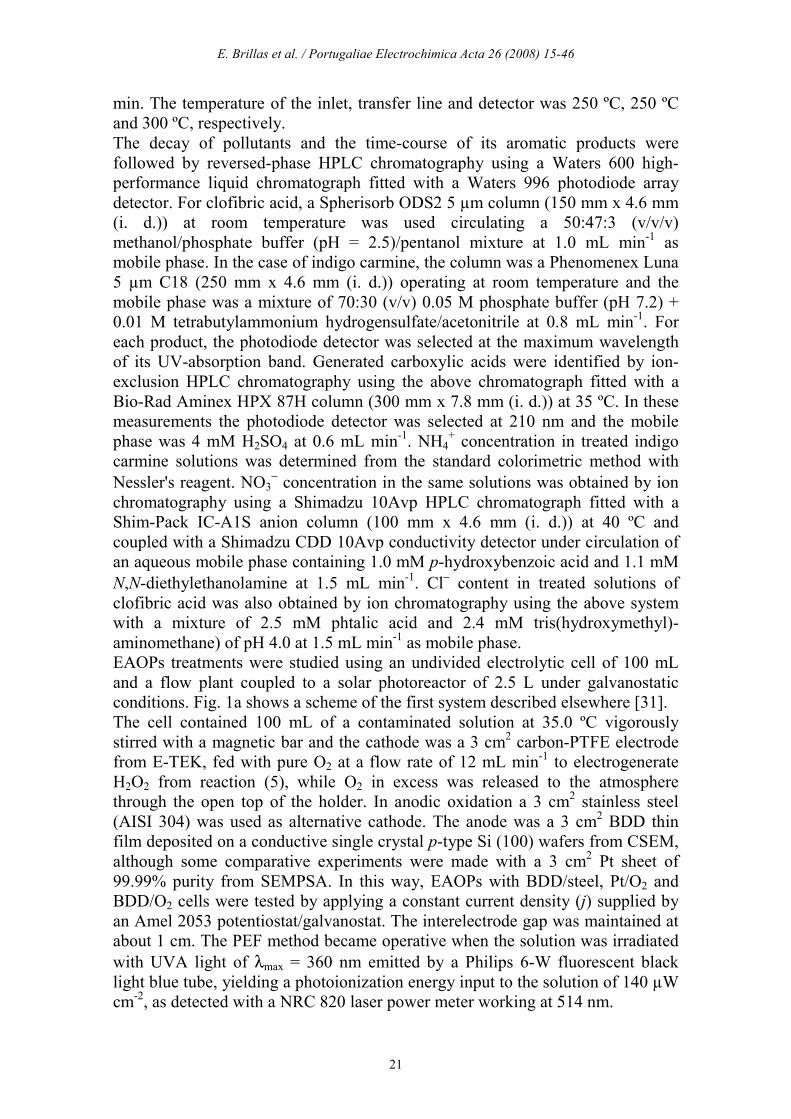
Figure 1. (a) Undivided two-electrode cell of 100 mL capacity with a 3 cm2 O2-diffusion cathode used for wastewater treatment by EAOPs [31]. (b) Flow plant (left) and one-compartment filter-press electrochemical cell (right) of 20 cm2 area used for the solar photoelectro-Fenton (SPEF) treatment of 2.5 L of cresols effluents [71]. (1) Flow cell, (2) power supply, (3) solar photoreactor, (4) reservoir, (5) peristaltic pump, (6) flowmeter, (7) heat exchangers, (8) purge valves.
Fig. 1b presents the sketches of the flow plant and the electrochemical cell used for the SPEF degradation with a BDD anode of 2.5 L of cresols solutions. The solution was introduced in the reservoir and continuously recirculated through the cell by a peristaltic pump at constant liquid flow rate by a flowmeter. The temperature was maintained at 30 ºC by two heat exchangers. The current was supplied by an Agilent 6552A DC power supply, which directly displayed the applied cell voltage. The solar photoreactor was a polycarbonate box of 240 mm x 240 mm x 25 mm (irradiated volume 600 mL), with a mirror at the bottom and inclined 30º from the horizontal to collect better the direct sun rays. Regarding the electrochemical cell, their components of 80 mm x 120 mm in dimension were separated with Viton gaskets to avoid leakages. The liquid compartment and O2 chamber were made of PVC and had a central window of 40 mm x 50 mm (20 cm2) to contact the effluent with the outer faces of both electrodes and to

E. Brillas et al. / Portugaliae Electrochimica Acta 26 (2008) 15-46
23
inject pure O2 to the cathode by its inner face, respectively. The anode was a BDD thin film from CSEM and the cathode was a carbon-PTFE O2-diffusion electrode from E-TEK, which was fed with pure O2 gas at 1.5 bar regulated with a back-pressure gauge connected to the O2 chamber. A Ni mesh between this chamber and the cathode acted as electrical connector. The interelectrode gap was 12 mm. Experiments were performed in sunny and clear days during the summer of 2006 in our laboratory (longitude: 41º 21’ N, latitude: 2º 10’ E). The average solar irradiation intensity varied between 740 and 810 W m-2, with direct UVA irradiation intensity between 17 and 20 W m-2, as measured by the weather station of our center. All experiments were performed with solutions containing 0.05 M Na2SO4 as background electrolyte. The initial pH was 3.0, close to the optimum pH of 2.8 for Fenton’s reaction (8) [74], which slightly decreased to 2.7-2.8 along all electrolyses. EF and PEF treatments in the undivided electrolytic cell of 100 mL were made with 1.0 mM Fe2+ as catalyst, although some trials were also made with 0.25 mM Cu2+ as co-catalyst, and at j values of 33, 100 and 150 mA cm-2. SPEF degradations in the flow plant were carried out with 0.25 or 1.0 mM Fe2+ in the j-range 25-100 mA cm-2. Before use of the plant, 2.5 L of 1 M H2SO4 were electrolyzed at 25 mA cm-2 for 4 h to remove organic impurities on the BDD anode surface and activate the O2-diffusion cathode.
Hydrogen peroxide electrogeneration The ability of the Pt/O2 cell to accumulate the H2O2 supplied by the carbon-PTFE O2-fed cathode from reaction (5) was previously characterized by electrolyzing 100 mL of 0.05 M Na2SO4 + H2SO4 solutions of pH 3.0 at 100, 300 and 450 mA [31]. Under these conditions, H2O2 is continuously accumulated for 3 h and attains a steady concentration of 17, 47 and 73 mM, respectively, values directly proportional to the applied current. The steady state is then reached when H2O2 is electrogenerated and simultaneously destroyed in the system at the same rate. The latter process takes place via HO2
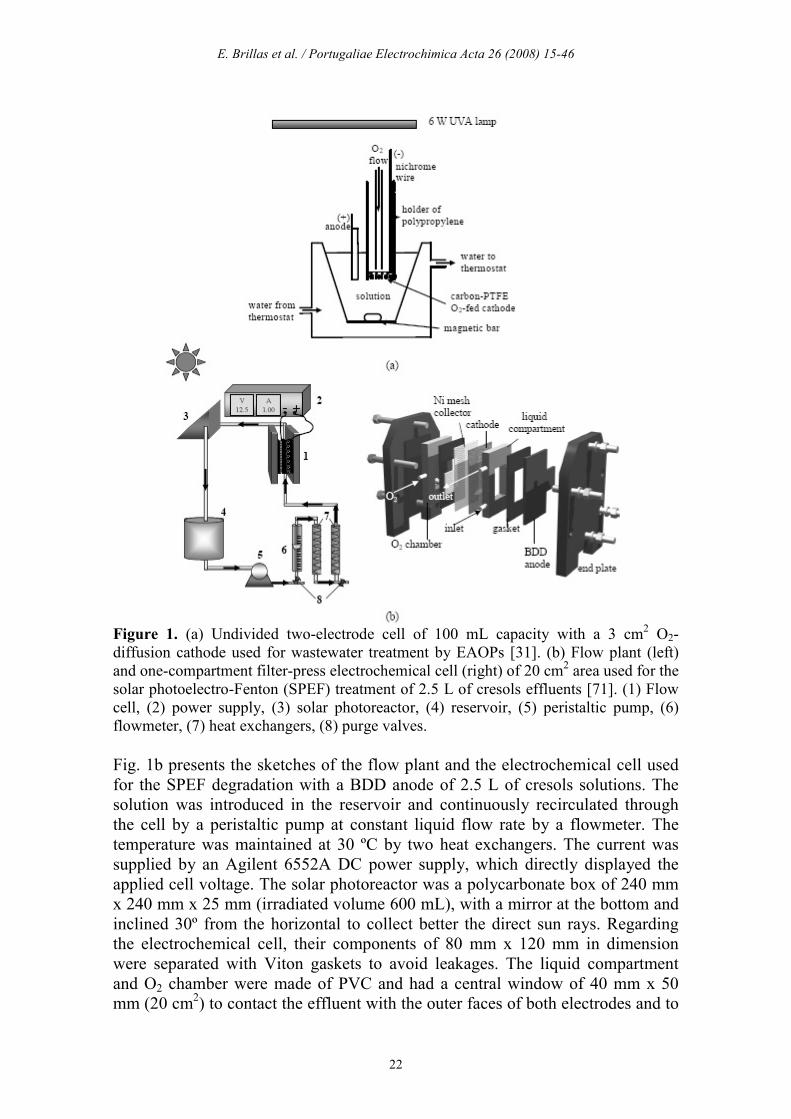
• formation following reactions (6) and (7), which compete with anodic oxidation of water to O2 initiated by reaction (1). A similar behavior can be seen in Fig. 2 when 2.5 L of a 0.05 M Na2SO4 solution of pH 3.0 were electrolyzed in the flow plant with a BDD/O2 cell at different current densities, 25 ºC and liquid flow rate of 180 L h-1 for 9 h [74]. In this system, H2O2 concentration progressively rises in solution up to reach steady values of 54, 36 and 16 mM at 150 mA cm-2 (curve a), 100 mA cm-2 (curve b) and 50 mA cm-2 (curve c), respectively. Since the steady H2O2 content is directly proportional to j, it can be inferred that the increase in current density causes the proportional electrogeneration of H2O2 from reaction (5), along with its proportional decomposition from reaction (6), producing more quantity of HO2
•. Note that low concentrations of other weak oxidants such as peroxodisulfate and O3 can also be produced at the BDD anode from reactions (2) and (4), respectively, as detected during the electrolyses of Na2SO4 solutions [30].
E. Brillas et al. / Portugaliae Electrochimica Acta 26 (2008) 15-46
24
Figure 2. Dependence of accumulated H2O2 concentration on time during the electrolysis of 2.5 L of a 0.05 M Na2SO4 solution of pH 3.0 in the flow plant at: (a) 150 mA cm-2, (b) 100 mA cm-2, (c) 50 mA cm-2, 25 ºC and liquid flow rate of 180 L h-1. In curve d, a 100 mg L-1 mecoprop solution with 0.5 mM Fe2+ was degraded under the same conditions at 50 mA cm-2 by SPEF [73]. The effect of Fe2+ and UVA light on H2O2 accumulation was also investigated in the Pt/O2 cell [31]. It was found that when 1.0 mM Fe2+ is added to 100 mL of the 0.05 M Na2SO4 solution electrolyzed at 300 mA (electro-Fenton conditions), less H2O2 is accumulated, as expected if decomposition of H2O2 is accelerated by the action of Fe2+ from Fenton’s reaction (8), Fe3+ from reaction (9) and •OH as follows [83]:
H2O2 + •OH → HO2
• + H2O (16)
Operating under photoelectro-Fenton conditions at 300 mA, a higher decay in accumulated H2O2 was obtained, since UVA irradiation enhances Fe2+ regeneration from reaction (14), leading to an increase in rate of reactions (8), (9) and (16). The same trends for H2O2 accumulation is then expected for the BDD/O2 cell operating under EF and PEF conditions. The behavior of this system in SPEF was studied during the treatment of a solution with 100 mg L-1 of the herbicide mecoprop, 0.05 M Na2SO4 and 0.5 mM Fe2+ of pH 3.0 in the flow plant at 50 mA cm-2. As can be seen in curve d of Fig. 2, H2O2 is always present in excess in the medium (< 2 mM), indicating that the system maintains the maximum production of •OH from Fenton’s reaction (8) during the SPEF process, thus allowing the fastest destruction of pollutants with this oxidant. The above results evidence that H2O2 electrogeneration is faster than its decomposition in both, the electrolytic cell and the flow plant. The excess of this species is then accumulated in more or less content depending on the indirect electrooxidation method applied. This ensures the optimum generation of •OH in
E. Brillas et al. / Portugaliae Electrochimica Acta 26 (2008) 15-46
25
the presence of catalyst Fe2+ from Fenton’s reaction (8) at pH 3.0, i.e., under the conditions selected for the treatment of clofibric acid, indigo carmine and cresols.
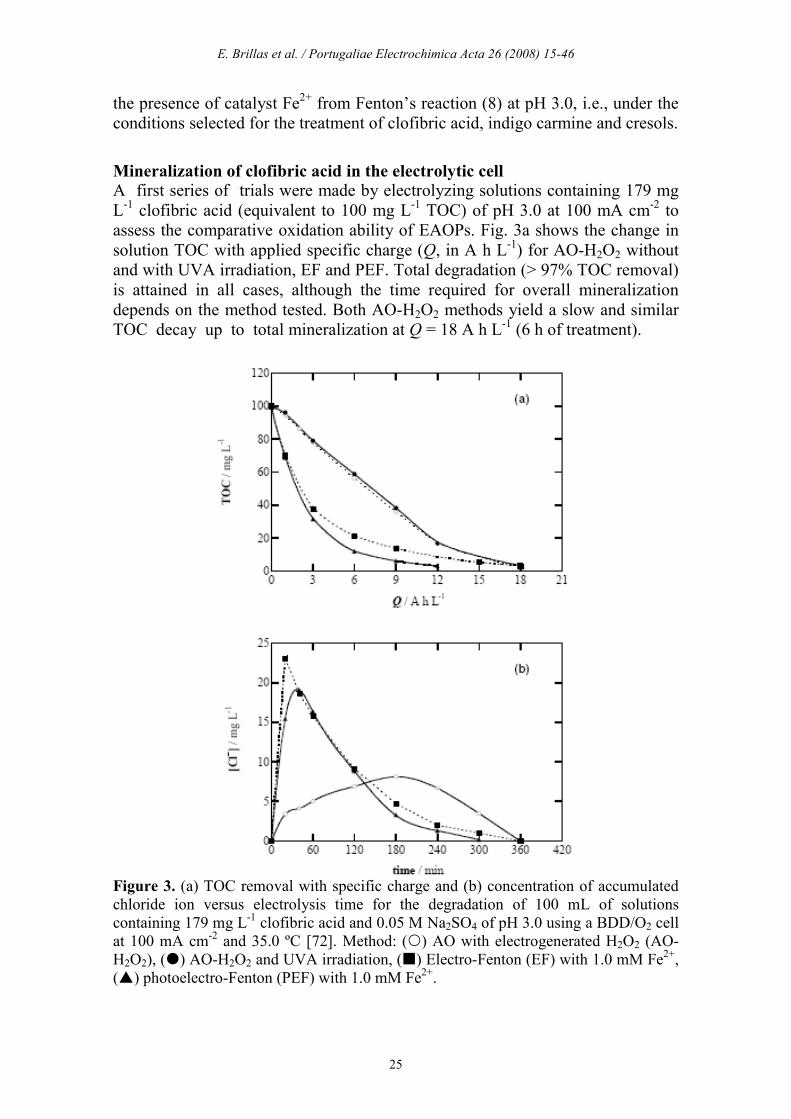
Mineralization of clofibric acid in the electrolytic cell A first series of trials were made by electrolyzing solutions containing 179 mg L-1 clofibric acid (equivalent to 100 mg L-1 TOC) of pH 3.0 at 100 mA cm-2 to assess the comparative oxidation ability of EAOPs. Fig. 3a shows the change in solution TOC with applied specific charge (Q, in A h L-1) for AO-H2O2 without and with UVA irradiation, EF and PEF. Total degradation (> 97% TOC removal) is attained in all cases, although the time required for overall mineralization depends on the method tested. Both AO-H2O2 methods yield a slow and similar TOC decay up to total mineralization at Q = 18 A h L-1 (6 h of treatment).
Figure 3. (a) TOC removal with specific charge and (b) concentration of accumulated chloride ion versus electrolysis time for the degradation of 100 mL of solutions containing 179 mg L-1 clofibric acid and 0.05 M Na2SO4 of pH 3.0 using a BDD/O2 cell at 100 mA cm-2 and 35.0 ºC [72]. Method: () AO with electrogenerated H2O2 (AO-H2O2), () AO-H2O2 and UVA irradiation, () Electro-Fenton (EF) with 1.0 mM Fe2+, () photoelectro-Fenton (PEF) with 1.0 mM Fe2+.

E. Brillas et al. / Portugaliae Electrochimica Acta 26 (2008) 15-46
26
This behavior indicates that all organics are destroyed by the oxidant BDD(•OH) formed from reaction (1), without significant photolysis by UVA light. In contrast, the degradation rate (the change of TOC with time) is strongly enhanced in EF and PEF. The significant acceleration of the destruction of organic pollutants in the early stages of the EF process can be accounted for by their quicker reaction with the great amount of •OH formed from Fenton’s reaction (8). For this method, however, the rate in TOC decay gradually drops with prolonging electrolysis, probably by the formation of complexes of Fe(III) with final carboxylic acids that are hardly oxidized. Thus, the solution is totally mineralized at 6 h, that is, at similar time to that needed for both AO-H2O2 treatments. Fig. 3a also evidences that TOC is much more rapidly removed by PEF, where total decontamination is achieved at Q = 12 A h L-1 (4 h). The increase in mineralization rate in this process can be related to: (i) the enhanced generation of •OH due to additional photoreduction of Fe(OH)2+ from reaction (14) and/or (ii) the parallel photodegradation of complexes of Fe(III) with final carboxylic acids via reaction (15). All these results bring to consider that photoelectro-Fenton is the method with highest oxidation power.
Figure 4. TOC abatement vs. specific charge for the treatment of 100 mL of clofibric acid solutions of pH 3.0 by EF with 1.0 mM Fe2+ using a BDD/O2 cell at 35.0 ºC [72]. In plot (a), 179 mg L-1 of metabolite at () 33 mA cm-2, () 100 mA cm-2, () 150 mA cm-2. In plot (b), () 557 mg L-1 (close to saturation), () 358 mg L-1, () 179 mg L-1, (∆) 89 mg L-1 of metabolite at 100 mA cm-2.

E. Brillas et al. / Portugaliae Electrochimica Acta 26 (2008) 15-46
27
Figure 5. TOC decay with electrolysis time for the treatment of 100 mL of indigo carmine solutions of pH 3.0 by means of AO with a BDD/steel cell at 35.0 ºC [51]. In plot (a), 220 mg L-1 of dye degraded at () 33 mA cm-2, () 100 mA cm-2, () 150 mA cm-2. In plot (b), () 880 mg L-1, () 441 mg L-1, () 220 mg L-1, () 112 mg L-1 of indigo carmine electrolyzed at 100 mA cm-2.
Mineralization of clofibric acid is accompanied by the release of chloride ion. This was confirmed by ion chromatography of treated solutions that only displayed a defined peak at a retention time (tr) of 2.3 min related to Cl−. The evolution of the concentration of this ion in the above treatments is presented in Fig. 3b. As can be seen, Cl− is accumulated and totally removed in 300-360 min in all cases, after reaching a maximum content of 8 mg L-1 at 180 min of AO-H2O2, 23 mg L-1 at 20 min of EF and 19 mg L-1 at 40 min of PEF, corresponding to 27%, 78% and 64% of the initial Cl content in solution (29.5 mg L-1). The slow accumulation of Cl− in AO-H2O2 confirms the slow reaction of chloro-organics with BDD(•OH), whereas its much faster release in EF and PEF corroborates the quick destruction of these pollutants with •OH. The gradual destruction of this ion during electrolysis can be explained by its slow oxidation to Cl2 on BDD [37]. The influence of current density and clofibric acid concentration on the oxidizing ability of the EF and PEF processes was explored. Fig. 4a evidences that when j

E. Brillas et al. / Portugaliae Electrochimica Acta 26 (2008) 15-46
28
increases from 33 to 150 mA cm-2, the specific charge for total mineralization (QTM) of 179 mg L-1 of clofibric acid rises from 12 to 22 A h L-1, decreasing the time needed for overall mineralization (tTM) from 12 to 5 h. This enhancement of the degradation rate can be explained by the greater production of BDD(•OH) from reaction (1) and of •OH from Fenton’s reaction (8) because more H2O2 is generated (see Fig. 2). However, the increase in (QTM) when j rises suggests that larger proportions of reactive BDD(•OH) and •OH are progressively wasted by their non-oxidizing reactions, involving for example, the anodic oxidation of BDD(•OH) to O2 and reactions (10)-(13) and (16) for
•OH. Moreover, increasing j can accelerate the formation of weaker oxidants as peroxodisulfate, ozone and chlorine that also reduce the relative proportion of BDD(•OH). Figure 4b shows that at 100 mA cm-2 overall mineralization is achieved with decreasing consumption of 24 A h L-1 (8 h), 21 A h L-1 (7 h), 18 A h L-1 (6 h) and 12 A h L-1 (4 h) starting from 557 (close to saturation), 358, 179 and 89 mg L-1 of the metabolite, respectively, as expected if lower amounts of organic matter are destroyed in solution. In addition, more TOC is removed with rising initial pollutant content. For example, at 2 h of electrolysis (Q = 6 A h L-1) the TOC of the above solutions is reduced by 231, 150, 70 and 39 mg L-1, respectively. This indicates that the non-oxidizing reactions of BDD(•OH) and •OH occur in less proportion with rising metabolite content, favoring their reaction with organics. All these findings allow establishing that the oxidation power of EAOPs increases with increasing current density and initial pollutant concentration.
Mineralization of indigo carmine in the electrolytic cell
The degradation of indigo carmine was initially studied by AO in a BDD/steel cell under electrolysis of a 220 mg L-1 dye solution (equivalent to 100 mg L-1 TOC) of pH 3.0 at different current densities [51]. Fig. 5a evidences a more rapid TOC reduction with increasing j and hence, tTM drops from 600 min at 33 mA cm-2 to 300 min at 150 mA cm-2, although QTM raises from 10 to 22.5 A h L-1. As explained above, the faster TOC removal with increasing current density can be ascribed to the concomitant greater production of BDD(•OH) from reaction (1), whereas the simultaneous increase in QTM is indicative of a slower relative proportion of •OH produced at the BDD anode due to the quicker generation of O2 and other weaker oxidants (S2O8
2−, H2O2 and O3). Anodic oxidation also showed great effectiveness to destroy high indigo carmine contents up to 0.9 g L-1. An increase in tTM from 240 min (12 A h L-1) to 660 min (33 A h L-1) can be seen in Fig. 5b when concentration varies from 110 to 880 mg L-1, as expected by the presence of more pollutants. Nevertheless, the rate of TOC removal with time increases with rising indigo carmine concentration up to 441 mg L-1. This trend can be related to the transport of more organics to the anode causing their faster reaction with greater amounts of BDD(OH), thus decreasing the loss of this radical by non-oxidizing reactions. The above results confirm that AO with BDD is a useful technique for the overall destruction of indigo carmine, with greater oxidation ability with raising current density and dye concentration. Analysis of treated solutions revealed the final conversion of all initial nitrogen of indigo carmine into 75.4 % of NH4
+ and 24.6

E. Brillas et al. / Portugaliae Electrochimica Acta 26 (2008) 15-46
29
% of NO3−, indicating that NH4
+ is the inorganic ion produced in larger extent during the mineralization process.
Figure 6. Variation of TOC with specific charge for the degradation of 100 mL of a 220 mg L-1 indigo carmine solution in 0.05 M Na2SO4 of pH 3.0 at 33 mA cm-2 and at 35.0 ºC using a Pt/O2 or BDD/O2 cell [70]. (a) EF with Pt and 1.0 mM Fe2+, (b) PEF with Pt and 1.0 mM Fe2+, (c) EF with BDD and 1.0 mM Fe2+, (d) PEF with Pt and 1.0 mM Fe2+ + 0.25 mM Cu2+. The oxidation ability of different indirect electrooxidation treatments using the Pt/O2 and BDD/O2 cells was further tested by electrolyzing the same indigo carmine solution of pH 3.0 at 33 mA cm-2 and at 35.0 ºC for 9 h [70]. Fig. 6 shows that the use of EF with Pt and 1.0 mM Fe2+ as catalyst (curve a) causes a fast degradation for 3 h (Q = 3 A h L-1) up to attain 46% of mineralization, but at longer time decontamination becomes so slow that TOC is only reduced by 49% at 9 h (Q = 9 A h L-1). Since in this method organics are mainly destroyed by reaction with Pt(•OH) formed at the Pt surface from reaction (1) and •OH formed in the medium from reaction (8), the low mineralization obtained can be ascribed to the formation of by-products that can not be oxidized with these radicals, which are mainly complexes of Fe(III) with final carboxylic acids. When the solution is irradiated with UVA light (see curve b of Fig. 6), the degradation rate of contaminants is accelerated and TOC is already reduced by 84% at 9 h, as expected if some Fe(III) complexes are photodecomposed under the action of UVA light [79]. The low effectiveness of PEF with Pt can be due to the existence of other by-products that can not be photolyzed and for this reason, we attempt to improve the degradation rate of the dye using the BDD/O2 cell and adding Cu
2+ as co-catalyst. The positive action of BDD in the EF process of indigo carmine can be observed in curve c of Fig. 6, giving rise to a quicker TOC destruction than that of PEF with Pt (see curve b of Fig. 6). In EF with BDD, 91% of TOC is removed at 9 h and complete mineralization is reached at 13 h. That means that complexes of Fe(III) with final carboxylic acids are then efficiently oxidized with BDD(•OH), as also found in the case of clofibric acid.
E. Brillas et al. / Portugaliae Electrochimica Acta 26 (2008) 15-46
30
The dye solution was finally degraded by PEF with Pt after addition of 1.0 mM Fe2+ and 0.25 mM Cu2+. Curve d of Fig. 6 shows that the combined use of both ions causes a very rapid destruction of all pollutants, attaining total mineralization at 7 h (QTM = 7 A h l
-1). This synergetic effect is due to the fast destruction of complexes of Cu(II) with final carboxylic acids, as will be discussed below. Under these conditions, greater production of •OH in the medium could also take place from the Cu2+/Cu+ catalytic system [84,85], involving the reduction of Cu2+ to Cu+ with HO2
• by reaction (17), followed by regeneration of Cu2+ by oxidation of Cu+ with H2O2 from the Fenton-like reaction (18).
Cu2+ + HO2• → Cu+ + H+ + O2 (17)
Cu+ + H2O2 → Cu2+ + •OH + OH− (18)
These results allow concluding that indigo carmine can be completely mineralized using the EF process with a BDD anode and Fe2+, as well as the PEF process with a Pt anode in the presence of both, Fe2+ and Cu2+ as co-catalysts. Note that treated solutions contained a NH4
+ concentration of 17.5 mg L-1 (95% of initial nitrogen) after 9 h of EF with BDD and 17.9 mg L-1 (98% of initial nitrogen) after 7 h of PEF with Pt and 1.0 mM Fe2+ + 0.25 mM Cu2+. A quite small NO3
− content is slowly accumulated in the same electrolyzed solutions, reaching a final value of 1.7 mg L-1 (3% of initial nitrogen) and 0.5 mg L-1 (1% of initial nitrogen), respectively. These results indicate that the major part of nitrogen of indigo carmine is converted into NH4
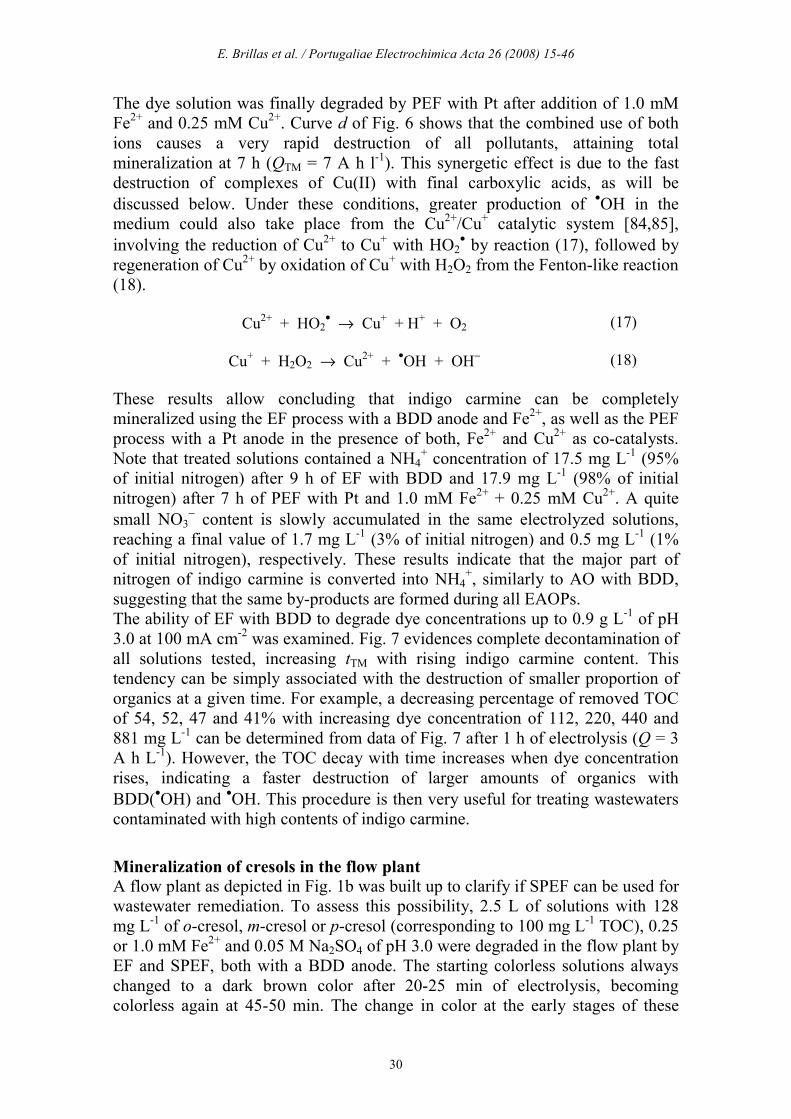
+, similarly to AO with BDD, suggesting that the same by-products are formed during all EAOPs. The ability of EF with BDD to degrade dye concentrations up to 0.9 g L-1 of pH 3.0 at 100 mA cm-2 was examined. Fig. 7 evidences complete decontamination of all solutions tested, increasing tTM with rising indigo carmine content. This tendency can be simply associated with the destruction of smaller proportion of organics at a given time. For example, a decreasing percentage of removed TOC of 54, 52, 47 and 41% with increasing dye concentration of 112, 220, 440 and 881 mg L-1 can be determined from data of Fig. 7 after 1 h of electrolysis (Q = 3 A h L-1). However, the TOC decay with time increases when dye concentration rises, indicating a faster destruction of larger amounts of organics with BDD(•OH) and •OH. This procedure is then very useful for treating wastewaters contaminated with high contents of indigo carmine.
Mineralization of cresols in the flow plant
A flow plant as depicted in Fig. 1b was built up to clarify if SPEF can be used for wastewater remediation. To assess this possibility, 2.5 L of solutions with 128 mg L-1 of o-cresol, m-cresol or p-cresol (corresponding to 100 mg L-1 TOC), 0.25 or 1.0 mM Fe2+ and 0.05 M Na2SO4 of pH 3.0 were degraded in the flow plant by EF and SPEF, both with a BDD anode. The starting colorless solutions always changed to a dark brown color after 20-25 min of electrolysis, becoming colorless again at 45-50 min. The change in color at the early stages of these
E. Brillas et al. / Portugaliae Electrochimica Acta 26 (2008) 15-46
31
treatments can be related to the generation of highly conjugated polyaromatic by-products, which are quickly destroyed with BDD(•OH) produced by reaction (1) and •OH formed from reactions (8) and/or (14).
Figure 7. Dependence of TOC on specific charge for 100 mL of solutions with () 881 mg L-1, () 440 mg L-1, () 220 mg L-1, () 112 mg L-1 indigo carmine and 1.0 mM Fe2+ of pH 3.0 by EF with BDD at 100 mA cm-2 and at 35.0 ºC [70].
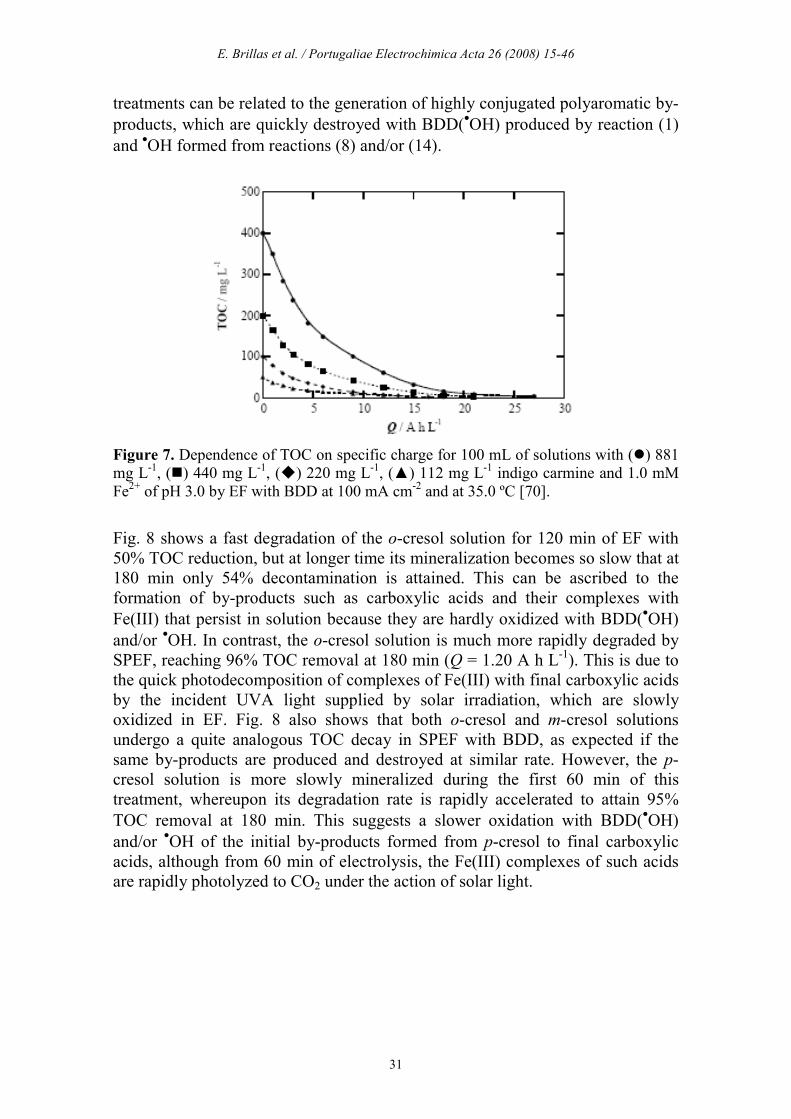
Fig. 8 shows a fast degradation of the o-cresol solution for 120 min of EF with 50% TOC reduction, but at longer time its mineralization becomes so slow that at 180 min only 54% decontamination is attained. This can be ascribed to the formation of by-products such as carboxylic acids and their complexes with Fe(III) that persist in solution because they are hardly oxidized with BDD(•OH) and/or •OH. In contrast, the o-cresol solution is much more rapidly degraded by SPEF, reaching 96% TOC removal at 180 min (Q = 1.20 A h L-1). This is due to the quick photodecomposition of complexes of Fe(III) with final carboxylic acids by the incident UVA light supplied by solar irradiation, which are slowly oxidized in EF. Fig. 8 also shows that both o-cresol and m-cresol solutions undergo a quite analogous TOC decay in SPEF with BDD, as expected if the same by-products are produced and destroyed at similar rate. However, the p-cresol solution is more slowly mineralized during the first 60 min of this treatment, whereupon its degradation rate is rapidly accelerated to attain 95% TOC removal at 180 min. This suggests a slower oxidation with BDD(•OH) and/or •OH of the initial by-products formed from p-cresol to final carboxylic acids, although from 60 min of electrolysis, the Fe(III) complexes of such acids are rapidly photolyzed to CO2 under the action of solar light.
E. Brillas et al. / Portugaliae Electrochimica Acta 26 (2008) 15-46
32
Figure 8. Comparative TOC abatement with specific charge for the degradation of 2.5 L of solutions containing 128 mg L-1 of cresols and 0.25 mM Fe2+ in 0.05 M Na2SO4 of pH 3.0, at 50 mA cm-2, 30 ºC and liquid flow rate of 180 L h-1 [71]. () EF with BDD of o-cresol. SPEF with BDD of () o-cresol, () m-cresol, () p-cresol.
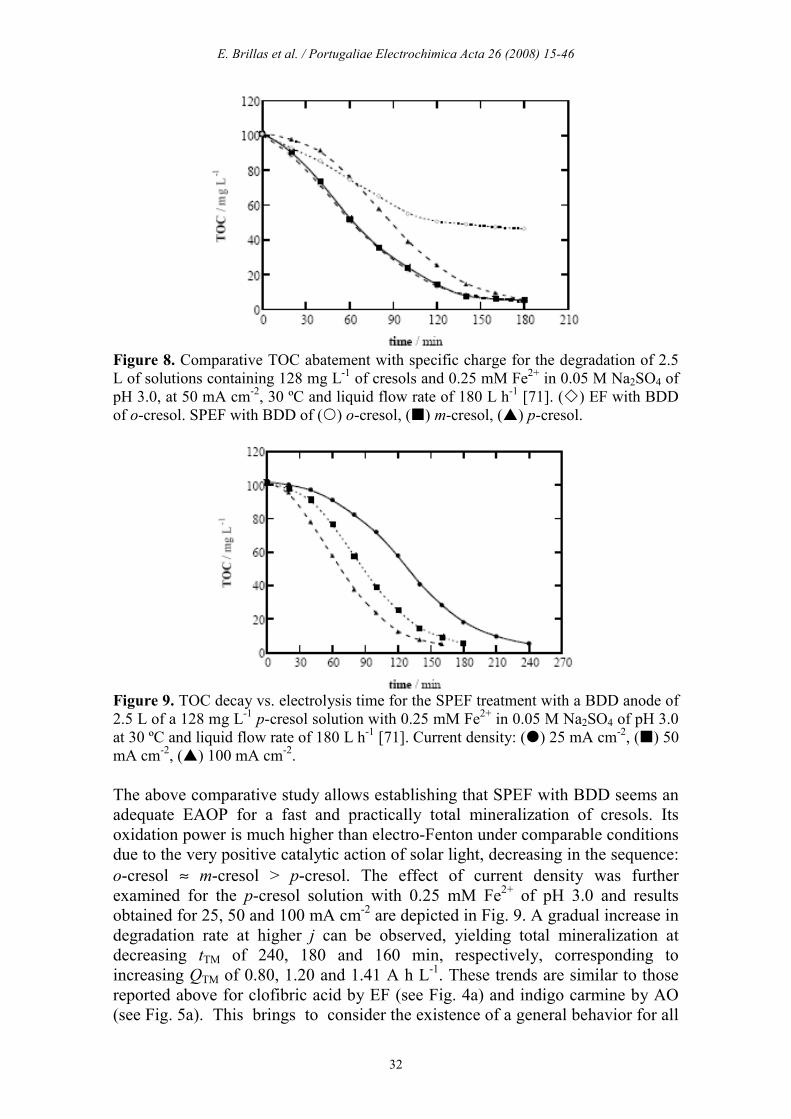
Figure 9. TOC decay vs. electrolysis time for the SPEF treatment with a BDD anode of 2.5 L of a 128 mg L-1 p-cresol solution with 0.25 mM Fe2+ in 0.05 M Na2SO4 of pH 3.0 at 30 ºC and liquid flow rate of 180 L h-1 [71]. Current density: () 25 mA cm-2, () 50 mA cm-2, () 100 mA cm-2. The above comparative study allows establishing that SPEF with BDD seems an adequate EAOP for a fast and practically total mineralization of cresols. Its oxidation power is much higher than electro-Fenton under comparable conditions due to the very positive catalytic action of solar light, decreasing in the sequence: o-cresol ≈ m-cresol > p-cresol. The effect of current density was further examined for the p-cresol solution with 0.25 mM Fe2+ of pH 3.0 and results obtained for 25, 50 and 100 mA cm-2 are depicted in Fig. 9. A gradual increase in degradation rate at higher j can be observed, yielding total mineralization at decreasing tTM of 240, 180 and 160 min, respectively, corresponding to increasing QTM of 0.80, 1.20 and 1.41 A h L
-1. These trends are similar to those reported above for clofibric acid by EF (see Fig. 4a) and indigo carmine by AO (see Fig. 5a). This brings to consider the existence of a general behavior for all
E. Brillas et al. / Portugaliae Electrochimica Acta 26 (2008) 15-46
33
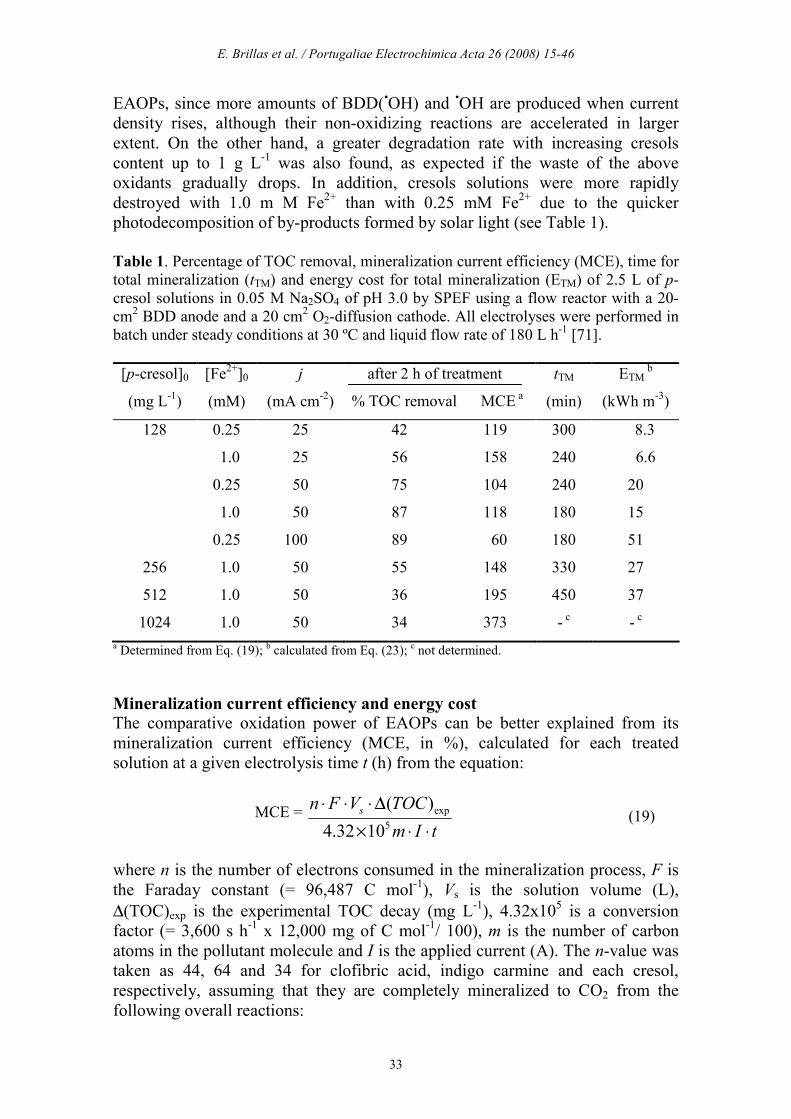
EAOPs, since more amounts of BDD(•OH) and •OH are produced when current density rises, although their non-oxidizing reactions are accelerated in larger extent. On the other hand, a greater degradation rate with increasing cresols content up to 1 g L-1 was also found, as expected if the waste of the above oxidants gradually drops. In addition, cresols solutions were more rapidly destroyed with 1.0 m M Fe2+ than with 0.25 mM Fe2+ due to the quicker photodecomposition of by-products formed by solar light (see Table 1). Table 1. Percentage of TOC removal, mineralization current efficiency (MCE), time for total mineralization (tTM) and energy cost for total mineralization (ETM) of 2.5 L of p-cresol solutions in 0.05 M Na2SO4 of pH 3.0 by SPEF using a flow reactor with a 20-cm2 BDD anode and a 20 cm2 O2-diffusion cathode. All electrolyses were performed in batch under steady conditions at 30 ºC and liquid flow rate of 180 L h-1 [71]. [p-cresol]0
(mg L-1)
[Fe2+]0
(mM)
j
(mA cm-2)
after 2 h of treatment
% TOC removal MCE a
tTM
(min)
ETM b
(kWh m-3)
128
256
512
1024
0.25
1.0
0.25
1.0
0.25
1.0
1.0
1.0
25
25
50
50
100
50
50
50
42 119
56 158
75 104
87 118
89 60
55 148
36 195
34 373
300
240
240
180
180
330
450
- c
8.3
6.6
20
15
51
27
37
- c a Determined from Eq. (19); b calculated from Eq. (23); c not determined.
Mineralization current efficiency and energy cost The comparative oxidation power of EAOPs can be better explained from its mineralization current efficiency (MCE, in %), calculated for each treated solution at a given electrolysis time t (h) from the equation:
MCE = exp
5
( )
4.32 10s
n F V TOC
m I t
⋅ ⋅ ⋅ ∆
× ⋅ ⋅
(19)
where n is the number of electrons consumed in the mineralization process, F is the Faraday constant (= 96,487 C mol-1), Vs is the solution volume (L), ∆(TOC)exp is the experimental TOC decay (mg L-1), 4.32x10⁵ is a conversion factor (= 3,600 s h-1 x 12,000 mg of C mol-1/ 100), m is the number of carbon atoms in the pollutant molecule and I is the applied current (A). The n-value was taken as 44, 64 and 34 for clofibric acid, indigo carmine and each cresol, respectively, assuming that they are completely mineralized to CO2 from the following overall reactions:

E. Brillas et al. / Portugaliae Electrochimica Acta 26 (2008) 15-46
34
C10H11ClO3 + 17 H2O → 10 CO2 + Cl
− + 45 H+ + 44 e− (20) C16H8N2O8S2
2- + 32 H2O → 16 CO2 + 2 NH4+ + 2 SO4
2− + 64 H+ + 64 e− (21)
C7H8O + 13 H2O → 7 CO2 + 34 H+ + 34 e− (22)
Selected MCE values thus obtained for the different EAOPs of pollutants tested in a BDD/O2 cell are given in Fig. 10 and Table 1. An inspection of these data reveals that the efficiency increases with increasing the oxidation power of the method following the sequence: AO ≈ AO-H2O2 < EF < PEF. Thus, Fig. 10a shows that the two less potent anodic oxidation processes for clofibric acid possess a similar, small and practically constant MCE value of about 7%, suggesting that most organics are mineralized at the same rate by BDD(•OH) along electrolysis without significant influence of UVA light. In contrast, this parameter attains a much higher value for EF and PEF, although the latter procedure with the highest oxidation power is the most efficient because of the parallel photodecomposition of final by-products. Note that an efficiency of 33% and 35% is found after 20 min of these treatments, respectively, corroborating that organics are more quickly destroyed with •OH than with BDD(•OH). At longer time, the efficiency drops due to the generation of complexes of Fe(III) with final carboxylic acids that are more difficultly mineralized by both oxidants and/or UVA light. The effect of the initial pollutant content on efficiency is exemplified in Fig. 10b for the EF treatment of indigo carmine with 1.0 mM Fe2+ at 100 mA cm-2. A rapid increase in MCE at the beginning of most experiments can be observed, suggesting the quick destruction of products that are more easily oxidizable than clofibric acid. In contrast, the dramatic fall in efficiency at long electrolysis times can be related to the gradual formation of less oxidizable by-products, as stated above. Fig. 10b also shows a higher MCE value when more dye is present in solution, as expected if competitive non-oxidizing reactions of BDD(•OH) and/or •OH become slower and higher concentration of such radicals can react with more pollutants. The highest efficiency found for 881 mg L-1 of the dye is 53% at 40 min (Q = 2 A h L-1). Table 1 illustrates that SPEF degradation of p-cresol with 1.0 mM Fe2+ at 50 mA cm-2 is much more efficient at high pollutant content. After 2 h of electrolysis, MCE increases from 118 to 373% when its concentration rises from 128 to 1024 mg L-1. That means that UVA light supplied by solar irradiation photodecomposes so rapidly the complexes of Fe(III) with final carboxylic acids that enhances strongly the degradation rate and efficiency. A significant effect on efficiency was also found with varying j. As exemplified in Fig. 10c for the SPEF degradation of 128 mg L-1 of p-cresol with 0.25 mM Fe2+, the efficiency increases gradually as current density diminishes, reaching maximum values of 65%, 103% and 151% for 100, 50 and 25 mA cm-2, respectively. The concomitant loss in efficiency under these conditions can be ascribed again to the waste of BDD(•OH) and •OH in faster parallel non-oxidizing reactions giving rise to smaller relative amounts of them with ability to

E. Brillas et al. / Portugaliae Electrochimica Acta 26 (2008) 15-46
35
destroy organics and hence, favoring the consumption of more ineffective specific charge. Note that all curves of Fig. 10c show a large enhancement of MCE at the early stages of electrolysis, as expected if greater amounts of easily degradable products are gradually transformed into CO2, whereas at long times the efficiency progressively drops due to the more difficult destruction of final carboxylic acids.
Figure 10. Mineralization current efficiency calculated from Eq. (19) for the experiments reported in: (a) Fig. 3a, (b) Fig. 7, (c) Fig. 9. On the other hand, the energy cost for total mineralization (ETM, in kWh m-3) of p-cresol solutions at time tTM (h) was determined as follows:
E. Brillas et al. / Portugaliae Electrochimica Acta 26 (2008) 15-46
36
ETM = TM
s
V I t
V
⋅ ⋅ (23)
where V is the average cell voltage (V). Table 1 summarizes the ETM values thus obtained under selected conditions. As can be seen, ETM increases with increasing Fe2+ content from 0.25 to 1.0 mM due to the faster action of solar light to photolyze Fe(III) complexes. Table 1 also evidences an increase in energy cost with rising initial pollutant concentration because longer tTM is needed for greater contents of p-cresol. This parameter decreases strongly as less current density is applied due to the concomitant drop in cell voltage and the gradual increase in MCE. The lowest ETM value of 6.6 kWh m-3 is found when treating a 128 mg L-1 p-cresol solution with 1.0 mM Fe2+ at 25 mA cm-2 (see Table 1). These results confirm the high efficiency and low energy cost required for the degradation of cresols by SPEF, which can then be a useful technique for industrial application.
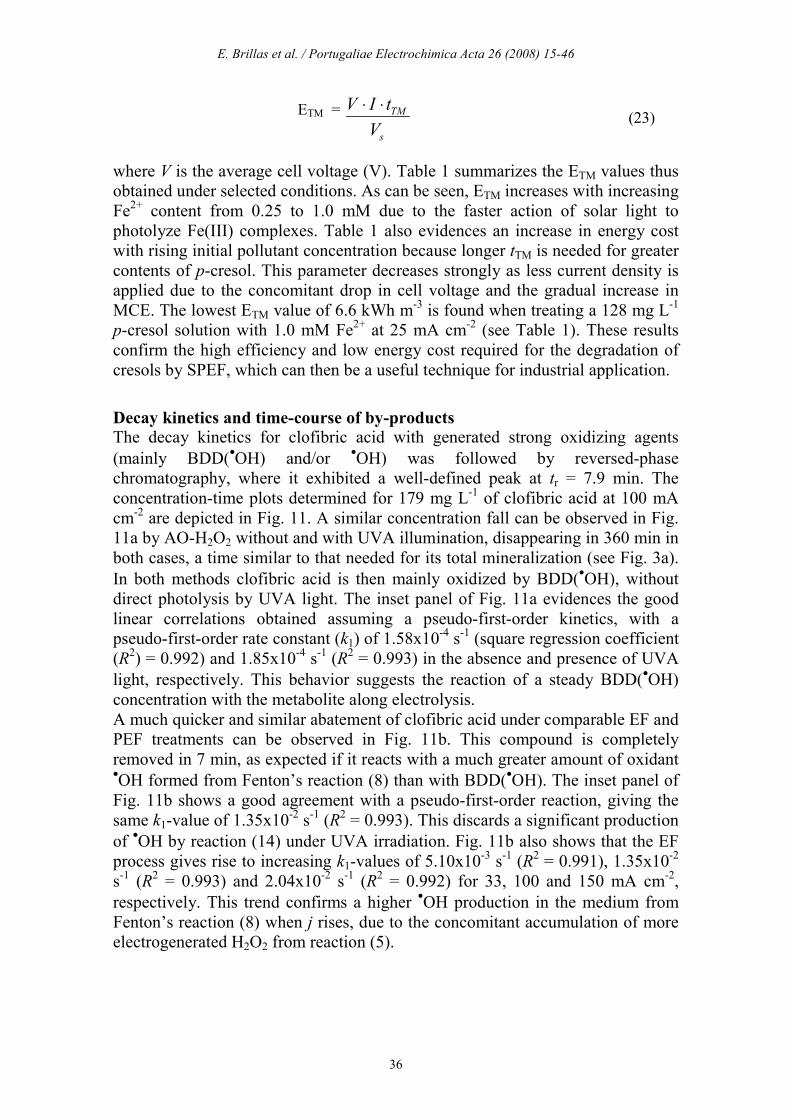
Decay kinetics and time-course of by-products The decay kinetics for clofibric acid with generated strong oxidizing agents (mainly BDD(•OH) and/or •OH) was followed by reversed-phase chromatography, where it exhibited a well-defined peak at tr = 7.9 min. The concentration-time plots determined for 179 mg L-1 of clofibric acid at 100 mA cm-2 are depicted in Fig. 11. A similar concentration fall can be observed in Fig. 11a by AO-H2O2 without and with UVA illumination, disappearing in 360 min in both cases, a time similar to that needed for its total mineralization (see Fig. 3a). In both methods clofibric acid is then mainly oxidized by BDD(•OH), without direct photolysis by UVA light. The inset panel of Fig. 11a evidences the good linear correlations obtained assuming a pseudo-first-order kinetics, with a pseudo-first-order rate constant (k1) of 1.58x10
-4 s-1 (square regression coefficient (R2) = 0.992) and 1.85x10⁻⁴ s-1 (R2 = 0.993) in the absence and presence of UVA light, respectively. This behavior suggests the reaction of a steady BDD(•OH) concentration with the metabolite along electrolysis. A much quicker and similar abatement of clofibric acid under comparable EF and PEF treatments can be observed in Fig. 11b. This compound is completely removed in 7 min, as expected if it reacts with a much greater amount of oxidant •OH formed from Fenton’s reaction (8) than with BDD(•OH). The inset panel of Fig. 11b shows a good agreement with a pseudo-first-order reaction, giving the same k1-value of 1.35x10
-2 s-1 (R2 = 0.993). This discards a significant production of •OH by reaction (14) under UVA irradiation. Fig. 11b also shows that the EF process gives rise to increasing k1-values of 5.10x10
-3 s-1 (R2 = 0.991), 1.35x10⁻² s-1 (R2 = 0.993) and 2.04x10⁻² s-1 (R2 = 0.992) for 33, 100 and 150 mA cm-2, respectively. This trend confirms a higher •OH production in the medium from Fenton’s reaction (8) when j rises, due to the concomitant accumulation of more electrogenerated H2O2 from reaction (5).
E. Brillas et al. / Portugaliae Electrochimica Acta 26 (2008) 15-46
37
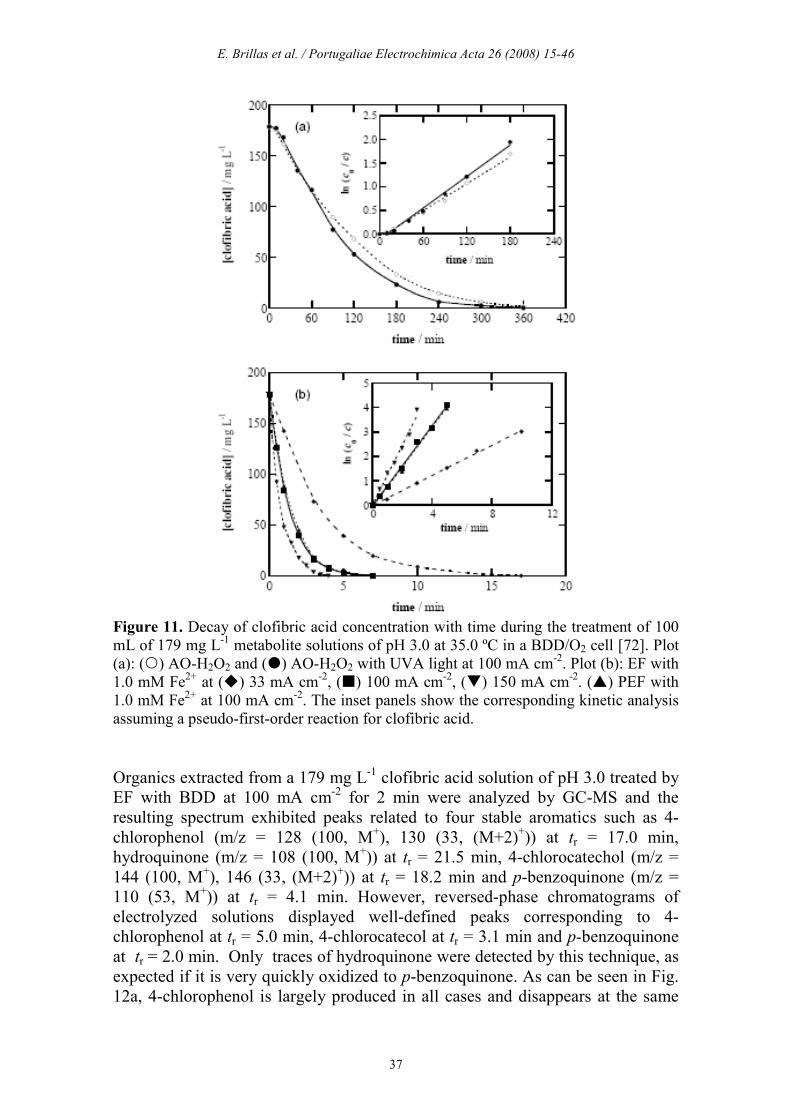
Figure 11. Decay of clofibric acid concentration with time during the treatment of 100 mL of 179 mg L-1 metabolite solutions of pH 3.0 at 35.0 ºC in a BDD/O2 cell [72]. Plot (a): () AO-H2O2 and () AO-H2O2 with UVA light at 100 mA cm-2. Plot (b): EF with 1.0 mM Fe2+ at () 33 mA cm-2, () 100 mA cm-2, () 150 mA cm-2. () PEF with 1.0 mM Fe2+ at 100 mA cm-2. The inset panels show the corresponding kinetic analysis assuming a pseudo-first-order reaction for clofibric acid. Organics extracted from a 179 mg L-1 clofibric acid solution of pH 3.0 treated by EF with BDD at 100 mA cm-2 for 2 min were analyzed by GC-MS and the resulting spectrum exhibited peaks related to four stable aromatics such as 4-chlorophenol (m/z = 128 (100, M+), 130 (33, (M+2)+)) at tr = 17.0 min, hydroquinone (m/z = 108 (100, M+)) at tr = 21.5 min, 4-chlorocatechol (m/z = 144 (100, M+), 146 (33, (M+2)+)) at tr = 18.2 min and p-benzoquinone (m/z = 110 (53, M+)) at tr = 4.1 min. However, reversed-phase chromatograms of electrolyzed solutions displayed well-defined peaks corresponding to 4-chlorophenol at tr = 5.0 min, 4-chlorocatecol at tr = 3.1 min and p-benzoquinone at tr = 2.0 min. Only traces of hydroquinone were detected by this technique, as expected if it is very quickly oxidized to p-benzoquinone. As can be seen in Fig. 12a, 4-chlorophenol is largely produced in all cases and disappears at the same

E. Brillas et al. / Portugaliae Electrochimica Acta 26 (2008) 15-46
38
time as the initial pollutant. However, Fig. 12b evidences that 4-chlorocatechol is accumulated in much smaller extent in EF and PEF, disappearing in 7 min. The same removal time is found for p-benzoquinone in such treatments, although it persists for 60 and 360 min in the lower potent methods of AO-H2O2 with and without UVA irradiation, respectively (see Fig. 12c).
Figure 12. Time-course of the concentration of selected intermediates during the mineralization of solutions reported in Fig. 11. Plots correspond to: (a) 4-chlorophenol, (b) 4-chlorocatechol, (c) p-benzoquinone, (d) oxalic acid. Method: () AO-H2O2, () AO with UVA light, () EF, () PEF. Ion-exclusion chromatograms of solutions treated by the two AO-H2O2 methods showed peaks associated with small contents of carboxylic acids such as 2-hydroxyisobutyric at tr = 12.6 min, tartronic at tr = 7.7 min, maleic at tr = 8.1 min, fumaric at tr = 16.1 min, formic at tr = 14.0 min and oxalic at tr = 6.6 min. Note that 2-hydroxyisobutyric acid is expected to be released when 4-chlorophenol is formed, whereas the other acids come from the oxidation of the aryl moiety of aromatics [31]. The ultimate by-product, oxalic acid, was accumulated in large extent in EF and PEF and persisted up to the end of their mineralization processes. The time-course of oxalic acid concentration during all treatments is depicted in Fig. 12d. In both AO-H2O2 methods this acid is formed and destroyed at similar rate, reaching 5-6 mg L-1 as maximum at 180 min and disappearing in 360 min, just when the initial compound is totally removed (see Fig. 11a) and the solution is totally mineralized (see Fig. 3a). Clofibric acid and most of its by-products are then simultaneously destroyed at similar rate with BDD(•OH) in these processes, as expected from the steady MCE value determined for them

E. Brillas et al. / Portugaliae Electrochimica Acta 26 (2008) 15-46
39
(see Fig. 10a). In contrast, oxalic acid reaches high contents of 68 and 59 mg L-1 at 40 min of EF and PEF, respectively, due to the very quick oxidation of precedent organics with •OH formed from Fenton’s reaction (8). It is completely removed in 240 min by PEF, just when the solution is totally decontaminated (see Fig. 3a), still remaining about 6 mg L-1 (less than 1.5 mg L-1 TOC) after 360 min of EF. Since oxalic acid forms Fe(III)-oxalate complexes in large extent that can not be oxidized by •OH in the medium [31], these species are slowly mineralized in EF with BDD(•OH) and even more quickly photodecomposed by UVA irradiation in PEF.
Figure 13. Evolution of the concentration of: (a) indigo carmine, (b) isatin 5-sulfonic acid, (c) oxalic acid, (d) oxamic acid during the degradation of a 220 mg L-1 dye solution under the conditions given in Fig. 6. Method: () EF with Pt and 1.0 mM Fe2+, () PEF with Pt and 1.0 mM Fe2+; () EF with BDD and 1.0 mM Fe2+, () PEF with Pt and 1.0 mM Fe2+ + 0.25 mM Cu2+. The kinetics for the reaction between indigo carmine and hydroxyl radicals was comparatively studied in the treatments of 220 mg L-1 dye solutions of pH 3.0 at 33 mA cm-2 under the EF and PEF conditions given in Fig. 6. Fig. 13a shows that indigo carmine disappears very rapidly in 4-5 min, following a pseudo zero-order reaction in all cases that suggests a complex attack of OH on different bonds of this compound. The little influence on the destruction rate of the dye using a much more oxidizing BDD anode than Pt, as well as Cu2+ as co-catalyst, corroborates its main reaction with OH generated from Fenton’s reaction (8) and the low production of this radical from the Cu2+/Cu+ system via reactions (17) and (18).

E. Brillas et al. / Portugaliae Electrochimica Acta 26 (2008) 15-46
40
GC-MS analysis of the derivatized components of the dye solution degraded by EF with Pt and 1.0 mM Fe2+ for 2 min only allowed the identification of the trimethylsilyl compound of isatin (m/z = 219 (15, M+)) at tr = 12.8 min. Ionic compounds such as indigo carmine and its sulfonic products can not be detected by this technique. In contrast, reversed-phase HPLC chromatograms of all treated solutions by AO, EF and PEF exhibited the peaks of isatin 5-sulfonic acid (tr = 5.3 min), isatin (tr = 10.7 min) and indigo (tr = 20.8 min). Note that isatin 5-sulfonic acid has been reported for the degradation of indigo carmine with the H2O2/UV system [21], whereas indigo has been found using TiO2/UV [7]. Fig. 13b shows a similar evolution of isatin-5-sulfonic acid for all EF and PEF methods tested, since it is quickly and largely accumulated up to 75-86 mg L-1 at 4 min and further, it is rapidly destroyed to disappear in 8-10 min. That means that it is also quickly destroyed by OH. Only traces (< 0.1 mg L-1) of indigo and isatin were found in all cases, indicating that they are formed in a secondary pathway. Final carboxylic acid were identified after esterification of the remaining components of a 220 mg L-1 dye solution of pH 3.0 electrolyzed by EF with Pt and 1.0 mM Fe2+ at 33 mA cm-2 and 35.0 ºC for 4 h. The MS spectrum exhibited two peaks related to diethyl oxalate (m/z = 146 (1, M+)) at tr = 9.1 min and ethyl oxamate (m/z = 117 (1, M+)) at tr = 17.4 min. Ion-exclusion chromatograms of all degraded solutions also displayed well-defined peaks associated with oxalic (tr = 6.7 min) and oxamic (tr = 9.4 min) acids. Oxamic acid could be formed from the heterocyclic ring opening of isatin 5-sulfonic acid and isatin, followed by oxidation of their CO-CO-NH groups. Fig. 13c and 13b show that the evolution of oxalic and oxamic acids depends on the catalysts used. For EF with Pt and 1.0 mM Fe2+, both acids are accumulated for 120 min and attain a steady concentration of 89 and 50 mg L-1, respectively, corresponding to 37 mg L-1 TOC, a value lower than 51 mg L-1 found for the remaining solution (see curve a of Fig. 6). Under these conditions, Fe(III)-oxalate and Fe(III)-oxamate complexes can not be oxidized with OH and are largely accumulated as predominant species. For PEF with Pt and 1.0 mM Fe2+, Fig. 13c shows a slow accumulation of oxalic acid to 10 mg L-1 at 300 min and its complete disappearance at 480 min due to the photodecomposition of its Fe(III) complexes [79]. In contrast, Fig. 13d evidences that Fe(III)-oxamate complexes are not photolyzed, although it only reaches 27 mg L-1 as maximum, a value lower than 50 mg L-1 found in the absence of UVA light. These results suggest the existence of parallel degradation ways of intermediates under UVA irradiation accelerating their mineralization and inhibiting the formation of oxamic acid. In EF with BDD and 1.0 mM Fe2+, Fe(III)-oxalate and Fe (III)-oxamate complexes are slowly destroyed up to total mineralization at 13 h (see curve c of Fig. 6), as expected if both complexes are destroyed with BDD(OH). A faster and total removal of both acids at ca. 420 min can be seen in Figs. 13c and 13d for PEF with Pt and 1.0 mM Fe2+ + 0.25 mM Cu2+, i. e., at the same time as the electrolyzed solution is completely decontaminated (see curve d of Fig. 6). Since complexes of Fe(III) and Cu(II) with oxalic and oxamic acids are competitively formed and Fe(III)-oxamate complexes remain stable, as stated

E. Brillas et al. / Portugaliae Electrochimica Acta 26 (2008) 15-46
41
above, one can conclude that Fe(III)-oxalate complexes are photodecarboxylated by UVA light, whereas Cu(II)-oxalate and Cu(II)-oxamate complexes are mineralized in parallel by OH because Pt(OH) has much lower oxidation ability. Finally, it was confirmed that overall mineralization of pure oxamic acid by EF with BDD leads to the release of NH4
+, along with a quite small amount of NO3
−.
Proposed reaction sequences
The initial reaction sequence for clofibric acid degradation is proposed in Fig. 14a, which considers all aromatic by-products detected for EAOPs with BDD. The process is initiated by the breaking of the C(1)-O bond of this compound by BDD(•OH) and/or •OH to give 4-chlorophenol and 2-hydroxyisobutyric acid as primary products. Further attack of both oxidants on the C(4)-position of 4-chlorophenol yields hydroquinone, with loss of Cl−, which is then oxidized to p-benzoquinone. Parallel hydroxylation of 4-chlorophenol only by attack of •OH on its C(2)-position leads to 4-chlorocatechol. The subsequent oxidation of the latter product, with release of Cl−, and p-benzoquinone cause the opening of their benzenic rings giving rise to carboxylic acids.
Figure 14. Proposed reaction sequence for the initial degradation of (a) clofibric acid and (b) indigo carmine by EAOPs with BDD. Fig. 14b shows the scheme proposed for the initial degradation of indigo carmine by the different EAOPs with BDD. The initial attack of BDD(•OH) and/or •OH at

E. Brillas et al. / Portugaliae Electrochimica Acta 26 (2008) 15-46
42
the C(1) and C(1’) positions of the dye, with breaking its C=C bond, produces isatin 5-sulfonic acid as the main aromatic product. Parallel oxidation of both sulfonic groups of indigo carmine gives indigo with loss of two SO4
2− ions, which is subsequently converted into isatin. Further destruction of isatin 5-sulfonic acid, with release of SO4
2−, and isatin leads to final carboxylic acids.
Figure 15. Proposed pathways for the mineralization of (a) oxalic acid and (b) oxamic acid by EAOPs with BDD. From results of Figs. 12d and 13c, the mineralization pathway of Fig. 15a is proposed for oxalic acid. This acid is oxidized to CO2 with BDD(
••••OH), either directly in AO-H2O2 treatments or as Fe(III)-oxalate complexes in EF. The latter complexes also undergo a parallel and fast photodecarboxylation under the action of UVA light in PEF, with regeneration of Fe2+ as proposed by Zuo and Hoigné [79]. In the presence of Cu2+, Cu(II)-oxalate complexes competitively formed are efficiently oxidized with ••••OH. A similar path is proposed in Fig. 15b for oxamic acid produced during indigo carmine degradation. This sequence differs from that of oxalic acid by the fact that Fe(III)-oxamate complexes can only be oxidized by BDD(•OH), but not photolyzed. The mineralization of oxamic acid mainly gives NH4
+, along with NO3− in much smaller proportion.

E. Brillas et al. / Portugaliae Electrochimica Acta 26 (2008) 15-46
43
Final remarks It has been demonstrated that EAOPs with BDD are powerful electrochemical methods with ability to completely mineralize aromatic pharmaceuticals and dyes. They are environmentally friendly methods because their main oxidants are BDD(•OH) and/or •OH and they can be applied with low salt contents in the effluent. Anodic oxidation with BDD is very effective in the absence and presence of electrogenerated H2O2 since organics are effectively destroyed by BDD(•OH). Aromatic pollutants are more rapidly destroyed in electro-Fenton because they mainly react with •OH formed from Fenton’s reaction. In contrast, complexes of Fe(III) with final carboxylic acids such as oxalic and oxamic can only be oxidized with BDD(•OH). Photoelectro-Fenton is the most efficient method due to the parallel photodecarboxylation of Fe(III)-oxalate complexes with UVA light. However, when oxamic acid is formed, its Fe(III) complexes can not be photolyzed. The use of Cu2+ as co-catalyst under these conditions enhances the degradation rate due to the quick destruction of Cu(II)-oxalate and Cu(II)-oxamate complexes by •OH. Solar photoelectro-Fenton can be a useful technique for the treatment of industrial wastewaters due to its high efficiency and low operational cost.
References 1. C.G. Daughton, T.L. Jones-Lepp (Eds.), Pharmaceuticals and personal care
products in the environment. Scientific and regulatory issues, ACS Symposium Series, Washington, 2001.
2. K. Kümmerer (Ed.), Pharmaceuticals in the environment. Sources, fate and
risks, Springer, Berlin, 2001. 3. T. Heberer, Toxicol. Lett. 131 (2002) 5. 4 R. Andreozzi, R. Marotta, P. Nicklas, Chemosphere 50 (2003) 1319. 5. N. Nakada, T. Tanishima, H. Shinohara, K. Kiri, H. Takada, Water Res. 40
(2006) 3297. 6. A.I. Balcioglu, M. Ötker, Chemosphere 50 (2003) 85. 7. M. Vautier, C. Guillard, J.M. Hermann, J. Cat. 201 (2001) 46. 8. A.H. Gemeay, I.A. Mansour, R.G. El-Sharkawy, A.B. Zaki, J. Mol. Cat. A:
Chem. 193 (2003) 109. 9. M.A. Sanromán, M. Pazos, M.T. Ricart, C. Cameselle, Chemosphere 57
(2004) 233. 10. A. Fernandes, A. Morao, M. Magrinho, A. Lopes, I. Goncalves, Dyes
Pigments 61 (2004) 287. 11. E. Brillas, M.A. Oturan, Procédé électro-Fenton: développements récents et
applications à l'élimination des pesticides en milieux aqueux, in: M.A. Oturan, J.M. Mouchel (Eds.), Pesticides: Impacts environmentaux, gestion
et traitements, Presses de l'École Nationale des Ponts et Chaussées, Paris, 2007, pp. 61-73.
12. A. Tauxe-Wuersch, L.F. De Alencastro, D. Grandjean, J. Tarradellas, Water
Res. 39 (2005) 1761. 13. J.P. Emblidge, M.E. DeLorenzo, Environ. Res. 100 (2006) 216.

E. Brillas et al. / Portugaliae Electrochimica Acta 26 (2008) 15-46
44
14. C. Tixier, H.P. Singer, S. Oellers, S.R. Müller, Environ. Sci. Technol. 37 (2003) 1061.
15. T.A. Ternes, M. Meisenheimer, D. McDowell, F. Sacher, H.J. Brauch, B. Haist-Gulde, G. Preuss, U. Wilme, N. Zulei-Seibert, Environ. Sci. Technol. 36 (2002) 3855.
16. R. Andreozzi, V. Caprio, R. Marotta, A. Radovnikovic, J. Hazard. Mat. B103 (2003) 233.
17 J.L. Packer, J.J. Werner, D.E. Latch, K. McNeill, W.A. Arnold, Aq. Sci. 65 (2003) 342.
18. T. Doll, F.H. Frimmel, Water Res. 38 (2004) 955. 19. Z. Ruo-bing, W. Yan, L. Guofeng, Plasma Sources Sci. Technol. 14 (2005)
308. 20. J.A. Kettle, B.M. Clark, C.C. Winterbourn, J. Biol. Chem. 279 (2004)
18521. 21. C. Galindo, P. Jacques, A. Kalt, J. Photochem. Photobiol. A: Chem. 141
(2001) 47. 22 B.H. Rao, S.R. Asolekar, Water Res. 35 (2001) 3391. 23 V. Kavitha, K. Palanivelu, Water Res. 39 (2005) 3062. 24 K.H. Wang, Y.H. Hsieh, L.J. Chen, J. Hazard. Mater. 59 (1998) 251. 25 G. Sivalingam, M.H. Priya, G. Madras, Appl. Catal. B: Environ. 51 (2004)
67. 26 A. Hatipoğlu, N. San, Z. Çinar, J. Photochem. Photobiol. A: Chem. 165
(2004) 119. 27 D. Rajkumar, K. Palanivelu, Ind. Eng. Chem. Res. 42 (2003) 1833. 28 J.L. Nava, F. Núñez, I. González, Electrochim. Acta 52 (2007) 3229. 29. B. Marselli, J. García-Gomez, P.A. Michaud, M.A. Rodrigo, Ch.
Comninellis, J. Electrochem. Soc. 150 (2003) D79. 30. M. Panizza, G. Cerisola, Electrochim. Acta 51 (2005) 191. 31. E. Brillas, C. Arias, P.L. Cabot, F. Centellas, J.A. Garrido, R.M. Rodríguez,
Port. Electrochim. Acta 24 (2006) 159. 32. D. Gandini, E. Mahé, P.A. Michaud, W. Haenni, A. Perret, Ch.
Comninellis, J. Appl. Electrochem. 30 (2000) 1345. 33. M.A. Rodrigo, P.A. Michaud, I. Duo, M. Panizza, G. Cerisola, Ch.
Comninellis, J. Electrochem. Soc. 148 (2001) D60. 34. J. Iniesta, P.A. Michaud, M. Panizza, G. Cerisola, A. Aldaz, Ch.
Comninellis, Electrochim. Acta 46 (2001) 3573. 35. F. Montilla, P.A. Michaud, E. Morallon, J.L. Vazquez, Ch. Comninellis,
Electrochim. Acta 47 (2002) 3509. 36. B. Boye, P.A. Michaud, B. Marselli, M.M. Dieng, E. Brillas, Ch.
Comninellis, New Diamond Frontier Carbon Technol. 12 (2002) 63. 37. A. Kraft, M. Stadelmann, M. Blaschke, J. Hazard. Mat. 103 (2003) 247. 38. S. Hattori, M. Doi, E. Takahashi, T. Kurosu, M. Nara, S. Nakamatsu, Y.
Nishiki, T. Furuta, M. Iida, J. Appl. Electrochem. 33 (2003) 85. 39. P. Cañizares, J. García-Gómez, C. Sáez, M.A. Rodrigo, Ind. Eng. Chem.
Res. 42 (2003) 956.

E. Brillas et al. / Portugaliae Electrochimica Acta 26 (2008) 15-46
45
40. E. Brillas, B. Boye, I. Sirés, J.A. Garrido, R.M. Rodríguez, C. Arias, P.L. Cabot, Ch. Comninellis, Electrochim. Acta 49 (2004) 4487.
41. M. Panizza, G. Cerisola, Electrochim. Acta 49 (2004) 3221. 42. P. Cañizares, C. Sáez, J. Lobato, M.A. Rodrigo, Ind. Eng. Chem. Res. 43
(2004) 1944. 43. C.A. Martinez-Huitle, S. Ferro, A. De Battisti, Electrochim. Acta 49 (2004)
4027. 44. P. Cañizares, J. Lobato, R. Paz, M.A. Rodrigo, C. Sáez, Water Res. 39
(2005) 2687. 45. B. Nasr, G. Abdellatif, P. Cañizares, C. Sáez, J. Lobato, M.A. Rodrigo,
Environ. Sci. Technol. 39 (2005) 7234. 46. E. Brillas, I. Sirés, C. Arias, P.L. Cabot, F. Centellas, R.M. Rodríguez, J.A.
Garrido, Chemosphere 58 (2005) 399. 47. C. Flox, J.A. Garrido, R.M. Rodríguez, F. Centellas, P.L. Cabot, C. Arias,
E. Brillas, Electrochim. Acta 50 (2005) 3685. 48. X. Chen, G. Chen, Sep. Purif. Technol. 48 (2006) 45. 49. C. Flox, P.L. Cabot, F. Centellas, J.A. Garrido, R.M. Rodríguez, C. Arias,
E. Brillas, Chemosphere 64 (2006) 892. 50 B. Boye, E. Brillas, B. Marselli, P.A. Michaud, Ch. Comninellis, G. Farnia,
G. Sandonà, Electrochim. Acta 51 (2006) 2872. 51. S. Ammar, R. Abdelhedi, C. Flox, C. Arias, E. Brillas, Environ. Chem. Lett.
4 (2006) 229. 52. M.A. Oturan, J. Appl. Electrochem. 30 (2000) 475. 53. M.A. Oturan, N. Oturan, C. Lahitte, S. Trevin, J. Electroanal. Chem. 507
(2001) 96. 54. B. Gözmen, M.A. Oturan, N. Oturan, O. Erbatur, Environ. Sci. Technol. 37
(2003) 3716. 55. E. Guivarch, N. Oturan, M.A. Oturan, Environ. Chem. Lett. 1 (2003)165. 56. G. Kaichouh, N. Oturan, M.A. Oturan, K. El Kacemi, A. El Hourch,
Environ. Chem. Lett. 2 (2004) 31. 57. K. Hanna, S. Chiron, M.A. Oturan, Water Res. 39 (2005) 2763. 58.. A. Wang, J. Qu, J. Ru, H. Liu, J. Ge, Dyes Pigments 65 (2005) 227. 59. S. Irmak, H.I. Yavuz, O. Erbatur, Appl. Catal. B: Environ. 63 (2006) 243. 60. N. Bellakhal, M.A. Oturan, N. Oturan, M. Dachraoui, Environ. Chem. 3
(2006) 345. 61. M. Dieng, N. Oturan, M. Oturan, Chemosphere 66 (2007) 841. 62. I. Sirés, J.A. Garrido, R.M. Rodríguez, E. Brillas, N. Oturan, M.A. Oturan,
Appl. Catal. B: Environ. 72 (2007) 382. 63. E. Brillas, J.C. Calpe, J. Casado, Water Res. 34 (2000) 2253. 64. E. Brillas, J. Casado, Chemosphere 47 (2002) 241. 65. B. Boye, M.M. Dieng, E. Brillas, Environ. Sci. Technol. 36 (2002) 3030. 66. E. Brillas, B. Boye, M.M. Dieng, J. Electrochem. Soc. 150 (2003) E583. 67. B. Boye, M.M. Dieng, E. Brillas, J. Electroanal. Chem. 557 (2003) 135. 68. E. Brillas, M.A. Baños, S. Camps, C. Arias, P.L. Cabot, J.A. Garrido, R.M.
Rodríguez, New J. Chem. 28 (2004) 314.

E. Brillas et al. / Portugaliae Electrochimica Acta 26 (2008) 15-46
46
69. A. Da Pozzo, C. Merli, I. Sirés, J.A. Garrido, R.M. Rodríguez, E. Brillas, Environ. Chem. Lett. 3 (2005) 7.
70. C. Flox, S. Ammar, C. Arias, E. Brillas, A.V. Vargas-Zavala, R. Abdelhedi, Appl. Catal. B: Environ. 67 (2006) 93.
71. C. Flox, P.L. Cabot, F. Centellas, J.A. Garrido, R.M. Rodríguez, C. Arias, E. Brillas, Appl. Catal. B: Environ. 75 (2007) 17.
72. I. Sirés, F. Centellas, J.A. Garrido, R.M. Rodríguez, C. Arias, P.L. Cabot, E. Brillas, Appl. Catal. B: Environ. 72 (2007) 373.
73. C. Flox, J.A. Garrido, R.M. Rodríguez, P.L. Cabot, F. Centellas, C. Arias, E. Brillas, Catal. Today in press.
74. J.J. Pignatello, Environ. Sci. Technol. 2 (1992) 944. 75. Y. Sun, J.J. Pignatello, Environ. Sci. Technol. 27 (1993) 304. 76. Y. Sun, J.J. Pignatello, J. Agric. Food Chem. 41 (1993) 308. 77. J. De Laat, H. Gallard, Environ. Sci. Technol. 33 (1999) 2726. 78. J.D. Rush, B.H.J. Bielski, J. Phys. Chem. 89 (1985) 5062. 79. Y. Zuo, J. Hoigné, Environ. Sci. Technol. 26 (1992) 1014. 80. F.J. Welcher (Ed.), Standard Methods of Chemical Analysis, R.E. Krieger
Pub. Co., Huntington, New York, 1975, Vol. 2 (Part B), 6th ed., p. 1827. 81. N.H. Furman (Ed.), Standard Methods of Chemical Analysis, R.E. Krieger
Pub. Co., Huntington, New York, 1975, Vol. 1, 6th ed., p. 553. 82. E.B. Sandell, in: B.L. Clarke, P.J. Elving, I.M. Kolthoff (Eds.), Chemical
Analysis, Interscience Publishers, Inc., New York, 1959, Vol. III, 3rd ed., p.522.
83. G.U. Buxton, C.L. Greenstock, W.P. Helman, A.B. Ross, J. Phys. Chem.
Data Ref. 17 (1988) 513. 84. H. Gallard, J. De Laat, B. Legube, Rev. Sci. Eau 12 (1999) 715. 85. J. De Laat, H. Gallard, Environ. Sci. Technol. 33 (1999) 2726.