Embed Size (px)
Citation preview
International Conference on Solid Waste 2011 Moving Towards Sustainable Resource Management
Waste Recycling in Developing
Countries
186 Proceedings of the International Conference on Solid Waste 2011- Moving Towards Sustainable Resource Management,
Hong Kong SAR, P.R. China, 2 – 6 May 2011
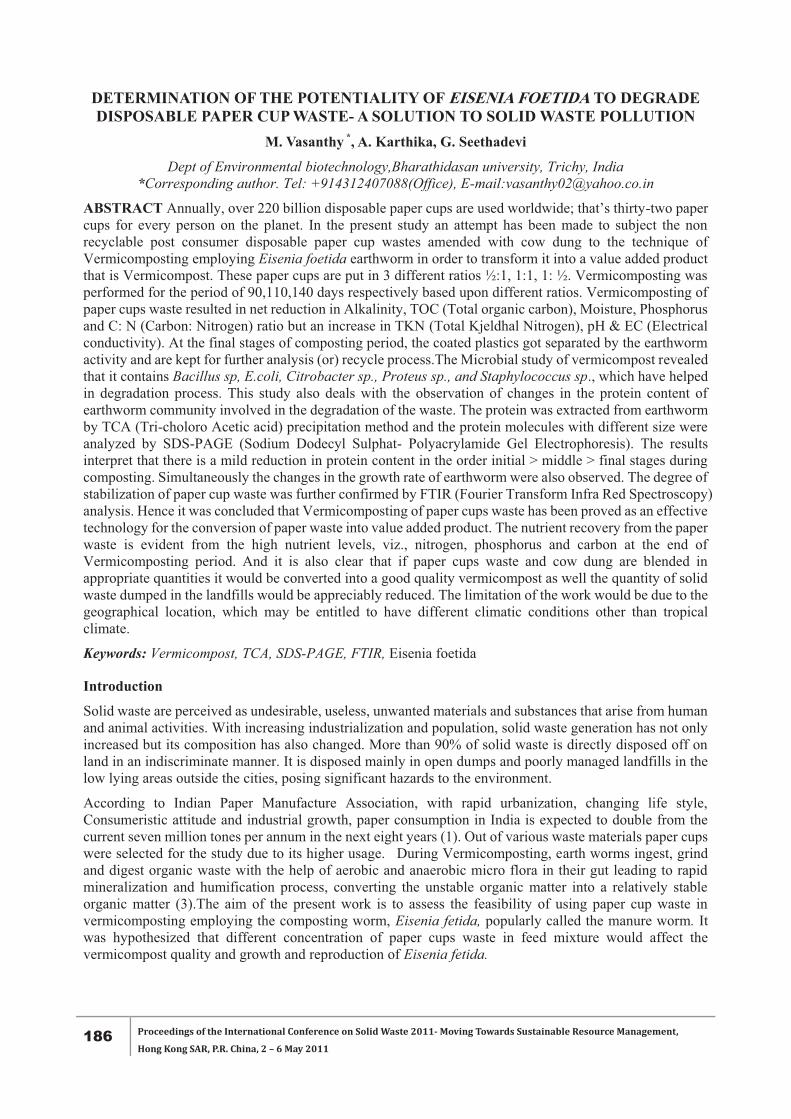
DETERMINATION OF THE POTENTIALITY OF EISENIA FOETIDA TO DEGRADE DISPOSABLE PAPER CUP WASTE- A SOLUTION TO SOLID WASTE POLLUTION
M. Vasanthy *, A. Karthika, G. Seethadevi
Dept of Environmental biotechnology,Bharathidasan university, Trichy, India *Corresponding author. Tel: +914312407088(Office), E-mail:[email protected]
ABSTRACT Annually, over 220 billion disposable paper cups are used worldwide; that’s thirty-two paper cups for every person on the planet. In the present study an attempt has been made to subject the non recyclable post consumer disposable paper cup wastes amended with cow dung to the technique of Vermicomposting employing Eisenia foetida earthworm in order to transform it into a value added product that is Vermicompost. These paper cups are put in 3 different ratios ½:1, 1:1, 1: ½. Vermicomposting was performed for the period of 90,110,140 days respectively based upon different ratios. Vermicomposting of paper cups waste resulted in net reduction in Alkalinity, TOC (Total organic carbon), Moisture, Phosphorus and C: N (Carbon: Nitrogen) ratio but an increase in TKN (Total Kjeldhal Nitrogen), pH & EC (Electrical conductivity). At the final stages of composting period, the coated plastics got separated by the earthworm activity and are kept for further analysis (or) recycle process.The Microbial study of vermicompost revealed that it contains Bacillus sp, E.coli, Citrobacter sp., Proteus sp., and Staphylococcus sp., which have helped in degradation process. This study also deals with the observation of changes in the protein content of earthworm community involved in the degradation of the waste. The protein was extracted from earthworm by TCA (Tri-choloro Acetic acid) precipitation method and the protein molecules with different size were analyzed by SDS-PAGE (Sodium Dodecyl Sulphat- Polyacrylamide Gel Electrophoresis). The results interpret that there is a mild reduction in protein content in the order initial > middle > final stages during composting. Simultaneously the changes in the growth rate of earthworm were also observed. The degree of stabilization of paper cup waste was further confirmed by FTIR (Fourier Transform Infra Red Spectroscopy) analysis. Hence it was concluded that Vermicomposting of paper cups waste has been proved as an effective technology for the conversion of paper waste into value added product. The nutrient recovery from the paper waste is evident from the high nutrient levels, viz., nitrogen, phosphorus and carbon at the end of Vermicomposting period. And it is also clear that if paper cups waste and cow dung are blended in appropriate quantities it would be converted into a good quality vermicompost as well the quantity of solid waste dumped in the landfills would be appreciably reduced. The limitation of the work would be due to the geographical location, which may be entitled to have different climatic conditions other than tropical climate.
Keywords: Vermicompost, TCA, SDS-PAGE, FTIR, Eisenia foetida
Introduction
Solid waste are perceived as undesirable, useless, unwanted materials and substances that arise from human and animal activities. With increasing industrialization and population, solid waste generation has not only increased but its composition has also changed. More than 90% of solid waste is directly disposed off on land in an indiscriminate manner. It is disposed mainly in open dumps and poorly managed landfills in the low lying areas outside the cities, posing significant hazards to the environment.
According to Indian Paper Manufacture Association, with rapid urbanization, changing life style, Consumeristic attitude and industrial growth, paper consumption in India is expected to double from the current seven million tones per annum in the next eight years (1). Out of various waste materials paper cups were selected for the study due to its higher usage. During Vermicomposting, earth worms ingest, grind and digest organic waste with the help of aerobic and anaerobic micro flora in their gut leading to rapid mineralization and humification process, converting the unstable organic matter into a relatively stable organic matter (3).The aim of the present work is to assess the feasibility of using paper cup waste in vermicomposting employing the composting worm, Eisenia fetida, popularly called the manure worm. It was hypothesized that different concentration of paper cups waste in feed mixture would affect the vermicompost quality and growth and reproduction of Eisenia fetida.
Proceedings of the International Conference on Solid Waste 2011- Moving Towards Sustainable Resource Management,
Hong Kong SAR, P.R. China, 2 – 6 May 2011 187
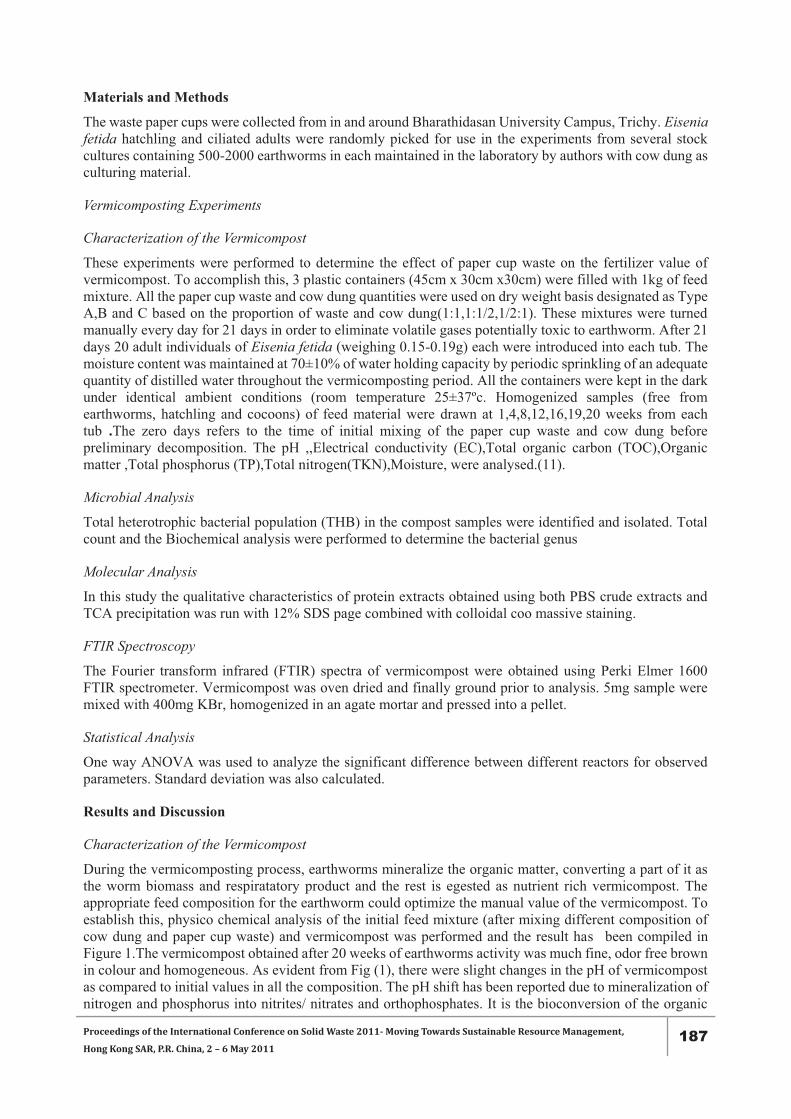
Materials and Methods
The waste paper cups were collected from in and around Bharathidasan University Campus, Trichy. Eisenia fetida hatchling and ciliated adults were randomly picked for use in the experiments from several stock cultures containing 500-2000 earthworms in each maintained in the laboratory by authors with cow dung as culturing material.
Vermicomposting Experiments
Characterization of the Vermicompost
These experiments were performed to determine the effect of paper cup waste on the fertilizer value of vermicompost. To accomplish this, 3 plastic containers (45cm x 30cm x30cm) were filled with 1kg of feed mixture. All the paper cup waste and cow dung quantities were used on dry weight basis designated as Type A,B and C based on the proportion of waste and cow dung(1:1,1:1/2,1/2:1). These mixtures were turned manually every day for 21 days in order to eliminate volatile gases potentially toxic to earthworm. After 21 days 20 adult individuals of Eisenia fetida (weighing 0.15-0.19g) each were introduced into each tub. The moisture content was maintained at 70±10% of water holding capacity by periodic sprinkling of an adequate quantity of distilled water throughout the vermicomposting period. All the containers were kept in the dark under identical ambient conditions (room temperature 25±37ºc. Homogenized samples (free from earthworms, hatchling and cocoons) of feed material were drawn at 1,4,8,12,16,19,20 weeks from each tub .The zero days refers to the time of initial mixing of the paper cup waste and cow dung before preliminary decomposition. The pH ,,Electrical conductivity (EC),Total organic carbon (TOC),Organic matter ,Total phosphorus (TP),Total nitrogen(TKN),Moisture, were analysed.(11).
Microbial Analysis
Total heterotrophic bacterial population (THB) in the compost samples were identified and isolated. Total count and the Biochemical analysis were performed to determine the bacterial genus
Molecular Analysis
In this study the qualitative characteristics of protein extracts obtained using both PBS crude extracts and TCA precipitation was run with 12% SDS page combined with colloidal coo massive staining.
FTIR Spectroscopy
The Fourier transform infrared (FTIR) spectra of vermicompost were obtained using Perki Elmer 1600 FTIR spectrometer. Vermicompost was oven dried and finally ground prior to analysis. 5mg sample were mixed with 400mg KBr, homogenized in an agate mortar and pressed into a pellet.
Statistical Analysis
One way ANOVA was used to analyze the significant difference between different reactors for observed parameters. Standard deviation was also calculated.
Results and Discussion
Characterization of the Vermicompost
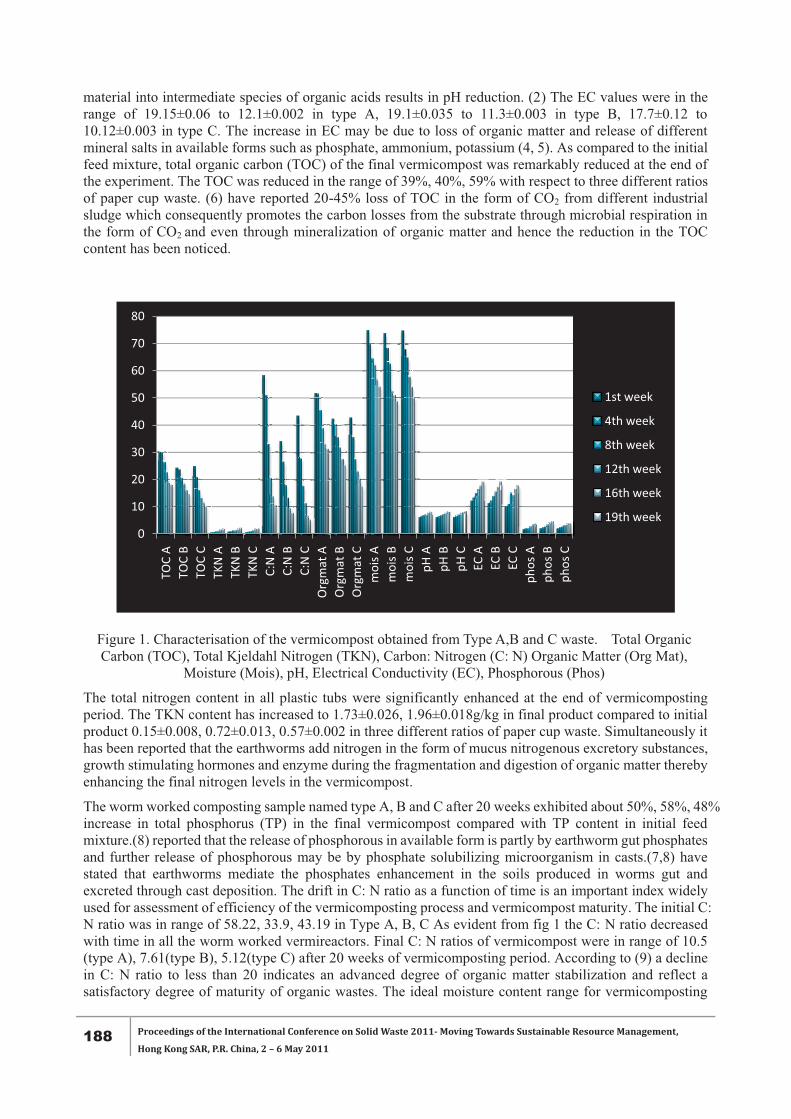
During the vermicomposting process, earthworms mineralize the organic matter, converting a part of it as the worm biomass and respiratatory product and the rest is egested as nutrient rich vermicompost. The appropriate feed composition for the earthworm could optimize the manual value of the vermicompost. To establish this, physico chemical analysis of the initial feed mixture (after mixing different composition of cow dung and paper cup waste) and vermicompost was performed and the result has been compiled in Figure 1.The vermicompost obtained after 20 weeks of earthworms activity was much fine, odor free brown in colour and homogeneous. As evident from Fig (1), there were slight changes in the pH of vermicompost as compared to initial values in all the composition. The pH shift has been reported due to mineralization of nitrogen and phosphorus into nitrites/ nitrates and orthophosphates. It is the bioconversion of the organic
188 Proceedings of the International Conference on Solid Waste 2011- Moving Towards Sustainable Resource Management,
Hong Kong SAR, P.R. China, 2 – 6 May 2011
material into intermediate species of organic acids results in pH reduction. (2) The EC values were in the range of 19.15±0.06 to 12.1±0.002 in type A, 19.1±0.035 to 11.3±0.003 in type B, 17.7±0.12 to 10.12±0.003 in type C. The increase in EC may be due to loss of organic matter and release of different mineral salts in available forms such as phosphate, ammonium, potassium (4, 5). As compared to the initial feed mixture, total organic carbon (TOC) of the final vermicompost was remarkably reduced at the end of the experiment. The TOC was reduced in the range of 39%, 40%, 59% with respect to three different ratios of paper cup waste. (6) have reported 20-45% loss of TOC in the form of CO2 from different industrial sludge which consequently promotes the carbon losses from the substrate through microbial respiration in the form of CO2 and even through mineralization of organic matter and hence the reduction in the TOC content has been noticed.
Figure 1. Characterisation of the vermicompost obtained from Type A,B and C waste. Total Organic Carbon (TOC), Total Kjeldahl Nitrogen (TKN), Carbon: Nitrogen (C: N) Organic Matter (Org Mat),
Moisture (Mois), pH, Electrical Conductivity (EC), Phosphorous (Phos)
The total nitrogen content in all plastic tubs were significantly enhanced at the end of vermicomposting period. The TKN content has increased to 1.73±0.026, 1.96±0.018g/kg in final product compared to initial product 0.15±0.008, 0.72±0.013, 0.57±0.002 in three different ratios of paper cup waste. Simultaneously it has been reported that the earthworms add nitrogen in the form of mucus nitrogenous excretory substances, growth stimulating hormones and enzyme during the fragmentation and digestion of organic matter thereby enhancing the final nitrogen levels in the vermicompost.
The worm worked composting sample named type A, B and C after 20 weeks exhibited about 50%, 58%, 48% increase in total phosphorus (TP) in the final vermicompost compared with TP content in initial feed mixture.(8) reported that the release of phosphorous in available form is partly by earthworm gut phosphates and further release of phosphorous may be by phosphate solubilizing microorganism in casts.(7,8) have stated that earthworms mediate the phosphates enhancement in the soils produced in worms gut and excreted through cast deposition. The drift in C: N ratio as a function of time is an important index widely used for assessment of efficiency of the vermicomposting process and vermicompost maturity. The initial C: N ratio was in range of 58.22, 33.9, 43.19 in Type A, B, C As evident from fig 1 the C: N ratio decreased with time in all the worm worked vermireactors. Final C: N ratios of vermicompost were in range of 10.5 (type A), 7.61(type B), 5.12(type C) after 20 weeks of vermicomposting period. According to (9) a decline in C: N ratio to less than 20 indicates an advanced degree of organic matter stabilization and reflect a satisfactory degree of maturity of organic wastes. The ideal moisture content range for vermicomposting
0
10
20
30
40
50
60
70
80
TOC
ATO
C B
TOC
CTK
N A
TKN
BTK
N C
C:N
AC:
N B
C:N
CO
rgm
at A
Org
mat
BO
rgm
at C
moi
s Am
ois B
moi
s CpH
ApH
BpH
CEC
AEC
BEC
Cph
os A
phos
Bph
os C
1st week
4th week
8th week
12th week
16th week
19th week
Proceedings of the International Conference on Solid Waste 2011- Moving Towards Sustainable Resource Management,
Hong Kong SAR, P.R. China, 2 – 6 May 2011 189
process is reported to be 70-90%. The moisture content of three different ratio of paper cup waste was 70% and it has got gradually reduced to 50% at the end of the process.
Microbial Analysis
Microbial activity is considered to be greatly stimulated by favorable condition (moisture, pH, high concentration of mucus) in the anterior part of the gut in the midgut. This enhanced microbial activity results in the digestion of soil organic matter. The bacterial genus identified in the vermicompost was Shigella, Proteus, Salmonella and Citrobacter.
Molecular Analysis
In this study the qualitative characteristics of protein extract obtained using both PBS crude extract and TCA precipitation was subjected for 12% SDS PAGE. On composting both of the extraction protocols, the TCA extract generated samples of consistently better quality with well resolved bands over a wide range. The molecular size of protein from Eisenia fetida ranged from less than 14.4kDa to more than 116kDa (12) obviously the plastic content from the paper cups may have affected the contents of proteins in different size of Eisenia fetida bodies. There is a significant difference in the band during initial, middle and final stages. As the earthworms from initial and middle stages of TCA precipitate exhibit two bright proteins bands in molecular size between 35kDa to 45kDa which was not found in final stage. This implies the toxic effect of plastic on the protein content of the earthworm subjected for the degradation.
Statistical Analysis
When the calculated F values were compared with the table values, in case of TOC and TOM the calculated F values are higher than the table value so the difference is significant whereas for TKN, C:N, pH, EC, moisture, phosphorus the calculated F values is lower than the table value so, the difference is not significant.
FTIR Spectroscopy
With increasing composting time the significant changes were observed between initial and final FTIR spectroscopy.There was a change in the intensity of peaks at 2923.93cmˉ1 in paper type A, B and C which could be attributed to significant biodegradation of lipids and carbohydrates. In type A the major difference occurs in the peak range 1387-1385 which may be due to CH3 bend symmetry. In type B the major difference occurs in the peak range of 1419 due to CH2 bend scissoring, followed by a change in the range of 1384-1393 and 1042-1094 due to antisymmetrically coupled C-O to C-C stretch. In type C major difference occurs in the peak range of 1040-1055 and 1388-1567 as noticed with type BFurther there was an appreciable increase in the intensity of bands 1040.88 cmˉ1 to 1042.22 cmˉ1 in type C and 1042 to 1094.61 in type B due to C=C in aromatic groups, aromatic ethers and polysaccharides. In the case of type A there was a change in the intensity of peak 1641 cmˉ1 ratios shows that could be attributed to significant biodegradation of alkenes. Further two bands were seen in the region 3888cmˉ1 and 3803cmˉ1 which were not seen in the initial sample in type A. The stretch in this region has been reported N-H groups but the doublet has confirmed the presence of amide containing compound. This confirms the degradation of nitrogenous substances into amide containing compounds. Degradation of CH3and CH2 is considered as an indicator of an increasing degree of organic matter stabilization. (10).Hence during composting the protein, cellulose and hemicelluloses get mineralized.
Conclusions
The higher degree of organic matter stabilization has been achieved when paper cups has been subjected for vermicomposting in different ratio along with cow dung and soil. The C: N ratio TOM, TOC and PO4 content has decreased when compared with the final compost. This study demonstrates the role of earthworms and microorganism during the degradation of paper cups. The SDS PAGE results showed that the significant differences were observed in the band during initial, middle and final stages of composting. The earthworms from initial and middle stages were exhibited two bright protein bands in molecular size between 35kDa to 45kDa which was not found in the final stages. The FTIR analysis clearly confirmed that the higher degradation of lipids, carbohydrates and nitrogenous substances present in the paper waste.
190 Proceedings of the International Conference on Solid Waste 2011- Moving Towards Sustainable Resource Management,
Hong Kong SAR, P.R. China, 2 – 6 May 2011
Hence the present study makes us to conclude that the paper waste could be converted into a manure using earthworms thereby reducing the aesthetic and solid waste pollution.
References �1� Gupta, S et al., 1998. Solid waste management in India: Option and opportunities. Resource Conserv.
Recycle, 24: 137-154 �2� Hogg, D et al., 2002. Comparison of compost standards within the EU, North America and Australia.
The waste and Resources Action Programme (WARP), Oxon. �3� Maboeta, M.S., Van Rnesburg, L. 2003. Vermicomposting of Industrially produced wood chips and
sewage sludge using E.foetida, Ecotoxicol. Environ. Saf, 56: 256-270. �4� Kaviraj., Sharma, S., 2003. Municipal solid waste management through vermicomposting employing
exotic and local species of earthworm. Biores.technol., 90: 169-173. �5� Lasaridi, K., et al. 2006. Quality assessment of compost in the green market the need for standards
and quality assurance, J. Environ. Manage. 80: 58-65 �6� Kaushik, P., Garg, V.K., 2003. Vermicomposting of mixed solid textile mill sludge and cow dung
with epigenic earthworm Eisenia fetida. Bioresource technology, 90: 311- 316. �7� Lebayon, R.C., Binet, F., 2006. Earthworm changes the distribution and availability of phosphorus in
organic substrates. Soil Biol. Biochem. 38: 235-246. �8� Lee, K.E., 1992. Some trends and oppurtunities in earthworm research. Biochem.24, pp. 1765-1771. �9� Senesi, N., 1989. Composted material as organic fertilizer, the sci. Total Environ., 81/82: 521-524. �10� Senesi, N., Brunetti, G., 1996. Chemical and physic chemical parameters for quality evaluation of
humic substances produced during composting in M. De Bertoidi, Sequi P, Lemmes B, Papi T(Eds), The composting, Blackie Academic and Professional Glasgow, UK, pp 195-212.
manures.Fertilizers Development and Consultation Organization,New Delhi.India. th worm Eisenia foetida for 2-DE Sino- German
International program, China Agricultural University, P.R China Dec 1.
Proceedings of the International Conference on Solid Waste 2011- Moving Towards Sustainable Resource Management,
Hong Kong SAR, P.R. China, 2 – 6 May 2011 191
SOLID WASTE RECYCLING STRATEGIES IN SELECTED MUNICIPALITIES OF SOUTHERN LUZON PHILIPPINES
G.V. Pangga
Farming Systems and Soil Resources Institute, University of the Philippines Los Baños College, Laguna, Philippines
Tel: +63 495363229, Fax: +63 495365282, E-mail: [email protected]
ABSTRACT Despite the national and local legislations in intensifying the collective efforts of the local government units to provide solid waste management projects to the entire Laguna Province, the Philippines remains less privileged on employing advanced technology on waste management.
A documentation study was conducted in selected municipalities of Southern Luzon Philippines to investigate the municipal practices in solid waste management. The study was prompted by the fact that the increased population, urbanization and structures on the vicinity of Laguna Lake over the years has resulted in an increase in the quantity of solid waste generated, posing serious problems in the nearby communities; and polluted water in many rivers and canals leading to the lake.
The methodology employed in this study included physical observations and questionnaire surveys that consisted of open-ended and close-ended questions addressing the current status on municipal solid waste disposal in the selected municipalities. The questionnaire was administered to each of the municipalities under studied, and information obtained from the surveys was complemented by interviews with local officials in the relevant departments. Determining the present status of solid waste management and recommending appropriate systems to handle the waste required both data analysis and field study.
Research findings showed that there are success stories in managing municipal wastes that can be attributed to several factors such as strong political leadership, strengthened networking with other stakeholders, and active participation of community members. Another strategy to address the problems of solid waste management is the use of low cost and local technology but with high level of effectiveness. The study also highlighted the different technologies of composting biodegradable wastes and the role of informal settlers in recycling non-biodegradable wastes.
Nevertheless, results also showed that there are still municipalities with poor state of waste management instigated by many interrelated factors such as engineering problem, rapid urbanization, poor financing capacity of local government units, low technical knowledge on planning and management of solid waste, and weak enforcement of environmental regulations.
The study concludes and recommends that compliance to environmental policies with resource recovery and conservation measures should be regularly monitored. The massive information drive on ecological solid waste management would stimulate further interest in composting and in the appreciation of its benefits.
Keywords: Solid waste, Recycling strategy, Composting
192 Proceedings of the International Conference on Solid Waste 2011- Moving Towards Sustainable Resource Management,
Hong Kong SAR, P.R. China, 2 – 6 May 2011
SUSTAINABLE WASTE MANAGEMENT IN MALAYSIA: A FOCUS ON 3R RELATED POLICIES
P. Agamuthu 1, S. Chenayah 2*, F.S. Hamid 1, D. Victor 1 1 Institute of Biological Sciences, Faculty of Science, University of Malaya, 50603 Kuala Lumpur, Malaysia
2 Faculty of Economics and Administration, University of Malaya, 50603 Kuala Lumpur, Malaysia * Corresponding author: Email: [email protected] , Tel: +60379673733
ABSTRACT This study (funded by Ministry of Environment, Japan) is to examine 3R related policies for solid waste management (SWM) in Malaysia and to analyze possible development or impact of national level policy in response to specific challenges in relation to priority policy areas. A review of the main solid waste management policies in Malaysia was done to determine their significance. Consecutively, data collection and interviews involving collation of existing recycling data and 3R awareness surveys were conducted. Compilation of data from the various stakeholders was achieved via a Focus Group Discussion (FGD) and responses through survey. Eventually, 3R gaps between policy and practice were analyzed and some actions to reduce the 3R policy gaps were recommended. As a conclusion, the study indicated that existing 3R policies have gaps which weaken the implementation of 3R activities, thus resulting with failure in 3R program in the country. However, it can be amended with appropriate strategy to remove the existing gaps.
Keywords: 3R policy, Solid waste management, Policy gap, Focus group discussion, Policy formulation
Introduction
The objective of the 3Rs program is to reduce the nation’s generation of solid waste by REDUCE, REUSE and RECYCLE in line with the National Recycling Target of 22% of the total solid waste generated by the year 2020. However, this remains to be seen as the current official rate is only about 5%, although it is estimated to be 10% to 15%. Many players are involved in Malaysian 3Rs programs.
The 3Rs principle was established to improve waste management system towards a more sustainable approach and to reduce human ecological footprint. Many studies around the globe have reported that the implementation of 3Rs managed to boost economic activities, reduce environmental impacts from waste disposal, prevent the loss of resources and lengthen landfills operating life. Though the implementation of 3Rs has been successful in many developed countries, the accomplishment among the developing nation is yet to be seen. Many factors are contributing towards the failure of 3Rs implementation in most developing countries including Malaysia. Among others is the lack of efficient institutional mechanisms for waste management and lack of policy to promote 3Rs.
This study examines 3R related policies for solid waste management (SWM) in Malaysia and analyzes possible developments or impacts of national level policy in response to specific challenges in relation to priority policy areas.
The paper is organized in the following manner. First, we will briefly explain the 3R policy and its implementation in Malaysia. In the next section, we focus on the 3R related policies in Malaysia and the existing gaps. This is followed by analysis of our study. We end with some recommendations in closing the 3R gaps in Malaysia.
3R Related Policies in Malaysia and Policy Gaps
The main 3R related policies in Malaysia are the Action Plan for a Beautiful and Clean Malaysia (ABC) (1988); The National Strategic Plan for Solid Waste Management (NSP)(2005); Master Plan on National Waste Minimization (2006); National Solid Waste Management Policy (2006); Solid Waste and Public Cleansing Management Act (2007).
Many of the Malaysian SWM policies especially those related to 3R activities have been implemented in an informal basis due to a lack of legislative empowerment. However, even though the enactment of the SWM Act in 2007 has provided the legislative framework for SWM it is still powerless because it has not been enforced where it cannot be implemented due to lack of supporting regulations. Furthermore, the initial enforcement of the SWM Act is only expected to be in areas related to SWM facilities and services.
Proceedings of the International Conference on Solid Waste 2011- Moving Towards Sustainable Resource Management,
Hong Kong SAR, P.R. China, 2 – 6 May 2011 193
Consequently one of the potential key policy gaps observed in 3R policies is the delay in the formal adoption and implementation of 3R policies in Malaysia. There is a significant policy gap analysis between theory and practice since without the formal adoption or enforcement of the policies; policy implementation can only be done informally and in an ad-hoc manner by SWM stakeholders. Thus, the key challenge in the Malaysian 3R policy analysis is gap reduction between SWM policy and its implementation either due to stakeholder acceptability of 3R policies or policy implementation obstacles from political interference or policy impracticality due to direct adoption of SWM policy practices from other countries.
Analysis of 3R Policies in Malaysia
Our analysis consisted of obtaining the feedback on the 3R policies and their implementation in Malaysia using interview, questionnaires and focus group discussions. A 3R policy analysis questionnaire was developed.
This was carried out in two phases. The first was a 3R Focus Group Discussion (FGD) with a total of 25 participants from government agencies, local authorities, non-government organizations (NGOs) and private sector organizations attending the 3R FGD. Next, the 3R Questionnaire was administered to 107 local authorities (LA) in Malaysia who was known to practice 3R activities within their jurisdiction. Some of the key areas in the questionnaire are perceptions on existing 3R situation, 3R policies & legislation, 3R awareness & information, 3R infrastructure and facilities, 3R on economic incentives & support and on 3R benefits & key issues.
All the respondents had moderately high awareness on 3R policies enlisted in the previous section. This was prominent among the LA’s. There is a general perception among the Focus Group (FG) and the LA’s that Malaysia can achieve a 22% recycling target by 2020. Both groups agree that the public is ready for solid waste source separation. However, there is a general consensus that recycling is inconvenient.
The 3R FG perception was that existing political will for recycling is not high and that low consciousness for recycling was due to a lack of government efforts. Surprisingly, the LA’s response was identical to that of the FG. Both groups agreed that the residents who refuse to recycle should be punished severely where laws should be stipulated to make recycling mandatory.
From the analysis, it was clear that people were aware of the location of recycling facilities in their area. However accessibility to the facilities seems to be a major problem to the public. Vandalism seems to be a problem too. However, the perception is that recycling awareness among the public is not high and low public concern is the cause for limited recycling. Interestingly 100% of the respondents agreed that awareness creation was important for recycling. Therefore, awareness creation plays an important role in making 3R a success. Awareness creation in the form of education and technical training for staff is also important in making recycling a success.
Some of the factors that can contribute to the success of the 3R are availability of recycling information and sufficient user friendly recycling facilities. The respondents perceive that it was appropriate to pay for better recycling services and that social factors and cost criterion plays an important role in recycling. However the perception was that recycling did not increase the burden of the local authorities and that government funding was also not sufficient. Most LA receive their funds from the Federal Government to finance their recycling activities. Some have their own revenue such as from the tax collection.
Generally, the FG and LA’s agreed that recycling can be increased if government agencies were to use recycled products. About 87% of the respondent agrees that financial incentives can encourage more recycling activities. However, most of the respondents perceived that public participation in recycling should be voluntary.
The analysis highlighted that the main benefit of 3R activities was the highest for pollution prevention, followed by resource conservation, business generation and the last was economic interest. The key area for the successful implementation of 3R activities was the highest for policy and legislation at 48% followed by information and awareness at 35%, economic incentives at 9% and infrastructure and facilities at 7%.
194 Proceedings of the International Conference on Solid Waste 2011- Moving Towards Sustainable Resource Management,
Hong Kong SAR, P.R. China, 2 – 6 May 2011
The 3R respondents had the following feedback on 3R benefits, key issues and potential solutions in general:
i. The SWM Act 2007 should be implemented for the success of 3R including mandatory recycling.
ii. 3R awareness is high but requires commitment, infrastructure for the success of 3R including implementing 3R in the education system and government agencies.
iii. Government should provide more user friendly recycling facilities including recycling bins and buy back centres.
iv. 3R requires economic incentives such as tax reduction for industries implementing 3R and take back systems.
Conclusions
The 3R analysis highlighted some potential areas of 3R policy gaps and 3R policy strategy opportunities. First, 3R policy gaps was in the area of policy formulation and implementation and this is possibly due to a lack of political will for 3R implementation. Next, clearly there were policy gaps in the area of awareness of key 3R policies and this is possibly due to a lack of stakeholder engagement and public participation in the policy formulation process. Another 3R policy gaps was in the area of existing 3R funding from the government for 3R activities and support from the industries and producers. The analysis indicated some 3R policy opportunities in the area of the government’s purchasing policy on recycled products and in the area of legislation for mandatory 3R activities such as recycling and source separation.
Acknowledgements
This paper is based on the Asia Resource Circulation Research Project, an international collaborative research, funded by Ministry of the Environment of Japan (MOEJ) via Institute for Global Environmental Strategies (IGES) as the coordinator of the project. Thanks are due to University of Malaya for infrastructure and further funding.
References �1� Agamuthu. 2010. MSW Management in Malaysia: Changes for Sustainability”, Municipal Solid
Waste Management in Asia and the Pacific Islands, Penerbit ITB, Indonesia, pp 138-144 �2� GOM. 2007. Solid Waste & Public Cleansing Corporation Act, Government of Malaysia. �3� GOM. 2007. Solid Waste & Public Cleansing Management Act, Government of Malaysia. �4� MHLG. 2005. “=National Strategic Plan for Solid Waste Management in Malaysia, Ministry of
Housing & Local Government Malaysia. �5� MHLG. 2006. The National Solid Waste Management Policy, Ministry of Housing and Local
Government. �6� MHLG. 2006. The Study of National Waste Minimization in Malaysia, Ministry of Housing and
Local Government and the Japanese International Cooperation Agency. �7� MHLH. 1998. Action Plan for a Beautiful and Clean Malaysia, Unpublished Document, Ministry of
Housing & Local Government Malaysia.

Proceedings of the International Conference on Solid Waste 2011- Moving Towards Sustainable Resource Management,
Hong Kong SAR, P.R. China, 2 – 6 May 2011 195
SCAVENGING IN LANDFILL: CONTRIBUTIONS TO SUSTAINABLE LANDFILLING IN DEVELOPING COUNTRIES?
C. Meidiana 1,2*, T. Gamse 1 1 Graz University of Technology, Institute for Chemical Process and Environmental Technology,Graz,
Austria 2 Brawijaya University, Faculty of Engineering, Malang, Indonesia
* Corresponding author. Tel: +43 316 873 7477 Fax: +43 316 873 74697, E-mail: [email protected]
ABSTRACT Waste reduction done by the waste pickers has been recorded in Bendo Landfill, Yogyakarta (Indonesia) during 10 days in October 2010. The results showed that the recyclable material from Bendo landfill was plastics, paper, metal and glass. Waste reduction done by waste pickers were about 7.5% and 12.9% for plastics and for paper respectively. Reduction on metal and glass were very small (below 0.01%) because most of them have been sorted by the scavengers before delivering to the landfill. Waste reduction in Bendo Landfill can contribute methane emission reduction. Bendo landfill will be closed in 2012 and the new landfill can be operated as controlled landfill which allows scavenging activity to reduce waste in landfill. Therefore, waste pickers involvement in the new landfill should be accommodated. Some measurements can be implemented for waste sorting optimization such as, time and place management, and workplace safety and health improvement for the scavengers.
Keywords: Solid waste management, Landfill, Waste picker, Waste reduction
Introduction
Municipality of Yogyakarta as waste authority and landfill operator will close the old landfill in 2012 and construct a new landfill. The new landfill should be an environmentally safe final disposal site as required in The Waste Law no. 18/2008. Article 22 defines this clearly by intending the implementation of environmentally friendly technology for final waste treatment, whereas Article 44 intends the requirement of safe landfill practices.
The previous study has suggested that a controlled landfill can be appropriate for the new landfill for some local conditions [1]. In controlled landfill, scavenging activity is allowed and believed as a contribution to waste reduction. However, there are discussions among local decision makers about the involvement of waste pickers in the new future landfill in Yogyakarta. Some believe that reducing the waste by treating it as near as possible to the waste source is more effective than allowing the waste pickers to sort the waste at the landfill. Therefore, this study aims to identify and to analyze the waste pickers involvement in reducing the waste disposed of on landfill. The result can be an input for the local decision makers in determining the policy related to the new landfill in Yogyakarta.
Materials and Methods Surveys for primary and secondary data have been carried out twice. The first survey was conducted in January until March 2010 and the second was in October 2010. Data on municipal solid waste were collected from waste authorities in Yogyakarta to identify the general municipal solid waste including the waste characteristic, the rate of waste generation, waste collection and waste transportation to the landfill. Secondary data on waste were mainly sourced from statistics on waste management in 2004 - 2010, Regency/City Profile, Waste Status Report 2007 – 2010. Survey for primary data was conducted by means of questionnaires to provide more recent data and through interview in order to follow-up the questionnaire answered by the respondents and to get in-depth information related to landfill operation. Questionnaires were distributed to two kinds of respondents. The first respondent represented the stake holders involved in waste management, while the second respondent represented the waste pickers in landfill. The respondents for waste authorities were Municipality and Environmental Board of Yogyakarta. Standard open ended interviews were selected in which the respondents were asked with same open ended questions to get detailed information which is easy to be analyzed and compared. The field survey aimed to examine the declared waste treatment in landfill, to evaluate the performance of existing landfill and to measure the waste reduction done by waste pickers at Bendo landfill.

196 Proceedings of the International Conference on Solid Waste 2011- Moving Towards Sustainable Resource Management,
Hong Kong SAR, P.R. China, 2 – 6 May 2011
Due to the lack of input data, the following major assumptions were made: 1. Currency rate is Rp 9,500 for $1 which is the average value of the predicted exchange rate
of Rupiah from Central Bank ranging between Rp 9000 - Rp 10,000 in 2010 2. Waste density is assumed 400 kg/m3 based on typical domestic waste density in Indonesia
[2]. The assumption is made to convert some waste data from volume units to weight units. 3. Waste generation rate per person is derived from the average amount of total waste
generation and number of population from 2004 – 2008. 4. Waste percentage was kept consistent over the time period. 5. Population growth was the average value over the period and kept consistent for the
prediction.
Results and Discussion
The City of Yogyakarta is situated on the Indonesian island of Java and has population of approximately 460,000 people in 2009 having grown from 398,000 people in 2000. It is comprised of 14 districts and 45 sub-districts covering a total area of 32.5 km2. The population growth in Yogyakarta is approximately 1.7% each year [3]. Meanwhile, the waste generation is increasing approximately 1.8% each year [4,5,6]. Figure 1 shows that the waste generation is increasing proportionally to population growth.
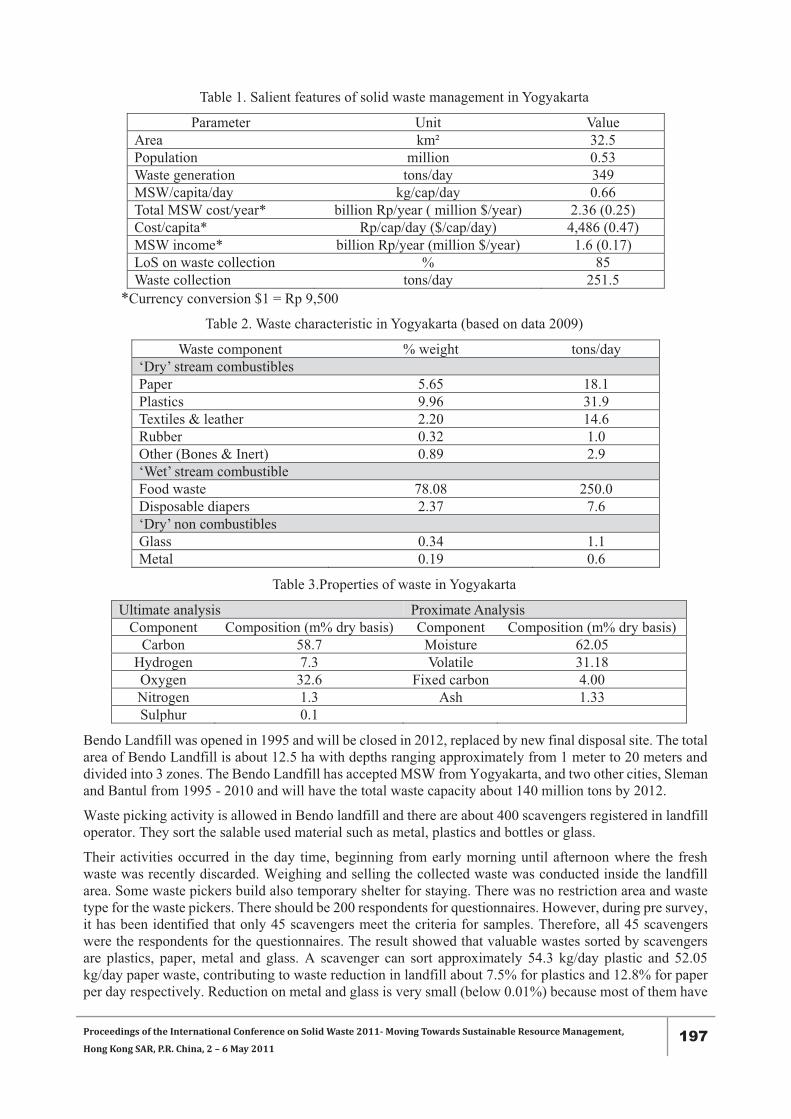
Yogyakarta, like many other cities in Indonesia, suffers from an inability to cope with waste generation and disposal. The national waste law, The Waste Law No. 18/2008 was recently enacted in May 2008 but Yogyakarta have had regional related-waste law some years before 2008. It was The Law No. 22/2002 about community management in Yogyakarta. Still, the low law enforcement caused the ineffectiveness in MSWM. The low waste generation per capita and waste cost per capita characterizes MSWM in Yogyakarta. The waste generation per capita is below 1 kg/cap/day, while the cost for waste management per capita is not more than $1.0/cap/year. Municipal solid waste (MSW) generation in Yogyakarta city is estimated at around 349 ton/day (0.66 kg/capita/day) with the level of Service of (LoS) 85% in 2009. Table 1 shows the salient features of solid waste management in Yogyakarta.
Figure 1. Waste data in Yogyakarta
Most of waste dumped in landfill in Yogyakarta comes from household resulting waste with high organic content about 62 %. This is the nature of typical waste in developing countries which has high organic content (about 70%) and high moisture content (about 50%) [4]. Meanwhile, plastics and paper have the less percentage afterwards followed by other smaller fractions such as glass, metal, textile, rubber, diapers, bone/feathers and inert as described in Table 2. The waste composition influences the waste properties in Yogyakarta as shown in Table 3.
The collected waste is mainly delivered to the landfill and only small fraction of the waste treated using other methods such as recycling and composting. Waste sorting is done before and after waste is dumped in Bendo landfill.
Proceedings of the International Conference on Solid Waste 2011- Moving Towards Sustainable Resource Management,
Hong Kong SAR, P.R. China, 2 – 6 May 2011 197
Table 1. Salient features of solid waste management in Yogyakarta
Parameter Unit Value Area km² 32.5 Population million 0.53 Waste generation tons/day 349 MSW/capita/day kg/cap/day 0.66 Total MSW cost/year* billion Rp/year ( million $/year) 2.36 (0.25) Cost/capita* Rp/cap/day ($/cap/day) 4,486 (0.47) MSW income* billion Rp/year (million $/year) 1.6 (0.17) LoS on waste collection % 85 Waste collection tons/day 251.5
*Currency conversion $1 = Rp 9,500
Table 2. Waste characteristic in Yogyakarta (based on data 2009)
Waste component % weight tons/day ‘Dry’ stream combustibles Paper 5.65 18.1 Plastics 9.96 31.9 Textiles & leather 2.20 14.6 Rubber 0.32 1.0 Other (Bones & Inert) 0.89 2.9 ‘Wet’ stream combustible Food waste 78.08 250.0 Disposable diapers 2.37 7.6 ‘Dry’ non combustibles Glass 0.34 1.1 Metal 0.19 0.6
Table 3.Properties of waste in Yogyakarta
Ultimate analysis Proximate Analysis Component Composition (m% dry basis) Component Composition (m% dry basis)
Carbon 58.7 Moisture 62.05 Hydrogen 7.3 Volatile 31.18 Oxygen 32.6 Fixed carbon 4.00 Nitrogen 1.3 Ash 1.33 Sulphur 0.1
Bendo Landfill was opened in 1995 and will be closed in 2012, replaced by new final disposal site. The total area of Bendo Landfill is about 12.5 ha with depths ranging approximately from 1 meter to 20 meters and divided into 3 zones. The Bendo Landfill has accepted MSW from Yogyakarta, and two other cities, Sleman and Bantul from 1995 - 2010 and will have the total waste capacity about 140 million tons by 2012.
Waste picking activity is allowed in Bendo landfill and there are about 400 scavengers registered in landfill operator. They sort the salable used material such as metal, plastics and bottles or glass.
Their activities occurred in the day time, beginning from early morning until afternoon where the fresh waste was recently discarded. Weighing and selling the collected waste was conducted inside the landfill area. Some waste pickers build also temporary shelter for staying. There was no restriction area and waste type for the waste pickers. There should be 200 respondents for questionnaires. However, during pre survey, it has been identified that only 45 scavengers meet the criteria for samples. Therefore, all 45 scavengers were the respondents for the questionnaires. The result showed that valuable wastes sorted by scavengers are plastics, paper, metal and glass. A scavenger can sort approximately 54.3 kg/day plastic and 52.05 kg/day paper waste, contributing to waste reduction in landfill about 7.5% for plastics and 12.8% for paper per day respectively. Reduction on metal and glass is very small (below 0.01%) because most of them have
198 Proceedings of the International Conference on Solid Waste 2011- Moving Towards Sustainable Resource Management,
Hong Kong SAR, P.R. China, 2 – 6 May 2011
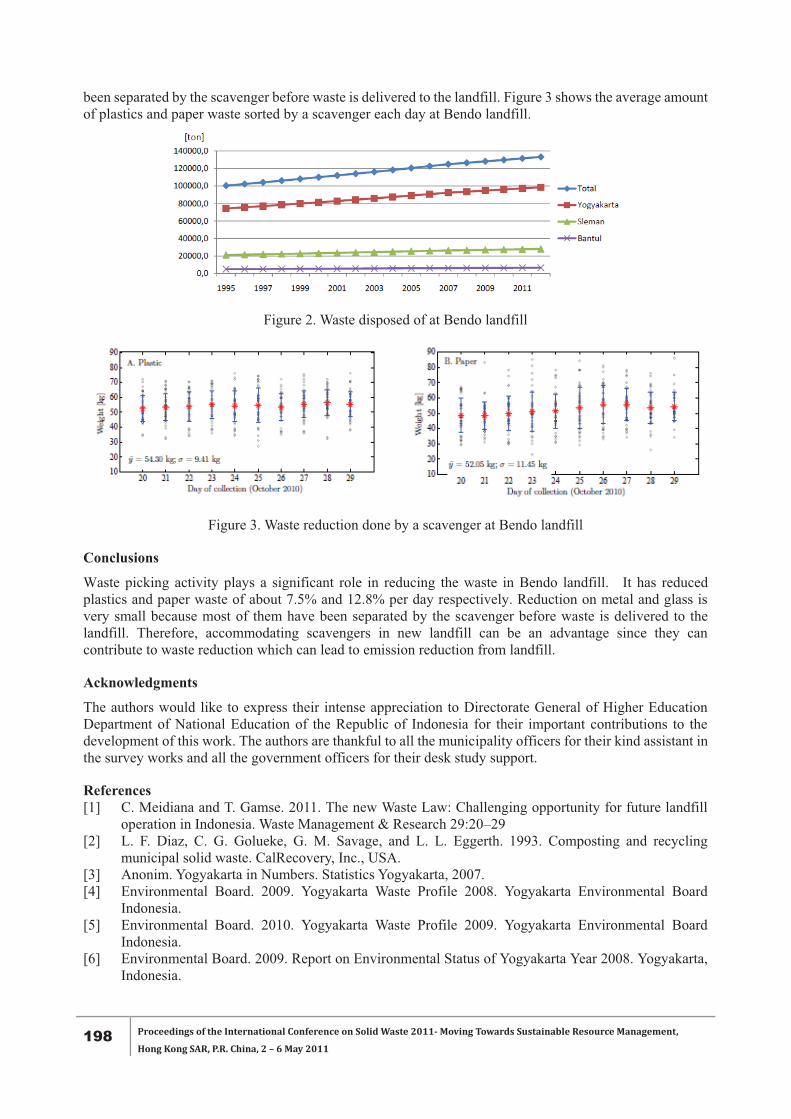
been separated by the scavenger before waste is delivered to the landfill. Figure 3 shows the average amount of plastics and paper waste sorted by a scavenger each day at Bendo landfill.
Figure 2. Waste disposed of at Bendo landfill
Figure 3. Waste reduction done by a scavenger at Bendo landfill
Conclusions
Waste picking activity plays a significant role in reducing the waste in Bendo landfill. It has reduced plastics and paper waste of about 7.5% and 12.8% per day respectively. Reduction on metal and glass is very small because most of them have been separated by the scavenger before waste is delivered to the landfill. Therefore, accommodating scavengers in new landfill can be an advantage since they can contribute to waste reduction which can lead to emission reduction from landfill.
Acknowledgments
The authors would like to express their intense appreciation to Directorate General of Higher Education Department of National Education of the Republic of Indonesia for their important contributions to the development of this work. The authors are thankful to all the municipality officers for their kind assistant in the survey works and all the government officers for their desk study support.
References [1] C. Meidiana and T. Gamse. 2011. The new Waste Law: Challenging opportunity for future landfill
operation in Indonesia. Waste Management & Research 29:20–29 [2] L. F. Diaz, C. G. Golueke, G. M. Savage, and L. L. Eggerth. 1993. Composting and recycling
municipal solid waste. CalRecovery, Inc., USA. [3] Anonim. Yogyakarta in Numbers. Statistics Yogyakarta, 2007. [4] Environmental Board. 2009. Yogyakarta Waste Profile 2008. Yogyakarta Environmental Board
Indonesia. [5] Environmental Board. 2010. Yogyakarta Waste Profile 2009. Yogyakarta Environmental Board
Indonesia. [6] Environmental Board. 2009. Report on Environmental Status of Yogyakarta Year 2008. Yogyakarta,
Indonesia.