Embed Size (px)
Citation preview

1
Executive Summary
Waste Heat Recovery Opportunities in Selected US Industries
©Frost & Sullivan 2010
“Partnering with Clients to Create Innovative Growth Strategies”

2
0
2
4
6
8
10
12
14
16
18
20
1980
1990
2000
2001
2002
2003
2004
2005
2006
2007
2008
2009
2010
2011
2012
2013
2014
2015
2016
2017
2018
2019
2020
kW
h/k
g o
f A
lum
iniu
m p
rod
uced
The consistent improvement in the energy intensity for the production of Aluminium, and particularly with regards to the Hall-Heroult cell, has made the
significant impact seen above. In the 1900s, one kilo of Aluminium processed required nearly 50kWh along from start to finish (excl. transport). In 2020,
it is forecasted that only 11kWh will be required. Moreover, the increased use of recycled aluminium (Secondary Aluminium) from around 500,000 tons
in 1980 to 2.9 million tons in 2009, further reduces the overall energy intensity of the industry. Secondary Aluminium requires less than 20% of the energy of Primary Aluminium per unit weight. The following page shows the two different processes.
Aluminium
□ Historical and Forecasted Industry Energy Intensity
The amount of energy used for each kg of Primary
Aluminium has consistently decreased over the past 30
years, and is expected to continue decreasing. It is
forecast to reach 11 kWh/kg by 2020. Note that Secondary Aluminium uses less than 20% of this figure.
20 yrs
Energy Intensity for Primary Aluminium

3
Aluminium
□ Total Energy Used and Wasted Heat in the Value Chain
Mining Refining
Anode Production
Smelting Primary
Melting/ Casting
Secondary Casting
Scrap Aluminium
Rolling
Extrusion
Shaping
Primary Aluminium
Secondary Aluminium
Energy Used (1012 Btu per year, 2008)
Heat Wasted (1012 Btu per year, 2008)
37
438
13
27
52
Secondary Casting
Primary
Melting/ Casting
2127
52
N/A
Unknown
2.675.464.32
16.2
2.67
2.67
15.65
4.32

4
5.1
18.4
11.7
2.8
19.3
Flue Gases Steam/ Vapour
Other
Low Temp<200oC (400oF)
Medium Temp200oC-500oC (400oF-920oF)
High Temp>500oC (920oF) 50%
80%
12.5%
0.4
100%
100%
N.B: Units are in BTU x1012
Currently Recovered (of Total potential)100%
1
Aluminium
□ Overall Waste Heat Schematic
5
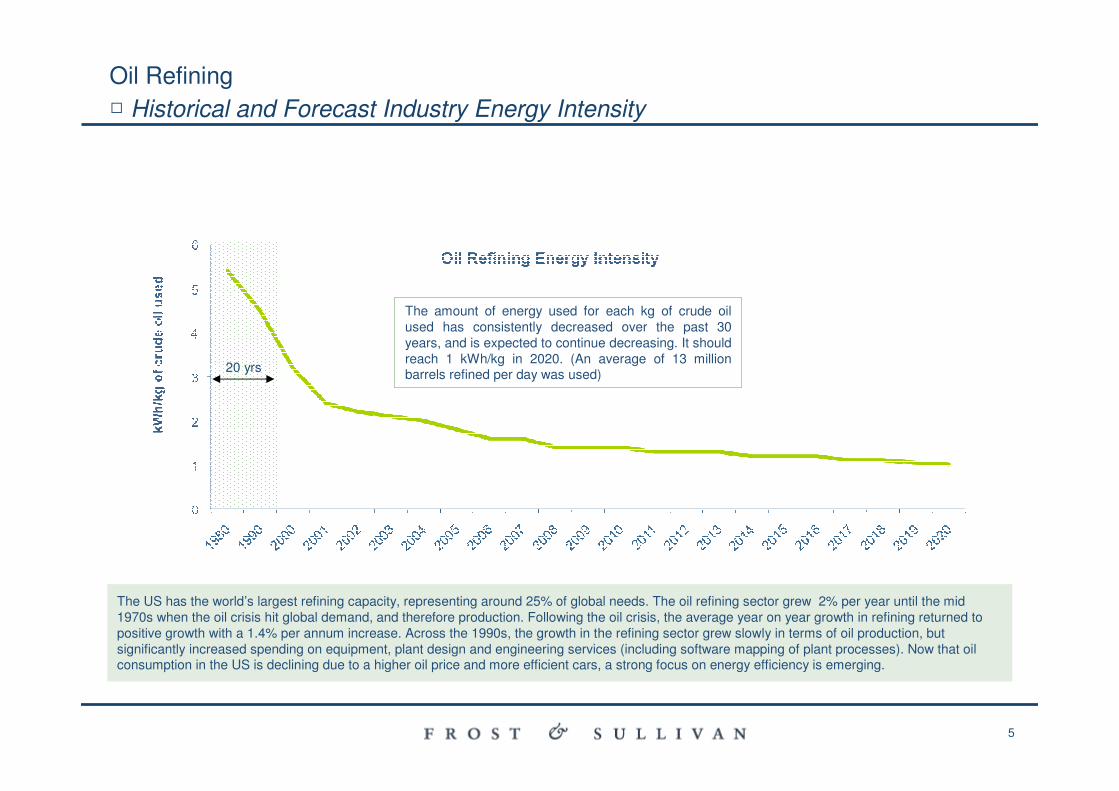
The US has the world’s largest refining capacity, representing around 25% of global needs. The oil refining sector grew 2% per year until the mid
1970s when the oil crisis hit global demand, and therefore production. Following the oil crisis, the average year on year growth in refining returned to
positive growth with a 1.4% per annum increase. Across the 1990s, the growth in the refining sector grew slowly in terms of oil production, but
significantly increased spending on equipment, plant design and engineering services (including software mapping of plant processes). Now that oil consumption in the US is declining due to a higher oil price and more efficient cars, a strong focus on energy efficiency is emerging.
Oil Refining
□ Historical and Forecast Industry Energy Intensity
The amount of energy used for each kg of crude oil
used has consistently decreased over the past 30
years, and is expected to continue decreasing. It should
reach 1 kWh/kg in 2020. (An average of 13 million barrels refined per day was used)
20 yrs

6
8 processes chosen = ~68% of the total energy consumption
Oil Refining
□ Total Energy Used and Waste Heat in the Value Chain
Crude Distillation
Vacuum Distillation
Napthahydrotreating
Catalytic Reforming
FCC
Mid-distillate hydrotreating
Energy Used (1012 Btu per year, 2008)
Heat Wasted (1012 Btu per year, 2008)
240204
190
101
376
Coking
Hydrocracking
7798101
55
202253
140115
42
640
371

7
The energy intensity in the US steel industry has
dramatically decreased since the ’80s. Recent data
published by the American Iron & Steel Institute reveal
that energy intensity across the industry has decreased
and reached 30% of previous levels in the last 20 years. The forecast is for a further, sustained fall.
Both the US Department of Energy and the American Iron & Steel Institute indicate that the energy intensity in the production of steel has declined at
the fastest pace of any US industry since the 1980s. The fuel combination of the energy sources employed in the US steelmaking industry in 2008 was the following: 45% gas, 31% coke and coal, 19% electricity and 4% other sources including renewables.
Steel Manufacturing
□ Historical and Forecast Industry Energy Intensity
20 yrs
Energy Intensity for Steel Production
0
2
4
6
8
10
12
14
1980
1990
2000
2001
2002
2003
2004
2005
2006
2007
2008
2009
2010
2011
2012
2013
2014
2015
2016
2017
2018
2019
2020
kW
h/k
g o
f S
teel
pro
du
ced

8
Steel Manufacturing
□ Total Energy Used and Waste Heat in the Value Chain
130170
90
5052 35
Source: Nippon Steel Corporation
2816.5
750
353
Coke Oven
Sinter Plant
Blast Furnace
5.1 2.1
221
9050
10
BOF EAF Casting
Energy Used
(1012 Btu per year, 2008)
Waste Heat (1012 Btu per year, 2008)

9
Pulp & paper is the third largest industrial consumer of energy behind petroleum and chemicals. An energy reduction of 20% was achieved between
1980 and 2008 and a further reduction of 5% are expected by 2020. A variety of factors are responsible for this decrease in energy needed, the main
ones include an increase in waste paper recycling, requiring significantly less energy, a declining share of the high energy intensive mechanical pulping
processes and the implementation of a variety of energy saving measures, including waste heat recovery. Despite a reduction in required energy per
production unit, the total amount of energy consumed in the industry has remained relatively stable over the past three decades as production output significantly increased.
Pulp & Paper
□ Historical and Forecast Industry Energy Intensity
20 yrs From about 5.1kWh/kg in 1980, the amount of energy
used for each ton of paper has consistently decreased
over the past 30 years, and is expected to continue
decreasing. It should reach a forecasted 3.8 kWh/kg in 2020.
Pulp & Paper Energy Intensity
0.0
1.0
2.0
3.0
4.0
5.0
6.0
1980
1990
2000
2001
2002
2003
2004
2005
2006
2007
2008
2009
2010
2011
2012
2013
2014
2015
2016
2017
2018
2019
2020
kW
h/k
g o
f P
ap
er
pro
du
ced

10
Wood Preparation
Cooking/ Digesting Bleaching
TOTAL PULP
Stock Preparation/
Pressing
TOTAL PAPER
Chemical Recovery (including Evaporation and Calcination)
Grinding/ Ref ining for (Thermo-) MechanicalPulping
Drying Calendering/ Finishing
(e.g coating)
Slushing, De-inking for receycled paper pulping
Pulp Drying (if non-integrated) P&P mill
Screening/ Clearing
Pulp & Paper
□ Total Energy Used and Waste Heat in the Value Chain
Energy Used (1012 Btu per year, 2008)
Heat Wasted (1012 Btu per year, 2008)
The figures stating the energy input and
waste heat by process are based on
estimations from secondary sources
such as the US Department of Energy and opinions of industry experts.
33 <1.0
195
364
71
5
13
4
509
191
8 <1.0
42
382
65
124
220
34

11
Legislation & Competitive Landscape
□ Legislation – Overview and Key Implications
• American Recovery and Reinvestment Act – to encourage economic growth, grants for 'shovel-ready' projects
• Industrial Technological Program – to improve industrial energy efficiency, includes no-cost energy assessments
• Investment Tax Credit – federal corporate tax credit for commercial, industrial and corporate sectors, equalling to 30% of the investment cost
• Production Tax Credit – a per-kW-hour tax credit for electricity generated by renewable sources and sold to a third party
• Renewable Energy Grants – federal grant program, equalling to 30% of the property cost
• Renewable Portfolio Standard – aimed at increasing renewable energy generation, requiring utilities to supply a specified amount of electricity generated by renewable sources
Key Implications:
1. Legislation acts both as a driver and a restraint. Although there is increasing support from the government to help realise the potential waste heat recovery represents, the US energy regulation
requires further modifications to accommodate the required change as well as a speedier response to market conditions. Also, regarding applicable legislation or incentives, there is no common agreement on whether to regard waste heat recovery as green energy or not.
2. The availability of funding plays an important role in realising market potential.The lack of capital and available third party financing also hamper market development. In addition, the current investment hurdle rate (between 25 to 45%) needs to fall further before the market can develop further.
3. The focus is not yet on industrial process heating recovery.Due to better regulatory and financial support, as well as lower investment cost and better return, product and service providers tend to concentrate
on the more rewarding waste heat recovery projects. At the moment the majority of recovered heat comes from CHP plants that recycle waste energy rather than waste heat from industrial processes turned into electricity or steam.
Also, waste heat recovery is just one of the many ways of improving energy efficiency and lowering costs and simpler efficiency improvement alternatives can provide quicker results at lower costs.

12
Legislation & Competitive Landscape
□ Market Overview and Project Steps
� In the US, waste heat recovery, together with cogeneration, are commonly referred to as the two main parts of Recycled Energy and according to a DOE study, one-third of the potentially recyclable power could come from waste energy recovery, while two-thirds from CHP plants.
� Process related efficiency improvements differ from the traditional performance contracting type of solutions commonly used in public and commercial buildings for facility related efficiency gains. This is due to difficulties in acquiring funds for the project and in calculating the achievable savings potential.
Engineering and
Economic Feasibility
Studies
Project Financing
Project Design,
Engineering and Permitting
Commissioning
Operation & Maintenance
Construction
Energy Audit
� The project is usually divided into two main parts, Engineering+ Procurement and Construction
� Answering no to the following questions usually means the use of external help is required:
� Does the owner of the company have all the capabilities to come up with the concept and carry out the work?
� Is the owner of the company able to get all permitting done, including environmental, water and air permits?
� Is the owner of the company able to sell the generated electricity back to the grid?
� The various players in the market can provide either or all missing skills and capabilities.

13
• Many industrial companies have great expertise in engineering and process related issues and would normally take care of waste heat recovery projects themselves.
• Local or national players with local presence. • Mainly interested in the design and build phases and in 50MW+ projects.• E.g.: Fluor Daniel, Jacobs, Turbo Steam, etc.
• Cover all aspects of the project from funding, to the technical piece, to selling the power. • Usually work on below 50M projects.• E.g.: Recycled Energy Development, ElectraTherm, Synergy, etc.
• Growing presence.• Offering pioneering proprietary products, focusing on low hanging fruit, such as biomass plants.
• Initially created as a result of PURPA law • Cater for bigger projects (50MW+).
Industrial Plants
EPC / Engineering Companies
‘Do-it-all’ types of Companies
Small Start-up Companies
Unregulated arms of utility companies
Legislation & Competitive Landscape
□ Types of Players and Their Roles
• Not in direct competition with service providers as they are regarded simply as subcontractors/ suppliers of the required equipment.
• E.g.: Nooter Eriksen, Babcock & Wilcox, Dresser Round, Clayton Industries, etc.Equipment Suppliers
• Providing energy assessments and feasibility studies.• E.g.: Productive Energy, Steam Engineering, VGA EC, NE EES, Go Sustainable Energy, etcConsultancies
• Specialist providers, dealing with the purchase and sale of RECs (Renewables Energy Certificate) and carbon credits.
Carbon Credit Trading Companies
1. Complex market In terms of key industry participants and their major roles, the market is regarded as very complex, with many overlaps. For ease of understanding, the industry prefers to look at it from a financial point of view, i.e. where the financing for a given project originates from.
Key Messages:
2. Confusion in the industryMany players find it difficult to identity their competitors. As waste heat recovery equipment, in most cases, is process specific and tailored to the
specific requirements of a plant or a given process, often market participants do not feel they are in direct competition with each other. This is further complicated given the fact that the market is not well established from a supplier perspective.

14
www.frost.com

15
Growth Partnership
Subscription
Growth Consulting
Career Best Practices �
�
�
“The Growth Partnership Company”
Frost & Sullivan
is a global growth consulting company with more
than 40 years experience. We specialise in these
8 industries:
• Energy & Power Systems
• Automotive & Transportation
• Chemicals, Materials & Food
• Healthcare
• Industrial Automation & Electronics
• Aerospace & Defense
• Environment & Building Technologies
• Information & Communication Technologies

16
MilanSophia Antipolis
Paris
London
Oxford
Frankfurt
Warsaw
Tel Aviv
Dubai
Cape TownBuenos Aires
Bogotá
São Paulo
Mexico City
San Antonio, TX
Mountain View, CANew York, NY
Toronto
Beijing
Chennai
Kuala Lumpur
Mumbai
Bangalore
Calcutta
Delhi
Singapore
Shanghai
Sidney
Melbourne
Seoul
Tokyo
A global growth consulting company that partners with clients to support the development of
innovative growth strategies
A local presence and global expertise: 31 offices worldwide – 2,000+ employees
“The Growth Partnership Company”

© Frost & Sullivan 2010