Embed Size (px)
Citation preview

Water Requirements of Selected IndustriesGEOLOGICAL SURVEY WATER-SUPPLY PAPER 1330
This volume was published as separate chapters A-H

UNITED STATES DEPARTMENT OF THE INTERIOR
STEWART L. UDALL, Secretary
GEOLOGICAL SURVEY
William T. Pecora, Director
CONTENTS
[Letters designate the separately published chapters]
(A) Water requirements of the pulp and paper industry, by O. D. Mussey.(B) Water requirements of the carbon-black industry, by H. L. Conklin.(C) Water requirements of the aluminum industry, by H. L. Conklin.(D) Water requirements of the rayon- and acetate-fiber industry, by O. D.
Mussey.(E) Water requirements of the copper industry, by O. D. Mussey.(F) Water requirements of the styrene, butadiene, and synthetic-rubber indus
tries, by C. N. Durf or.(G) Water requirements of the petroleum refining industry, by L. E. Otts, Jr.(H) Water requirements of the iron and steel industry, by F. B. Walling and
L. E. Otts, Jr.
O


ater Requirements f the Pulp and
Industryf v ORVILLE D. MUSSEY
r'ATER REQUIREMENTS OF SELECTED INDUSTRIES
GEOLOGICAL SURVEY WATER-SUPPLY PAPER 1330-A
A study of the manufacturing processes with special emphasis on future water requirements
UNITED STATES GOVERNMENT PRINTING OFFICE, WASHINGTON : 1955

UNITED STATES DEPARTMENT OF THE INTERIOR
Douglas McKay, Secretary
GEOLOGICAL SURVEY
W. E. Wrather, Director
For sale by the Superintendent of Documents, U. S. Government Printing OfBce Washington 25, D. G. - Price 60 cents (paper cover)

FOREWORD
The early industries in America generally were established when and where demands for the products of industry arose. Most of the early industries were so located that their increasing re quirements for transportation, raw materials, market, labor, and water supply could be satisfied economically. Many of these orig inal plant locations have continued as modern industrial centers and their output has increased manyfold in meeting the demands of our growing Nation. The recent and current industrial expan sion and the trend toward the growth of chemical industries, many Of which are heavy users of water, has resulted in a tremendous increase in the total withdrawal of water for industrial use as well as a large increase in the per capita use of water. This in crease in industrial water requirement has strained the capacity of the developed water supplies in many areas, and in some in stances the adequacy of the potential water supplies is questionable.
The Geological Survey is engaged in preparing and publishing a series of reports describing the developed and undeveloped water resources of many important industrial areas. This work was started initially at the requestofthe National Securities Resources Board as a means to insure that water supplies are adequate for our rapidly expanding industrial development. Although many factors contribute to establishing the feasibility or even the limits of future industrial development, the one relating to available wa ter supply is extremely important. A knowledge of the water re quirements of various industries is valuable therefore in planning the logical development in any area where water supply is a critical factor. Thus far very little suitable information on the water requirements of our major industries is available for general planning. An inventory of unit water-use values in indus try therefore would be generally helpful and also might tend to stimulate water-conservation methods.
To obtain such information, investigations are being made re garding the water requirements of a number of important indus tries. This report, describing the water requirements of the pulp and paper industry, is the first of a series of reports by the Geo logical Survey on industrial water requirements.
Modern industrial plants involve large capital investments, and many of them require immense quantities of water for processing
III

IV WATER REQUIREMENTS OF SELECTED INDUSTRIES
purposes, not only for current operation demands but also for possible future expansion. It is obvious, therefore, that an ade quate supply of suitable water is of primary importance in the lo cation of new plants. As the industrial development of the country progresses, the more favorable sites are becoming increasingly difficult to obtain. These reports describing the water require ments of various industries should be helpful in locating potential industrial sites. If they are used in connection with the inventories of developed and potential water resources of the selected in dustrial areas, they should be particularly helpful in planning future industrial development. A special application of the avail able information would be in planning the establishment of large water-using industries in connection with defense mobilization.
This report reviews briefly the entire process of making pulp and paper in order to demonstrate how water enters /into the various manufacturing methods, and show the requirements for use and the potentialities for reuse of water in the process.
C. G. Paulsen
Chief, Water Resources Division

PREFACE
This report is one of a series describing the water require ments of selected industries that are of national importance. It was prepared at the request of and in consultation with the Water and Sewerage Industry and Utilities Division, Business and De fense Services Administration, Department of Commerce, and is designed to serve the dual purpose of providing basic information for national defense planning and at the same time rendering a valuable service to business and industry in their development of water resources for present and future use. The report was pre pared in the Water Resources Division of the Geological Survey under the direction of Jack B. Graham, chief, Water Utilization Section, Technical Coordination Branch.
The author is indebted to Ernest H. Sieveka, who planned the scope of the reports on the use of water in industry and who guided and aided the author during the study of the water requirements of the pulp and paper industry.
Acknowledgment is given to the many officials of the pulp and paper industry, who in addition to their helpful suggestions, fur nished much of the information on which this report is based.
Special acknowledgment for information and constructive sug gestions in presenting the water requirements of the industry is due the following: C. T. Beals and A. W. Neubauer of the Crown Zellerbach Corporation, Camas, Wash., who furnished the photo graph for figure 2; R. T. Bingham, Technical Association of the Pulp and Paper Industry, New York; Charles Carpenter, New York and Pennsylvania Co. , Inc.; G. H. Chidester, chief. Division of Pulp and Paper, Forest Products Laboratory, U. S. Forest Serv ice, Madison, Wis.; L. N. Erickson, California Forest and Range Experiment Station, U. S. Department of Agriculture; A. S. Erspamer, chairman, Technical Association of the Pulp and Paper Industry Water Committee; H. W. Gehm, technical director, National Council for Stream Improvement of the Pulp, Paper, and Paperboard Industry; the late B. W. Scribner, chief, Pulp and Paper Section, U. S. Bureau of Standards; the late C. J. West, librarian, Institute of Paper Chemistry, Appleton, Wis.; T. F. Wisniewski, director, Committee on Water Pollution, Bureau of Sanitary Engineering, Wisconsin Board of Health; and the William L. Barrell Co. , who, through the efforts of W. B. Wheelwright of Cambridge, Mass. , made available the photograph shown in figure I.


CONTENTS
PageAbstract................................................................................................................................... 1Introduction.............................................................................................................................. 2History...................................................................................................................................... 4Description of process........................................................................................................... 7
Manufacture of pulp............................................................................................................ 7Preparation of pulpwood for processing...................................................................... 7Groundwood pulp............................................................................................................. 8Sulfate pulp..................................................................................................................... 9Soda pulp....................................................................................................................._, 12Sulfite pulp...................................................................................................................... 12Woodpulp by miscellaneous methods............................................................................ 14Bleaching......................................................................................................................... 14
Manufacture of paper.......................................................................................................... 15Reusing wastepaper............................................................................................................ 19Pulp and paper wastes....................................................................................................... 20
Quantitative water requirements........................................................................................... 22Review of literature........................................................................................................... 22Wisconsin pulp- and paper-mill waste surveys............................................................... 26Water-use data from other sources................................................................................... 29Results of present survey.................................................................................................. 30Consumptive use................................................................................................................. 34
Qualitative water requirements............................................................................................. 35Pertinent chemical and physical characteristics........................................................... 35Scale and corrosion............................................................................................................ 38Water-quality standards...................................................................................................... 39
Process water.................................................................................................................. 39Boiler-feed water............................................................................................................ 40Cooling water.................................................................................................................. 43General-purpose water................................................................................................... 45
Results of present survey.................................................................................................. 45Quality of untreated water............................................................................................. 46Water treatment................................................................................................................ 49
Future water requirements..................................................................................................... 50Location............................................................................................................................... 50
Source of raw materials.................................................................................................. 50Economics of mill location............................................................................................ 51
Amount.................................................................................................................................. 52Growth of industry.......................................................................................................... 52Present capacity of mills.............................................................................................. 55Use of paper products.................................................................................................... 59
Trends in the pulp and paper industry............................................................................. 62Summary.................................................................................................................................... 63
Quantitative water requirements....................................................................................... 63Qualitative water requirements......................................................................................... 65Trends in water requirements............................................................................................ 66
Selected references................................................................................................................ 67Index......................................................................................................................................... 69
VII

VIII CONTENTS
ILLUSTRATIONS
Page Plate 1. Water use in the two most important woodpulp manufacturing
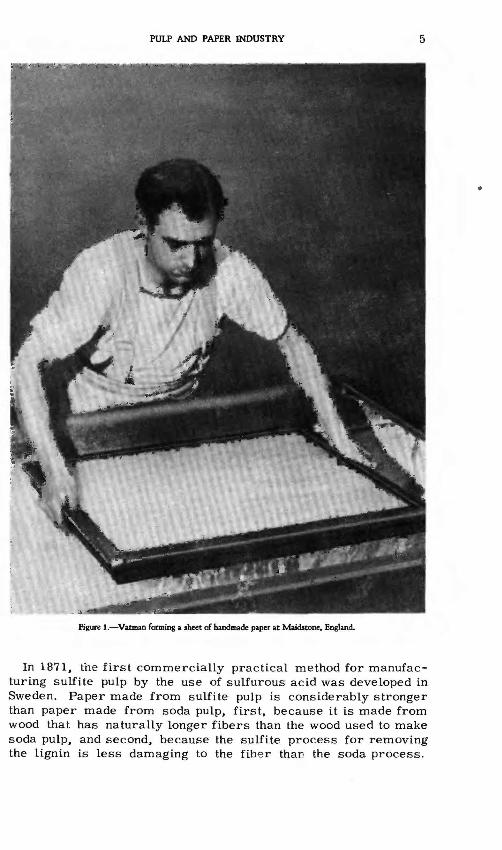
processes.................................................................................................. In pocketFigure 1. Vatman forming a sheet of handmade paper at Maidstone, England............ 5
2. A modern Fourdrinier papermaking machine................................................... 63. Fourdrinier machine........................................................................................... 174. Frequency distribution of unit water-use values determined in 1951
inventory of the pulp and paper industry.................................................... 345. Frequency distribution of chemical characteristics in available anal
yses of water supplies for the pulp and paper industry............................ 476. Frequency distribution of physical characteristics in available anal
yses of water supplies for the pulp and paper industry............................ 487. Annual production of woodpulp and paper and board in the United
States, 1899-1950.......................................................................................... 528. Quantity and percentage of woodpulp production, by process, in the
United States, 1899-1950............................................................................. 539. Percent of pulp production bleached, 1935 50.............................................. 55
10. Capacity of pulp mills in the United States, 1949........................................ 5611. Location and tonnage of United States pulp and paper production, 1947.. 5912. Quantity and source of fibrous material used in making the paper and
paperboard consumed in the United States, 1947...................................... 61
TABLES
Page Table 1. Waste flows and sewered population equivalents for pulp and paper
mills................................................................................................................. 202. Summary of 1939 survey of water requirements for production of
pulp and paper................................................................................................ 243. Use of makeup water, by operations, in a newsprint mill using 10
percent sulfite pulp........................................................................................ 254. Water required for production of pulp and paper............................................ 265. Computed unit water requirements for pulp and paper mills in
Wisconsin........................................................................................................ 276. Quantitative unit water-use values (arranged), for pulp and paper
manufacture,obtained in the 1950 preliminary survey............................... 317. Quantitative unit water-use values (arranged), for the pulp and paper
industry, obtained in the 1951 survey......................................................... 328. Quantitative unit water-use values (arranged) for various specified
pulp and paper products................................................................................ 339. Specifications for chemical composition of process water for manu
facture of various pulps and papers............................................................ 3910. Chemical and physical characteristics of an ideal boiler water................. 4111. Statistical characteristics of available analyses of untreated water
used in pulp and paper manufacture............................................................ 4612. Number of pulp and paper mills included in 1951 inventory using
water-treatment methods listed.................................................................... 4913. Comparison of four types of woodpulp............................................................ 5014. Mean and median capacity of woodpulp mills of the United States, 1949. 5715. Woodpulp production in the United States, 1947........................................... 5716. Paper and board production in the United States, 1947............................... 5817. Imports of woodpulp, 1922-48......................................................................... 5918. Imports and exports of paper and paperboard, 1922 48............................... 6019. Estimated consumption of paper and board in the United States, 1955..... 6220. Water requirements of the pulp and paper industry....................................... 63
WATER REQUIREMENTS OF SELECTED INDUSTRIES
TVATER REQUIREMENTS OF THE PULP AND PAPER INDUSTRY
By Orville D. Mussey
ABSTRACT
Water, of varied qualities, is used for several purposes in the manufacture of pulp and paper, as a vehicle for transporting the constituents of paper in the paper machines; as process water for cooking wood chips to make pulp; as a medium for heat transfer; and for washing the pulpwood, the woodpulp, and the machines that handle the pulp.
About 3,200 million gallons of water was withdrawn from surface- and ground-water sources each day during 1950 for the use of the pulp and paper industry. This is about 4 percent of the total estimated industrial withdrawal of water in the Nation
The paper industry in the United States has been growing at a rapid rate. It has in creased about tenfold in the last 50 years and has doubled every 15 years. The 1950 pro duction of paper was about 24 million tons, which amounts to about 85 percent of the domestic consumption. In 1950, the pulp mills of the country produced more than 14 mil lion tons of woodpulp, which supplied about 85 percent of the demand by the paper mills and other industries. The remainder of the fiber for paper manufacture was obtained from imported woodpulp, from reclaimed wastepaper, and from other fibers including rags and straw. The nationwide paper consumption for 1955 has been estimated at 31,700,000 tons.
Woodpulp is classified according to the process by which it is made. Every woodpulp has characteristics that are carried over into the many and diverse grades of paper. Groundwood pulp is manufactured by simply grinding up wood and refining the resulting product. Soda, sulfite, and sulfate pulps are manufactured by chemically breaking down the lignin that cements the cellulose of the wood together and removing, cleaning, and sometimes bleaching the resulting fibers. Some woodpulp is produced by other methods. Sulfate-pulp mills are increasing in number and in rated daily capacity and are manufac turing more than half of the present domestic production of woodpulp. Most of the newer and larger woodpulp mills are manufacturing sulfate pulp; because of the antipollution laws, many sulfite-pulp mills are being converted to sulfate-pulp mills. The waste from the manufacture of a ton of sulfate pulp is much more readily disposed of than that from a ton of sulfite pulp. Pulp mills are located near the source of raw material, which means that they are located in the eastern half of the United States and in the Pacific Northwest. It is advantageous for paper mills to be located close to a market and therefore a large number of paper mills are in the northeastern section of the United States from Minnesota to Maine. However, much of the coarser paper, which will ship well, is produced close to the pulp mills.
The entire process of making paper from pulpwood, with special reference to water use is briefly described to provide an understanding of how the water is used and reused.
341091 O - 55 - Z

2 WATER REQUIREMENTS OF SELECTED INDUSTRIES
A field survey of the water requirements of selected pulp and paper mills revealed a wide range in the amount of water used to manufacture a ton of similar grades of pulp, paper, and paperboard under similar conditions. Also, it was found that average water re quirements for woodpulp manufacture ranged from 10,000 gallons per ton for groundwood pulp to 75,000 gallons per ton for bleached sulfite or sulfate pulp. In paper manufacture, the average water use ranged from 13,000 gallons per ton of paperboard to 80,000 gallons per ton of fine rag paper. On the average the maximum unit water use in paper manufacture was about 5 times the minimum unit water use in making similar products in the same gen eral area. Some economy in water use could be obtained in plants that make their own pulp and convert it directly into paper.
A study and comparison with accepted water-quality requirements was made of the avail able analyses of the chemical and physical characteristics of the raw-water supplies used by the selected sample of pulp and paper mills. Dissolved solids ranged from 18 to 1,080 ppm (parts per million), but the median values of all the characteristics except color indi cated that the raw water was generally of much better quality than the concentrations sug gested as the maximum limits in the specifications for the chemical composition of pro cess water for pulp and paper manufacture issued by the Technical Association of the Pulp and Paper Industry.
Process water should be quite soft and almost entirely free from iron and manganese. If the paper is to be used in food processing, the water should be free from bacteria, and also from taste and odor. Special precautions must be.taken to prevent slime growth and to control corrosion. The specifications for boiler-feed water are quite rigid and are of considerable importance because of the very large percentage of boiler-water makeup that is used in the industry.
A tendency was noted to use smaller amounts of water per ton of product except for bleaching. For bleaching the tendency is to use more and more water per ton of product. The water used for pulp and paper manufacture today is generally of better quality than the water used for this purpose a decade or more ago.
INTRODUCTION
Few people realize the importance of adequate water supplies of suitable quality in the successful operation of many American manufacturing activities. This report, covering the first of a series of investigations of the water requirements of important industries, presents the results of a survey of the quantitative and qualitative water requirements of the pulp and paper producers. This kind of information is needed to plan more intelligently the overall development of specific areas and to utilize our water resources more effectively. The average water requirements shown in this report will help to establish a reasonable concept of the scope of the water needs of the pulp and paper manufacturers. The survey covered changes in manufacturing procedure and the resultant alterations in the quality of the finished product that are necessitated when a paper producer is required to use less water than is generally thought advisable. If defense mobilization should be necessary, the results of this survey would be especially help ful in locating new plants using large amounts of water so that the pulp and paper mills will be assured adequate water supplies of suitable quality and at the same time not interfere with the re quirements of other industries with whom they must share the water.

PULP AND PAPER INDUSTRY 3
Literature was consulted for background material to obtain an understanding of the industry's water-supply problems. Information was available concerning the size and location of pulp and paper mills in operation, values of past and present domestic production, consumption of pulp and paper, and the extent of the foreign trade in pulp and paper. These factors along with values of unit water use may be projected into the future to predict the anticipated water needs of individual plants of economic design, as well as the needs of the entire industry. Very few descriptions of the various proc esses for making pulp and paper were sufficiently detailed to show just how water enters into the processes at different points. An un derstanding of how water is used at the mills, at just what points it is extremely important to use the best water obtainable, and at what points a lower quality of water maybe used, is needed to appreciate the industry's water problems. The brief descriptions of the four most important methods ofwoodpulp manufacture and a generalized description of paper manufacture are based on standard texts cover ing the subjects. Shreve, Witham, and the articles by Sawyer in Industrial and Engineering Chemistry were freely drawn upon as source material for the section covering description of process. Sufficient descriptive matter is included to show how reuse practices permit savings of heat and useful material suspended in the waste water and result in lower costs for treatment of water supply and waste.
Little information has been published regarding the pulp and paper industry's water requirements although much has been written about most other aspects of the industry. Available published data relating to the quantitative and qualitative water requirements of the pulp and paper industry were tabulated and summarized. These data indi cated a wide range in the amount and quality of the water used. Ad ditional information thus was needed to explain the great differences in the amount of water used by different mills, even in making the same type of finished product from identical raw materials. This necessitated a good understanding of many details of the manufac turing process. Afield survey was made to supplement and explain the data from the technical literature. The survey was conducted along several lines: preliminary inquiries to the field offices of the Water Resources Division of the Geological Survey, interviews at selected mills, and inquiries to technical and research organiza tions concerned with the industry. Interviews were conducted at selected mills in Maryland, Michigan, Pennsylavnia and Wiscon sin, and at the central offices of several companies operating mills in various parts of the country. Data were obtained from mills throughout the country representing about 11 percent of the pro ducing facilities of the industry. These mills were selected with the object of obtaining data typical of water use from the more im portant pulp- and paper-producing areas in the country.

4 WATER REQUIREMENTS OF SELECTED INDUSTRIES
The results of this survey together with the information in the literature were summarized and interpreted to present a picture of the water requirements of the pulp and paper mills currently in operation and the trends in these requirements.
HISTORY
Paper is composed basically of natural fibers that have been separated and then rearranged to form a sheet. The process of papermaking that is, the process of breaking down and reassem bling the individual fibers constituted an abrupt departure from the earlier methods of making writing materials such as parch ment or papyrus. Parchment was made from hides by a special tanning process. Papyrus was made by pressing thin longitudinal strips of natural fibrous material, cut from the papyrus reed, into a product resembling modern paper.
Paper was first made in China about 100 A. D. , but papermaking was not known in Europe until it was Introduced there by the Arabs about the middle of the 12th century. Until about 1800, paper was made by hand, a single sheet at a time (fig. 1). Except in the Orient it was made from rags, principally cotton and linen. When paper was made one sheet at a time, the water problem was not a significant one. No large amount of water was used at any one point, and its suitability for papermaking was judged by taste.
With the invention of the Fourdrinier and cylinder-type paper machines (fig. 2) at the beginning of the 19th century, paper- production costs were reduced, resulting in such an increased demand for paper that the rag supply was insufficient. For a long time prior to 1800 the Chinese had been making paper from certain kinds of bark and other vegetable matter as well as from rags. In 1719 Reaumur, the French naturalist, after studying wasps' nests, suggested that paper might be made from wood.
The first practical method for making pulp from wood was de veloped in 1840. This was the groundwood process which supplies pulp for most newsprint and a considerable amount of other low- quality paper. The groundwood process is purely a mechanical one and does not remove the ligneous matter from the wood cel lulose. The soda process for producing purified wood cellulose was developed in 1851. Fiber was prepared by boiling poplar wood chips in a caustic alkali solution at high temperature and pressure. The soluble material was washed out and the fibers were bleached to a white color. Soda pulp did not make a very strong, paper so rag pulp was added to obtain strength in the final product.
PULP AND PAPER INDUSTRY
Figure 1. Vatman forming a sheet of handmade paper at Maidstone, England.
In 1871, the first commercially practical method for manufac turing sulfite pulp by the use of sulfurous acid was developed in Sweden. Paper made from sulfite pulp is considerably stronger than paper made from soda pulp, first, because it is made from wood that has naturally longer fibers than the wood used to make soda pulp, and second, because the sulfite process for removing the lignin is less damaging to the fiber thar the soda process.

WA
TER R
EQU
IREM
ENTS O
F SELECTED
IND
USTR
IES
IS °3it

PULP AND PAPER INDUSTRY 7
The sulfate process was developed in Europe about 1880 but was not used in the United States until nearly 30 years later. Salt cake or sodium sulfate is used as a raw material to prepare the cooking liquor, and pulpwood such as southern pine is used as a source of cellulose. Sulfate pulp can be bleached to yield strong white fibers, but much of it is used without bleaching to make a strong brown paper.
At the present time, waste paper is an important source of fibers for paperboard and low-quality paper. Straw, hemp, jute, bagasse, flax, and cotton, in addition to linen and cotton rags, supply the fibers used for certain special paper and board.
Writing papers have changed very little since the introduction of woodpulp and surface coating. However, many new materials such as high wet-strength paper suitable for charts, towels, and food containers have been made in recent years by mixing various plastic resins with paper pulp either to increase the wet strength or the resistance to penetration by oil or water (Barrell's Paper Annual, 1950-51, p. 12).
As the industry expanded, it became concentrated at points where economic factors were favorable. One of these factors was an abundant supply of cheap water of suitable quality.
DESCRIPTION OF PROCESS
MANUFACTURE OF PULP
Water in varying quantity and quality is used in many ways in modern pulp mills. This can only be appreciated by studying the processes involved. Therefore, this report contains a summary of the various pulp-manufacturing processes with special emphasis on water use, the opportunities and practices of reuse, and of the problems related to the disposal of the large quantities of con taminated water.
PREPARATION OF PULPWOOD FOR PROCESSING
Pulpwood is received at the mills in many lengths and diame ters, most of it with the bark in place. Enough pulpwood is gen erally stored in the woodyard to insure continuous operation during periods of transportation difficulties or seasonal slumps in supplies. As such storage represents a fire hazard, good practice demands that the woodyard be well supplied with fire hydrants.

8 WATER REQUIREMENTS OF SELECTED INDUSTRIES
At some mills the logs are stored in a pond for a short time be fore being processed.
To make any type of woodpulp the first step is to cut the logs to a size suitable for the plant equipment and to remove the bark, sawdust, and rotten wood. After the pulpwood is cut to the desired length, the bark is removed by barking drums, knife barkers, or jets of water.
In the barking-drum process, the lengths of wood are placed in drums which revolve, either partially immersed in water or with the wood blocks sprayed upon by jets of water. The bark is phys ically rubbed off and the water washes it away. If one trip through the drum is not sufficient, the process is repeated. Knot-boring machines are sometimes used to remove knots or seams of un desirable material. This is followed by another washing.
No water is used in the knife-barking method, but more man- hours of labor are required than with the barking-drum method and wood is wasted that otherwise could, be used for pulp making.
In the Northwest another method of barking utilizes the mechan ical force of a jet of water. For example, at a mill in Camas, Wash. , the jet is turned against a log which is rotated at 40 rev olutions per minute. The jet uses 1, 200 gpm (gallons per minute) at a pressure of 1, 400 pounds per square inch. From 4 to 8 logs, 24 feet long and of large diameter, can be debarked each minute at the Camas plant.
GROUNDWOOD PULP
Groundwood pulp is made by a purely mechanical process. The barked pieces of pulpwood are forced against a revolving stone by means of a hydraulic ram. The pulp fiber is produced by tearing as long a fiber as possible from the wood. From 0. 7 to 1. 2 horse power-hours of energy is consumed for each pound of groundwood pulp produced. More than 90 percent of this power is transformed into heat and the temperature of the wood is controlled by the in troduction of large quantities of cooling water. If the wood is too cold, a very coarse fiber results; if the wood is too hot, an inert floury type of fiber is produced. The best felting pulp is obtained when the temperature is maintained between 155° and 190°F.
Cooling water is also used to clean the stone. Ordinarily "white water, " which is water containing a small amount of finely ground woodfiber that remains after most of the fiber has been separated, is used for this purpose. A small amount of clean water generally
PULP AND PAPER INDUSTRY 9
is added to the white water to make up losses. The pulp and water mixture goes first to a sliver screen where the large material is separated and discarded. The remaining pulp is pumped to the fine screens. The pulp retained on these screens is sent to the re finers where it is ground again and returned to the fine screens. The material that passes the fine screens is concentrated in the thickeners and becomes commercial groundwood pulp. All steps in the manufacture of this pulp are purely mechanical, although a slight hydration of the cellulose from long contact with the water may occur.
SULFATE PULP
The sulfate process is the most important modern chemical process. The chemical reactions involved in the process are rather indefinite but include hydrolysis of the lignins to alcohols, acids, mercaptans, and sulfides. The flow of water through the sulfate process at a mill in Camas, Wash., (Sawyer and others, 1950a) is shown in plate 1A
After the pulpwood has been debarked and cleaned, it moves to the chippers where it is reduced to chips. The chips are then separated on screens into three categories oversize chips, those of desirable size, and sawdust. The oversize chips are further re duced in size, the sawdust is burned in the boilers, and the chips of satisfactory size are stored in a chip bin.
The chips are moved by steam jets and gravity from the chip bin into the digesters, where the chips are cooked to decompose the lignins so that they can be removed by washing. Most digesters are charged by gravity only, but the use of steam jets makes it possible to charge the digester more quickly and to pack nearly 10 percent more chips into it, thus increasing the output. A cooking liquor containing sodium sulfide and caustic soda is added to the chips, after which live steam is applied and the air is ex hausted. Pressure is gradually built up to about 125 pounds per square inch, held there for more than an hour, and then gradually lowered. After more than 3 hours the digester is emptied into the blow tank. The heat of the steam blown off from the digester is recovered in a heat exchanger.
The pulp is diluted with weak black liquor (wash water from earlier batches of sulfate pulp) and the mixture is pumped to the knotter. Here the uncooked pieces remaining from large chips and knots are separated to be returned to the digester where further cooking reduces them to pulp. The pulp that passes through the screens of the knotter is delivered to the washers.
341091 O - 55 - 3

10 WATER REQUIREMENTS OF SELECTED INDUSTRIES
It is important to wash the maximum amount of chemical from the pulp with a minimum amount of water so that the water may be evaporated cheaply and the chemical recovered. Hydroxide re maining in the pulp damages the cellulose fiber and increases the amount (and cost) of chemicals needed for bleaching. The pulp washing is multiple stage, with the effluent from the final stage of the washing process going to the next previous stage until weak black liquor emerges from the first wash and clean pulp emerges from the last wash. Clean warm water is introduced only in the final stage of the washing process. Four-stage washings with an agitating device between the second and third stages are commonly used. From the washers the pulp is pumped to the high-density storage chest for delivery to the bleach plant or the paper mill.
At the Camas plant the black liquor from the washer is delivered to the six-effect evaporators where steam generated in the chemical-recovery furnace concentrates the liquid from about 16 percent to about 50 percent solids. The vapor condensed from the steam going to the first-effect evaporator is returned to the boiler, but the condensate from the other evaporators may be wasted. Vacuum is maintained by steam ejectors. Black liquor that is 50 percent solids becomes rather difficult to handle by standard evaporating methods because of its high viscosity. From the steam evaporators the black liquor is taken to the disk evap orators. These evaporators consist of a number of disks revolving in a vertical plane with the lower parts immersed in black liquor and the upper parts exposed to hot gases containing dust from the chemical-recovery furnace. The viscous fluids stick to the sides of the disks and water is evaporated that would be dif ficult to remove by standard methods. The disk evaporators con centrate the black liquor to about 60 percent solids.
The hot gases from the disk evaporators, now cooled to a temperature of 325° F, pass through a Cottrell precipitator where the inorganic dust particles are removed by building up a strong negative charge on the particles which are then attracted to the positive pole. They are then shaken off into a hopper for removal by a screw conveyer. This dust consists almost entirely of sodi um sulfateand sodium carbonate. More than 100 pounds of dust are recovered by the precipitator for each ton of pulp processed. The dust from the Cottrell precipitator is mixed with the strong black liquor coming from the disk evaporator after which the makeup chemicals, sodium sulfate and sulfur, are added.
The black liquor, which is now thick enough to burn, is raised to a temperature of 220° F by introducing steam directly into the liquor. The heated liquor is sprayed into the chemical- recovery furnace where the organic sodium salts are reduced to
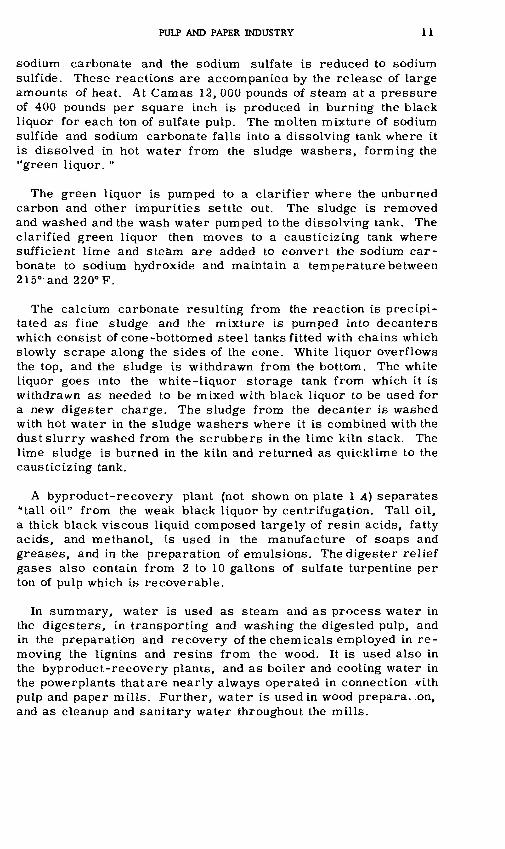
PULP AND PAPER INDUSTRY 11
sodium carbonate and the sodium sulfate is reduced to sodium sulfide. These reactions are accompanied by the release of large amounts of heat. At Camas 12, 000 pounds of steam at a pressure of 400 pounds per square inch is produced in burning the black liquor for each ton of sulfate pulp. The molten mixture of sodium sulfide and sodium carbonate falls into a dissolving tank where it is dissolved in hot water from the sludge washers, forming the "green liquor. "
The green liquor is pumped to a clarifier where the unburned carbon and other impurities settle out. The sludge is removed and washed and the wash water pumped to the dissolving tank. The clarified green liquor then moves to a causticizing tank where sufficient lime and steam are added to convert the sodium car bonate to sodium hydroxide and maintain a temperature between 215° and 220° F.
The calcium carbonate resulting from the reaction is precipi tated as fine sludge and the mixture is pumped into decanters which consist of cone-bottomed steel tanks fitted with chains which slowly scrape along the sides of the cone. White liquor overflows the top, and the sludge is withdrawn from the bottom. The white liquor goes into the white-liquor storage tank from which it is withdrawn as needed to be mixed with black liquor to be used for a new digester charge. The sludge from the decanter is washed with hot water in the sludge washers where it is combined with the dust slurry washed from the scrubbers in the lime kiln stack. The lime sludge is burned in the kiln and returned as quicklime to the causticizing tank.
A byproduct-recovery plant (not shown on plate 1 A) separates "tall oil" from the weak black liquor by centrifugation. Tall oil, a thick black viscous liquid composed largely of resin acids, fatty acids, and methanol, is used in the manufacture of soaps and greases, and in the preparation of emulsions. The digester relief gases also contain from 2 to 10 gallons of sulfate turpentine per ton of pulp which is recoverable.
In summary, water is used as steam and as process water in the digesters, in transporting and washing the digested pulp, and in the preparation and recovery of the chem icals employed in re moving the lignins and resins from the wood. It is used also in the byproduct-recovery plants, and as boiler and cooling water in the powerplants that are nearly always operated in connection vith pulp and paper mills. Further, water is used in wood preparav.on, and as cleanup and sanitary water throughout the mills.

12 WATER REQUIREMENTS OF SELECTED INDUSTRIES
SODA PULP
The soda process like the sulfate process is alkaline. Somewhat smaller chips are used than in the sulfate process. The cooking liquor consists of a 6- or 7-percent solution of caustic soda. The cooking time is from 2 to 3 hours at a pressure of 110 pounds per square inch and a temperature of 344°F. The digesters generally blow to open pits, and the steam is wasted. The flow sheet shown in plate IA is generally applicable to the soda process except that sodium sulfate and sulfur are not added to the black liquor before it is fed to the recovery furnace. The furnace burns the black liquor to form a powdery black ash instead of a molten smelt. The black ash, which consists of sodium carbonate, sodium hydrox ide, and carbon, is leached countercurrently with water or a weak alkali solution, and the carbon waste is discarded or used for manufacturing byproducts. Recovered lime and makeup sodium carbonate are added to the leached solution in the causticizing tank. These chemicals react to form sodium hydroxide and calcium carbonate.
Calcium carbonate is precipitated and is separated and con verted to quicklime in the lime kiln. The filtrate becomes the white liquor to prepare another batch of cooking liquor. This part of the process is the same as is shown in plate 1A
The utilization of water is similar to that in the sulfate process.
SULFITE PULP
The sulfite process is an acid process. As much of the sulfite pulp is used for high-grade paper or as a base material for rayon, the barking and cleaning of the wood is done more thoroughly for sulfite than for other pulps.
The cooking liquor is a solution of calcium bisulfite, magnesium bisulfite, and sulfur dioxide. Two methods of preparing cooking liquor are in use, and the cooking may be either director indirect. Plate ID is a flow sheet showing the tower method of preparing the cooking liquor and the direct method of cooking. The appli cation of water in the process is indicated.
Sulfur that has been melted by the heat from the sulfur burner is fed to the burner where it is oxidized to form sulfur dioxide. The sulfur dioxide is cooled quickly in a system of pipes which are either immersed in water or sprayed with water. Next, the

PULP AND PAPER INDUSTRY 13
sulfur dioxide gas is absorbed in water in the presence of calcium and magnesium compounds. A series of two or more towers are packed with magnesian limestone. Water is sprayed into the top of each tower, and sulfur dioxide is blown up from the bottom. The liquor from the absorption towers goes to the reclaiming tank where free sulfur dioxide vented from the digesters is bubbled through it, adding to the amount of free sulfur dioxide.
From the reclaiming tank the cooking acid is transferred to one or more accumulators where relief gases may be added again to boost the free sulfur dioxide content. The digesters are filled with chips, and the cooking liquor is added. Heating of the digester is done usually by adding high-pressure steam to the digester to build up both temperature and pressure. The maximum cooking pressure generally varies between 70 and 160 pounds per square inch, depending upon the design of the plant. Cooking time varies between 10 and 11 hours, and the temperature ranges from 220° to 310° F. Processing conditions vary with the type of wood, the quantity of the wood, and the composition of the cooking liquor. Instead of charging the digester directly with steam, which dilutes the cooking liquor, heat may be added to the cooker either by circulating the cooking liquor through a heater or by passing steam through a series of coils inside the cooker. The lignin is converted to calcium ligno-sulfonic acids. Some formic acid, acetic acid, and furfural are formed. Spruce turpentine and methanol are re moved in the relief gases.
After the cooking process is complete, the digester is emptied into a blow pit where the pulp is drained and washed with fresh water. The cooking liquor is not of further use to the process and is discharged to waste, if possible. The pulp is removed from the blow pit, diluted with considerable water, and placed in the stock chest. In the stock chest the cellulose constitutes about 2| percent and water 97| percent by weight of the mixture.
From the stock chest the pulp is pumped to screens consisting of a series of slots or perforations in moving or stationary plates through which the accepted pulp must pass. The slots gradually decrease in size. The rejected material (about 6 to 10 percent of the pulp) consists of uncooked or knotted masses of fibers, which later are generally separated by grinding and used to make paper of lower quality.
The refined pulp is now ready for the storage chest, from which it is taken to the bleach plant or the paper mill. Most sulfite pulp is bleached before it is used.
Summarizing, water is used as a coolant and as process water in preparation of the cooking liquor, as steam in cooking the chips

14 WATER REQUIREMENTS OF SELECTED INDUSTRIES
in the digester, as wash water and a transportation medium in washing and refining the cooked chips, and as washupand sanitary water throughout the plant. More water is used in barking and cleaning the pulpwood than is used in the alkaline processes.
WOODPULP BY MISCELLANEOUS METHODS
Many other methods are used to make small amounts of pulp. One of these, the semichemical method, involves the use of chemicals to soften the lignin that cements the cellulose together. The softened chips are then ground to form a pulpy mass similar to groundwood. Pulp is also made from straw and from esparto, a grass grown along the Mediterranean Sea. Strawboard pulp is made by cooking straw with lime under 40-pound pressure for about 12 hours. A considerable amount of wastepaper is worked up to form a pulp from which board is made; in fact, nearly a third of the supply of paper fiber comes from this source. The best grades of paper are made of pulp from rags which are cooked in a caustic solution and then washed and bleached.
BLEACHING
Woodpulp produced by any of the standard processes has asso ciated with it a portion of the lignin that originally cemented the cellulose fibers together. The lignin has incorporated with it certain colored impurities that cannot be removed by any amount of washing or mechanical treatment. Other dark-colored mate rials are produced by the action of the digester liquors on the various complex substances contained in the wood. These colored substances can be eliminated only by chemical treatment.
The object of the woodpulp-bleaching process is to obtain, without using an excessive amount of bleach, a product that will have the desired degree of whiteness, and that will remain white indefinitely without impairing the strength and pliability of the fiber and without causing excessive shrinkage in weight and volume.
The pulp-bleaching process used depends on the amount of wa ter available. If only a small amount of water is available, a con centrated bleach is used which reacts both with the cellulose and the color, decreasing the weight and strength of the cellulose as well as bleaching the product. If large amounts of water are available, the pulp may be bleached in stages using a dilute so lution of bleach ateach stage. Ateach stage, considerable ligneous material is separated and washed away. The pulp is bleached with

PULP AND PAPER INDUSTRY 15
less damage and loss of fiber, and with a smaller expenditure for bleach when large amounts of water are available.
Small plants may bleach in batch lots, but large plants use a. continuous process. Bleaching water should be soft and as free from organic matter as possible to avoid excessive reaction with the impurities in the water. All water requires a certain amount of bleach to react with the organic and mineral matter that it con tains. The cost of process water and the amount of bleach required to neutralize the process water are factors affecting the quantity of water used. Bleach water or wash water ordinarily contains so much organic matter washed from the pulp that more bleach must be added to take care of this organic matter before the water may be reused. This factor has an important bearing on the reuse of such water.
MANUFACTURE OF PAPER
Many materials are used in the manufacture of paper and paperboard. Altogether about 600 organic and inorganic chemicals are used to impart various properties to different kinds of paper. These are used in preparing the fiber, in mixing with the pulp, in preparing material for the paper machine, and in providing ma terials for coating paper.
At the paper mill the pulp, diluted with water to hundreds of times its air-dry weight, is screened by being passed through very narrow slots in metal plates. These slots are about 0. 01 inch wide. This screening may precede the bleaching of the pulp.
The pulp is then processed through a beater, a refiner, or both, and mixed with other essential ingredients. This is known in the trade as "making" the paper. For example, in the beater the pulp, diluted to about 5 percent pulp density, passes through very small spaces between sets of rotating and stationary knives. This re sults in physical changes in the pulp fibers such as a breaking down of the individual fibers into smaller fibrils, a decrease in the thickness of the cell walls of the individual fibers, a shortening of the fibers, a splitting of the cell walls so that the fibers are opened up like ribbons, a decrease in fiber stiffness, and a re sulting decrease in the rate of drainage of water through mats of the fibers. A certain amount of hydration of the cellulose fibers also occurs in the beaters. Beating or refining the pulp tends to make the paper stronger, less opaque, less porous, more uni form, and of greater density.
16 WATER REQUIREMENTS OF SELECTED INDUSTRIES
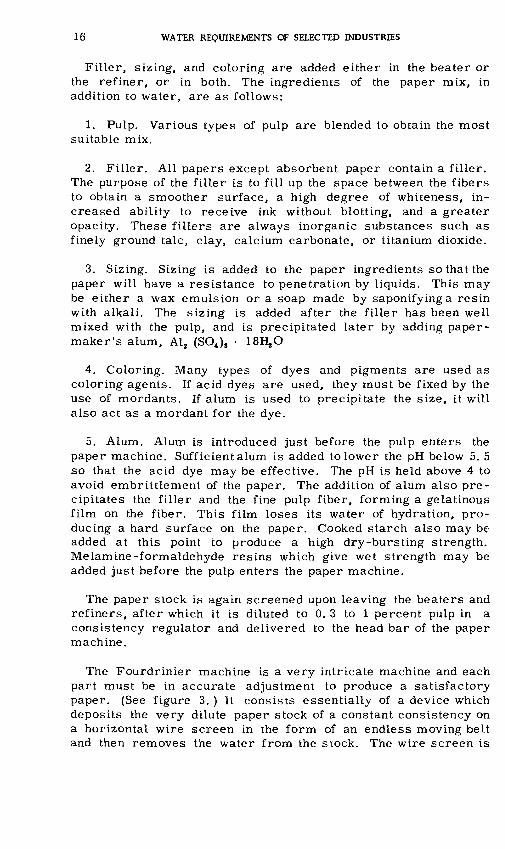
Filler, sizing, and coloring are added either in the beater or the refiner, or in both. The ingredients of the paper mix, in addition to water, are as follows:
1. Pulp. Various types of pulp are blended to obtain the most suitable mix.
2. Filler. All papers except absorbent paper contain a filler. The purpose of the filler is to fill up the space between the fibers to obtain a smoother surface, a high degree of whiteness, in creased ability to receive ink without blotting, and a greater opacity. These fillers are always inorganic substances such as finely ground talc, clay, calcium carbonate, or titanium dioxide.
3. Sizing. Sizing is added to the paper ingredients so that the paper will have a resistance to penetration by liquids. This may be either a wax emulsion or a soap made by saponify ing a resin with alkali. The sizing is added after the filler has been well mixed with the pulp, and is precipitated later by adding paper- maker's alum, A1 2 (SO4 ),
4. Coloring. Many types of dyes and pigments are used as coloring agents. If acid dyes are used, they must be fixed by the use of mordants. If alum is used to precipitate the size, it will also act as a mordant for the dye.
5. Alum. Alum is introduced just before the pulp enters the paper machine. Sufficient alum is added to lower the pH below 5. 5 so that the acid dye may be effective. The pH is held above 4 to avoid embrittlement of the paper. The addition of alum also pre cipitates the filler and the fine pulp fiber, forming a gelatinous film on the fiber. This film loses its water of hydration, pro ducing a hard surface on the paper. Cooked starch also may be added at this point to produce a high dry-bursting strength. Melamine -formaldehyde resins which give wet strength may be added just before the pulp enters the paper machine.
The paper stock is again screened upon leaving the beaters and refiners, after which it is diluted to 0. 3 to 1 percent pulp in a consistency regulator and delivered to the head bar of the paper machine.
The Fourdrinier machine is a very intricate machine and each part must be in accurate adjustment to produce a satisfactory paper. (See figure 3. ) It consists essentially of a device which deposits the very dilute paper stock of a constant consistency on a horizontal wire screen in the form of an endless moving belt and then removes the water from the stock. The wire screen is

PULP AND PAPER INDUSTRY 17
PERCENT OF WATER IN PAPER90 82 68
I I I
~\ WATERMARKING SUCTION ROLL
'FINE-MESH BRONZESCREEN
WINDING REEL
FELT-DRYING BLANKET
Figure 3. Fourdrinier machine.
sufficiently fine to retain the paper stock while much of the water is drained away from the pulp. This drainage is assisted by a series of suction boxes under the wire. A shaking motion is im parted to the screen as it moves, which orients some of the fiber and gives a better felting action and more strength to the sheet. At the end of the screen the paper passes a pair of couch rollers which squeeze out a considerable amount of water from the very wet sheet. The couch rollers reduce the water content from about 90 percent to about 82 percent. At this point the paper is trans ferred to a blanket made of woven wool called a felt which carries it through a series of press rolls where the moisture content is reduced to 60 or 70 percent. As much water as possible is re moved by pressing, but the pressure on the rolls is limited by the crushing strength of the paper. The paper is then transferred to a second blanket which carries it through a number of steam-heated drying rolls, reducing the water content to about 7 percent. At this point it may be externally sized, externally colored or plastic coated, and dried again. The final step is a calendering or ironing in a stack of smooth, heavy rollers, which is followed by winding the finished product on a roll. The operating speed of the paper machine varies from 200 feet per minute for fine paper to 1, 500 feet or more per minute for some of the coarser grades.
A slightly different machine known as the cylinder machine is used to make heavy cardboard or papers composed of two or more layers of dissimilar material. This machine has as many as seven parallel vats charged with paper stock. A cylinder covered with wire screen rotates partly submerged in each vat. Water is re moved from the inside of the cylinder, resulting in a deposit of paper stock on the outside of the screen. As the paper stock reaches the top of the cylinder it contacts and adheres to a moving felt. Some of the water is squeezed out under a couch roll. The felt and paper contact the top of the next cylinder, picking up another layer of paper stock. In this way several layers of paper are built up and passed along to pressing, drying, and smoothing rolls, as in the Fourdrinier machine.
341091 O - 55 - 4
18 WATER REQUIREMENTS OF SELECTED INDUSTRIES
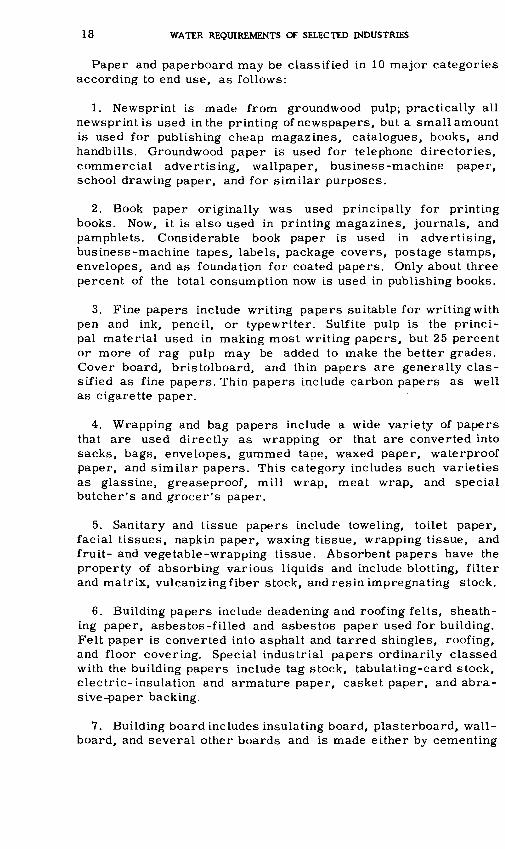
Paper and paperboard may be classified in 10 major categories according to end use, as follows:
1. Newsprint is made from groundwood pulp; practically all newsprint is used in the printing of newspapers, but a small amount is used for publishing cheap magazines, catalogues, books, and handbills. Groundwood paper is used for telephone directories, commercial advertising, wallpaper, business-machine paper, school drawing paper, and for similar purposes.
2. Book paper originally was used principally for printing books. Now, it is also used in printing magazines, journals, and pamphlets. Considerable book paper is used in advertising, business-machine tapes, labels, package covers, postage stamps, envelopes, and as foundation for coated papers. Only about three percent of the total consumption now is used in publishing books.
3. Fine papers include writing papers suitable for writing with pen and ink, pencil, or typewriter. Sulfite pulp is the princi pal material used in making most writing papers, but 25 percent or more of rag pulp may be added to make the better grades. Cover board, bristolboard, and thin papers are generally clas sified as fine papers. Thin papers include carbon papers as well as cigarette paper.
4. Wrapping and bag papers include a wide variety of papers that are used directly as wrapping or that are converted into sacks, bags, envelopes, gummed tape, waxed paper, waterproof paper, and similar papers. This category includes such varieties as glassine, greaseproof, mill wrap, meat wrap, and special butcher's and grocer's paper.
5. Sanitary and tissue papers include toweling, toilet paper, facial tissues, napkin paper, waxing tissue, wrapping tissue, and fruit- and vegetable-wrapping tissue. Absorbent papers have the property of absorbing various liquids and include blotting, filter and matrix, vulcanizing fiber stock, and resin impregnating stock.
6. Building papers include deadening and roofing felts, sheath ing paper, asbestos-filled and asbestos paper used for building. Felt paper is converted into asphalt and tarred shingles, roofing, and floor covering. Special industrial papers ordinarily classed with the building papers include tag stock, tabulating-card stock, electric-insulation and armature paper, casket paper, and abra sive-paper backing.
7. Building board includes insulating board, plasterboard, wall- board, and several other boards and is made either by cementing

PULP AND PAPER INDUSTRY 19
together several thin layers of appropriate material or by forming a single layer of the desired thickness.
8. Container board consists of corrugated board used mostly for making boxes for shipping canned and packaged goods.
9. Boxboard includes the material used to make either folding or setup boxes of solid fiberboard, such as are used by manufac turers and retailers to package food, clothing, hardware, and other miscellaneous articles. Board for tubing and egg cases are included in this category.
10. All other board includes various kinds of miscellaneous cardboard, such as index and uncoated postcard not included in the other three categories of board or with the fine papers.
REUSING WASTEPAPER
Much wastepaper is reused. A large amount of paper known as "broke" which has been discarded during manufacture, either be cause of poor quality or breaking in the machine, or as trim, is repulped in a broke beater and sent to the plant's reclaim system, where it is used to make lower grade papers.
Much wastepaper is used in the manufacture of paperboard. Some of this is used by working up the paper in beaters a second time, washing out the filler and some of the short fibers, and using it to make a dark-colored low-quality paperboard.
A high-quality pulp can be produced from sorted wastepapers originally made from high-quality pulp. The pulp may be cooked with caustic soda, which breaks down the oil in which the carbon of the printer's ink is suspended, allowing the carbon to be washed away. Other physically attached pigments, filler, and sizing are also removed by this process. Some bleach is necessary to pro duce a white fiber suitable for making high-quality paper. The fibers in the reworked pulp are shorter than they were the first time they were used and some long fibers must be added to pro duce a strong paper.
Another method is to use propellers with high-speed blades, which break down the paper and knock out most of the filler, sizing, and carbon so that they can be washed away. Large amounts of wash water are required to produce a high-quality pulp from wastepaper.

20 WATER REQUIREMENTS OF SELECTED INDUSTRIES
PULP AND PAPER WASTES
The pulp and paper industry produces an immense quantity of waste material. Typical waste flows and sewered population equivalents for pulp, paper, and strawboard mills, as determined by the U. S. Public Health Service, are given in table 1. In
Table 1. Waste flows and sewered population equivalents for pulp one? paper mills
[Adapted from H. Doc. 266, 78th Cong , 1st Sess. , p. 1193]
Product
Pulp:
Soda.....................................................Sulfate.. ................................................Sulfite.. ................................................
Miscellaneous paper:
With bleach.... .......................................
Waste (gallons)
Sewered population equivalent1 (number of persons)
Biochemical oxygen demand
Suspended solids
Per ton of product daily
5,000 85,000 64,000 60,000
39,000 47,000 14, 000 26, 000 83,000
16 460 390
1,330
26 40 97
1,230 1,250
6,100
520 220 445
1,920
The calculated population which would normally contribute the same amount per day.
pulping, the principal wastes are the digester liquors, but there are other wastes from the sawing, barking, and chipping opera tions, as well as from the screens, rifflers, knotters, and thick eners. General washing operations, as wellasbleaching and bleach washing, add to the amount of wastes. In papermaking, waste originates in the beaters, the regulating and mixing boxes, and the paper machines.
The waste problems of the pulp and paper industry vary ac cording to the product manufactured and the process employed. The wastes are classified by type of product.
Groundwoodpulp. As both the Hgnin and the cellulose from the wood are used in making groundwood pulp, very little waste results from making this type of pulp.
Suliate pulp. Sulfate or kraft-process pulp has in part attained its present leading position because the black-liquor cooker wastes can be burned, permitting the recovery of chemicals and heat. Therefore, the effluent from the sulfate mill contains very little lignin and cooking chemicals.
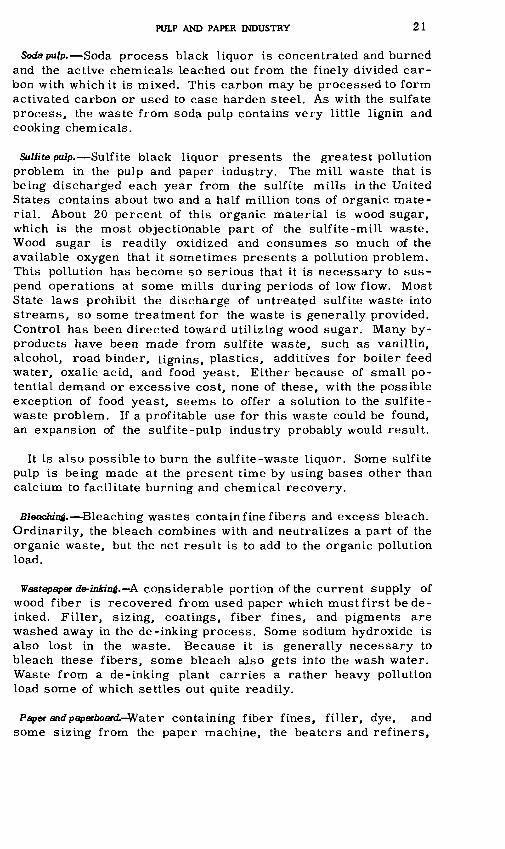
PULP AND PAPER INDUSTRY 21
Soda palp. Soda process black liquor is concentrated and burned and the active chemicals leached out from the finely divided car bon with which it is mixed. This carbon may be processed to form activated carbon or used to case harden steel. As with the sulfate process, the waste from soda pulp contains very little lignin and cooking chemicals.
Sulfite palp. Sulfite black liquor presents the greatest pollution problem in the pulp and paper industry. The mill waste that is being discharged each year from the sulfite mills in the United States contains about two and a half million tons of organic mate rial. About 20 percent of this organic material is wood sugar, which is the most objectionable part of the sulfite-mill waste. Wood sugar is readily oxidized and consumes so much of the available oxygen that it sometimes presents a pollution problem. This pollution has become so serious that it is necessary to sus pend operations at some mills during periods of low flow. Most State laws prohibit the discharge of untreated sulfite waste into streams, so some treatment for the waste is generally provided. Control has been directed toward utilizing wood sugar. Many by products have been made from sulfite waste, such as vanillin, alcohol, road binder, Ugnins, plastics, additives for boiler feed water, oxalic acid, and food yeast. Either because of small po tential demand or excessive cost, none of these, with the possible exception of food yeast, seems to offer a solution to the sulfite - waste problem. If a profitable use for this waste could be found, an expansion of the sulfite-pulp industry probably would result.
It is also possible to burn the sulfite-waste liquor. Some sulfite pulp is being made at the present time by using bases other than calcium to facilitate burning and chemical recovery.
Bleaching. Bleaching wastes contain fine fibers and excess bleach. Ordinarily, the bleach combines with and neutralizes a part of the organic waste, but the net result is to add to the organic pollution load.
Wastepapet de-inking. A considerable portion of the current supply of wood fiber is recovered from used paper which must first be de- inked. Filler, sizing, coatings, fiber fines, and pigments are washed away in the de-inking process. Some sodium hydroxide is also lost in the waste. Because it is generally necessary to bleach these fibers, some bleach also gets into the wash water. Waste from a de-inking plant carries a rather heavy pollution load some of which settles out quite readily.
Paper and pqper&oard-Water containing fiber fines, filler, dye, and some sizing from the paper machine, the beaters and refiners,

22 WATER REQUIREMENTS OF SELECTED INDUSTRIES
the regulating and mixing boxes, and the screens, poses a waste problem for paper mills. In paperboard manufacture from waste- paper, the wastepaper is frequently reprocessed in a beater, re sulting in filler, sizing, and short fibers as waste products.
The pollution problem. The discussion in the preceding sections has been presented to describe the wastes resulting from pulp and paper manufacture. However, in most areas pollution is rigidly controlled either by pollution control boards or by company policy; thus only a fraction of the total waste gets into the streams.
In the past the pulp and paper industry has been one of the major sources of stream pollution, but recently it has carried out in tensive research into methods of control. Much progress has been made in keeping down fiber losses, often at a profit to the paper mills. The reuse of water has been instrumental in saving both fiber and chemicals, which often has been of benefit to the paper mills as well as to their downstream neighbors. Waste from the sulfate process is not as obnoxious as that from the sulfite process because of the chemical recovery practiced. Consequently, there has been a gradual shift from sulfite to sulfate-pulp production. Part of the pressure to convert to sulfate process results from the exhaustion ofpulpwood suitable for the soda or sulfite process. The most troublesome ingredient of the sulfite waste is wood sugar. In Europe this problem has been solved by government subsidy of the manufacture of industrial alcohol from the sugar, which has resulted in cleaner streams because the remaining waste has a much smaller oxygen demand.
Several states have established pollution-control boards which have been empowered to limit or even prohibit the discharge of industrial and sanitary waste into the streams. As a whole, the pulp and paper industry has been reducing the amount of stream pollution per ton of product.
QUANTITATIVE WATER REQUIREMENTS
REVIEW OF LITERATURE
Apparently more water was used in making a ton of paper a few decades ago than is used at the present time. Walton Van Winkle (1914) states that water was used in immense quantities in the manufacture of paper and that many mills required almost 400, OQO gallons per ton of product, several times the present requirement. Paper can be manufactured using much less water than is general ly thought necessary. A sulfate-process pulp and paper mill near Johannesburg, South Africa, has operated with an effluent as small
PULP AND PAPER INDUSTRY 2 3
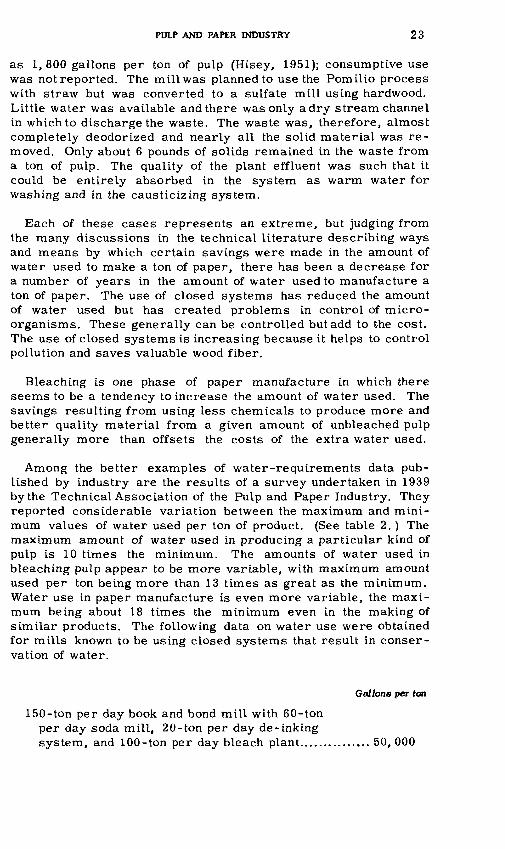
as 1,800 gallons per ton of pulp (Hisey, 1951); consumptive use was not reported. The mill was planned to use the Pomilio process with straw but was converted to a sulfate mill using hardwood. Little water was available and there was only a dry stream channel in which to discharge the waste. The waste was, therefore, almost completely deodorized and nearly all the solid material was re moved. Only about 6 pounds of solids remained in the waste from a ton of pulp. The quality of the plant effluent was such that it could be entirely absorbed in the system as warm water for washing and in the causticizing system.
Each of these cases represents an extreme, but judging from the many discussions in the technical literature describing ways and means by which certain savings were made in the amount of water used to make a ton of paper, there has been a decrease for a number of years in the amount of water used to manufacture a ton of paper. The use of closed systems has reduced the amount of water used but has created problems in control of micro organisms. These generally can be controlled but add to the cost. The use of closed systems is increasing because it helps to control pollution and saves valuable wood fiber.
Bleaching is one phase of paper manufacture in which there seems to be a tendency to increase the amount of water used. The savings resulting from using less chemicals to produce more and better quality material from a given amount of unbleached pulp generally more than offsets the costs of the extra water used.
Among the better examples of water-requirements data pub lished by industry are the results of a survey undertaken in 1939 by the Technical Association of the Pulp and Paper Industry. They reported considerable variation between the maximum and mini mum values of water used per ton of product. (See table 2. ) The maximum amount of water used in producing a particular kind of pulp is 10 times the minimum. The amounts of water used in bleaching pulp appear to be more variable, with maximum amount used per ton being more than 13 times as great as the minimum. Water use in paper manufacture is even more variable, the maxi mum being about 18 times the minimum even in the making of similar products. The following data on water use were obtained for mills known to be using closed systems that result in conser vation of water.
Gallons per too
150-ton per day book and bond mill with 60-ton per day soda mill, 20-ton per day de-inking system, and 100-ton per day bleach plant............... 50, 000

24 WATER REQUIREMENTS OF SELECTED INDUSTRIES
Gallons per ton
White wrapping and specialty-paper mill, includingsulfate-pulp mill and bleach plant........................ 75, 000
Dried bleached sulfite mill (for rayon) ..... ......... ...200, 000140-tonper day book and bond mill with 50-ton per day
de-inking system and 100-ton per day bleach plant.............................................................. 53, 600
135-ton per day book and bond mill with 90-ton perday de-inking system........................................ 74, 000
Newsprint mill................................................... 6, 000600-ton per day newsprint mill, own pulp................ 25,000350-ton per day newsprint mill, own pulp................ 40, 000350-ton per day newsprint mill, own pulp................ 39,000
Table 2. Summary of 1939 survey of water requirements for production of pulp and papa;in gallons per ton
[After Tech. Assoc. of Pulp and Paper Industry (TAPPI) Mono. 1, 1942]
Kind Maximum Minimum Average
Numberof mills
insample
Pulp
Sulfite, pulp only:
Sulfite, news grade used at mill to make paper:
Sulfite book, waxing, wrapper, bond, catalog, and hanging grades and converted at mill into paper:
Soda pulp converted at mill into paper:
Kraft (sulfate) pulp:
12,80050,000
62,000133,00092.000
57,000
60,00083,10041,600
34,00080,00040,000
57,00093,00067,000
4,0005,000
40,00070,00050,000
27.500
30 , 00070,00039,000
20,00036,00012.700
11,00091,6005,000
28,800
92,00075,720
39,30075,100
58,000
34, 600
37
266
3
543
363
623
Paper
Paperboard:
Bonds and other papers:
Book; Coating, stock, catalog, magazine, directory.. Kraft (sulfate):
Wrapping, bag, liner, corrugated, boxboard, e
12,00040, 00016, 00030, 500
170,00090,000
84,700170,00050,00033,000
8756,6002,0006,700
12,2005,000
15,00027,0008,0009,500
15,000
25, 600100,000
42,50027,750
36,10084,25029,00022,000
27251
910
5458

PULP AND PAPER INDUSTRY 25
Table 3. Use of makeup water, by operations, in a newsprint mill using 10 percent sulfite pulp, in gallons per ton of finished paper
[After TAPPI Mono. 1, 1942]
Distribution Water use (gal per ton)
Woodyard: Conveyor lubrication..............................
Coarse-screen room:Two hoses........................................................Bearing pump, gland seals, and cooling water.........
Total...........................................................
Fine-screen room:Sulfite screen showers.........................................Oliver shower ...................................................Sluicing tailings and seals on hosing pump..............
Total...........................................................
Machine room (two 245-inch machines):Voith screens, cylinder showers ............................Eccentric lubrication..........................................Bearing lubrication............................................Flat screen shower.............................................Foam showers...................................................Dandy showers..................................................Deckle squirt, bearing cooling, gear-box cooling.....Breast roll shower..............................................Sweat drier, reel cooling, calender-bearing cooling . Vacuum-pump priming.......................................Jordan and compressor cooling..............................Hosing............................................................
Total...........................................................
Wood room (drum barking):Bark sluicing....................................................Sewer sluicing..................................................Bearing lubrication............................................
Total...........................................................
Ground wood mill:Press water makeup............................................Bearing cooling.................................................
Total...........................................................
Blow pits:Gas cooling......................................................Wash water......................................................Sluicing brown stock..........................................
Total...........................................................
Acid plant..........................................................
Laboratory and washrooms......................................
Boiler makeup.....................................................
Transformer cooling..............................................
Grand total...................................................
280
470230
700
1,900280620
2,800
400140380
20560560120460200600930230
7,600
4,2002,600
400
7,200
90410
500
3003,1001.700
5.100
740
140
140
2,300
27,500
341091 0-55-5

26 WATER REQUIREMENTS OF SELECTED INDUSTRIES
A 180-ton per day boxboard and paperboard specialty mill re duced its effluent to less than 600 gallons per ton of product. This would indicate that the process water use would be about 1, 100 gallons per ton.
The use of water for various operations in a newsprint mill showing a rated capacity of 310 tons per day and using 90 percent groundwood pulp and 10 percent sulfite pulp is shown in table 3.
Data from the report "Water in Industry" (Natl. Assoc. Manu facturers and Conservation Foundation, 1950) are shown in table 4. Some of their data were taken from earlier publications and some were obtained by questionnaires sent to selected manufacturers in the United States.
Table 4. Water required for production of pulp and paper
[From Water in Industry, 1950]
Product
Do..........................................................Unbleached sulfate pulp......................................Bleached sulfate pulp..........................................
Soda pulp and bleaching......................................
Do........................................... ......... ..Paperboard.....................................................
Do........................................................ ..Do........................................ ...... .. .
Water use (gal per ton)
70,00064, 00035, 00053,00085,00060,00053,00060,00080,0007,692
15.36090,000
WISCONSIN PULP- AND PAPER-MILL WASTE SURVEYS
The Wisconsin Board of Health in cooperation with the industry conducts annual surveys of the effluents of nearly all of the pulp and paper mills in the State. The mills are described only by code number, but the type of product from each mill is available. The waste flows measured for these surveys do not include all the water entering the mills. However, it seemed possible that these effluent values could be converted to values of total water use that would be reasonably representative. After conferring with Mr. T. F. Wisniewski of the Wisconsin Board of Health and with others, it was decided that the effluent values obtained in the sur veys could be converted to the approximate total water require ments, first by increasing them 30 percent (10 percent for mis cellaneous losses and 20 percent for cooling) and then by adding to these arbitrarily increased values a fixed amount to compensate for waste flow from the woodyard and evaporation. For paper

PULP AND PAPER INDUSTRY 27
Table 5. Computed unit water requirements, in gallons per ton, for pulp and papermills in Wisconsin
[Based on 1949 survey by the Wisconsin Board of Health]
Millno.
Effluentper ton
of product
Effluentplus
30 percent
Evaporationand
barking
Totalwater
requirements(computed)
Extremes andratio of
extremes of totalwater requirements
Book mills
12345
189
Mean
13, 36810,25313,0448,180
16,592iz, ooy 11,3277,7077,825
11,218
17,36013,32016,97010,62021,58016,470 14,72010,02010,17014.600
460460460460460460 460460460460
17,80013,80017,40011,10022,00016,900 15,20010,50010.60015,100
Maximum = 22,000
Minimum = 10,500
MaximumMinimum
Tissue mills
1011121314 1516171819
Mean
45, 12418,09828,38612.52821,448 28,33414,45413,95817,82833,97023,413
58,60024,80036,80016,30027,800 36,80018,80018,20023,20044,10030,400
460460460460460 460460460460460460
59,10025,30037,30016,80028,300 37,30019,30018,70023,70044,60030,900
Maximum = 59,100
Minimum = 16,800
Maximum e 3 5 Minimum
Wrapping mills
20 21 22 23 25 26
Mean
21,918 25,572 12,881 9,040
15,083 15,17716.612
28,440 33,200 16.7JOO 11,750 19,560 19,70021,600
460 460 460 460 460 460460
28,900 33,700 17,200 12,200 20,000 20,20022,100
Maximum = 33,700
Minimum = 12,200
Maximum 9 flMinimum
Bond mills
28 29 30 31 32 33
Mean
25,000 21,555 13,596 15,546 8,077
14,41316, 698
32,500 28,000 17,800 20,200 10,500 18.75022,100
460 460 460 460 460 460460
33,000 28,500 18,300 20,700 11 , 000 19,20022,600
Maximum = 33,000
Minimum * 11,000
Maximum q n
Minimum
Glassine mills
343536
Mean
75,55353,69628,32152,523
98,10069,80036,80068,200
460460460460
98,60070,30037,30068,700
Maximum = 98,600Minimum = 37,300Maximum . 0 gMinimum *"
Board mill
37 6.964 I 9.040^ 460 9.500
38 43.622 56,700
Black wadding mill
1 460 | 57,200

28 WATER REQUIREMENTS OF SELECTED INDUSTRIES
Table 5. Computed unit water requirements, in gallons per ton, for pulp and paper mills in Wisconsin -Continued
Mill no.
Effluent per ton
of product
Effluent plus
30 percent
Evaporation and
barking
Totalwater
requirements (computed)
Extremes andratio of
extremes of total water requirements
Rag and de -inked pulp mills
3940414243
Mean
81,87018,49740,964
127,45016,91657,139
106,00024,00053,200
165,00022,30074.300
106,00024, 00053,200
165,00022,30074,300
Maximum = 165,000
Minimum - 22,300
Maximum _ 7 ^Minimum
Kraft (sulfate) pulp mills
45 46 47 48
Mean
21,180 58,338 39,100
111,325
57,762
27,500 75,800 50,800
144,50075,000
500 500 500 500500
28,000 76,300 51,300
145,00075,500
Maximum = 145 , 000
Minimum = 28,000
Maximum 5 2Minimum
Sulfite pulp mills
495051525354555657585960616263
Mean
43,75031,46212,33064,96833,51954,89555,32385,32338,62314, 65541,66372,60578,27688,46638,695
50,304
56,90040,90016,00084,40043,50071,30071,900
111,00050,20019,00054,10094,400
102,000115,00050,300
65,500
270270270270270270270270270270270270270270270
270
57,20041,20016,30084,70043,80071,60072,200
111,00050,50019,30054,40094,700
102,000115,00050,600
65,800
Maximum i 115,000
Minimum = 16 , 300
Maximum _ -,Minimum
Groundwood pulp mills
64656669
Mean
5989,293
6821,136
2,927
78012,060
8901,480
3,800
270270270270
270
1,05012,3001,1601,750
4,070
Maximum = 12,300
Minimum = 1,050
Maximum i? -3Minimum
Semichemical pulp mills
70 71
800 85,062
1,040 110,600
270 270
1,310 111,000
Maximum i 111,000
Minimum = 1,310
Maximum _ ipcMinimum
Part of this variation may be due to a difference in process.

PULP AND PAPER INDUSTRY 29
mills, this required the addition of 460 gallons per ton of paper to take care of evaporation in the paper machine. For all pulp mills, the fixed amount added was 270 gallons per ton of pulp for barking for all kinds of pulp and an additional 230 gallons for sulfate pulp to allow for black-liquor evaporation.
The computed water requirements as well as the effluent data and the pertinent computations for the Wisconsin mills are shown in table 5. It would appear that the extreme unit water-use values obtained by this method would be closer to an average value than the actual extremes, because cooling water is one of the greatest variables in unit water requirements and it was estimated as a uniform, nonvariable percent of the effluent. The computed ratios of the maximum unit water use to the minimum in each classifi cation, as shown in the table are undoubtedly smaller than the actual ratios.
Even though these ratios as computed are probably too small, they vary over a considerable range. The median value of the ratios for the 10 product classifications for which ratios were developed is 4. 5. As the ratios are generally too small, the median would be proportionately small, and a more probable median value would be about 5. This means that the maximum unit water use for mills making a certain type of pulp or paper product under somewhat similar conditions in the same State is normally about five times as great as the minimum unit water use for a similar product.
WATER-USE DATA FROM OTHER SOURCES
The California Forest and Range Experiment Station supplied the following water-use values, including information in footnote:
_ Minimum water requirements p*oouct (gallons per ton)
Sulfite pulp:Unbleached...................................................... '40, 000Bleached.........................................................'TO, 000
Kraft pulp:Unbleached......................................................'SO, 000Bleached......................................................... '90, 000
Groundwood pulp ................................................. 10, 000
Industry requirements somewhat higher.
The National Council for Stream Improvement of the Pulp, Paper, and Paperboard Industry furnished the following infor-

30 WATER REQUIREMENTS OF SELECTED INDUSTRIES
mation regarding water requirements of the pulp and paper industry:
1. Kraft (sulfate) pulping requires 10,000 to 20,000 gallons per ton of pulp. One third of this amount can be salt water (presumably for cooling) and another third can be paper-machine overflow.
2. Bleaching of Kraft pulp requires 30, 000 to 50, 000 gallons per ton depending on the degree of bleach.
3. Paper and paperboard manufacture from pulp requires from 5, 000 to 15, 000 gallons per ton of paper.
RESULTS OF PRESENT SURVEY
During the summer of 1950, field offices of the Water Resources Division of the Geological Survey made preliminary inquiries into the amount of industrial water used per unit of finished product in manufacturing a great variety of materials. Many unpublished unit water-use values were obtained as a result of this survey. In the field of pulp and paper, 43 unit values of quantitative water use were collected. These data are listed in table 6. It is surmised that some of the values shown include only process water. This survey, like all the earlier surveys, indicated a great variation in the amount of water used in pulp and paper manufacture.
Most of the water-requirements data taken from the literature were presented with so little background information that it was not possible to determine whether the unit use of water in pulp and paper manufacture varied with the quantity of water available, the chemical or physical characteristics of the available supply, var iations of the standard processes, the productive capacity of the individual mills, or the techniques of different operators. Early in 1951, a survey of the water requirements and other related data was conducted at pulp and paper mills producing 11 percent of the total national output. The type of information collected from this survey has been described previously. All the data obtained were confidential and can be summarized and presented only in ways that will preserve the anonymity of the individual mills.
All of the water-use values obtained as a result of the 1951 surveys are listed in descending order in table 7. The corre sponding pulp or paper product is shown opposite each water-use value. The unit water use ranges from 2,200 to 184,000 gallons per ton, the maximum water use being about 84 times the mini mum. An overall evaluation of water use can be obtained from table 7.
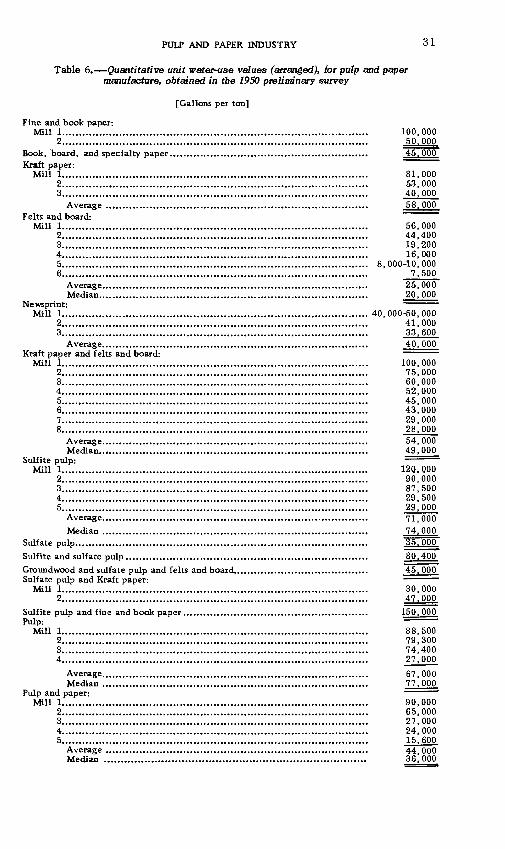
PULP AND PAPER INDUSTRY 3 1
Table 6. Quantitative unit wafer-use values (arranged), for pulp and paper manufacture, obtained in the 1950 preliminary survey
[Gallons per ton]
Fine and book paper:Mill 1........................................................................................... 100,000
2........................................................................................... 50. PCBook, Tjoard, and specialty paper........................................................... 45, OOPKraft paper:
Mill 1........................................................................................... 81,0002........................................................................................... 53,0003........................................................................................... 40,000
Average .............................................................................. 58,000Felts and board:
Mill 1........................................................................................... 56,0002........................................................................................... 44,4003........................................................................................... 19,2004........................................................................................... 16,0005........................................................................................... 8,000-10,0006........................................................................................... 7,500
Average............................................................................... 25,000Median................................................................................ 20,000
Newsprint: Mill 1........................................................................................... 40, 000-50, 000
2........................................................................................... 41,0003........................................................................................... 33.600
Average............................................................................... 40,000Kraft paper and felts and board:
Mill 1........................................................................................... 100,0002........................................................................................... 75,0003........................................................................................... 60,0004........................................................................................... 52,0005........................................................................................... 45,0006........................................................................................... 43,0007........................................................................................... 29,0008........................................................................................... 28,000
Average............................................................................... 54,000Median................................................................................ 49,000
Sulfite pulp: Mill 1........................................................................................... 120,000
2........................................................................................... 90,0003........................................................................................... 87,5004........................................................................................... 29,5005........................................................................................... 29,000
Average............................................................................... 71,000Median ............................................................................... 74.000
Sulfate pulp....................................................................................... 35.000Sulfite andsulfate pulp........................................................................ 80.400^Groundwood and sulfate pulp and felts and board........................................ 45,000Sulfate pulp and Kraft paper: ~
Mill 1........................................................................................... 30,0002........................................................................................... 47,000
Sulfite pulp and fine and book paper ....................................................... 150, OOPPulp: Mill 1........................................................................................... 88.5PP
2........................................................................................... 79, SOP3........................................................................................... 74.4PP4........................................................................................... 27.PPP
Average............................................................................... 67.PPOMedian............................................................................... 77.PPP
Pulp and paper; Mill 1........................................................................................... 9P.PPP
2........................................................................................... 65.PPP3........................................................................................... 27.PPP4........................................................................................... 24, POP5........................................................................................... 15.6PP
Average .............................................................................. 44, OOPMedian .............................................................................. 36.PPO

32 WATER REQUIREMENTS OF SELECTED INDUSTRIES
Table 7. Quantitative unit wafer-use values (arranged), tor the pulp and paper industry, obtained in the 1951 survey
[Gallons per ton]
Water used Product
184,000140,000133,000105,00092,00091,00087,00083,00082,00080,00075,00070,30070,00065,00055,00049,00048,00045,00045,00043,00041,00040,00038, 00038,00037,50036,40033,00031,00030,20026,20026,00025,00021,20020,00017,00016,00016,00013,00013,00011,0008,000
350600400400200900
*1,100
Fine paper from pulpwood.Book and fine paper from pulpwood.Paper from pulpwood.Book and fine paper from pulpwood.Sulfate pulp including byproducts plant.Tissue, napkin and towel from pulpwood.Paper and board from pulpwood.Finished paper (includes soda mill producing 50 percent of pulp used).Kraft paper from pulpwood.Sulfite pulp.Specialty paper from pulp.Finished paperboard.Book paper from pulpwood.Kraft paper from pulpwood.Sulfite pulp (2/3 to 3/4 bleached).Book and fine paper from pulpwood.Book and board paper from pulp.Kraft paper and board from pulpwood.Groundwood and unbleached sulfate pulp and paper.Sulfite bleaching.Kraft paper and board from pulpwood.Sulfite pulp.Sulfite pulp.Fine, book, and groundwood paper from pulp.Book and board paper from pulp.Kraft pulp.Coated opaque specialty paper from pulp.Kraft paper, board, bags from pulpwood.Kraft bleaching.Finished newsprint.Book and fine paper.Book, fine, and groundwood paper from pulp.Paperboard machine.Book paper from pulp.Kraft paper from pulp.Groundwood pulp.Sulfite-pulp byproduct production.Specialty paper.Specialty paper.Felts, wallboard, asbestos.Roofing and other felts.Groundwood pulp.Saturating felts.Newsprint machine.Paperboard from waste paper.Roofing felt.Paperboard from pulpwood.Insulation board.
*Water use given in gallons per thousand square feet.
Table 8 shows the variation in water use for similar pulp and paper products. Where sufficient data were available the median and quartile values were computed. Table 8 shows that for similar products the maximum unit water use appears to be about five times the minimum. The sample of pulp and paper mills in ventoried was too small to supply a sufficient number of unit water-use values to permit analysis of all categories.
The salient points of the data presented in tables 7 and 8 are shown graphically in figure 4. In the figure the median values of

PULP AND PAPER INDUSTRY 33
Table 8. Quantitative unit water-use values (arranged) for various specified pulp and paper products in gallons per ton
[Data obtained in 1951 surveys]
Product Water-ns* values
Fine and book paper................................... 1 184, 000'
1133,0001105,000
283,000170,000149,00026,00020,000
Book, board, and specialty paper.................. W.OOO'75,000 70,300 48,000
138,000 37,500 33,000 25,000 13,000.
Kraft paper............................................... 182,000165,OOQ ^5,00045,000
141,000 131,00017.00Q
Felts and board.......................................... 11,0008,000 6,600 2,400 2, 200
Tissue, napkin, and towel............................ 191,000Newsprint................................................. 26,200
Sulfite pulp.............................................. 80,000355,000 40,000 38,000.
Sulfate (Kraft) pulp.................................... 492,000]36.4001
Groundwood pulp....................................... 16, OOOl7,350]
Partial process values:Sulfite bleaching.................................... 43,000Kraft bleaching...................................... 30, 200Paperboard machine................................ 21,200Sulfite - pulp byproduct production.............. 16,000Newsprint machine................................. 3,400
Trom pulpwood.^rom half pulp and half pulpwood by soda process'From 2/3 to 3/4 bleached.Includes byproduct plant.
3rd quartile = 135,000Median => 85,0001st quartile = 43,000
3rd quartile z 72,000Median = 40,0001st quartile = 31,000
3rd quartile = 60,000Median = 44,0001st quartile = 34,000
3rd quartile = 8,800Median = 5,9001st quartile = 2,400
3rd quartile = 68,000Median = 48,0001st quartile - 39,000
Average = 64,000
Average = 12,000
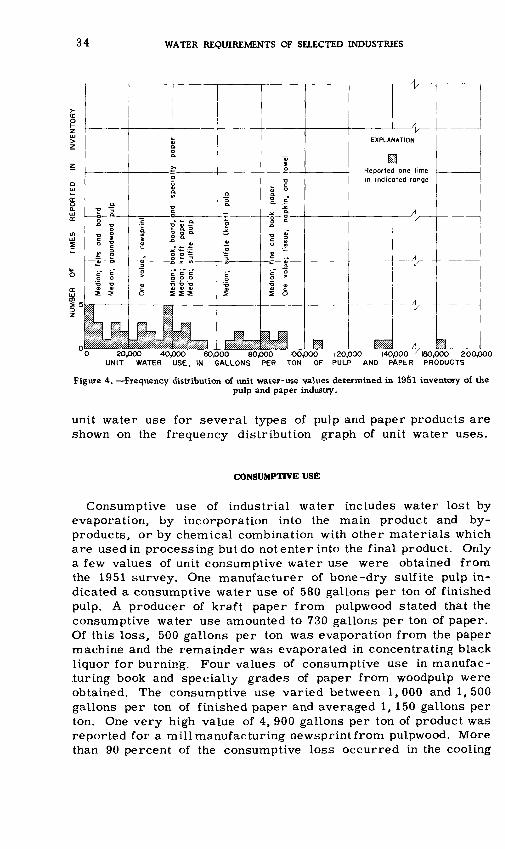
34 WATER REQUIREMENTS OF SELECTED INDUSTRIES
NUMBER OF TIMES REPORTED IN INVENTORY
O 01
a."° ~3
I 1
c* c o .9 o "o
ki
a.a a.
0
a.
a c
1 ilii 2 aC »- *-
"i jc 1o ;
JfcJ
i O O
i "D TO
( 5 5
J
a.
"5
f
_^^^
1
w c
Q. fc
a. .5
a §
.. 3
a a,
1 6
V
A
EXPLANATION
Reported one time in indicated range
AV
A
A
A3 20,000 40,000 60,000 B0000 lOOjOOO 120,000 140000 v 180,000 200,000
UNIT WATER USE, IN GALLONS PER TON OF PULP AND PAPER PRODUCTS
Figure 4. Frequency distribution of unit water-use values determined in 195l inventory of thepulp and paper industry.
unit water use for several types of pulp and paper products are shown on the frequency distribution graph of unit water uses.
CONSUMPTIVE USE
Consumptive use of industrial water includes water lost by evaporation, by incorporation into the main product and by products, or by chemical combination with other materials which are used in processing but do not enter into the final product. Only a few values of unit consumptive water use were obtained from the 1951 survey. One manufacturer of bone-dry sulfite pulp in dicated a consumptive water use of 580 gallons per ton of finished pulp. A producer of kraft paper from pulpwood stated that the consumptive water use amounted to 730 gallons per ton of paper. Of this loss, 500 gallons per ton was evaporation from the paper machine and the remainder was evaporated in concentrating black liquor for burning. Four values of consumptive use in manufac turing book and specialty grades of paper from woodpulp were obtained. The consumptive use varied between 1, 000 and 1, 500 gallons per ton of finished paper and averaged 1, 150 gallons per ton. One very high value of 4, 900 gallons per ton of product was reported for a mill manufacturing newsprint from pulpwood. More than 90 percent of the consumptive loss occurred in the cooling
PULP AND PAPER INDUSTRY 35
towers, which take care of all the cooling for this mill. The con sumptive use of water in the pulp and paper industry is usually so small in comparison with the total use that it is difficult to evaluate it by measuring the incoming and outgoing water. A more accurate estimate probably can be made by analyzing the process. In making paper about 460 gallons of water is evaporated for each ton of paper manufactured. In addition, about 230 gallons of water is evaporated in the recovery of chemicals used in the manufacture of a ton of sulfate pulp. Some pulp is shipped with a large moisture content to avoid the cost of drying it thoroughly. This results in a rather large consumptive use at the pulp mill. If pulp is thoroughly dried, a large percentage of water is evaporated. If pulpwood is quite green and full of sap, it is possible that the waste water may be greater than the water entering the plant.
Because so much water is needed to manufacture paper eco nomically, the consumptive use generally fades into insignificance and at present is of little importance.
QUALITATIVE WATER REQUIREMENTS
PERTINENT CHEMICAL AND PHYSICAL CHARACTERISTICS
Natural waters are almost never pure. Even water falling as rain contains dissolved gases and dust removed from the atmos phere. In passing over and through the ground as it travels toward the sea, water picks up additional material in suspension and solution, and impurities become more concentrated by evapo ration. Industrial pollution adds to the suspended and dissolved solids. A discussion of various substances contained in water and the characteristics affecting water quality with particular refer ence to pulp and paper manufacture is contained in the following paragraphs.
Turbidity. Turbidity in water is a result of the presence of finely divided particles such as clay, silt, sand, or organic mat ter. Turbidity is measured by visual comparison with a standard solution of suspended silica which has been obtained from some special material such as fuller's earth. Values for turbidity therefore are expressed as parts per million of silica (SiO2 ). Turbidity in water causes a loss of brightness and darkens the color of white or tinted paper.
Color. The term color as used in water analysis refers only to material dissolved in the water and not to the appearance pro duced by the suspended matter. Many turbid waters that appear yellow, red, or brown are practically colorless after the sus pended matter is removed.

36 WATER REQUIREMENTS OF SELECTED INDUSTRIES
Generally, color is due either to natural organic material or industrial waste and sewage. Organic or colloidal iron may also contribute to amount of color present. The color determination is based on a comparison with colored discs calibrated to equivalent scale of solutions of platinum-cobalt salt which for convenience has been chosen as an arbitrary standard. Although a unit of color corresponds to the coloration produced by an equivalent unit of platinum-cobalt salt in solution, it is customary to report the re sults directly in parts per million without further reference to the standard used.
The color may be absorbed by the cellulose fibers or it may cause a loss of brightness in a white or light-colored finished paper. If the color is caused by organic matter it often contributes to the formation of slime.
Hardness. For practical purposes, hardness of water is caused almost entirely by the presence of calcium and magnesium com pounds. For convenience, hardness is expressed in units of cal cium carbonate (CaCO3 ). Hardness may be of two types, namely carbonate hardness, comprising carbonate and bicarbonate of magnesium and calcium; and noncarbonate hardness consisting of chloride, sulfate, and nitrate salts of magnesium and calcium. Because of low solubility, calcium and magnesium carbonate precipitate when the water is heated and therefore tend to form scale on the screens, Fourdrinier wire, condensers, pumps, re- circulating systems, and other equipment. The scale may be re moved by using acid but this practice is damaging to the equipment. Calcium carbonate in alkaline bleach tanks forms a colored scale that breaks -off in chunks and contaminates the pulp. Hardness re acts with resin size toform insoluble products that are objection able because they waste size, add to the ash content of the pulp, and contaminate the final product. Hardness forms insoluble salts with the resins that are produced in pulping; these salts are particularly objectionable in the case of alpha-cellulose pulps such as those used in the making of rayon and plastics.
Alkalinity. Alkalinity is caused by the presence of carbonates and bicarbonates (or hydroxides) in the water. Alkalinity adds to the cost of papermaking because alum is used to precipitate the size and sufficient alum must be added to neutralize the alkalinity before it can have an effect on the size.
Iron and manganese. Iron and manganese are considered together as they are very similar in their behavior. Cellulose will adsorb iron from dilute solutions, causing white pulp and paper to become yellow and colored paper to become dull. In bleaching, manganese is oxidized to form a permanganate, which produces a pink color.

PULP AND PAPER INDUSTRY 37
Oxides of manganese form in various places and may clog pipes. Iron in solution may sustain certain kinds of bacteria that utilize the iron in their life processes. Such bacteria produce a trouble some growth of slime and result in deposition of iron oxides in tubercles.
Silica. Silica (SiO 2 ) is an undesirable constituent in water for pulp manufacture as it adds to the ash content of the pulp. If pulp aluminum and silica are present in the black-liquor system of a sulfate-pulp mill, a type of scale harder than glass will develop in the multiple-effect evaporators and heaters.
Carbon dioxide. Free carbon dioxide is objectionable because of both the corrosive action resulting from the lowering of the pH of the water and the physical effect it may have on the paper. Free carbon dioxide in amounts exceeding 25 ppm may adversely affect sheet formation on the paper machine.
Other constituents. Ordinarily, insofar as the paper itself is con cerned, the chloride content is not particularly significant except that a large amount of chloride may be indicative of excessive mineral content. However, chlorides, if present beyond certain amounts, are objectionable for other reasons. First, waters con taining chlorides are corrosive to metal, thus increasing main tenance costs. As the presence of iron in very small amounts affects the quality of fine papers, there may be further objection to chlorides if the corrosion resulting from them adds iron to the water. Secondly, the presence of large amounts of chloride ag gravates foaming in sulfate pulping.
Water to be used in the manufacture of paper food containers must be free of contaminating bacteria. Tastes and odors may be carried over into the paper unless they are eliminated from the process water. Sufficient oxygen may be present in natural waters to make it unusually corrosive. Even very small amounts of radioactive substances in the water are undesirable in making paper for photographic products.
Hydrogen-ion concentration (pH). A measure of the degree of acidity or alkalinity of a water is an index of its corrosive properties. Cor rosion results in damage to the metal parts of the machine, and in the addition of iron to the water, which results in discoloration of the paper. The numerical measure of this acidity or alkalinity value is the pH which is the negative logarithm of the hydrogen-ion concentration expressed in grams per liter. A neutral water has a pH of 7. 0. The pH of most natural waters ranges from 6. 0 to 8. 0. Values decreasing below 7. 0 denote increasing acidity, whereas values progressively higher than 7. 0 denote increasing alkalinity.

38 WATER REQUIREMENTS OF SELECTED INDUSTRIES
Swamp drainage may contain considerable amounts of organic acid and generally has pH values below 6. 0.
SCALE AND CORROSION
The pH is closely related to other factors in determining the corrosiveness of a water and may be of considerable importance. A thin layer of calcium carbonate scale deposited from the water protects the metal from corrosion. Too much scale formation is undesirable, but no scale formation leaves the metal unprotected from corrosion. This tendency toward corrosion or scale forming is dependent on a combination of conditions including the pH, calcium-ion concentration, dissolved-solids concentration, alka linity, and temperature. The pH at which a water is neither scale forming nor corrosive is known as the pH of saturation, which varies with the other factors indicated above. If the pH is above this value, the water is capable of forming a CaCO 3 scale; if the pH is below this value, the water will not form a scale but will tend to dissolve CaCO 3 scale already formed and then corrode the exposed metal. The pH of saturation is an equilibrium condition in the water, at which the water is just saturated with CaCO3 . Both scaling and corrosion are problems in the papermaking machines because the water is heated and evaporated.
Scale formation partially seals the Fourdrinier screen on which the paper is formed, which results in slower operating speed and eventual shutdown to clean the screen.
Scale and corrosion present special problems in steam boilers. Corrosion may result in rupture of the metal of which the boiler is composed, with a resultant shutdown. Boiler scale may form an insulating layer at points of high heat input. If the layer of scale were thickened indefinitely it would be necessary to de crease the boiler output to the point where excessive heating of the metal of the boiler did not occur. Excessive heating of the metal results in lower boiler efficiency and the possibility of weakening the metal to the point of damage. Scale may also form on the superheater tubes and in the steam turbines of the power- plant. These deposits usually are caused by the deposition of water-soluble salts that are mechanically entrained in the steam. Calcium and magnesium salts are usually the basic ingredients of this scale, but if silica is also precipitated, the scale is much harder, more tenacious, and more difficult to remove.

PULP AND PAPER INDUSTRY 39
WATER-QUALITY STANDARDS
Quality standards for water vary according to intended use. Water used in the manufacture of pulp and paper is divided into four basic groups: process, boiler feed, cooling, and general purpose.
PROCESS WATER
Tentative quality standards for process water used in the manu facture of certain kinds of pulp and paper have been set up by the Technical Association of the Pulp and Paper Industry. The speci fications concerning different pulp and paper products have been adopted at different times by the association. Collectively, they cover somewhat more than 50 percent of the tonnage of both pulp and paper. The tabular data are summarized in table 9, and the
Table 9. Specifications for chemical composition of process water for manufacture ofvarious pulps and papers
[From tentative standards established by the Technical Association of the Pulp and Paper Industry. These specifications should be considered only as a guide in determining the quality of water needed for manufacturing the pulps and papers indicated. Maximum allowable amounts in parts per million]
Constituent or property
Color.......................................Total hardness as CaCC^... ...........
Magnesium hardness as CaCCv ......
Silica (SiOz)...... ........................
Chloride (Cl)3 .. .........................
Soda and sulfate
pulps1
Z25 5
100 50 50 75
.1
.05 20
250 10 75
Groundwood paperl
250 30
200
150 .3 .1
50 500
10 75
Kraft (sulfate) paper
Bleached
40 25
100
75 .2 .1
50 300
10 200
Unbleached
100 100 200
150 1.0 .5
100 500
10 200
Finepaper
10 5
100 50
75 .1 .05
20 200
10
2.0
*Not applicable to groundwood paper made from southern pine. 2Materials causing turbidity must not be gritty.^Limits for chloride are for the purpose of decreasing corrosion in the metal parts of the man
ufacturing system. For fine paper the chloride is limited by the maximum for dissolved solids.
descriptive matter included in the specifications has been con densed in the following paragraphs. Necessarily, some of these specifications have been discussed in the section dealing with the chemical and physical characteristics of water.
Color, iron, and manganese are kept low because of their tend ency to be absorbed by and lessen the brightness of the product. Calcium and magnesium compounds are maintained at low concen-
40 WATER REQUIREMENTS OF SELECTED INDUSTRIES
trations in pulp manufacture because of their tendency to form scales on the equipment and precipitates on the pulp where water comes in contact with the highly alkaline chemicals used in process. Silica is kept low because of its tendency to be absorbed by the pulp and paper and increase their ash content, and, in pulp manufacture, because of its possible tendency to aggravate scaling in the evaporators and to interfere with the settling of the white liquor.
Limits for organic materials were not included because the nature of the organic material is a controlling factor. For some types much higher limits may be permitted than for others. The specifications for color have a limiting effect on the more ob jectionable types of soluble organic matter. In general, organic materials are kept as low as possible in process water. Limits for pH are not included since the desirable range for pH depends to a large extent on the type and quality of the products being made, the composition of the water, and the condition of the operation.
Water of less purity than that specified for pulp manufacture may be used if the pulp receives a final corrective treatment.
Certain special papers such as facial, cigarette, filter, photo sensitive papers, and capacitor tissue may require process water of a purity greater than that specified.
A survey of quality of waters used for processing in the pulp and paper industry was conducted by the Technical Association of the Pulp and Paper Industry in 1939. If the water received any treat ment analyses were made of the treated water.
BOILER-FEED WATER
The problem of supplying satisfactory boiler-feed water is more complicated than that of supplying satisfactory process water. The pulp and paper industry has a boiler-plant capacity which is second in size only to that of the public utilities. There are two reasons for this large boiler-plant capacity: (1) a great deal of process steam is used in the production of pulp, and a large amount of steam is used for heat in paper production; and (2) most pulp and paper mills find it economical to produce their own electric power, because of the high cost of an occasional failure of purchased power. Boiler-feed water at pulp and paper mills equals 25 to 50 percent of steam production, depending on the amount used for process steam that is not returned.

PULP AND PAPER INDUSTRY 41
Proper treatment of boiler-feed water for large installations is so important that special consultants are generally employed on a continuing basis to revise boiler-feed-water treatment currently to keep abreast of the changing quality of the raw water. The purpose of feed-water treatment is to reduce to a minimum the combined cost of water treatment and the maintenance and replacement of steam-making and steam-us ing equipment.
Most of the troubles from unsatisfactory boiler-feed water occur in the steam boiler. Although the boiler contains no moving parts, it is subject to corrosion, caustic embrittlement, and scale for mation as previously discussed. Some boiler-water impurities precipitate as a sludge, and other salts, which are extremely soluble, remain in solution. Most of these are chemically active. The concentration of soluble salts and sludge is kept within allow able limits by periodic or continuous blowoff of a part of the water circulating in the boiler.
A perfect boiler water which would eliminate the difficulties just described is not ordinarily available. An analysis of such an ideal boiler water (TAPPI Mono. 1) is shown in table 10. This ideal
Table 10. Chemical and physical characteristics of an ideal boiler water
[Adapted from TAPPI, Mono. 1]
Hardness.............................................................ppm.. 0Sodium chloride...................................................ppm.. 0Sodium sulfate.....................................................ppm.. 0Silica ................................................................ppm.. 0Sodium hydroxide.................................................ppm.. 40Suspended matter .................................................ppm.. 0pH........................................................................... 11,0Slight excess of reducing chemicals. Sufficient embrittlement inhibitor.
water could be obtained most easily by distillation and subsequent treatment. This is practical only if the boiler feed is less than five percent of the steam output and then only in high-pressure boiler systems.
The chief objectives of boiler-water treatment are the removal of suspended matter and the prevention of caustic embrittlement, corrosion, and scale formation. A brief description of the treat ments employed follows.
Suspended matter may be removed by any combination of screen ing, sedimentation, coagulation, and settling. At most mills this part of the treatment is a joint operation with the process water, cooling water, and general-use water. Treatment for these pur poses usually provides for the removal of iron, manganese, color,
42 WATER REQUIREMENTS OF SELECTED INDUSTRIES
and other substances which otherwise would have to be removed in the boiler-water treatment process.
Caustic embrittlement usually is the result of an excessive con centration of salts at a point of mechanical stress which may re sult in a break in the boiler. This condition is controlled by suit able feed-water treatment and blowoff.
The principal scale-forming impurities in water are calcium, magnesium, and silica. The treatment of boiler-feed water can be divided into two broad general classifications: internal and ex ternal. Internal treatment of boiler water to prevent scale for mation consists of adding chemicals directly to the boiler to pre cipitate the scale-forming materials as a sludge, in whichformthey can be flushed from the boiler. Sodium carbonate and sodium phosphate are most frequently used for this purpose. It is gener ally more economical to soften boiler-feed water by external treatment before introducing it into the boiler. This may be done by the use of lime, sodium phosphate, or zeolites. Sodium zeolite is a solid substance of .a complex chemical structure with the unusual property of exchanging its sodium ions for calcium or magnesium ions. This property makes it possible to remove the calcium and magnesium ions from water which is passed through a bed of granular zeolite, replacing them with sodium ions. When all the sodium in the zeolite is replaced by calcium, the zeolite may be regenerated by the use of a solution of common salt. The cal cium is replaced by sodium, and after washing, the zeolite bed is again ready for use. Similarly, hydrogen zeolite exchanges hy drogen for the metallic cations. The exhausted zeolite is re generated with inorganic acids, and the hydrogen zeolite is ready for washing and reuse. The hydrogen zeolite method results in an acid water because of the free acids formed in the exchange, and the water must be neutralized before it is used for boiler feed. By comparison, the feed water resulting from the sodium zeolite softener has essentially the same pH as the incoming water. Sodium zeolite and hydrogen zeolite are sometimes used in parallel as a means of reducing the alkalinity of the final water. The flow from the two units is mixed in proper proportions to give the de sired alkalinity.
Corrosion in a boiler may be caused by dissolved gases, elec trolytic action, acidity, and corrosive salts. Dissolved gases, particularly oxygen, are the more common cause of boiler cor rosion. Oxygen generally is removed by treating the water in a de- aerating heater just before it enters the boiler. The oxygen re moval is based on the fact that very little dissolved oxygen can be retained by water at high temperatures. The general practice is to follow the deaerating heater by chemical treatment with sodium

PULP AND PAPER INDUSTRY 43
sulfite to remove the last traces of oxygen and to react with any oxygen from the air that may subsequently get into the system. Carbon dioxide also causes corrosion in the boiler and is en trained with the steam, causing further corrosion troubles in the condensate lines. Carbon dioxide also may be removed in the deaerating heater.
Electrolytic action in boilers may be caused by stray electrical currents from poorly insulated circuits or from impurities in the boiler metal. Its prevention is therefore a matter of boiler-plant construction.
Acidity should never be present in boiler water. Water which is acid before or after treatment requires neutralization before use as boiler feed. Corrosive salts are those which at boiler temperatures decompose to form an acid. Magnesium chloride is an example of this type of salt. It decomposes and forms hydro chloric acid. Corrosion due to these salts is prevented by re moving the salts as completely as possible before entering the boiler and by maintaining sufficient alkalinity in the boiler to neutralize any acid that may be formed.
COOLING WATER
The pulp and paper industry requires large quantities of high quality water for process purposes, and mills have been located to meet this requirement. Therefore, pulp and paper mills gen erally have available cooling water of good quality.
Cooling water may be obtained from either fresh- or salt-water sources. The use of salt or brackish water for cooling involves many factors which will not be discussed in detail here. In gen eral, the use of sea water presents difficulties with sea growths, deposition of shells, and many problems resulting from excessive corrosion. Heavy chlorination with chlorine residuals up to 0. 7 ppm for short periods several times a day is advisable to control shellfish growth. The use of salt water for cooling is economically justified in many cases.
Cooling systems are subject to corrosion and to stoppage be cause of accumulation of scale, corrosion deposits, sediment, and organic growths. Treatment of the cooling water to reduce these conditions may be necessary.
There are three types of cooling systems, once-through-to - waste, once-through-to-other-use, and recirculating.

44 WATER REQUIREMENTS OF SELECTED INDUSTRIES
Cooling water that is used once-through-to-waste is given a minimum amount of treatment. Some cooling waters may not fe- ceive treatment except screening to remove coarse suspended matter where necessary. Other cooling waters used in the once- through-to-waste system may require chemical treatment; chlo rination probably is the most common. Chlorination generally is advisable both for surface and ground water to prevent the growth of slimes, and iron or manganese bacteria. One treatment for scale prevention consists of adding sulfuric acid in small amounts to convert some of the carbonates to sulfates. The prevention of scale is based in part on the fact that the calcium and magnesium sulfates formed are much more soluble than the corresponding carbonates and hence will not precipitate as scale. The treatment is carried out under pressure to permit the retention of carbon dioxide which helps to hold the remaining carbonates in solution. Another scale-prevention treatment adaptable to the once-through- to-waste system is the use of polyphosphates which, even in very small dosages, are able to "sequester" or hold in solution con siderable quantities of calcium, magnesium, and iron, and thereby prevent their precipitation as scale. The polyphosphate method is not adapted to waters that are too alkaline or too high in pH, or to cooling operations where a large rise in temperature is contemplated.
In a once-through-to-other-use system, it generally has been found advisable to give the water the necessary treatment to meet the process requirements before the water enters the cooling system. The conventional water treatments, such as pH adjust ments, aeration of excess carbon dioxide, chlorination, softening, and removal of turbidity, iron, and manganese may be used. Such treated water is of excellent chemical quality for cooling purposes.
Recirculating systems use a water-cooling device, such as a cooling tower or spray pond, to lower the temperature of the water so that it can be reused. The makeup water that must be supplied to such a system is generally only a small percentage of the total water circulating; hence more complete treatment is economically feasible than in the once-through-to-waste system. In the pulp and paper industry, water is not generally treated as extensively for the recirculating system as for the once-through-to-other-use system. Chlorination is regularly practiced to control organic growths. Chlorination before use and before entering the cooling tower or pond has beenfound desirable. If a cooling pond is used, dosing with copper sulfate is sometimes necessary to control algae. To prevent scale formation, the treatment may be softening by either the lime-soda or zeolite methods or by addition of acids to convert carbonates to sulfates. Treatment with phosphates may be used bothfor scale prevention and corrosion control. Corrosion
PULP AND PAPER INDUSTRY 45
may be further reduced by pH and alkalinity adjustment to provide a protective scale coating under controlled conditions.
The recirculating system differs from the once-through systems because the water evaporates in the cooling towers and ponds, and the salts become more concentrated and may eventually deposit as scale or add to the corrosiveness of the water. For this reason a recirculating system must have a part of the circulating water re placed to prevent an excess concentration of dissolved salts.
To determine the effectiveness of water treatments in any cooling system, removable pieces of pipe may be installed in the cooling system to permit periodic removal and inspection.
GENERAL-PURPOSE WATER
Water purchased from a public supply is generally the most economical and satisfactory water for general purposes, including domestic supply. When a mill must provide its own general- purpose water, a satisfactory supply often can be obtained from ground water even if surface water is used for other purposes in the mill.
Quite often the mill furnishes potable water to a company town in addition to supplying itself. Ordinarily process water suitable for pulp and paper manufacture makes an excellent water for do mestic supply, except that the residual chlorine is much too high, generally about 2 ppm or three times a reasonable residual for drinking water. Process water makeup which is high in residual chlorine may be fitted for general-purposes use by dechlorinating with activated carbon or a reducing agent such as sodium sulfite or sulfur dioxide.
RESULTS OF PRESENT SURVEY
As many data as possible were obtained from the pulp and paper mills in regard to the chemical and physical characteristics of each source of water supply at all of the mills included in the 1951 survey. Some of the water analyses were supplied by the mills, and other analysis data were obtained from the published and un published investigations of the Geological Survey and other Federal and State agencies. The type of treatment, the percent of supply treated, and the use of treated water at each mill were listed. For purposes of publication these data are grouped without refer ence to individual use.

46 WATER REQUIREMENTS OF SELECTED INDUSTRIES
QUALITY OF UNTREATED WATER
Data were obtained regarding the following chemical and phys ical characteristics of the untreated-water supplies: Silica, alu minum, iron, calcium, magnesium, sodium, potassium, free car bon dioxide, carbonate, bicarbonate, alkalinity, sulfate, chloride, fluoride, nitrate, dissolved solids, total hardness, noncarbonate hardness, color, pH, specific conductance, turbidity, suspended matter, and temperature. Information regarding the physical and chemical characteristics was not available for many raw-water supplies, and only fragmentary data were available for others. The minimum, lower quartile, median, upper quartile, and max imum were determined for each constituent and characteristic. The number of samples, extremes, medians, and quartiles for each of these constituents and characteristics are tabulated in table 11.
Table 11. Statistical characteristics of available analyses of untreated water used in pulp and paper manufacture
[Quality of water expressed in ppm unless otherwise indicated. These are not balanced analysesand should not be used as such]
Constituent or
property
Silica (as SiCfe)....................
Free carbon dioxide (COfc)......
Sulfate (SQj).......................Chloride (Cl) ......................Fluoride (F)........................Nitrate (NOs) ......................
Hardness as CaCOs:
PH....................................Specific conductance (in
Average temperature (*F)......
Number of
samples
51154249492421
9 21445958143242
567
24
2949
1212
852
Minimum
1.0002.1.2
Trace00020000
18
00
(*>
24.6
53.7Trace
051
Lower quartile
5Trace
.02613.4.2
016
53.1.1
70
201013
46.7
951
Trace55
Median
6.5.05
15361.03.5 0
7018
6.2.3
140
552228
127.2
15041
58
Upper quartile
131.4.3
3411141.9
104
1503114
.52.2
240
12050
106
407.8
28012
764
Maximum
5611.22.6
11248
2257.3
2317
477366165
2.28.1
1,080
475150180
3609.4
838551789
Acidity, 17 ppm.
Frequency distribution charts for iron, dissolved solids, total hardness, color, pH, turbidity, and average temperature are shown in figures 5 and 6.

1.0 1.2 1.4 1.6
IRON (Fe), IN PARTS PER MILLION
EXPLANATION
Reported one time in indicated range
150 200 250 300 500 550
DISSOLVED SOLIDS, IN PARTS PER MILLION
60 260 280 K 48080 100 120 140 160 180
TOTAL HARDNESS AS CaC03, IN PARTS PER MILLION
Figure 5. Frequency distribution of chemical characteristics in available analyses of water supplies for the pulp and paper industry.

48
10WATER REQUIREMENTS OF SELECTED INDUSTRIES
EXPLANATION
Q.1U
0CLLLlQC
LLl 5
S1-
o
nc ucLLl OS
^
ijjjjhjm'tMMffim W,. w, Wk
Reported one time in indi cated range
) 10 20 30 40 50 60
TURBIDITY AS Si02 , IN PARTS PER MILLION
t55 60 65 70 75 80
AVERAGE TEMPERATURE AT INTAKE, IN DEGREES FAHRENHEIT90
Figure 6. Frequency distribution of physical characteristics in available analyses of water supplies for the pulp and paper industry.

PULP AND PAPER INDUSTRY 49
Great care is taken to eliminate abrasive material from water used for manufacturing printing paper so as to prevent excessive wear on the plates and cuts. Care is taken to avoid the use of process water containing radioactive material which might enter into the paper and damage sensitive materials which the paper might contact.
WATER TREATMENT
The many factors involved make it difficult to effectively analyze and compare the water-treatment methods used in mills producing different varieties of pulp and paper. Table 12 shows the water- treatment methods used for each product for individual plants.
Table 12. Number of palp and paper mills included in 1951 inventory using water- treatment methods listed
[Does not include prior treatment of purchased water]
Type of
treatment
Ion -exchange softening...
Hot lime -soda treatment.
Product of plant
Fine and book paper
3
6 6
2 6
3 3
Book, board,
and specialty
paper
1 11 5 5
6
2
1
Kraftpaper
4 1 2
3 5 1
4
4 1
11 1 1
Felts and
board
3 1
1 2
2 1 1 3
Tissue, napkin
and towel
.......
1
.......
News print
3 2 1 1 1 2
12
1 11
Sulfate (Kraft)
pulp
1
1
1
1 2 1
Ground - wood pulp
2
1
1
1
1
Sulfate bleaching
1 1
For example, all plants producing fine and book paper are grouped together, and each water-treatment operation practiced at all plants is indicated. Some of the treatment operations seem to overlap. For example, "screening" was interpreted to mean coarse screening (about 10 mesh to the inch). There are also categories for 60-mesh screening and 140-mesh screening. "Iron removal" means aeration and filtration in most instances. "Partial sodium removal" is generally an ion-exchange process. If a plant pro duced two or more types of products, the water treatment is tabu lated for each product. The water-treatment operation most fre quently used was filtration which was used by 23 mills. The second

50 WATER REQUIREMENTS OF SELECTED INDUSTRIES
most frequent was chlorination which was used by 21 mills. Sup plies for 13 mills received no treatment.
Every year more paper mills are using fungicides to control the growth of slime in the process water so that the water may be used several times before it is discarded.
FUTURE WATER REQUIREMENTS
Many factors enter into estimates of future water demands by the pulp and paper industry. A thorough understanding of these factors will permit estimates of total annual water requirements for many years in the future. A reasonably accurate estimate can also be made of how much water will be required for use at single pulp and paper mills of feasible size and in what sections of the country such plants probably will be constructed.
LOCATION
SOURCE OF RAW MATERIALS
Both pulp mills and paper mills require large amounts of water and must be located so that a cheap and abundant supply of water of suitable quality is available. Pulp and paper are low-unit-cost materials; transportation of both the raw materials and the finished
Table 13. Comparison of lour types of woodpulp
[Partly from Shreve, 1945]
Type of process
Soda..............
Grouttdwood.....
Sulfate...........
Kind of wood
poplar, birch, maple.
Soft, coniferous: spruce , balsam.
spruce most common.
southern pine, jack pine, spruce , balsam .
Location
some in N. C. and Tenn.
Northern U. S. , a little in the Gulf States.
Southern U. S. ,North and North west converting to sulfate.
Physical properties of
pulp
Short fibers, fairstrength, very soft and opaque.
Long, flexible, thin fibers, de terioration oc curs fairly rapidly.
strength, good color.
strength, vari able color.
Kind of paper
produced
Books and magazines,some absorbent papers.
Newsprint, wallpaper, wrapping paper, boxboard, wallboard.
rayon production.
Kraft papers of allsorts, wrapping paper, bags, and container board; bleached now available.
PULP AND PAPER INDUSTRY 51
product may be a large part of the cost to the consumer. The mills therefore generally are located close to a source of raw material or to a market, or to both if possible. Pulp mills gen erally are found in locations removed from population centers, but many paper mills are located close to diversified industries. The type of pulp that is produced in a particular mill depends in part on the varieties of pulpwood available, the time the mill was established or rebuilt, the facilities for waste disposal, and the type of pulp in local demand. The interrelation of these various factors may be seen from a study of table 13 which shows for each of the four principal types of woodpulp (1) the kind of wood from which it generally is made, (2) the location of the mills, (3) the physical properties of the woodpulp, and (4) the kinds of paper that generally are produced from it.
ECONOMICS OF MILL LOCATION
Ideally, pulp mills should be located at places where an adequate supply of suitable water is available and where the normal growth on surrounding forest lands will furnish an adequate supply of pulpwood without making inroads into either potential saw logs or immature trees. Similarly and ideally, paper or board mills should be reasonably close to reprocess or finished-product mar kets. At many places it is possible to manufacture both pulp and paper, but the amount of paper made is not necessarily equivalent to the pulp manufactured. A paper mill operated in conjunction with a pulp mill may use more or less pulp than the output of the pulp mill. The difference is shipped either into or out of the area.
The total investment in the pulp and paper industry in 1948 averaged about $17, 500 per employee. For the new, modern pulp and paper mills the investment per employee is much greater. Wakeman (1953) states that a modern integrated sulfate pulp and paper mill will cost about $70, 000 per employee. In view of this large investment per employee, the availability of an ade quate supply of suitable labor is generally secondary to other considerations.
Larger paper machines operating at greater speeds have neces sitated the employment of a larger technical staff, the cost of which is made feasible by the increased plant output. This is particularly true of the sulfate-pulp and kraft wrapping-paper mills which have recently been constructed in the South.
The pulp mills in operation at the present time include the survivors of the old plants, some of which were established to exploit large stands of virgin timber now exhausted, as well as
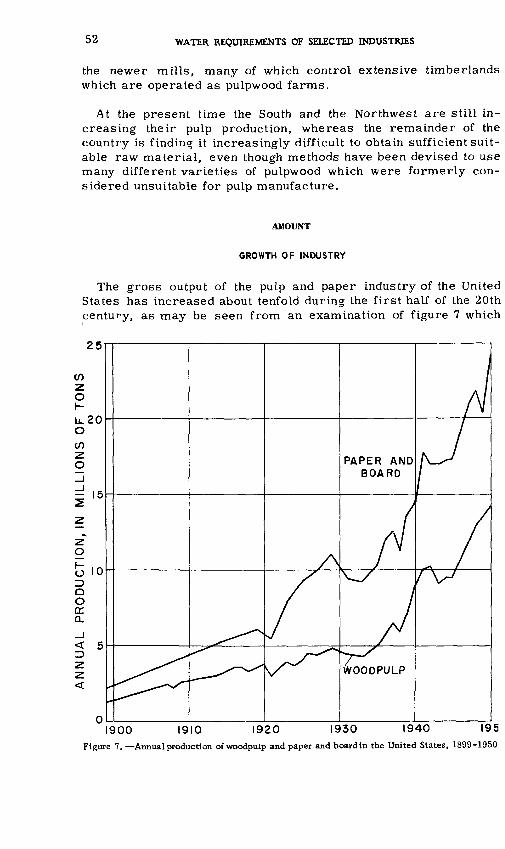
52 WATER REQUIREMENTS OF SELECTED INDUSTRIES
the newer mills, many of which control extensive timberlands which are operated as pulpwood farms.
At the present time the South and the Northwest are still in creasing their pulp production, whereas the remainder of the country is finding it increasingly difficult to obtain sufficient suit able raw material, even though methods have been devised to use many different varieties of pulpwood which were formerly con sidered unsuitable for pulp manufacture.
AMOUNT
GROWTH OF INDUSTRY
The gross output of the pulp and paper industry of the United States has increased about tenfold during the first half of the 20th century, as may be seen from an examination of figure 7 which
1900 1910 1920 1930 1940 195Figure 7. Annual prcxiuction of woodpuip and paper and boardin the United States, 1899-1950

PULP AND PAPER INDUSTRY 53
shows graphically the fluctuations of total annual production for the period 1899-1950. During this interval, the production of paper and board has about doubled every 15 years. There has
14
1900 1910 1920 1930 1940 1950
100
80
8 60
z 40
20
1900 1910 1920 1930 1940 1950
Figure 8. Quantity and percentage of woodpulp production, by process, in the United States,1899-1950.
54 WATER REQUIREMENTS OF SELECTED INDUSTRIES
been a definite tendency for production of paper and board and of woodpulp to follow general business conditions except that re cessions have been comparatively moderate, never exceeding 20 percent. This is probably because a rather large part of the total output is used directly or indirectly in food processing and dis tribution and therefore is not subject to as much fluctuation as most commodities.
Figure BA shows the quantity of woodpulp produced by various processes during the period 1899 1950, and figure 8B shows the percentage produced by each process. The relative quantity of each kind of pulp produced reflects the various phases through which the industry was passing, the changes in the geographical distribution of the industry, and the suitability and availability of the pulpwood supply. It also indicates the changing demands of the paper industry not only for total pulp but also for specific kinds of pulp.
Soda-pulp production increased moderately from 1900 to 1925 after which time the production in tons remained nearly constant, but the production as a percentage of the total woodpulp output de clined continuously. This was the result partly of a declining sup ply of broadleaf pulpwood and partly of the loss of markets to the sulfite and sulfate pulps. The increase in sulfite-pulp production was quite rapid from 1900 to 1920, after which time production increased rather slowly. The largest growth was in sulfate-pulp production, which started from a very small beginning in 1909 and grew to supply about 50 percent of the woodpulp market in 1950. This growth was due to the superior strength of the sulfate fibers and to the ample supplies of pulpwood suitable for this method of pulping, permitting the construction of very large sulfate mills. Only in the last 5 or 6 years have the miscellaneous woodpulps, such as those produced by the semichemical process, supplied a large part of the market.
As nearly all high-quality paper is made from pulp that is free of color, it is necessary to bleach the pulp that is used for this purpose. There is an increasing demand for bleached pulps, par ticularly in the sulfite and sulfate grades. Sulfite pulp is bleached more readily than sulfate pulp, therefore, more sulfite pulp is bleached. Only a little more than 20 percent of the sulfate pulp is bleached because a large part of it is used for strong brown paper. Figure 9 shows the percentage of sulfite and sulfate pulp that was bleached during each of the years 1935 50, inclusive. The decrease in the percentage of sulfite pulp bleached during 1941 and 1942 is probably the result of wartime austerity and was not considered in deter mining the trend. The proportion of bleached

PULP AND PAPER INDUSTRY 55
1935 1940 1945 1950 1935 1940 1945
Figure 9. Percent of pulp production bleached, 1935-50.
1950
to unbleached pulp is emphasized because considerably more water is used in producing bleached pulp than in producing unbleached pulp.
PRESENT CAPACITY OF MILLS
Pulp. Since pulpwood is found only where there is an abundant water supply, it is ordinarily possible to select mill locations in a forested area where there is a sufficient supply of water satis factory for paper manufacture. The newer mills are larger and have much more expensive equipment than the old mills. A suit able location for a modern pulp and paper mill must guarantee an adequate supply of pulpwood and vast quantities of suitable water.
The capacity of the woodpulp mills of the United States is shown in figure 10. Sulfite, sulfate, soda, and groundwood mills are shown separately. Where more than one kind of pulp is produced at the same location, each kind of mill is regarded as an inde pendent producer. Of the sulfite mills, those with a daily capacity of 100 tons are the most common, but the largest amount of sulfite pulp is made in the group of mills with a capacity of 250 tons per day. The capacity distribution of sulfate-pulp mills is quite uni form, apparently because of a tendency to increase the size of the mills during recent years. The average capacity of the 6 mills whose capacity is indicated as being more than 700 tons per day is about 1, 100 tons per day. This is more than 30 percent of the entire plant capacity of the Nation. In general, the larger sulfate mills are the more modern. There is comparatively little variation in the size of the soda-pulp mills. Groundwood-pulp mills with a 25-ton daily capacity are the most common, and mills with capac ity up to about 100 tons per day constitute three-fourths of the total number. No attempt was made to show the capacity dis tribution of the mills manufacturing other kinds of pulp. Table 14 gives the mean and median size of pulp mills for each of the four principal processes.

56 WATER REQUIREMENTS OF SELECTED INDUSTRIES
SULFITE-PULP MILLS
in o in o in o CM in K o CM in
SODA-PULP MILLS
I I I I I I I I I I I I I I I I I I
GROUNDWOOD-PULP MILLS
MILL CAPACITY, IN TONS PER DAY (Rounded to nearest multiple of 25)
Figure 10. Capacity of pulp mills in the United States, 1949.
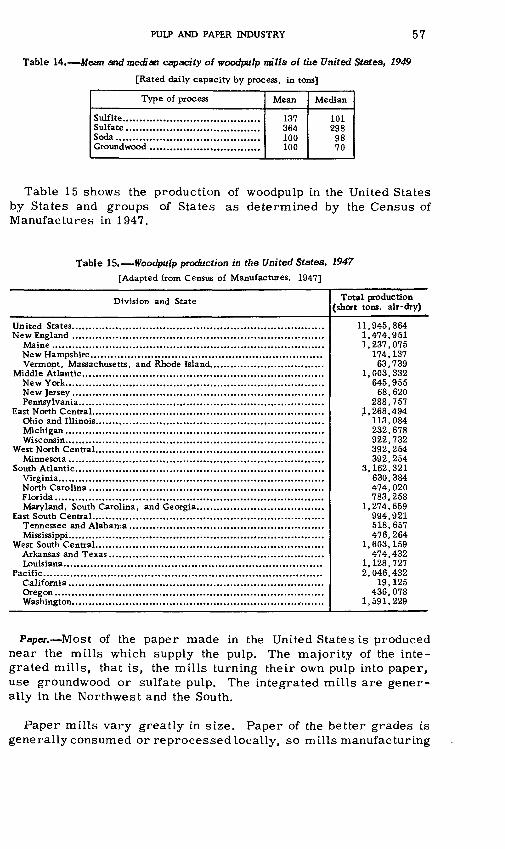
PULP AND PAPER INDUSTRY 57
Table 14. Mean and median capacity of woodpulp mills of the United States, 1949
[Rated daily capacity by process, in tons]
Type of process
Sulfite........Sulfate.......Soda..........Ground wood
Mean
137364100100
Median
1012989870
Table 15 shows the production of woodpulp in the United States by States and groups of States as determined by the Census of Manufactures in 1947.
Table 15. Woodpulp production in the United States, 1947
[Adapted from Census of Manufactures, 1947]
Division and State Total production (short tons, air-dry)
United States..........................................New England ..........................................
Maine ................................................New Hampshire.....................................Vermont, Massachusetts, and Rhode Island.
Middle Atlantic.......................................New York............................................New Jersey..........................................Pennsylvania........................................
East North Central....................................Ohio and Illinois...................................Michigan............................................Wisconsin............................................
West North Central...................................Minnesota...........................................
South Atlantic.........................................Virginia..............................................North Carolina.....................................Florida...............................................Maryland, South Carolina, and Georgia.....
East South Central....................................Tennessee and Alabama .........................Mississippi...........................................
West South Central...................................Arkansas and Texas...............................Louisiana.............................................
Pacific...................................................California...........................................Oregon...............................................Washington..........................................
11,945,8641,474,9511,237,075
174.13763,739
1,003,332645,95568,620
288,7571,268,494
113,084232,678922,732392,254392,254
3,162.321630,384474,020783,258
1,274,659994,921518,657476.264
1,603,159474,432
1.128,7272,046,432
19,125436,078
1,591,229
Paper. Most of the paper made in the United States is produced near the mills which supply the pulp. The majority of the inte grated mills, that is, the mills turning their own pulp into paper, use groundwood or sulfate pulp. The integrated mills are gener ally in the Northwest and the South.
Paper mills vary greatly in size. Paper of the better grades is generally consumed or reprocessed locally, so mills manufacturing

58 WATER REQUIREMENTS OF SELECTED INDUSTRIES
this type of paper are usually small, only large enough to satisfy the demands of nearby cities. Mills producing kraft paper or newsprint are usually large; a single paper plant may use the en tire output of a large pulp mill.
Table 16 shows the production of paper and paperboard in the United States by States and groups of States.
Table 16. Paper and board production in the United States, 1947
[Adapted from Census of Manufactures, 1947]
Division and StateTotal production (short tons, air-dry)
United States.............................................................................. 21,114, 000New England.............................................................................. 2,696,872
Maine.................................................................................... 1,255,582New Hampshire........................................................................ 223, 713Vermont................................................................................. 102,519Massachusetts.......................................................................... 742,096Rhode Island and Connecticut....;................................................ 372,962
Middle Atlantic.......................................................................... 4,248,504New York............................................................................... 1,849,873New Jersey.............................................................................. 1,105,145Pennsylvania........................................................................... 1,293,486
East North Central....................................................................... 5,559,882Ohio...................................................................................... 1,463,461Indiana.................................................................................. 391,693Illinois................................................................................... 776,221Michigan................................................................................ 1,536,490Wisconsin............................................................................... 1,392,647
West North Central...................................................................... 860.810Minnesota...............................................................................Iowa......................................................................................Missouri................................................................................. 860,810Kansas...................................................................................
South Atlantic............................................................................ ' 3,210,737Delaware................................................................................ 50,291Maryland and District of Columbia.............................................. 265,867Virginia................................................................................. 746,277West Virginia.......................................................................... 25,713North Carolina......................................................................... 389,236South Carolina and Georgia........................................................ 1,099.948Florida................................................................................... 633,405
East South Central....................................................................... 1,047,836Tennessee............................................................................... 211,284Alabama................................................................................ 374,512Mississippi.............................................................................. 462,040
West South Central...................................................................... 1,787,188Arkansas and Texas................................................................... 444, 629Louisiana................................................................................ 1,342,559
Pacific and Mountain................................................................... 1,702,171Washington............................................................................. 816,709Oregon................................................................................... 371,626California, Colorado, and Arizona............................................... 513,836
Figure 11 shows the distribution of the pulp and paper industry in nine major geographical subdivisions of the United States. Most of the production is east of the Mississippi River, but Louisiana, Minnesota, and the Pacific Northwest are also large producers. Where two pairs of circles are shown within the boundaries of a single group of States an attempt has been made to further sub divide the distribution of the industry.

PULP AND PAPER INDUSTRY 59
Modified from Guthrie, 1950
Figure 11. Location and tonnage of United States pulp and paper production, 1947.
USE OF PAPER PRODUCTS
Domestic. Domestic consumption of paper in the United States during recent years has generally been within 2 percent of the sum of the national production of paper and the imports of newsprint. This was not true during some of the war years, 1940 45, when the United States exported considerable amounts of paperboard to
Table 17. Imports of woodpulp, 1922-48, in thousands of tons
[From Guthrie, 1950]
Year
1922.......................................1923.......................................1924.......................................1925.......................................1926.......................................1927....................................... 1928.......................................1929....................................... 1930.......................................1931.......................................1932.......................................1933.......................................1934.......................................1935.......................................
Imports
1,2591,3831.5231,6641,7321,676 1,7551.881 1.8301.5961,4821,9421,8061,933
Year
1936.......................................1937.......................................1938.......................................1939.......................................1940.......................................1941....................................... 1942.......................................1943....................................... 1944.......................................1945.......................................1946.... ............................... ....1947.......................................1948.......................................
Imports
2,2782,3951,7102,0271,2171.141 1,2211,288 1,0581,7391.7812,2922.176

60 WATER REQUIREMENTS OF SELECTED INDUSTRIES
Latin America, but even during those years the exports were less than 4 percent of domestic consumption. Imports of all kinds of woodpulp averaged about 1,700,000 tons annually during the 27- year period 1922-48 (table 17). The maximum departure of annual imports of woodpulp from the mean during this period was 41 per cent, or about 695,000 tons, during the depression year of 1937. Most of the foreign trade in paper consists of imports of news print, the only paper that is free of import duty (table 18).
Table 18. Imports and exports of paper and paperboard, 1922 48, in thousands of tons
[Modified from Guthrie, 1950]
Year
1922..........................1923..........................1924..........................1925..........................
1926..........................1927..........................1928..........................1929..........................1930..........................
1931..........................1932..........................1933..........................1934..........................1935..........................
1936..........................1937..........................1938..........................1939..........................1940..........................
1941..........................1942..........................1943..........................1944..........................1945..........................
1946..........................1947..........................1»48..........................
Imports
Newsprint
1,029 1,309 1,357 1,448
1.851 1,987 2,157 2,423 2,280
2,067 1,792 1,794 2.210 2,383
2,752 3,317 2,275 2,615 2,763
2,982 2,291 2,637 2,491 2,669
3,490 3,957 4.400
Other
113 159 143 119
122 120 110 111 85
69 56 58 55 74
103 95 82 72 64
141747
84 85 84
135 164 180
Total
1,142 1,468 1,500 1,567
1,973 2,107 2,267 2,534 2,365
2,136 1,848 1,852 2,265 2,457
2,855 3,412 2,357 2,687 2,827
3,123 3,038 2.721 2.576 2,753
3,625 4,121 4,580
Exports
152 146 150 152
183 184 219 262 216
171 119 127 163 178
180 221 196 249 553
464 342 320 313 459
393 474 385
Figure 12 is a flow chart that shows the quantity and source of the fibrous material used in making the paper and paperboard consumed in the United States during 1947.
Classifications used in reporting production, exports, and im ports are slightly different so that it is quite difficult to obtain a perfect balance in figure 12, for which production data were ob- tainedfrom Census of Manufactures (1947) and import and export data from Guthrie (1950). Some minor adjustments were made by the author.
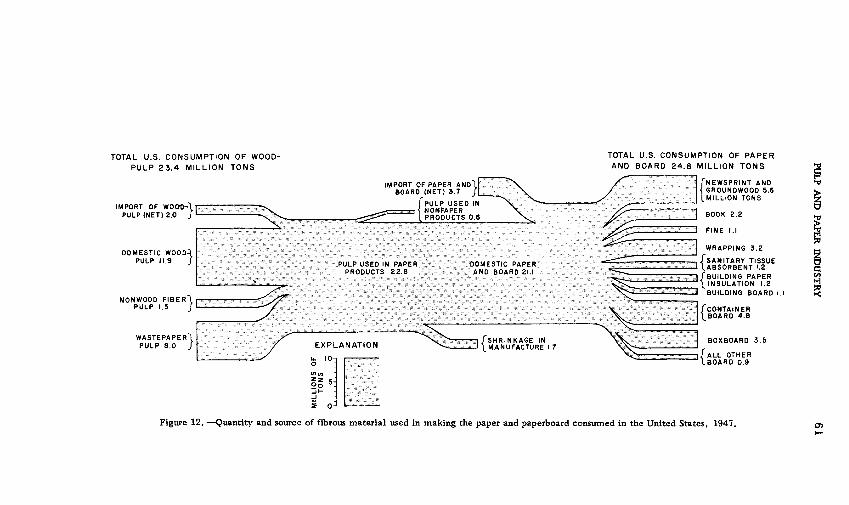
TOTAL U.S. CONSUMPTION OF WOOD- PULP 23.4 MILLION TONS
TOTAL U.S. CONSUMPTION OF PAPER AND BOARD 24.8 MILLION TONS
IMPORT OF WOOD-T PULP (NET) 2.0 J
DOMESTIC WOODA PULP 11.9 J
NONWOOD FIBERl PULP 1.5 J
WASTEPAPERl PULP 8.0 J
IMPORT OF PAPER AND\ ^"\ / BOARD (NET) 3.7 J -.- -- \ /
:--.:.v' " .V^V ^-=53 \ N ONPAPER \ .-.---- , /,*- > i
iV-,-^.'.:-""' > -. .. . -. -- .. '.''"' ':: ': : : v ...:': ::', ,:.'...' ... . S :. .jS^«~ "-"' '"' ' '. :: . . ....
.-"- ' . :. :.:- : . -^ --- "-:-.i;: .::::...' : " ...i...:: - - -- -!- .,:'.::.:..::' -: .:.:...:. . . i*S*rr^-* . - - : ' ::/:.:: ' ' .. ', : " : -.- : , :. . . ;v-,.:: . : , -, ' ' ' -.- '..'. ' ::'.;:«.. .:...:::: ::: : . .- -: .-:-. : \ . : ....... .-.. ; :,/ v. - : ; / . '
PRODUCTS 22.8 , AND HOARH 21.1. *<-^, ,, , :." - -- '.::::. -- , ;:- : .. ,...::, v. : ...... . ,..:....' ; -.- : ,: r- .. . ^ .:: \< -.-. -- -.-. .....'.:' .... ----- .. .. --. - : ...... .' r^ettH^i.,-. : ' -,: - ... :,;;.,:',,.:;bJ:L;:'. -.--. ,
^-^.... ... :: .... .... . .. ...,; , r...... : .. : , v.. ;;s . :,,.,,,.,..,,..;. .. ..,. ; , , : ; ;.. . ,. .. - .-.. -.. ; , ,,....- ->^^;^: -^ f ' -.. :: ;:A' V'J!;"!*.,..
-^f:'-rtr-':"-->""'--'~- -..'":- - -;--:-,:::::; ::- .-: A ; ; .; ,:; ;,.:;! :;..'i, : -,.'.;.:-. ;:;-. .- -.-..-.. ; .- - -..- . :: : -. - : -- - - M;::^: r ;"-'-""''l ".; u'.^---"^v>«V--; :- ,- - -.--- --- ;- - : ---" i ;'':5';; - f::^-!::^'^^'":"r"" -?- : :--:- : ' ; :" --v. :. ' : -. "" '"" : 7w»^>>«,!.u -..-r-T^-,
^/^ y/--"-: : '. ' -^M-^^^^^^^y^J^ ,/..:. " .".'.: ,j;^|Q^;: iG^S^
/ CVDI MviAT.nw ^Cp-^-r-Tj /SHRINKAGE IN \^ ' "- / EXPLANATION ^--..i,,,,;, ! ^MANUFACTURE 1 7 V\^
L : ____^ t 10- ---,;;-; ^ iBOARD 0.9
TNEWSPRINT AND < GROUNDWOOD 5.6 [MILLION TONS
BOOK 2.2
FINE I.I
WRAPPING 3.2
/SANITARY TISSUE lABSORBENT 1.2 /BUILDING PAPER
BUILDING BOARD I.I
/CONTAINER \BOARD 4.8
BOXBOARD 3.5
i/ALL OTHER
«« :11 5: v ~-0v:"d K : ^-;'^S-
LP AND PAPER INDUSTRY
Figure 12. Quantity and source of fibrous material used in making the paper and paperboard consumed in the United States, 1947.
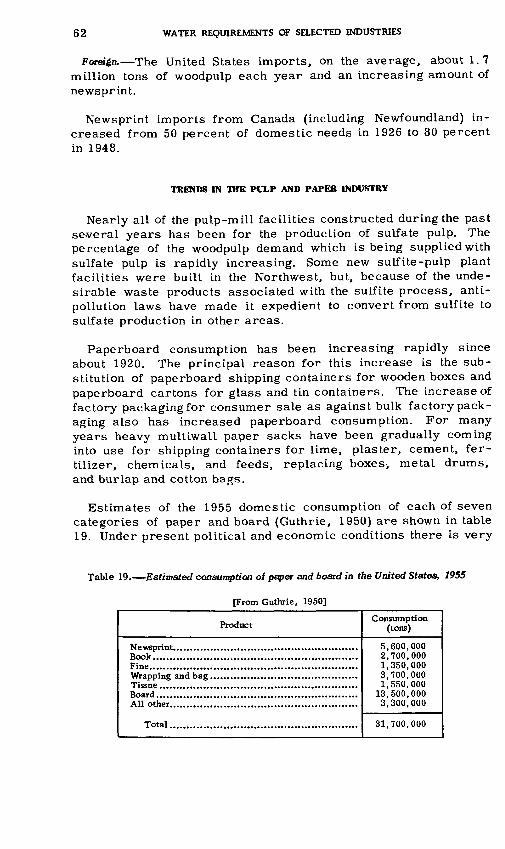
62 WATER REQUIREMENTS OF SELECTED INDUSTRIES
Foreign. The United States imports, on the average, about 1.7 million tons of woodpulp each year and an increasing amount of newsprint.
Newsprint imports from Canada (including Newfoundland) in creased from 50 percent of domestic needs in 1926 to 80 percent in 1948.
TRENDS IN THE PULP AND PAPER INDUSTRY
Nearly all of the pulp-mill facilities constructed during the past several years has been for the production of sulfate pulp. The percentage of the woodpulp demand which is being supplied with sulfate pulp is rapidly increasing. Some new sulfite-pulp plant facilities were built in the Northwest, but, because of the unde sirable waste products associated with the sulfite process, anti- pollution laws have made it expedient to convert from sulfite to sulfate production in other areas.
Paperboard consumption has been increasing rapidly since about 1920. The principal reason for this increase is the sub stitution of paperboard shipping containers for wooden boxes and paperboard cartons for glass and tin containers. The increase of factory packaging for consumer sale as against bulk factory pack aging also has increased paperboard consumption. For many years heavy multiwall paper sacks have been gradually coming into use for shipping containers for lime, plaster, cement, fer tilizer, chemicals, and feeds, replacing boxes-, metal drums, and burlap and cotton bags.
Estimates of the 1955 domestic consumption of each of seven categories of paper and board (Guthrie, 1950) are shown in table 19. Under present political and economic conditions there is very
Table 19. Estimated consumption of paper and board in the United States, 1955
[From Guthrie, 1950]
Product
Book.............................................................Fine..... .........................................................
Total........................................................
Consumption (tons)
5,600,0002,700,0001,350,0003,700,0001,550,000
13,500,0003,300,000
31,700,000

PULP AND PAPER INDUSTRY 63
little chance that newsprint manufacturers will increase their production in the United States. Practically all our other domestic needs for paper and board are supplied by paper mills in the United States. It is reasonable to assume that this situation will prevail for the next several years. It is estimated that the demand for woodpulp in 1955 will be about 17, 700, 000 tons, based on a projection of the present trend. No increase in the production of groundwood pulp for newsprint is anticipated owing to the existing favorable import conditions. Of the total pulp production in 1955, about 700, 000 tons is expected to be used for nonpaper products.
The President's Materials Policy Commission in 1952 estimated that the total United States consumption of pulp and paper in 1975 would be double the 1950 consumption.
SUMMARY
QUANTITATIVE WATER REQUIREMENTS
This survey was primarily concerned with determining the wa ter requirements of pulp and paper mills that were operating on a satisfactory economic basis rather than the absolute minimum amount of water that j^ight be used. It seemed best, therefore, to prepare a table which would show the average amount of water used in making each of a variety of pulp and paper products. These values, which are shown in table 20, are weighted averages
Table 20. Water requirements of the pulp and paper industry
Product Water requirements (gallons per ton)
10.00035,00075,00025,00075,00050,00090,00025,00060,00013,00030,00025,00030,00080,00030,00025,00070,000
based on the data contained in tables 2, 4, 5, 6, and 8 and on in formation obtained from other sources. The weights were based

64 WATER REQUIREMENTS OF SELECTED INDUSTRIES
on the author's judgment and varied with the number of mills used in each category and with the year for which the information was collected.
On the basis of production figures for 1950 and the water- requirement values shown in table 20, about 40, 000 gallons of water per ton was used on the average in the manufacture of pulp produced in 1950. In addition, about 33, 000 gallons was used on the average in producing a ton of paper on the basis of 1950 pro duction figures and the values given in table 20. Paperboard manufacture required an average of only about 13, 000 gallons per ton. The total water requirements for the pulp, paper, and paper- board industry in 1950 was about 3, 200 million gallons per day on the basis of the above water-requirement values.
Except for bleaching, the water requirements per ton of product generally appear to be decreasing with time. A tendency to in crease the unit use of water in bleaching was observed. The quan titative water requirements presented in table 20 are average unit-use values and it should be clearly understood that maximum values of unit water use may be many times greater than the min imum in the same category (table 5). For example, although table 20 indicates that 13,000 gallons per ton is an average unit water use for paperboard manufacture, one very accurate determination of unit water use based on water meters and mill-production records is 2,400 gallons per ton, or less than one-fifth of the average. Because there is little prospect that new soda-pulp mills will be built, a value for soda-pulp manufacture is not indicated, although one such value is shown in table 4. As can be seen from figure 8, most of the expansion of the pulp and paper industry is in sulfate pulp and paper. Particular care was taken to obtain reliable values for these uses. Use of water by operations is shown in table 3.
While it is not the intent of this publication to estimate total quantitative water requirements for pulp and paper production for any particular year in the future, sufficient data on the past growth of pulp and paper production has been presented so that the reader may extend production curves into the future to his own satisfac tion to estimate production of future years. These estimated pro duction figures, when multiplied by the water-requirement values (with possible slight downward adjustments) shown in table 20, will give reasonable water-requirement values for the pulp and paper industry. The water requirements for bleaching for any year in the future may be estimated by extrapolating the curves shown in figure 9 to show the percentage of sulfite or sulfate pulp that probably will be bleached in the indicated year. Multiplying this percentage of the estimated total production for that year by
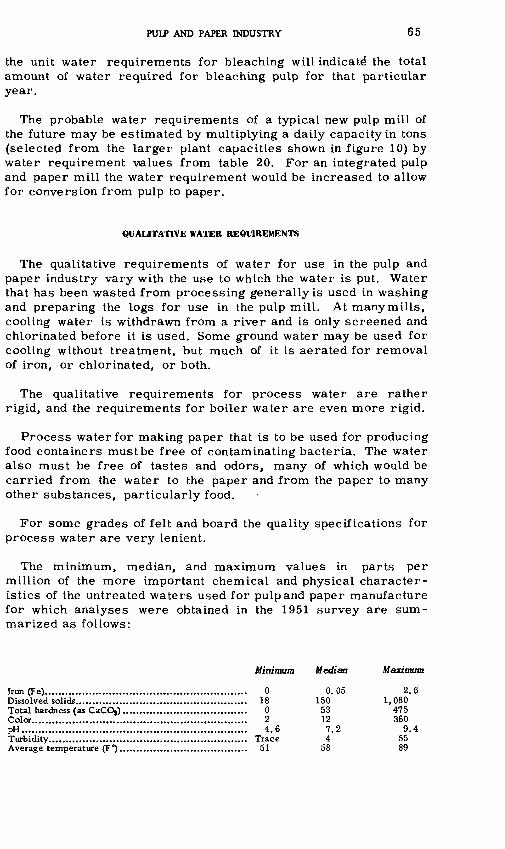
PULP AND PAPER INDUSTRY 65
the unit water requirements for bleaching will indicate1 the total amount of water required for bleaching pulp for that particular year.
The probable water requirements of a typical new pulp mill of the future may be estimated by multiplying a daily capacity in tons (selected from the larger plant capacities shown in figure 10) by water requirement values from table 20. For an integrated pulp and paper mill the water requirement would be increased to allow for conversion from pulp to paper.
QUALITATIVE WATER REQUIREMENTS
The qualitative requirements of water for use in the pulp and paper industry vary with the use to which the water is put. Water that has been wasted from processing generally is used in washing and preparing the logs for use in the pulp mill. At many mills, cooling water is withdrawn from a river and is only screened and chlorinated before it is used. Some ground water may be used for cooling without treatment, but much of it is aerated for removal of iron, or chlorinated, or both.
The qualitative requirements for process water are rather rigid, and the requirements for boiler water are even more rigid.
Process water for making paper that is to be used for producing food containers must be free of contaminating bacteria. The water also must be free of tastes and odors, many of which would be carried from the water to the paper and from the paper to many other substances, particularly food.
For some grades of felt and board the quality specifications for process water are very lenient.
The minimum, median, and maximum values in parts per million of the more important chemical and physical character istics of the untreated waters used for pulp and paper manufacture for which analyses were obtained in the 1951 survey are sum marized as follows:
Minimum Median Maximum
Iron (Fe)............................................................ 0 0.05 2.6Dissolved solids................................................... 18 150 1,080Total hardness (as CaCOg)..................................... 0 53 475Color................................................................ 2 12 360pH................................................................... 4.6 7.2 9.4Turbidity........................................................... Trace 4 55Average temperature (F^...................................... 51 58 89

66 WATER REQUIREMENTS OF SELECTED INDUSTRIES
With the exception of color, the median quality values of un treated water supplies for the pulp and paper industry were found to be generally much higher than is indicated as permissible in specifications for process water setup by the Technical Association of the Pulp and Paper Industry. Although there are not enough samples in either the 1939 or the 1951 survey to warrant positive statements regarding such slight differences, it appeared that the treated water used in 1939 was generally of quality inferior to that of the untreated water used in 1951. It is customary to improve the quality of most of the water used for processing and boiler feed together and then further improve the quality of the boiler water. In some instances, the different qualities of water required may be partly met by use of different sources, but frequently only one source of supply is available and treatment problems are intensified.
A study of the data obtained by fie Id contacts indicates that care ful periodic observation of the quality characteristics of untreated water supply is the exception rather than the rule. Most of the water used by the industry is obtained from surface-water sources that are subject to seasonal variation in chemical characteristics. In order to obtain a consistent quality of water, such variation in the quality of the untreated water must be controlled by modifying the extent of treatment. To accomplish such control most effec tively and economically a more careful evaluation of the variations in quality of the untreated water is needed.
TRENDS IN WATER REQUIREMENTS
Representatives of the pulp and paper industry seem to be con fident that necessity will find a way to make pulp and paper with less and less water as general industrial expansion makes it difficult to obtain as much water for each ton of product as is used at the present time. The industry has a tendency to build larger and larger mills to keep down the cost of the increased supervision that is necessary to produce better paper from less satisfactory pulpwood.
Most of the future expansion in the industry will be in the South, where the largest stands of timber not controlled by any established paper mill are available. The southern timber stands are generally suitable for sulfate pulping, and there are also suitable and adequate water supplies. The tendency toward larger mills makes it advisa ble to locate new mills only where the water supply is large enough to permit a substantial increase in mill capacity.
There is a reluctance to change established patterns of successful pulp- and paper-mill operation even where excessive amounts of

PULP AND PAPER INDUSTRY 67
water are being used. Warm weather may increase these de mands, and emergencies may arise which will require the use of even greater amounts of water.
In spite of the reluctance to change, changes do occur, even in such a field as water supply for the pulp and paper industry. Summarized, the present tendency seems to be toward the use of water of better quality in smaller amounts per ton of product, except for bleaching, for which water of better quality in greater amounts per ton of product is being used.
SELECTED REFERENCES
American Paper and Pulp Association, 1952, Technical problems of the pulp and paper industry: Committee on Coordination of Research, rept. 4, New York.
Barrell, William L., Company, 1951, Barrell's Paper Annual, 1950-51, v. 9, Lawrence, Mass.
Congressional Documents, 1944, 78th Cong., 1st sess., H. Doc. 266, U. S. Public Health Service, Ohio River pollution control.
Chemical and Metallurgical Engineering, 1944, Chemical Engineering flow sheets: New York.
Guthrie, J. A., 1950, The economics of pulp and paper: Pullman, Wash., State College of Washington Press.
Hisey, W. O., 1951, Abatement of sulphate pulp mill odor and effluent nuisances: TAPPI, Jan. 1951, p. 1-6.
Miller, L. B., 1945, Quality of process water required for paper manufacture: The Betz Indicator, July 1945.
Murdock, H. R., 1937, Trends in woodpulp industry: Chem. Metall. Eng., v. 44, no. 1, p. 4-8.
National Association of Manufacturers and Conservation Foundation, 1950, Water in in dustry: New York.
Post, L. D., Inc., 1950 and 1951, Post's Paper Mill Directories: New York.President's Materials Policy Commission, 1952j Resources for freedom.Sawyer, F. G., and others, 1950a, Kraft pulp production: Indus, and Eng. Chemistry, v.
42, no. 5, p. 756-767. 19506, Kraft paper making: Indus, and Eng. Chemistry, v. 42, no. 6, p.
1007-1020.Shreve, R. N., 1945, The chemical process industries: New York, McGraw-Hill Book Co.,
Inc.Technical Association of the Pulp and Paper Industry, 1942, Industrial water for pulp,
paper, and paperboard manufacture: TAPPI Mono. ser. 1.United States Bureau of the Census, 1949, Pulp, paper, and board, in Census of manu
factures, 1947.Van Winkle, Walton, 1914, Quality of the surface waters of Washington: U. S. Geol. Sur
vey Water-Supply Paper 339, p. 23.Wakeman, A. G., 1953, The development of the pulp and paper industry in the South: Am.
Soc. of Civil Eng. Proc., v. 79, Separate no. 356.Warrick, L. F., 1947, Industrial wastes pulp and paper industry: Indus, and Eng. Chem
istry, v. 39, no. 5, p. 670-676.Witham, C. S., Sr., 1942, Modern pulp and paper making: 2d. Ed., New York, Reinhold
Publishing Corp.


INDEX
Abstract____________________Alkalinity, of water _________Alum, in paper mix _________Aluminum, in water Analysis, ideal boiler water,
untreated water ________.
Page._____ 1-2 .__36, 39, 46 _____ 16
.__ 46 ___ 41
_~__146, 65
Bacteria, contaminating, in water _____ 37Bag papers, use ______________ 18Bark, methods of removing ________ 8Barking-drum process ___________ 8Bicarbonate, in water ____________ 46Black liquor, definition___________ 9
soda process _______________ 12._______ 9-11
.__ 27
sulfate process Black wadding mill, water
requirements_______Bleached pulp, increased demand______ 54Bleaching, object ______________ 14
process__________________14-15 reason ____________________ 14 reuse of water_______ 15 waste material ______________ 21 water requirements 14, 15, 23,
54-55, 64Board, see Paperboard.Boiler-feed water, acidity ________ 43
analysis ___________________ 41in steam production____________ 40relation of, caustic embrittlementto_ 42
corrosion to 42-43removal of suspended matter _____ 41treatment _______________41, 42-43
Boilers, electrolytic action in ______ 43Bond mills, water requirements_____ 24, 27Book mills, water requirements____24, 27,
31, 32, 33Book paper, use _______________ 18 Boxboard, use_________________ 19 Building board, use _____________18-19 Building papers, use_____________ 18 Broke paper, definition___________ 19
use __________________.____ 19
Calcium, in water__________ 38, 42, 46 California Forest and Range Experiment
Station, water-use values from _ 29 Carbon dixoide, in water___37, 39, 43, 46 Carbonate, in water ____________ 46 Cardboard, miscellaneous use______ 19 Caustic embrittlement, damage from 42 Chemical characteristics, process
water__________________ 39-40water, general________ 35-38, 46, 66
Chemical reactions, soda process______ 12sulfate process ______________ 9 sulfite process 13
Chloride, in water _______37, 39, 41, 46 Color, in water_______ 35-36, 39, 46, 65 Coloring, in paper mix___________ 16 Consumptive use of water ________34-35 Container board, use ____________ 19 Cooking liquor, sulfite process ______ 12
PageCooking procedure, sulfate process____ 9
sulfite process_______ ______ 13Cooling systems, description _____ 44-45
types _____________________ 43Cooling water, quality _ 43, 65
sources___________________ 43 treatment ________________44, 45
Corrosion, in boilers ___________38, 42 in papermaking machines_______ 38 relation to boiler-feed water ____42-43 treatment of boiler-feed water for___42-43
Cottrell precipitator, use of insulfate process..__ _ 10
Cylinder machine, description _____ 17 invention__________________ 4
De-inked pulp mills, waterrequirements________ _ 28
Domestic consumption, paper,estimated future use_______ 62
paper, present use ___________ 59-60paperboard, estimated future use ___ 62
Disk evaporators, sulfate process____ 10Dissolved solids, in water_____ 39, 46, 65
Exports, paper__ paperboard _______
Fibers, kinds used in paper industry____ 7 Field survey, methods___________ 3
quantitive water requirements,results _______________ 30-34
supplement to literature ________ 3 Filler, in paper mix ___________ 16 Fluoride, in water _________ __ 46 Fine papers, use_______________ 18 Fourdrinier machine, description ___ 16-17
invention_.________________ 4 Future water requirements _______ 50-63
General-purpose water, quality_______Glassine mills, water requirements _ Green liquor, definition
use in sulfate process__________ 11 Groundwood pulp, development of
process_____.________._ 4 manufacture _______________ 8-9 mills, capacity _ __ 55-57 use of white water ____________ 8-9 waste material ______________ 20 water requirements ______24, 28, 29,
31, 32, 33, 63
Hardness, of water___ 36, 39, 41, 46, 65 History of papermaking__________ 4-7 Hydrogen-ion concentration, in
water_____37-38, 40, 41, 46, 65
Imports, paper_______paperboard ________wood pulp___
Iron, in water _
____ ___ 60 . ________ 60
___59, 62 .__ 36-37, 39, 46, 65
69

70
Jet-of-water barking method_______Page
8
Knife-barking method _________Kraft paper, water requirements...
Kraft pulp. See Sulfate pulp.
831, 32,33, 63
Literature, technical background _ ____ 3
Magnesium, in water__ _ 38, 42, 46 Making the paper _______ _ 15 Manganese, in water ________ 36-37, 39 Materials Policy Commission, estimated
consumption of pulp and paper __ 63 Methods of manufacturing pulp, rag ____ 15
semichemical _______________ 15 straw_._________________.___ 15wastepaper ____________________ 15See also names of various pulp processes.
Mill location, economics ______._51-52 Mills, present capacity __________55-58
National Council for Stream Improvement of the Pulp, Paper, and Paper board Industry, water-use values____29-30
Newsprint, imports_____________60, 62 use _____________,_________ 18 water requirements___,____24, 25, 31,
32, 33, 63 Nitrate, in water ______________ 46
Once-through-to-other-use, coolingsystem ______________________
Once-through-to-waste, coolingsystem_________________ 44
Oxygen, in water______________37, 42
Paper;basic composition_____________ 4 estimated use _______________ 62 exports __________________ _ 60 kinds_____________________ 18-19 imports____________________ 60
44
manufacture, ingredients in papermix _____________________
kinds of products______________processes in___
new uses.production in 1947 __________.water requirements_____ 24, 26,
31. 32, 33Paper industry, growth _____________
trends________________________waste material__________________
Paper mills, present capacity_______Paper mix, ingredients __ __ Paper products, use____________ Papermaking, history__________. Paperboard, estimated use________
exports____________________kinds____________,_________imports__________________. production in 1947_____________waste material_____________water requirements_____ 24, 26,
31. 32, 33Paulsen, C. G., Foreword_________pH. See Hydrogen-ion concentration. Physical characteristics of wafer_____
Pollution problem, control_________in Europe_____________..
... 16 _ 18-19 _ 15-17 __ 7 __ 58 27, 30,
, 63, 64 __52-55 ,__62-63 __20-22 ._ 57-58.__ 16 __59-62 .__ 4-7 __ 62 .__ 60 ._ 18-19 .__ 60 __ 58 __ 20 27. 30,
. 63, 64 III-IV
35-38, 46, 65
,__ 22 _ 22
Pollution-control boards_____Potassium, in water ______Processes, comparison ,
paper manufacturing__ pulp manufacturing_____reusing of waste paper _
Process water, chemical charac teristic ____________39-40, 65
Pulp, in paper mix _____________ 16water requirements ______ 24, 26, 27,
31, 32, 33, 63, 64Pulp industry, growth ___________52-55
trends ___________________62-63waste materials ________ 20-22
Pulp washing, in sulfate process _____ 10 Pulpwood, preparation process _.
removal of bark____________storage _ 7-8
Purity of water, need of, for specialpapers. ____________ 40
Qualitative water requirements, resultsof survey________ ____ 45
summary___________.______65 -66 Quality standards, for water ______39-45 Quantitative water requirements, for
specific pulp and paper products _______________ 33
1950 preliminary survey_________ 311951 survey________ ___ 32 results of survey_______ _ 30-34 summary_________________ 63-65
Radioactive substances, in water _ 37 Rags, method of manufacturing pulp
from__________________ 14 Rag pulp mills, water requirements ____ 28 Raw materials, source _________ 50-51 Recirculating, cooling system_____ 44 45 References, selected_______ ._ 67
Sanitary papers, use __ _____ 18Scale, formation, in papermaking
machines______________36, 38 formation, in steam boilers ______ 38
Scale-forming impurities, in boiler- feed water_______________ 42
Scope of report________________ 2-4 Screening processes, at paper mill ___15, 16
water used_.___________________ 25Semichemical method of pulp manu
facturing, processes.._______water requirements_________.
Silica, in water________35. 37.40, 41,
Sizing, in paper mix_ Soda pulp;
increased production, manufacture. _____mills, capacity__ process, black liquor___ __
chemical reactions___ _ development______________water utilization___________white liquor.______________
waste material.______________water requirements 24,
Specific conductance, of water . Steam evaporators, in sulfate process Strawboard pulp, method of
m anuf act ring______.__. waste material_________
.__ 14 __ 28 38, 39. 42. 46
16
__ 54 ___ 12 .55-57 __ 12 ._ 12 __ 4 __ 12 __ 12 20, 21 26, 63 __ 46 _ 10
... 14 _ 20

71
Sulfate pulp:increased production_________manufacture____________mills, capacity____________process, black liquor ________
chemical reaction_ cooking procedure________Cottrell precipitator ______development ____________disk evaporators___________green liquor ______________pulp washing
Page
steam evaporators _ white liquor _______
waste material_water requirements _____ 24,
30, 31, Sulfite pulp:
increased production______manufacture______________mills, capacity______________process, chemical reactions _
cooking liquor ___________cooking procedure________development ______________water utilization __________
waste material_______________water requirements _____ 24,
31,Sulfur, use of in papermaking__ Suspended matter, in water____.
Tall oil, definition__________use___________________,
Temperature, average, of water___ Tissue mills, water requirements ___ Tissue papers, use___________, Treatment, of water, method__. Trends, paper industry ________.
pulp industry ___________.water requirements __________
Turbidity, in water 35,
26, :32,
Untreated water, analyses____
.__ 11
.__ 11 ___46, 65 27, 32, 33 .__ 18 __49-50 __62-63
__62-63 __66-67 39, 46,65
,__46, 65quality________________ 46, 49, 66
U. S. Pub lie Health Service, determinationof sewered population equivalents_ 20
determination of waste flows ______ 20
Waste material;bleaching _______________ 21 groundwood pulp_______________ 20 paper ____________________ 20, 21 paperboard ________________ 20, 21 soda pulp___________________ 21 sulfate pulp__________________ 20 sulfite pulp __________________ 21wastepaper de-inking ___ ._____ 21
Page Wastepaper, as a source of paper
fiber __________________ 14reuse treatment 19
Wastepaper de -inking, wastematerial _____________ 20, 21
Water, consumptive use ________ 34-35 untreated, analyses ___________ 46
Water requirements;black wadding mill ___________ 27 bleaching ______________ 14-15, 23 board mills ________________ 27 bond mills _________________ 27 book mills __________ 27, 31, 32, 33 de- inked pulp mi Us ___________ 28 future ___________________ 50-63 glassine mills _______________ 27 groundwood pulp ________ 24, 28, 29,
31, 32, 33, 63kraft paper _________ 31, 32, 33, 63newsprint _____ 24, 25, 31, 32, 33, 63paperboard ________ 24, 26, 27, 30,
31, 33, 63, 64quantitative, literature data _____ 22-26 rag pulp mills ________________ 28 semichemical pulp mills ________ 28 soda pulp ______________ 24, 26, 63 sulfate pulp ________ 24, 26, 28, 29,
30, 31, 32, 33, 63sulfite pulp ________ 24, 26, 28, 29,
31, 32, 33, 63summary of 1939 survey ________ 24 tissue mills ____________ 27, 32, 33trends in ______ __________66-67Wisconsin pulp and paper
mills __________wrapping mills_
._____27-29 .__ 27
Water treatment, methods________49-50Water utilization, soda process ______ 12
sulfate process..!_________^____ 11 sulfite process ______________ 13-14
White liquor, soda process _________ 12 sulfate process_______________ 11
White water, definition___________ 8 groundwood-pulp manufacturing ___ 8-9
Wisconsin, pulp- and paper-millwaste survey ___________26-29
Woodpulp, comparison of types ___,_ imports__________________ 59,production in 1947 ___________ 57
Woodpulp mills, mean capacityin 1949_________________ 57
median capacity in 1949________ 57 present capacity ______________ 55
Wrapping mills, water requirements _
Wrapping papers, use______ 27 ___ 18
U. S. GOVERNMENT PRINTING OFFICE: 1955 341091