Embed Size (px)
Citation preview

Vopak Asia: Continuous growth
Capital Markets Day, 10 December 2013
Patrick van der Voort, Division President Asia

Forward-looking statements
This presentation contains ‘forward-looking statements’, based on currently available plans and forecasts. By
their nature, forward-looking statements involve risks and uncertainties because they relate to events and
depend on circumstances that may or may not occur in the future, and Vopak cannot guarantee the accuracy
and completeness of forward-looking statements.
These risks and uncertainties include, but are not limited to, factors affecting the realization of ambitions and
financial expectations, developments regarding the potential capital raising, exceptional income and expense
items, operational developments and trading conditions, economic, political and foreign exchange
developments and changes to IFRS reporting rules.
Vopak’s EBITDA ambition does not represent a forecast or any expectation of future results or financial
performance.
Statements of a forward-looking nature issued by the company must always be assessed in the context of the
events, risks and uncertainties of the markets and environments in which Vopak operates. These factors could
lead to actual results being materially different from those expected, and Vopak does not undertake to publicly
update or revise any of these forward-looking statements.
2 Capital Markets Day 10 December 2013

Patrick van der Voort President, Vopak Asia
45
Education Patrick holds a doctoral degree from Erasmus
University in Rotterdam.
Career Patrick van der Voort joined Vopak in 2008 and has been
President of Vopak Asia since October 2010. He has 20
years of experience in logistics, shipping and supply
chain management.
Age
Name Patrick van der Voort
3 Capital Markets Day 10 December 2013
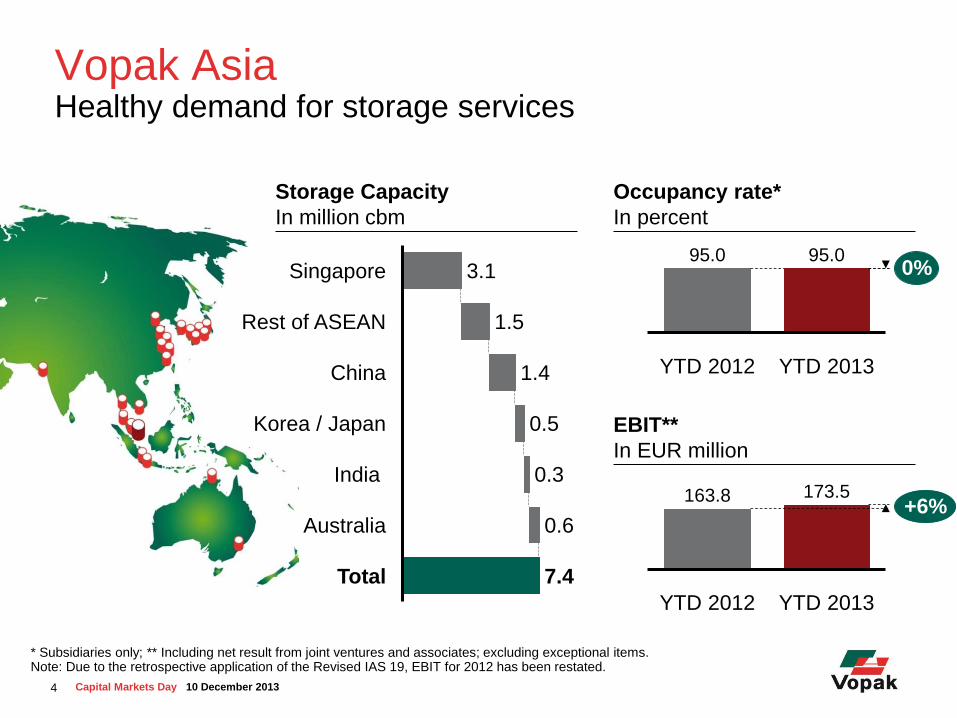
Vopak Asia Healthy demand for storage services
4 Capital Markets Day 10 December 2013
Total 7.4
Australia 0.6
India 0.3
Korea / Japan 0.5
China 1.4
Rest of ASEAN 1.5
Singapore 3.1
Storage Capacity
In million cbm
Occupancy rate*
In percent
EBIT**
In EUR million
* Subsidiaries only; ** Including net result from joint ventures and associates; excluding exceptional items. Note: Due to the retrospective application of the Revised IAS 19, EBIT for 2012 has been restated.
95.0 0%
YTD 2013 YTD 2012
95.0
173.5 +6%
YTD 2013 YTD 2012
163.8

Contents
Asia market environment
Strategy and growth opportunities
Role of strategic partnerships in Asia
5 Capital Markets Day 10 December 2013

Solid long-term trends driving Asia demand Increase in energy and chemical consumption
Rising population Growing economy Rising middle class
Increase in energy and chemical consumption in Asia
6 Capital Markets Day 10 December 2013

Oil demand in Asia Non-OECD Asia largest source of growth, with China and India leading
7 Capital Markets Day 10 December 2013
ASEAN
Indonesia, Thailand and
Malaysia: top 3 leaders
in energy consumption
Singapore as Asia’s key
oil hub
Heavy growth in refined
products consumption
for different sectors
Transportation sector
most important source
of growth in liquid fuels
use
World liquids consumption and
production 2010-2040
In million bpd
* Including Eurasia.
Source: EIA (2013).
Asia oil imports 66% higher
by 2035
ASEAN to become 4th largest oil
importer by 2035
-10 0 10 20 30
World total
Non- OECD Asia
Middle East
Non-OECD Americas
Non-OECD Europe*
Africa
OECD Americas
OECD Asia
OECD Europe
Production
Consumption

Supply landscape on crude oil New crude oil supplies from North America and Brazil; traditional
supplies for Americas and Middle East will flow to Asia
Source: Wood McKenzie; EIA (2013); IEA; GTIS.
8 Capital Markets Day 10 December 2013
Key regional net crude
trade flow
Net crude exporter
Net crude importer
North America
Latin America
Greater
Europe
Africa
Middle East
FSU
Asia
North
Sea Refinery
closures in
Japan
Refinery
closures in
Australia
Crude travel longer
distances
Increase in variety
coming in to Asia

Supply landscape on diesel and gasoil Increasing flows from North America and the Middle East
covering European deficits; growing intra-Asia movements
Middle
East
Asia
Pacific
Reducing trade
Increasing trade
Greater
Europe
Sub
Saharan
Africa
Latin
America
2012 balance (kp/d)
3.000
1.000
0
0
-1000
-3000
-3.000
0
-1.000
0
3.000
1.000
0
-1.000
-3.000
0
3.000
1.000
0
3.000
1.000
US
FSU
9 Capital Markets Day 10 December 2013
Source: Wood McKenzie; IEA; GTIS.
2018 balance (kp/d)
Refinery
closures in
Japan
Refinery
closures in
Australia

Petrochemicals demand in Asia Asia-Pacific chemicals demand estimated to rise with annual
growth rate of 5% till 2020; China and India leading the pack
Source: BASF; OPEC (2013).
World Chemicals Demand 2008-2020
In billion
3.000 2.000 1.000 0
Total
Rest of the World
Asia Pacific
North America
South America
Western Europe
2020
2008
10 Capital Markets Day 10 December 2013
Top Petrochemical demand drivers
Manufac-
turing
Auto-
motive
Plastics Construction

Supply landscape on petrochemicals Asia-Pacific major importer of olefins, driven primarily by
growth in China
North
America
and
Mexico
Latin
America
Europe
Middle
East
Africa
NEA
ASEAN,
India &
Pacific
2010 Ethylene flow
2010 Propylene flow
2010 Butadiene flow
To NEA From NA & Mexico
To NEA
From NEA
11 Capital Markets Day 10 December 2013
Source: Various consultations with IHS
Competitive ethylene
derivatives from North America
Coal and methane to define
developments in China
Naphtha / LPG based crackers
in Asia

LNG in Asia: Fastest growing gas market Growing demand and limited pipeline infrastructure further drive
need for LNG import terminals
Note: in bcm
Source: IEA (2013).
12 Capital Markets Day 10 December 2013
Opportunity for a
trading hub in Asia to
facilitate the exchange
of natural gas
Domestic production
Demand
LNG imports
LNG exports
Pipeline imports
Pipeline exports
27 10
20 11
64 1
35
64
9 35
12
5 195
81 15
230
67 73
14
92
7
188
54
68

LPG in Asia New LPG supplies ‘pushed’ to Asia resulting in opportunities for
competitive alternative feedstock to naphtha
Source: World LPG Market Outlook, IHS (2012); Statistical Review of Global LPG (2011).
North
America
Latin
America
Africa
Europe
Middle
East
NEA
India
ASEAN
Pacific
2020 Net
importers
13 Capital Markets Day 10 December 2013
Asia accounts for 35% of
world’s LPG demand
With growing imports; US,
Middle East, Australia as
main suppliers

3/4 of global demand expansion is
expected in developing countries, Asia
weighing most
China and India top vegetable oil
consumers in Asia, with China leading
Food use driving
vegetable oil demand in Asia Malaysia and Indonesia main
suppliers in Asia
Landscape on vegetable oils and biofuels Food use driving vegetable demand, with Malaysia and
Indonesia as main suppliers
Palm oil output in Malaysia and
Indonesia is expected to expand by
almost 45%
Expected rising biodiesel production in
Thailand, Malaysia and Indonesia
Source: OECD; EIA.
14 Capital Markets Day 10 December 2013

Contents
Asia market environment
Strategy and growth opportunities
Role of strategic partnerships in Asia
15 Capital Markets Day 10 December 2013

Well-established terminal network in Asia 25 terminals in 10 countries (7 million cbm of storage)
FY 2016
10.4
2016
0.1
2014
2.9
Pengerang
Hainan
Dongguang
2013
0.1
FY 2012
7.3
Storage Capacity developments
In million cbm under construction
16 Capital Markets Day 10 December 2013
Existing hub
Existing terminal
New terminal
under construction
Hub terminal
under construction

Growth opportunities: Hub strategy Existing footprint, under construction and potential opportunities
17 Capital Markets Day 10 December 2013
Straits Hub (Singapore and Pengerang):
(crude) oil, chemicals, LPG, LNG Singapore oil and LPG trading hub
Pengerang (Malaysia) development to support
vibrant oil trading in region
First independent crude terminal in ASEAN
(1.3 million cbm), with potential to establish an
LNG hub terminal
Hainan (China): crude oil Terminal (1.35 million cbm) will serve as an oil
transshipment hub at crossroads major shipping
lanes from Middle East and Africa to Far East
Northeast Asia: oil and chemicals Potential creation of Northeast Asia hub to
facilitate (crude) oil, ethylene and its
derivatives flows
Existing hub
Hub terminal
under construction
Potential growth area

Growth opportunities: Industrial terminals Under construction and potential opportunities
18 Capital Markets Day 10 December 2013
Potential new locations Pengerang (Malaysia) to possibly service
RAPID industrial complex
Efforts around expected new refinery /
petrochemical complexes in Vietnam,
Indonesia and India
Current and potential expansions Banyan (Singapore): recently commissioned
100,200 cbm with additional 10,000 cbm in 2014
Zhangjiagang (China): 46,800 cbm expected to
be commissioned in Q1 2014
Caojing (China): 52,400 cbm expected to be
commissioned in Q2 2014
Existing terminal
Potential growth area

Growth opportunities: Import and distribution Under construction and potential opportunities
19 Capital Markets Day 10 December 2013
Potential new locations Growing import requirements in India, China and
Indonesia
Growing import requirements in Australia due to
refinery closures
LNG demand growth might create opportunities
Current and potential expansions Tianjin phase 2 (China): 240,000 cbm for LPG
recently commissioned
Lanshan (China): 40,000 cbm for chemicals
expected to be commissioned in Q4 2013
Penjuru (Singapore): 47,000 cbm for chemicals
expected to be commissioned in Q1 2014
Zhangjiagang (China): 46,800 cbm for chemicals
expected to be commissioned in Q1 2014
Sydney (Australia): 21,000 cbm for bitumen
expected to be commissioned in Q1 2014
Potential expansions in ASEAN and India
New terminal: Dongguan (China) 153,000 cbm for chemicals expected to be
commissioned in Q2 2014
Existing terminal
New terminal
under construction
Potential growth area

Contents
Asia market environment
Strategy and growth opportunities
Role of strategic partnerships in Asia
20 Capital Markets Day 10 December 2013

Strategic alliances support growth strategy Over 75% of Asia terminals are with strategic partners
Note: Including terminals under construction.
Asia is a diverse region with many
different languages and cultures
Strategic partnerships are typically
formed with established local partners
and/or governmental-owned entities for
easier market entry and penetration, and
to reduce risks
In some jurisdictions cooperation with a
local partner is required due to, for
instance, foreign ownership restrictions
Relationship with strategic partnerships
as a gateway to further potential
cooperation
21 Capital Markets Day 10 December 2013
Wholly-owned terminal
Terminal with
strategic partner

Over 30 years of partnership across four
terminals in Singapore
PSA is one of the world’s largest port
operators, wholly-owned by Temasek
Holdings, the Singapore government’s
investment company
Vopak Terminals Singapore Kertih Terminals / Pengerang
The three parties first collaborated in Kertih
Terminals more than 10 years ago
Petronas is Malaysia’s national oil company
Dialog is a listed and established
engineering company
Three parties cooperate again in Pengerang
development 22 Capital Markets Day 10 December 2013
Some prominent partnerships in Asia Singapore and Malaysia

Demand growth, shifting trade flows
and energy mix will drive future growth
opportunities
Growing imbalances Growth in Asia
Vopak Asia growth strategy Supported by a well-established portfolio of existing terminals
and growth opportunities
Asia remains the growth engine with
China, India and ASEAN being key
growth areas
23 Capital Markets Day 10 December 2013

Royal Vopak
Westerlaan 10 Tel: +31 10 4002911
3016 CK Rotterdam Fax: +31 10 4139829
The Netherlands www.vopak.com