Embed Size (px)
DESCRIPTION
Vopak Roadshow Presentation Q1 2014
Citation preview

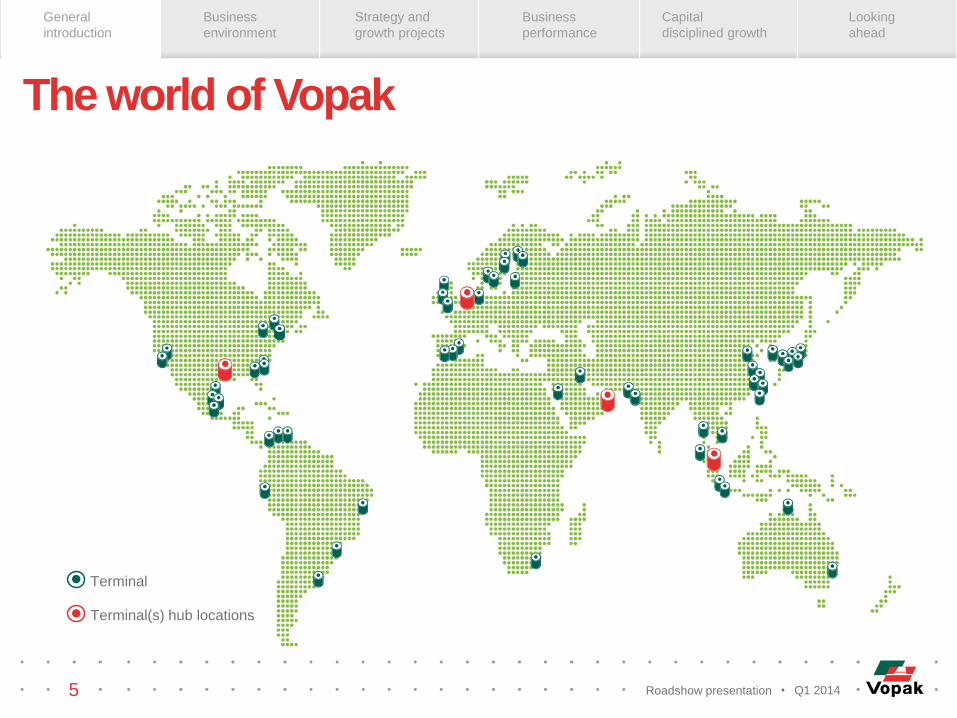
The world of Vopak
Q1 2014
ROADSHOW PRESENTATION

General
introduction
Business
environment
Strategy and
growth projects
Business
performance
Capital
disciplined growth
Looking
ahead
Forward-looking
Statements This presentation contains ‘forward-looking statements’, based on currently available plans and forecasts.
By their nature, forward-looking statements involve risks and uncertainties because they relate to events and
depend on circumstances that may or may not occur in the future, and Vopak cannot guarantee the
accuracy and completeness of forward-looking statements.
These risks and uncertainties include, but are not limited to, factors affecting the realization of ambitions and financial
expectations, developments regarding the potential capital raising, exceptional income and expense items, operational
developments and trading conditions, economic, political and foreign exchange developments and changes to IFRS reporting
rules.
Vopak’s EBITDA ambition does not represent a forecast or any expectation of future results or financial performance.
Statements of a forward-looking nature issued by the company must always be assessed in the context of the events, risks and
uncertainties of the markets and environments in which Vopak operates. These factors could lead to actual results being
materially different from those expected, and Vopak does not undertake to publicly update or revise any of these forward-looking
statements.
• • • • • • • • • • • • • • • • • • • • • • • • • • • • • • • • • •
• • 2 • • • • • • • • • • • • • • • • • • • Roadshow presentation • Q1 2014 • •
General
introduction
Business
environment
Strategy and
growth projects
Business
performance
Capital
disciplined growth
Looking
ahead
3
General
Introduction
Construction of ammonia tank at Banyan terminal (Singapore)

General
introduction
Business
environment
Strategy and
growth projects
Business
performance
Capital
disciplined growth
Looking
ahead
Vopak and storage since 1616 Almost four centuries of history
Q1 2014 Roadshow presentation 4
1616 1818 1839 1860 1929 1967 1996 1999 2002 2011
Vopak’s oldest Terminal (Vlaardingen) was founded Van Ommeren Blauwhoed
Full control of Univar
Vopak continues as a tank storage company
Merger Blauwhoed and Pakhuismeesteren in to Pakhoed
First ever dedicated oil storage container
Pakhuismeesters Merger Van Ommeren and Pakhoed resulting In Royal Vopak
First Vopak LNG terminal
General
introduction
Business
environment
Strategy and
growth projects
Business
performance
Capital
disciplined growth
Looking
ahead
The world of Vopak
Roadshow presentation 5
Terminal
Terminal(s) hub locations
Q1 2014
General
introduction
Business
environment
Strategy and
growth projects
Business
performance
Capital
disciplined growth
Looking
ahead
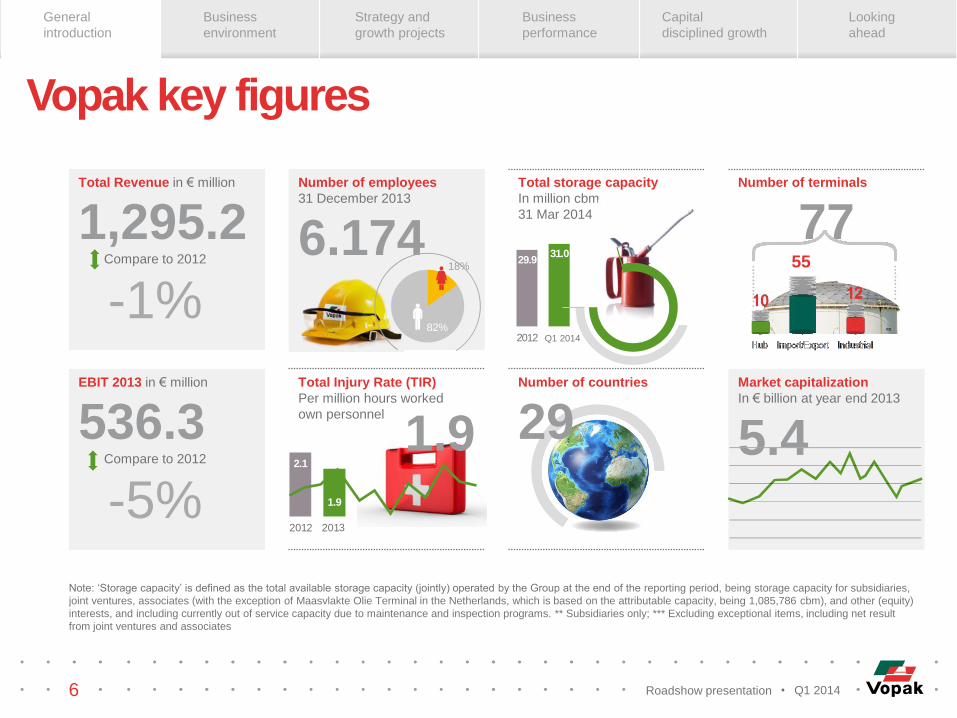
Total Revenue in € million
1,295.2 Compare to 2012
-1%
Number of employees
31 December 2013
6.174
Total storage capacity
In million cbm
31 Mar 2014
Number of terminals
77
EBIT 2013 in € million
536.3 Compare to 2012
-5%
Total Injury Rate (TIR)
Per million hours worked
own personnel
1.9
Number of countries
29 Market capitalization
In € billion at year end 2013
5.4
Note: ‘Storage capacity’ is defined as the total available storage capacity (jointly) operated by the Group at the end of the reporting period, being storage capacity for subsidiaries,
joint ventures, associates (with the exception of Maasvlakte Olie Terminal in the Netherlands, which is based on the attributable capacity, being 1,085,786 cbm), and other (equity)
interests, and including currently out of service capacity due to maintenance and inspection programs. ** Subsidiaries only; *** Excluding exceptional items, including net result
from joint ventures and associates
Vopak key figures
Roadshow presentation 6
201 3 201 2
1 . 9
2 . 1
18%
82% 2 0 1 2
3 1 . 0 2 9 . 9 55
Q1 2014
Q1 2014

General
introduction
Business
environment
Strategy and
growth projects
Business
performance
Capital
disciplined growth
Looking
ahead
Vopak’s role in the supply chain Energy and Chemical supply chain
Roadshow presentation 7
Independent Storage & Transshipment
Feedstock Production
Feedstock Gathering
Product Transmission
Production & Refining
Product Transmission
Midstream & Enduser Distribution
Independent Storage & Transshipment
Q1 2014
General
introduction
Business
environment
Strategy and
growth projects
Business
performance
Capital
disciplined growth
Looking
ahead
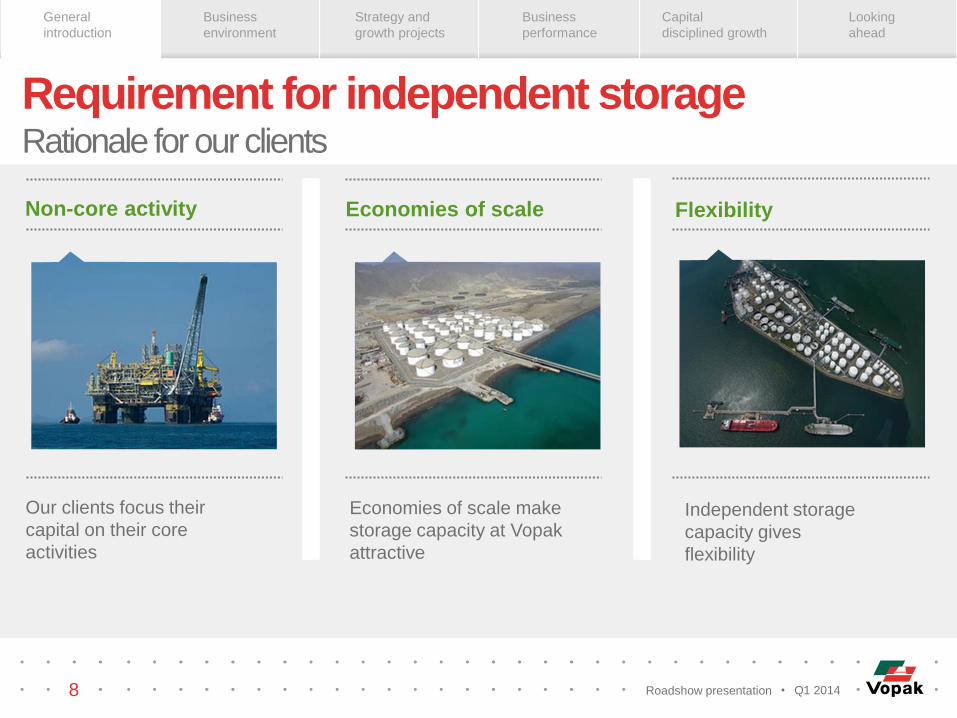
Requirement for independent storage Rationale for our clients
Roadshow presentation
Flexibility Economies of scale Non-core activity
Our clients focus their
capital on their core
activities
Economies of scale make
storage capacity at Vopak
attractive
Independent storage
capacity gives
flexibility
8 Q1 2014

General
introduction
Business
environment
Strategy and
growth projects
Business
performance
Capital
disciplined growth
Looking
ahead
Products
Crude oil
Oil products
Liquid and gaseous chemicals
Vegetable oils
Biofuels
LNG
LPG
Services
Storage
Blending
Make / break bulk
Heating / cooling / adding nitrogen
(Un)loading ships / railcars / trucks
Weighing / drumming
Clients
International oil/chemical companies
National oil/chemical companies
Governments
Downstream consumers
Utility providers
Trading companies
Biofuel/vegoil companies
Vopak business model
Roadshow presentation 9
Transport connection
Vessels
Barges
Pipelines
Tank trucks
Rail wagons
Drums
Q1 2014

General
introduction
Business
environment
Strategy and
growth projects
Business
performance
Capital
disciplined growth
Looking
ahead
Hub Import/Export Industrial
Hub Terminal
Vital link for incoming and outgoing flows of
global oil and chemicals
Import/Export Terminal
Storage of products that are imported or
exported for end-uses in a specific region
Industrial Terminal
Complete integration with the production
process of our customers
Example: Vopak Terminal Europoort (NL) Example: Vopak Terminal Durban
(South Africa) Example: Vopak Terminal Sakra (Singapore)
Strategic logistic functions of tank terminals Three types of terminals
Roadshow presentation 10
Automotive Electronics Construction
Q1 2014

General
introduction
Business
environment
Strategy and
growth projects
Business
performance
Capital
disciplined growth
Looking
ahead
Vopak’s business model
Roadshow presentation 11
Tank storage
Blending nitrogen
Adding / cooling
Heating / unloading of ships / railcars / trucks
Loading
Excess througput fees
Monthly invoicing in arrears
Fixed rental fees for capacity
Fixed number of throughputs per year
V opak does not own the product
Monthly invoicing in advance
Note: general overview of business model. Can vary per terminal.
Sh
are
of re
ve
nu
es
Services
Q1 2014
General
introduction
Business
environment
Strategy and
growth projects
Business
performance
Capital
disciplined growth
Looking
ahead
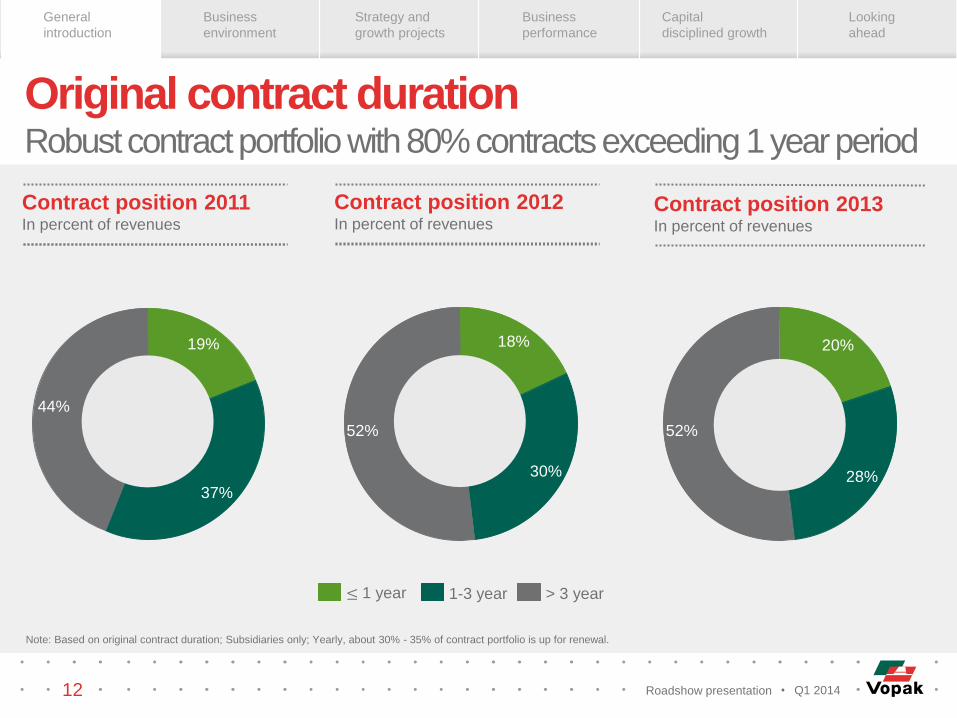
Original contract duration Robust contract portfolio with 80% contracts exceeding 1 year period
Contract position 2012 In percent of revenues
Contract position 2013 In percent of revenues
18%
52%
30% 28%
52%
20%
> 3 year ≤ 1-3 year
Note: Based on original contract duration; Subsidiaries only; Yearly, about 30% - 35% of contract portfolio is up for renewal.
Contract position 2011 In percent of revenues
19%
44%
37%
1 year
12 Roadshow presentation Q1 2014

General
introduction
Business
environment
Strategy and
growth projects
Business
performance
Capital
disciplined growth
Looking
ahead
13
Business
environment
LPG tanks at Vopak terminal Vlissingen (Netherlands). Currently constructing 36,800 cbm additional capacity

General
introduction
Business
environment
Strategy and
growth projects
Business
performance
Capital
disciplined growth
Looking
ahead
Primary competition Secondary competition Captive storage*
Independent competition renting
only to third parties
Partly using their capacity for
storing own products
Producers & traders only using
their capacity for storing their own
products
14
Vopak competitive environment Non-captive marine tank storage for liquid oil and chemical products
* Not considered as competition.
Roadshow presentation Q1 2014

General
introduction
Business
environment
Strategy and
growth projects
Business
performance
Capital
disciplined growth
Looking
ahead
15
Vopak: Global market leader In both oil and chemicals storage
Storage Capacity as per 31 December 2013
In million cbm
Note: Including inland capacity Source: Vopak; company websites.
0 2 4 6 8 10 12 14 16 18 20 22 24 26 28 30 32
Rubis
Stolt-Nielson
Odfjell
CIM
Horizon
Sunoco
IMTT
CLH
VTTI
Magellan
Nustar
Buckeye
Kindermorgan
Oiltanking
VopakVopak
Roadshow presentation Q1 2014

General
introduction
Business
environment
Strategy and
growth projects
Business
performance
Capital
disciplined growth
Looking
ahead
16
Market share according to definition
Vopak share
As a % of world market
As a % of primary
storage market**
Total
Vopak
Secondary competition
Primary competition
* Non-oil includes chemicals, vegoils, biofuels and gasses; ** Defined as the primary competition plus Vopak’s Storage Capacity. Note: In million cbm per
31 December 2013; excluding storage market for LNG. Source: Vopak own research.
Oil storage market In million cbm
8%
12%
127.2.
79.0
17.8
224.0
Non oil storage market* In million cbm
21%
25%
35.2
10.0
11.8
57.0
Total storage market In million cbm
11%
15%
162.4
89.0
29.6
282.0
Roadshow presentation Q1 2014

General
introduction
Business
environment
Strategy and
growth projects
Business
performance
Capital
disciplined growth
Looking
ahead
Mega trends that drive storage demand Growth scenarios projected for 2035 by different institutions
70-170%
GDP
15-55%
Energy demand
15-35%
Population
Source: UN (2013); World bank (2013); IMF (2013); IEA (2012); Shell (2013) and various other sources.
17 Roadshow presentation Q1 2014
General
introduction
Business
environment
Strategy and
growth projects
Business
performance
Capital
disciplined growth
Looking
ahead
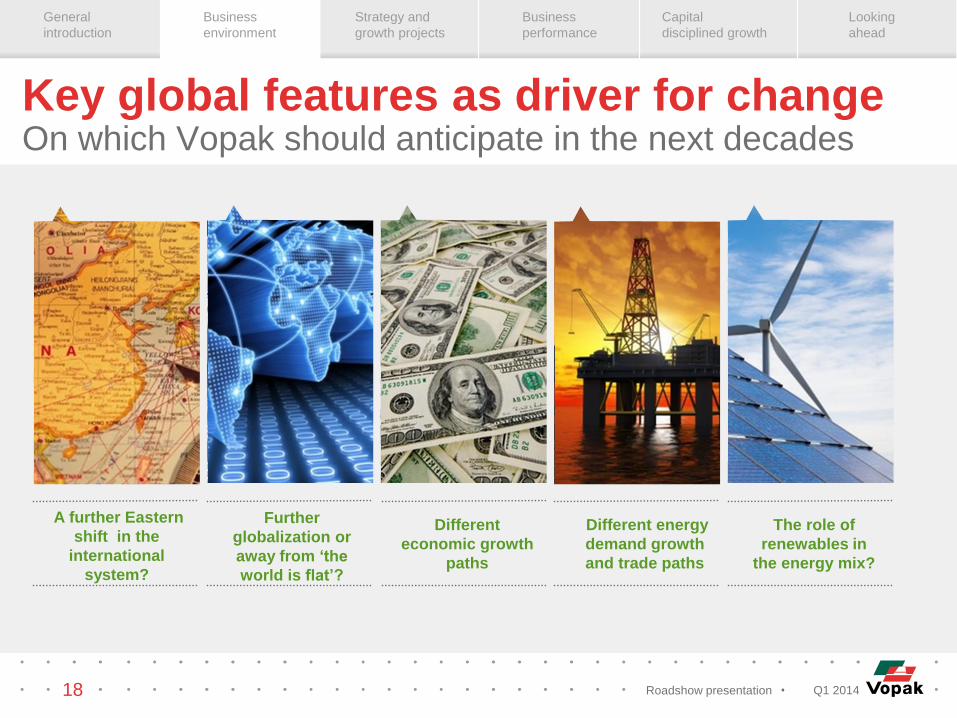
Key global features as driver for change On which Vopak should anticipate in the next decades
A further Eastern
shift in the
international
system?
Further
globalization or
away from ‘the
world is flat’?
Different
economic growth
paths
Different energy
demand growth
and trade paths
The role of
renewables in
the energy mix?
18 Roadshow presentation Q1 2014

General
introduction
Business
environment
Strategy and
growth projects
Business
performance
Capital
disciplined growth
Looking
ahead
Product developments in 2013
Oil products
The activities at hubs are
robust with growth in
deficit markets due to
refinery closures (OECD)
and economic growth
(non-OECD)
Growth in trade continues
to shift from crude
towards refined products
LNG
LNG trade develops with
more short-term contracts
and more players
The price differentials
across regions remained
substantial in 2013
Chemical products
Significant changes in
global chemical industry
due to feedstock
advantages
Repositioning of
European chemical
industry
Biofuels & vegoils
Biofuels demand grew
further
Vegoils demand grew
steadily through growth in
population
Flows into Europe in 2013
have been impacted by
increased import duties
19 Roadshow presentation Q1 2014

General
introduction
Business
environment
Strategy and
growth projects
Business
performance
Capital
disciplined growth
Looking
ahead
Roadshow presentation 20
Questions arising on the business Vopak has analyzed and quantified the boundaries
US oil and gas export scenarios LNG as transport fuel Shale gas in China
European refining & petrochemical Renewables scenarios Energy role of Africa
Q1 2014

General
introduction
Business
environment
Strategy and
growth projects
Business
performance
Capital
disciplined growth
Looking
ahead
Inside view of new ammonia tank at Banyan terminal (Singapore) 21
Strategy and
growth projects
General
introduction
Business
environment
Strategy and
growth projects
Business
performance
Capital
disciplined growth
Looking
ahead
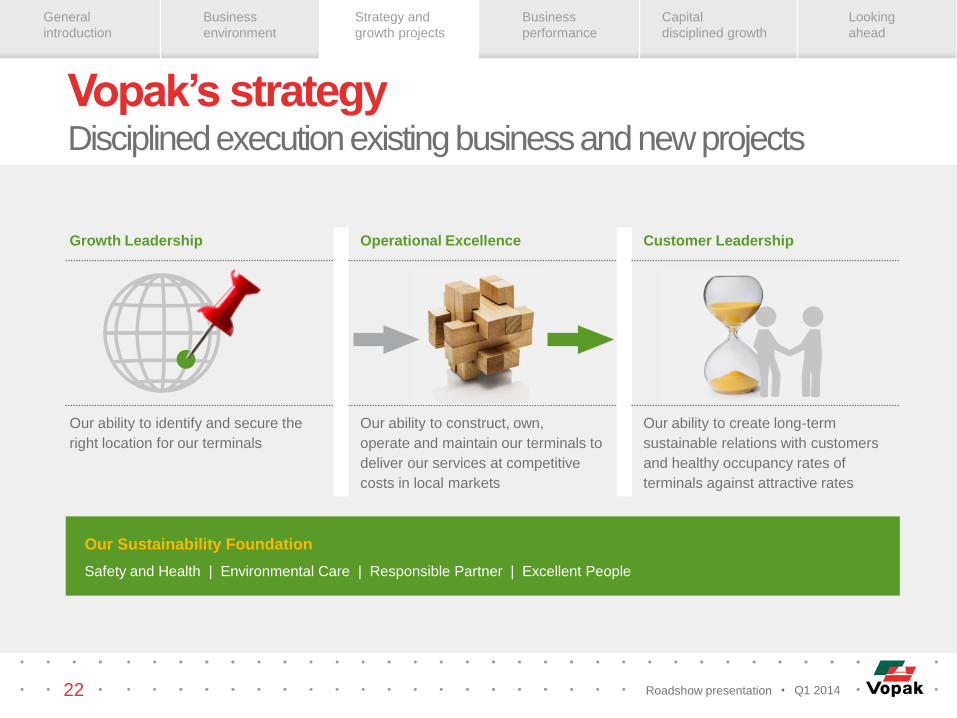
Growth Leadership Operational Excellence Customer Leadership
Our ability to identify and secure the
right location for our terminals
Our ability to construct, own,
operate and maintain our terminals to
deliver our services at competitive
costs in local markets
Our ability to create long-term
sustainable relations with customers
and healthy occupancy rates of
terminals against attractive rates
Our Sustainability Foundation
Safety and Health | Environmental Care | Responsible Partner | Excellent People
Vopak’s strategy Disciplined execution existing business and new projects
Roadshow presentation 22 Q1 2014
General
introduction
Business
environment
Strategy and
growth projects
Business
performance
Capital
disciplined growth
Looking
ahead
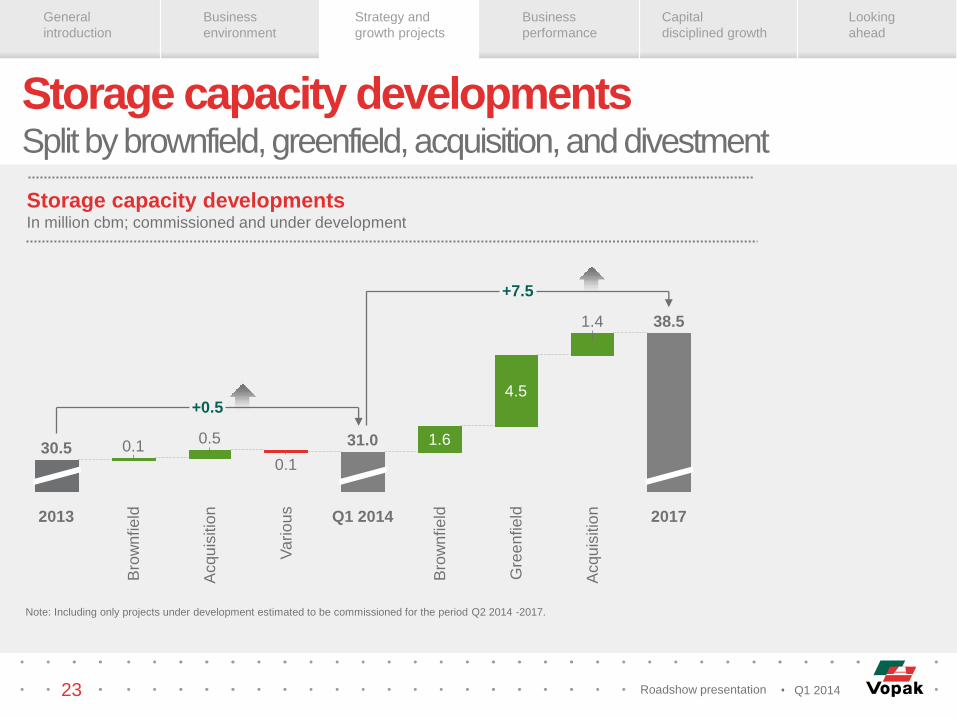
Storage capacity developments Split by brownfield, greenfield, acquisition, and divestment
Storage capacity developments In million cbm; commissioned and under development
30.5
+0.5
+7.5
2017
38.5
Acqu
isitio
n
1.4
Gre
en
field
4.5
2013
1.6
Q1 2014
31.0
Va
rio
us
Bro
wn
field
Acqu
isitio
n
0.5
Bro
wn
field
0.1 0.1
Note: Including only projects under development estimated to be commissioned for the period Q2 2014 -2017.
23 Roadshow presentation Q1 2014

General
introduction
Business
environment
Strategy and
growth projects
Business
performance
Capital
disciplined growth
Looking
ahead
24
Further alignment of Vopak’s terminal network Q1 With markets dynamics
Announced
Commissioned
Brownfield under
construction
Penjuru Phase 2
Montreal
Banyan
Note: This is only a selection of projects.
Jurong Rock
Caverns
Caojing
Quebec
Haiteng
Europoort
Vlaardingen
Acquired
Roadshow presentation Q1 2014
General
introduction
Business
environment
Strategy and
growth projects
Business
performance
Capital
disciplined growth
Looking
ahead
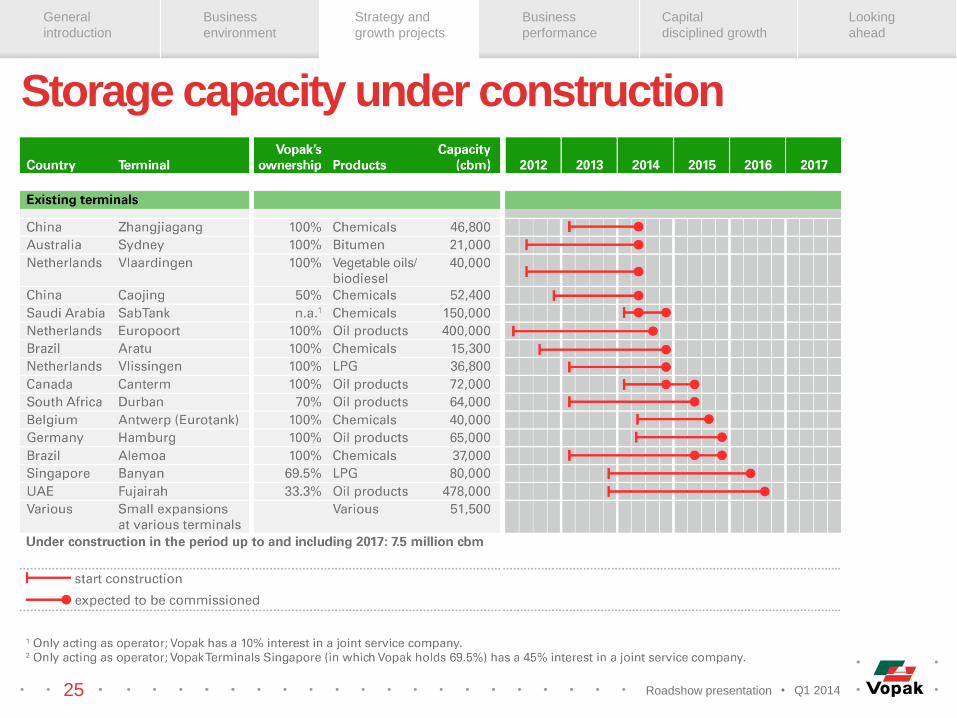
Storage capacity under construction
25 Roadshow presentation Q1 2014
General
introduction
Business
environment
Strategy and
growth projects
Business
performance
Capital
disciplined growth
Looking
ahead
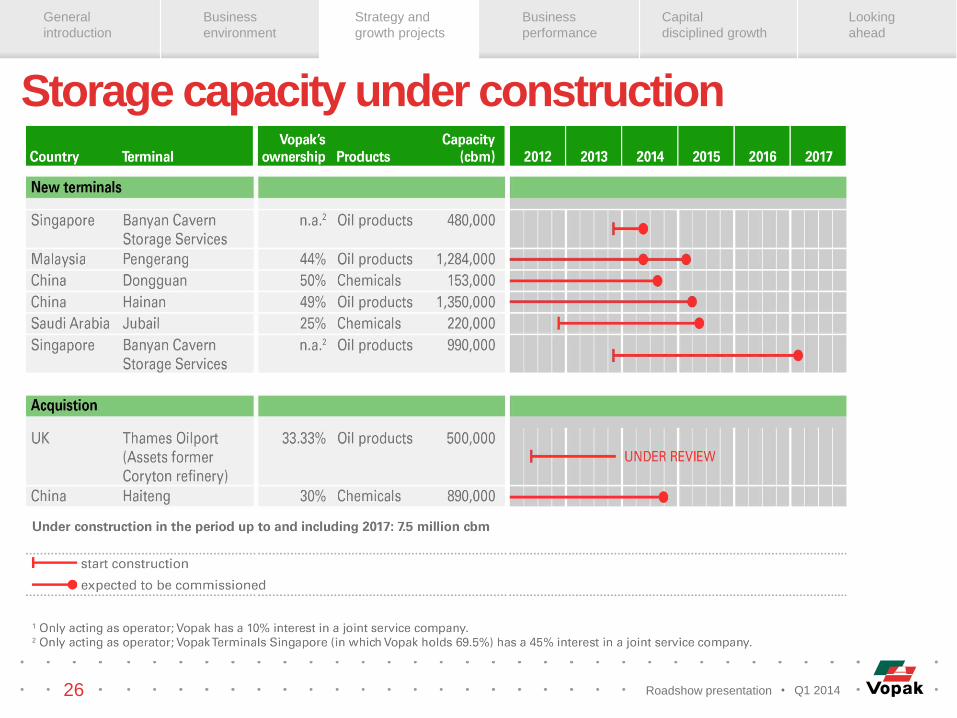
Storage capacity under construction
26 Roadshow presentation Q1 2014
General
introduction
Business
environment
Strategy and
growth projects
Business
performance
Capital
disciplined growth
Looking
ahead
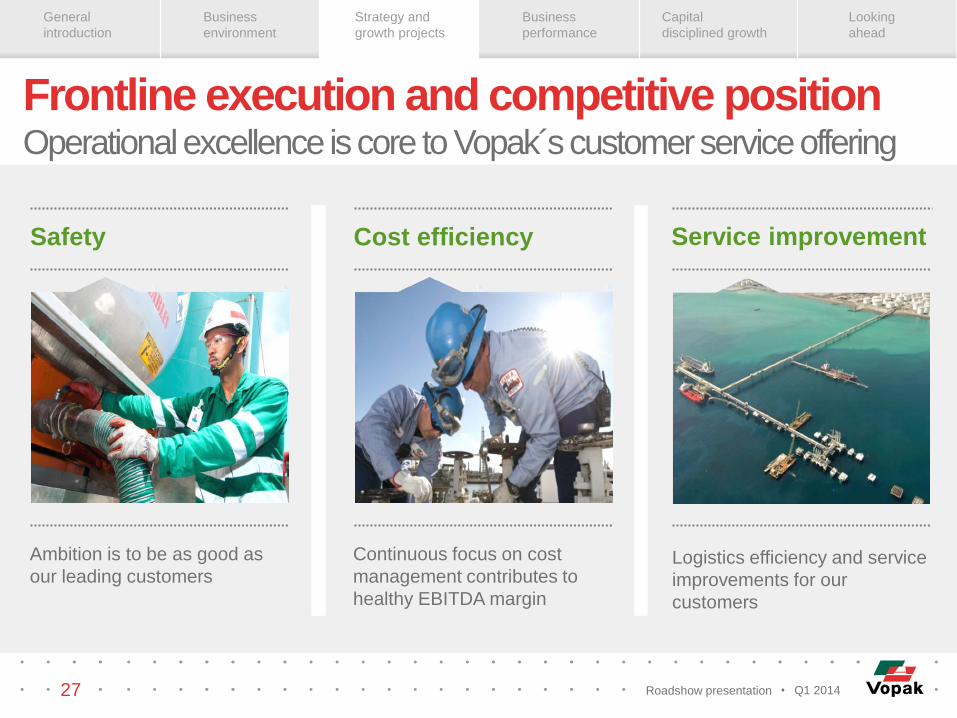
Service improvement Cost efficiency Safety
Ambition is to be as good as
our leading customers
Continuous focus on cost
management contributes to
healthy EBITDA margin
Logistics efficiency and service
improvements for our
customers
Frontline execution and competitive position Operational excellence is core to Vopak´s customer service offering
27 Roadshow presentation Q1 2014
General
introduction
Business
environment
Strategy and
growth projects
Business
performance
Capital
disciplined growth
Looking
ahead
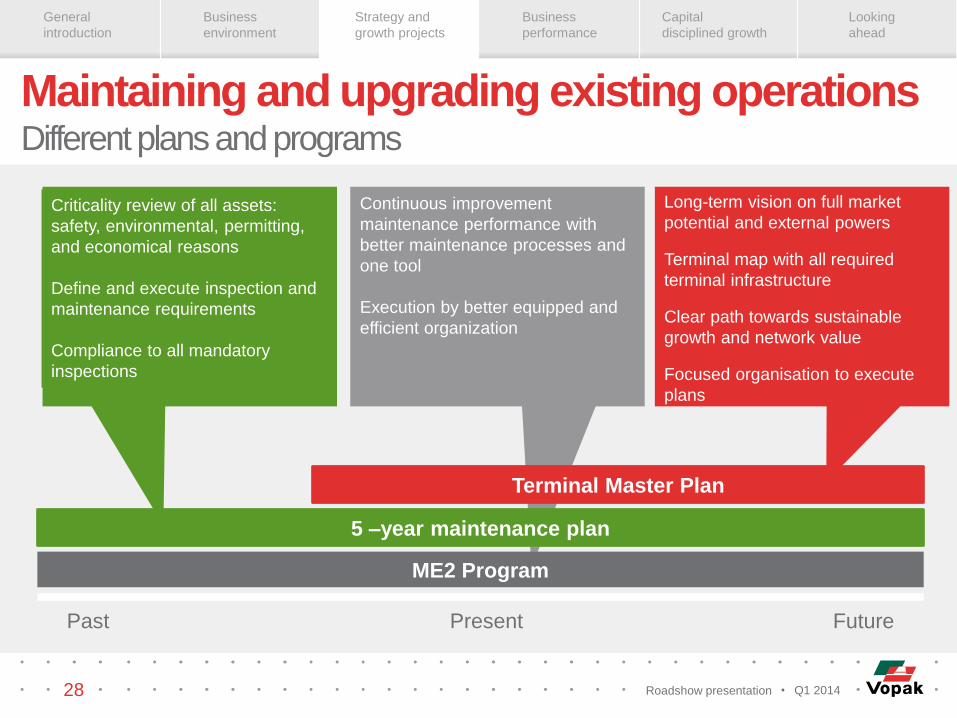
ME2 Program
Maintaining and upgrading existing operations Different plans and programs
28 Roadshow presentation
5 –year maintenance plan
Terminal Master Plan
Criticality review of all assets:
safety, environmental, permitting,
and economical reasons
Define and execute inspection and
maintenance requirements
Compliance to all mandatory
inspections
Continuous improvement
maintenance performance with
better maintenance processes and
one tool
Execution by better equipped and
efficient organization
Long-term vision on full market
potential and external powers
Terminal map with all required
terminal infrastructure
Clear path towards sustainable
growth and network value
Focused organisation to execute
plans
Past Present Future
Q1 2014

General
introduction
Business
environment
Strategy and
growth projects
Business
performance
Capital
disciplined growth
Looking
ahead
Roadmap Terminal Master Plan To align with future client needs
29 Roadshow presentation
Business drivers
Market outlook
(product scenario’s)
Customer
outlook/segmentation
Competition outlook
Legislative outlook
Commercial situation
Infrastructure
SHEQ performance
Terminal integrity
Financial performance
Organization
Key assets
Operating philosophy
(Safety/Service) culture
Organization
Automation
Commercial/service req.
Technical req.
Operational req.
Permit & safety req.
Automation req.
Investments per option
Financial outcomes
Sensitivities &
assumptions
SWOT & Gap analysis
Future market positioning
Strategic options
Business scenario’s
Positioning
& Strategic
options
Terminal
requirements
Blue print
terminal and
organization
Financial
evaluation
Market
outlook
Current
situation
Financial
evaluation
Terminal
requirements
Blue print
terminal and
organization
Commercial vision
Q1 2014
General
introduction
Business
environment
Strategy and
growth projects
Business
performance
Capital
disciplined growth
Looking
ahead
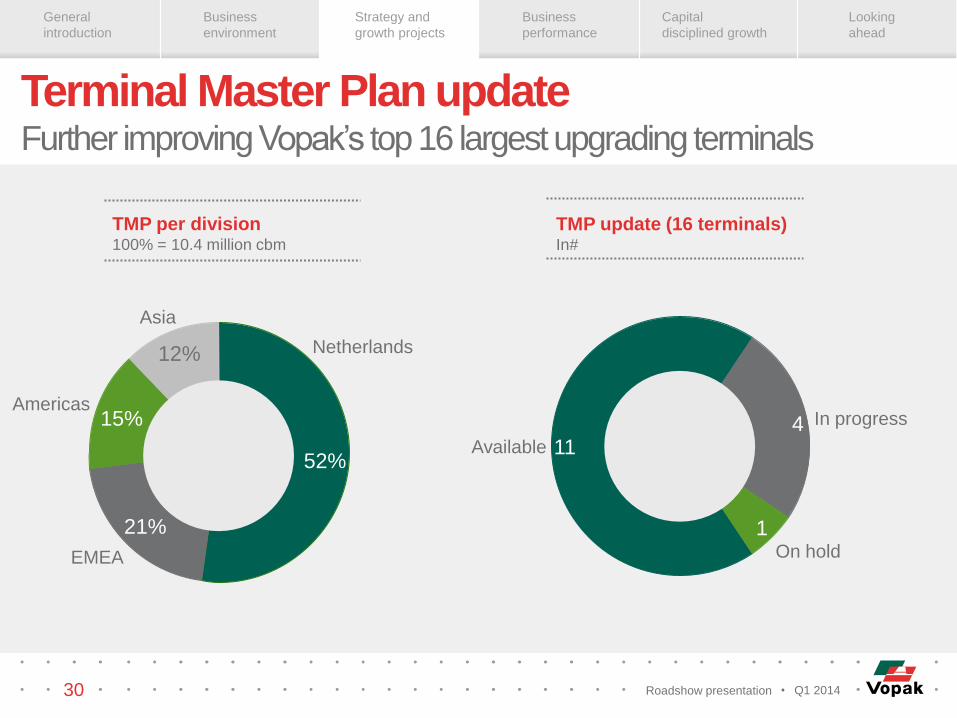
Terminal Master Plan update Further improving Vopak’s top 16 largest upgrading terminals
30 Roadshow presentation
Asia
12%
Americas 15%
EMEA
21%
Netherlands
52%
TMP per division 100% = 10.4 million cbm
On hold
In progress
1
Available
4 11
TMP update (16 terminals) In#
Q1 2014

General
introduction
Business
environment
Strategy and
growth projects
Business
performance
Capital
disciplined growth
Looking
ahead
Cost efficiency We managed our cost base without compromising safety and service
31
Group operational expenses per cbm per year
Index 2004 = 100
Note: Subsidiaries only; operational expenses excluding depreciation and exceptional items; based on storage capacity excluding out of service capacity .
0
20
40
60
80
100
120
140
2004 2005 2006 2007 2008 2009 2010 2011 2012 2013
Continuous focus
on cost
management
contributes to
healthy EBIT
margins
Roadshow presentation Q1 2014

General
introduction
Business
environment
Strategy and
growth projects
Business
performance
Capital
disciplined growth
Looking
ahead
Service improvements We invested in infrastructure that add value to our customers
32
Upgrading jetty infrastructure
We improved jetty capacity at our
terminals in Hamburg (Germany),
Antwerp (Belgium), Caojing (China) and
Banyan (Singapore).
Automation improvements We developed automation blue prints
for upgrading systems at several
terminals in order to operate more
efficient.
Debottlenecking & pipeline
connections
We enhanced our service delivery at
Westpoort terminal (the Netherlands),
invested in fuel oil pipelines at Sebarok
terminal (Singapore) and connected
the VHFL terminal with the port´s
general infrastructure in Fujairah
(UAE).
Note: The examples are for illustration purposes and do not cover all service improvements performed.
Roadshow presentation Q1 2014

General
introduction
Business
environment
Strategy and
growth projects
Business
performance
Capital
disciplined growth
Looking
ahead
Serving markets from a product perspective
33 Roadshow presentation
Customer segmentation
Access to the right people
Understand customer’s strategy
Account Management
Port attractiveness
Relevance for network
Pro-active approach
Portfolio of Terminals
Understand basic technology
Understand imbalances
Understand trade flow dynamics
Product strategy
Winning
clients and
ports
Q1 2014

General
introduction
Business
environment
Strategy and
growth projects
Business
performance
Capital
disciplined growth
Looking
ahead
Vopak’s commercial organization
34 Roadshow presentation
Global Regional Local
Global sales & marketing
Global Network Account
Directors
Global Product Directors
Business analysis
Division
Business developers
Commercial directors
Business analysis
Operating company
Commercial manager
Sales managers
Customer service
Q1 2014

General
introduction
Business
environment
Strategy and
growth projects
Business
performance
Capital
disciplined growth
Looking
ahead
Global, regional and local clients Each client segment represents about 1/3 of Vopak’s revenue
35 Roadshow presentation
Global clients Regional clients Local clients
Attractive at multiple Vopak
locations around the world
Current turnover and future
potential define Vopak’s
global network account
approach
Active in more than one
Vopak location on regional
level
Can be largest clients at a
division
Regional marketing
Active in one Vopak location
Can be largest clients at a
specific Vopak location
Local sales approach
Q1 2014

General
introduction
Business
environment
Strategy and
growth projects
Business
performance
Capital
disciplined growth
Looking
ahead
Sustainability
The core of every decision
36 Roadshow presentation
Have the right people
and create an agile
and solution driven
culture
Provide a healthy
and safe workplace
for our employees
and contractors
Be a responsible
partner for our
stakeholders
Excellent people
Safety and Health Environmental care
Responsible partner
Be energy and water
efficient and reduce
emissions and waste
Q1 2014

General
introduction
Business
environment
Strategy and
growth projects
Business
performance
Capital
disciplined growth
Looking
ahead
Safety We improved our process and own employee safety results
Roadshow presentation 37
Total Injury Rate Total injuries per million hours worked by own employees
2007
6.2 -10%
2013
5.8 6.5
2008 2010 2009
3.2 1.9
2012
2.1
2011
3.0
Process Incidents # incidents
133 154 12794
2012
-26%
2013 2011 2010
The lost time injury rate (LTIR) Total injuries leading to lost time per million hours worked
by own employees and contractors
1.7 1.4
2009 2008
1.4
2007
-14%
2011
0.7 1.3
2010
1.1
2013
0.6
2012
Q1 2014
General
introduction
Business
environment
Strategy and
growth projects
Business
performance
Capital
disciplined growth
Looking
ahead
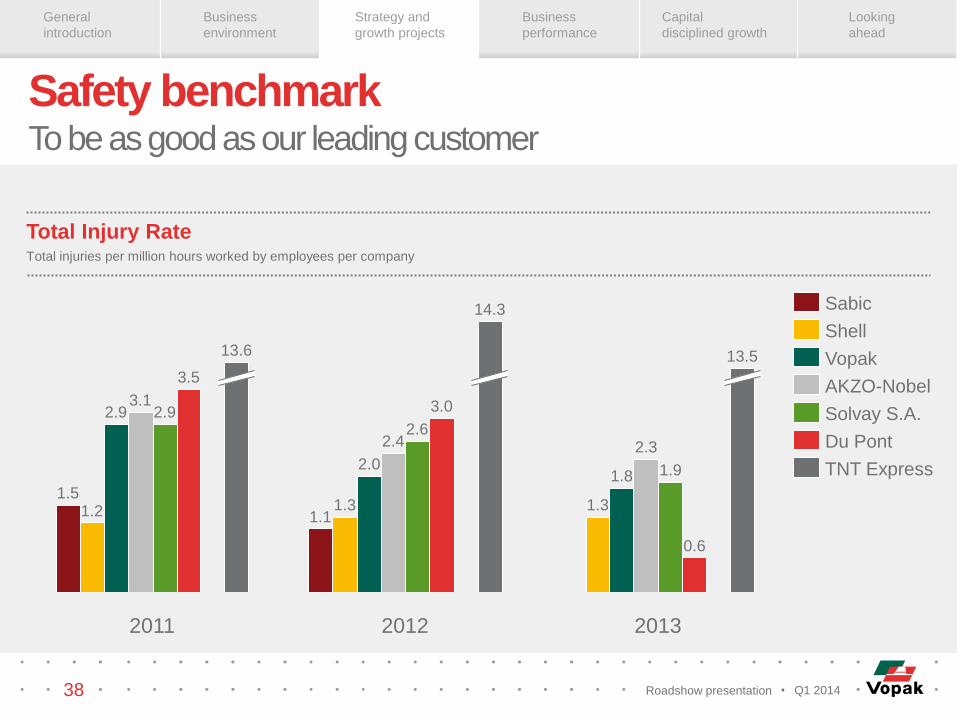
Safety benchmark To be as good as our leading customer
Roadshow presentation 38
Total Injury Rate Total injuries per million hours worked by employees per company
2012
14.3
3.0
2.6 2.4
2.0
1.3 1.1
2011
13.6
3.5
2.9 2.9 3.1
1.2 1.5
1.8
2013
0.6
1.9
2.3
1.3
13.5
TNT Express
Solvay S.A.
Du Pont
AKZO-Nobel
Vopak
Shell
Sabic
Q1 2014

General
introduction
Business
environment
Strategy and
growth projects
Business
performance
Capital
disciplined growth
Looking
ahead
Business
performance 2013
Inside view of new ammonia tank at Banyan terminal (Singapore) 39

General
introduction
Business
environment
Strategy and
growth projects
Business
performance
Capital
disciplined growth
Looking
ahead
Strategic value creation Value creation through capital disciplined growth and strong
cash flow focus
Tank terminal
strategy
Focus
divestments
Full potential
excellence
Growth
strategy
Note: graph for illustration purposes only.
2013 2012 2011 2010 2009 2008 2007 2006 2005 2004 2003
40
Alignment network
and competitive
position
Roadshow presentation Q1 2014

General
introduction
Business
environment
Strategy and
growth projects
Business
performance
Capital
disciplined growth
Looking
ahead
41
Value drivers of the financial performance Occupancy rates and capacity expansions determine (near) future
Occupancy
improvements
Operational
efficiency gains
Capacity
expansion
Near past 2010 – 2012
88%
Full potential
in the range
of 90-95%
Upward potential?
Note: Tickmarks for illustration purposes only.
Present 2013
Near future 2014 - 2016
Post 2016 >2016
Roadshow presentation Q1 2014
General
introduction
Business
environment
Strategy and
growth projects
Business
performance
Capital
disciplined growth
Looking
ahead
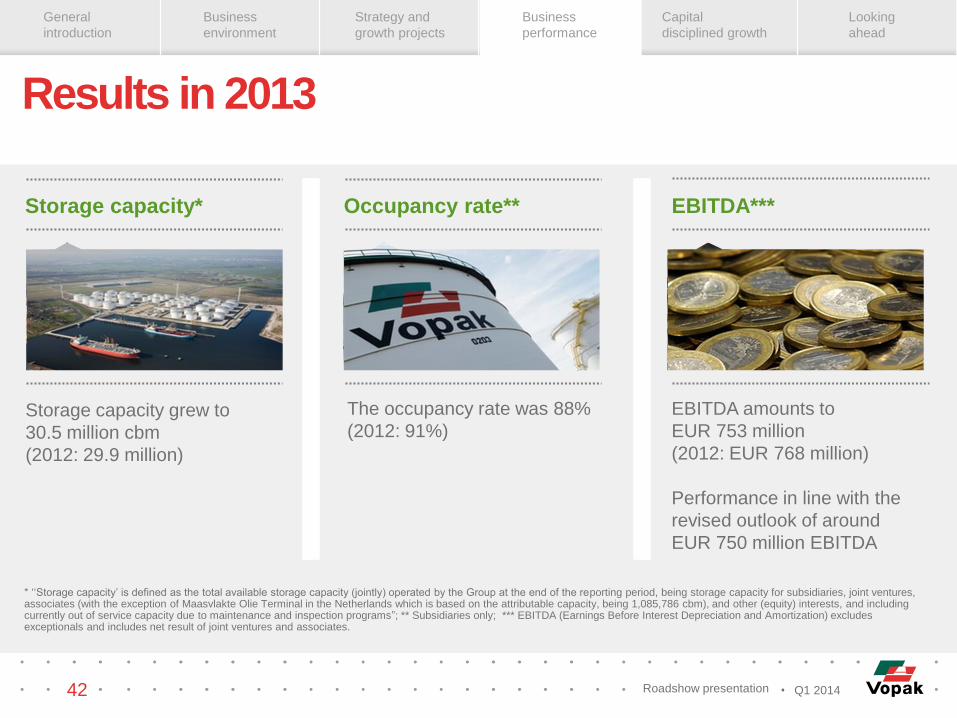
Results in 2013
EBITDA*** Occupancy rate** Storage capacity*
Storage capacity grew to
30.5 million cbm
(2012: 29.9 million)
The occupancy rate was 88%
(2012: 91%)
EBITDA amounts to
EUR 753 million
(2012: EUR 768 million)
Performance in line with the
revised outlook of around
EUR 750 million EBITDA
* ‘‘Storage capacity’ is defined as the total available storage capacity (jointly) operated by the Group at the end of the reporting period, being storage capacity for subsidiaries, joint ventures, associates (with the exception of Maasvlakte Olie Terminal in the Netherlands which is based on the attributable capacity, being 1,085,786 cbm), and other (equity) interests, and including currently out of service capacity due to maintenance and inspection programs”; ** Subsidiaries only; *** EBITDA (Earnings Before Interest Depreciation and Amortization) excludes exceptionals and includes net result of joint ventures and associates.
42 Roadshow presentation Q1 2014

General
introduction
Business
environment
Strategy and
growth projects
Business
performance
Capital
disciplined growth
Looking
ahead
Topics influencing results 2013
Capacity
expansions Regulations Currency effects
and pensions
43 Roadshow presentation Q1 2014

General
introduction
Business
environment
Strategy and
growth projects
Business
performance
Capital
disciplined growth
Looking
ahead
Occupancy rate developments Higher rate compared to Q4 2013 but lower than Q1 2013
Occupancy rate In percent
2012 2013
90-95%
85-90%
Q1
88
Q4
87
Q3
87
Q2
88
Q1
89
Q4
90
Q3
91
Q2
90
Q1
93
’13
88
’12
91
’11
93
’10
93
’09
94
’08
95
’07
96
’06
94
’05
92
’04
84
Note: Subsidiaries only.
Current playing field
Full potential playing field
44
2014
Roadshow presentation Q1 2014

General
introduction
Business
environment
Strategy and
growth projects
Business
performance
Capital
disciplined growth
Looking
ahead
EBIT(DA) margin development Capital disciplined growth strategy requires strong focus on margins
EBIT(DA) margin In percent
Note: Excluding exceptional items; excluding net result from joint ventures and associates.
0
10
20
30
40
50
60
70
2004 2005 2006 2007 2008 2009 2010 2011 2012 2013
EBIT margin
EBITDA margin
Competitive position Alignment network
45 Roadshow presentation Q1 2014

General
introduction
Business
environment
Strategy and
growth projects
Business
performance
Capital
disciplined growth
Looking
ahead
Vopak’s growth strategy New strategic alliances and expansions at existing locations
Note: Including only announced projects under development estimated to be commissioned for the period 2014-2017. The number of terminals for 2017 is indicative
and based on these announced projects under current circumstances.
Storage capacity In million cbm
3,7 4,0 3,8 4,0 3,78,2 8,7 9,0 6,6 8,1 8,1 8,1
10,012,5 13,0 13,0
15,1 15,1 15,5 15,8 16,7
17,5 18,1 18,319,7
20,3 20,8 21,321,9
22,2 22,2
3,32,32,32,31,61,61,51,51,51,51,41,41,41,11,11,1
2013
30.5
2012
29.9
2011 2014
Q1
2010
28.8
+11.1
2017
38.5
2016
27.8
37.5
2015
+7.5
37.0
22.2
2014
FY
34.2
31.0
2009
28.3
2008
27.1
2007
21.8
2006
21.2
2005
20.4
2004
20.2
2003
19.9
Subsidiaries Joint ventures and associates Only acting as operator
22 53
Terminals as per Q1 2014 In #
28 53
Terminals as per 2017 In #
2
3
77
84
46 Roadshow presentation Q1 2014

General
introduction
Business
environment
Strategy and
growth projects
Business
performance
Capital
disciplined growth
Looking
ahead
Q1 2014
results
Lifting dome roof for Midex project at Europoort terminal (the Netherlands) 47
General
introduction
Business
environment
Strategy and
growth projects
Business
performance
Capital
disciplined growth
Looking
ahead
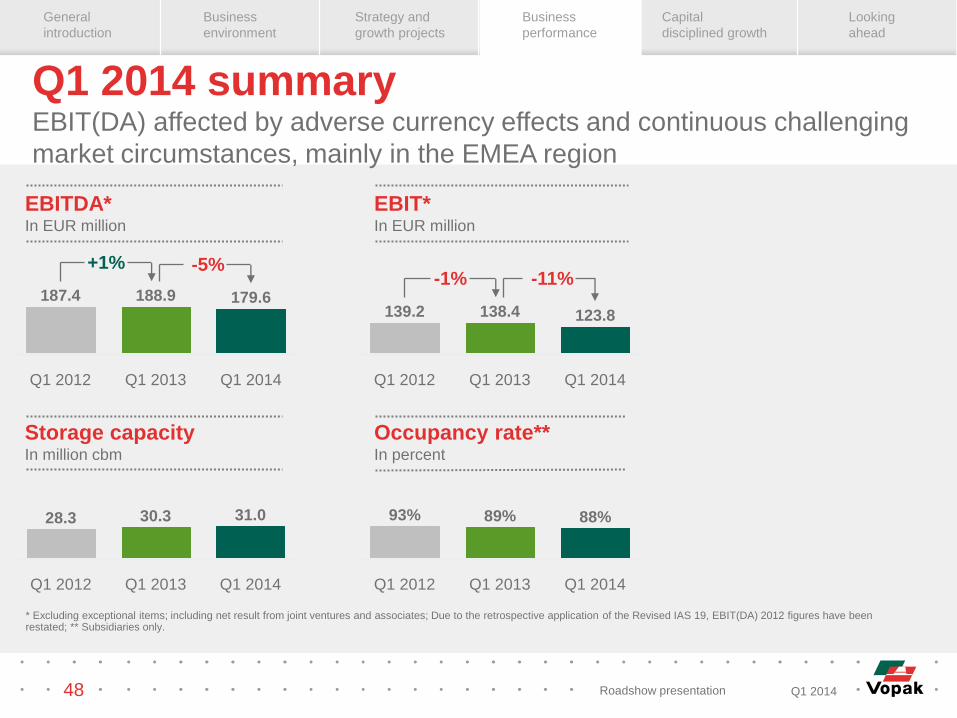
EBITDA* In EUR million
* Excluding exceptional items; including net result from joint ventures and associates; Due to the retrospective application of the Revised IAS 19, EBIT(DA) 2012 figures have been restated; ** Subsidiaries only.
EBIT* In EUR million
Storage capacity In million cbm
Occupancy rate** In percent
+1% -5%
Q1 2014 Q1 2013
188.9
Q1 2012
187.4 179.6
Q1 2014 Q1 2013
30.3
Q1 2012
28.3 31.0
Q1 2014 Q1 2013
89%
Q1 2012
93% 88%
-1% -11%
Q1 2014 Q1 2013
138.4
Q1 2012
139.2 123.8
Q1 2014 summary EBIT(DA) affected by adverse currency effects and continuous challenging
market circumstances, mainly in the EMEA region
Roadshow presentation 48 Q1 2014

General
introduction
Business
environment
Strategy and
growth projects
Business
performance
Capital
disciplined growth
Looking
ahead
Netherlands
Note: EBITDA in EUR million excluding exceptional items and including joint ventures and associates; Due to the retrospective application of the Revised IAS 19, EBITDA 2012 figures have been restated.
Q1 2014 EBITDA Adverse currency effects in Asia and Americas combined with challenging
market circumstances, mainly in the EMEA region
EMEA
Asia Americas
-6% +2%
Q1 2014
60.9
Q1 2013
59.8
Q1 2012
63.3
+5% -6%
Q1 2014
66.4
Q1 2013
70.7
Q1 2012
67.3 -3% -12%
Q1 2014
23.3
Q1 2013
24.0
Q1 2012
27.3
+7% -17%
Q1 2014
28.9
Q1 2013
34.7
Q1 2012
32.3 EBITDA*
-5%
26.0
Q1 2014
179.6
Q1 2013
188.9
Q1 2012
187.4
+1%
22.0 30.2
49 Roadshow presentation Q1 2014
General
introduction
Business
environment
Strategy and
growth projects
Business
performance
Capital
disciplined growth
Looking
ahead
Netherlands
Note: Amounts in EUR million; including associates; excluding exceptional items.
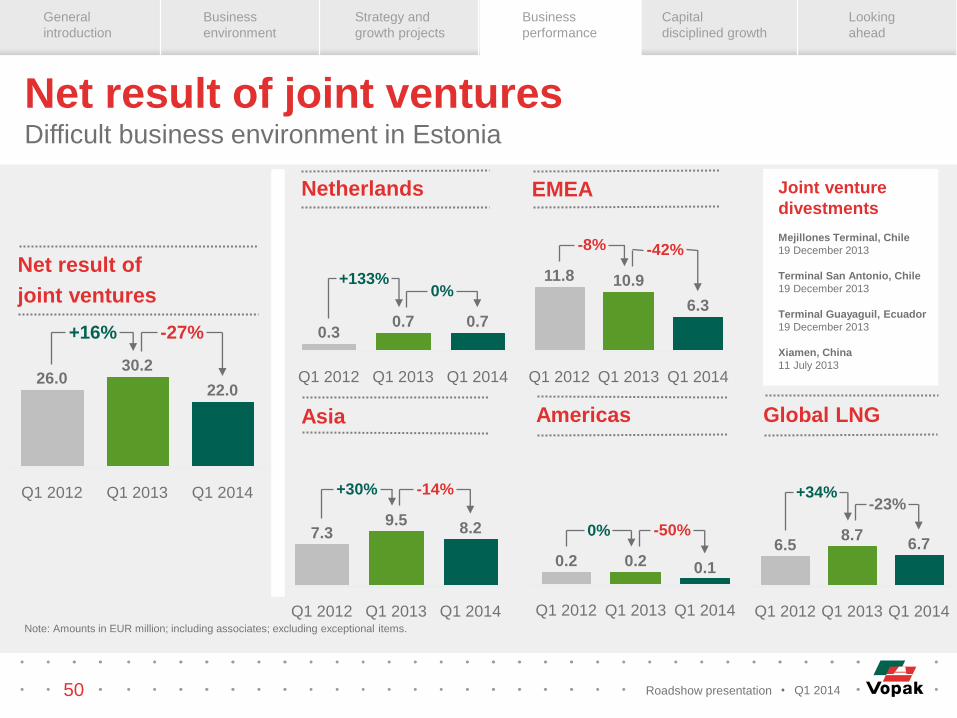
Net result of joint ventures Difficult business environment in Estonia
EMEA
Asia Americas
Q1 2014
0.7
Q1 2013
0.7
Q1 2012
0.3
+133% 0%
+30%
7.3
Q1 2013
8.2 9.5
Q1 2014
-14%
Q1 2012
0.1
Q1 2014 Q1 2012
0.2
Q1 2013
-50% 0%
0.2
6.3
-42% -8%
Q1 2014
11.8
Q1 2013
10.9
Q1 2012
Net result of
joint ventures
Q1 2013
30.2
+16% -27%
Q1 2014
22.0
Q1 2012
26.0
Global LNG
-23%
Q1 2014 Q1 2013
8.7
Q1 2012
+34%
6.5 6.7
50
Joint venture
divestments
Mejillones Terminal, Chile
19 December 2013
Terminal San Antonio, Chile
19 December 2013
Terminal Guayaguil, Ecuador
19 December 2013
Xiamen, China
11 July 2013
Roadshow presentation Q1 2014

General
introduction
Business
environment
Strategy and
growth projects
Business
performance
Capital
disciplined growth
Looking
ahead
FX translation effects Adverse translation effects of EUR 7.6 million in Q1 2014
2013 EBITDA transactional currencies In percent
Note: Excluding exceptional items.
25%
33%
28%
14%
Other
EUR
SGD
USD
-0,1
-1,6
-5,6
-0,3
-7,6
Asia
EMEA
Netherlands
Total
Non allocated
Americas
51
FX translation-effect on Q1 2014 EBITDA In EUR million
Roadshow presentation Q1 2014

General
introduction
Business
environment
Strategy and
growth projects
Business
performance
Capital
disciplined growth
Looking
ahead
Netherlands
Note: Subsidiaries only.
Occupancy rate Asia and Americas stable, EMEA region challenging
EMEA
Asia Americas
-8pp +3pp
Q1 2014 Q1 2013
85%
Q1 2012
93% 88%
0pp 0pp
Q1 2014 Q1 2013
95%
Q1 2012
95% 95%
0pp -4pp
Q1 2014 Q1 2013
91%
Q1 2012
95% 91%
0pp -9pp
Q1 2014 Q1 2013
89%
Q1 2012
89% 80%
Occupancy rate
-4pp -1pp
Q1 2014 Q1 2013
89%
Q1 2012
93% 88%
52 Roadshow presentation Q1 2014

General
introduction
Business
environment
Strategy and
growth projects
Business
performance
Capital
disciplined growth
Looking
ahead
Q1 2014 Q1 2013
9.5
Q1 2012
8.5 9.5
Q1
2014
60.9
Q4
2013
62.0
Q3
2013
61.3
Q2
2013
59.5
Q1
2013
59.8
Q4
2012
68.2
Q3
2012
69.6
Q2
2012
66.2
Q1
2012
63.3
Q1
2014
88%
Q4
2013
83%
Q3
2013
82%
Q2
2013
84%
Q1
2013
85%
Q4
2012
87%
Q3
2012
89%
Q2
2012
87%
Q1
2012
93%
EBITDA* In EUR million
Occupancy rate** In percent
Note: Due to the retrospective application of the Revised IAS 19, EBIT for 2012 has been restated; * Including net result from joint ventures and associates; excluding exceptional items; ** Subsidiaries only. .
Storage capacity In million cbm
Netherlands Challenges remain
Roadshow presentation 53 Q1 2014

General
introduction
Business
environment
Strategy and
growth projects
Business
performance
Capital
disciplined growth
Looking
ahead
EMEA Challenging business circumstances
Q1 2014 Roadshow presentation 54
Q3
2013
33.1
Q2
2013
33.6
Q1
2013
34.7
Q4
2012
31.5
Q3
2012
31.8
Q2
2012
36.7
Q1
2012
32.3
Q1
2014
28.9
Q4
2013
34.2
Q1 2014 Q1 2013
9.4
Q1 2012
8.4 9.6
Q1
2014
80%
Q4
2013
85%
Q3
2013
88%
Q2
2013
90%
Q1
2013
89%
Q4
2012
87%
Q3
2012
87%
Q2
2012
87%
Q1
2012
89%
EBITDA* In EUR million
Occupancy rate** In percent
Note: Due to the retrospective application of the Revised IAS 19, EBIT for 2012 has been restated; * Including net result from joint ventures and associates; excluding exceptional items; ** Subsidiaries only. .
Storage capacity In million cbm

General
introduction
Business
environment
Strategy and
growth projects
Business
performance
Capital
disciplined growth
Looking
ahead
Asia Steady performance offset by adverse currency effects
Q1 2014 Roadshow presentation 55
Q1
2014
66.4
Q4
2013
68.0
Q3
2013
70.6
Q2
2013
73.2
Q1
2013
70.7
Q4
2012
67.5
Q3
2012
71.0
Q2
2012
67.3
Q1
2012
67.3
Q1 2014 Q1 2013
7.3
Q1 2012
7.3 7.4
Q1
2014
95%
Q4
2013
94%
Q3
2013
94%
Q2
2013
95%
Q1
2013
95%
Q4
2012
93%
Q3
2012
94%
Q2
2012
95%
Q1
2012
95%
EBITDA* In EUR million
Occupancy rate** In percent
Note: Due to the retrospective application of the Revised IAS 19, EBIT for 2012 has been restated; * Including net result from joint ventures and associates; excluding exceptional items; ** Subsidiaries only. .
Storage capacity In million cbm

General
introduction
Business
environment
Strategy and
growth projects
Business
performance
Capital
disciplined growth
Looking
ahead
Americas Steady performance offset by adverse currency effects
Q1 2014 Roadshow presentation 56
Q1
2014
23.3
Q4
2013
21.2
Q3
2013
22.1
Q2
2013
28.0
Q1
2013
24.0
Q4
2012
25.6
Q3
2012
24.9
Q2
2012
24.4
Q1
2012
27.3
Q1 2014
3.7***
Q1 2013
3.3
Q1 2012
3.3
Q4
2013
Q1
2014
91% 89%
Q3
2013
89%
Q2
2013
89%
Q1
2013
91%
Q4
2012
93%
Q3
2012
94%
Q2
2012
93%
Q1
2012
95%
EBITDA* In EUR million
Occupancy rate** In percent
Note: Due to the retrospective application of the Revised IAS 19, EBIT for 2012 has been restated; * Including net result from joint ventures and associates; excluding exceptional items; ** Subsidiaries only; *** Q1 2014 includes the recently acquired Canterm terminals at 27 March 2014. .
Storage capacity In million cbm
General
introduction
Business
environment
Strategy and
growth projects
Business
performance
Capital
disciplined growth
Looking
ahead
57
Capital
disciplined growth
The Pengerang project has 1.3 million cbm under development (Malaysia)
General
introduction
Business
environment
Strategy and
growth projects
Business
performance
Capital
disciplined growth
Looking
ahead
58
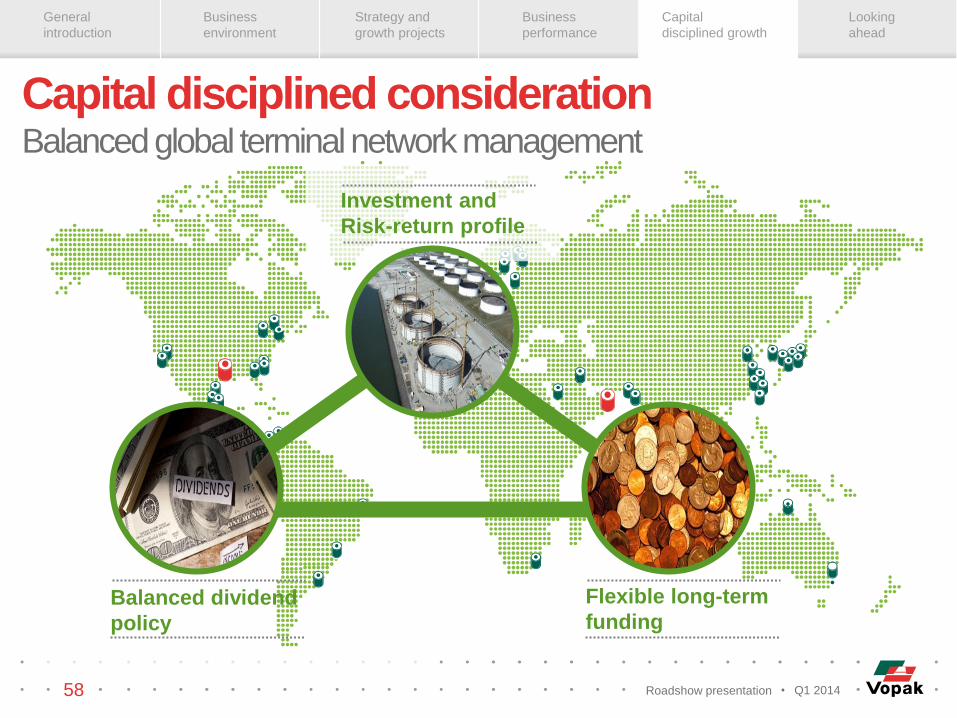
Capital disciplined consideration Balanced global terminal network management
Investment and
Risk-return profile
Balanced dividend
policy
Flexible long-term
funding
Roadshow presentation Q1 2014

General
introduction
Business
environment
Strategy and
growth projects
Business
performance
Capital
disciplined growth
Looking
ahead
Return requirements for investment Important elements to consider
59
Footprint in emerging markets
Mitigating downward risks
Optimization growth opportunities
Commercial coverage on projects
Local WACC
Strategic
alliances
Option
value
First-mover
advantage
Pay-back period
Project NPV / IRR
Equity IRR
Contracted infrastructure
Launching Customers
MoUs/LoIs
Growth along
with key accounts
Contribution from key accounts
IV
III
I
V
VI
II
Roadshow presentation Q1 2014

General
introduction
Business
environment
Strategy and
growth projects
Business
performance
Capital
disciplined growth
Looking
ahead
Risk-return profile per type of investment Vopak’s capital disciplined growth: different concepts for different
purposes
60
Low High
Risk
Low
High
Re
turn
Contracted infrastructure
(e.g. LNG and industrial terminals)
Growth projects with
launching customers
Growth project in
emerging countries
with only MoU’s
Brownfield
Greenfield
Option value
Roadshow presentation Q1 2014

General
introduction
Business
environment
Strategy and
growth projects
Business
performance
Capital
disciplined growth
Looking
ahead
Expansion projects Vopak’s project management
61
Scenario
analysis and
product studies
Scenario
analysis
Identifi-
cation
Selection
Generate,
develop and
select the
preferred
project
option(s)
Identify
opportuni-ties
Determine
feasibility and
align with
business
strategy
Definition
Develop the
project scope,
cost and get
the project
funded
Execution
Engineer and
build the asset
consistent with
the sanctioned
scope, cost
and schedule
Evalua-
tion
Evaluate the
asset to ensure
performance to
the sanctioned
business case
Vopak project management
Vopak’s project execution management
(worldwide, regional and local)
FID
Roadshow presentation Q1 2014
General
introduction
Business
environment
Strategy and
growth projects
Business
performance
Capital
disciplined growth
Looking
ahead
62
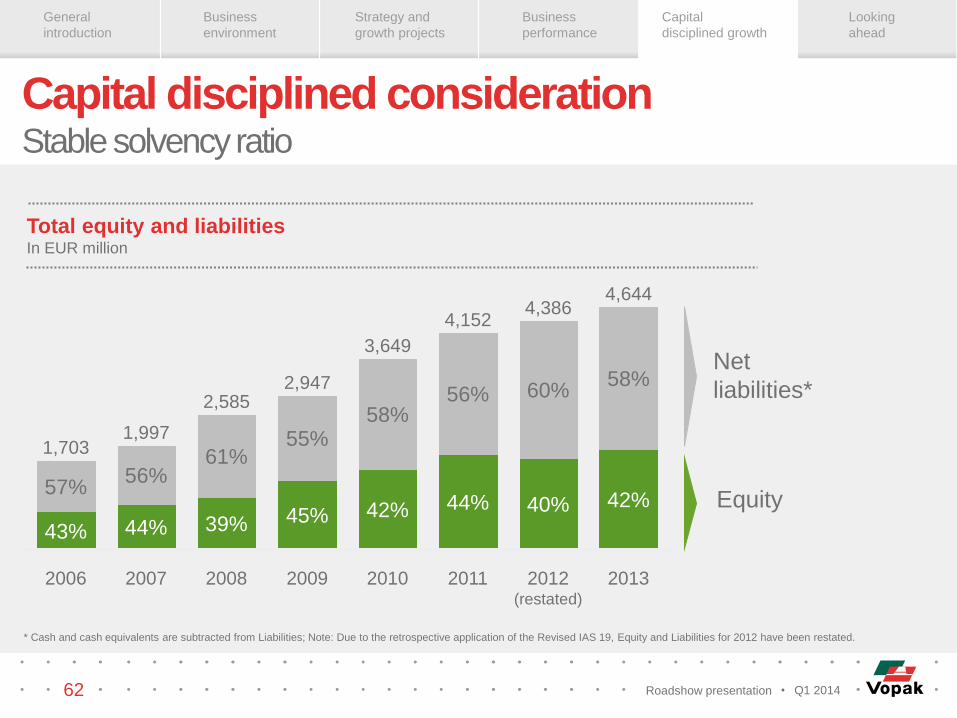
Capital disciplined consideration Stable solvency ratio
Total equity and liabilities In EUR million
* Cash and cash equivalents are subtracted from Liabilities; Note: Due to the retrospective application of the Revised IAS 19, Equity and Liabilities for 2012 have been restated.
60% 58%
42%
2013
4,644
2012 (restated)
4,386
2011
4,152
2010
3,649
2009
2,947
2008
2,585
2007
1,997
2006
1,703 55%
44%
56% 57%
43% 45%
61%
39% 42%
58%
44%
56%
40%
Net
liabilities*
Equity
Roadshow presentation Q1 2014

General
introduction
Business
environment
Strategy and
growth projects
Business
performance
Capital
disciplined growth
Looking
ahead
Capital disciplined growth Total investments and approved expansion capex as per Q1 Total investments 2008-2016 In EUR million
Note: Total approved expansion capex related to 7.5 million cbm under development is ~EUR 1,700 million; * Forecasted Sustaining and Improvement Capex; ** Total approved expansion capex related to 7.5 million cbm under development in the years Q2 2014 up to and including 2016.
Q2 2014-
2016
~900-1,200
~400
2,012
2008-2010
1,899
2011-2013
Other capex*
Expansion
capex**
~500-800
~400
Expansion capex** In EUR million; 100% = EUR 1,700 million
Remaining
Vopak share
in capex
(Group
capex and
equity share
in JV’s)
Group capex spent
Contributed Vopak equity share in JV’s
Total partner’s equity share in JV’s
Total non recourse finance in JV’s
~1,300
63
Forecasted capex
Roadshow presentation Q1 2014

General
introduction
Business
environment
Strategy and
growth projects
Business
performance
Capital
disciplined growth
Looking
ahead
64
Vopak capital disciplined growth strategy Supported by a solid capital structure with balanced leverage
Net debt
: EBITDA
Net debt : EBITDA ratio 0 6
0-2 2-3.75 >3.75
S&P
rating >A- <BBB
Limited
leverage
Balanced
leverage
Broader
diversification
of funding
sources
Positioning
Vopak
as reliable joint
venture partner
Increased ability
to rapidly seize
investment
opportunities
Positioning Vopak
as reliable
counterparty to
clients
Benefits
Relatively
high
leverage
Roadshow presentation Q1 2014
General
introduction
Business
environment
Strategy and
growth projects
Business
performance
Capital
disciplined growth
Looking
ahead
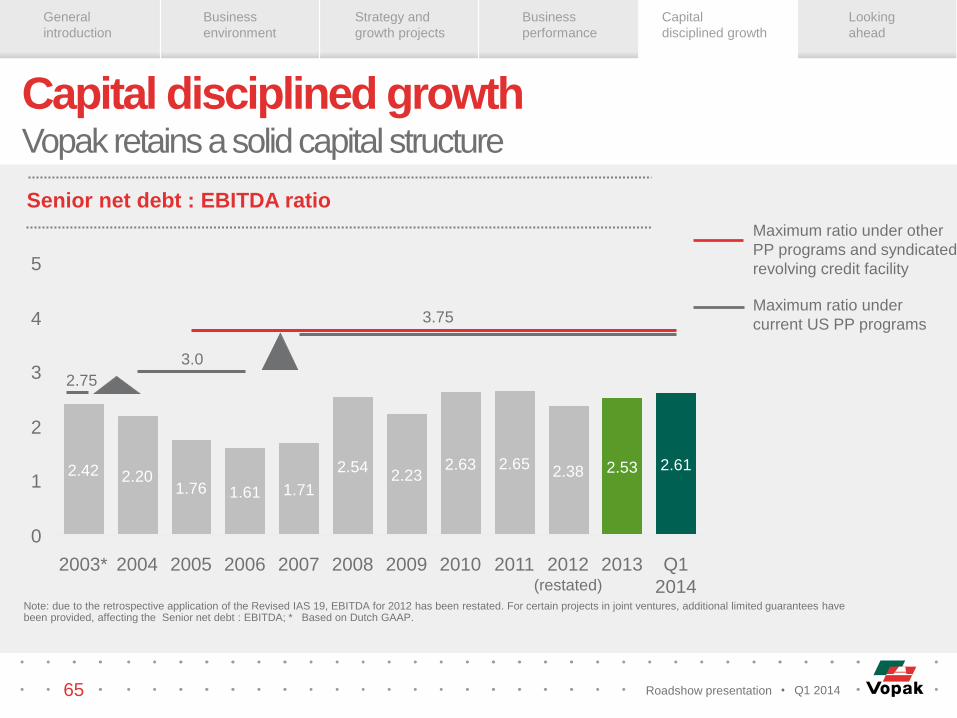
Capital disciplined growth Vopak retains a solid capital structure
Senior net debt : EBITDA ratio
Note: due to the retrospective application of the Revised IAS 19, EBITDA for 2012 has been restated. For certain projects in joint ventures, additional limited guarantees have been provided, affecting the Senior net debt : EBITDA; * Based on Dutch GAAP.
Maximum ratio under
current US PP programs
Maximum ratio under other
PP programs and syndicated
revolving credit facility
0
1
2
3
4
5
Q1
2014
2013
2.53
2012 (restated)
2.38
2011
2.65
2010
2.63
2009
2.23
2008
2.54
2007
1.71
2006
1.61
2005
1.76
2004
2.20
2003*
2.42 2.61
65
2.75
3.0
3.75
Roadshow presentation Q1 2014
General
introduction
Business
environment
Strategy and
growth projects
Business
performance
Capital
disciplined growth
Looking
ahead
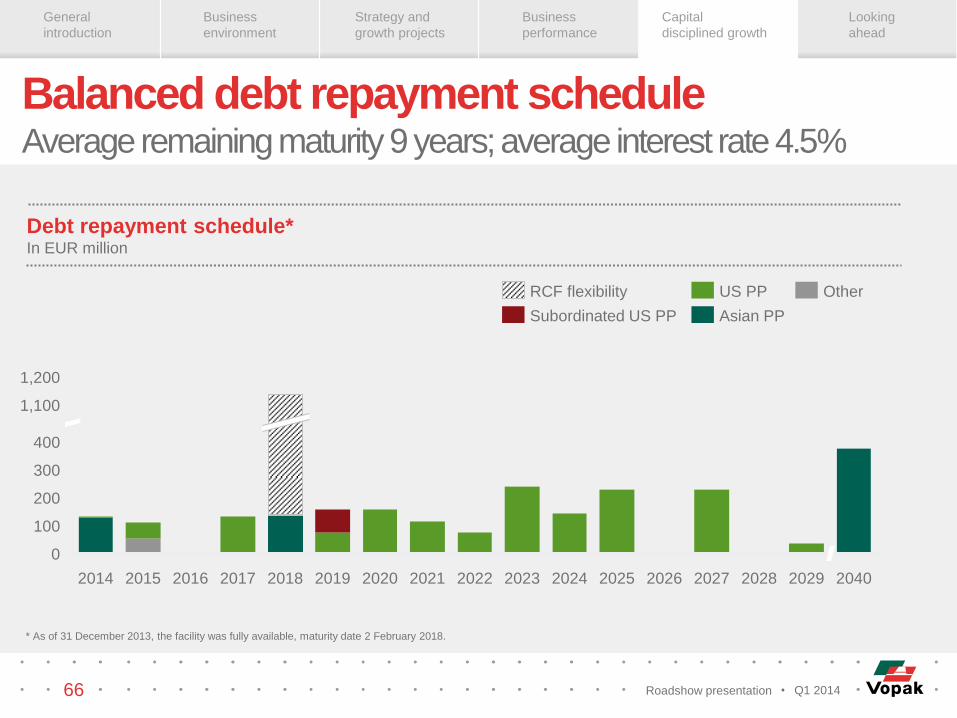
Balanced debt repayment schedule Average remaining maturity 9 years; average interest rate 4.5%
Debt repayment schedule* In EUR million
* As of 31 December 2013, the facility was fully available, maturity date 2 February 2018.
1,100
300
400
0
1,200
100
200
2018 2017 2040 2029 2028 2027 2026 2025 2024 2023 2022 2021 2020 2019 2016 2015 2014
US PP Other
Asian PP Subordinated US PP
RCF flexibility
66 Roadshow presentation Q1 2014
General
introduction
Business
environment
Strategy and
growth projects
Business
performance
Capital
disciplined growth
Looking
ahead
29 Februari 2014
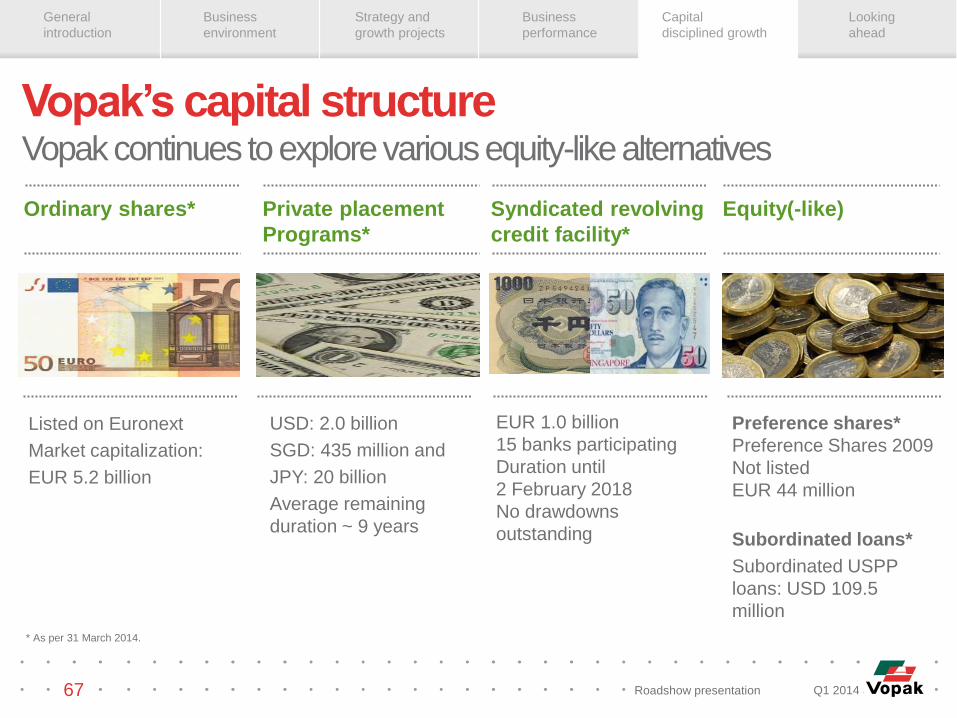
Vopak’s capital structure Vopak continues to explore various equity-like alternatives
* As per 31 March 2014.
Listed on Euronext
Market capitalization:
EUR 5.2 billion
Preference shares*
Preference Shares 2009
Not listed
EUR 44 million
Subordinated loans*
Subordinated USPP
loans: USD 109.5
million
USD: 2.0 billion
SGD: 435 million and
JPY: 20 billion
Average remaining
duration ~ 9 years
EUR 1.0 billion
15 banks participating
Duration until
2 February 2018
No drawdowns
outstanding
67
Ordinary shares* Private placement
Programs*
Syndicated revolving
credit facility*
Equity(-like)
Roadshow presentation Q1 2014
General
introduction
Business
environment
Strategy and
growth projects
Business
performance
Capital
disciplined growth
Looking
ahead
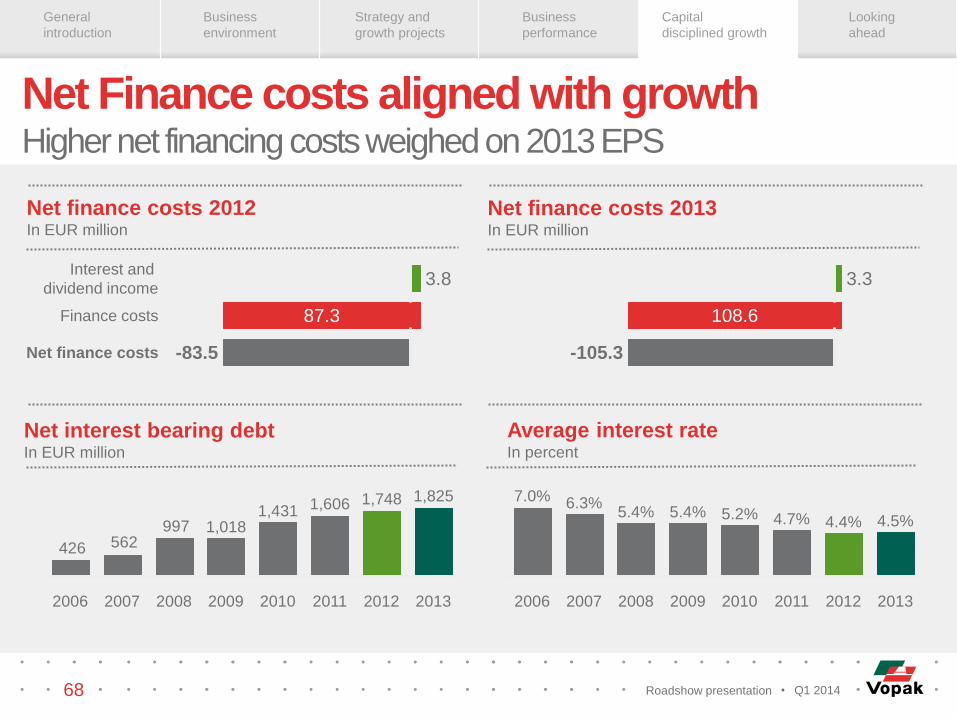
Net Finance costs aligned with growth Higher net financing costs weighed on 2013 EPS
Net finance costs 2012 In EUR million
Net finance costs -83.5
Finance costs 87.3
Interest and
dividend income 3.8
-105.3
108.6
3.3
2013
4.5%
2012
4.4%
2011
4.7%
2010
5.2%
2009
5.4%
2008
5.4%
2007
6.3%
2006
7.0%
Average interest rate In percent
997562426
2012 2013
1,825 1,748
2011
1,606
2010
1,431
2009
1,018
2008 2007 2006
Net interest bearing debt In EUR million
Net finance costs 2013 In EUR million
68 Roadshow presentation Q1 2014

General
introduction
Business
environment
Strategy and
growth projects
Business
performance
Capital
disciplined growth
Looking
ahead
Proposed 2013 dividend EUR 0.90 per ordinary share (pay-out ratio: 37%)
Dividend and EPS 2006-2013** In EUR
Note: due to the retrospective application of the Revised IAS 19, EBITDA for 2012 has been restated ;* Excluding exceptional items; attributable to holders of ordinary shares; ** Excluding exceptional items; historical figures adjusted for 1:2 share split effectuated 17 May 2010.
-10% 2.45
+2%
2013
0.90
2012
2.73
0.88
2011
2.16
2010
2.08
0.70
2009
1.92
0.63
2008
1.62
0.55
2007
1.31
0.48
2006
0.98
0.38 0.80
Dividend policy:
Barring exceptional
circumstances, the
intention is to pay
an annual cash
dividend of 25-50%
of the net profit*
69 Roadshow presentation Q1 2014

General
introduction
Business
environment
Strategy and
growth projects
Business
performance
Capital
disciplined growth
Looking
ahead
Looking
ahead
Manifold of Vopak Horizon Fujiarah terminal (UAE) connected to the port with new pipelines 70

General
introduction
Business
environment
Strategy and
growth projects
Business
performance
Capital
disciplined growth
Looking
ahead
EBITDA development Looking back
EBITDA development 2004-2013* In EUR million
Note: Due to the retrospective application of the Revised IAS 19, EBITDA for 2012 has been restated;* Excluding exceptional items; including net result from joint ventures and associates.
753768
636598
513
429370
314263
232
2007 2008
+12.5%
2012* (restated)
2013
2011 2010 2009 2006 2005 2004
CAGR
71 Roadshow presentation Q1 2014
General
introduction
Business
environment
Strategy and
growth projects
Business
performance
Capital
disciplined growth
Looking
ahead
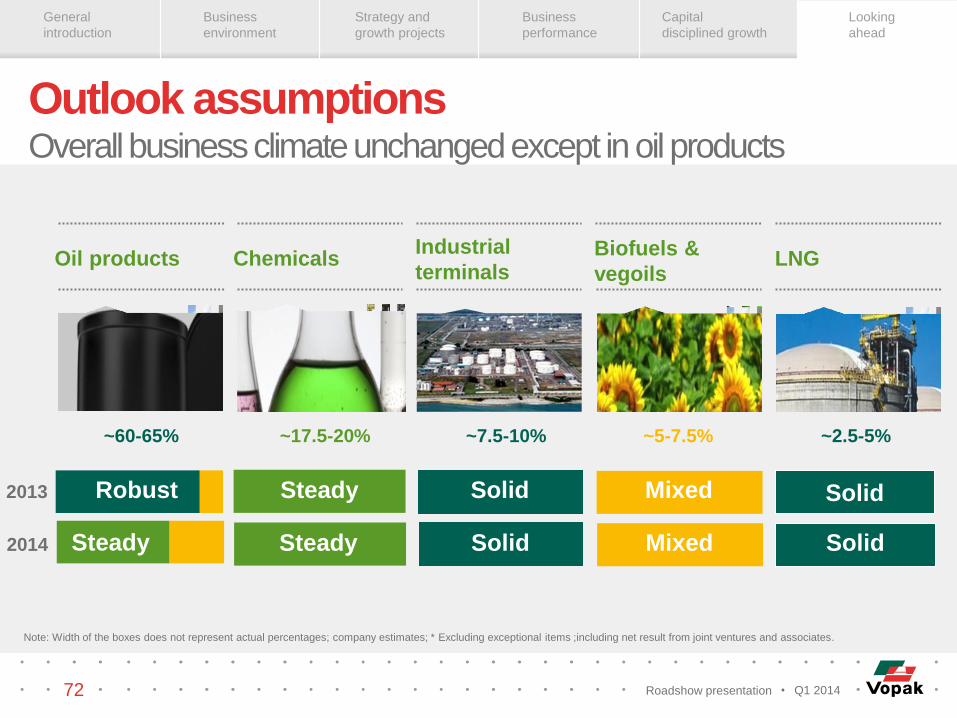
Outlook assumptions Overall business climate unchanged except in oil products
72
Note: Width of the boxes does not represent actual percentages; company estimates; * Excluding exceptional items ;including net result from joint ventures and associates.
Oil products Chemicals Industrial
terminals Biofuels &
vegoils LNG
Robust
Solid
Mixed
Solid
Mixed
2014
2013
Steady
Steady
Steady Solid
Solid
~60-65% ~17.5-20% ~7.5-10% ~2.5-5% ~5-7.5%
Roadshow presentation Q1 2014
General
introduction
Business
environment
Strategy and
growth projects
Business
performance
Capital
disciplined growth
Looking
ahead
73
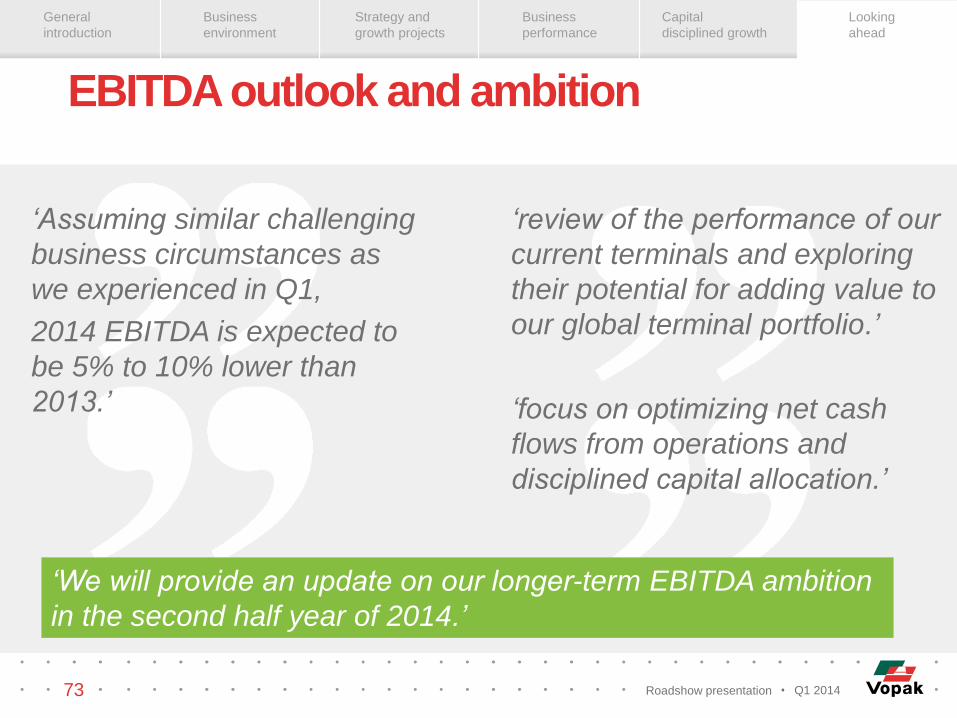
EBITDA outlook and ambition
‘Assuming similar challenging
business circumstances as
we experienced in Q1,
2014 EBITDA is expected to
be 5% to 10% lower than
2013.’
‘review of the performance of our
current terminals and exploring
their potential for adding value to
our global terminal portfolio.’
‘focus on optimizing net cash
flows from operations and
disciplined capital allocation.’
‘We will provide an update on our longer-term EBITDA ambition
in the second half year of 2014.’
Roadshow presentation Q1 2014

General
introduction
Business
environment
Strategy and
growth projects
Business
performance
Capital
disciplined growth
Looking
ahead
• • • • • • • • • • • • • • • • • • • • • • • • • • • • • • • • • •
• • • • • • • • • • • • • • • • • • • • • • • • • • • • • • • • • •
• • • • • • • • • • • • • • • • • • • • • • • • • • • • • • • • • •
“We have built
our company
over 400 years on
trust and reliability.”
• • • • • • • • • • • • • • • • • • • • • • • • • • • • • • • • • •
• • • • • • • • • • • • • • • • • • • • • • • • • • • • • • • • • •
• • • • • •
• • • • • • • • • • • • • • • • • • • • • • • • • • • • • • • • • •
• • • • • • • • • • • • • • • • • • • • • • • • • • • • • • • • • •
Royal Vopak I Westerlaan 10 I 3016 CK Rotterdam I The Netherlands I Tel: +31 10 400 2911 I Fax: +31 10 413 9829 I www.vopak.com

EBITDA development Value creation through capital disciplined growth and strong cash flow
focus
Q1 2014 Roadshow presentation 75
EBITDA development In EUR million
753768636598
513429370
314263
2013 2012 2011 2010 2009 2008 2007 2006 2005
878893
701665582
474421
341284
2013 2012 2011 2010 2009* 2008*
2007* 2006* 2005*
Proportionate EBITDA development In EUR million
713659
496455451387
335286225
2009 2008 2007 2006 2005 2012 2013 2011 2010
Cash flow from operating activities (gross) In EUR million
Note: EBITDA excluding exceptionals; * Proportionate EBITDA including exceptionals.

Cash flow Capital disciplined growth results in steady increase of cash flows
76
Cash flow from operating activities (gross) In EUR million
187250 307 362
420 410392
571590
12388104453125283638
2011
+8% 713
2013 2012
659
496
2010
455
2009
451
2008
387
2007
335
2006
225 286
2005
Subsidiaries Joint ventures and associates based on received dividend
Q1 2014 Roadshow presentation

Strong focus on cash flow Operating cash flow important source for growth strategy
77
Consolidated statement of cash flows In EUR million
* Including bank overdrafts.
713
180
533
Operational
free cash
flow
Sustaining
capex
Gross
operating
cash flow*
436
533 478
90
120
169
171
59
Net Cash
position
31/12/2013*
Disposals Dividend
paid in
cash
Finance
activities
excluding
dividend
paid
Other
incl. tax
Invest-
ments
Operational
free cash
flow
Net cash
position
1/1/2013*
Q1 2014 Roadshow presentation
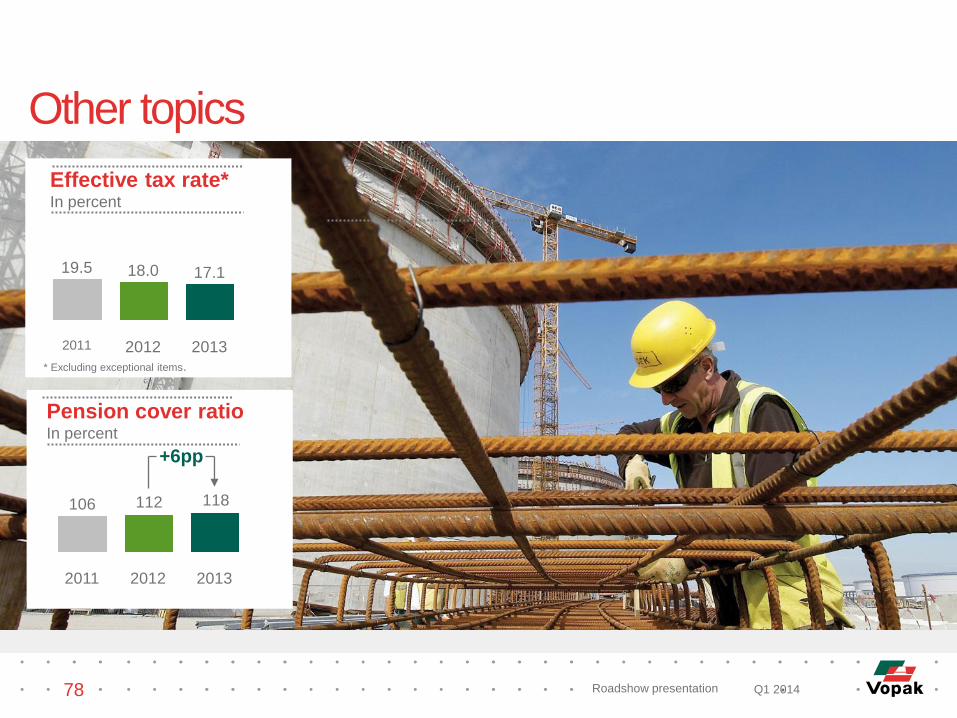
Other topics
78
Effective tax rate* In percent
19.5
2011 2012
18.0
2013
17.1
* Excluding exceptional items.
Pension cover ratio In percent
118112106
+6pp
2011 2013 2012
Q1 2014 Roadshow presentation