Embed Size (px)
Citation preview

Volume 14 Number 1, June 2008
The International Society for Southeast Asian Agricultural Sciences

J. ISSAAS Vol. 14, No 1 (2008)
i
CONTENTS
Page
Invited Papers
Tropical fruit cultivation as a successful business venture in Thailand
Lop Phavaphutanon ----------------------------------------------------------------------------
1
Challenges and opportunities for agricultural products under the context of
international integration: A case study for safe vegetables in Vietnam
Tran Huu Cuong --------------------------------------------------------------------------------
9
Converting agriculture particularly banana commodity, into a successful business venture in Malaysia
Dato' Dr Zainuddin Wazir ---------------------------------------------------------------------
21
Status and agribusiness potentials of organic agriculture in the Philippines
Rogelio D. Colting and Darlyn D. Tagarino -----------------------------------------------
25
Contributed Papers
Sustainable water management in the rural landscape of Cianjur watershed,
Cianjur District, West Java, Indonesia
Kaswanto, Hadi Susilo Arifin, Aris Munanda and Kenji Iiyama ----------------------------------
33
Survey of aphid infestation and viral infection of potatoes in Syria
Azusa Fujiie, Abdul Mohsen Said Omar, Ahmed Bahij Sawas , Abbas Abbas,
Mohammad Abdul Hadi, Emad Alden Sawas, Ayman Barakat, Maen Naser, and
Shigeru Takahashi ------------------------------------------------------------------------------
46
Spiders in paddy fields in northern Thailand
Samaporn Saengyot and Banpot Napompeth ----------------------------------------------
60
Current vulnerability of the rice production sector to rainfall variability and extremes
in the province of Camarines Sur, Philippines.
Michael A. Cuesta and Roberto F. Rañola, Jr.----------------------------------------------
67
Utilization of dairy cattle manure-rice hull compost using microbial inoculation
Bayani M. Espiritu, Lovely B. Willauer, and Mannix S. Pedro -------------------------
80
Protection of hot pepper against multiple infection of viruses by utilizing root
colonizing bacteria
Tri Asmira Damayanti and Trias Katerina -------------------------------------------------
92
Toxicity of Cymbopogon citratus Stapf. (Poaceae) against the diamondback moth,
Plutella xylostella L. (Lepidoptera: Yponomeutidae) larvae
Dadang and Kanju Ohsawa ------------------------------------------------------------------
101
Report from ISSAAS Central Secretariat ----------------------------------------------------
111
Members, Editorial Committee ---------------------------------------------------------------
116

J. ISSAAS Vol. 14, No 1: 33-45 (2008)
33
SUSTAINABLE WATER MANAGEMENT IN THE RURAL LANDSCAPE OF
CIANJUR WATERSHED, CIANJUR DISTRICT, WEST JAVA, INDONESIA
Kaswanto1, Hadi Susilo Arifin
1, Aris Munandar
1 and Kenji Iiyama
2
1Bogor Agricultural University 2Japan International Research Center for Agricultural Sciences
(Received: August 5, 2005 ; Accepted: June 27, 2007 )
ABSTRACT
Water management in the rural landscape of Cianjur Watershed was evaluated during the dry
season. Five villages located in the upper stream area (Galudra Dua Hamlet), the middle stream area
(Burangkeng and Gasol Satu Hamlet), and the lower stream area (Sayang and Cibakung Hamlet) were
studied. A survey method was used in order to find out water quality and quantity, and its management. Water resources from ponds, wells, rivers, paddy fields and springs were analyzed chemically and
physically. Water qualities changed significantly, showing a decrease along the Cianjur River and
accumulation in the down stream area. Water utilization in the rural landscape indicated optimal
improvement of human activity and agricultural production through changes in land use. Disturbance in
land use were predicted as related to water quality, and urban land use affected rural areas negatively.
Examination of pond characteristics were a best estimate for the entire watershed area. The results on
the water cycle in the pekarangan was elucidated to find out the management, its availability and its role
in the village's ecosystem.
Key words: pekarangan, water quality.
INTRODUCTION
The Cianjur watershed is one of the most important watershed areas in Indonesia, especially in West
Java Province. It covers 7,250 km2 area including 6 municipalities and a district in West Java (Whitten et al., 1999) and supports three dams, Saguling, Cirata and Jatiluhur, which are usually used for
agricultural needs and other useful activities for rural civilization. The management of the watershed in this
area is necessary in order to meet increasing demand for water, like agricultural and household activities.
These impacts are now putting pressure on the dams and their catchments areas, and are leading to more
sedimentation in the reservoirs and other problems.
The Cianjur watershed is dominated by farmland areas, some of which are found as an agroforestry
system. The agroforestry products from this area were marketed mostly in areas outside the watershed, like Jakarta and other urban areas. However, this area must also be conserved because the water stream from
this catchment area supplies the water to downstream areas, and severe erosion due to farmland degradation
can increase the runoff and lead to flooding in Jakarta and other downstream areas. The agroforestry
practiced in Cianjur watershed land use, such as intercropping and multiple cropping, has several
beneficial effects. These include using energy optimally, reducing yield-failure risks, and maintaining high
biodiversity (Arifin, 2001). On the other hand, land use can indicate optimal energy utilization in the
rural area, and it is necessary to figure out the suitable maintenance along the Cianjur watershed.
Water value, as one of main elements in rural landscape of Cianjur watershed, could be seen in its
functions and utilization for sustaining life. Water is one of the most important and most attractive
element in the farming system of watersheds through quality, quantity, distribution of sedimentation and

Sustainable water management in the rural landscape.......
34
erosion, and agroforestry system. Water also contributes to the daily life of rural people as a natural
feature of sustainability of the rural landscape. Rural landscapes that are managed and developed in a
sustainable manner can supply needs of consumption of the owner (subsistence) and contribute to food
security.
This study sought to analyze qualities and quantities of water elements and sustainability of
water management patterns in three different agro-bioclimatic zones in the Cianjur watershed.
STUDY SITES
This research has been conducted as collaboration between Bogor Agricultural University and The
University of Tokyo - for the period of 1998-2007. The research was conducted in five villages in the Cianjur watershed that lie between E 106°59'07" - 107°15'00" and between S 6°45'00" - 6°52'30".
Table 1. Classification of five study areas.
Zoning
Study Area
Latitude
Longitude
Altitude
Upper Stream Galudra S 6°46'23" - 6°47'15" E 106°59'07" - 107°03'16" 1300 - 2500 m
Middle
Stream
Mangunkerta S 6°47'44" - 6°48'14" E 107°03'11" - 107°05'08'' 700 - 1000 m
Gasol S 6°48'14" - 6°50'17" E 107°04'14" - 107°03'16'' 550 - 700 m
Down Stream
Sayang S 6°48'06" - 6°50'02" E 107°08'34" - 108°14'19" 350 - 450 m
Selajambe S 6°48'07" - 6°49'18" E 107°12'17'' - 107°14'32" 250 - 300 m
Source: Ground check by GPS (Global Positioning System)
The study sites were categorized by grouping geographical condition of Cianjur watershed into three
zones (Table 1). Another factor considered was the location of the urban area, before and after the
capital city. These zones have different agro-bioclimatic conditions along gradient slopes of Cianjur River.
The three zones in the five villages are positioned in the east slope of Mount Gede. The upper stream of
the catchments is a part of Gede Mountain and the down stream is dominated by a riverine plain (Fig. 1).
Fig. 1. Research site classification in the Cianjur watershed
3500
UPPER STREAM
MIDDLE STREAM
DOWN STREAM
3000
2500
2000
1500
1000
500
0 20 15 10 5 35 30 25
Horizontal Distance (km)
Top of Mount Gede (2991m)
After City Before City
Gasol
Mangunkert
a CIANJUR CITY
Sayang Selajambe
Galudra

J. ISSAAS Vol. 14, No 1: 33-45 (2008)
35
The Cianjur watershed area covers 7,250 km2 and is dominated by agricultural land use, where
the types of agricultural land use are paddy field, mixed garden and plantation, especially tea (Camelia
sinensis) plantations.
MATERIALS AND METHODS
Watershed Landscape Analysis
The land use data was collected using a field survey. Field survey techniques (Veldkamp et al.,
2001) in examining land use have a relationship within agroforestry development in rural landscape
because at least a small rural landscape has already made some agroforestry practice for needs
complementation. On the field surveys, the Integrated Transect Method (ITM) was used to describe land use at the semi-detailed level, using a multidisciplinary approach (Duivenbooden et al., 1996). Spatially
explicit ecosystem models could determine their changes (the land use patterns of the study area between 1972
and 1997). Spatially explicit ecosystem models allow the calculation of water and matter dynamics in a
landscape that function as a spatial localization of habitat structures and matter input (Seppelt and Voinov,
2002).
Water Sources and Stream Types, Performance and Visualization (Spatial)
The research tools used were rolling meter (50 m), pole meter, leveling staff, altimeter and GPS.
Survey methods and measurements using questionnaires in the hamlet area were performed in biophysical and
sociological approaches with Proportional Random Sampling. The number of respondent in each
hamlet is 60 householders. A total of 300 householders were interviewed with the assumption that a hamlet is
a homogenous landscape unit. The mapping data were taken by using previous Indonesia Land Use and
Topographical map, sheet 1209-213 Cugenang Area and sheet 1209-214 Cianjur Area with a scale of
1:25,000 (first edition of BAKOSURTANAL, 1990), hydrogeology map of Cianjur District with a scale of
1:100,000 (Direktorat Geologi Tata Lingkungan, 1990) and a semi-detailed land map of Citarum Tengah III Watershed, West Java with a scale of 1:25.000 (Pusat Penelitian Tanah, 1980).
Water Quality and Water Quantity of Rural Landscape Research Sites
Water samples were taken from ponds, paddy fields, wells and water springs around five villages in five
hamlets during the dry season. Water samples were taken three times in each location to represent three
replications.
The Dissolved Oxygen (DO) concentration was measured directly in the field by using a handy type
DO-meter (F-102-5 Shibata, Tokyo). The Chemical Oxygen Demand (COD) concentration was calculated
by using a COD: WAK-COD, phosphate (PO43-: WAK-PO4), ammonia (NH3: WAK-NH4), nitrite (NO2
1-:
WAK-NO2) and nitrate (NO31: WAK-NO3) by colorimetry using Pack Test Sheets (Kyoritsu, Tokyo). The
numbers of Escherichia coli and general bacteria were counted by using Test Papers TPA-BG and TPA
CG (Kyoritsu, Tokyo), respectively. The process continued by conducting statistical analysis using
Duncan Test Method. Water quantity analyses included debit and human needs around the study sites.
Water needs were gathered by questionnaires and river water debits were estimated by using a water debit formula.
RESULTS
Land Use Changes in the Cianjur Watershed
According to Landsat Images, the land use in the area was classified into the following three
categories: (1) forest, (2) urban area, and (3) agriculture area, including paddy fields, mixed gardens and

Sustainable water management in the rural landscape.......
36
plantations. Others land use classifications like forest garden and home garden could not be classified
in detail using unsupervised classification. Forest gardens (talon) were classified into forest class and
home garden, which are always located near settlements to urban areas. The result of this classification
shows that forest areas have declined from 1972 to 1997 by about half, which was from 42% in 1972 to 22% in 1997. In addition, the agriculture and urban areas have increased. The agricultural area has
increased from 51% to 54% and the urban area has increased from 7% to 24 %. These changes have
been faster after the 1980's.
Identifying Stream Types and Water Resources
Biophysical characteristics of water elements could be projected from stream types and existing water
sources. Based on its water flow, the Cianjur River is classified as a lotic water body. The field survey of streams was conducted in order to characterize stream attributes, including stream types, using a
combination of physical and biological indicators. Watershed slopes distinguish water velocity and
higher slopes make water flow higher. Delineation resulting from a contour grid map shows the level
of the slope. Upper streams had more than 45% slope levels, and at this level, water dynamics will be close
to 3.3528 m/s (Harris and Dines, 1988). It also has an impact on the sedimentation process that impulses
erosion and transportation of soil from upper to down stream.
Cianjur Watershed Performance and Visualization
Watershed visualization (spatial) and performance (transect and land use) were produced by
relative section and position of land use from Cianjur River. Watershed performance could be
indicated by the land use system along the river corridor and depends on a sustainable ecosystem and
agroforestry element. The upper stream has much better water performance and visualization than the other
because bamboo talun (bamboo forest) are within the river position. Talun that hemmed in Cianjur
River ecologically has many advantages, because the upper streams that have steep slopes are susceptible to
erosion and run off.
Water Resource Quality and Quantity
Water quality as an ecological indicator could predict the sustainability of daily human activities of
land use practice. Table 2 shows the result of statistical analysis of water quality that decreases along
the study site using Duncan Test Method. It is dominantly significant both in the study site and in location,
and the quality decreases zone by zone. In addition, the water qualities that were predicted from Gasol
and Sayang village (after and before city) decreased quite significantly as an impact of urban landscape.
High concentrations of COD, NO2, PO4, NO3, NH4 and low concentration of DO were detected in
water samples, which were highly contaminated by colon bacillus (Escherichia coli) and general bacteria,
probably because of cattle in the area. Water quantities became much higher down stream, but the velocity
becomes much slower compared to upper stream. Down stream had the highest river debited, 15.36 m/sec,
and the upper stream is about 0.24 m/sec. These are in synergy with the Hydrogeology Cianjur
District Map (1990) that calculated yearly debit means of upper and down stream water.
Water Resources Utilization
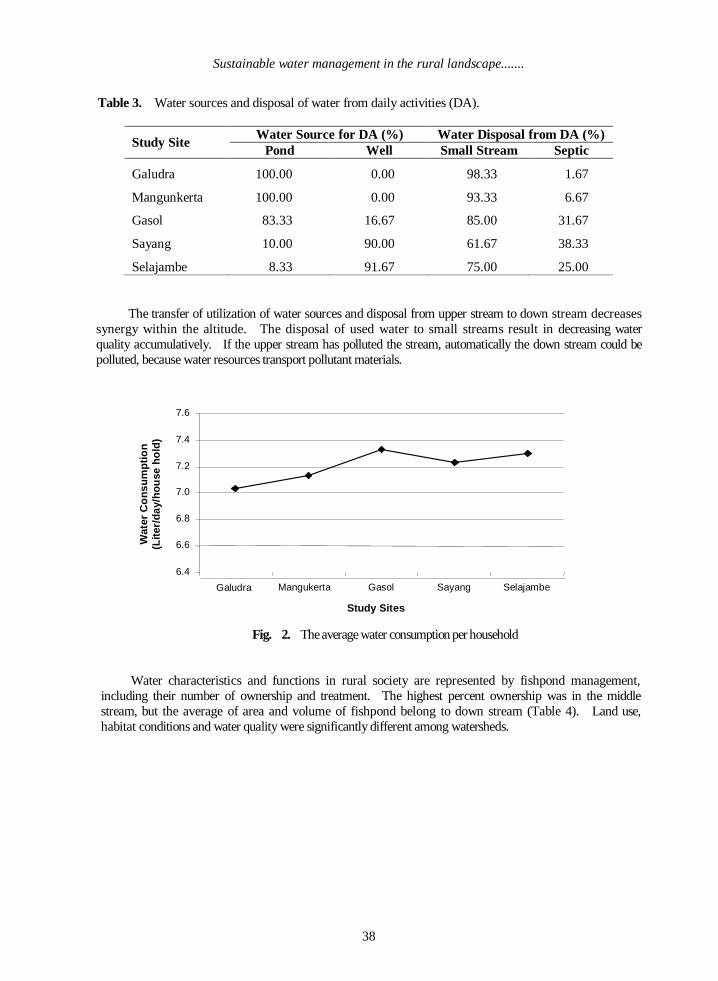
Drinking water sources for meeting the needs of rural society came from ground water and
springs. The consumption of drinking water among the study sites was almost relatively similar (Fig. 2).
Furthermore, the daily water sources from ponds and wells were utilized in different ratios among the study
sites (Table 3).

J. ISSAAS Vol. 14, No 1: 33-45 (2008)
37
Table 2. Statistical analysis results of water quality
Study Sites Sample
Location
DO
(a)
COD
(b)
NO2
(c)
NO3
(a)
PO4
(a)
NH4
(a)
Temp.
(a)
pH
(a)
E.
coli
(c)
General
Bacteria
(a)
Galudra
Well 2.61 8.00 0.01 7.67 0.10 0.20 18.70 7.20 43.33 61.67
Pond 4.68 7.33 0.04 4.67 0.20 0.10 20.57 8.05 98.33 84.67
River 4.95 7.00 0.01 3.67 0.20 0.10 21.50 7.91 127.00 101.33
Paddy Field 3.91 4.67 0.01 1.00 0.10 0.10 23.30 7.67 67.33 85.33
Spring 3.30 4.00 0.01 4.00 0.10 0.10 19.13 7.80 45.33 45.00
Mangukerta
Well 2.94 6.67 0.01 3.33 0.10 0.17 20.73 7.16 47.67 63.00
Pond 6.07 6.67 0.03 4.00 0.20 0.23 22.70 8.12 73.33 90.00
River 6.48 7.67 0.02 2.33 0.20 0.13 23.27 7.89 105.67 109.00
Paddy Field 8.08 6.00 0.01 1.67 0.20 0.17 24.23 7.37 85.00 96.67
Spring 4.24 5.33 0.01 2.67 0.10 0.10 22.27 7.03 38.33 53.33
Gasol
Well 4.51 8.00 0.01 2.33 0.10 0.30 19.50 7.02 48.00 65.00
Pond 8.12 5.00 0.03 3.33 0.20 0.10 20.10 7.52 90.00 93.00
River 6.60 8.00 0.01 1.67 0.20 0.10 20.80 7.74 105.00 109.00
Paddy Field 6.14 8.00 0.01 1.67 0.10 0.10 20.50 7.32 98.00 101.00
Spring 3.89 8.00 0.01 1.00 0.10 0.10 21.40 7.01 45.00 59.00
Sayang
Well 6.21 8.33 0.01 3.33 0.10 0.20 21.30 6.86 51.67 75.00
Pond 8.23 10.23 0.03 3.67 0.40 0.23 25.32 7.33 80.00 99.00
River 6.87 8.67 0.01 1.00 0.40 0.13 25.43 7.65 125.33 140.33
Paddy Field 6.46 10.67 0.01 1.00 0.10 0.17 26.7 7.23 98.33 110.67
Spring - - - - - - - - - -
Selajambe
Well 6.50 9.00 0.01 1.00 0.10 0.17 28.30 6.55 52.00 79.33
Pond 7.82 12.67 0.01 1.00 0.40 0.70 29.10 7.16 81.00 99.00
River 7.24 9.33 0.02 1.00 0.50 0.20 29.77 7.50 139.33 154.33
Paddy Field 6.57 11.00 0.02 1.00 0.10 0.30 29.47 7.15 98.67 122.33
Spring - - - - - - - - - -
Note: DO, COD, NO2, NO3, PO4 and NH4 concentration in ppm unit. Temperature in °C unit. Escerichia coli and general bacteria in number of spot unit.
(a). Significantly different, both in the study site and sample location (b): Significantly different only in the study site, not in the sample location (c): Significantly different only in the sample location, not in the study site
Sustainable water management in the rural landscape.......
38
Table 3. Water sources and disposal of water from daily activities (DA).
Study Site Water Source for DA (%) Water Disposal from DA (%)
Pond Well Small Stream Septic
Galudra 100.00 0.00 98.33 1.67
Mangunkerta 100.00 0.00 93.33 6.67
Gasol 83.33 16.67 85.00 31.67
Sayang 10.00 90.00 61.67 38.33
Selajambe 8.33 91.67 75.00 25.00
The transfer of utilization of water sources and disposal from upper stream to down stream decreases
synergy within the altitude. The disposal of used water to small streams result in decreasing water
quality accumulatively. If the upper stream has polluted the stream, automatically the down stream could be
polluted, because water resources transport pollutant materials.
Fig. 2. The average water consumption per household
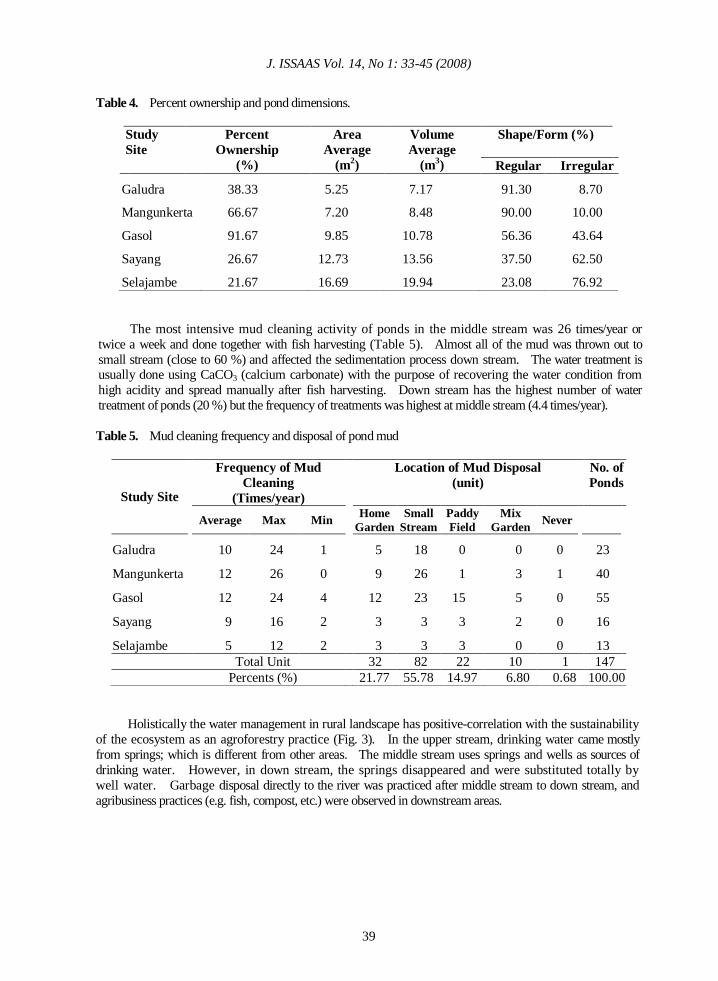
Water characteristics and functions in rural society are represented by fishpond management,
including their number of ownership and treatment. The highest percent ownership was in the middle
stream, but the average of area and volume of fishpond belong to down stream (Table 4). Land use,
habitat conditions and water quality were significantly different among watersheds.
6.4
6.6
6.8
7.0
7.2
7.4
7.6
Galudra Mangukerta Gasol Sayang Selajambe
Wate
r C
on
su
mp
tio
n
(Lit
er/
da
y/h
ou
se
ho
ld)
Study Sites
J. ISSAAS Vol. 14, No 1: 33-45 (2008)
39
Table 4. Percent ownership and pond dimensions.
Study
Site
Percent
Ownership
(%)
Area
Average
(m2)
Volume
Average
(m3)
Shape/Form (%)
Regular Irregular
Galudra 38.33 5.25 7.17 91.30 8.70
Mangunkerta 66.67 7.20 8.48 90.00 10.00
Gasol 91.67 9.85 10.78 56.36 43.64
Sayang 26.67 12.73 13.56 37.50 62.50
Selajambe 21.67 16.69 19.94 23.08 76.92
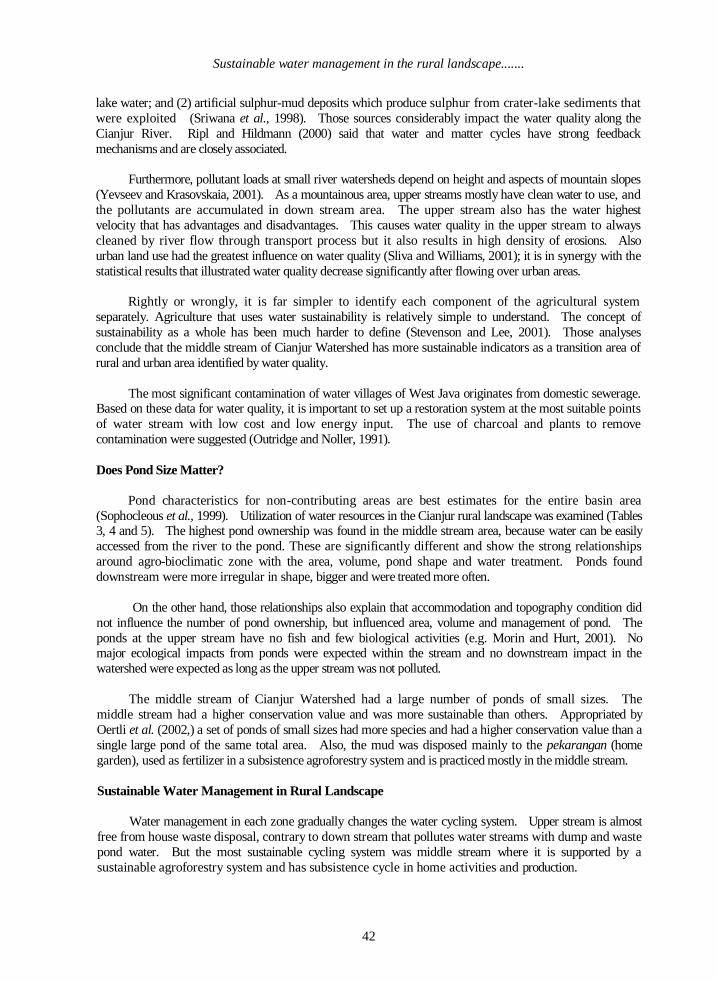
The most intensive mud cleaning activity of ponds in the middle stream was 26 times/year or
twice a week and done together with fish harvesting (Table 5). Almost all of the mud was thrown out to
small stream (close to 60 %) and affected the sedimentation process down stream. The water treatment is usually done using CaCO3 (calcium carbonate) with the purpose of recovering the water condition from
high acidity and spread manually after fish harvesting. Down stream has the highest number of water
treatment of ponds (20 %) but the frequency of treatments was highest at middle stream (4.4 times/year).
Table 5. Mud cleaning frequency and disposal of pond mud
Study Site
Frequency of Mud
Cleaning
(Times/year)
Location of Mud Disposal
(unit)
No. of
Ponds
Average Max Min Home
Garden
Small
Stream
Paddy
Field
Mix
Garden Never
Galudra 10 24 1 5 18 0 0 0 23
Mangunkerta 12 26 0 9 26 1 3 1 40
Gasol 12 24 4 12 23 15 5 0 55
Sayang 9 16 2 3 3 3 2 0 16
Selajambe 5 12 2 3 3 3 0 0 13
Total Unit 10 32 82 22 10 1 147
Percents (%) 21.77 55.78 14.97 6.80 0.68 100.00
Holistically the water management in rural landscape has positive-correlation with the sustainability
of the ecosystem as an agroforestry practice (Fig. 3). In the upper stream, drinking water came mostly
from springs; which is different from other areas. The middle stream uses springs and wells as sources of
drinking water. However, in down stream, the springs disappeared and were substituted totally by
well water. Garbage disposal directly to the river was practiced after middle stream to down stream, and
agribusiness practices (e.g. fish, compost, etc.) were observed in downstream areas.

Sustainable water management in the rural landscape.......
40
Fig. 3. Water management in the rural landscape watershed:
Upper stream (top); Middle stream (middle); Down stream (bottom)
The bold arrow and shading box indicate the differences
POND
Water and Mud
VEGETATION
HOUSE
DUMP
COMPOST
LIVESTOCK
RIVER
MARKET
ANOTHER
OPEN SPACE
Water Utilization
Fertilizer use Decomposition Disposal
Consumption Disposal
Feeding Feeding
SPRING Water Utilization
Home Garden System
POND
Water and Mud
VEGETATION
HOUSE
DUMP
COMPOST
LIVESTOCK
RIVER
MARKET
ANOTHER
OPEN SPACE
Input from river
sungai
Utilization
Water Utilization
Fertilizer use Decomposition Disposal
Production
Feeding Feeding
Dumping
WELL
Production Disposal
Home Garden System
POND
Water and Mud
VEGETATION
HOUSE
DUMP
COMPOST
LIVESTOCK
RIVER
MARKET
ANOTHER
OPEN SPACE
Input from river
sungai
Utilization
Water Utilization
Fertilizer use Decomposition Disposal
Disposal
Production
Feeding Feeding
Dumping
SPRING Water Utilization
WELL
Disposal
Home Garden System
Disposal Input from river
Production Utilization
Dumping
Water disposal
Disposal
Water
disposal
Consumption
Disposal
Water
Disposal
Consumption
Disposal

J. ISSAAS Vol. 14, No 1: 33-45 (2008)
41
DISCUSSION
Land Use and Cover Change Related to Water Availability
Land use of forest was very important for conservation of natural resource and for keeping all natural
function more sustainable. Nevertheless, the needs for agricultural land and settlement areas have led to
constant decrease in forest areas. The demand for agricultural area and urban settlements and access to the
catchments areas have increased greatly since the 1980's, especially in the urbanized area Cianjur City.
Urbanization process has been faster after 1980s because the government has opened highways from
Jakarta to Bogor city. Besides, the landscape along the route from Jakarta to other areas in the eastern
part of West Java across this area is beautiful and, therefore, the tourism industry is growing fast in this area, especially through settlements and recreation areas that support this industry and also decreasing process
of water quality along Cianjur River.
Land use disturbance has been reflected in the water quality (Stewart et al., 2000) and
agricultural land use has escalated landscape sensitivity (Knox, 2001). On the slope of
agro-bioclimatic zones, agricultural landscapes are more sensitive to climatic variability than natural
landscapes. It is usually caused by tillage and grazing that typically reduces water infiltration and
increase magnitudes of surface runoff. However, talun has high contribution in producing water availability.
The different transport of materials emphasizes the fact that the initial point of entry and final point
of impact of nutrients can be cumulative downstream and physically separated in both space and time
(Edwards and Dennis, 2000). The implications of land use change on nutrient cycling are reviewed
by contrasting the properties of nitrogen and phosphorus. In addition, for any particular location selected
in the drainage network, the attributes can be quantified for upper stream areas, which make this structure
especially useful for identifying point sources of pollution. This is the reason why pollutants were accumulated in downstream area.
Cianjur Stream Type as an Ecological Unit
As a lotic system, Cianjur Streams are particularly conditioned in a flow rate, turbidity, and
effects of temperature on the biota of rapids and pools. With a high flow rate over rocks or logs, the
surface of a stream is broken, and considerable water turbulence occurs (Forman and Godron, 1986) and
there is an increasing sedimentation process. According to Seyhan's categories of watershed (1990) the characteristics of Cianjur Watershed could be influenced by area, shape, slope, vegetation, land use,
fishpond and lake number, drainage and pH permeability. Furthermore, Cianjur Watershed can be
dominantly categorized into perennial stream type (Hansen, 2001) with the presence of a defined channel. It
means a defined channel was entrenched into the landscape or had an active water path that is noticeably
scoured, sorted, or settled materials.
Did Water Quality Decrease Stream by Stream?
Landscape elements can be ranked according to their general influence on water quality
(Thierfelder, 1998) from the mimicry of an agroforestry system. The highest polluted area is the river.
The accumulation of pollutants in the river shows that rural civilization used their resources (e.g.
pesticide, fertilizer) in high concentration.
'
Active and recently extinct volcanoes surrounding the catchments area in the upper Cianjur
Watershed were highly contaminated with natural contaminants. The main streams originate from two
different sources: (1) a flank spring producing water which is suspected to contain a portion of leaking acid
Sustainable water management in the rural landscape.......
42
lake water; and (2) artificial sulphur-mud deposits which produce sulphur from crater-lake sediments that
were exploited (Sriwana et al., 1998). Those sources considerably impact the water quality along the
Cianjur River. Ripl and Hildmann (2000) said that water and matter cycles have strong feedback
mechanisms and are closely associated.
Furthermore, pollutant loads at small river watersheds depend on height and aspects of mountain slopes
(Yevseev and Krasovskaia, 2001). As a mountainous area, upper streams mostly have clean water to use, and
the pollutants are accumulated in down stream area. The upper stream also has the water highest
velocity that has advantages and disadvantages. This causes water quality in the upper stream to always
cleaned by river flow through transport process but it also results in high density of erosions. Also
urban land use had the greatest influence on water quality (Sliva and Williams, 2001); it is in synergy with the
statistical results that illustrated water quality decrease significantly after flowing over urban areas.
Rightly or wrongly, it is far simpler to identify each component of the agricultural system
separately. Agriculture that uses water sustainability is relatively simple to understand. The concept of
sustainability as a whole has been much harder to define (Stevenson and Lee, 2001). Those analyses
conclude that the middle stream of Cianjur Watershed has more sustainable indicators as a transition area of
rural and urban area identified by water quality.
The most significant contamination of water villages of West Java originates from domestic sewerage. Based on these data for water quality, it is important to set up a restoration system at the most suitable points
of water stream with low cost and low energy input. The use of charcoal and plants to remove
contamination were suggested (Outridge and Noller, 1991).
Does Pond Size Matter?
Pond characteristics for non-contributing areas are best estimates for the entire basin area
(Sophocleous et al., 1999). Utilization of water resources in the Cianjur rural landscape was examined (Tables 3, 4 and 5). The highest pond ownership was found in the middle stream area, because water can be easily
accessed from the river to the pond. These are significantly different and show the strong relationships
around agro-bioclimatic zone with the area, volume, pond shape and water treatment. Ponds found
downstream were more irregular in shape, bigger and were treated more often.
On the other hand, those relationships also explain that accommodation and topography condition did
not influence the number of pond ownership, but influenced area, volume and management of pond. The
ponds at the upper stream have no fish and few biological activities (e.g. Morin and Hurt, 2001). No major ecological impacts from ponds were expected within the stream and no downstream impact in the
watershed were expected as long as the upper stream was not polluted.
The middle stream of Cianjur Watershed had a large number of ponds of small sizes. The
middle stream had a higher conservation value and was more sustainable than others. Appropriated by
Oertli et al. (2002,) a set of ponds of small sizes had more species and had a higher conservation value than a
single large pond of the same total area. Also, the mud was disposed mainly to the pekarangan (home
garden), used as fertilizer in a subsistence agroforestry system and is practiced mostly in the middle stream.
Sustainable Water Management in Rural Landscape
Water management in each zone gradually changes the water cycling system. Upper stream is almost
free from house waste disposal, contrary to down stream that pollutes water streams with dump and waste
pond water. But the most sustainable cycling system was middle stream where it is supported by a
sustainable agroforestry system and has subsistence cycle in home activities and production.

J. ISSAAS Vol. 14, No 1: 33-45 (2008)
43
Most farmers households are connected to the potable water system based on gravity. Their
concerns focused on water availability, demand, quality and management conflict on the watershed
level (Kammerbauer et al., 2001). Anthropogenic activities can act on pristine wetland and change
water quantity and water quality (Alvarez-Cobelas et al., 2001). In the Cianjur watershed, the different kinds of management conflicts can be observed as water fluxes in the creek were reduced during
the dry season period. Cianjur watershed communities compete for irrigation water for their farming,
as clear rules for the assignment of irrigation water were not established effectively. One of the water
improvement practices is by using water quality priority scenario that increases the agroforestry system
production which is sustainable (Coiner and Polasky., 2001).
One approach to achieve sustainable management of water is ecohydrology (Zalewski, 2000).
Degradation of freshwater ecosystems, and those of water resources have two facets: pollution and the disruption of water and nutrient cycles, and pollution can be substantially eliminated by biotechnology.
Janauer (2000) dealing management with the optimization of ecotone zones structure in whole
watershed usually fights a lack of space for ecohydrologically relevant structure, and a lack of funding,
although ecotones and other structural biotic elements provide basis for sustainable landscape
management. ??
CONCLUSIONS
Our findings allow the following conclusions:
1. Land use change in Cianjur watershed was under threat, and this may offer the people of the area an
unpromising future.
2. Cianjur Watershed performance, according to the land use profile, gradually changes the
ecological system (agroforestry system). Cianjur River is a lotic system, high in infiltration and
evaporation, categorized by perennial system type.
3. Water qualities were changing, and significantly different. Water quantities were sustainable,
supply and demand were in balanced conditions. Urban landscape has influenced rural landscape
gradually.
4. Accommodation and topography condition did not influence the number of pond ownership, but
influenced area, volume and their management.
5. Water utilization in three zones indicates optimal improvement of human activity and agricultural
production. According to material balance cycling system, the middle stream of Cianjur Watershed has
more sustainable water management pattern than the others.
ACKNOWLEDGEMENT
This research is collaborative effort between The University of Tokyo, Japan and Bogor Agricultural University, Indonesia under The Core University Program in Applied Bioscience, the Japan Society for the
Promotion of Science (JSPS), Japan and Directorate General of Higher Education (DGHE), Indonesia.
We would like express our gratitude to the Landscape Architecture Laboratory, Bogor Agricultural
University (IPB), Indonesia and Asian Natural Environmental Science Center, The University of Tokyo,
Japan who supported the research budget, tools and materials during the field survey.

Sustainable water management in the rural landscape.......
44
REFERENCES
Alvarez-Cobelas, M., S. Cirujano and S. Sanchez-Carrillo. 2001. Hydrological and Botanical Man-made
Changes in the Spanish Wetland of Las Tablas de Daimiel. Biological Conservation, 97: 89-98.
Arifin, H.S., K. Sakamoto and T. Takeuchi. 2001. Study of Rural Landscape Structure Based on Its
Different Bio-climatic Conditions in Middle Fart of Citarum Watershed, Cianjur District, West Java,
Indonesia. Pp 99-108 In Proc. JSPS-DGHE Core University Program in Applied Biosciences, Tokyo,
Japan.
Coiner, C., J. Wu and S. Polasky. 2001. Economic and Environmental Implications of Alternative
Landscape Design in the Walnut Creek Watershed of Iowa. Ecological Economics, 38: 119-139.
Duivenbooden, N., P.N. Windmeijer, V. Andriesse, and L.O. Fresco. 1996. The Integrated Transect Method
as A Tool For Land Use Characterization, With Special Reference to Inland Valley
Agro-Ecosystems in West Africa. Landscape and Urban Planning, 34: 143-160.
Fdwards, A.C. and P. Dennis. 2000. The Landscape Ecology of Water Catchments: Integrated
Approaches to Planning and Management. Landscape Research, 25(3): 305-320.
Forman, R.T.T. and M. Godron. 1986. Landscape Ecology. John Wiley and Sons. New York. 619 p.
Hansen, W.F. 2001. Identifying Stream Types and Management Implications. Forest Ecology
Management, 143: 39-46.
Harris, C.W. and N.T. Dines. 1988. Time-Saver Standards for Landscape Architecture, Design and
Construction Data. McGraw Hill. New York. 380 p.
Janauer, G.A. 2000. Ecohydrology: Fusing Concepts and Scales. Ecological Engineering, 16: 9-16.
Kammerbauer, J., B. Cordoba, R. Escolan, S. Flores. V. Ramirez and J Zeledon. 2001. Identification of
Development Indicators in Tropical Mountainous Regions and Some Implications for Natural Resource
Policy Designs: An Integrated Community Case Study. Ecological Economics, 36: 45-60.
Knox. J.C. 2901. Agricultural Influence on Landscape Sensitivity in the Upper Mississippi River Valley.
Catena, 42: 193-224.
Morin, K.A. and N.M. Hurt. 2001. Relocation of Net-acid-generating to Improve Post-mining Water
Chemistry. Waste Management, 21: 185-190.
Oertli, B., D.A. Joye, E. Castella, R. Juge, D. Cambin and J.B. Lachavanne. 2002. Does Size Matter? The
Relationship Between Pond Area and Biodiversity. Biological Conservation, 104: 59-70.
Outridge, P.M. and B.N. Noller. 1991. Accumulation of Toxic Trace Elements by Freshwater Vascular Plants. Envt. Contamination and Toxicology, 121: 1-63.
Ripl, W. and C. Hildmann. 2000. Dissolved Load Transported by Rivers as An Indicator of Landscape
Sustainability. Ecological Engineering. 14:373-387.
Seppelt, R. and A. Voinov. 2002. Optimization Methodology for Land Use Patterns Using Spatially Explicit
Landscape Models. Ecol. Modeling, 151:125-142.

J. ISSAAS Vol. 14, No 1: 33-45 (2008)
45
Seyhan, E. 1990. Fundamentals of Hydrology. Gadjah Mada University Press. Yogyakarta. Indonesia. 187 p.
Sliva, L. and D.D. Williams. 2001. Buffer Zone Versus Whole Catchments Approaches to Studying Land
Use Impact on River Water Quality. Water Resources, 35(14): 3462-3472.
Sophocleous, M.A., J.K. Koelliker, R.S. Govindaraju, T. Birdie, S.R. Ramireddygari and S.P. Perkins. 1999.
Integrated Numerical Modeling for Basin-wide Water Management: The Case of the Rattlesnake
Creek Basin in South-central Kansas. Journal of Hydrology, 214: 179-196.
Snwana. T., M.J. van Bergen, S. Sumarti, J.C.M. de Hoog, B.J.H van Os, R. Wahyuningsih and M.A.C.
Dam. 1998. Volcanogenic Pollution by Acid Water Discharges along Ciwidey River. West Java
(Indonesia). Journal of Geochemical Exploration, 62: 161-182.
Stevenson, M. and H. Lee. 2001. Indicators of Sustainability as A Tool in Agricultural Development
Partitioning Scientific and Participatory Processes. Int. Journal of Sustainable Dev. and World
Ecology, 8: 57-65.
Stewart, P.M, J.T. Butcher and T.O.Swinford. 2000. Land Use, Habitat; and Water Quality Effects on
Macroinvertebrate Communities in Three Watersheds of A Lake Michigan Associated Marsh
System. Aquatic Ecosystem Health and Management, 3: 179-189.
Thierfelder, T. 1998. The Morphology of Landscape Elements as Predictors of Water Quality in
Glacial/Boreal Lakes. Journal of Hydrology, 207: 189-203.
Veldkamp, A., K. Kok, G.H.J. De Koning, J.M. Schoorl, M.P.W. Sonneveld and P.H. Verburg. 2001.
Multi-scale System Approaches in Agronomic Research at the Landscape Level. Soil and Tillage
Research, 58: 129-140.
Yevseev, A.V. and T.M. Krasovskaia. 2001. Technogenic Load in Small River Watersheds in the Hibiny
Mountains. Chemosphere, 42: 79-83.
Whitten, T., E.S. Roehayat, and S.A. Afiff. 1999. Ecology of Java and Bali (Ekologi Java dan Bali)
Prenhallindo, Jakarta, Indonesia. 969 p. (In Indonesian)
Zalewski, M. 2000. Ecohydrology - The Scientific Background to Use Ecosystem Properties as
Management Tools toward Sustainability of Water Resources. Ecological Engineering, 16: 1-8
J. ISSAAS Vol. 14, No 1: 46-59 (2008)
46
SURVEY OF APHID INFESTATION AND VIRAL INFECTION
OF POTATOES IN SYRIA
Azusa Fujiie 1, Abdul Mohsen Said Omar
2, Ahmed Bahij Sawas
2, Abbas Abbas
2, Mohammad
Abdul Hadi 2, Emad Alden Sawas
2, Ayman Barakat
2, Maen Naser
2, Shigeru Takahashi
3
1 Japan International Cooperation Agency (JICA) Syria Office and Attachment to General
Organization for Seed Multiplication (GOSM) in Syria
JICA: P.O.BOX 10012 Damascus, Syria
GOSM: P.O.BOX 5857 Aleppo, Syria E-mail: [email protected]
2 General Organization for Seed Multiplication in Syria 3 Utsunomiya University in Japan
(Received: February 12, 2008; Accepted: April 16, 2008)
ABSTRACT
The occurrence of aphids and viral diseases on potatoes in Syria was examined. Aphids
were trapped in a yellow pan with water at the Tissue Culture Laboratory of the General Organization for Seed Multiplication (GOSM), Al Eeramoun, from June, 2006 to June, 2007. The number of
winged aphids trapped increased slightly in autumn and markedly in spring. On autumn-cultivated
potato plants in the Aleppo and Hama areas, aphid densities increased from mid-October to early
November, just before the harvest, in 2006. On spring-cultivated potatoes, aphid densities decreased
from late May, although the densities were higher in mid-April, just after sprouting, in 2007. Virus-
infected plants were common among both autumn- and spring-cultivated potatoes in fields not
contracted to GOSM, but were few in contracted fields in which virus-free plants grew. Aphid
species belonging to 13 genera, including Myzus persicae, Aphis gossypii, A. fabae, A. craccivora,
Schizaphis borealis and Lipaphis erysimi, were identified among aphid samples collected from potato
plants. In addition, Rhopalosiphum rufiabdominalis was found on rhizomes and roots of potato
plants in GOSM greenhouses in 2007. The major aphids as potato pests were considered to be M. persicae and A. gossypii, and A. fabae to a lesser extent. To our knowledge, this is the first report of
A. fabae and R. rufiabdominalis infesting potatoes in Syria.
Key words: Myzus persicae, Aphis gossypii, Aphis fabae, yellow pan, Potato Virus Y
INTRODUCTION
The main agricultural crops in Syria are wheat, barley, olives, cotton, and lentils. Crops such
as potatoes, tomatoes, cucumbers, egg plants, green and red peppers, tobacco, cotton, beans, sugar
beets and sunflowers are cultivated in limited areas where irrigation systems are set up. Potato
(Solanum tuberosum) is one of the major crops in the irrigated areas.
In Syria, seed potatoes are imported, propagated and distributed by a national organization,
the General Organization for Seed Multiplication, or GOSM (GOSM, 2006). Because a large
quantity of seed potatoes is imported annually, a national project to switch from the importation of
seed potatoes to domestic production is proceeding in partial cooperation with the Japan International
Cooperation Agency (JICA). However, a decline in domestic production as a result of infection with
viruses is a serious problem.

Survey of aphid infestation and viral infection.....
47
GOSM is propagating virus-free potato plants by means of apical culture technology. A
system has been constructed for mass production of virus-free seed potatoes in culture rooms,
greenhouses, net-houses and open fields. Seed potatoes are produced firstly in net-houses and in the
second and third phases in fields, and are called ‘Super Elite’, ‘Elite’ and ‘Class A’, respectively.
The ‘Class A’ seed potatoes are distributed to farmers for commercial production of potatoes.
Potatoes in Syria are seriously infected with Potato Virus Y (PVY) (Chikh Ali et al., 2006),
which is transmitted in the fields by aphids. This situation cannot be solved completely with the use
of virus-free seed potatoes. The most important concern is the efficient control of aphids. However,
the relationship between the aphids and viral infection has been inadequately investigated and the
identity of the aphid species is sufficiently unknown (Katayama, unpublished report of Technical
Transfer by JICA Expert, February 2002).
To analyze the population dynamics of aphids and the occurrence of viral infection of
potato plants in Syria, we investigated the number of winged aphids trapped in a yellow pan with
water, and quantified aphid densities on potato plants and the level of virus-infected plants. In
addition, we identified the aphids infesting potato plants.
MATERIALS AND METHODS
Environmental conditions and occurrence of winged aphids
Temperatures were measured at the Tissue Culture Laboratory, GOSM, Al Eeramoun, Syria,
at 13:00 from June, 2006 to June, 2007. Weather conditions and grass growth were also observed at
the site.
A yellow pan with water (30 cm diameter) with a surface-active agent , from a commercial
shampoo, was placed on the ground at the Tissue Culture Laboratory site in June, 2006. The seasonal
changes were monitored by counting the number of winged aphids and other insects trapped from June, 2006 to June, 2007.
Occurrence of aphids and viral infection
(1) Autumn-cultivated potatoes in 2006
Commercial farms are classified into those contracted to GOSM and un-contracted fields.
Virus-free seed potatoes of the ‘Super Elite’ and ‘Elite’ classes were cultivated in contracted fields.
Three contracted fields and three un-contracted fields in the Aleppo area in northern Syria and one
contracted field and four un-contracted fields in the Hama area in the Syrian midlands, were selected
(Table 1). ‘Afamia’ was the main potato cultivar grown in each field.
The occurrence of the aphids Myzus persicae and Aphis gossypii, which are the main aphid
species in Syria (GOSM, 2005), on potato plants was investigated and samples of the aphids were
collected for identification. Numbers of nymphs and adult aphids on 200 randomly selected
compound leaves were counted in each field about twice per month. In addition, the number of virus-
infected plants, based on the presence of mosaic symptoms on the foliage, was counted for 200 plants.
(2) Spring-cultivated potatoes in 2007
One contracted and four un-contracted fields in the Aleppo area, and one contracted and four
un-contracted fields in the Hama area were selected (Table 1). ‘Afamia’ was the main potato cultivar
J. ISSAAS Vol. 14, No 1: 46-59 (2008)
48
grown in the fields. The occurrence of aphids and viral disease was investigated, and aphid samples
collected, with the same methods as for the autumn-cultivated potatoes.
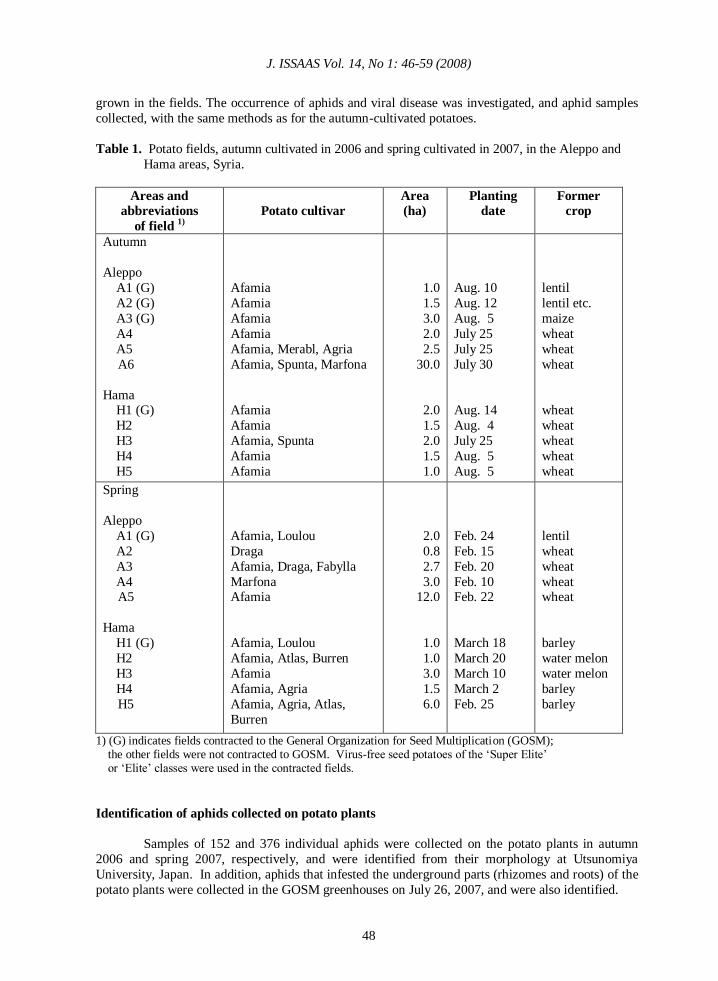
Table 1. Potato fields, autumn cultivated in 2006 and spring cultivated in 2007, in the Aleppo and
Hama areas, Syria.
Areas and
abbreviations
of field 1)
Potato cultivar
Area
(ha)
Planting
date
Former
crop
Autumn
Aleppo
A1 (G)
A2 (G)
A3 (G)
A4
A5
A6
Hama H1 (G)
H2
H3
H4
H5
Afamia
Afamia
Afamia
Afamia
Afamia, Merabl, Agria
Afamia, Spunta, Marfona
Afamia
Afamia
Afamia, Spunta
Afamia
Afamia
1.0
1.5
3.0
2.0
2.5
30.0
2.0
1.5
2.0
1.5
1.0
Aug. 10
Aug. 12
Aug. 5
July 25
July 25
July 30
Aug. 14
Aug. 4
July 25
Aug. 5
Aug. 5
lentil
lentil etc.
maize
wheat
wheat
wheat
wheat
wheat
wheat
wheat
wheat
Spring
Aleppo
A1 (G)
A2
A3
A4 A5
Hama
H1 (G)
H2
H3
H4
H5
Afamia, Loulou
Draga
Afamia, Draga, Fabylla
Marfona Afamia
Afamia, Loulou
Afamia, Atlas, Burren
Afamia
Afamia, Agria
Afamia, Agria, Atlas,
Burren
2.0
0.8
2.7
3.0 12.0
1.0
1.0
3.0
1.5
6.0
Feb. 24
Feb. 15
Feb. 20
Feb. 10 Feb. 22
March 18
March 20
March 10
March 2
Feb. 25
lentil
wheat
wheat
wheat wheat
barley
water melon
water melon
barley
barley
1) (G) indicates fields contracted to the General Organization for Seed Multiplication (GOSM); the other fields were not contracted to GOSM. Virus-free seed potatoes of the ‘Super Elite’ or ‘Elite’ classes were used in the contracted fields.
Identification of aphids collected on potato plants
Samples of 152 and 376 individual aphids were collected on the potato plants in autumn
2006 and spring 2007, respectively, and were identified from their morphology at Utsunomiya
University, Japan. In addition, aphids that infested the underground parts (rhizomes and roots) of the
potato plants were collected in the GOSM greenhouses on July 26, 2007, and were also identified.

Survey of aphid infestation and viral infection.....
49
The aphid samples collected for identification were put into small specimen tubes
containing 70% alcohol. In order to examine the structure of the aphids, samples were mounted on
microscope slides prepared with Lambers methods. Scientific names of aphids were determined
using numerous published keys and references, including Takahashi (1961), Miyazaki (1971), Heie
(1980, 1986), Blackman and Eastop (1984), Stroyan (1984), and Torikura (1991).
RESULTS
Environmental conditions and occurrence of winged aphids
(1) Temperature, weather conditions and grass growth
Table 2 shows the temperatures, weather conditions and grass growth in Al Eeramoun, Syria
from June, 2006 to June, 2007. The periphery of the study site was wasteland-like desert and few
grasses were growing in June, 2006, when the study began. From June until mid-September 2006,
fine, dry and hot weather prevailed. During summer, the weather was often very hot and the
maximum temperature at 13:00 was above 40°C. In autumn, fine weather continued except in late
September, but the temperature decreased slightly and it rained occasionally. During mid-October and early November, rainy and cloudy weather continued and grasses germinated in late October.
Shortly afterwards, however, grass growth was inhibited by low temperatures.
During late March until mid-May, 2007, grasses grew densely and blossomed coinciding
with the rise in temperature and rainfall. However, the grasses withered in late May following high
temperatures and little rainfall.
Table 2. Temperatures, weather conditions and grass growth in Al Eeramoun, Syria from
June, 2006 to June, 2007.
Month
Temperature (°C) 1)
Weather conditions 2)
Grass growth 2)
Mean Min. Max.
June, 2006 36.5 30 41 Fine, dry and hot. No grasses.
July 38.0 34 42 Fine, dry and hot. No grasses.
August 38.2 35 42 Fine, dry and hot. No grasses.
September 32.4 20 41 Sometimes rainy and cool
late in the month.
No grasses.
October 24.3 16 32 Fine in the beginning.
Rainy and cloudy in the
middle and late in the
month.
Grasses germinated on
one occasion late in the
month.
November 15.0 10 18 Fine, dry and cold
in the middle and late in
the month.
Grass growth occurred,
but growth was soon
inhibited.
December 10.5 4 16 Fine, dry and cold. No grasses.
January, 2007 8.2 2 14 Sometimes rainy, cloudy
and snowy.
No grasses.
February 3) 9.9 5 14 Sometimes rainy and
cloudy.
No grasses.
March 3)
17.8 13 20 Grasses grew steadily
late in the month.

J. ISSAAS Vol. 14, No 1: 46-59 (2008)
50
Month
Temperature (°C) 1)
Weather conditions 2)
Grass growth 2)
Mean Min. Max.
April 18.7 16 22 Sometimes rainy and
cloudy.
Grasses grew densely
and blossomed.
May 31.2 25 40 Rainy and cloudy
in the beginning and
middle. Fine, dry and hot
late in the month.
Grasses withered late in
the month.
June 39.6 30 46 Fine, dry and hot. No grasses.
1) The temperatures were measured at 13:00 in the shade at the GOSM Tissue Culture Laboratory, Al Eeramoun, Syria.
2) The weather conditions and grass growth were observed at the same site. 3) Observation was stopped from late February to mid–March, 2007.
(2) Seasonal changes in the number of aphids trapped in the yellow pan
Fig. 1 shows the seasonal changes in the number of winged aphids and other insects trapped
by a yellow pan from June 2006 to June 2007 at Al Eeramoun, Syria. From June to September, high-
temperature months, a few aphids were trapped. A total of 147 and 58 aphid individuals were trapped
in October and November, respectively. However, few aphids were trapped during winter.
In spring, 2007, the number of trapped aphids increased markedly to 1,022 and 765
individuals in April and May, respectively. Few aphids were trapped in June. The seasonal changes
in the numbers of other insects trapped in the yellow pan resembled those of aphids (Fig. 1). The
insects belonged to a diversity of orders, including Orthoptera, Hemiptera, Neuroptera, Coleoptera,
Diptera, Lepidoptera and Hymenoptera.
0
200
400
600
800
1000
1200
Jun Jul Aug Sep Oct Nov Dec Jan Feb Mar Apr May Jun
2006 2007
No
. o
f in
se
cts
tra
pp
ed
Aphids
Other insects
Fig. 1. The number of winged aphids and other insects trapped by a yellow pan
from June 2006 to June 2007 at Al Eeramoun, Syria.

Survey of aphid infestation and viral infection.....
51
2. Occurrence of aphids and viral infection
(1) Autumn-cultivated potatoes in 2006
Table 3 shows the mean number of the aphids M. persicae and A. gossypii per leaf on potato
plants, and mean percentage of plants showing viral mosaic symptoms in autumn-cultivated potato plants, in the Aleppo and Hama areas, Syria in 2006. The densities of winged and non-winged
aphids began to increase from the middle of October and increased in early November, 2006, just
before the potato harvest, in the contracted and un-contracted fields in both Aleppo and Hama. Large
colonies of non-winged aphids were not observed; they formed extremely small colonies or infested
plants individually in the same manner as the winged aphids.
The virus-infected plants, which were assumed to be infected with PVY based on the visible
symptoms, were already evident on September 3, soon after planting in the contracted and un-
contracted fields in Aleppo. The percentage of infected plants increased with time, and the highest
percentage of 98% was observed on November 9 in the un-contracted field, H3, in Hama (Table 3).
Lower levels of diseased plants were usually observed in the contracted fields.
Table 3. Mean number of the aphids, Myzus persicae and Aphis gossypii per leaf on potato plants,
and mean percentage of plants showing viral mosaic symptoms in autumn-cultivated potato
plants, in the Aleppo and Hama areas, Syria in 2006.
Area
Date
Field 1)
Aphid (No./leaf) 2)
Virus 3)
(%) Myzus persicae Aphis gossypii
Aleppo Sep. 3 A1 (G)
A2 (G)
A3 (G)
A5
A6
0
0
0
0
0
0
0
0
0
0
0.5
0
0
0.1
1.0
Sep. 20 A1 (G)
A2 (G)
A3 (G)
0
0
0
0
0
0
0
0
0.5
Oct. 4 A3 (G)
A4
A5 A6
0
0
0 0
0
0
0 0
1.0
0.5
16.0 62.5
Oct. 18 A1 (G)
A2 (G)
A3 (G)
0.01(W)
0
0
0
0
0
1.0
1.0
0.5
Nov. 1 A3 (G)
A4
A5
A6
0.03
0
0
0.01(W)
0.01
0
0.01
0.01, 0.01(W)
1.0
1.5
51.0
76.0
Nov. 8 A1 (G)
A2 (G)
A3 (G)
0.04
0.06
0.05, 0.01(W)
0
0
0
0.5
0
1.0

J. ISSAAS Vol. 14, No 1: 46-59 (2008)
52
Area
Date
Field 1)
Aphid (No./leaf) 2)
Virus 3)
(%) Myzus persicae Aphis gossypii
Hama
Sep. 18
H1 (G)
H2
H3
H4
H5
0
0
0
0.02(W)
0.01
0
0
0
0
0
0.5
0
2.5
0
0
Sep. 27 H1 (G)
H2
H3
H4
H5
0
0
0
0
0
0
0
0
0
0
0.5
1.5
11.0
0.5
0
Oct. 12 H1 (G)
H2
H3
H4
H5
0
0
0
0.01(W)
0.01(W)
0
0
0
0
0
1.5
18.0
26.5
4.0
0.5
Nov. 2 H1 (G)
H2
H3 H4
H5
0.01
0.01
0.06 0.04
0.01, 0.01(W)
0
0
0.01 0
0
1.0
36.0
93.0 4.0
1.0
Nov. 9
H1 (G)
H2
H3
H4
H5
0.05, 0.01(W)
0.05, 0.01(W)
0.08
0.08, 0.01(W)
0.03
0
0
0
0
0
0.5
81.5
98.0
6.0
0
1) The field codes are as listed in Table 1. (G) indicates fields that were contracted to GOSM. 2) Adults and nymphs of M. persicae and A. gossypii were counted. The number preceding (W) is the number of
winged aphids recorded. 3) The percentage of virus-infected plants showing mosaic symptoms.
(2) Spring-cultivated potatoes in 2007
Table 4 shows the mean number of the aphids M. persicae and A. gossypii per leaf on potato
plants and mean percentage of plants showing virus mosaic symptoms in spring-cultivated potato
plants in the Aleppo and Hama areas, Syria in 2007. Winged and non-winged aphids were already
present on spring-cultivated potato plants in April, just after sprouting. Higher aphid densities were
observed until mid-May, and then lower densities were recorded from late May to harvesting in June
or July, in the contracted and un-contracted fields in both Aleppo and Hama. Large colonies of non-
winged aphids were not observed.
A large number of virus-infected plants were observed during May and July in the un-
contracted fields. The highest percentage of diseased plants (100%) was observed in the un-contracted fields, A2 and H3, at Aleppo and Hama on June 27 and July 4, respectively (Table 4).

Survey of aphid infestation and viral infection.....
53
Lower levels of diseased plants were observed in the contracted fields, as in the autumn-cultivated
potatoes.
Table 4. Mean number of the aphids Myzus persicae and Aphis gossypii per leaf on potato plants
and mean percentage of plants showing virus mosaic symptoms in spring-cultivated potato
plants in the Aleppo and Hama areas, Syria in 2007.
Area
Date
Field 1)
Aphid (No./leaf) 2)
Virus 3)
(%) Myzus persicae Aphis gossypii
Aleppo April 18
A1 (G)
A2
A3
A4
A5
0.01 (W)
0
0
0.01, 0.01 (W)
0.01, 0.01 (W)
0.01, 0.01 (W)
0.01, 0.01 (W)
0.01
0.01 (W)
0
0
0
0
0
0
April 26 A2
A4
A5
0.03, 0.02 (W)
0.01, 0.01 (W)
0.03(W)
0.02, 0.02 (W)
0.04, 0.02 (W)
0.01, 0.14 (W)
0
0
0
May 16 A1 (G)
A2
A3
A4
A5
0.01 (W)
0.01 (W)
0
0
0
0.03 (W)
0.01 (W)
0.01 (W)
0.01, 0.01 (W)
0
0
0
0
27.0
0
May 30 A1 (G)
A2
A3
A4 A5
0
0
0
0 0
0
0
0
0 0
0
29.5
2.0
91.0 10.5
June 13 A1 (G)
A2
A3
A4
A5
0
0
0
0
0
0
0
0
0
0
1.5
95.5
2.5
98.5
32.5
June 27
A1 (G)
A2
A3
0
0
0
0
0
0
2.0
100
24.5
Hama
April 11 H1 (G)
H2
H3
H4
H5
0
0.01, 0.03 (W)
0.05 (W)
0.01 (W)
0.03 (W)
0.04 (W)
0.01, 0.01 (W)
0.01 (W)
0.02 (W)
0.01 (W)
0
0
0
0
0
April 25 H1 (G)
H2
H3
H4 H5
0.01, 0.04 (W)
0.08 (W)
0.01, 0.12 (W)
0.05, 0.01 (W) 0.03, 0.12 (W)
0.02, 0.09 (W)
0.04 (W)
0.01, 0.14 (W)
0.03, 0.06 (W) 0.02, 0.02 (W)
0
0
0
0 0
May 9 H1 (G) H2
H3
H4
H5
0 0.01 (W)
0
0
0
0.01 (W) 0.01, 0.01 (W)
0
0
0
0 0
0.5
0.5
0.5

J. ISSAAS Vol. 14, No 1: 46-59 (2008)
54
Area
Date
Field 1)
Aphid (No./leaf) 2)
Virus 3)
(%) Myzus persicae Aphis gossypii
May 29 H1 (G)
H2
H3
H4
H5
0
0
0.01 (W)
0
0
0
0.01
0
0
0
0
1.0
89.5
7.0
6.5
June 7 H1 (G)
H2
H3
H4
H5
0
0
0
0
0.01 (W)
0
0
0
0
0
0.5
1.0
92.5
6.0
8.0
June 20 H1 (G)
H2
H3
H4 H5
0
0
0
0 0
0
0
0
0 0
0.5
51.0
75.0
4.5 13.0
July 4 H2
H3
H4
H5
0
0
0
0
0
0
0
0
90.0
100
5.0
5.5
1) The field codes are as listed in Table 1. (G) indicates the fields that were contracted to GOSM. 2) Adults and nymphs of aphids, M. persicae and A. gossypii were counted. The number preceding (W) is the number of winged aphids recorded. 3) The percentage of virus-infected plants showing mosaic symptoms.
3. Identification of the aphids collected on potato plants
Thirteen aphid species and four groups identified to generic and tribal levels, which
collectively belonged to 13 genera, were identified, as shown in Table 5. The four groups were not
able to be identified to species level. The major aphid species were M. persicae and A. gossypii, and
to a lesser extent A. fabae. Both winged and non-winged individuals of M. persicae, A. gossypii,
A.fabae, A. craccivora, L. erysimi and other unidentified Aphis spp. were observed, but only winged
individuals were recorded for the other aphid species.
In addition, adult and larval aphids were found on the underground parts (rhizomes and
roots) of potato plants in the GOSM greenhouses. These were identified as Rhopalosiphum rufiabdominalis.

Survey of aphid infestation and viral infection.....
55

J. ISSAAS Vol. 14, No 1: 46-59 (2008)
56
DISCUSSION
Potatoes are one of the most prosperous crops in Syria. However, the decline in production
caused by viral diseases is a serious problem. Potatoes are severely infected with viruses transmitted
by potato-infesting aphids in fields, but the relationship between the dynamics of the aphid
populations and occurrence of viruses is not sufficiently understood. Moreover, the species of aphids have not been identified precisely (Katayama, unpublished report of Technical Transfer by JICA
Expert, February, 2002). To control the aphids efficiently, solutions to these problems are essential.
A few winged aphids were trapped in the yellow pan from June to September (the high-
temperature season) in 2006. Little rain was received and few grasses grew in this period, so the
development of the host plants was extremely limited. The number of aphids trapped increased
somewhat in autumn (October and November), 2006 and more so in spring (April and May), 2007
under moderate temperatures and rainy conditions when grasses germinated at once. These seasonal
changes in the numbers of trapped aphids are considered to be caused by the amount of grasses
available as host plants. The host plants grew densely under mild seasonal climatic conditions. We
also assume that the reproduction and activity of aphids are inhibited by intensely high temperatures.
In Japan, in contrast, the numbers of winged aphids trapped in yellow pans increased in
summer in Hokkaido, a cool-climate area (Mizukoshi, 2002), and in spring and autumn in Kanagawa,
which experiences a warm climate (Chikaoka et al., 1981). Grasses as host plants grow densely
during spring and autumn, therefore the seasonal changes in the numbers of trapped aphids might be
determined by the maximum temperatures.
The infestation of potatoes by aphids accompanies the risk of transmitting viruses. Viruses
transmitted by the aphids have the greatest impact on potatoes, although direct damage caused by
feeding of aphids is also serious (Torikura, 1994). Chikh Ali et al. (2006) reported that PVY was the
main virus infecting potatoes in Syria. PVY samples in Syria were genetically analyzed in detail
(Chikh Ali et al., 2007a, b) and a polyclonal antibody was produced (Sankari et al., 2007). The major virus, PVY, is non-persistently transmitted by M. persicae or A. gossypii (Takanami, 2004). M.
persicae was the most numerous aphid species among the samples collected on potatoes in Syria,
followed by A. gossypii. Moreover, A. fabae ranked among the major aphid pests of potato, which
was examined on potatoes in Turkey by Bostan et al. (2006) and can transmit viruses of potatoes
(Blackman and Eastop, 1984). In Syria, A. fabae is not noted as a potato pest, although M. persicae
and A. gossypii are well known (GOSM, 2005). To our knowledge, this is the first report of the
identification of A. fabae on potatoes in Syria (GOSM, 2005; Personal communication).
We identified aphids from at least 13 species on potatoes in Syria, but the activities of these
aphids as pests on potatoes are unknown except for M. persicae, A. gossypii and A. fabae. Probably
numerous individuals among the aphids stayed only temporarily on the potatoes except for A.
craccivora, L. erysimi and other unidentified Aphis spp., for which non-winged individuals of each were observed.
In addition, we found adults and nymphs of R. rufiabdominalis infesting the underground
parts of potato plants. The reproduction of R. rufiabdominalis is not known on potatoes in Syria
(GOSM, 2005; Personal communication). In Japan, this species is rarely observed on potatoes
(Moritsu, 1949), although infestations and reproduction are frequently observed on barley, dry-paddy
rice and several other orchard and vegetable crops (Moritsu, 1983). The ability of R. rufiabdominalis
to transmit viruses of potato is unknown.
In the present study, large colonies of non-winged aphids were not observed on the potato
plants, on which they formed extremely small colonies or individuals only. In Japan, however, non-

Survey of aphid infestation and viral infection.....
57
winged aphids usually form large colonies (Fujiie, 1972). It is suggested that the lack of water causes
potato plants to become flaccid in the arid climate in Syria and aphids, which are aware of stressed
and unhealthy plants, can scarcely reproduce. Viruses are extensively spread as a result of the
migratory habit of aphids. It appears that the distribution pattern of aphids in potato fields is random
in Syria and that winged aphids randomly fly to potato plants. In Japan, the distribution of aphids is
usually concentrated for reproduction (Fujiie, 1972). This phenomenon in Syria should be considered in the future management of aphids in potato fields.
In the autumn-cultivated potato fields, the aphids began to appear in October. Lower
percentages of virus-infected plants, which were assumed to be infected by PVY, were observed in
September and higher percentages were recorded in October and November. However, in September
11% diseased plants were already found in the un-contracted field, and a lot of diseased plants were
present in some un-contracted fields that we incidentally visited in August (data not shown). Early in
the growing season (August and September), these viral infections were suspected to be the result of
seed potatoes infected with viruses, mostly self-produced ones, for example, and subsequently the
viruses were spread by aphids such as M. persica and A. gossypii late in the growing season (October
and November). A. fabae was not observed in the season.
In the spring-cultivated potato fields, higher aphid densities were observed in April, just after
sprouting, and May. Lower percentages of virus-infected plants were observed in April and higher
percentages were recorded from late May in the un-contracted fields. Late in the growing season,
from late May to July, the increase in viral infection was assumed to be caused by transmission by
aphid species such as M. persica, A. gossypii and A. fabae.
In the contracted fields, virus-infected plants were seldom observed among both autumn- and
spring-cultivated potatoes. Using virus-free seed potatoes of the ‘Super Elite’ or ‘Elite’ classes,
eliminated infected plants from the fields, and also spraying with chemical pesticides, through
controlling aphid populations, might have reduced the occurrence of diseased plants in the fields.
The broad usage of virus-free seed potatoes and effective management of aphids utilizing
several control methods are indispensable to keep virus infection at a low level in Syria. In particular,
virus-free seed potatoes should be used, because the disease was suspected to originate from seed
potatoes already infected with viruses. However, it is impossible to manage aphids completely with a
single method. Needless to say, heavy usage of chemical pesticides should be avoided. The
introduction of integrated pest management based on various control methods, predictions of pest
emergences and economic injury levels, are mandatory for managing aphids (Fujiie, 1997; Shimanuki
et al., 2005).
ACKNOWLEDGEMENT
We gratefully thank Prof. Hidetomo Natsuaki, Utsunomiya University, Japan and Prof.
Keiko T. Natsuaki, Tokyo University of Agriculture, Japan for useful comments and advice on the
manuscript.

J. ISSAAS Vol. 14, No 1: 46-59 (2008)
58
REFERENCES
Blackman, R. L. and V. F. Eastop. 1984. Aphids on the World's Crops. An Identification Guide. J.
Wiley and Sons. Chichester. 466p.
Bostan, H., C. Guclu, E. Ozturk, I. Ozdemir and H. Ilbagi. 2006. Influence of aphids on the epidemiology of potato virus diseases (PVY, PVS and PLRV) in the high altitude areas of
Turkey. Pak. J. Biol. Sci. 9:759-765.
Chikaoka, I., S. Yabuki, S. Akutsu, A. Udagawa and H. Takezawa. 1981. Studies on the control of
mosaic disease on Japanese radish –Especially the control by soil mulches-. Bull. Kanagawa
Agric. Rec. Cent. 122:33-46 (in Japanese with English summary).
Chikh Ali, M., K. Katayama, T. Maoka and K. T. Natsuaki. 2006. The occurrence of Potato virus Y
on potato in Syria. Jpn. J. Trop. Agric. 50:23-28.
Chikh Ali, M., T. Maoka and K. T. Natsuaki. 2007a. The occurrence and characterization of new
recombinant isolates of PVY displaying shared properties of PVYNW and PVYNTN. J. Phytopathology. HP: http://www.blackwell-synergy.com
Chikh Ali, M., T. Maoka and K. T. Natsuaki. 2007b. A point mutation changes the serotype of a
Potato virus Y isolate; genomic determination the serotype of PVY strains. Virus Genes.
HP: http://www.springerlink.com
Fujiie, A. 1972. A sampling plan for populations of two aphid species on lettuce. Japan Appl. Entmol.
Zool. 16:87-93 (in Japanese with English summary).
Fujiie, A. 1997. Prediction of Pests, Pest Control. Pest Control. Written by F. Nakasuji, N.
Ohobayashi and A. Fujiie. Asakura syotenn. Tokyo. pp. 85-101,102-141 (in Japanese).
GOSM. 2005. Guidelines on seed potato production fields stage. Edited by M. Ali-Hammod. GOSM.
Aleppo. 94p (in Arabic).
GOSM. 2006. General Organization for Seed Multiplication 2006. Syrian Arabic Republic Ministry
of Agriculture and Agrarian Reform, General Organization for Seed Multiplication, Aleppo,
56p.
Heie, O. E. 1980. The Aphidoidea (Hemiptera) of Fennoscandia and Denmark. I. General part. The
families Mindoridae, Hormaphididae, Thelaxidae, Anoeciidae, and Pemphigidae. Fauna Ent.
Scand. 9:236.
Heie, O. E. 1986. The Aphidoidea (Hemiptera) of Fennoscandia and Denmark. Ⅲ. Family
Aphididae: Subfamily Pterocommtinae & tribe Aphidini of subfamily Aphidinae. Fauna Ent. Scand. 17:314.
Miyazaki, M. 1971. A revision of the tribe Macrosiphini of Japan (Homoptera, Aphididae,
Aphidinae). Insecta Matsumurana, 34:1-247.
Mizukoshi, T. 2002. Seasonal changes in the number of the foxglove aphid, Aulacorthum solani
(Kaltenbach) (Homoptera; Aphididae), alate caught in yellow pan traps in potato field and
weedy field. Ann. Rept. Plant Prot. North Japan. 53:191-193 (in Japanese with English
summary).

Survey of aphid infestation and viral infection.....
59
Moritsu, M. 1949. Descriptions of two new or a little known species of root-aphids from Japan.
Insecta Matsumurana. 17: 11-14.
Moritsu, M. 1983. Aphids of Japan in color. Zenkoku Nogyo Kyouiku Kyoukai (Tokyo). 545p (in
Japanese).
Sankari, S., M. Chikh Ali, K. Katayama, N. Miki, A. M. S. Omar, A. B. Sawas and K. T. Natsuaki.
2007. The first report of polyclonal antibody production of a Syrian isolate of potato virus Y.
J. Agric. Sci. Tokyo Univ. Agric. 52:109-114.
Shimanuki, T., K. Ito, A. Kushida and M. Kato. 2005. Manual for potatoes. Manual for IPM: A
integrated pest management with minimal environmental stress. Edited by M. Umekawa et
al. National Agricultural Research Center. Tsukuba. pp.145-156 (in Japanese).
Stroyan, H. L. G. 1984. Aphids-Pterocommatinae and Aphidinae (Aphidini) Homoptera, Aphididae.
Handbooks for the identification of British insects, 2(6):1-232.
Takahashi, R. 1961. Descriptions of some new and little known species of Aphis of Japan, with key to
species. Trans. Am. Ent. Soc. 92:519-556.
Takanami, Y. 2004. Virus diseases. The newest plant pathology. Written by S. Okuda et al. Asakura
Shotenn. Tokyo. pp.165-172 (in Japanese).
Torikura, H. 1991. Revisional notes on Japanese Rhopalosiphum, with keys to the species based on
the morphs on the primary host. Jpn. J. Ent. 59(2):257-273.
Torikura, T. 1994. Yield loss of potato by the infection of melon aphid, Aphis gossypii (Homoptera:
Aphididae). Ann. Rept. Plant Prot. North Japan. 45:153-155 (in Japanese with English summary).

J. ISSAAS Vol. 14, No 1:60-66 (2008)
60
SPIDERS IN PADDY FIELDS IN NORTHERN THAILAND
Samaporn Saengyot1
and Banpot Napompeth2
1 NBCRC Upper Northern Regional Center, Mae Jo University
Chiang Mai 50290, Thailand 2 National Biological Control Research Center (NBCRC), Kasetsart University
Bangkok 10900, Thailand
(Received: October 27, 2007; Accepted: April 14, 2008)
ABSTRACT
A survey of spiders in the paddy fields was carried out from October 2005 to August 2006 at
Tambon Mae Faek Mai (approx.19° N, 99° E; 320 meters MSL), Amphoe San Sai, Changwat Chiang
Mai, in the northern highland area of Thailand. The spider fauna thus found were Argiope catenulata
(Doleschall) and A. inustus (L. Koch) (Araneidae); Tetragnatha javana (Thorell), T. mandibulata
Walckenaer and, T. maxillosa Thorell (Tetragnathidae); Runcinia acuminata (Thorell), Thomisus
labefactus Karsch and Thomisus sp. (Thomisidae); Oxyopes javanus Thorell and O. lineatipes (L.
Koch) (Oxyopidae); Pardosa (Lycosa) pseudoannulata (Boesenberg and Strand) (Lycosidae); and
Atypina (= Calitrichia) formosana (Oi) (Linyphiidae). All of these were generalist predators of the
rice stem borers and rice leaf folder, the dominant lepidopterous pests of rice, and other less important
and occasional pests such as rice cutworm, rice caseworm, rice skipper, green rice leafhoppers and
rice brown planthopper. The population densities of these insect pests of rice were all below the economic threshold levels and not causing any observable or significant damage during the
investigation. These results indicated that the spiders present in the paddy fields served as effective
biological control agents.
Key words: generalist predators, biological control agents, rice pests
INTRODUCTION
Natural enemies exhibit close association with the insect pests of rice in the paddy fields. Generally the insect pests of rice do not cause economic damage because of the abundance of the
natural enemies of the rice pests including spiders as generalist predators. The importance of the
spider fauna in the paddy fields has also long been acknowledged. Okuma et al. (1993) prepared an
illustrated monograph of the rice field spiders of Bangladesh. Barrion and Litsinger (1994) prepared a
chapter on the taxonomy of rice insect pests and their arthropod parasites and predators including
spider fauna in South and Southeast Asia. A total of 342 species belonging to 131 genera under 26
families of the rice land spiders of South and Southeast Asia were described and illustrated in Barrion
and Litsinger (1995).
The pioneering work on spiders in the paddy fields in Thailand were undertaken by Okuma
(1968), Okuma and Wongsiri (1973) and Patarakulpong (1977). Vungsilabutr (no date) prepared an
illustrated list of spiders in the paddy fields in Thailand covering 50 species in 36 genera and 14 families highlighting Pardosa (Lycosa) pseudoannulata and Tetragnatha sp. as key natural enemies
of the rice brown planthopper (BPH), Nilaparvata lugens (Homoptera: Delphacidae), and the rice

Spiders in paddy fields in Northern Thailand
61
green leafhopper, Nephotettix virescecens (Homoptera: Cicadellidae). Reports concerning several
species of natural enemies of rice pests and spiders were also included in Napompeth et al. 1983 and
Napompeth, 1989). In addition, Yano et al. (1997) also made a survey of spiders associated with
orchid plants in Thailand. Of the total of 106 specimens of spiders collected, 77 specimens belonging
to 12 families were recorded and 29 specimens have yet to be identified. Vungsilabutr (2001) also
reported 78 species of diurnal spiders in the citrus plantations of the central plains of Thailand admitting that there might be a lot more of the nocturnal spiders which were not then collected.
However, the knowledge about their distribution and abundance in certain microhabitat has not
received much attention through the earlier investigations.
This study sought to clarify the spider fauna in association with the insect pests of rice in the
paddy fields rotated with vegetables at Tambon Mae Faek Mai, Amphoe San Sai, Changwat Chiang
Mai. Rice and vegetables were cultivated under a near “organic” situation where pesticides are hardly
used. Since insecticides were not used and only one application of urea was done on vegetables, rice
and vegetables cultivated at the site were assumed to be near “organic”.
MATERIALS AND METHODS
Site of Investigation
The study site was located at Tambon Mae Faek Mai, Amphoe San Sai, Changwat Chiang Mai
in the northern highland area of Thailand. It is served by Highway No. 1001 (Chiang Mai – Phrao)
about 20 km north of the city of Chiang Mai. Its geographical position is 18° 57′ - 19° 02′ N latitude
and 98° 58′ - 99° 02′ E longitude. The elevation ranges from 320 m on the plain to 947 m on the hilly
slope. The temperature averaged from a minimum of 11.6 °C in February to a maximum of 39.3 °C
in April, while the average relative humidity (RH) ranged from a low 13% in March to a high 96%
from June to December. The overall area is subject to the typical tropical monsoon.
This farming area is cultivated year-round using rice and vegetables in crop rotation and synthetic chemical pesticides are rarely used.
Field Survey, Collection, and Identification of Spiders and Insect Pests
Spiders and their associated pests were collected in the paddy fields for one year from June
2005 to June 2006 to synchronize the collection with the main rice cropping season from June to
November and the second cropping season from November to April in Thailand. Field collection was
made on a weekly basis during the early morning hours from 08:00-10:00 AM. Since this is strictly a
preliminary survey, no attempts were made to collect any quantitative data using any experimental
design for statistical analysis.
The spiders were collected by sweep net and/or aspirator and preserved in 70 % ethyl alcohol. For insect pest species on rice they were collected from infested or damaged plant parts. The eggs,
immature stages, larvae, pupae or nymphs and adults were collected in the field and transferred to
laboratory conditions at the National Biological Control Research Center, Upper Northern Regional
Center (NBCRC-UNRC), at Mae Jo University for further laboratory diagnosis and identification,
where appropriate. Adults of each species were preserved wet in 70% ethyl alcohol or pinned and
dried, as specimens for further identification. Both insect pests and spiders were identified by
comparison with the identified specimens deposited at the Natural Enemies Reference Depository
(NERD), National Biological Control Research Center (NBCRC) Headquarters at Kasetsart
University in Bangkok and other illustrated references such as Okuma (1968), Okuma and Wongsiri
(1973), Patarakulpong (1977), Napompeth et al. (1983), Barrion and Litsinger (1994), Vungsilabutr
(no date), Yano et al. (1997), and Vungsilabutr (2001).

J. ISSAAS Vol. 14, No 1:60-66 (2008)
62
All the voucher specimens of spiders and insect pests obtained from this investigation were
deposited at the NBCRC-UNRC Insect Collection, Mae Jo University, Chiang Mai, Thailand.
RESULTS
Overview of crop cultivation at the Study Site
Typical cultivation in Tambon Mae Faek Mai consisted of two crops of rice per annum, the
main crop from June to November and the second crop from November to April. Since the area is
under irrigation, the rice crop is rotated with some vegetables including cruciferous crops such as
cabbage (Brassica oleracea var. capitata), cauliflower (B. oleracea var. botrytis), Chinese cabbage
(B. chinensis) and Chinese kale (B. oleracea var. acephala), cucurbits such as bitter gourd
(Momordica charantia), angled loofah (Luffa acutangula) and cucumber (Cucumis sativus), chili
pepper (Capsicum frutescens and C. annuum), eggplant (Solanum xanthocarpum), garlic (Allium
sativum) and yard-long bean (Vigna unguiculata subsp. sesquipedalis).
Rice varieties cultivated during the main cropping season from June were regular rice Khao
Hom Mali 105, sticky rice RD 10, and sticky rice San Pa Tong 1. The rice varieties cultivated as the second crop in November were regular rice Suphan Buri 60 and RD 7, sticky rice RD 10, and sticky
rice San Pa Tong 1.
Synthetic chemical pesticides were rarely used in the rice paddies in Tambon Mae Faek Mai for
insect pest and weed control. If used, these were synthetic pyrethroids such as permethrin and
cypermethrin; organophosphates such as chlorpyrifos, methyl parathion (which has been banned);
carbamates such as carbaryl and methomyl; and avermectin and abamectin. Plant extracts also used
were rotenone, neem and home-made fermented biological concoctions. Some weeds were
controlled by manual weeding and herbicides commonly employed were phosphanate such as
glyphosate; bipyridiliums such as paraquat; carbamates such as thiocarbamate; and amides such as
alachlor.
Spiders
In this investigation at least 11 species of spiders were found associated with insect pests of rice
in the paddy fields. These were Argiope catenulata (Doleschall) and A. inustus (L. Koch) (Araneidae)
(Fig. 1), Tetragnatha javana (Thorell), T. mandibulata Walckenaer and, T. maxillosa Thorell
(Tetragnathidae) (Fig. 2), Thomisius sp. and Runcinia acuminata (Thorell) (Thomisidae) (Fig. 3),
Oxyopes lineatipes (L. Koch) and O. javanus (Thorell) (Oxyopidae) (Fig. 4), Pardosa (Lycosa)
pseudoannulata (Boesenberg and Strand) (Lycosidae) (Fig. 5), and Atypina (Calitrichia) formosana
(Oi) (Linyphiidae) (Fig. 6).
A B
Fig. 1. Family Araneidae: A=Argiope catenulata (Doleschall); B=A. inustus (L. Koch).

Spiders in paddy fields in Northern Thailand
63
A B C
Fig. 2. Family Tetragnathidae: A = Tetragnatha maxillosa Thorell;
B = T. mandibulata Walckenaer; C = T. javana (Thorell).
A B
Fig. 3. Family Thomisidae: A = Thomisus sp.; B = Runcinia acuminata (Thorell)
A B
Fig. 4. Family Oxyopidae: A =Oxyopes lineatipes (L. Koch); B = O. javanus Thorell

J. ISSAAS Vol. 14, No 1:60-66 (2008)
64
Fig. 5. Family Lycosidae: Pardosa (Lycosa) pseudoannulata (Boesenberg and Strand).
Fig. 6. Family Linyphiidae: Atypena (Calitrachia) formosana (Oi)
Insect pests of rice
For insect pests, the rice stem borer complex was the dominant lepidopterous pests consisting of
the yellow rice stem borer (Scirpophaga incertulas; Pyralidae), striped rice borer (Chilo suppressalis;
Pyralidae), and pink stem borer (Sesamia inferens; Noctuidae). Other lepidopterous pests which
were less important and were found occasionally were rice cutworm (Mythimna separata; Noctuidae),
rice leaf folder (Cnaphalocrocis medinalis; Pyralidae), rice caseworm (Nymphula depunctalis;
Pyralidae) and rice skipper (Pelopidas mathias; Hesperiidae).
Next in its dominance to the rice stem borer complex was the leafhopper and planthopper
complex consisting of the green rice leafhoppers (Nephotettix virescens and N. nigropictus;
Cicadellidae) and few other planthoppers such as the rice brown planthopper (Nilaparvata lugens; Delphacidae). Other occasional, minor or secondary insect pests encountered were rice gall midge
(Orseolia oryzae; Diptera: Cecidomyiidae), rice hispa (Dicladispa armigera; Coleoptera:
Chrysomelidae) and rice thrips (Stenchaetothrips biformis; Thysanoptera: Thripidae).

Spiders in paddy fields in Northern Thailand
65
Non-insect pests
Non-insect pests found were the rice paddy crabs, Somaniathelphusa spp. (Parathelphusidae);
the golden apple snail, Pomacea canaliculata (Ampullariidae); the rice weaver birds, Ploceus manyar
and P. philippinus (Ploceidae); and rats and mice, Rattus spp. and Mus spp. (Muridae).
DISCUSSION
Predatory Natural Biological Control Agents in Rice and Vegetable Fields
Spiders found in this preliminary study played a very important and vital role as generalist
predators of several species of insect pests in the paddy fields where agro-pesticides were rarely or
less used. They are naturally-occurring biological control agents. As a result of their occurrence and
species abundance, the typical damage to rice plants caused by the insect pests during the period of
investigation was hardly observed. Yano et al. (1997) reported at least 20 identified species as well as
29 unknown species from 107 specimens collected from orchid plants in the wild and from various
orchid nurseries in Thailand. While there were only 11 species of spiders in six families found in this
study, it could still be concluded that the spider fauna in the paddy fields is relatively rich and diversified.
Among the entire spider species thus found, it was observed by judging from the number of
specimens collected in the fields that Tetragnata spp. and Oxyopes spp. were the most abundant
species encountered. The relative densities of these spiders were not investigated in this preliminary
study and, therefore, need to be further quantified employing proper and intensive sampling in the
fields. The difference in spider fauna diversity and richness at the study site and other sites could be
attributed most probably to the higher use of synthetic chemical pesticides in those areas. Cropping
systems of rice in rotation with crucifers, cucurbits and other vegetables with low chemical pesticide
input also render the study site a more favorable habitat harboring spiders and other parasitic and
predatory insect fauna.
The combination of all these factors might have a biotic influence on the low population
densities of the insect pests of rice to cause any observable damage to the crop. As a result, no other
control measures, especially chemical control, are necessary. In addition, the study site could also
serve as a refuge for other beneficial insect species, and increase its diversity eventually to become a
more stable habitat within the overall agroecosystem. It is also obvious that the stability of such a
habitat is relatively favorable for the adoption of organic rice production systems. This habitat should
be maintained and supplemented with an appropriate natural enemy conservation program. It should
also be further modified to become a suitable site of organic rice farming eventually.
CONCLUSION
Spiders found in the paddy fields or elsewhere under other agroecosystems are generalists
feeders and are by nature not prey-specific. However, collectively their predatory habit is a density-
dependent factor which is of primary importance to natural biological control. However, it should be
cautioned that spiders could not be easily and cost-effectively reared under captivity. These are also
not readily amenable to laboratory mass rearing to obtain large population. As a result, these could
not be utilized in the augmentative biological control program. It is, therefore, strongly recommended
that a conservation program of spider fauna should be implemented and carried out concurrently with
the conservation and augmentative use of other natural enemies in that particular habitat of rice or
vegetables cultivation. In addition, any effective microbial control agents such as Bacillus
thuringiensis and some entomopathogenic fungi could also be integrated, where appropriate as an
additional integrated pest management strategy. This approach could then lead to some extent in the

J. ISSAAS Vol. 14, No 1:60-66 (2008)
66
reduction of pesticide use and render the production site more environmentally suitable for organic
rice cultivation.
ACKNOWLEDGEMENT
The authors would like to express their appreciation to Dr Akimi Fujimoto, Project Leader, Academic Frontier Research Project (AFRP), Tokyo University of Agriculture, Tokyo, for providing
partial support to this investigation and Dr Shuji Okajima, AFRP Natural Enemy Team Leader, for
guidance and encouragement. Other facilities and support provided by the National Biological
Control Research Center (NBCRC) Headquarters, Kasetsart University, Bangkok and NBCRC Upper
Northern Regional Center (NBCRC-UNRC), Mae Jo University, Chiang Mai is also herewith
acknowledged.
REFERENCES
Barrrion, A.T. and J.A. Litsinger. 1994. Taxonomy of rice insect pests and their arthropod parasites
and predators, p. 14-359. In: Biology and management of rice insects. E.A. Heinrichs (ed.)
Wiley Eastern Ltd., New Delhi and International Rice Research Institute (IRRI), Manila, the Philippines.
Barrion, A.T. and J.A. Litsinger. 1995. Riceland spiders of South and Southeast Asia. CAB
International, Wallingford in association with International Rice Research Institute. 700 p.
Napompeth, B., S. Buranapanichapan and A. Winothai. 1983. Natural enemies complexes of insect
pests of rice in Thailand. National Biological Control Research Center/ Kasetsart University/
National Research Council of Thailand, Bangkok, Thailand. 55 p.
Napompeth, B. 1989. Biological control of insect pests and weeds in Thailand. BIOTROP Special
Publication 36. p. 51-68.
Okuma, C. 1968. Preliminary survey on the spider fauna of the paddy fields in Thailand. Mushi 42:
89-118.
Okuma, C. and T. Wongsiri. 1973. Second report on the spider fauna of the paddy fields in Thailand.
Mushi 47: 1-17.
Okuma, C., N.Q. Kamal, Y. Hirashima, M.Z. Alam and K. Ogata. 1993. Illustrated monograph of the
rice field spiders of Bangladesh. Institute of Postgraduate Studies in Agriculture
(IPSA)/Japan International Cooperation Agency (JICA) Project. Gazipur, Bangladesh. 93 p.
Patarakulpong, W. 1977. A preliminary survey of spider fauna and their predation in the paddy fields in Thailand. M.Sc. Thesis. Kasetsart University, Bangkok. 59 p.
Vangsilabutr, W. (no date). Spiders in the paddy fields of Thailand. Entomology and Zoology
Division, Department of Agriculture, Bangkok. 53 p. (in Thai).
Vangsilabutr, W. 2001. Spider fauna in citrus orchards in Thailand. Entomology and Zoology
Division, Department of Agriculture, Bangkok. 108 p. (in Thai).
Yano, K., W. Vangsilabutr and B. Napompeth. 1997. Spiders associated with orchid plants in
Thailand. Thai Journal of Agricultural Science 30: 111 – 145.

J. ISSAAS Vol. 14, No 1:67- 79 (2008)
67
CURRENT VULNERABILITY OF THE RICE PRODUCTION SECTOR
TO RAINFALL VARIABILITY AND EXTREMES IN THE PROVINCE OF
CAMARINES SUR, PHILIPPINES
Michael A. Cuesta1 and Roberto F. Rañola, Jr.
2
1Research Associate, Ateneo Social Science Research Center, Ateneo de Naga University
2Professor, Department of Agricultural Economics, College of Economics and Management,
University of the Philippines, Los Baños, Philippines
(Received: September 11, 2007; Accepted: April 3, 2008)
ABSTRACT
This paper discusses the results of a study on vulnerability of the rice production sector to
rainfall variability in the Province of Camarines Sur. Results of the study show that the province has
become more exposed to climate hazards caused by the increase in rainfall variability during the
period 1976-2005. It has become more vulnerable to drought, which reduced annual rice production
output by nearly 20 percent. The analysis of risk of crop loss associated with drought also shows that
this has been increasing over time, costing nearly P1.2 billion during the period 1996-2005. These results suggest that the increase in rainfall variability puts the province at risk of food insufficiency if
no mitigating or adaptation measures are instituted.
Key words: risk, drought, climate change
INTRODUCTION
Rice production has always been affected by changes in climatic conditions. Despite
advancements in technology such as irrigation and better seed varieties, climate remains to be a key factor determining rice productivity. In the past years, climate change and their impacts on rice
productivity, income and over-all food security has become a central focus of government policies
and researches particularly in Southeast Asian countries.
Rice is very important to the Philippines and many of its provincial economies. In recent
years, rice sufficiency has become synonymous with food sufficiency, with rice accounting for 35
percent of the calorie intake of the population to as high as 60-65 percent for households in the lowest
income groups (DA, 2002). In the Bicol Region, the province of Camarines Sur plays a dominant role
in rice production. But in the last three decades, the rice production sector of the province has been
under increasing pressure to meet the increasing demand for rice by the growing population given that
productive resources (land and water) have increasingly become more limited and that farm inputs
have become more expensive. Climate hazards brought about by changing climatic conditions are expected to add to this pressure.
The effects of climate on rice production are well established through climate-based, crop-
response models. But these approaches fail to predict actual rice productivity because they do not
integrate socioeconomic factors that serve to mitigate the effects of changing climatic conditions. The
advent of vulnerability studies served to fill this gap. But while there has been a considerable increase
in the number of these types of studies dealing with vulnerability to changing climatic conditions

Current vulnerability of the rice production sector.....
68
during the past several years, most of these studies were undertaken at the global, regional and
national scale. These are of limited value to local decision-makers since they require locally relevant
information which they can use as bases for designing and prioritizing interventions to address these
vulnerabilities. There is therefore a need to understand the effects of climate hazards in different areas
so that interventions can be more focused and appropriate.
This paper discusses the current risks posed by rainfall variability and extremes on the sector
and the major socioeconomic impacts particularly on the province’s rice production output. Such an
understanding is particularly important for developing the appropriate strategies for mitigating the
effects of these climatic hazards.
CONCEPTUAL FRAMEWORK
The rice production sector of the province of Camarines Sur is considered as a system that is
exposed to risks of crop failure due to climate hazards from variability in rainfall. The analysis of risk
follows the conceptual framework presented in Fig. 1. In this framework, risk reduction involves
enhancing the capacity of stakeholders particularly in the rice farming sector to prepare for, avoid,
moderate, and recover from the effects of climate hazards.
Fig. 1. Climate risk, vulnerability and adaptive capacity framework
Climate Risk
In this paper, risk is viewed as the outcome of climate-related disasters triggered by a
physically defined climate hazard (e.g., drought) given the vulnerability of the exposed system. This
is compatible with previous definitions of risk being a product of the frequency and consequences of
an adverse event (Blaike et al., 1994, cited in Kelly and Adger, 2000; Downing and Patwardhan,
2003; Brooks, 2003; Dolan and Walker, 2004). When applied to the rice production sector, risk is
referred to as the loss in rice produce due to the occurrence of a climate hazard such as drought or extreme rainfall events caused by rainfall anomalies.

J. ISSAAS Vol. 14, No 1:67- 79 (2008)
69
Formally: Ri = pHi x Vi (1)
Where, Ri = risk of crop loss from type of hazard i
pHi = probability of hazard i
Vi = vulnerability of the sector to hazard i
such that the higher the frequency of a hazard and/or the higher the vulnerability of the sector to the
hazard, the greater the risk.
Climate Hazard
Hazard is viewed as a physically defined climatic event that has the potential to cause harm
such as extreme rainfall events and/or drought (UNDP, 2003). Climate hazards are typically
characterized through hydrological and meteorological variables. In this paper, climate hazards are
characterized using the total annual rainfall recorded in the province. A set of criteria was developed
to establish the critical values for annual precipitation that would indicate rainfall anomalies or mark
the presence of a hazard. Formally,
Hi = Wi Wlo ≤ W < Whi (2)
Where, Hi = specific type of climate hazard
Wi = actual amount of rainfall
Wlo = lower critical value of rainfall for i
Whi = upper critical value of rainfall for i
The probability of a hazard, pHi in Equation 1, was then associated with the frequency by
which the actual amount of rainfall occurs within these critical values over a period of time.
Vulnerability to Climate Hazards
Vulnerability is a composite of the biophysical and socioeconomic attributes of the rice
production sector that causes it to become susceptible to and unable to cope with the effects of a
climate hazard (Kelly and Adger, 2000; IPCC, 2001, cited in Brooks, 2003). Vulnerability, in this
view is systemic and a consequence of the state of development that is often manifested in aspects of
human conditions such as undernourishment and poverty (Downing and Patwardhan, 2003). Using
this lens, vulnerability is specifically referred to in this paper as the outcomes determined by the
interactions between the biophysical and socioeconomic conditions of the rice production sector and
rainfall variability measured in terms of anomalies in the amount of rice produced.
RESEARCH METHODOLOGY
Formulation of Risk Criteria
Climate hazards such as drought and extreme rainfall events are known to negatively affect
rice productivity at varying degrees, depending on the severity and frequency by which they occur.
Thus, a set of criteria was used to mark the occurrence of rainfall anomalies or hazards, and to
determine the severity, frequency, level of risk and magnitude of the impacts associated with their
occurrence.
The set of criteria used is a modification of the “decile” technique developed by Gibbs and
Maher in 1967. The attractiveness of this technique compared to other techniques for measuring

Current vulnerability of the rice production sector.....
70
rainfall anomalies lies in the ease of calculation using fewer data and assumptions while still
providing an accurate statistical measurement of precipitation. The need for a long climatological
record to calculate the deciles accurately however is a disadvantage of the decile system (Hayes,
2006).
Using the modified decile method, the annual rainfall data recorded in the province over a 30-year period (1976-2005) obtained from the CSSAC-PAGASA-PCARRD Agromet-Synoptic
Station in Pili, Camarines Sur, was divided into fifths of the distribution (Table 1). Each part of the
distribution or category was called a “quintile.” Ideally, the monthly and annual rainfall data covering
a 50-year period at the sub-provincial level is needed to determine the degree of spatial variations in
climate hazards across the province. But the choice of data was constrained by the fact that there is
only one agromet-synoptic station in the province and was only established in 1975. Thus, with this
limited data, it was simply assumed that municipalities were subject to uniform climate hazards. The
implication of this assumption of identical climate hazards is that the differences in risk outcomes are
assumed to be due solely to variations in vulnerability (i.e., biophysical and socioeconomic
conditions) across different municipalities.
Table 1. Categories of annual rainfall
Categories Description
1st Quintile: Lowest 20 % Much below normal
2nd Quintile: Next lowest 20 % Below normal
3rd Quintile: Middle 20 % Near normal
4th Quintile: Next highest 20 % Above normal
5th Quintile: Highest 20 % Much above normal
Characterizing Current Climate Hazards
Using the quintile categories of rainfall, a climate hazard is said to exist when the amount of
rainfall occur within the range of the lowest or highest 40% of the rainfall distribution. The
probability of a hazard is then measured as the frequency by which it occurs over a period of time.
The recorded annual distribution of rainfall over the last 30 years (1976-2005) was further divided
into three separate decades to allow for comparison and to determine the trend in the occurrence of climate hazards over the period.
Assessment of Current Vulnerability
It is recognized that the rice production sector is very vulnerable and greatly affected by
climate hazards. Vulnerability in this context is measured by the amount of change in the level of rice
produced due to the occurrence of a hazard. The initial assessment of the vulnerability of the rice
production sector to rainfall variability was made using the 30-year (period 1976-2006) rice
production data of the Bureau of Agricultural Statistics (BAS) for Camarines Sur and the
corresponding annual rainfall anomalies derived earlier. A comparison of the trend in the anomalies
for both annual rice production and annual rainfall was the first step in determining vulnerability.
The anomaly data for annual rice production was determined by calculating the deviation of
an observed data from the mean of the data set. Using this method, an observation greater than the
mean yields a positive deviation, whereas an observation smaller than the mean yields a negative
deviation. The extent of vulnerability of the rice production sector to climate hazards caused by
J. ISSAAS Vol. 14, No 1:67- 79 (2008)
71
variability in rainfall was then determined by comparing the anomalies for annual rice production and
annual rainfall. An increasing negative trend in the anomalies means that the production loss from
climate hazards is increasing over time and that the rice production sector is becoming more
vulnerable.
The amount of loss in rice production due to the occurrence of a particular climate hazard was estimated by regressing yearly rice production output with the time variable and a dummy
variable representing the hazard, and excluding one category, “near normal” rainfall, to serve as basis
for comparison.
The following regression equation illustrates the procedure:
Y = α+ β1DummyH1+ β2DummyH2 + β3DummyH3 + (3)
Β4DummyH4+ β5Time + μ
where Y is annual rice production output; α is a constant term; β1,…, β5 are regression coefficients;
DummyH1 is a hazard dummy representing “much below rainfall”, DummyH2 = “below normal”
rainfall, DummyH3 = “above normal” rainfall, and DummyH4 = “much above normal” rainfall; Time is in years; and μ is an error term. The hazard dummy, say DummyH1, is equal to “1” if the hazard exists,
and “0” if otherwise. A negative sign of the regression coefficient, β, suggests that amount of rice
produced has declined due to the occurrence of the hazard event. Thus, the value of the coefficient, β,
is a good indicator of the decrease in amount of rice produced due to the hazard. It is assumed that the
decrease in the amount of rice produced results to a large extent from the occurrence of a climate
hazard.
Assessment of Current Climate Risk
Risk is defined in this paper as the product of the probability and consequences of a climate
hazard. It is the outcome of the interaction between the climate hazard and the vulnerability of the rice production sector to these hazards. Thus, “risk = probability of a hazard x degree of vulnerability.”
The degree by which the rice production sector is vulnerable to a particular hazard is based on the
amount of loss in annual rice production computed using Equation 3. Thus, the higher the frequency
of a hazard and/or degree of vulnerability, the greater is the risk of crop loss. Decadal comparison of
the risk posed by climate hazards from rainfall variability was made by modifying Equation 1, such
that:
j
RT = ∑ (pHi * Vi)T i = 1,…,j (4)
i=1
Where, T = time period
j = set of climate hazards i = specific type of climate hazard
pHi = probability of ith hazard in j at time T
Vi = sector vulnerability to ith hazard in j at time T
j RT = aggregate risk from hazard i = 1,…,j at time T
i=1
RESULTS AND DISCUSSION
The province of Camarines Sur is located some 447 kilometers southeast of Manila. It is the
largest among the six provinces in the Bicol Region. The province’s total land area comprises around

Current vulnerability of the rice production sector.....
72
30 percent (548.2 thousand hectares) of the region, over half (262.9 thousand hectares) of which is
used for agricultural production (NSO, 2004). In year 2000, the total population of Camarines Sur
was 1.55 million, comprising 33 percent of the region’s total population. It increased at an average
rate of 1.72 percent in 1995-2000. Its total population consisted of 296 thousand families, 67 percent
of whom resided in rural areas, where agricultural activities are the main source of income (NSO,
2000).
Rice production is very important to the country and many of its regional economies. In
recent years, rice sufficiency has become synonymous with food security, especially among the poor.
The rice production sector of Camarines Sur plays a dominant role in the rice economy of the Bicol
Region because of its relatively high level of productivity of 3.1 MT per hectare. The province
provides 46% of the total rice area as well as 47% of the annual regional production output.
However, similar to other areas of the country, the province’s rice production sector has
remained underdeveloped. During the past three decades, this sector has been under a lot of pressure
to produce enough to meet the increasing demand for rice despite the decline in cultivated area which
has shrunk by 12.4 percent during the period 1991-2002. Farming has also become less viable as a
business with a reduction in the net profit-cost ratio from 0.15 in 1991 to only 0.06 in 2002 (PhilRice-BAS, 2004). Poverty incidence among rural families has remained high and increased a little from
52.6 percent in 1991 to 57.8 percent in 2000 (PIDS, 2003).
In response, the government launched in 2002 the “Ginintuang Masaganang Ani Rice
Program” as one of the core programs of Agriculture and Fisheries Modernization Act with DA as the
lead agency and several other government agencies supporting it. The program was expected to
benefit the farmers through increase in productivity, income and over-all food security by providing
improved seed varieties, access to credit facilities, improved marketing systems and facilities, better
irrigation services, and extension and trainings on integrated farming systems. However, what the
program was not able to address were concerns related to changing climatic conditions which have
reversed some of these gains.
Current Climate Hazards
The discussion in the paper focuses on the assessment of the risks and impacts related to
climate hazards due to annual rainfall variability, such as drought and extreme rainfall events, on the
rice production sector of Camarines Sur. By and large, these climate hazards are known to adversely
affect the productivity of the rice sector in varying degrees, depending on the severity and frequency
by which they occur. The set of criteria used to characterize annual rainfall anomalies is presented in
Table 2.
Table 2. Categories of annual rainfall, Camarines Sur, 1976-2005
Categories Amount of Annual
Rainfall (mm) Description
1st Quintile: Lowest 20 % < 1,690.14 Much below normal
2nd
Quintile: Next lowest 20 % < 2,066.68 Below normal
3rd Quintile: Middle 20 % < 2,303.34 Near normal
4th Quintile: Next highest 20 % < 2790.12 Above normal
5th Quintile: Highest 20 % ≥ 2,790.12 Much above normal

J. ISSAAS Vol. 14, No 1:67- 79 (2008)
73
As shown in Table 2 for example, the first or lowest quintile includes annual rainfall of less
than 1,690 mm and described as “much below normal”. Likewise, the second quintile was defined by
the amount of annual rainfall (2,066.68 mm) not exceeded by the lowest 40% of the observations. On
the other extreme, the 5th quintile includes annual rainfall exceeding 2,790 mm and described as
“much above normal”. This is the largest amount of annual rainfall (2,790.12 mm) recorded in the
province within the last 30-year period (1976-2005).
These categories for annual rainfall were used to determine the presence of climate hazards
such as annual rainfalls with levels within the lowest or highest 40 percent of the rainfall distribution.
The lowest 40 percent of the rainfall distribution is characterized by dry spells or drought conditions,
while the highest 40 percent is often accompanied by the occurrence of tropical cyclones. The
probability of a climate hazard was based on the frequency by which these hazards occurred over a
period of time. The nature and extent by which the rice production sector was exposed was
determined by a decadal comparison of the frequency by which the hazards occurred.
Annual Rainfall Anomalies
The recorded distribution of annual rainfall was categorized based on the procedure described in the previous section and the result of which is shown in Fig. 2 below.
Fig. 2. Decadal comparison of total annual rainfall by quintile classification and
frequency, Camarines Sur, 1976-2005
Decadal comparison of total annual rainfall showed that the incidence of “near normal”
rainfall has increased over the period, from 10 percent in 1976-1985 to 30 percent in 1996-2005.
However, the incidence of “much above normal” rainfall has also increased considerably, from 10
percent in 1976-1985 to 40 percent in 1996-2005. In contrast, the frequency of “above normal”
rainfall has considerably decreased, from a high of 40 percent in 1976-1985 to near zero in 1996-
2005. On the other hand, while the frequency of “below normal” rainfall has decreased, from 30 percent in 1976-1985 to 10 percent in 1996-2005, the incidence of “much below normal” rainfall has
increased from 10 percent in 1976-1985 to 20 percent in 1996-2005. The increase in “much below
normal” rainfall in 1986-1995 is consistent with the occurrence of the El Niño phenomenon in the
province.

Current vulnerability of the rice production sector.....
74
Moreover, similar analysis of total monthly and seasonal rainfall revealed that during the dry
season, the province has become increasingly exposed to drought and extreme rainfall conditions.
Relatively heavy rainfall activity early in the dry season (November-December) has increased, while
relatively low level rainfall activity during the later month of April appeared to extend up to the early
months of May to July of the wet season, suggesting a delay in the coming of the monsoon rains. By
contrast, the wet season has been characterized by relatively less extreme rainfall conditions, from “near normal” to “above normal” rainfall, with increasing heavy rainfall activity in October.
Overall, the results show that the frequency of extreme weather events in the province has
increased over the past three decades, marked by the increase in the occurrence of “much below
normal” and “much above normal” annual rainfall. These findings suggest that by and large, rainfall
as a resource critical to rice production has increasingly become uncertain and more likely to occur in
the extreme, characterized by periods of long dry spells and/or drought conditions as well as heavy
rainfall events, particularly during the dry season. As rice production in the province is largely
dependent on rainfall, it is reasonable to expect that climate hazards caused by the increase in rainfall
variability will have an adverse effect on the rice production sector from shortages in irrigation water
and shortened cropping periods.
Current Vulnerability to Climate Hazards
An assessment of the trend in the anomalies in annual rainfall and rice production in the
province over 30 years from 1976 to 2005 was undertaken to determine changes in the level of
vulnerability of the rice production sector to climate hazards caused by annual rainfall variability.
The deviation of observed rice production data from the mean was computed to obtain the
rice production anomaly data. These production anomalies were then grouped into the annual rainfall
categories developed in the previous section and plotted over the time period from 1975 to 2005 (Fig.
3). The results show that while there has been a noticeable increase in rice production during the
years with “near normal”, “below normal” and “much above normal” rainfall, there has been a noticeable decline in rice production during years with “much below normal” rainfall. This means that
the production of rice has declined over time due to drought indicating that the rice producing sector
of the province has become more vulnerable to the changing rainfall conditions.

J. ISSAAS Vol. 14, No 1:67- 79 (2008)
75
Fig. 3. Time trend of anomalies in annual rainfall and rice production output,
Camarines Sur, 1976-2005.
The shifts in the volume of rice production due to the occurrence of annual rainfall anomalies
over the period 1976-2005 was estimated using the regression model given by Equation 3. The total
annual rice production output taken from the data of BAS was regressed against a time trend and the individual dummy variables representing the five categories of annual rainfall. Prior knowledge
suggested that the occurrence of a climate hazard such as drought or extreme rainfall events cause rice
production to decrease. A summary of the results of the regression analyses is shown in Table 3
below.
Table 3. Results of the regression model for rice production anomalies, Camarines Sur, 1976-2005.
Predictors Coefficients Std. Error t-Value Sig.
Constant -10,257,862 2,844,338 -3.606 .001
Time 5,323 1,426 3.734 .001
DummyH1 -68,128 32,398 -2.103 .046
DummyH2 -20,729 33,326 -0.622 .540
DummyH3 -1,456 36,990 -0.039 .969
DummyH4 -23,348 32,020 -0.729 .473
Adjusted RSquare = .395 F = 4.783 Sig. = .004
The results show that the annual rice production is not affected by amount of rainfall which
are “below normal” (DummyH2), “above normal” (DummyH4) and “much above normal” (DummyH5).
This is indicated by the non-significance of the coefficients. Possibly, this is because the use of total
annual rainfall and rice production data is not able to fully capture the timing and nature by which
climate hazards occur within the year, as well as its corresponding effects on rice production. The
prevalence of “much above normal” rainfall, for instance, may have occurred at a time when farmers
have already harvested their rice and so it did not entirely affect the volume of rice produced. In this
case, the analysis may be improved by using more detailed data such as the seasonal or monthly
distribution of rainfall and rice production output.
On the other hand, the results show that volume of rice produced dropped significantly by around 68,128 MT when the amount of rainfall was much “below normal”. This is indicated by the
negative and relatively large coefficient (-68,128 MT) of its dummy variable, DummyH1. The
decrease in the volume of rice produced may be partly explained by the significant decrease in the
total area harvested to rice due to the lack of supply of irrigation water.
The volume of rice lost compared to the “near normal” production as indicated by the
coefficient for DummyH1 is estimated at 68,128 MT or 551 kgs./ha during a “much below normal” or
drought condition. This value is also indicative of the degree of vulnerability of the province’s rice
production sector to drought. The crop loss due to drought is estimated at nearly 20 percent of
province’s average annual rice production output of 361,298 MT. Assuming an average value of
P8,740 per MT of unmilled rice, the estimated value of crop loss due to drought is placed at P595.44
million annually.
Moreover, the results suggest that the occurrence of “much below normal” rainfall or
drought has an adverse effect on capacity of the province to domestically produce the total rice
requirement of its population, that is, to be self-sufficient, for a given period. In 2005, the food

Current vulnerability of the rice production sector.....
76
demand for rice was 717 MT per day or 258,120 MT per year (NSCB, 2005). This means that, with
an average annual rice production of 361,298 MT, the province’s production sufficiency ratio was 140
percent, suggesting that it had an excess supply of rice of about 103,178 MT or equivalent to 144 days
of supply of rice. But, this also means that, in case of “much below normal” rainfall or drought, the
resulting decrease in annual rice production of 68,128 MT will reduce the province’s excess supply of
rice to only 35,050 MT or equivalent to only 48 days supply of rice. Moreover, the implications of a decrease in Camarines Sur’s supply of rice may be expected to extend to other provinces that
normally depend on its surplus for their own supply of rice. The “knock-on” effects of the decrease in
rice production and income may likewise be felt through the forward and backward linkages of the
rice sector with the other sectors of the local economy in terms of reduced demand, income and
employment.
The effects of the “much below normal” rainfall occurrence are felt strongly at the farm
level. An average rural family in Camarines Sur normally earns an annual income of P72,626, 18.5
percent (P13,436) of which comes from raising crops such as rice in a 2 hectare farm lot (NSO, 2000).
Thus, during a time of drought, rural households or 67 percent of the families in the province would
lose over 70 percent (P9,634) of their agricultural income. This suggests that, in the event of drought,
average rural families will not be unable to produce enough rice to meet their own household requirements. Conceivably, the consequent loss of income can cause rural families to fall back into
temporary or transitory poverty. This condition at the farm level can be magnified at the provincial
level.
As a whole, the results suggest that the province in general and small farmers in particular
are at risk from increased crop loss and food insufficiency due to climate hazards, particularly
drought, caused by rainfall variability if no mitigating or adaptation measures are instituted.
Current Climate Risks
The previous findings suggest that compared to other climate hazards, the province is more vulnerable to the occurrence of “much below normal” rainfall or drought. The current risk from
drought due to the rainfall variability in 1976-2005 is calculated using Equation 4. The corresponding
probability of occurrence of drought and the loss in annual rice production associated with the hazard
are obtained from the results of the previous sections. The observations are divided into three decades
for comparison to determine whether there are changes in the levels of risk over time. Results of prior
analysis show that there has been an increase in the level of risk due to the increase in extreme
weather events.
Table 4. Estimated current risk of crop loss due to drought by decade, Camarines Sur,
1976-2005.
Decade Frequency of
Drought
Estimated Crop Loss
Volume
(metric tons)
Value
(billion pesos)
1976-1985 1 68,127 0.595
1986-1995 3 204,381 1.786
1996-2005 2 136,254 1.191
Assumptions: Estimated annual crop loss in volume due to drought is 68,127 Price of unmilled rice is 8,740/MT
The results show that the estimated risk of loss in rice production output due to drought has
increased by 100 percent, from P0.595 billion in 1976-85 to P1.191 billion in 1996-2005, brought

J. ISSAAS Vol. 14, No 1:67- 79 (2008)
77
about by the increase in the frequency of “much below normal” rainfall (Table 4). The amount of
risk was highest in 1986-1995, reaching P1.786 billion due to the series of the El Niño events that
occurred during the period. Overall, this indicates that the province’s rice production sector has
increasingly been placed at risk from drought due to rainfall variability, specifically, the occurrence of
“much below normal” rainfall. These estimates may be used by concerned agencies as input in
developing vulnerability-reducing strategies, particularly in rationalizing the cost of these strategies or interventions.
CONCLUSION
The province is more vulnerable to drought, which is marked by the occurrence of “much
below normal” rainfall conditions compared to the other climate hazards from increase in rainfall
variability. Over the last three decades, production has been declining due the increasing occurrence
of “much below normal” rainfall events. This phenomenon is indicative of the increasing vulnerability
of the rice production sector of the province. The province’s annual rice production during the period
1976-2005 for example dropped by nearly 20 percent compared to the “near normal” trend because of
drought.
Drought conditions, among the different climate hazards mentioned, have the greatest impact
on the province’s production of rice. With drought or “much below normal” rainfall, the resulting
decrease in annual rice production of 68,128 MT will reduce the province’s rice surplus to only
35,058 MT which is equivalent to only 48 days supply of rice. Moreover, the implications of a
decrease in Camarines Sur’s supply of rice may be expected to extend to other provinces that
normally depend on its surplus for their own rice supply. Its “knock-on” effects such as reduced
demand, income and employment to other industries in the local economy may also be felt through
forward and backward linkages of the rice production sector
At the farm level, about 67 percent of rural households in the province loses at least 70
percent (P9,634) of their annual agricultural income due to the “much below normal” rainfall. This suggests that they will not be able to produce enough rice for their own consumption. Similarly, rural
families are estimated to lose around P4,380 or 33 percent of their annual farm income in years of
“below and/or much above normal” rainfall.
For the rice producing sector of the province, the estimated risk of loss in the volume of rice
produced due to the increasing frequency of drought conditions has increased by 100 percent over the
last three decades, from P.595 billion for the period 1976-85 to P1.191 billion for the period 1996-
2005.
These findings suggest that the changing climatic condition has increased the risks faced by
the rice producing sector of the province with a consequent reduction in productivity and farm
incomes which threatens the food security especially of small farmers. There is a need therefore to invest in programs which will enhance the capacity especially of small farmers to adapt to these
changing climatic conditions through different mitigating measures.
In developing these adaptation programs, it is important to gain a more detailed
understanding of key socioeconomic conditions that make local communities vulnerable to the risks
posed by current climate hazards, as well as the various adaptation measures that they had actually
used to manage these risks. Even if future adaptation strategies would be different, today’s adaptation
measures will provide valuable inputs for developing those strategies. It is therefore recommended
that adaptive capacity studies at the local level should be conducted for this purpose.

Current vulnerability of the rice production sector.....
78
The effects of drought compared to typhoons on average rural families are gradual, less
dramatic, often invisible but persistent and take them much more time to recover. Often also, the
delay in getting vital information on current climate conditions from the National Weather Bureau
often results to delays in getting the appropriate assistance from the local and national government
units. There is a need then for local government units to be able to monitor on their own the onset of
changes in climatic conditions and implement on time appropriate mitigating measures. This becomes especially important with the increase in the likelihood of occurrence of drought and the vulnerability
of rural families to this type of hazard. Initially, this task may require enhancing the capacity of local
government units to employ drought monitoring tools and develop a planned response that is an
integral part of its disaster management program.
REFERENCES
Brooks, N. (2003). Vulnerability, risk and adaptation: a conceptual framework. Working Paper 38.
Tyndall Centre for Climate Change Research. University of East Anglia, Norwich, United
Kingdom. Retrieved August 23, 2005, from Tyndall Centre website:
http://www.tyndall.ac.uk/publications/working_papers/wp38.pdf .
Dolan, A.H. and I.J. Walker (2004). Understanding vulnerability of coastal communities to climate
change related risks. Journal of Coastal Research, SI 39. (Proceedings of the 8th International
Coastal Symposium). Itajai, SC-Brazil, ISSN 0749-0208. Retrieved July 23, 2005, from the
Uvic-Geography website :http://www.geog.uvic.ca/blast/Publication%20PDFs/Dolan&
Walker-ICS042.pdf .
Downing, T.E., and A. Patwardhan (2003). Assessing vulnerability for climate adaptation. UNDP
Adaptation Policy Framework Technical Paper 3. New York: UNDP. Retrieved March 11,
2006, from the UNDP-Global Environment Facility website: http://www.undp.org/gef/undp-
gef_publications/publications/apf%20technical%20paper03.pdf .
Department of Agriculture (2002). Ginintuang masaganang ani rice program 2000 primer. DA-Field
Operations Service. Elliptical Road, Diliman, Quezon City.
Hayes, M.J. (2006). Drought indices. National Drought Mitigation Center. Retrieved May 28, 2007,
from the NDMC website: http://drought.unl.edu/whatis/indices .
Kelly, P.M. and W.N. Adger (2000). Assessing vulnerability to climate change and facilitating
adaptation. Center for Social and Economic Research on the Global Environment Working
Paper GEC 99-07. Retrieved July 23, 2005, from CSERGE website:
http://www.uea.ac.uk/env/cserge/pub/wp/gec/gec_1999_07.pdf .
National Statistical Coordination Board (2005). Regional social and economic trends: Bicol Region.
National Statistical Coordination Board, Regional Division V. Legazpi City.
National Statistics Office (2000). Family income and expenditures survey. Volume I National
Summary. Final Report. Integrated Survey of Household Bulletin. Series No. 109. National
Statistics Office, Manila.
National Statistics Office. 2000. Census of population and housing. Report No. 2-25E (Camarines
Sur), Volume I, Demographic and Housing Characteristics. January 2003. National Statistics
Office, Manila.

J. ISSAAS Vol. 14, No 1:67- 79 (2008)
79
National Statistics Office (2004). Census of agriculture. National Statistics Office, Manila.
Philippine Rice Research Institute and Bureau of Agricultural Statistics (2004). Philippine rice
statistics handbook, 1970-2002. Volume I-III.
Philippine Institute for Development Studies (2003). Poverty and subsistence measures by province. NEDA, Makati Building, 106 Amorsolo St., Legaspi Village, Makati City 1229 Philippines.
Retrieved March 11, 2006 from the PIDS Economic and Social Database website:
http://econdb.pids.gov.ph/index.php
United Nations Development Program (2003). Adaptation policy frameworks for climate change:
developing strategies, policies and measures: annexes. Retrieved March 11, 2006, from the
UNDP-Global Environment Facility website: http://www.undp.org/gef/undp-
gef_publications/publications/apf%20annexes%20a&b.pdf

J. ISSAAS Vol. 14, No 1:80-91 (2008)
80
UTILIZATION OF DAIRY CATTLE MANURE-RICE HULL COMPOST USING
MICROBIAL INOCULATION
Bayani M. Espiritu, Lovely B. Willauer and Mannix S. Pedro
National Institute of Molecular Biology and Biotechnology (BIOTECH)
University of the Philippines Los Baños (UPLB), College, Laguna, Philippines
(Received: September 26, 2007; Accepted: April 10, 2008)
ABSTRACT
The effects of seeding nitrogen-fixing bacterial inoculants into cattle manure-rice hull mixtures in composting were evaluated, particularly in terms of nitrogen gain in the substrate and
level of survival of the bacteria. The effects of such compost on wetland rice as test crop was also
determined. One hundred-gram weights of dry and screened dairy cattle manure-rice hull mixture
(70/30, w/w) were placed in nylon bags and composted for 20 days in actual compost piles of the
same materials. Burk medium (without glucose) was added to the substrates. Inoculation treatments
of nitrogen-fixing bacteria Azotobacter sp. or cellulolytic fungi of Trichoderma sp. were imposed on
the materials. Carbon loss (66.7 mg C/g vs. control’s 59.7) was high and nitrogen gain (14.50 mg
N/g vs. control’s 7.02) was highest in those treated with nitrogen-fixing bacteria. The survival of the
inoculant organisms was highest in those correspondingly treated compost. Azotobacter counts in
treated compost were 4.22 x 10⁶ cfu/g compost, significantly higher than the control with 1.13 x 10⁶
cfu/g compost. The inoculated compost produced in this study was tested in wetland rice, and was found to significantly improve the tiller number, panicle number, and grain yield of the test crop at
levels similar to those supplied with chemical fertilizers.
Key words: compost, cattle manure-rice hull mixture, nitrogen-fixing bacteria, Azotobacter sp.,
cellulolytic fungi, Trichoderma sp.
INTRODUCTION
Composts or organic fertilizers are renewable inputs for crop production. These can be
produced from organic wastes whenever needed. The continuing increase in human population
coupled with the increase in livestock-raising for food would indicate the magnitude of waste
generation which at the same time is directly related to present-day pollution problems. On the other hand, chemical fertilizers are not renewable such that their use must be in regulated amounts.
Chemical nitrogen fertilizers make use of depletable fossil fuels while chemical phosphatic
fertilizers depend on the continuous mining of rock phosphates.
The use of organic materials in crop production is known to provide nutritional and other
benefits (Yoshida, 1995), and may serve to offset the excessive or improper use of chemical
fertilizers (Ahmed, 1994). Composts, in particular, can be superior to chemical fertilizers in the
cultivation of field plants (Fujio et al, 1986), and when in combination with beneficial microbial
inoculants, could further boost sustainability and efficiency. The combined use of organic matter
and microbial inoculants had been shown to give nitrogen increases in the order of 6 to 14 mg/g of
substrate consumed (Lynch, 1984). Other benefits of microbial inoculation of organic residues such as improvements of soil-stabilizing properties of wheat straw have been noted (Lynch and Wood,
1984). The problem of disposal of cattle manure and rice hull has not been solved yet in many areas
of the country. In one province alone, such as Batangas in Southern Luzon, dry cattle manure
production reaches 647.8 t per year, while rice hull generation amounts to 44.6 t per year (BAS,
1995).
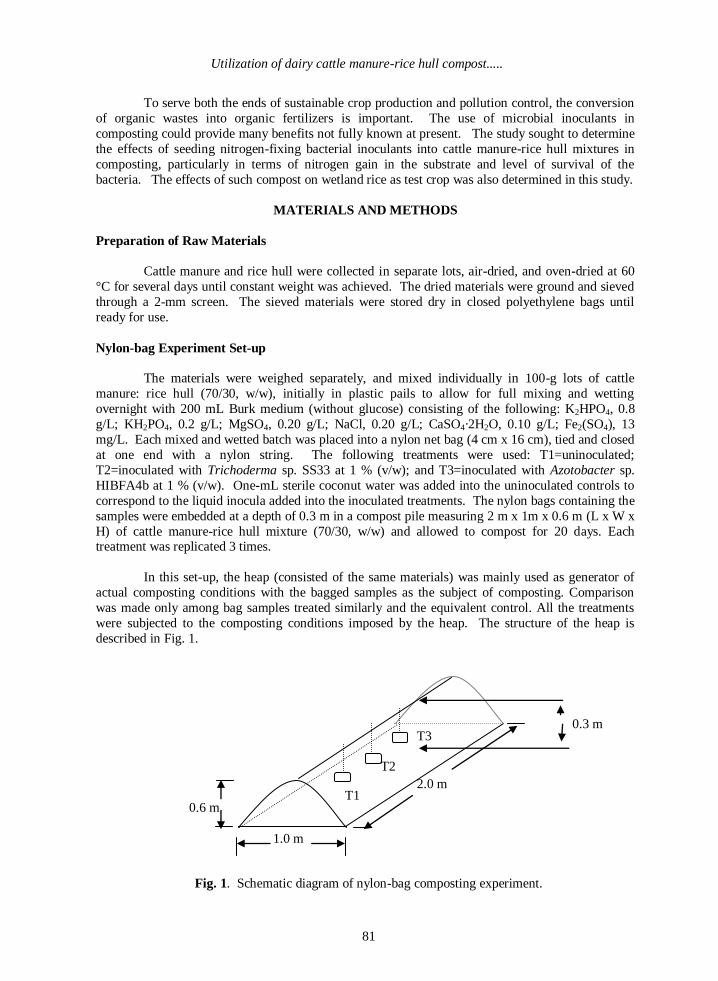
Utilization of dairy cattle manure-rice hull compost.....
81
To serve both the ends of sustainable crop production and pollution control, the conversion
of organic wastes into organic fertilizers is important. The use of microbial inoculants in
composting could provide many benefits not fully known at present. The study sought to determine
the effects of seeding nitrogen-fixing bacterial inoculants into cattle manure-rice hull mixtures in
composting, particularly in terms of nitrogen gain in the substrate and level of survival of the
bacteria. The effects of such compost on wetland rice as test crop was also determined in this study.
MATERIALS AND METHODS
Preparation of Raw Materials
Cattle manure and rice hull were collected in separate lots, air-dried, and oven-dried at 60
°C for several days until constant weight was achieved. The dried materials were ground and sieved
through a 2-mm screen. The sieved materials were stored dry in closed polyethylene bags until
ready for use.
Nylon-bag Experiment Set-up
The materials were weighed separately, and mixed individually in 100-g lots of cattle
manure: rice hull (70/30, w/w), initially in plastic pails to allow for full mixing and wetting
overnight with 200 mL Burk medium (without glucose) consisting of the following: K2HPO4, 0.8
g/L; KH2PO4, 0.2 g/L; MgSO4, 0.20 g/L; NaCl, 0.20 g/L; CaSO4·2H2O, 0.10 g/L; Fe2(SO4), 13
mg/L. Each mixed and wetted batch was placed into a nylon net bag (4 cm x 16 cm), tied and closed
at one end with a nylon string. The following treatments were used: T1=uninoculated;
T2=inoculated with Trichoderma sp. SS33 at 1 % (v/w); and T3=inoculated with Azotobacter sp.
HIBFA4b at 1 % (v/w). One-mL sterile coconut water was added into the uninoculated controls to
correspond to the liquid inocula added into the inoculated treatments. The nylon bags containing the
samples were embedded at a depth of 0.3 m in a compost pile measuring 2 m x 1m x 0.6 m (L x W x
H) of cattle manure-rice hull mixture (70/30, w/w) and allowed to compost for 20 days. Each treatment was replicated 3 times.
In this set-up, the heap (consisted of the same materials) was mainly used as generator of
actual composting conditions with the bagged samples as the subject of composting. Comparison
was made only among bag samples treated similarly and the equivalent control. All the treatments
were subjected to the composting conditions imposed by the heap. The structure of the heap is
described in Fig. 1.
Fig. 1. Schematic diagram of nylon-bag composting experiment.
0.6 m
1.0 m
2.0 m
0.3 m
T1
T2
T3

J. ISSAAS Vol. 14, No 1:80-91 (2008)
82
Microbial Inocula Preparation
The Trichoderma sp. SS33 inoculum was prepared by growing seed culture in potato-
dextrose broth (PDB) and by dilution technique, separating a clear-cut colony growing in potato
dextrose agar (PDA). The colony was grown to abundance in PDA slant for 3 to 4 days. A 1-cm
growth was cut from the slant and regrown in 4-mL sterile coconut water in 10-mL sterile tubes. One-mL volumes were taken from the liquid broth for inoculation into the raw materials which were
placed in nylon bags. The bacterial inoculants of Azotobacter sp. HIBFA 4b were prepared using
standard procedures. A loopful of inoculum was taken from a previously purified stock culture and
streaked in Burk medium (BM) agar plates. The plates were incubated for 3-4 d at 30 °C and a
single colony was picked for re-growing in abundance in 4-mL sterile coconut water in 10-mL tubes
with shaking at 30 °C for another 3-4 days. From the cloudy broth of the purified strain, one-mL
volumes were taken for inoculation into raw materials that were placed in nylon bags.
Physical and Chemical Analysis
Percent weight loss was determined by deducting the final oven-dry weight of materials
from the initial dry weight and multiplying the value by 100. The chemical characteristics of the resulting compost were determined using recommended procedures (PCARRD, 1980). Total N was
determined using an automatic nitrogen analyzer. The ignition method was used to determine the
total carbon content. The total phosphorus content of the compost was determined using the vanado-
molybdate method.
Microbial Count
One-g samples from each treatment was taken after thorough mixing and placed separately
in 9-mL sterile distilled water and shaken for 1 hr. Appropriate dilutions were made. Aliquots of 1
mL from 10-5 to 10-8 dilutions were spread-plated on appropriate growing media (PDA, BM or NA)
depending upon the target organisms. Colony-forming units (cfu’s) on each plate were counted. The corresponding cfu/g dry weight was calculated. All Azotobacter-like colonies were picked out
from BM agar plates after a 3 to 4 day growing period. These were tested for morphological and
physiological characteristics, and intrinsic antibiotic resistance (IAR) patterns (Tchan, 1984),
relative to the inoculum strain. Trichoderma-like fungal isolates from each treatment were evaluated
relative to the fungal inoculum strain based on cultural and morphological characteristics (Rolph and
Miner, 1998).
Field Testing of Inoculated Compost in Wetland Rice
The use of inoculated compost [i.e. corresponding to T3 of the composting experiment;
inoculated with Azotobacter sp. HIBFA4b at 1 % (v/w)] was tested in Los Banos, Laguna, during the
wet season. The test soil was Maahas clay loam, pH 6.0, 0.35 % total N, and organic matter content of 5.08 %. Wetland rice cv. IR-74 was the test crop. The seedlings were grown in soil bed lined
with heavy paper for 10 days, and these were transplanted into plots laid out in randomized complete
block design (RCBD) with 4 replications per treatment.
The following treatments were used in the field test: T1 = control (no fertilizer applied); T2
= added with chemical fertilizer at the rate per ha of 90 kg N, 60 kg P, and 60 kg K; T3 = added
with chemical fertilizer at the rate per ha of 45 kg N, 30 kg P, and 30 kg K, and inoculated compost
(500kg/ha, 30 % moisture); T4 = added with inoculated compost at 500 kg/ha; and T5 = supplied
with chemical fertilizer at the rate per ha of 90 kg N, 60 kg P, 60 kg K, and inoculated compost at
500 kg/ha.

Utilization of dairy cattle manure-rice hull compost.....
83
Organic fertilizer or inoculated compost used in this experiment came from one stock, and
analyzed to have these properties: 1.28 % total N, 0.75 % total P2O5, and 1.50 % total K2O, and
24.59 % total C.
The whole amount of inoculated compost of 500 kg/ha was applied basally and
incorporated into the soil during the final leveling of the field. For chemically treated plots, chemical fertilizers were applied in split, 60-60-60 was broadcast basally, and the remaining N at 30-
0-0 was topdressed at plant panicle initiation stage. Irrigation water was allowed into the plots one
week after transplanting. The grains were harvested when about 90 % of the grains in all plots
turned yellow. Plant height and tiller number were taken 30 days after transplanting (30 DAT), and
at harvest. Plants, within a 2m x 3m harvest area in each plot, were cut with a sickle and collected.
Sample plants were threshed, cleaned and straw weights were recorded. Grains from each plot were
weighed and oven-dried at 60oC for 3 days.
RESULTS
Effects of Microbial Inoculation on Total N and C Content and Weight Loss
Inoculation was done where required in all samples prior to composting. Selected
properties of raw materials are presented in Table 1. The cattle manure- rice hull mixture had the
following initial contents: total N, 1.05 %; C, 30.34 %; and C/N of 29.0. The composting heap was
used to provide the actual composting conditions and thus the bagged samples were the ones
analyzed. The homogeneity of starting materials was critical for comparison.
Table 1. Selected properties of raw materials.
Raw Material N (%) C (%) C:N Ratio P(%) K(%)
Rice hull 0.25 43.20 172.80 1.00 0.90
Cattle manure 1.04 25.64 24.65 0.60 1.82
Cattle manure-rice hull
mixture (70/30, w/w)
1.05 30.34 29.00 0.50 1.33
The compost pile heated up during the composting period. The temperature profile of the
heap throughout the 20-day incubation period is shown in Fig. 2. The temperature varied from a
mean of 47.2 °C through the first week, then about 41.5 °C in the middle week, and finally about
39.3 °C in the last stages.
The selected properties of cattle manure-rice hull blend after composting are shown in
Table 2. Inoculation with the nitrogen-fixing bacteria Azotobacter (T3) produced the highest total N
in the resulting compost. This N content was significantly higher than that of the control (T1) and
that of the Trichoderma-inoculated treatment (T2). The total C contents in T3 and T2 were
significantly lower than that of the control. The highest loss in dry matter weight (relative to each to
each treatment’s initial dry weights) was detected in the Trichoderma-inoculated samples. Significantly lower weight losses were noted in the control and in the Azotobacter-inoculated
samples.
Inoculation of cattle manure-rice hull mixture with the nitrogen-fixing bacteria Azotobacter
significantly enhanced the nitrogen content of the resulting compost as compared to the control and
to that inoculated with Trichoderma sp. Inoculation with the nitrogen-fixing bacteria showed
similar amount of dry matter loss as the control.

J. ISSAAS Vol. 14, No 1:80-91 (2008)
84
Fig. 2. Temperature profile of dairy cattle manure-rice hull (70/30, w/w) compost pile.
Table 2. Selected properties of cattle manure-rice hull blend (70/30, w/w) after composting.
Treatment N (%) C (%) C/N Weight Loss
(%)
(T1) Control - uninoculated 1.16 b 24.37 a 21.0 c 15.62 b
(T2) Trichoderma – inoculated 1.04 c 23.31 b 22.0 b 17.35 a
(T3) Azotobacter - inoculated 1.28 a 23.67 b 18.0 d 15.77 b Note: Raw material at zero time had the following contents, C = 30.34%; N = 1.05%, and initial oven-dry weight of 100 g. Means followed by the same letter within a column are not significantly different at 5% level DMRT.
Effects of Microbial Inoculation on N Gain of Compost
The gain in nitrogen of the control composted material over the uncomposted state was 1.10
mg/g compost. Inoculation with Azotobacter doubled that N gain to 2.27 mg/g, a significant
increase over the control. No N gain was detected with Trichoderma inoculation. N gain efficiency
in terms of mg N per g C lost was also significantly highest in the Azotobacter-inoculated materials
(Table 3); likewise, the highest N gain efficiency in terms of mg N per g substrate consumed. The
results showed that inoculation of the cattle manure-rice hull mixture significantly improved the
nitrogen gain in compost.
0
10
20
30
40
50
60
Incubation time (days)
Tem
pera
ture
(d
eg
C)
morning noon afternoon
morning 42 44.6 45.2 47.3 46 44.8 41.2 40.8 38.6 39.7 39.3 38 39.2 38.6 39.5 39noon 50.3 49.3 49.7 49.3 48.3 46.1 42.1 41.2 39.1 40.2 39.8 39.7 41.3 39 41.5 40.2afternoon 46.2 48.9 47.1 47.5 46.5 45.2 42.9 40.9 40.1 39.2 38.9 38.4 39.1 39.2 39.1 38.4
1 2 3 4 5 6 7 8 9 10 11 12 13 14 15 16 17 18 19 20

Utilization of dairy cattle manure-rice hull compost.....
85
Table 3. Carbon loss and nitrogen gain of cattle manure-rice hull blend (70/30, w/w) after
composting.
Treatment
pH
C loss
(mg/g)
N gain
(mg/g)
N gain
(mg N/g C lost)
(T1) Control - uninoculated 7.9 a 59.7 b 1.10 b 18.58 b
(T2) Trichoderma – inoculated 8.1 a 70.3 a 0 c 0 c
(T3) Azotobacter - inoculated 8.4 b 66.7 a 2.27 a 33.83 a Means followed by the same letter within a column are not significantly different at 5 % level by DMRT
Correlation of C/N with Residual Dry Weight and N Gain
Correlation analyses showed that the resulting C/N of each treatment was due more to N
gain and not to weight loss. The correlation of C/N vs. residual dry weight of samples was low and
showed negative relationship (r = -0.44, figure not shown), while that of the C/N vs. nitrogen gain
was high and also negative (r = -0.98, Fig. 3). The improvement in the nitrogen content appeared to
be due mainly to nitrogen fixation and not to material decomposition.
20.6221.95
17.7419.48
18.44
21.14
21.27
22.71
22.6
y = -1.7198x + 22.591
r = - 0.97946
0
5
10
15
20
25
0 0.5 1 1.5 2 2.5 3
N gain (mg N / g compost)
C :
N r
ati
o
Fig. 3. Regression line and correlation between C:N ratio and
N gain in cattle manure-rice hull compost.
Total Bacteria, Azotobacter and Trichoderma Counts
The load of the inoculant organisms as well as the total bacteria were determined in each
treatment after composting. The total bacterial counts are shown in Fig. 4. The highest bacterial
count was found in those treated with either Azotobacter (35.94 x 10⁸ cfu/g compost) or
Trichoderma (32.92 x 10⁸ cfu/g compost). These counts were both significantly higher than those of
the control (15.85 x 10⁸ cfu/g compost).

J. ISSAAS Vol. 14, No 1:80-91 (2008)
86
Fig.4. Total bacterial count in cattle manure-ricehull blend (70/30, w/w) after composting at thermophilic
temperatures.
0
5
10
15
20
25
30
35
40
(T1) Control-uninoculated
(T2) Inoculated-Trichoderma
(T3) Inoculated-Azotobacter
Treatment
Tota
l bac
teria
l cou
nt (x
100
milli
on c
fu/g
com
post
)
Fig. 4. Total bacterial count in cattle manure-rice hull blend (70/30, w/w) after
composting at thermophilic temperatures. (Means followed by the same letter
are not significantly different at 5 % level by DMRT).
The Azotobacter-inoculated treatment gave the highest Azotobacter counts after 30-d
composting (4.22 x 10⁶ cfu/g compost, Fig. 5). Both the control and the Trichoderma-inoculated
treatments showed significantly lower Azotobacter counts (1.13 x 10⁶ and 1.61 x 10⁶ cfu/g compost,
respectively).
Fig. 5. Count of azotobacters in cattle manure-rice hull blend after composting at thermophilic temperatures
(Means followed by the same letter are not significantly different at 5 % level by DMRT).
4.22 a
1.61 b
1.13 b
0
0.5
1
1.5
2
2.5
3
3.5
4
4.5
(T1) Control-uninoculated
(T2) Inoculated-Trichoderma
(T3) Inoculated-Azotobacter
Treatment
Azot
obac
ter c
ell c
ount
(x 1
milli
on c
fu/g
com
post
)
Fig. 5. Count of azotobacters in cattle manure-rice hull blend (70/30, w/w) after composting.
Means followed by the same letter are significantly different at 5% level by DMRT.

Utilization of dairy cattle manure-rice hull compost.....
87
The highest Trichoderma counts (Fig. 6) were found in the Trichoderma-inoculated
compost. Significantly lower Trichoderma counts were found in the control (1.39 x 10³ cfu/g
compost) and in the Azotobacter-treated compost (1.38 x 10³ cfu/g compost).
Fig. 6. Count of Trichoderma in cattle manure-rice hull blend (70/30, w/w) after composting at thermophilic temperatures.
1.39
3.37
1.38
0
0.5
1
1.5
2
2.5
3
3.5
4
(T1) Control-uninoculated
(T2) Inoculated-Trichoderma
(T3) Inoculated-Azotobacter
Treatment
Fung
al c
ount
(x 1
000
cfu/
g co
mpo
st)
Fig. 6. Trichoderma counts in cattle manure-rice hull blend (70/30, w/w) after composting. Means followed by the same letter are significantly different
at 5% level by DMRT.
Effects of Inoculated Compost in Field Conditions
At 30 DAT, inoculated compost showed its effects (Table 4). Plants supplied with
inoculated compost at 500 kg/ha were taller (53.15 cm/hill) than those of the control (47.75 cm/hill).
The combination of chemical fertilizer at N-P-K of 90-60-60 (each nutrient in kg/ha), and inoculated
compost at 500 kg/ha, produced the significantly tallest plants at 56.53 cm/hill, which were 18 %
taller than the control. At the same early growth stage, the treatment with inoculated compost alone significantly gave the highest tiller number (456.0/m2) followed by treatment with the combined
addition of half chemical fertilizer (45-30-30) and full inoculated compost at 500 kg/ha (446.0/m2).
These two treatments gave 45 % and 42 % increases in tiller count over the control (315.0/m2). At
the same growth stage, tiller count of plants supplied with inoculated compost alone was
significantly equivalent to those supplied with full chemical fertilizer (432.0 tillers/m2).
At harvest, addition of fertilizers, whether chemical or inoculated compost, gave plants
significantly taller than the control (Table 5). Inoculated compost application alone at 500 kg/ha
gave the highest tiller count at 487.0 tillers/ m2; significantly higher that those of the control (388.0
tillers/ m2), and those with full chemical fertilizer (462.0/m2). The combined application of full
chemical fertilizer and inoculated compost gave the highest panicle number at harvest (437.0
panicles/ m2), followed by those of combined rates of half chemical fertilizer and inoculated compost (358.0/m2).
Combined application of full chemical fertilizer and inoculated compost gave the highest
grain yield of 6.15 t/ha, a 28-percent increase over the control. Half rate of combined application of
chemical fertilizer (60-30-30) with full inoculated compost (500 kg of organic fertilizer) gave the
second highest grain yield of 6.10 t/ha, an increase of 27 % over the control. Inoculated compost

J. ISSAAS Vol. 14, No 1:80-91 (2008)
88
applied alone at 500 kg/ha gave grain yield of 5.92 t/ha, significantly higher than the control by 24
%. The control gave the lowest grain yield of 4.79 t/ha.
Table 4. Effect of inoculated dairy cattle manure-rice hull compost on the average plant height and
tiller count of rice cv. IR-74 at 30 DAT 1.
Treatment Mean plant height
(cm/hill)
Tiller number
(no./m2)
T1, Control (no fertilizer) 47.75 b 315.0 b
T2, Chemical fertilizer
(90-60-60)
56.40 a 432.0 a
T3, Chemical fertilizer (45-30-30) + Inoculated compost
(500 kg/ha)
54.90 a 446.0 a
T4, Inoculated compost (500
kg/ha)
53.15 a 456.0 a
T5, Chemical fertilizer (90-60-
60) + Inoculated compost (500
kg/ha)
56.53 a 445.0 a
1 Values are a mean of 4 replicates; means followed by a common letter are not significantly different at 5 % level by DMRT.
Table 5. Effects of inoculated dairy cattle manure-rice straw compost on the average plant height
and tiller count of rice cv. IR-74 at harvest.
Treatment Mean plant
height
(cm/hill)
Tiller
number
(no./m2)
Panicle
number
(no. / m2)
Grain
yield
(t/ha)
T1, Control (no
fertilizer)
59.48 b 388.0 b 195.0 c 4.79 b
T2, Chemical
fertilizer (90-60-60)
70.22 a 462.0 a 339.0 a 6.02 a
T3, Chemical
fertilizer (45-30-30)
+ Inoculated
compost (500
kg/ha)
71.82 a 476.0 a 358.0 a 6.10 a
T4, Inoculated
compost (500
kg/ha)
68.65 a 487.0 a 355.0 a 5.92 a
T5, Chemical
fertilizer (90-60-60) + Inoculated
compost (500
kg/ha)
68.90 a 462.0 a 437.0 b 6.15 a
1 Values are a mean of 4 replicates; means followed by a common letter are not significantly
different at 5 % level by DMRT.

Utilization of dairy cattle manure-rice hull compost.....
89
DISCUSSION
All of the treatments used in this experiment received mineral supplementation in the form
of Burk medium minus mannitol or glucose. The minerals were supplied with distilled water as
wetting medium. The effects of microbial inoculation, with either the nitrogen-fixing bacteria
Azotobacter or the cellulolytic fungus Trichoderma, on the compost end-product as compared to the uninoculated control, were evaluated in this study.
The raw materials (cattle manure-rice hull mixture) had initial total N content of 1.05 %, C
content of 30.34 % and C/N of 29.0 at day 0. The composting process proceeded at a temperature
range between 49 to 37 °C. The control and the Azotobacter-treated materials showed increases in
nitrogen content after composting, giving values of 1.16 and 1.28 %, respectively. Only the
Trichoderma-treated compost (1.04 % total N) did not show any increase in N after composting.
Nitrogen content normally increases with the composting process, due to organic matter degradation
and low ammonia losses (Genevini et al., 1997). On the aspect of organic matter degradation, such
as in composting, materials of low nitrogen content and easily decomposable carbon offer the
potential for dinitrogen fixation (Gibson et al., 1988). The production of fixed nitrogen in organic
materials through aerobic nitrogen-fixers and aerobic cellulose decomposers has been shown by some workers (Halsall and Gibson, 1985).
The differences in results were mainly due to the inoculation treatments. All treatments
showed high weight losses in the range of 15 to 17 %, indicating high OM degradation. Differences
in temperature range, whether high or low, may induce differences in the composition of the
microflora inside the composting mass (McKinley and Vestal, 1985; Chino et al., 1983). In spite of
the relatively high temperature range, survival of the mesophilic inoculants were detected after
composting. Samples inoculated with Trichoderma (T2) showed the highest carbon loss (70.3 mg
C/g) similar to those inoculated with Azotobacter (T3, 66.7 mg/g). Inoculation with either
Trichoderma or Azotobacter consumed the highest carbon during substrate degradation. N gain was
highest in materials inoculated with Azotobacter (2.27 mg/g), followed by the control (1.10 mg/g). Samples inoculated with Trichoderma showed no gain in nitrogen.
In terms of N gain as mg N/g substrate consumed, Azotobacter inoculation gave the highest
values (14.5 mg/g). The control had significantly lower N gain at 7.02 mg. But the Trichoderma-
inoculated samples had no gain in nitrogen after composting. The Azotobacter-treated samples
which showed the highest N gains also exhibited the highest counts of these nitrogen-fixing bacteria,
indicating that the greater nitrogen content in the compost is due to these organisms. The control
which most likely also accommodated native nitrogen-fixers and cellulolytic fungi had significantly
lower N gains.
The highest total bacterial counts were found in those treated with either Azotobacter
(35.94 x 10⁸ cfu/g compost) or Trichoderma (32.92 x 10⁸ cfu/g compost). These counts were equally significantly higher than those of the control (only 15.84 x 10⁸ cfu/g compost). The added
inoculants appeared to have encouraged greater growth of microflora which could be due to the
positive interactions induced by them.
The N gains obtained by inoculation in the small bagged samples as done in this study were
nil. But the magnitude of N gain could be higher under actual large-scale composting conditions,
and this is the subject of our subsequent experiments. Factors that could be beneficial to crops other
than N gain could be at work in inoculated composts. Other workers have indicated growth-
promoting or biocontrol effects that are magnified by inoculated composts (Kostov et al., 1996;
Hoitink et al., 1993). The changes observed in inoculated compost over uninoculated one as shown
in this study could have other beneficial effects on target crops which would need to be elucidated.

J. ISSAAS Vol. 14, No 1:80-91 (2008)
90
Actual composting conditions involve aerobic, anaerobic and microaerophilic sites brought
about by the nature of mixed solid substrate degradation such that an array of various types of
microbial nitrogen-fixers may be found in the materials. The materials composted in this study were
a heterogeneous mass of mixed cattle manure and rice hull with niches of high and low N fractions
and sites of varying degrees of oxygen supply. Against this background, both the aerobes and the anaerobes would be active (Lynch and Wood, 1984) subject to the influence of treatment conditions.
The field test revealed the beneficial effects of inoculated dairy cattle manure-rice hull compost on
the growth and yield of rice. The inoculated compost boosted the tiller and panicle numbers and the
grain yield of rice at levels similar to those effected by chemical fertilizers. Organic materials such
as manure and rice plant parts contain nutrients and other constituents such as cellulose, hemi-
cellulose, lignin, water-soluble sugars, ash, and others (Adachi et al., 1997) which can promote plant
growth. Composting conditions as well as bacterial inoculants can provide gains in nutrients and
minimization of adverse growth conditions obtaining in the field (Moroyu, 1982; Ponnamperuma,
1984). Other workers (Vien et al., 2006; Yong-Hwan, 2004)) have noted that soil nitrogen could
increase under compost application as compared to full rate of chemical NPK fertilizers. It had also
been observed that the combination of compost and chemical fertilizers can effect large soil nitrogen
pool and more microbial activity. Under these conditions the rice plant could very well benefit from a gradual and stable supply of more available nitrogen coming from the mineralization of soil
organic matter and applied compost.
ACKNOWLEDGEMENTS
We would like to acknowledge the funding support of the National Dairy Authority (NDA)
and the administrative assistance of the Philippine Council for Agriculture and Resources Research
and Development (PCARRD) in the conduct of this study as part of an overall project study on
waste management and bioorganic fertilizer production.
REFERENCES
Adachi, K, W. Chaitep and T. Senboku. 1997. Promotive and inhibitory effects of rice straw and
cellulose application on rice plant growth in pot and field experiments. Soil Sci. Plant Nutr.,
43(2): 369-386.
Ahmed, S. 1994. Agriculture-fertilizer interface in Asian and Pacific Region: issues of growth,
sustainability and vulnerability. Food and Fertilizer Technology Center, Extension Bull.
387, 1-22.
Bureau of Agricultural Statistics (BAS). 1995. Annual Report. Department of Agriculture,
Philippines
Chino, M., S. Kanazawa, T. Mori, M. Araragi, and B. Kanze. 1983. Biochemical studies on
composting of municipal sewage sludge mixed with rice hull. Soil Sci. Plant Nutr. 29, 159-
173.
Fujio, Y., S. Kume, and S. Ueda. 1986. Correlation between physical and chemical changes of rice
straw as a major constituent under composting. J. Ferment. Technol. 64 (4), 351-354.
Genevini, P., F. Adani, and C. Villa. 1997. Rice hull degradation by co-composting with dairy cattle
slurry. Soil Sci. Plant Nutr. 43 (1), 135-147.

Utilization of dairy cattle manure-rice hull compost.....
91
Gibson, A. H., D. M. Halsall, and M. M. Roper. 1988. Nitrogen fixation associated with residue
breakdown. In: Bothe, H., F. I. N. Derujin, and W. E. Newton (Eds.), Nitrogen Fixation-
100 Years After. Stuttgart: Gustav Fisher. pp. 753-758.
Halsall, D. M. and A. H. Gibson. 1985. Cellulose decomposition and associated nitrogen fixation by
mixed cultures of Cellulomonas gelida and Azospirillum species or Bacillus macerans.
Appl. Environ. Microbiol. 50, 1021-1026.
Hoitink, H., M. Boehm, and Y. Hadar. 1993. Mechanisms of suppression of soilborne plant
pathogens in compost-amended substrates. In: H. Hoitink and H. Keeper (Eds.). Science
and Engineering of Composting. Renaissance Publications, Worthington, OH. pp. 601-621.
Kostov, O., Y. Tzvetkov, G. Petkova, and J. M. Lynch. 1996. Aerobic composting of plant wastes
and their effect on the yield of ryegrass and tomatoes. Biol. Fertil. Soils. 23 (1), 20-25.
Lynch, J. M. 1984. Interactions between biological processes, cultivation and soil structure. Plant
and Soil. 76, 307-318.
Lynch, J. M and D. A. Wood. 1984. Controlled microbial degradation of lignocellulose: the basis for existing and novel approaches to composting. In. J. K. R. Gasser (Ed.), Composting of
Agricultural and Other Wastes. Elsevier Appl. Sci. Publishers. pp. 183-193.
McKinley. V. L. and R. V. Vestal. 1985. Physical and chemical correlates of microbial activity and
biomass in composting municipal sewage sludge. Appl. Environ. Microbiol. 50, 1395-1403.
Moroyu, H., H. Naganoma and K. Kanda. 1981. Effects of application of barley straw on growth of
rice plants and chemical changes in the soil. Part 1. Field experiments on successive
application of barley straw. J. Cent. Agric. Exp. Stn. 35, 179-205 (in Japanese with English
summary).
Philippine Council for Agriculture and Resources Research and Development [PCARRD]. 1980
Standard methods of analysis for soil, plant, water and fertilizers. Los Baños, Laguna.
Ponnamperuma F. N. 1984. Straw as a source of nutrient for wetland rice. In: Organic Matter and
Rice, p. 117-136. International Rice Research Institute, Los Banos.
Rolph, H. and D. Miner. 1998. Identification of Trichoderma and Verticillium. A Training Manual
from the International Course on the Identification of Fungi of Agricultural and
Environmental Significance (CBS). Baarn & Delft, The Netherlands.
Tchan, Y. 1984. Azotobacteriaceae. In: Bergey’s Manual of Systematic Bacteriolog Vol. 1. N.R.
Kreig and J. G. Holt (Eds.) William and Wilkins. USA. pp. 219-234.
Vien, M.D., T. Watanabe, H.L.Man, K.V. Tien, and P.N. Thi. 2006. Application of rice straw
compost for sustainable rice production. Paper presented in the 18th World Congress of
Soil Science, July 9-15, Philadelphia, Pennsylvania, USA.
Yong-Hwan L, Sang-Min L, Yun-Jeong L and Du-Hoi C. 2004. Rice cultivation using organic
farming system with organic input materials in Korea, In: New directions for a diverse
planet: Proceedings of the 4th International Crop Science Congress, Brisbane, Australia, 26
Sep – 1 Oct 2004 | ISBN 1 920842 20 9 | www.cropscience.org.au
Yoshida, T. 1995. Soil microorganisms for sustainable agriculture. J. ISSAAS 1 (1) 62-71.

J. ISSAAS Vol. 14, No 1:92-100 (2008)
92
PROTECTION OF HOT PEPPER AGAINST MULTIPLE INFECTION OF VIRUSES
BY UTILIZING ROOT COLONIZING BACTERIA
Tri Asmira Damayanti and Trias Katerina
Department of Plant Protection, Faculty of Agriculture,
Bogor Agricultural University, Jl. Kamper, Darmaga Bogor 16680,
E-mail : [email protected]
(Received: January 21, 2008; Accepted: April 17, 2008)
ABSTRACT
Mixed virus infection is a common phenomena in nature. It results in severe disease
symptoms and yield loss. We utilized seven selected root colonizing bacteria (rhizobacteria) isolated
from the hot pepper rhizosphere to improve the effectiveness of virus management. The efficacy of
those rhizobacteria in inducing plant growth and systemic resistance (ISR) on hot pepper against
multiple infection of Tobacco mosaic virus (TMV), and Chili veinal mottle virus (ChiVMV) was
evaluated in greenhouse trials. The rhizobacteria was applied as seed treatment and soil drench.
All bacteria treated plants showed better growth character, milder symptom expressions than control and increased peroxidase enzyme activities and ethylene but these depended on the species. It
affected slightly the accumulation of TMV, however it suppressed the ChiVMV accumulation.
Based on the morphological characters and full length nucleotide sequences analysis of 16S r-RNA,
Bacillus cereus (I-35) and Stenotrophomonas sp (II-10) were the potential isolates as PGPR.
Key words : multiple viral infection, rhizobacteria, Bacillus cereus, Stenotrophomonas sp, ISR
INTRODUCTION
Hot pepper (Capsicum annuum) is one of important vegetables in Indonesia. However, infection by plant pathogens, including plant viruses have become a serious constraint for hot pepper
production. The main viral disease infecting hot-pepper are Chili veinal mottle virus (ChiVMV),
Pepper veinal mottle virus (PVMV), Pepper mottle virus (PeMoV), Pepper severe mosaic virus
(PeSMV) and Cucumber mosaic virus (CMV). In Indonesia ChiVMV, CMV, TMV and recently
Geminivirus are important viruses infecting hot pepper (Duriat, 1996; Sulandari 2004). In nature,
multiple infection by pathogens is a natural phenomena which causes damage more severe than a
single infection by a pathogen.
Management strategies to control plant viruses in Indonesia are limited to the use of resistant
cultivars, culture management and most farmers rely on chemical insecticides to control the insect
vectors. To minimize the use of pesticides, which pollute the environment, and to improve the
effectiveness of virus disease control, the utilization of beneficial root colonizing bacteria isolated from the plant rhizosphere, referred to as Plant Growth Promoting Rhizobacteria (PGPR), might offer
a promising viral disease control. Previously, PGPR reported to be effective in controlling fungi,
bacterial and viruses (Maurhofer et al., 1994; De Meyer et al., 1999; Murphy et al., 2000; Murphy et
al., 2003). Plants develop an enhanced defensive capacity against a broad spectrum of plant
pathogens after colonization of the roots by selected strains of nonpathogenic bio-control bacteria
(Pieterse et al., 2000).

Protection of hot pepper against multiple infection of viruses.....
93
In Indonesia, the availability of hot-pepper resistant cultivars against either pest or diseases are
limited. Hence, this study sought to find and to evaluate the potential of rhizobacteria eliciting plant
growth and induced systemic resistance (ISR) to protect hot pepper against multiple infection of TMV
and ChiVMV.
MATERIALS AND METHODS
Rhizobacteria Isolates
Rhizobacteria were isolated from the healthy rhizosphere of hot pepper cultivar in the field at
Darmaga Bogor, West Java. The bacteria was isolated and cultured on tryptic soya agar (TSA, Difco,
USA). Bacterial isolation was performed as described previously (Lemanceau et al., 1995).
Seven rhizobacteria isolates were used: I-2, I-16, I-25, I-30, I-35, II-7, II-10, and evaluated based on
their ability to enhance plant growth and their ability to protect hot pepper against multiple virus
infection.
Identification of Rhizobacteria
The potential isolate(s) as candidate PGPR was identified by sequencing the 16S r-RNA using
a set of primer specific for prokaryotes 16S ribosomal RNA. The forward primer was 68f
(5’-CAGGCCTAACACATGCAAGTC-3’) and the reverse primer was 1387r
(5’-GGGCGGWGTGTACAAGGC-3’) as previously described (Marchesi et al., 1998). Further
sequencing of the full length of 16S rRNA, additional primers was designed according to the species.
The homology and similarity of the nucleotide sequences were analyzed using WU-Blast2 software
provided by EMBL-EBI (European Molecular Biology Laboratory - European Bio-Informatics
Institute).
Viral Inoculum
TMV was propagated on tobacco plants, while ChiVMV was propagated on hot pepper.
TMV and ChiVMV were obtained from Laboratory of Virology collection, Department of Plant
Protection, Faculty of Agriculture, Bogor Agricultural University. The viral inoculum was tested
serologically before inoculation.
Growth Condition and Rhizobacteria Treatment
The experiments were conducted in greenhouse trials to evaluate the rhizobacterial ability as
PGPR to protect hot pepper against mixed infection of viruses. Rhizobacteria treatment (109 cfu/ml)
and growing conditions were performed as described previously (Damayanti et al., 2007). Plants
were grown in the greenhouse with humidity and temperature depending on the natural conditions.
Six plants were used for each treatment.
Virus Inoculation
Plants per treatment were mechanically inoculated with mixed infected plant sap (1:10 w/v) in
phosphate buffer (pH 7.0) (Merck, Germany) at 2 weeks post transplanting or 4 weeks after planting
(WAP) into pots. The first two leaves on each plant were gently dusted with carborundum, 600 mesh
(Nacalai Tesque, Japan) prior to rub-inoculation with sap containing viruses.
Evaluation of Plant Growth Characters and Disease Assessments
The height of each plant was measured from soil line to shoot apex taken at 1 day prior to

J. ISSAAS Vol. 14, No 1:92-100 (2008)
94
inoculation (dpi) with viruses and at 4 and 8 weeks post-viral inoculation (wpi). The fresh weight of
the above tissues, number of leaves, number of flowers/fruits (taken as single measure) were counted
at 6-8 wpi.
Disease Assessments
Disease severity rating was made at 2 wpi using rating scales developed using mock inoculated
plants of treatment as a standard by using the following rating scales : 0 = no symptoms, 2 = mild
mosaic symptoms on the leaves, 4 = severe mosaic symptoms on the leaves, 6 = mosaic and
deformation of leaves, 8 = severe mosaic and severe deformation of leaves and stunted. Disease
severity was measured for each plant used in the experiment.
ELISA test. Viral protein accumulation was detected by DAS-ELISA (double antibody
sandwich enzyme linked-immunosorbent assay) method at 2 and 4 wpi with TMV, and ChiVMV
antiserum. Samples were taken as composite leaf samples per treatment. The procedure was
carried out according to manufacture’s recommendation (DSMZ, Deutsche Sammlung von
Mikroorganismen und Zellkulturen, Germany). Viral accumulation was quantitatively measured by
using an ELISA reader at 405 nm. The positive sample was considered for the presence of the virus when absorbance value was twice that of healthy control.
Extraction and Quantification of Peroxidase (PO) Enzyme Activities. Peroxidase enzyme
activities for 3 minutes was used as a parameter to determine whether ISR occurred or not.
Extraction and quantification of peroxidase enzyme activities were done using a spectrophotometric
method conducted at 1 wpi according to method described previously (Hammerschmidt et al., 1982;
Damayanti et al., 2007) with minor modification. The reaction mixture was incubated at room
temperature and the absorbance determined using a spectrophotometer at 420 nm with 30 second
intervals for 3 minutes. The enzyme activity was expressed as a change in absorbance (min-1mg-1
protein). PO enzyme activity was measured from composite leaf samples of each bacterial
treatment.
Quantification of Ethylene Production. The quantification of ethylene production was
carried out by gas chromatography (GC) at the Balai Besar Pasca Panen, Cimanggu, Bogor, Indonesia.
Leaves samples (2 g/each treatment) of bacteria-treated and control plants were taken at 5 dpi and
were measured for ethylene production, expressed as µmol/ g leaf. Ethylene production was
measured from composite leaf samples of each bacterial treatment.
Data Analysis
Data was analyzed by analysis of variance (ANOVA) and the treatment means were separated
by Duncan’s Multiple Range Test (DMRT)(α = 0.05) using SAS software version 6.12 (SAS Institute,
Gary, NC, USA).
RESULTS AND DISCUSSION
Evaluation of rhizobacteria treatment on plant growth characters
Plant height measured at 1 day before viral inoculation (4 WAP) was significantly higher on
bacteria treated plants than control. In addition, bacteria treated plants visually exhibited greater
vigor, fitness and leaf size than control plants (data not shown). However, I-16 and I-30-treated
plants at 8 WAP and at 12 WAP, respectively did not show any difference with control plants (Table 1,
Healthy). Similar results were obtained when plants were challenge inoculated by mixed viruses at 4
weeks post inoculation (wpi) (8 WAP) and 8 wpi (12 WAP) (Table 1, Infected). It showed that even
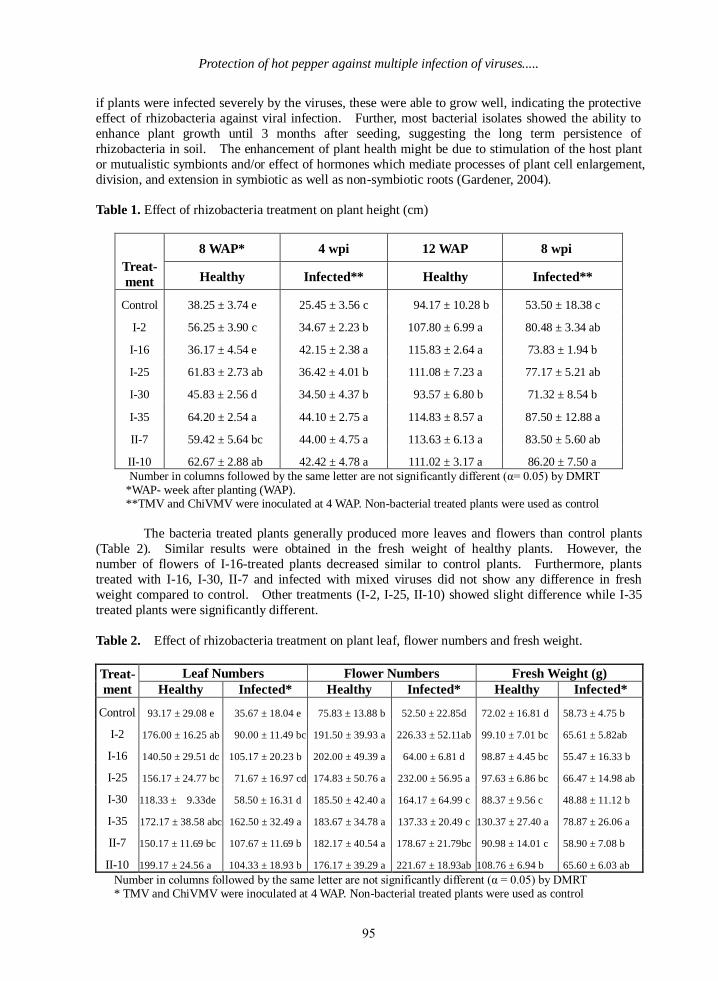
Protection of hot pepper against multiple infection of viruses.....
95
if plants were infected severely by the viruses, these were able to grow well, indicating the protective
effect of rhizobacteria against viral infection. Further, most bacterial isolates showed the ability to
enhance plant growth until 3 months after seeding, suggesting the long term persistence of
rhizobacteria in soil. The enhancement of plant health might be due to stimulation of the host plant
or mutualistic symbionts and/or effect of hormones which mediate processes of plant cell enlargement,
division, and extension in symbiotic as well as non-symbiotic roots (Gardener, 2004).
Table 1. Effect of rhizobacteria treatment on plant height (cm)
Treat-
ment
8 WAP* 4 wpi 12 WAP 8 wpi
Healthy Infected** Healthy Infected**
Control 38.25 ± 3.74 e 25.45 ± 3.56 c 94.17 ± 10.28 b 53.50 ± 18.38 c
I-2 56.25 ± 3.90 c 34.67 ± 2.23 b 107.80 ± 6.99 a 80.48 ± 3.34 ab
I-16 36.17 ± 4.54 e 42.15 ± 2.38 a 115.83 ± 2.64 a 73.83 ± 1.94 b
I-25 61.83 ± 2.73 ab 36.42 ± 4.01 b 111.08 ± 7.23 a 77.17 ± 5.21 ab
I-30 45.83 ± 2.56 d 34.50 ± 4.37 b 93.57 ± 6.80 b 71.32 ± 8.54 b
I-35 64.20 ± 2.54 a 44.10 ± 2.75 a 114.83 ± 8.57 a 87.50 ± 12.88 a
II-7 59.42 ± 5.64 bc 44.00 ± 4.75 a 113.63 ± 6.13 a 83.50 ± 5.60 ab
II-10 62.67 ± 2.88 ab 42.42 ± 4.78 a 111.02 ± 3.17 a 86.20 ± 7.50 a
Number in columns followed by the same letter are not significantly different (α= 0.05) by DMRT *WAP- week after planting (WAP). **TMV and ChiVMV were inoculated at 4 WAP. Non-bacterial treated plants were used as control
The bacteria treated plants generally produced more leaves and flowers than control plants
(Table 2). Similar results were obtained in the fresh weight of healthy plants. However, the
number of flowers of I-16-treated plants decreased similar to control plants. Furthermore, plants
treated with I-16, I-30, II-7 and infected with mixed viruses did not show any difference in fresh
weight compared to control. Other treatments (I-2, I-25, II-10) showed slight difference while I-35
treated plants were significantly different.
Table 2. Effect of rhizobacteria treatment on plant leaf, flower numbers and fresh weight.
Treat-
ment
Leaf Numbers Flower Numbers Fresh Weight (g)
Healthy Infected* Healthy Infected* Healthy Infected*
Control 93.17 ± 29.08 e 35.67 ± 18.04 e 75.83 ± 13.88 b 52.50 ± 22.85d 72.02 ± 16.81 d 58.73 ± 4.75 b
I-2 176.00 ± 16.25 ab 90.00 ± 11.49 bc 191.50 ± 39.93 a 226.33 ± 52.11ab 99.10 ± 7.01 bc 65.61 ± 5.82ab
I-16 140.50 ± 29.51 dc 105.17 ± 20.23 b 202.00 ± 49.39 a 64.00 ± 6.81 d 98.87 ± 4.45 bc 55.47 ± 16.33 b
I-25 156.17 ± 24.77 bc 71.67 ± 16.97 cd 174.83 ± 50.76 a 232.00 ± 56.95 a 97.63 ± 6.86 bc 66.47 ± 14.98 ab
I-30 118.33 ± 9.33de 58.50 ± 16.31 d 185.50 ± 42.40 a 164.17 ± 64.99 c 88.37 ± 9.56 c 48.88 ± 11.12 b
I-35 172.17 ± 38.58 abc 162.50 ± 32.49 a 183.67 ± 34.78 a 137.33 ± 20.49 c 130.37 ± 27.40 a 78.87 ± 26.06 a
II-7 150.17 ± 11.69 bc 107.67 ± 11.69 b 182.17 ± 40.54 a 178.67 ± 21.79bc 90.98 ± 14.01 c 58.90 ± 7.08 b
II-10 199.17 ± 24.56 a 104.33 ± 18.93 b 176.17 ± 39.29 a 221.67 ± 18.93ab 108.76 ± 6.94 b 65.60 ± 6.03 ab
Number in columns followed by the same letter are not significantly different (α = 0.05) by DMRT * TMV and ChiVMV were inoculated at 4 WAP. Non-bacterial treated plants were used as control

J. ISSAAS Vol. 14, No 1:92-100 (2008)
96
Disease Assessments
All bacteria treated plants inoculated with mixed viruses exhibited phenotype symptoms milder
than control plants (Fig. 1). The mildest symptoms were displayed by plants treated with I-16 and
I-35. The protective effect afforded by isolates in suppressing the symptoms varied in severity,
suggesting that the variety of the bacteria species might lead to different effects on plants after the challenge inoculation of viruses. In addition, the effect of I-16 on disease severity was more
prominent than its ability to promote plant growth (Table 1 and Fig. 1).
0,0
1,0
2,0
3,0
4,0
5,0
6,0
C I-2 I-16 I-25 I-30 I-35 II-7 II-10
Treatments
Severi
ty
Fig. 1. Disease severity of control plants (C) and bacterial treated plants.
inoculated by mix viruses
ELISA test. Based on the ELISA absorbance value, the rhizobacteria treatment affected
TMV slightly either at 2 or 4 wpi, while ChiVMV accumulated lower levels of the virus than control
plants (Table 3). This suggests that the bacterial treatment was able to suppress the ChiVMV better
than TMV.
Table 3. ELISA test of control and inoculated plants infected by virus
Treatment
ELISA Absorbance value*
TMV ChiVMV
2 wpi 4 wpi 2 wpi 4 wpi
C** 1.624 1.895 0.326 0.472
I.2 1.889 1.942 0.187 0.386
I.16 2.198 1.765 0.080 0.074
I.25 2.100 1.769 0.221 0.410
I.30 1.810 1.712 0.234 0.360
I.35 2.039 1.751 0.089 0.065
II.7 1.955 1.660 0.195 0.358
II.10 1.925 1.770 0.187 0.341 *Means of ELISA absorbance value obtained from duplex measurement of composite samples per treatment. Positive results of ELISA = twice absorbance of healthy plants
Healthy absorbance value of TMV= 0.095, and that of ChiVMV = 0.031 ** C = control plants inoculated by mixed viruses
The accumulation of TMV was more prominent than that of ChiVMV, indicating the stability
of TMV to compete with other viruses during multiple infection. Alternatively, rhizobacteria
a
c bc
b bc
c
b
bc
c
bc
b
bc
c
b
bc
a

Protection of hot pepper against multiple infection of viruses.....
97
treatment did not decrease the TMV accumulation, but it suppressed the severity. Even the
rhizobacteria treatment slightly affected TMV, however all rhizobacteria treated plants exhibited
milder symptom expression compared with control plants (Fig. 1). The protection afforded to
rhizobacteria treated plants appeared to have been a result of the enhanced growth of hot pepper,
thereby allowing them to respond to inoculation with viruses.
Peroxidase Enzyme Activities. Generally, all rhizobacteria treated plants had increased
PO activity compared with control (healthy), and the PO activities increased to some extent after
challenge inoculated with viruses, except for plants treated with I-25, and II-10 (Fig. 2). This
suggests that some rhizobacteria treatments might induce plant’s systemic resistance through
increasing peroxidase enzyme activity (PO dependent) except for I-25 and II-10. It showed that
some rhizobacteria might able to enhance plant defense response through elevated PO activity (I-2,
I-16, I-30, I-35, II-7) while others might be PO-independent (I-25, I-10) and it might be dependent on
the species. The polyphenol oxidase enzyme and peroxidase oxidizes phenolics to quinones and
generates hydrogen peroxide (H2O2). It well known that H2O2 is an antimicrobial compound, which
releases highly reactive free radicals and further increases the rate of polymerization of phenolic
compounds into lignin-like substances. These substances are then deposited in cell walls and
papillae and interfere with the further growth and development of pathogens (Agrios, 2005; Hammond-Kosack and Jones, 1996). Certain PGPR do not induce pathogenesis related (PR)
proteins but rather increase accumulation of peroxidase, phenylalanine ammonia lyase, phytoalexins,
polyphenol oxidase, and/or chalcone synthase (reviewed by Compant et al., 2005). These
experiments also showed that some isolates, except I-25 and II-10, were able to induce peroxidase
after challenge with virus infection.
0,01,02,03,04,05,06,07,08,09,0
10,0
C I-2 I-16 I-25 I-30 I-35 II-7 II-10
Treatments
PO
ac
tiv
ity
(U
/mg
/min
)
Healthy
Infected
Fig. 2. Peroxidase enzyme activity of healthy and virus infected plants
Ethylene Production. Overall, rhizobacteria treatment did not show increased ethylene
production (healthy) (Fig. 3). However, the ethylene production increased when plants were
challenge inoculated with viruses, except for I-2 and I-30 treated plants. In this case, induction of
ISR either through increased ethylene production or the ACC (1-aminocyclopropane-1carboxylate)
converting capacity to ethylene is still unclear and needs further investigation. However,
rhizobacteria treatments (I-16, I-25 I-35, II-7, II-10) and challenge inoculation with viruses increased
ethylene production compared with healthy plants. A greater production of ethylene in the initial
phase of infection might contribute to enhanced resistance against pathogens. In other words,

J. ISSAAS Vol. 14, No 1:92-100 (2008)
98
ethylene might act as the primary signal in enhancing the defense capacity or may activate some
defense genes. However, even plants treated with I-2 and I-30 did not increase ethylene production,
but treated plants showed milder disease severity than control.
Improvement in plant health and productivity by PGPR are mediated by three different
ecological mechanisms; (1) antagonism of pests and pathogens, (2) promotion of host nutrition and growth and (3) stimulation of plant host defenses (Gardener, 2004).
The majority of plant growth promoting bacteria that activate ISR appear to do so via an
SA-independent pathway involving jasmonate and ethylene signals (reviewed in Compant et al.,
2005). It seemed that ISR afforded by isolates might increase the jasmonic acid (JA) production and
leads to increased sensitivities to ethylene similar to the case of PGPR WCS417r in Arabidopsis
(Knoester et al., 1999). ISR is associated with an increase in sensitivity to JA and ethylene rather
than an increase in their production, which might lead to the activation of a partial set of defense
genes (Hase et al., 2003; Pieterse and van Loon, 1999). Unfortunately, in these experiments, JA
production was not measured for further elucidation of the role of JA in ISR on hot pepper plants.
0,00
0,05
0,10
0,15
0,20
0,25
0,30
0,35
C I-2 I-16 I-25 I-30 I-35 II-7 II-10
Treatments
Eth
yle
ne
Pro
du
cti
on
(u
mo
l/g)
Healthy
Infected
Fig. 3. Ethylene production of healthy and virus infected plants
Identification of Rhizobacteria Species
Isolates I-35 and II-10 have the potential as PGPR as these are able to protect hot pepper plants against multiple virus infection. Previously, I-35 identified as Bacillus cereus (DDBJ
Accession No.AB288105) was reported to enhance growth and protect hot pepper plants against TMV
infection (Damayanti et al., 2007). In most cases, Bacillus spp that elicit ISR typically promote plant
growth. B. cereus has been previously reported to have activities that suppress pests and pathogens
or promote plant growth (reviewed in Kloepper et al., 2004). These results also support the previous
reports on B. cereus (I-35) that consistently exhibited its ability as PGPR and/or enhanced plant
systemic resistance event in plants infected by mixed viruses.
Rhizobacteria species were identified by testing the morphological characters of the bacteria
(gram type, colony form, cell type) and nucleotide sequences of 16S r-RNA. The II-10 isolate is a

Protection of hot pepper against multiple infection of viruses.....
99
gram-negative, whitish colony on TSA, and rod shaped. Based on these characters and 16S r-RNA
sequences, the isolate II-10 was identified as Stenotrophomonas sp (DDBJ Accession No. AB288107).
Few Stenotrophomonas genera have been reported as PGPR. However, Stenotrophomonas
maltophilia was the most frequent species recovered from weeds rhizosphere in Canada and is
reportedly able to promote potato growth (Sturz et al., 2001). Our results here extend the role of
Stenotrophomonas genera as PGPR. These results might be the first evidence of Stenotrophomonas sp as inducer of plant systemic resistance against plant viruses in hot pepper.
CONCLUSION
Based on the evaluation of plant growth characters and disease assessments, the potential
candidates of root colonizing bacteria as PGPR which could protect hot pepper against multiple
infection of viruses are Bacillus cereus (I-35) and Stenotrophomonas sp (II-10).
ACKNOWLEDGEMENT
This research was financially supported by the Indonesian Toray for Science Foundation (ITSF-2005) in 2006. This was also partially financed by Competition Grant Program B 2006,
Department of Plant Protection, Bogor Agricultural University for the author to conduct a part of the
work in Japan through the International Linkage Program. I gratefully acknowledge the technical
assistance provided by Tetsuro Okuno and Kazuyuki Mise and the DNA sequencing facilities at the
Laboratory of Plant Pathology, Graduate School of Agriculture, Kyoto University. I am also grateful
to Nisa Rachmania Mubarik, Hendra Pardede and Edi Supardi for excellent work support.
REFERENCES Agrios, G.N. 2005. Plant Pathology. Fifth Edition. Academic Press, New York.
Compant, S., B. Duffy, J. Nowak, C. Clement, and E.A. Barka. 2005. Use of plant growth-promoting
bacteria for biocontrol of plant diseases; principles, mechanisms of action, and future prospects.
App. Environ. Microbiol. 71:4951-4959.
Damayanti, T.A., H. Pardede, and N.R. Mubarik. 2007. Utilization of root-colonizing bacteria to
protect hot-pepper against Tobacco Mosaic Tobamovirus. HAYATI J. Biosci. 14: 105-109.
De Meyer, G.., K. Audenaert, and M. Hofte.1999. Pseudomonas aeruginosa 7NSK2-induced systemic
resistance in tobacco depends on in plant salicylic acid but is not associated with PR1a
expression. Eur. J. Plant Pathol. 105: 513-517.
Duriat, A.S. 1996. Management of pepper viruses in Indonesia: Problem and Progrees. IARD J.
18(3): 45-50.
Gardener, B.B.M. 2004. Ecology of Bacillus and Paenibacillus spp. in agricultural systems.
Phytopathology 94: 1252-1258.
Hammerschmidt, R., E.M. Nuckles, and J. Kuc. 1982. Association of enhanced peroxidase activity
with induced systemic resistance of cucumber to Colletotrichum lagenarium. Physiol. Pl.
Pathol. 20: 73-82.

J. ISSAAS Vol. 14, No 1:92-100 (2008)
100
Hammond-Kosack, K.E, and J.D.G. Jones. 1996. Resistance gene-dependent plant defense responses.
Plant Cell 8: 1773-1791.
Hase, S., J.A. Van Pelt, L.C Van Loon, and C.M.J. Pieterse. 2003. Colonization of Arabidopsis roots
by Pseudomonas fluorescens primes the plant to produce higher levels of ethylene upon
pathogen infection. Physiol. Mol. Plant Pathol. 62: 219-226.
Knoester, M., C.M.J. Pieterse, J.F. Bol, and L.C. Van Loon. 1999. Systemic resistance in Arabidopsis
induced by rhizobacteria requires ethylene-dependent signaling at the site of application. Mol.
Plant Microbe Interact 12: 720-727.
Kloepper, J.W., C.M. Ryu, and S. Zhang. 2004. Induced systemic resistance and promotion of plant
growth by Bacillus spp. Phytopathology 94: 1259-1266.
Lemanceu, P., T. Corberand, L. Gardan, X. Latour, G. Laguerre, J.M. Boeufgras, and C. Alabouvette.
1995. Effect of two plant species, flax (Linum usitatissinum L.) and tomato (Lycopersicon
esculentum Mill.), on the diversity of soil-borne populations of fluorescent Pseudomonads.
Appl. Environ. Microbiol. 61: 1004-1012.
Marchesi, M.T., T. Sato, A.J. Weightman, T.A. Martin, J.C. Fry, S.J. Hiom, and G.R. Wade. 1998.
Design and evaluation of useful bacterium-specific PCR primers that amplify genes coding for
bacterial 16S-rRNA. Appl. Environ. Microbiol. 64: 795-799.
Maurhofer, M., C. Hase, P. Meuwly, J.P. Metraux and G. Defago. 1994. Induction of systemic
resistance of tobacco necrosis virus by the root-colonizing Pseudomonas fluorescens strain
CHA0: Influence of the gacA gene and of pyoverdine production. Phytopathology 84:
139-146.
Murphy, J.F., G..W. Zehnder, D. J. Schuster, E. J. Sikora, J. E. Polston and J. W. Kloepper. 2000. Plant growth-promoting rhizobacteria mediated protection in tomato against Tomato mottle virus.
Plant Dis. 84: 779-784.
Murphy, J.F., M.S. Reddy, C.M. Ryu, J.W. Kloepper, and R. Li. 2003. Rhizobacteria-mediated growth
promotion of tomato leads to protection against Cucumber mosaic virus. Phytopathology 93:
1301-1307.
Pieterse, C.M.J., and L.C. Van Loon. 1999. Salicylic acid-independent plant defense pathways.
Trends Plant Sci. 4: 52-58.
Pieterse, C.M.J., J. Van Pelt, J. Ton, S. Parchmann, M.J. Muller, A.J. Buchala, J.P. Metraux, and L.C.
Van Loon. 2000. Rhizobacteria-mediated induced systemic resistance (ISR) in Arabidopsis required sensitivity to jasmonate and ethylene but is not accompanied by an increase their
production. Physiological and Molecular Plant Pathology 57:123-134.
Sturz, A.V., B.G. Matheson, W. Arsenault, J. Kimpinski, and B.R. Christie. 2001. Weeds as a source of
plant growth promoting rhizobacteria in agricultural soil. Can. J. Microbiol. 47:1013-1024.
Sulandari, S. 2004. Biological characterization, serological assay and DNA finger printing analysis of
pepper yellow leaf curl virus. Dissertation. Department of Plant Protection, Bogor
Agricultural University.

J. ISSAAS Vol. 14, No 1:101-110 (2008)
101
TOXICITY OF CYMBOPOGON CITRATUS STAPF. (POACEAE) AGAINST THE
DIAMONDBACK MOTH, PLUTELLA XYLOSTELLA L. (LEPIDOPTERA:
YPONOMEUTIDAE) LARVAE
Dadang
1 and Kanju Ohsawa
2
1 Department of Plant Protection, Faculty of Agriculture, Bogor University of Agriculture
2 Department of Bio-Science, Faculty of Applied Bio-Science, Tokyo University of Agriculture
(Received: January 10, 2008; Accepted: May 26, 2008)
ABSTRACT
Cymbopogon citratus Stapf. has been reported to possess antifungal, nematocidal, acaricidal,
and insecticidal activities. Active compounds that possess insecticidal activity to the diamondback
moth, Plutella xylostella L. (Lepidoptera: Yponomeutidae) larvae have not yet been identified.
Therefore, this study was conducted to evaluate the efficacy of the extract of C. citratus aerial parts
and to elucidate the structure of the active compound causing larval mortality to P. xylostella.
Bioassay-guided fractionation led to the isolation of the active compound as an essential oil,
3,7-dimethyl-2,6,-octadienal or citral. The LD50 value of this compound was 7.7 µg/insect by
topical application.
Key words: active compound, botanical insecticide, citral, insecticidal activity
INTRODUCTION
Plant essential oils have been used as material ingredients of many commercial products
such as perfumes, analgesic ointments, liniments and food additives. Moreover, they are also
known to possess several biological activities to insects such as repellent, ovicidal, larvicidal,
antifeedant, and mortality activity. The essential oils of Litsea elliptica (Lauraceae) and Piper
aduncum L. (Piperaceae) are highly toxic to mosquito larvae, Aedes aegypti (Diptera: Culicidae).
Benzyl benzoate present in oils of Cinnamon spp. (Lauraceae) is highly toxic to brine shrimp.
Moreover, oils of L. elliptica, Cymbopogon nardus Rendle (Poaceae) and C. mollissimum showed
high repellency against female adult A. aegypti (Ibrahim et al., 1996). Citronella and peppermint
inhibit hatchability of Earias vittella (F.) (Lepidoptera: Noctuidae) eggs which results in 50%
hatchabiity, when eggs are exposed to the volatile oil (Marimuth et al., 1997). C. proximus
significantly inhibits feeding activity of Spodoptera littoralis Boisduval (Lepidoptera: Noctuidae) at
a concentration range of 0.25 - 1.0% (Swidan, 1994).
The herb, lemon grass C. citratus Stapf., have leaves of about 1 m. This plant is noted
as a source of oleum citronella (Anonymous, 1986); however, C. citratus actually yields several
essential oils such as linalool (1.1%), neral (25-28%), geral (45-55%), myrcene (8.2-19.2%),
geraniol (0.5-0.6%), and citranellol (0.1%), among others. (Weiss, 1997). It is reported to possess
antifungal activity against Alternaria tenuis, Botrytis allii, Diplodia maydis, Fusarium oxysporum,
Gibberella fujikuroi, Ustilago avenae and Cladosporium fulvum, nematocidal activity to
Meloidogyne incognita, acaricidal activity to Tetranychus cinnabarinus, and insecticidal activity to
Aedes aegypti, Aphis gossypii and Musca domestica (Grainge and Ahmed, 1988). Therefore, it is

Toxicity of Cymbopogon citratus Stapf. (Poaceae) against the Diamondback Moth.....
102
important to assay this plant against other economic insect pests in order to develop a botanical
insecticide.
MATERIALS AND METHODS
Plant material
The whole plant (mainly stems) of C. citratus were obtained from a local market in
Bogor, Indonesia. These were air-dried at room temperature for 1-2 weeks before extraction.
Insect
Larvae of the diamondback moth, Plutella xylostella (L.) (Lepidoptera: Yponomeutidae),
were obtained from a mass culture. Larvae fed on 6-10 days old radish (Raphanus sativus L.)
seedlings were kept at 25±1°C under long day 12:12 (L:D) photoperiod regimen in an insect room.
Adults, reared in a different cage and fed on 10% honey solution (aqueous), were allowed to mate
and oviposit on 6-8 days old radish seedlings. Third instar larvae were used for bioassay.
Extraction
From 5 kg of fresh sample, 395.6 g of air-dried C. citratus was collected, cut into small
pieces and ground using a mill to make a powder. The powder was poured into a thimble filter (40
mm x 159 mm) and extracted with ether by Soxhlet for 48 hours to obtain 21.0 g of a solid crude
extract. The crude extract (20.9 g) was separated into basic, acidic and neutral fractions through a
series of solvent-solvent partitioning. The crude extract was dissolved in 300 ml ether and
partitioned with 150 ml sodium hydroxide (NaOH), 5% three times. The resulting NaOH fraction
(Na-1) and ether fraction (Et-1) were further fractionated.
Aqueous sulfuric acid, 20% was added to the NaOH fraction (Na-1) to attain a pH of 1-2.
This was partitioned with ether, 100 ml three times, to get an ether fraction (300 ml, Et-2) and a
NaOH fraction (450 ml, Na-2) which was discarded. Meanwhile, the ether fraction (Et-2) was
dried with Na2SO4 anhydrous (5-8 g) overnight and evaporated under reduced pressure to get an
acidic fraction (1.8 g). The ether fraction (Et-1) was partitioned with 5% H2SO4 (aqueous), 100 ml
three times, to get an ether fraction (Et-3) and H2SO4 fraction (300 ml), which was further
partitioned with ether. Both fractions were dried with anhydrous Na2SO4 overnight. The solvent
was evaporated under reduced pressure to get 13.8 g of a neutral fraction (from Et-3 fraction) and
0.8 g of a basic fraction (from H2SO4 fraction).
The neutral fraction (13.5g) was separated by silica gel column chromatography
(Wakogel C-300, glass column: 45 x 3.5 cm i. d.) with n-hexane and chloroform as mobile phase.
The concentration of chloroform in n-hexane increased 5% for each 600 ml added. Each fraction
was tested by thin layer chromatography (TLC) (Keiselgel 60 F254, 0.25 mm in thickness, 20 cm x 20
cm) with n-hexane and chloroform as development solvents in a glass chamber (25 cm x10 cm x 22
cm). The TLC plates were sprayed with 5% H2SO4 (in ethanol) and heated in an oven at 120°C for
2-3 minutes, before viewing under a UV lamp at 254 and 365 nm. The fractions with the same Rf
values, represented by spots on TLC, were pooled (Fig. 1).
The active fraction (0.8 g) was further separated by silica gel column chromatography
(Wakogel C-300, glass column 35x3 cm i.d) with n-hexane and chloroform as eluents with
increasing the concentration of chloroform. Resulting active fraction (0.5 g) was further separated by
high performance liquid chromatography (Shimadzu LC-8A, column: Nucleosil 50-5, Chemopack

J. ISSAAS Vol. 14, No 1:101-110 (2008)
103
7.5x300 cm, solvent system: n-hexane and chloroform (3:1/v:v), flow rate: 2 ml/minute, recorder:
C-R4A chromatopac under UV spectrophotometric detector (SPD-6A) at 254 nm). Main peaks
were collected by a fraction collector (Shimadzu FCV-100B) connected to the HPLC. Collecting
each fraction was based on retention time of peaks. Weight of each fraction was assessed based on
the peak area compared to all peak areas recorded by C-R4A chromatopac.
Cymbopogon citratus
(395.6 g)
Ether
Soxhlet for 48 hours
Crude extract
(21.0 g)
Acidic fr. Neutral fr. Basic fr.
(1.8 g) (13.8 g) (0.8 g)
silica gel column chromatography
chloroform in n-hexane
F-1 F-2 F-3 F-4 F-5
(0.8 g) (1.0 g) (2.8 g) (3.5 g) (1.1 g)
silica gel column chromatography
chloroform in n-hexane
F-1-1 F-1-2 F-1-3 F-1-4
(20 mg) (500 mg) (100 mg) (60 mg)
HPLC
chloroform and n-hexane
F-1-2-1 F-1-2-2 F-1-2-3 F-1-2-4 F-1-2-5
70 mg 20 mg 35 mg 65 mg 65 mg
GC-MS
Active compound
Fig. 1. Isolation scheme for the insecticidal compound from Cymbopogon citratus
Analytical instruments

Toxicity of Cymbopogon citratus Stapf. (Poaceae) against the Diamondback Moth.....
104
The NMR spectra were recorded on a Jeol α-400 JNM spectrometer in CDCl3 with TMS
as an internal standard. Chemical shifts recorded were relative to residual CDCl3 at 77.0 ppm for 13
C and TMS at 0.0 ppm for 1
H. 13
C and 1H spectra were run at 100 and 400 MHz, respectively.
Gas chromatography-mass spectrum (GC-MS) was measured by a Shimadzu QP-5000 spectrometer
(capillary column DB-1, 0.25 mm i.d. x 30 m, initial GC temperature: 40 OC for 5 minutes,
temperature gradient 40-200OC with 5 OC /minute increment, He gas as carrier at flow rate of 5
ml/minute).
Bioassay
An appropriate amount of sample was dissolved in acetone to get the desired
concentration and this was diluted serially to get lower concentrations. The test solution was
applied onto the dorso-thorax of ten larvae (1µl/insect) in a Petri dish, by topical application method
using a microsyringe applicator. Insects treated with acetone only served as control. After
application, a fresh cabbage leaf (2 cm x 2 cm) was placed into the Petri dish (9 cm in diameter)
lined with a distilled water-moistened filter paper (Advantec no.2). Each treatment was replicated
3 times. Insects that did not move when prodded with a fine brush were considered dead. Percent
mortality was assessed at 24, 48 and 72 hours after treatment. LD50 values were determined by
using probit analysis.
RESULTS AND DISCUSSION
Identification of active compound
Fractionation conducted by HPLC resulted in several fractions. Eight main fractions
were collected with retention times and fraction weights as follows: 5.18, 7.47, 8.51, 10.12, 12.09,
12.63, 15.95, 17.76 minutes and 70, 20, 35, 65, 65, 36, 40, and 60 mg, respectively (Fig. 2). The
fraction with retention time of 8.51 minutes produced mortality activity; while others produced no
mortality activity.

J. ISSAAS Vol. 14, No 1:101-110 (2008)
105
Fig. 2. HPLC chromatogram of active fraction of C. citratus
The analysis of the isolated fraction from HPLC by gas chromatography resulted in two
peaks with retention times of 25.10 and 26.09 minutes (Fig. 3). Nevertheless, when the mass
spectral data of these two peaks were analyzed and mass fragmentation patterns compared, these
showed similar fragmentation patterns, at m/z 41, 69, 109, and 152. Fragmentation at m/z 152 was
considered as the parent ion [M+], so it is suggested that the compounds were isomers with each
other (Fig. 4).
Fig. 3. Gas chromatogram of isolated fraction of C. citratus

Toxicity of Cymbopogon citratus Stapf. (Poaceae) against the Diamondback Moth.....
106
Fig. 4. Mass spectrum of isolated compound from C. citratus
The C. citratus essential oils contain citral which is racemic, having cis and trans forms
(Formacek and Kubecka, 1982). Identification was also supported by 13C-NMR spectrum as shown
in Fig. 5. The presence of peaks at 190.8 and 190.3 indicate the presence of aldehyde (CHO)
moieties for both neral and geranial compounds (isomer compounds). In addition, peaks found
within the range of 122.02-163.45 indicated the presence of double bonds. Meanwhile, the
remaining peaks found between 17.20-40.29 ppm indicated methyl moieties.
The position of each carbon atom and mass fragmentation are shown in Fig. 5 and Fig. 6,
respectively. The active compound isolated from C. citratus was identified as citral,
3,7-dimethyl(-2,6-octadienal), a monoterpenoid compound.
Fig. 5. 13C-NMR spectrum and position of carbons in chemical structure
of isolated compounds from Cymbopogon citraus

J. ISSAAS Vol. 14, No 1:101-110 (2008)
107
CHO
m/z 152 m/z 123 m/z 69 m/z 41
+
++
C4H6CHOC3H6
C2H2
Fig. 6. Mass fragmentations of isolated compound from C. citratus
Larval toxicity
The extraction of 395.6 g fresh C. citratus aerial parts resulted in 21.0 g of crude extract
(5.3%). The dark blue extract caused mortality activity to P. xylostella larvae, so fractionation and
isolation of the active compound was pursued. Fractionation of the crude extract resulted in acidic,
basic and neutral fractions. Bioassay of the fractions showed that the neutral fraction was toxic to P.
xylostella larvae causing 92% larval mortality at 150 µg/insect within 72 hours of exposure; while
acidic and basic fractions at 20 and 8 µg/insect did not cause larval mortality (Fig. 7).
The neutral fraction was separated by column chromatography with n-hexane and
chloroform as mobile phases. Five fractions were obtained; F-1 eluted with 0-15%, F-2 with
15-25%, F-3 with 30-45, F-4 with 45-70, and F-5 with 70-100%. Bioassay based on equivalent
doses at 10, 10, 30, 40, and 15 µg/insect for F-1, F-2, F-3, F-4, and F-5, respectively, all fractions
gave no larval mortality activity. Nevertheless, bioassay of all fractions at 50µg/insect resulted in
one fraction (F-1) which showed mortality activity. This fraction produced 100% larval mortality
within 72 hours exposure; while other fractions did not produce larval mortality activity (Fig. 8).
Neu
tral
basic
acid
ic
24
48
72
0
20
40
60
80
100
Mo
rta
lity
(%
)
Fractions
Time (hrs)
Fig. 7. Larval mortality produced by acidic, basic and neutral fractions of C. citratus
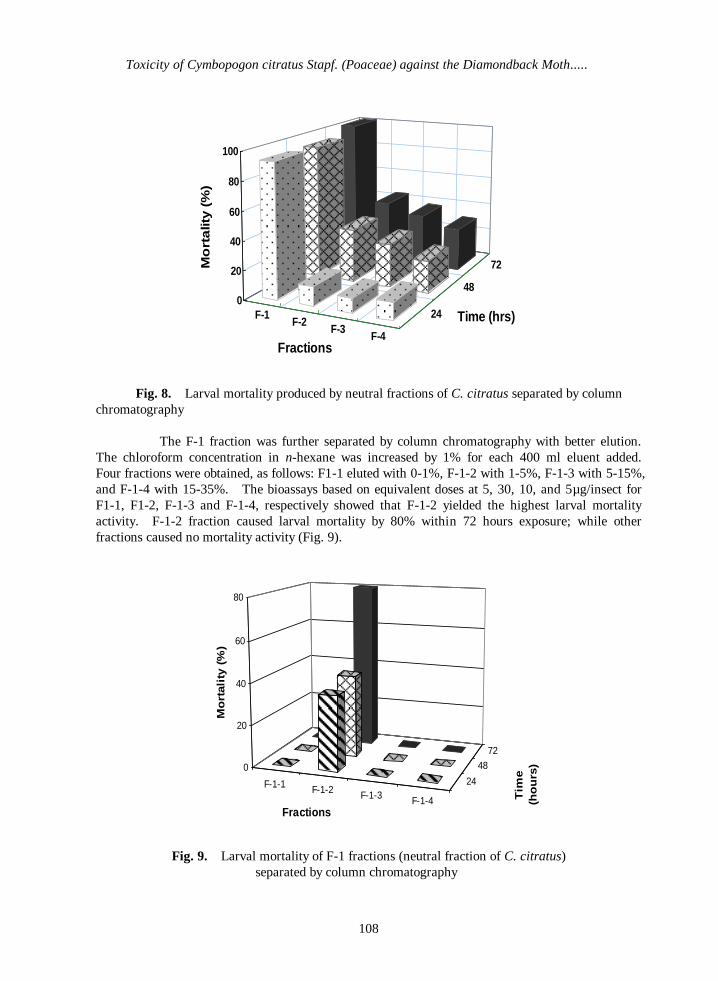
Toxicity of Cymbopogon citratus Stapf. (Poaceae) against the Diamondback Moth.....
108
F-1F-2
F-3F-4
24
48
72
0
20
40
60
80
100
Mo
rta
lity
(%
)
Fractions
Time (hrs)
Fig. 8. Larval mortality produced by neutral fractions of C. citratus separated by column
chromatography
The F-1 fraction was further separated by column chromatography with better elution.
The chloroform concentration in n-hexane was increased by 1% for each 400 ml eluent added.
Four fractions were obtained, as follows: F1-1 eluted with 0-1%, F-1-2 with 1-5%, F-1-3 with 5-15%,
and F-1-4 with 15-35%. The bioassays based on equivalent doses at 5, 30, 10, and 5µg/insect for
F1-1, F1-2, F-1-3 and F-1-4, respectively showed that F-1-2 yielded the highest larval mortality
activity. F-1-2 fraction caused larval mortality by 80% within 72 hours exposure; while other
fractions caused no mortality activity (Fig. 9).
F-1-1 F-1-2 F-1-3 F-1-4
2448
720
20
40
60
80
Mo
rtali
ty (
%)
Fractions
Tim
e
(ho
urs
)
Fig. 9. Larval mortality of F-1 fractions (neutral fraction of C. citratus)
separated by column chromatography
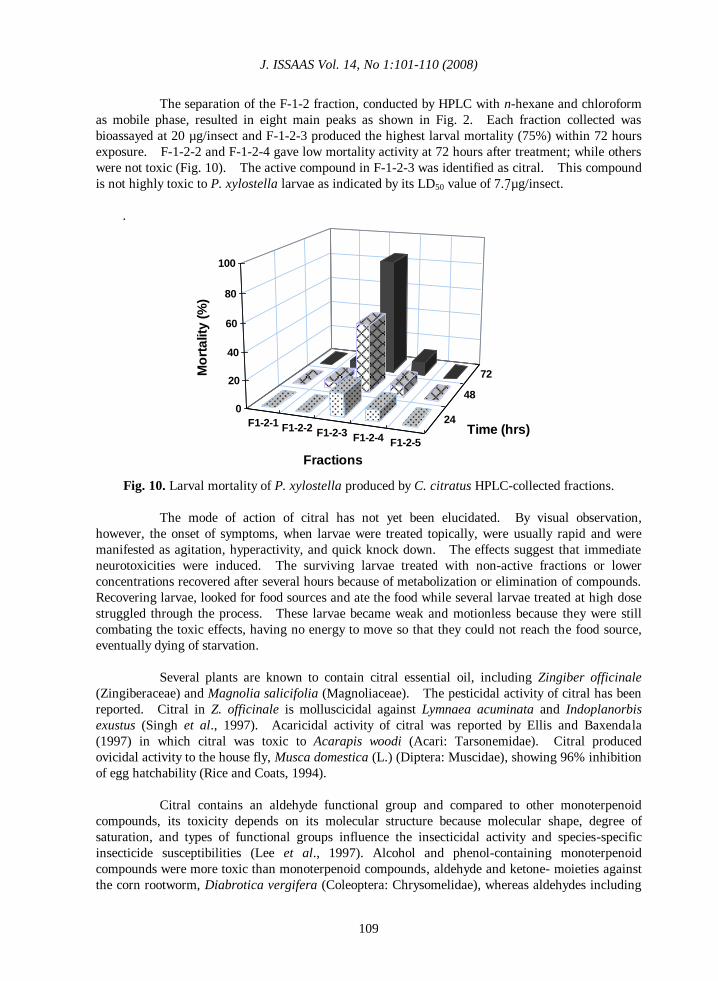
J. ISSAAS Vol. 14, No 1:101-110 (2008)
109
The separation of the F-1-2 fraction, conducted by HPLC with n-hexane and chloroform
as mobile phase, resulted in eight main peaks as shown in Fig. 2. Each fraction collected was
bioassayed at 20 µg/insect and F-1-2-3 produced the highest larval mortality (75%) within 72 hours
exposure. F-1-2-2 and F-1-2-4 gave low mortality activity at 72 hours after treatment; while others
were not toxic (Fig. 10). The active compound in F-1-2-3 was identified as citral. This compound
is not highly toxic to P. xylostella larvae as indicated by its LD50 value of 7.7µg/insect.
.
F1-2-1 F1-2-2 F1-2-3 F1-2-4 F1-2-5
24
48
72
0
20
40
60
80
100
Mo
rta
lity
(%
)
Fractions
Time (hrs)
Fig. 10. Larval mortality of P. xylostella produced by C. citratus HPLC-collected fractions.
The mode of action of citral has not yet been elucidated. By visual observation,
however, the onset of symptoms, when larvae were treated topically, were usually rapid and were
manifested as agitation, hyperactivity, and quick knock down. The effects suggest that immediate
neurotoxicities were induced. The surviving larvae treated with non-active fractions or lower
concentrations recovered after several hours because of metabolization or elimination of compounds.
Recovering larvae, looked for food sources and ate the food while several larvae treated at high dose
struggled through the process. These larvae became weak and motionless because they were still
combating the toxic effects, having no energy to move so that they could not reach the food source,
eventually dying of starvation.
Several plants are known to contain citral essential oil, including Zingiber officinale
(Zingiberaceae) and Magnolia salicifolia (Magnoliaceae). The pesticidal activity of citral has been
reported. Citral in Z. officinale is molluscicidal against Lymnaea acuminata and Indoplanorbis
exustus (Singh et al., 1997). Acaricidal activity of citral was reported by Ellis and Baxendala
(1997) in which citral was toxic to Acarapis woodi (Acari: Tarsonemidae). Citral produced
ovicidal activity to the house fly, Musca domestica (L.) (Diptera: Muscidae), showing 96% inhibition
of egg hatchability (Rice and Coats, 1994).
Citral contains an aldehyde functional group and compared to other monoterpenoid
compounds, its toxicity depends on its molecular structure because molecular shape, degree of
saturation, and types of functional groups influence the insecticidal activity and species-specific
insecticide susceptibilities (Lee et al., 1997). Alcohol and phenol-containing monoterpenoid
compounds were more toxic than monoterpenoid compounds, aldehyde and ketone- moieties against
the corn rootworm, Diabrotica vergifera (Coleoptera: Chrysomelidae), whereas aldehydes including

Toxicity of Cymbopogon citratus Stapf. (Poaceae) against the Diamondback Moth.....
110
citral were more toxic than alcohol-containing monoterpenoids by topical and fumigant action
against M. domestica.
Monoterpenoid compounds are typically rather lipophilic compounds and may interfere
with basic metabolic biochemical, physiological and behavioral functions of insects (Brattsten, 1983).
Therefore, these chemicals are potentially useful as natural sources for the development of novel
insecticides because of their low mammalian toxicity. Certain monoterpenoids are recognized as
safe for humans by the Food and Drug Administration of USA and are used commercially as
artificial flavorings and perfumes (Coats, 1994).
CONCLUSION
Cymbopogon citratus is toxic to Plutella xylostella larvae. The essential oil, citral,
3,7-dimethyl-2,6,-octadienal, was isolated and was responsible for the mortality activity. The LD50
value of this compound was 7.7 µg/insect, by topical application.
REFERENCES
Brattsten, L.B. 1983. Cytochrome P-450 involvement in interactions between plant terpenes and
insect herbivores. In: P.A. Hedin (ed.) Plant Resistance to Insects. ACS Washington DC. P.
173-195.
Coats, J. R. 1994. Risks from natural versus synthetic insecticides. Annual Review of Entomology.
39: 489-515.
Ellis, M.D. and F. P. Baxendale. 1997. Toxicity of seven monoterpenoids to tracheal termite (Acari:
Tarsonemidae) and their honey bee (Hymenoptera: Apidae) hosts when applied as fumigants.
J. Economic Entomology. 90(5): 1087-1091.
Grainge, M. and S. Ahmed. 1988. Handbook of Plants with Pest-Control Properties. John Wiley and
Sons. New York. 469 p.
Ibrahim, J., A.A. Said, A.A. Rashih, M.A.N. Azah, M.Z. Zaridah, A.A. Kadir, and N. Hussein.
1996. Essential oils of selected Malaysian plants and their potential uses. Proceeding of the
3rd Conference of Forestry and Forest Products Research. Kepong. 1: 97-103.
Lee, S.K., T. Rong, C. Peterson, J.R. Coats, S. K. Lee, and R. Tsao. 1997. Insecticidal activity of
monoterpenoids to western corn rootworm (Coleoptera: Chrysomelidae), two spotted spider
mite (Acari: Tetranychidae) and house fly (Diptera: Muscidae). J. Economic Entomology.
90(4): 883-892.
Marimuts, S., G. Gurusubramanian, and S.S. Krishna. 1997. Effects of exposure of eggs to vapours
from essential oils on egg mortality, development and adult emergence in Earias vittela (F.)
(Lepidoptera: Noctuidae). Biological Agriculture and Horticulture. 14(4): 303-307.
Rice, P.J. and J.R. Coats. 1994. Insecticidal properties of several monoterpenoids to the house fly
(Diptera: Muscidae), red flour beetle (Coleoptera: Tenebrionidae), and the southern corn
rootworm (Coleoptera: Chrysomelidae). J. Economic Entomology. 87(5): 1172-1179.

J. ISSAAS Vol. 14, No 1:101-110 (2008)
111
Singh, S., V. K. Singh, and D. K. Singh. 1997. Molluscicidal activity of some common spice
plants. Biological Agriculture and Horticulture. 14(3): 237-249.
Swidan, M.H. 1994. Antifeedant activity of 24 plant extracts against larvae of Spodoptera
littoralis Boisduval (Lepidoptera: Noctuidae). J. Agricultural Research. 39(3): 363-374.
Weiss, E.A. 1997. Essential Oil Crops. CAB International. 600p.

The International Society for Southeast Asian Agricultural Sciences