Embed Size (px)
Citation preview

AN IN-DEPTH LOOK AT CORPORATE TURNAROUNDS FROM THE LENS OF
ORGANIZATIONAL LEARNING
By
Vivek Kalwani
Richard Ivey School of Business
The University of Western Ontario
London, Ontario
March 2012

| 2
Table of Contents
Executive Summary ....................................................................................................................................... 3
1. Introduction .............................................................................................................................................. 5
2. Literature Review ...................................................................................................................................... 6
3. Research – questions & hypothesis ........................................................................................................ 13
4. Research – design ................................................................................................................................... 15
5. Methodology ........................................................................................................................................... 18
6. Results ..................................................................................................................................................... 22
7. Implications ............................................................................................................................................. 29
8. Conclusions – a call to action .................................................................................................................. 34
9. Appendices .............................................................................................................................................. 37
10. References ............................................................................................................................................ 39

| 3
Executive Summary
A study by Bibeault (1982) found that out of 1,094 listed companies (on the NYSE, ASE, and NASDAQ)
that experienced sustained losses in net income only 33% successfully turned around their situation. The
low success rate underscores the need to better understand the ‘corporate turnaround’ phenomenon.
By exploring the existing literature, three distinct categories of studies emerged within the topic of
turnaround management – context, content, and process.
This paper focuses on adding value to existing research within the ‘process’ category by assessing
turnaround performance against two types of actions that companies take:
• Single-loop learning – actions that are limited to detection and correction of organizational error
• Double-loop learning – actions that enable organizations to detect and correct errors in ways
that involve the modification of underlying norms, policies, and objectives
First, this paper hypothesizes that implementing double-loop learning action(s) are necessary to restore
long-term performance for a public company in need of a corporate turnaround. By using a quantitative
approach, the likelihood of turnaround success is compared between companies that do and do not use
double-loop learning. Second, the most frequent learning techniques – single and double loop – are
studied for companies that sustain or improve three to four years post-announcement of a turnaround
effort. An assessment of how frequently each action is used provides insight to what strategy and
actions a firm might consider taking during the process. Third, the correlation between individual
double-loop actions and long-term performance is studied. A regression model is constructed to provide
insight to how actions can be prioritized based on their financial impact.
The findings are based on a sample of 74 publicly listed companies (or previously listed) on the NYSE,
NASDAQ, TSX from the years 1992 to 2007. First, public companies that use double-loop learning
techniques appear more likely to turnaround successfully, however statistically there is not enough
| 4
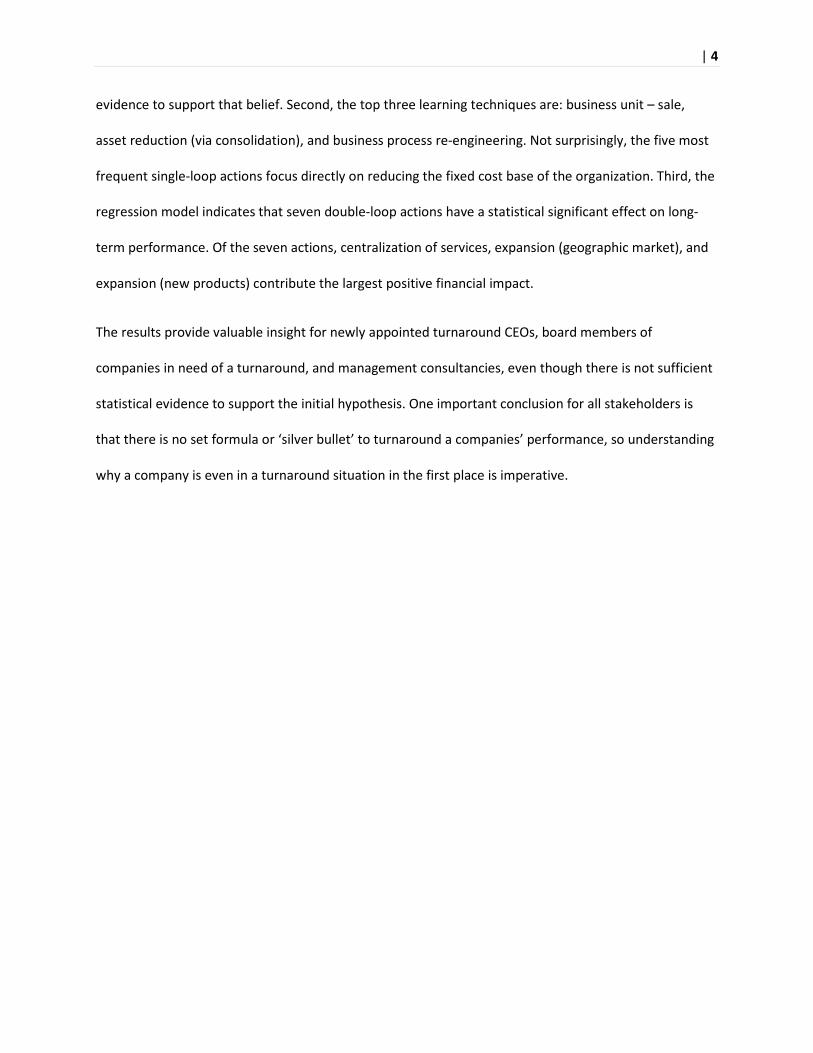
evidence to support that belief. Second, the top three learning techniques are: business unit – sale,
asset reduction (via consolidation), and business process re-engineering. Not surprisingly, the five most
frequent single-loop actions focus directly on reducing the fixed cost base of the organization. Third, the
regression model indicates that seven double-loop actions have a statistical significant effect on long-
term performance. Of the seven actions, centralization of services, expansion (geographic market), and
expansion (new products) contribute the largest positive financial impact.
The results provide valuable insight for newly appointed turnaround CEOs, board members of
companies in need of a turnaround, and management consultancies, even though there is not sufficient
statistical evidence to support the initial hypothesis. One important conclusion for all stakeholders is
that there is no set formula or ‘silver bullet’ to turnaround a companies’ performance, so understanding
why a company is even in a turnaround situation in the first place is imperative.

| 5
1. Introduction
Other than being widely recognized companies – Fiat SpA, Denny’s, and Krispy Kreme Donuts – all share
something in common. At some point, each company went through a successful corporate turnaround
to dramatically improve their respective profitability and competitive position. Unfortunately, all firms
that undergo an organization-wide change effort do not experience success. In fact, one study by
Bibeault (1982) found that out of 1,094 companies listed on the NYSE, ASE, and NASDAQ that
experienced sustained losses in net income, only 33% successfully turned around their situation. The low
success rate underscores the need to better understand the ‘corporate turnaround’ phenomenon
regardless of whether or not turnaround management is more of an art than a science.
| 6
2. Literature Review
In section 2.1, existing literature was analyzed to identify areas within the study of corporate
turnarounds that have been inadequately explored. In section 2.2, a ‘deep dive’ into the study of the
turnaround process was conducted to understand what part of the process could be further studied. In
section 2.3, organizational learning concepts were reviewed to provide a framework to analyze
techniques used by companies to address declining performance. In section 2.4, a review of research
papers that study organizational learning, in the context of a corporate turnaround, was discussed to
highlight how companies can simultaneously improve performance and internal capabilities.
2.1 Corporate Turnarounds
A keyword search of: turnaround, crisis, turnaround management, strategic renewal, or organizational
change would provide numerous papers that examine the phenomenon from both a quantitative and
qualitative perspective. Perhaps the best known macro-study was done by Pandit (2000), who examines
a sample of 47 past papers to provide future researchers with recommendations on areas that appear to
be inadequately explored. Pandit uses a framework proposed by Pettigrew (Pettigrew, 1987, 1990,
1992) to neatly categorize past papers based on their primary focus – content (what), context (why –
both inner and outer context), and process (how). This paper clearly highlights the need for research
related to the turnaround process, since only 15% of the papers in the sample do. Many of the process
studies only examine characteristics of successful turnaround managers, leaving space to add value.
Another valuable insight from the macro-study (Pandit, 2000) is that researchers define a corporate
turnaround differently. Broadly speaking, each paper identifies two phenomenon that help better
categorize a turnaround situation – a period of gradual or sharp performance decline and a period of
performance improvement greater than the initial decline. However, the difference in definition relates

| 7
to measurement of performance and definition of the turnaround cycle. As a result, Pandit recommends
that future research conclusions should be drawn from data that “consist of cases that fit a generally
agreed conceptualization of what a turnaround is” (Pandit 37) to maximize relevance.
The macro-study (Pandit, 2000) also examines the research design and methods. The study highlights
the role that qualitative and quantitative research has played to better understand the turnaround
process. Qualitative research is more common and provides a rich description of individual or multiple
case studies, whereas quantitative research is less common and more focused content related
questions. Pandit suggests that additional quantitative research should be done to study the process,
even though the studies might provide less depth than examining case studies.
As part of a paper by Smith and Graves (2005), the authors review past studies (Bibeault, 1982; Slatter,
1984; Finkin, 1985; Castrogiovanni et al., 1992; Arogyaswamy et al., 1995) to qualitatively understand
the impact of senior management turnover in the turnaround process. The paper outlines the benefits
of turnover for stakeholders. As a result, future studies may benefit from using companies in their
sample data that have senior management turnover. The event of a turnover not only provides a
common point in time for the start of a turnaround to be measured but also a common conceptual
framework that is aligned with Pandit’s recommendations.
Using senior management turnover as a common framework was further explored in study by Ellis
(2010), who examines the operating performance of firms that experience CEO turnover and hire a
turnaround specialist as the successor. The paper provides two useful insights into the study of
corporate turnarounds. First, a method to systematically approach quantitative sample data
construction by segregating companies that undergo a turnaround from companies that do not.
Second, based on the quantitative model, there are noticeable differences in a firm’s performance
based on whether the CEO successor had a reputation of a turnaround specialist or not. This insight
| 8
further strengthens the thought that using CEO turnover and the reputation of the replacement
successor as a criteria for identifying turnaround companies is meaningful.
2.2 Corporate Turnarounds – A deep dive into the ‘process’
Upon further research, three distinct categories emerged within the topic of the turnaround process –
phases, strategies, and macro-level actions to recover. The study by Smith and Graves (2005) depicts the
process as a series of phases – the decline stemming and the recovery support (see appendix #1 –
Turnaround process). The model captures the cause-effect relationship of action-result and provides
insight into actions that companies can take within each phase. Furthermore, the model can be used as
a framework to analyze the turnaround process in detail.
Simply put, a firm can either increase revenue or decrease cost (or some combination of both) to
improve profitability and return on capital. Both strategies have been studied in detail, but Schendel et
al. (1976) were one of the first to classify recovery actions as either efficiency-oriented or
entrepreneurial-oriented. They argued that firms should use efficiency-oriented strategies (cost and
asset reduction) when a firm’s operation is inefficient and entrepreneurial-oriented actions when a
firm’s corporate strategy has lost relevance. This distinction is important, since it dictates the type of
actions firms’ might undertake during a turnaround, all of which can be coded for analysis.
A study related to turnaround strategies by Hofer (1980) highlights a different model that could be used
to identify an appropriate set of actions for companies to take. The paper describes a framework to
developing a strategy that incorporates and addresses all the phases outlined in appendix #1. This study
is insightful because the model clearly segments turnaround situations across different dimensions –
strategic vs. operating, relative market position, stage of product, and technological position. For future
| 9
research, each of these attributes or characteristics could be modeled to understand their correlation to
a firm's recovery performance.
Armenakis and Fredenberger (1995) assess the corporate turnaround process in more detail by
examining how organizations can implement change, after a turnaround strategy has been selected,
through multiple case studies. As part of the authors’ study, they outline three phases – readiness,
adoption and institutionalization – based on past research (Lewin, 1951). The importance of this
research is three-fold. First, the paper goes beyond the content and context – within the turnaround
process – and provides a framework to examine how organizations can implement change. Second, the
paper introduces the concept of institutionalizing change to drive culture change. Third, the paper
examines specific levers that organizations can pull to alter the culture – active participation, persuasive
communication, management of external information, and human resource management practices. As a
result, the study adds tremendous insight into what actions would be important to identify, if a
researcher was to identify how a change in culture is correlated to performance during a turnaround.
Using situational and organizational determinants of turnaround, Francis and Desai (2005) classify
performance outcomes in declining firms. This quantitative study highlights two important points. First,
that correlating turnaround performance to organizational and cultural factors is feasible by using a
standard set of criteria to identify firm actions. Second, that similar to other studies (Pandit, 2000; Smith
and Graves, 2005; Ellis, 2010), a common definition of declining performance is two or three consecutive
years and recovery performance is two or three consecutive years post-implementation. Both insights
would be critical when designing a research method for a quantitative study.
Broadly speaking, numerous models (4-step, 6-step, 8-step) exist that discuss macro-level actions
organizations can take to change their organization. Most commonly cited is the 8-Step Change Model1
1 http://www.mindtools.com/pages/article/newPPM_82.htm

| 10
by John Kotter. The eighth step discusses the need to anchor the change into the corporate culture by
making the new methods part of the day-to-day activities. This concept is important because it
highlights the need to change elements of the existing culture, so organizations can better understand
and take ownership of the implemented changes.
Another model developed by Beer, Eisenstat and Spector2 outlines 6-steps to change management.
Most importantly, with respect to organizational learning, is step 6 – monitor the revitalization process,
adjusting in response to problems. The step highlights the idea of helping organizations learn from their
mistakes and adjust accordingly.
The use of organizational learning principles appears to extend beyond academia into the business
world. For example, Bain & Company – a global management consulting firm – describes a 4-step
process to leading change management: plan, lead, operate, and track. The ‘track’ stage is interesting,
since it alludes to the need to monitor progress and adjust. The site suggests that, “a change program
will wither unless management implements a means of tracking progress and adjusting the plan as
necessary.”3 This real-world application indicates that the concept of organizational learning is being
operationalized to drive performance during a turnaround.
2.3 Organizational Learning
The roots of organizational learning trace back to a book, “Theory of Practice”, by Chris Argyris and
Donald Schön (1974). The authors argue that organizational learning is the ultimate competitive
advantage and view learning as: discovery or diagnosis, invention of a solution, production of that
solution, and monitoring its implementation. Moreover, the authors provide a conceptual framework by
which organizational learning can be classified (see Table 1 – Organizational Learning).
2 Harvard Business Review, Nov. 1990. Why Change Programs Don’t Produce Change
3 http://www.bain.com/publications/articles/leading-change-management-requires-sticking-to-the-plot.aspx

| 11
Table 1 – Organizational Learning
Single-loop Double-loop Deutero-learning
Actions that are limited to
detection and correction of
organizational error
Enables organizations to detect
and correct errors in ways that
involve the modification of
underlying norms, policies, and
objectives
The process of inquiring into
the learning system by which
an organization detects and
corrects its errors
The authors build on their initial organizational learning framework in “Organizational Learning” (1978),
and discuss Model I and II (see Table 2 – Model I and II Schemes).
Table 2 – Model I and II
Model I Model II
Behavior that builds strategies
of action without inquiring into
the values that underlie those
actions
Behavior that centers on
understanding the underlying
causes of problems
Each framework provides a unique lens that could be used to examine corporate turnarounds.
Organizational learning might be the only competitive advantage (DeGeus, 1988), but whether or not
organizations can use these principles to address declining performance appears to be less researched.
2.4 The Inter-section of Corporate Turnarounds and Organizational Learning
Harold Sirkin and George Stalk Jr. put it simply – ‘Fix the process, Not the problem’4. The article provides
a case study of how a mill used four problem solving loops to effectively turn its operations around.
More importantly, the example resembles double loop learning and highlights how companies can
practically address underlying causes of poor performance to anticipate and prevent performance
issues. From a qualitative perspective, the article demonstrates how future researchers might be able to
examine companies during the turnaround process to find evidence of organizational learning.
4 Harvard Business Review, July-August 1990, pp. 26-33
| 12
The real-world example is supported by academic research that has explored the concept of
organizational learning during a corporate turnaround. For example, Buono and Kerber (2010) explore
the notion of building organizational change capacity and discuss creating a culture of change. The
authors discuss the need to encourage and support managers to broaden their change implementation
skillset. As a result, one might expect to see a period of sustained results – post turnaround – if change
agents can adequately develop a mindset and culture focused on continuous improvement.
Lastly, the concept of organizational learning and strategic renewal is examined through a case study of
the strategic renewal process at Canada Post Corporation by Crossan and Berdrow (2003). The paper
provides a framework that can be used to understand organizational learning processes in all
organizations. The discussion of institutionalizing processes at the organizational level is important,
since each input/outcome – i.e. routines, diagnostic systems, rules and procedure – could be further
explored when trying to understand how organizations can imbed organizational learning into their
culture during a corporate turnaround.
2.5 Summary of Key Insight
1. Corporate Turnarounds: process-related studies are less common than content or context
studies; an accepted conceptual model is important for sample selection; quantitative research
related to the turnaround process is not common
2. Corporate Turnarounds (Process): discrete actions during a turnaround can be identified;
existing quantitative studies do correlate actions to firm performance; changing the culture is
important to sustaining results post-turnaround
3. Organizational Learning: actions can be categorized as single-loop (Model I) or double-loop
(Model II)
4. Inter-section of Organizational Learning and Corporate Turnarounds: real-world and academic
examples exist that provide a conceptual model to understanding how firms can apply
organizational learning during a corporate turnaround

| 13
3. Research – questions & hypothesis
Based on the foregoing literature, a series of questions was addressed to provide an in-depth look at
corporate turnarounds from the lens of organizational learning.
3.1 Primary
Q1: is double-loop (Model II) learning necessary to restore long-term performance for a public
company in need of a corporate turnaround?
H: Public companies that use double-loop learning techniques are more likely to turnaround successfully
H2: Public companies that use double-loop learning techniques are more likely to sustain or improve
performance 3-4 years after the announcement of a turnaround CEO
Understanding whether organizational learning principles can be applied to corporate turnarounds to
drive long-term performance provides – board members, c-level executives, and turnaround specialists
– insight to how important changing the corporate culture is in the initial 2 years post-announcement.
3.2 Secondary
Q1: What learning techniques – single and double loop – are most commonly used during a corporate
turnaround by companies that sustain or improve return on net assets 3-4 years post-announcement?
Understanding what techniques are most commonly used provides – board members, c-level executives,
and turnaround specialists – tangible insight to what strategy and actions a firm might consider taking
during the process.
| 14
Q2: What double-loop learning techniques are highly correlated to long-term performance?
Understanding what techniques are highly correlated to long-term performance provides – board
members, c-level executives, and turnaround specialists – insight to how actions might be prioritized
based on the impact on return on net assets.
3.3 Tertiary
Q1: What implications does this have for stakeholders – consultancies, board members of companies
in need of a turnaround and newly appointed turnaround CEOs?
Each stakeholder plays a role in assisting companies during a turnaround – either as an advisor or
operator. As a result, the findings provide recommendations for what actions each stakeholder can take
to maximize the probability of not only turnaround success but also sustaining long-term performance.
| 15
4. Research – design
4.1 Quantitative
The primary focus of the research is qualitative at the organization level. Since majority of the existing
research related to the turnaround process is individual case and comparative case studies (Pandit,
2000), the findings are not completely generalizable to other corporate turnaround situations. As a
result, a quantitative analysis across different turnaround companies – across industries – and situations
provides findings that are more generalizable. The method can be categorized as cross-sectional.
4.1.1 Frequency Analysis
To address 3.2 (Q1), a frequency chart was constructed to identify the most commonly types of single
and double loop learning techniques used by firms that sustain or improve long-term performance.
4.1.2 Regression Analysis
To address 3.2 (Q2), a multi-variant regression was constructed to identify which learning techniques
have the largest impact on the percent change of average return on net assets.
4.2 Qualitative
A secondary focus of the research is qualitative. Three semi-structured discussions were conducted with
individuals that have senior level experience at overseeing a corporate turnaround. The purpose of the
discussions was to understand how experts would categorize the various learning techniques and to
gain first-hand insight at the use and impact of learning techniques throughout the process.

| 16
4.3 Discussion of Measurement
4.3.1 Public company in need of a turnaround
The data set comprised of organizations that have experienced CEO turnover – for any reason – and
replaced the position with an outside successor. The successor must be either known to be a turnaround
CEO or to have turnaround experience – at least two previous turnarounds of different companies. A
review of public announcements and biographies helped determine if the successor fits the criteria.
4.3.2 Long-term performance
Long-term performance was defined using return on net assets – 3 to 4 years – post announcement of a
turnaround CEO. A time frame greater than three years is a better representative of long-term
performance, in contrast to results within the first two years.
4.3.3 Organizational learning
To measure the techniques companies use to instill organizational learning, the following actions
(Whitney, 1986; Finkin, 1992; Armenakis and Fredenberger, 1995; Barker III and Duhaime, 1997; Buono
and Kerber, 2010) are classified as either: single-loop learning or double-loop learning:
Table 3 – Learning techniques
Single-loop Double-loop
• Acquisition (scale/scope)
• Partnership / Joint-venture
• Business unit – sale
• Business unit – closure
• Exit – product line
• Exit – market segment
• Change – pricing strategy
• Change – product mix
• Process outsourcing
• Workforce reduction
• Supplier consolidation
• Expansion (products)
• Expansion (market segments)
• Expansion (geographic market)
• Expansion (distribution channels)
• Centralization of functions
• Business process re-engineering
• Cost control policies
• IT investment
• Change to business unit/functional reporting lines
• Senior management personnel changes or additions
• HR practices (compensation or incentive system)

| 17
• Asset reduction
• Debt re-structuring
• Recapitalization
• HR practices (training program)
• Performance measurement system
4.3.4 Turnaround successfully
Successful turnaround companies were defined as companies that continued business operations –
independently (i.e. not merged with another company) – for at least three years post-announcement.
4.3.5 Sustained or improved performance
Companies that sustained or improved performance were defined as companies that experienced an
average return on net assets of years three and four greater than the average return on net assets of
years one and two post-announcement.
| 18
5. Methodology
5.1 Proposed Model
To address 3.2 (Q2), the model will have the dependent variable of the percent change in average return
on net assets of years 3 and 4 relative to years 1 and 2 post announcement of a turnaround CEO. The
independent dummy-variables will consistent of the various techniques outlined in table 3.
5.2 Sample Construction
5.2.1 Data collection
See appendix #2 – data scale
Turnaround companies were identified by searching articles (Proquest Plus, Business Source Complete;
specific sources included: wire feeds, newspaper, magazines) using the keywords [Turnaround and (CEO
or Specialist)] to identify recently appointed CEOs who are mentioned to be turnaround CEOs. For CEOs
that were not specifically said to be turnaround specialists, their profile was analyzed through LexisNexis
to better understand their background.
Once the list of turnaround CEOs (and thus the companies that hired them) was identified, companies’
performance data was collated, using Mergent Online and ThomsonOne, for the eight intervals in table
4. Furthermore, the return on net assets was analyzed to verify that each company experienced a
decline prior to the announcement. Each company was scored on a scale – unacceptable, acceptable,
good, very good and excellent. All categories were included in the data analysis except for unacceptable.
5.2.2 Coding of Organizational Learning
Public information was used to code the types of techniques that companies used during the
turnaround process. Specifically, the information was extracted from company reports (Form 10-K and
| 19
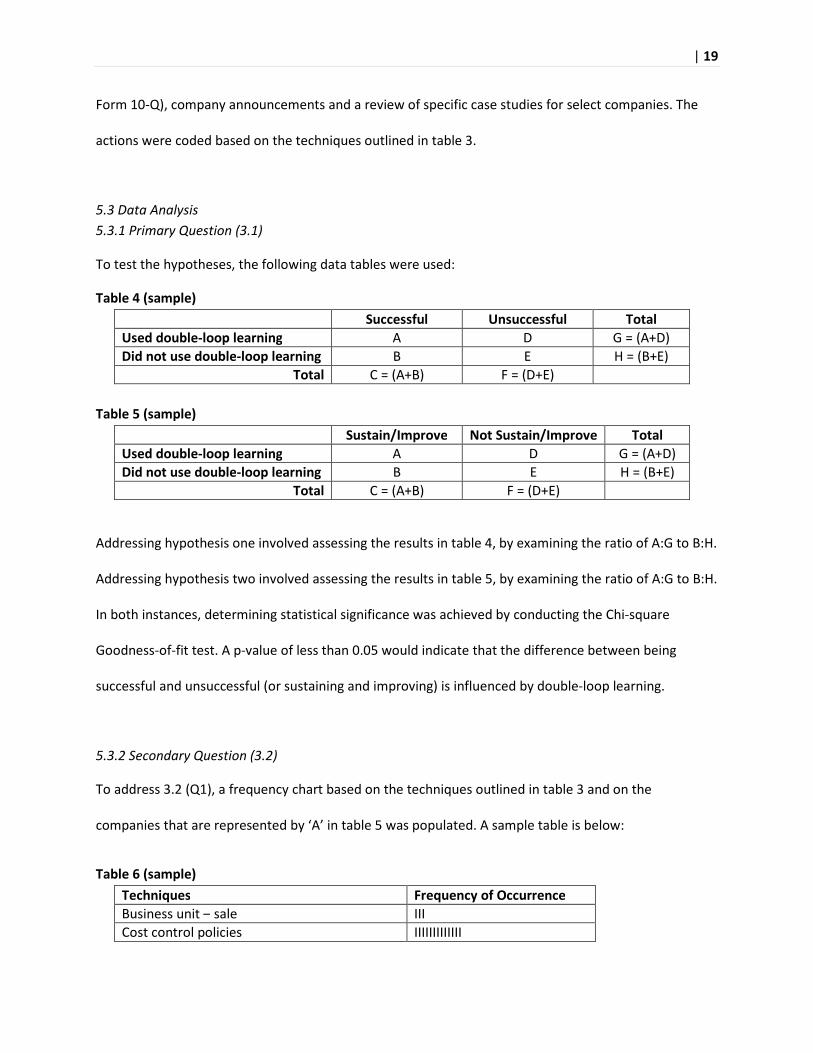
Form 10-Q), company announcements and a review of specific case studies for select companies. The
actions were coded based on the techniques outlined in table 3.
5.3 Data Analysis
5.3.1 Primary Question (3.1)
To test the hypotheses, the following data tables were used:
Table 4 (sample)
Successful Unsuccessful Total
Used double-loop learning A D G = (A+D)
Did not use double-loop learning B E H = (B+E)
Total C = (A+B) F = (D+E)
Table 5 (sample)
Sustain/Improve Not Sustain/Improve Total
Used double-loop learning A D G = (A+D)
Did not use double-loop learning B E H = (B+E)
Total C = (A+B) F = (D+E)
Addressing hypothesis one involved assessing the results in table 4, by examining the ratio of A:G to B:H.
Addressing hypothesis two involved assessing the results in table 5, by examining the ratio of A:G to B:H.
In both instances, determining statistical significance was achieved by conducting the Chi-square
Goodness-of-fit test. A p-value of less than 0.05 would indicate that the difference between being
successful and unsuccessful (or sustaining and improving) is influenced by double-loop learning.
5.3.2 Secondary Question (3.2)
To address 3.2 (Q1), a frequency chart based on the techniques outlined in table 3 and on the
companies that are represented by ‘A’ in table 5 was populated. A sample table is below:
Table 6 (sample)
Techniques Frequency of Occurrence
Business unit – sale III
Cost control policies IIIIIIIIIIIII

| 20
To address 3.2 (Q2), a model (90% confidence) was constructed using all independent variables in table
3. After assessing the p-value of each variable against the threshold of 0.10, the variable with the largest
p-value was removed. This process continued until a set of statistically significant variables remained.
5.3.3 Tertiary Question (3.3)
Drawing insights and recommendations for how management consultancies could structure and execute
turnaround related services was based on: the literature review, semi-structured discussions, and
findings from the analysis.
5.4 Use of Single and Multi-indicator measurements
All measurements outlined in section 4.3 have single indicators, except for organizational learning. All
single indicators were derived from literature review insights. In contrast, the multiple actions of both
single and double-loop learning were derived from: the literature review and the research past
experience in management consulting for various companies in need of a corporate turnaround.
5.5 Discussion of Reliability and Validity
Each measurement was examined to highlight concerns of reliability and validity. Chart 1 provides a
summary of potential concerns and each concern is subsequently discussed.
Chart 1 – Potential concerns
Measurement Reliability Validity
Public company in need of a turnaround Stability -
Long-term performance - Construct*
Organizational learning Intra-observer consistency Construct
Successful turnaround - Construct*
Sustained or improved turnaround - Construct*

| 21
5.5.1 Reliability
Using public information and CEO experience data to identify companies in need of a turnaround raises
concerns of stability. The implicit assumptions are that communication practices of companies have not
changed over time. Furthermore, that each company discloses the same degree of detail and uses the
same public mediums when announcing a new CEO. For consistency, the key word search criteria were
not expanded, but this inherently may bias the sample.
The measurement of organizational learning raises concerns of intra-observer consistency. Each
individual observation (i.e. each company analysis) was conducted over the course of three months, so
the degree of consistency applied to identify learning techniques may be called into question. To
maintain consistency, a list of actions was identified prior to analyzing company actions. If a new
relevant action was identified during the analysis then previous companies were re-analyzed.
5.5.2 Validity
First, measuring organizational learning through companies’ actions may be subject to construct validity.
Even though significant research was conducted, the deduction of learning techniques may be mistaken.
Second, measurements categorized as construct* may be inadequate measures of the respective
concepts. Each indicator was derived from the literature, but there is no generally accepted definition.
These issues of reliability and validity are potential limitations of the study.

| 22
6. Results
In section 6.1, the outcome and process used to generate the data set is described. In section 6.2, an
analysis of turnaround success is examined for companies that do and do not use double-loop learning
techniques. In section 6.3, an analysis of companies that operate for at least three years post-
announcement is conducted to understand the potential of sustaining or improving performance. In
section 6.4, the frequency of learning techniques is examined. In section 6.5, a review of the multi-
variant regression results is discussed to understand the importance of different techniques. In section
6.6, a summary of the semi-structured discussion comments are outlined.
6.1 Data collection and sample size
Identifying companies to include in the data set to address all research questions required a multi-step
iterative process. Table 7 outlines the results of the data collection process.
Table 7 – Data set
74 (public companies identified)
69 (remained public)
5 (converted ownership structure to private)
38 (sufficient pre/post
announcement data)
31 (insufficient post-
announcement data)
36 (acceptable
data or
better)
2 (unacceptable)
A detailed scan – across the NYSE, NASDAQ, TSE, and TSX from 1992 to 2007 – identified 74 companies
that match the keyword search criteria. 5 companies were bought by private equity firms and taken
private, so they were excluded from the data set. Of the remaining 69 companies, 38 companies

| 23
operated independently for at least three years post-announcement. In contrast, 31 firms were
unsuccessful and either sold or went bankrupt within two years of hiring a turnaround CEO.
The annual return on net assets trend was analyzed for the 38 companies and each was labeled
according to the data scale. Of the 38 companies, 36 companies were labeled as acceptable or higher
and remained in the data set for analysis. A detailed review of the twos unacceptable firms indicated
that the firms hired a turnaround CEO for other reasons (i.e. to address rumors that the company was
for sale).
6.2 Analysis of turnaround success
Table 8 – Single and double-loop learning in relation to turnaround success (data for table 4)
Successful Unsuccessful
Used at least one double-loop technique 25 17 42 Used no double-loop technique 11 14 25 36 31 67 total firms
A few important observations can be made:
• 63%5 of the total number of firms used at least one double-loop technique
• 54%6 of the firms that undertook a corporate turnaround were successful in improving their
performance and operated for at least three years post-turnaround
o The 54% success rate of turnaround efforts is significantly higher than the 33% success
rate observed in the study conducted by Bibeault (1982). However, an in-depth analysis
indicates otherwise. As discussed in section 6.3, 11 of 36 firms that were initially
successful failed to sustain or improve performance. Therefore, the turnaround success
rate in this study is actually 37%7, which is similar to the rate observed by Bibeault
5 42 firms / 67 total firms
6 36 firms / 67 total firms
7 (36 firms – 11 firms) / 67 total firms

| 24
• Of the successful companies, 69%8 used at least one double-loop technique. In contrast, only
55%9 of the unsuccessful companies used at least one double-loop technique
• Of the companies that used at least one double-loop technique, 60%10
were successful in their
turnaround efforts compared to only 44%11
that did not use double-loop techniques
6.2.1 Chi-square Goodness-of-fit test
The p-value equaled 0.22. As a result, there is not enough evidence to believe that a firm using a double
loop learning technique is more likely to achieve a successful turnaround.
6.3 Analysis of sustained turnaround results (long-run performance)
Table 9 – Single and double-loop learning in relation to sustaining or improving performance 3-4 post
announcement (data for table 5)
Sustain or Improve Not Sustain or Improve
Used at least one double-loop technique 19 6 25 Used no double-loop technique 6 5 11 25 11 36 firms
A few important observations can be made:
• 69%12
of the initially successful firms used at least one double-loop technique
• 69%13
of the firms that remained operational after two years either sustained or improved their
return on net assets. These firms generated a higher average return on net assets in years 3 and
4 relative to the average return in years 1 and 2
• Of the firms that sustained or improved their average return on net assets, 76%14
did so using at
least one double-loop technique
8 25 firms / 36 firms
9 17 firms / 31 firms
10 25 firms / 42 firms
11 11 firms / 25 firms
1225 firms / 36 successful firms
13 25 firms / 36 successful firms

| 25
• Of the firms that used at least one double-loop technique, 76%15
were able to sustain or
improve whereas only 55%16
of the firms that did not use a double-loop technique do so
6.3.1 Chi-square Goodness-of-fit test
The p-value equaled 0.20. As a result, there is not enough evidence to believe that a firm using a double
loop learning technique is more likely to sustain or improve performance.
6.4 Analysis of learning techniques
Table 10 – Number of occurrences for the top-5 techniques (data for table 6)
Single-loop Frequency Double-loop Frequency
Business unit – sale 12 Business process re-engineering 10
Asset reduction
(via consolidation)
11
Change to business unit/functional
reporting lines
9
Tie: Workforce reduction /
Debt restructuring
9 Tie: IT investment / Senior
management changes or additions
6
Business unit – closure 5 Tie: Expansion (products) /
Expansion (market segments)
5
Based on the 25 companies that sustained or improved performance, the top three learning techniques
are: business unit – sale, asset reduction (via consolidation), and business process re-engineering.
Regarding the single-loop techniques, the top five techniques represent a mix of strategic (2),
operational (2), and financial (1) actions. Also, no individual firm took all five actions, but 3 of the 25
companies did employ four of the five techniques. Regarding the double-loop techniques, the top five
techniques represent a mix of strategic (1), operational (2), and organizational (2) actions. Interestingly,
one firm – AMX Corporation – utilized all five double-learning techniques and experienced the third
largest improvement on return on assets.
14
19 firms / 25 firms 15
19 firms / 25 firms 16
6 firms / 11 firms

| 26
6.5 Multi-variant analysis of return on net asset improvement
6.5.1 Impact of double-loop techniques on percent change in average return on net assets of years three
and four compared to years one and two
Table 11 – Summary of regression output (years 3 and 4 compared to years 1 and 2)
Adjusted R Square 0.84 Standard Error 3.22 Observations 19 Independent Variables Coefficients Std. Error P-value
Centralization of services 41.2 6.1 0.0% Expansion (geographic market) 33.8 3.5 0.0% Expansion (products) 7.4 2.5 1.1% Business process re-engineering 3.8 1.3 1.3% Expansion (market segments) (3.8) 1.7 4.8% Expansion (distribution channels) (21.8) 3.4 0.0% HR Practices (compensation or incentive system (33.4) 4.7 0.0%
The model generates an adjusted R squared of 0.84, which indicates that majority of the variability in
the percent change in average return on assets can be explained by the independent variables. Also, 7 of
the original 13 variables yielded a statistically significant p-value of < 0.1. Centralization of services and
expansion (geographic market) contribute the largest percent change to the average return on assets –
more than 4x the third highest variable. Of the 7 variables, 3 variables indicate that the percent change
in return on assets will actually be negatively impacted if the action is executed.
6.5.2 Impact of double-loop techniques on percent change in average return on net assets of years one
and two four compared to initial turnaround year
Table 12 – Summary of regression output (years 1 and 2 compared to the initial turnaround year)
Adjusted R Square 0.74 Standard Error 4.76 Observations 20 Independent Variables Coefficients Std. Error P-value
Expansion (geographic market) 27.6 4.1 0.0% Centralization of functions 10.2 3.7 2.1% Expansion (products) 10.2 3.3 1.1% Business process re-engineering 6.3 2.9 5.6% Change to business unit/functional reporting lines 4.1 2.0 6.4% Senior management personnel changes or additions (6.9) 2.7 2.9%

| 27
Expansion (market segments) (7.6) 3.6 5.9% Performance measurement system (15.1) 6.8 5.1% HR practices (compensation or incentive system) (15.8) 3.4 0.1% Expansion (distribution channels) (15.8) 4.8 0.8%
The model generates an adjusted R squared of 0.74, which indicates that majority of the variability in
the percent change in average return on assets can be explained by the independent variables. Also, 10
of the original 13 variables yielded a statistically significant p-value of < 0.1. Expansion (geographic
market), centralization of services, and expansion (products) contribute the largest percent change in
the average return on assets. Of the 7 variables, 5 variables indicate that the percent change in return
on assets will actually be negatively impacted if the respective action is executed.
6.6 Summary of semi-structured discussions
Collectively, the broad experience of the four interviewees included working: in professional services
and industry, as an advisor and operator, with underperforming, distressed, and crisis companies, and
across mid-market and large-cap companies. Overall, the discussions uncovered 3 insights that enhance
the literature review and quantitative analysis.
First, evaluating the state of the organization to determine necessary actions requires not only assessing
the current management team, capital structure, and cash burn-rate but also understanding why the
company is in need of a turnaround. Studying performance in T-3 and T-2 can yield valuable insight into
the reason for decline and help determine if the company has a viable business model.
Second, organization-focused double-loop learning techniques are important to sustaining or improving
long-term turnaround performance, but the positive impacts are difficult to measure financially. For
example, changes to senior personnel or reporting lines and creating proper performance measurement
tools to aid decision-making helps the organization make better decisions, but the outcome is much less
tangible than reducing the age of accounts receivables or interest payments.

| 28
Third, some companies fail to avoid making one of two (or both) critical mistakes during a turnaround
effort. Companies impact future revenue streams by severely pissing off existing customers and ruining
relationships after making certain changes. Also, companies fail to sufficiently reduce legacy costs – i.e.
union employment contracts – then find themselves in another turnaround situation in the future.
6.7 Summary of Key Findings
1. Data Collection and Sample Size: 74 companies identified; 67 used in the analysis of success; 36
scored acceptable or better; 19 used in the regression analysis
2. Analysis of Turnaround Success: 54% of the firms that undertake a turnaround are successful.
However, no statistical significance to suggest double-loop learning has an impact
3. Analysis of Sustained Turnaround Results: data suggests (76% vs. 55%) companies that use
double-loop learning are more likely to sustain or improve. However, no statistical significance
4. Analysis of Learning Techniques: top three techniques used are: selling entire business unit(s),
asset reduction / consolidation, and business process re-engineering; business process re-
engineering and changing existing business unit reporting lines are top double-loop techniques
5. Multi-variant Analysis of Return on Net Asset Changes: centralization of services and expansion
(geographic market) contribute the largest percent change to the average return on assets

| 29
7. Implications
This paper sought to add value to the research on the turnaround process – deliberating ignoring the
content and context of turnaround situations. By design, addressing the research questions would
uncover insight into strategies and macro-actions (single and double-loop learning techniques) that
companies could use to not only successfully orchestrate a corporate turnaround but also sustain and
improve long-term performance. Furthermore, a specific focus of this research was determining
whether double-loop actions increased the likelihood of turnaround success. The results provide
valuable insight for management consultancies, board members of companies in need of a turnaround
and turnaround CEOs, even though there is not sufficient statistical evidence to support the hypothesis.
7.1 Discussion of the results in the context of the research questions and hypothesis
7.1.1 Addressing section 3.1 - primary
Based on the sample data set, public companies that use double-loop learning techniques appear more
likely to turnaround successfully (Q1-H), however statistically there is not enough evidence to support
that belief. Despite the statistical insignificance, implementing double-loop actions seem to be standard
practice since majority, 63%, of the firms used at least one technique. Furthermore, executing certain
double-loop actions seems necessary to enable the organization to take other actions that directly
improve performance. For example, making an IT investment to improve reporting would enable
decision-makers to make more accurate and timely decisions. The financial impact of accurate decision-
making is difficult to measure, but the rationale to investment is aligned with the insights uncovered
during the semi-structured discussions.
Similar to the conclusion for (Q1-H), public companies that use double-loop learning techniques appear
more likely to sustain or improve performance 3-4 years after the announcement of a turnaround CEO
(Q1-H2), however statistically there is not enough evidence to support that belief. Interestingly, the

| 30
proportion of firms that sustain or improve performance and use at least one double-loop technique is
76%, which suggests those firms enabled dramatic changes. As a result, the organization may have been
in a better position to capitalize on more unforeseen opportunities throughout the turnaround process.
7.1.2 Addressing section 3.1 - secondary
Not surprisingly, the five most frequent single loop actions focus directly on reducing the fixed cost base
of the organization. This result is aligned with the insights from the semi-structured discussions since
“right-sizing” the balance sheet is a crucial initial step in the turnaround process. Of the most frequent
four double-loop actions, three actions are focused on improving decision-making effectiveness,
suggesting that turnaround CEOs place emphasis on trying to change the underlying cultural norms. This
rationale is aligned with the notion that double-loop learning techniques may be an enabler for future
actions. The most frequent action of selling business units provides additional insight. The action seems
to address multiple issues simultaneously – generate cash, improve management’s ability to focus on
the core business, and immediately remove employees that may become barriers to change.
There is correlation between percent change in average return on net assets and double-loop actions,
despite the lack of statistical significance. In regards to the impact of double-loop techniques on percent
change in average return on net assets of years three and four compared to years one and two, the
centralization of services has the largest positive impact and should be a high priority action. The action
has a dual outcome – reduced operating costs and improve decision-making effectiveness. The next
priority action should be expansion (geographic markets), which seems reasonable because the
company can capture higher margin dollars from existing products in new markets by adding little to no
incremental fixed costs. Expansion (products) has the third largest positive impact, which seems
counter-intuitive because product development costs money. However, in industries where companies

| 31
have large fixed distribution costs, the additional margin dollars generated by new products will still
offset fixed distribution costs.
Conversely, expansion (market segments and distribution channels) both negatively impact the return
on net assets. Companies would have to invest in establishing new channels that might simply
cannibalize sales through existing channels – online vs. bricks & mortar. Establishing a new
compensation or incentive system also significantly negatively impacts average return on net assets.
This result is quite surprising, since one would think that the right incentives would motivate the right
behavior, but creating the right incentive system may be difficult during times of crisis.
In regards to the impact of double-loop techniques on percent change in average return on net assets of
years one and two compared to initial turnaround year, all positive and negative actions are the same as
the long-term except for the addition of: change to business unit/functional reporting lines and senior
management personnel changes. This suggests that regardless of timeframe, the positive actions in
table 11 and table 12 should be high priority actions for companies in need of a turnaround. Since
removing existing management can be costly, this may explain why the impact of senior management
changes is financially unfavorable. However, doing so may be needed to change the cultural norms.
7.2 Discussion of the results in the context of the literature review
The results of this study provide three insights when considering the literature review. First, all things
being equal, the success rate of corporate turnarounds has not improved (37% vs. 33%) over the years
despite advances in business theory and technology. Therefore, the need to understand the turnaround
phenomenon – context, content, and process – remains urgent and important.

| 32
Second, the study by Schendel et al. (1976) classified recovery actions as efficiency-oriented or
entrepreneurial-oriented, so based on that classification, firms use efficiency actions more frequently.
However, entrepreneurial-oriented actions have a larger positive impact on the average return on net
assets. This suggests that many firms’ corporate strategy has lost relevance which supports the notion of
assessing why firms are in a turnaround situation in the first place to understand if they have a viable
business model – i.e. manufacturing music CDs, magazine & newspaper hardcopy publishing.
Third, the results quantitatively align with the qualitative study by Armenakis and Fredenberger (1995).
The authors’ outline three phases – readiness, adoption, and institutionalization – during
implementation. The high frequency of changes to business unit/functional reporting lines and senior
management suggest that the turnaround CEOs first step is to get the organization ready for change
before a new business model can be adopted.
7.3 Discussion of the results in the context of contributing to existing research and possible extensions
7.3.1 Contributing to existing research
This paper contributes to existing turnaround research in two important ways. First, the results clearly
indicate that recovery actions have a very different impact on short and long-term performance, so
stakeholders can better prioritize actions. More importantly, the lack of statistical significance of
correlating double-loop actions to success emphasizes the need to further understand the content and
context of turnaround situations before determining what recovery actions should be implemented.
Second, attempting to generalize a ‘standard’ approach to turnaround management would be
detrimental. The results indicate that not all companies experience the same improvement by using the
same actions, so adopting a more holistic view of turnaround management is necessary. Getting a clear
understanding of the industry structure, recent trends, competitive position and severity of
| 33
performance decline would yield better information for future researchers and practitioners to design
company-specific approaches.
7.3.2 Possible study extensions
Upon further review, three study extensions could be completed to provide insight that is beyond the
scope of this paper. First, the sample size could be increased – i.e. timeframe and stock exchanges – to
determine if the same results continue to hold true. As mentioned, the sample appeared to support the
initial hypothesis, so increasing the sample size may yield a different result. If so, a qualitative study
should be done on the companies in the sample set to provide context to the quantitative results.
Second, the companies in the data set could be categorized based on industry and/or severity of
performance decline from years T-3 to T. Segmenting the data based on categories would provide more
context specific insight into each turnaround situation.
Third, the five best and worst performing companies could be qualitatively studied in greater detail. By
studying the outliers, through a review of case studies – if possible – and/or interviews with senior
personnel, insight into why the individual company’s performance declined may surface. As a result, this
information could be related back to the quantitative results to better understand the rationale for
taking certain recovery actions and their impact in certain situations.

| 34
8. Conclusions – a call to action
One important conclusion for all stakeholders – management consultancies, board members, and newly
appointed turnaround CEOs – is that there is no set formula or ‘silver bullet’ to turnaround a companies’
performance. All stakeholders need to step back from the organization and take a 30,000 feet view to
determine what has changed in the industry, competitive landscape, consumer mindset, or internal
operation to understand why the company is even in a turnaround situation in the first place.
8.1 Recommendation for newly appointed turnaround CEOs
There is no doubt that newly appointed turnaround CEOs would have numerous urgent and important
issues to deal with immediately, but three important recommendations should be kept in mind. First, do
not hesitate to make tough people calls when necessary – changing senior or middle management
personnel. By making the call, employees will realize that serious efforts are being made to change the
norms and ready the organization to adopt and institutionalize a new business model.
Second, focus on the core business. In relation to the product/market focus, a penetration strategy
would be ideal since presumably the product/service and distribution channels are already established.
So, re-positioning the business at a minimal cost relative to other product/market focuses is required.
Third, do invest time in actions that also enable the organization to make effective decisions. The actions
may not yield financially visible results, but if done correctly the decision-making process should be
streamlined and yield more accurate and timely decisions. The extent to which a turnaround effort can
focus on enabler actions is dependent on the urgency of the situation.

| 35
8.2 Recommendation for board members of companies in need of a corporate turnaround
Even though board members may not play a line management role in the turnaround process, two
important recommendations can help them support the change agent. First, do not hesitate to divest
non-strategic business units. Sometimes management teams may feel obligated to make every business
unit work, but doing so can be detrimental. Selling business units could generate much needed cash and
help focus the management team on improving the core business.
Second, similar to the recommendation for newly appointed turnaround CEOs, do not hesitate to make
tough people calls (or support the turnaround CEO) related to senior management. The added board
level support may be the catalyst needed to move the organization into an adoption phase quickly. A
turnaround requires dealing with the issues of the past, so board members may be in the best position
to help deal resolve those issues as quickly as possible.
8.3 Recommendation for management consultancies
In addition to providing seasoned industry experts and analytical horsepower, firms should focus on
assisting companies in a need of a turnaround in two ways. First, provide an objective assessment of the
client’s current business model based on past client projects and industry research. Sometimes current
board members and executives have too narrow of a view of the company that they fail to see how
changes in the external environment have impacted the company. This insight is not only important for
companies to develop appropriate recovery strategies but also for firms since they can position
themselves as the most logical partner to aid the company during the turnaround process. In most
cases, the potential value of fees from assisting the company will outweigh the cost of conducting up-
front research, especially if the firm can help multiple companies in the same industry.

| 36
Second, get involved in quantitative and qualitative research. Presumably, firms that already assist
companies in need of a turnaround have substantial institutional knowledge. As a result, these firms can
contribute to existing research by adding qualitative data to many existing quantitative studies –
especially since in some cases firms’ were directly involved in the turnaround effort by providing interim
management services. In these cases, the additional context provided would go a long way in helping all
stakeholders – including future researchers – understand how applicable the theory is in practice.

| 37
9. Appendices
Appendix #1 –Turnaround Process

| 38
Appendix #2 – Data scale
Score Definition (in relation to return on net assets performance)
Excellent T < T-1 < T-2 < T-3
Very Good T < T-1 < T-2
Good T < T-1 and either T < T-2 or T < T-3
Acceptable T < T-2 and/or T < T-3
Unacceptable Other
| 39
10. References
Armenakis, A.A. and Fredenberger, W.B. (1995), Process strategies for turnaround change agents: crisis
and non-crisis situations. Journal of Strategic Change, Vol. 4, pp. 19-31
Bain & Company. http://www.bain.com/publications/articles/leading-change-management-requires-sticking-to-the-
plot.aspx
Barker III, V.L. and Duhaime, I.M. (1997), Strategic Change in the Turnaround Process: Theory and
Empirical Evidence. Strategic Management Journal, Vol. 18, pp. 13-38
Beer, M., Eisenstat, R.A., and Spector, B., Nov. 1990. Why Change Programs Don’t Produce Change.
Harvard Business Review
Bibeault, D.B., 1982. Corporate Turnaround: How Managers Turn Losers Into Winners. McGraw-Hill.
Buono, A.F. and Kerber, K.W. (Spring 2010), Creating a Sustainable Approach to Change: Building
Organizational Change Capacity. Advanced Management Journal, pp. 4-21
Crossan, M.M., (2003). Chris Argyris and Donald Schön's "Organizational Learning": There Is No Silver
Bullet. The Academy of Management Executive, Vol. 17, No. 2, pp. 37-39
Crossan, M.M. and Berdrow, I. (Nov. 2003), Organizational Learning and Strategic Renewal. Strategic
Management Journal, Vol. 24, No. 11, pp. 1087-1105
Desai, A.B. and Francis, J.D. (2005), Situational and organizational determinants of turnaround.
Management Decision, Vol. 43, No. 9, pp. 1203-1224
Ellis, J. (2010), Are Turnaround Specialists Special? An examination of CEO reputation and CEO
succession. Retrieved at: http://www.cba.ua.edu/assets/docs/efl/Are_Turnaround_Specialists_Special.pdf
Finkin, E.F. (1992), Structuring a Successful Turnaround. Journal of Business Strategy, Vol. 13, pp. 56
Graves, C. and Smith, M. (2005), Corporate turnaround and financial distress. Managerial Auditing
Journal, Vol. 20, No. 3, pp. 304-320
Harris, P.R., (1994), Book Review – Theory in Practice. Behavioral Science, Vol. 39, Issue 3, pp. 254
Hofer, C.W. (1980), Turnaround strategies. Journal of Business Strategy, Vol. 1, No. 1, pp. 19-31
Kotter, J. (1995), Leading Change. Retrieved at: http://www.mindtools.com/pages/article/newPPM_82.htm
Lewin, K. (1951), Field Theory in Social Science, Harper and Row, New York, NY
Pandit, N.R. (2000), Some Recommendations for Improved Research on Corporate Turnarounds.
M@n@gement-AIMS, Vol. 3, No. 2, pp. 31-56

| 40
Schendel, D., Patton, G.R. and Rigg, J. (1976), Corporate turnaround strategies: a study of profit decline
and recovery. Journal of General Management, Vol. 3, No. 3, pp. 3-11
Sirkin, H. and Stalk Jr., G., July-August 1990, Fix the process, Not the Problem. Harvard Business Review,
pp. 26-33
Whitney, J.O. (1986), Organizing for a Turnaround. Management Review, 75:12, pp. 50