Embed Size (px)
Citation preview

This document is downloaded from DR‑NTU (https://dr.ntu.edu.sg)Nanyang Technological University, Singapore.
Visualizing the perturbation of cellular cyclicdi‑GMP levels in bacterial cells
Ho, Chun Loong; Chong, Kavin Shi Jie; Oppong, Jamila Akosua; Chuah, Mary Lay‑Cheng;Tan, Suet Mien; Liang, Zhao‑Xun
2013
Ho, C. L., Chong, K. S. J., Oppong, J. A., Chuah, M. L. C., Tan, S. M., & Liang, Z. X. (2013).Visualizing the Perturbation of Cellular Cyclic di‑GMP Levels in Bacterial Cells. Journal ofthe American Chemical Society, 135(2), 566‑569.
https://hdl.handle.net/10356/79909
https://doi.org/10.1021/ja310497x
© 2013 American Chemical Society. This is the author created version of a work that hasbeen peer reviewed and accepted for publication by Journal of the American ChemicalSociety, American Chemical Society. It incorporates referee’s comments but changesresulting from the publishing process, such as copyediting, structural formatting, may notbe reflected in this document. The published version is available at:[http://dx.doi.org/10.1021/ja310497x].
Downloaded on 03 Jan 2022 19:48:20 SGT
S1
Supporting Information
Visualizing the Perturbation of Cellular Cyclic di-GMP
Levels in Bacterial Cells
Chun Loong Ho, Kavin Shi Jie Chong, Mary Lay Cheng Chuah, Suet Mien Tan, Zhao-Xun
Liang*
Division of Structural Biology & Biochemistry, School of Biological Sciences, Nanyang
Technological University, 60 Nanyang Drive, Singapore 637551.
Table of contents
Material and methods
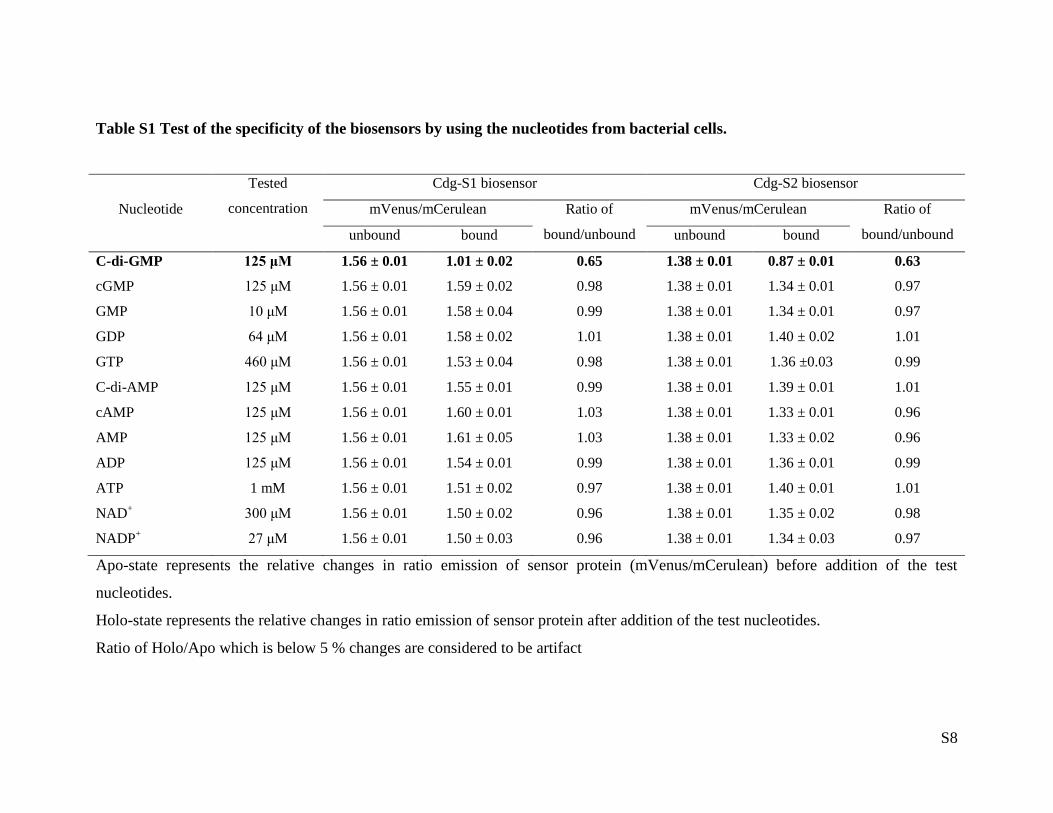
Table S1 Test of the specificity of the biosensors by using the nucleotides from bacterial cells.
Table S2 Experimental concentrations of the biofilm-dispersing compounds and perturbation of
FRET efficiencies in two E. coli strains.
Table S3 Minimal inhibition concentration (MIC), experimental concentrations of the
antibiotics and perturbation of FRET efficiencies in two E. coli strains.
Fig. S1 In vitro characterization of cdg-S1 and cdg-S2 and cellular localization and fluorescent
proteins.
Fig. S2 Perturbation of c-di-GMP levels in UTI89 E. coli cells by biofilm-dispersing agents as
reported by Cdg-S1 and Cdg-S2.
Fig. S3 Perturbation of c-di-GMP levels in UTI89 E. coli cells by subinhibitory concentration
antibiotics as reported by Cdg-S1 and Cdg-S2.
Fig. S4 Perturbation of c-di-GMP level in the UTI89 E. coli cells engulfed by macrophage as
reported by Cdg-S1 and Cdg-S2.
S2
Material and methods
Chemical and biological reagents
Top10 and BL21(DE3) E. coli cells were purchased from Invitrogen (Carlsbad, USA). The
wild type uropathogenic E. coli string UT189 was acquired as a gift from Drs. Liang Yang and
Kimberley Kline (Nanyang Technological University, Singapore). Cyclic di-GMP and cyclic di-
AMP were synthesized enzymatically in our laboratory. All the other chemicals, salt and buffer
were purchased from Sigma-Aldrich (Steinheim, USA), Fluka (Steinheim, USA), USB
(Cleveland, OH USA) and Merck (Darmstadt, Germany). All medium and ingredients were
purchased from Bacton and other commercial sources.
Gene cloning, protein expression and purification
The genes that encode MrkH, VCA0042 and several other c-di-GMP binding proteins were
cloned separately into the pET28 vector that harbors the mCerulean and mVenus genes. The
DNA sequences that contain several restriction sites were designed to allow the optimization of
the length of the linkers between the fluorescent protein genes and c-di-GMP binding protein
gene. The resulting plasmids were transformed into E. coli BL21 (DE3) for protein expression
and characterization. E. coli BL21(DE3) cells carrying the pET28 plasmids that harbor the
biosensor constructs were grown in 5 mL Lysogeny Broth (LB) medium supplemented with 50
mg/L of kanamycin at 37 OC, 180 rpm overnight to prepare seeding culture. The seeding culture
were then used to inoculate 800 mL of LB with 50 mg/L kanamycin; and the inoculated culture
was allowed to grow under similar conditions as above until OD600nm 0.6 ~ 0.8 Abs. The cultures
were then cooled to 16 OC, induced with 0.5 mM Isopropyl β-D-1-thiogalactopyranoside (IPTG)
and incubated at 16 OC, 160 rpm for 20 hours. Cells were harvested by centrifugation at 8,000
rpm for 10 minutes and re-suspended in 30 mL lysis buffer (50 mM NaH2PO4, 300 mM NaCl,
10% Glycerol and 1 mM dithiothreitol (DTT)). Cells were ruptured by passing the suspension
through the Emulsiflex C3 Homogenizer equipped with cooling coil (Avestin, Canada) five
times with a setting of 15 kPa. The lysate was then centrifuged at 20,000 rpm for 30 min (4 OC).
Supernatant was incubated with Sephadex nickel-nitrilotriacetic acid (Ni-NTA) beads for one
hour at 4 OC with gentle agitation before being loaded into a column. The beads were then
washed with lysis buffer with a step gradient of imidazole-containing buffer (0 mM, 20 mM and

S3
50 mM imidazole) and finally eluted with the elution buffer that contains 300 mM imidazole.
The purity of eluted fractions was checked using 12% denaturing SDS-PAGE. The eluted
fractions with the highest purity were pooled together and incubated with c-di-GMP
phosphodiesterase RocR (with 10 mM MgCl2) to remove the trace amount of c-di-GMP derived
from the E. coli host cells. The incubation was performed in Snakeskin dialysis tubing with
10,000 MWCO, dialyzing against normal lysis buffer at 4 OC overnight to allow the maturation
of mVenus. HPLC was employed to show that c-di-GMP bound to the biosensors was
completely hydrolyzed to 5’-pGpG and GMP. The proteins were then further purified using gel-
exclusion chromatography on an AKTA FPLC system equipped with a Superdex 200 HR 16/60
column (GE Healthcare). Pure protein fractions containing the unbound biosensor were then
concentrated for storage and fluorescent titration assays described below.
In vitro fluorescence titration
C-di-GMP was prepared by enzymatic method as described previously1. The purified FRET
biosensor proteins were titrated with c-di-GMP to determine the effect of c-di-GMP binding on
FRET efficiency and to determine the dissociation constants (Kd). Briefly, 250 nM of purified
biosensors were titrated with c-di-GMP (0 ~ 12.5 μM) in the 100 mM HEPES (pH 8.0) buffer.
Fluorescence was measured by using a TECAN Infinite 200 PRO multi-plate reader with
fluorescence measurement capabilities, with an excitation λ433 nm and scanning from 445 nm to
600 nm. The emission maxima of mCerulean and mVenus at 466 nm and 528 nm were
monitored and the titration curves were plotted using the value of relative changes in emission
ratio (Em528nm/Em466nm) against log [c-di-GMP]. The titration data were fitted to the one-site
binding equations as shown below (Eq. 1 and Eq. 2).
[c-di-GMP] = Kd . Q ((R-Rmin)/(Rmax-R)) (Eq. 1)
Where Q is the ratio of YFP/CFP emission and the lowest fluorescence emission (Rmin) and
maximum emission (Rmax) represents the YFP/CFP emission ratio of the ligand-bound to
unbound form.
Q = (P1 [c-di-GMP])/(Kd + [c-di-GMP]) + P2 (Eq. 2)
S4
Where Q is the ratio of YFP/CFP emission; P1 is the ratiometric change upon c-di-GMP binding;
P2 is the YFP/CFP ratio in the absence of c-di-GMP. Similar results (Kd values) were obtained
from the fitting to the two equations. To validate the specificity of the sensor, the sensors were
also titrated with a set of naturally occurring nucleotides at physiologically relevant
concentrations (Table S1). The concentrations of the nucleotides used were based on the
reported values2. From these experiments, Cdg-S1 and Cdg-S2 emerged as the best performers
with significant changes in FRET efficiency upon c-di-GMP binding and little interference from
other nucleotides.
Construction of the expression plasmids for the uropathogenic E. coli UTI89
The gene coding for Cdg-S2 was amplified by PCR by using the primers that contain XbaI
and PstI restriction sites. The gene coding for Cdg-S1 was amplified by PCR by using the
primers that contain XbaI and SmaI restriction sites. The amplified fragments were ligated into
pUCP18 plasmid for constitutive protein expression in the wild type E. coli UTI89 strain via the
PLac promoter3. This resulted pUCP18 plasmids that harbor the cdg-S1 gene (pUCP18-cdgS1)
and cdg-S2 gene (pUCP18-cdgS2).
Transformation of the uropathogenic E. coli UTI89
The plasmids obtained above were transformed into the electro-competent UTI89 E. coli cells
using 1.8 kV with a GenePulser Xcell (Biorad) and selected on LB agar plates with 100 mg/L
ampicillin. Positive transformants were picked and used to inoculate the LB medium
supplemented with 100 mg/L ampicillin for 20 hours at 37 OC. Prepared cells were transferred
onto 1% agarose pads on a 15 well Multitest microscope slide (MP Biomedical, USA). Cells
were then visualized using LSM510 Meta Confocal Microscope (Zeiss, Germany), using
excitation 430 nm and 514 nm to validate the presence of both fluorescent proteins.
Perturbation of c-di-GMP levels in E. coli by subinhibitory concentrations of antibiotics
BL21 E. coli cells that express Cdg-S1 or Cdg-S2 biosensor were grown in LB medium
supplemented with 50 mg/L kanamycin to about OD600nm 0.6 ~ 0.8 at 37 OC, 180 rpm before
being cooled down to 16 OC. Cultures were induced with 0.1 mM IPTG for 6 hours at 20
OC, 180

S5
rpm before the cells were suspended in a 10 diluted LB medium and incubated overnight at 4
OC with gentle rocking to allow mVenus maturation. Cell culture was then immediately changed
into fresh warm LB medium without antibiotic before being subjected to antibiotic treatment.
The biosensor-containing UTI89 E. coli cells were grown in LB medium supplemented with 100
mg/L of ampicillin to about OD600nm 0.2 ~ 0.3 at 37 OC before being resuspended in fresh LB
medium and allowed to grow at room temperature for 36 hours. Cells were subsequently
resuspended in fresh warm LB medium to reach an OD600nm of 0.6 ~ 0.8 by dilution before
antibiotic treatment.
The E. coli cells were treated with antibiotics of sub-minimal inhibitory concentrations as
indicated in Table S3. The individual antibiotics were added separately to cell cultures and
incubated at 37 OC for 30 minutes. The cells were fixed on agarose pads, before visualizing on
LSM510 Meta Confocal Microscope (Zeiss, Germany) using excitation wavelength of 430 nm
and observing the emission of cyan fluorescence at 466 nm and yellow fluorescence at 528 nm.
The FRET efficiency was measured through photobleaching of the acceptor fluorescent protein
mVenus using intense pulsing of 514 nm light. The recovery of cyan emission was recorded and
calculated using Equation 3 to determine the FRET efficiency.
E = (1- FDA / FD) 100 (Eq. 3)
Where E is the FRET efficiency (%), FDA is the cyan emission before mVenus photobleaching
and FD is the cyan emission after mVenus photobleaching. Each individual cell was only used
once for the measurement because of the damaging effect of the photobleaching on the
fluorescent proteins. The mean and standard deviations of each condition were obtained from the
measurement and averaging of multiple cells (n>10). For the time-dependent experiment, the
aminoglycoside antibiotic gentamicin, which is known to induce biofilm formation in E. coli and
other bacterial cells,4 was used to treat the E. coli cells to observe the response dynamics.
Photobleaching was conducted every five minutes (on different cells) upon the addition of
antibiotics to the cells. Measurements were repeated five times and the mean and standard
deviations were determined. Control experiments with the c-di-GMP binding VAC0042 and
MrkH fused to mVenus (or mCerulean) showed insignificant changes in fluorescent intensity
upon the treatment of the biofilm-dispersing compounds.
S6
Perturbation of C-di-GMP levels in E. coli by biofilm-dispersing agents
Using similar protocols as described above in the antibiotic stress experiment, several biofilm
dispersing compounds were tested for the perturbation of c-di-GMP levels in both the BL21 and
UTI89 E. coli cells. The identity and concentrations of the biofilm-dispersing compounds used in
this study are listed in Table S2. These compounds were chosen based on the reports that they
are able to disperse biofilm in E. coli and other bacterial strains 5,6
. Measurement of the FRET
efficiencies were performed following the same protocol described above.
Perturbation of c-di-GMP levels in E. coli during phagocytosis in RAW264.7 murine
macrophage
The RAW264.7 murine macrophage cells were cultured on petri dishes containing
Dulbecco’s Modified Eagle Medium (DMEM) containing high-glucose and sodium pyruvate
(Hyclone, cat. no. SH30243.FS) supplemented with 10% Foetal Bovine Serum (FBS) and 100
units / mL of Penicillin-Streptomycin in 37 OC with 5% CO2. Cells were harvested by scraping
upon reaching 70 ~ 80 % confluency, and washed twice in Phosphate Buffered Saline (PBS).
The cells were then resuspended into serum-free DMEM without antibiotic. The macrophage
cells were allowed to adhere to glass microscope coverslips by seeding the cells onto glass
coverslips submerged in DMEM without FBS and antibiotics in 6 well multi titer plates. The
cells were then incubated in 37 OC with 5 % CO2 for 3 hours before use.
Bacterial suspension of both E. coli BL21 and wild-type UTI89 strains were prepared as
described above. The cells were spun down at 8,000 rpm for 10 minutes and washed twice in
PBS. The E. coli cells were opsonized by resuspending in FBS, incubated at 37 OC for one hour
and subsequently washed twice with PBS, before finally resuspended in serum-free DMEM
without antibiotic7. The attached RAW264.7 cells were added with the bacterial mixture with a
ratio of 1:3 of macrophage cells to bacterial cells. The suspension was incubated for 1 ~ 2 hours
at 37 OC. Coverslips were then washed in cold PBS to remove excessive bacterial cells and to
stop further bacterial uptake or bacterial digestion by phagolysosome. The coverslips were fixed
onto a glass microscope slide and viewed over the LSM510 meta confocal microscope using
settings as described above.8 Bacterial cells engulfed by the macrophages were compared to free
swimming cells by tabulating the photobleaching profiles of more than 50 cells.

S7
Statistical analysis
Experimental FRET efficiencies were measured by observing the change in donor emission
(466 nm) upon acceptor photobleaching. The experimental results were presented as the mean or
average FRET efficiencies. Statistical analysis was performed by using SigmaPlot and GraphPad
software to calculate the P-values to determine the statistical significance of the observed
differences in FRET efficiencies. The results are indicated by the asterisks (*, P < 0.05; **, P <
0.01; ***, P < 0.001).
References:
(1) Rao, F.; Pasunooti, S.; Ng, Y.; Zhuo, W.; Lim, L.; Liu, A. W.; Liang, Z.-X. Anal.
Biochem. 2009, 389, 138.
(2) Bochner, B. R.; Ames, B. N. J. Biol. Chem. 1982, 257, 9759.
(3) Schweizer, H.; Hoang, T.; Propst, K.; Ornelas, H.; Karkhoff-Schweizer, R. In
Genetic Engineering: Principles and Methods; 2002; V 23, 69.
(4) Hoffman, L. R.; D'Argenio, D. A.; MacCoss, M. J.; Zhang, Z.; Jones, R. A.;
Miller, S. I. Nature 2005, 436, 1171.
(5) Lee, J.-H.; Cho, M. H.; Lee, J. Environ. Microbiol. 2011, 13, 62.
(6) Frei, R.; Breitbach, A. S.; Blackwell, H. E. Angew. Chem. Inter. Ed. 2012, 51,
5226.
(7) Wise, A. J.; Hogan, J. S.; Cannon, V. B.; Smith, K. L. J. Dairy Sci. 2002, 85,
1454.
(8) Doyle, S. E.; O'Connell, R. M.; Miranda, G. A.; Vaidya, S. A.; Chow, E. K.; Liu,
P. T.; Suzuki, S.; Suzuki, N.; Modlin, R. L.; Yeh, W.-C.; Lane, T. F.; Cheng, G. J. Exp. Med.
2004, 199, 81.
S8
Table S1 Test of the specificity of the biosensors by using the nucleotides from bacterial cells.
Nucleotide
Tested
concentration
Cdg-S1 biosensor Cdg-S2 biosensor
mVenus/mCerulean Ratio of
bound/unbound
mVenus/mCerulean Ratio of
bound/unbound unbound bound unbound bound
C-di-GMP 125 μM 1.56 ± 0.01 1.01 ± 0.02 0.65 1.38 ± 0.01 0.87 ± 0.01 0.63
cGMP 125 μM 1.56 ± 0.01 1.59 ± 0.02 0.98 1.38 ± 0.01 1.34 ± 0.01 0.97
GMP 10 μM 1.56 ± 0.01 1.58 ± 0.04 0.99 1.38 ± 0.01 1.34 ± 0.01 0.97
GDP 64 μM 1.56 ± 0.01 1.58 ± 0.02 1.01 1.38 ± 0.01 1.40 ± 0.02 1.01
GTP 460 μM 1.56 ± 0.01 1.53 ± 0.04 0.98 1.38 ± 0.01 1.36 ±0.03 0.99
C-di-AMP 125 μM 1.56 ± 0.01 1.55 ± 0.01 0.99 1.38 ± 0.01 1.39 ± 0.01 1.01
cAMP
125 μM 1.56 ± 0.01 1.60 ± 0.01 1.03 1.38 ± 0.01 1.33 ± 0.01 0.96
AMP
125 μM 1.56 ± 0.01 1.61 ± 0.05 1.03 1.38 ± 0.01 1.33 ± 0.02 0.96
ADP 125 μM 1.56 ± 0.01 1.54 ± 0.01 0.99 1.38 ± 0.01 1.36 ± 0.01 0.99
ATP 1 mM 1.56 ± 0.01 1.51 ± 0.02 0.97 1.38 ± 0.01 1.40 ± 0.01 1.01
NAD+
300 μM 1.56 ± 0.01 1.50 ± 0.02 0.96 1.38 ± 0.01 1.35 ± 0.02 0.98
NADP+
27 μM 1.56 ± 0.01 1.50 ± 0.03 0.96 1.38 ± 0.01 1.34 ± 0.03 0.97
Apo-state represents the relative changes in ratio emission of sensor protein (mVenus/mCerulean) before addition of the test
nucleotides.
Holo-state represents the relative changes in ratio emission of sensor protein after addition of the test nucleotides.
Ratio of Holo/Apo which is below 5 % changes are considered to be artifact

S9
Table S2. Experimental concentrations of the biofilm-dispersing compounds and perturbation of FRET efficiencies in two E.
coli strains.
Compound Class
Tested
concentration
BL21
FRET efficiency (%)
UTI89
FRET efficiency (%)
S1 ± s.d. S2 ± s.d S1 ± s.d. S2 ± s.d
Untreated - - 13.6 ± 2.4 16.5 ± 2.0 17.8 ± 0.8 18.2 ± 2.5
D-Tyrosine D – amino acid 7 μM 13.3 ± 1.8 17.2 ± 1.1 14.5 ± 3.4 14.4 ± 3.3
N-Hexanoyl-DL
homoserine lactone
AHL 25 μM 21.0 ± 0.9 22.9 ± 0.2 20.0 ± 4.8 21.2 ± 3.7
Resveratrol Stilbeniod 25 μM 21.3 ± 2.1 23.5 ± 0.3 21.0 ± 3.7 25.0 ± 4.2
3-Iodolylacetonitrile 2-Aminobenzimidazole 25 μM 23.0 ± 1.3 24.8 ± 1.2 23.3 ± 2.0 23.2 ± 1.6
MAHMA-NONOate NO donor 100 μM 21.6 ± 0.8 23.6 ± 0.6 22.8 ± 4.4 24.4± 3.5
AHL: N-Acyl homoserine lactone
NO: Nitric oxide

S10
Table S3. Minimal inhibition concentration (MIC), experimental concentrations of the antibiotics and perturbation of FRET
efficiencies in two E. coli strains.
Antibiotic Class
MIC 90%
(μg/mL)
Tested
concentration
(μg/mL)
BL21
FRET efficiency (%)
UTI89
FRET efficiency (%)
S1 ± s.d. S2 ± s.d S1 ± s.d S2 ± s.d
Untreated - - - 18.9 ± 2.3 19.4 ± 2.6 18.0 ± 2.5 18.2 ± 2.5
Gentamicin Aminoglycoside 8-10 3 2.3 ± 1.9 10.1 ± 2.9 7.8 ± 1.5 10.4 ± 4.4
Streptomycin 12-20 3 2.0 ± 1.7 10.1 ± 4.9 7.5 ± 1.7 12.2 ± 1.7
Tobramycin 16 3 8.0 ± 2.2 13.5 ± 0.6 8.8 ± 1.6 11.5 ± 1.6
Erythromycin Macrolide 8 0.6 2.2 ± 0.30 15.0 ± 1.0 8.6 ± 2.3 16.3 ± 4.8
Ampicillin Beta-lactam 8 5 7.2 ± 2.20 17.2 ± 2.0 12.8 ± 2.6 15.5 ± 1.7
Norfloxacin Quinolones 8 0.25 15.0 ± 0.3 18.6 ± 1.2 15.8 ± 2.1 17.5 ± 2.2
Mitomycin C Aziridine - 50 16.7 ± 1.3 18.1 ± 3.9 15.8 ± 2.6 16.9 ± 2.4
Vancomycin Glycopeptide 4 1 3.0 ± 0.02 3.6 ± 0.2 5.7 ± 1.8 6.4 ± 3.2

S11
Fig. S1. Polar localization of mCerulean, mVenus and Cdg-S2 in BL21 E. coli cells.
Both the CFP and YFP channels are shown. mVenus has a greater tendency to localize at
the poles than mCerulean.

S12
Fig. S2. Perturbation of c-di-GMP levels in UT189 E. coli cells by biofilm-dispersing
agents. a) Average FRET efficiencies for the E. coli-containing biosensors before and
after the treatment with biofilm-dispersing agents for 30 min. FRET efficiency was
measured by observ-ing the change in donor emission (466 nm) upon acceptor photo-
bleaching (see Supporting Information). Statistical significance is indi-cated by the
asterisk (*, P < 0.05; **, P < 0.01). Changes in FRET effi-ciency are directly correlated
to changes in the population of ligand binding biosensors and thus to c-di-GMP level. b)
Time-dependent change of the FRET efficiencies for 3-IAN-treated cells. c) Representa-
tive images of YFP (λ430 nm excitation, λ528 nm emission) prior to acceptor
photobleaching.
c)

S13
c)
Fig. S3. Perturbation of c-di-GMP levels in UT189 E. coli cells by subinhibitory
concentration antibiotics. a) Average FRET efficiencies for the E. coli-containing
biosensors before and after the treatment with antibiotics for 30 min. FRET efficiency
was measured by observing the change in donor emission (466 nm) upon acceptor
photobleaching (see Supporting Information). Statistical significance is indicated by the
asterisk (*, p < 0.05; **, P < 0.01). Data were obtained by averaging the readings for
multiple cells (n > 10). Changes in FRET ratio are directly correlated to changes in the
population of ligand binding biosensors and thus to c-di-GMP level. b) Time-dependent
change of the FRET efficiencies for gentamycin. c) Representative images of YFP (λ430
nm excitation, λ528 nm emission) prior to acceptor photobleaching.

S14
a)
Fig. S4. Perturbation of c-di-GMP level in the UT189 E. coli cells engulfed by
macrophage. a) Representative images of YFP (λ430 nm excitation, λ528 nm emission)
prior to acceptor photobleaching of the E. coli cells outside and inside of RAW264.7
macrophage cells. Side panels show the enlarged views of the bacterial cells. b) Average
FRET efficiencies for the E. coli cells outside and inside of the macrophage. Statistical
significance is indicated by the asterisk (***, P < 0.001). c) Histogram showing the FRET
efficiency distribution for cdgS2 in the free and macrophage-engulfed E. coli cells. (Total
number of cells are 50 (free) and 53 (engulfed))