Embed Size (px)
Citation preview
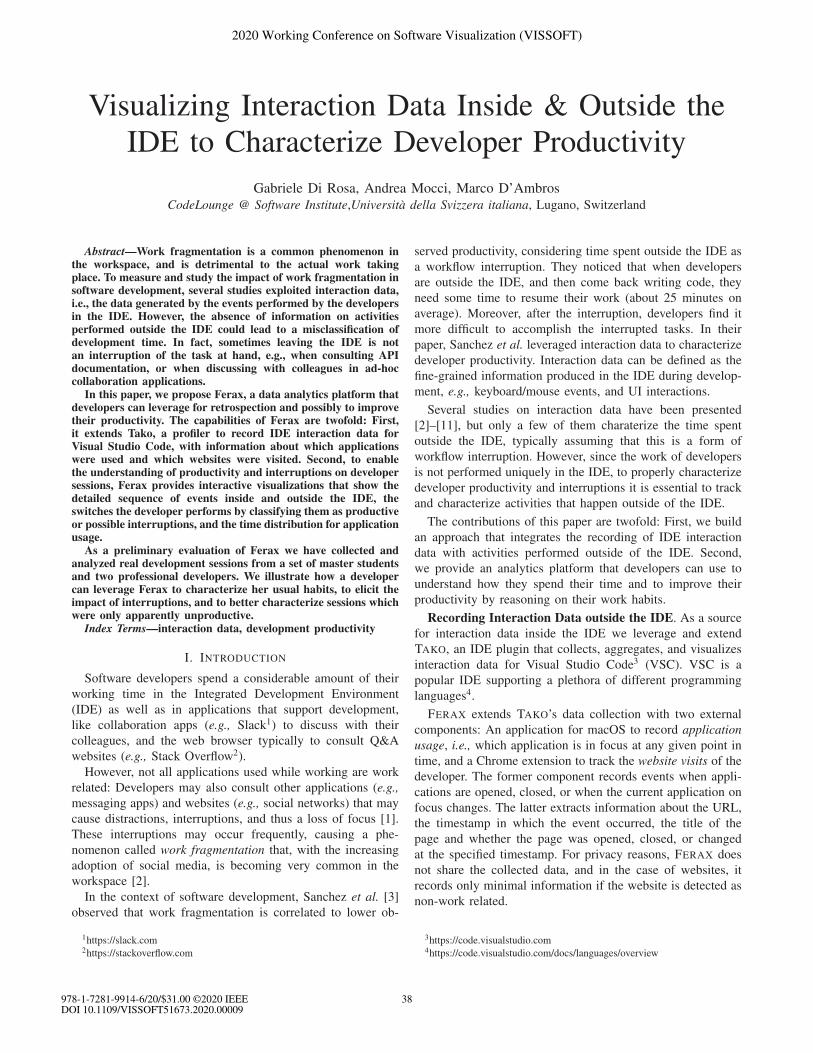
Visualizing Interaction Data Inside & Outside theIDE to Characterize Developer Productivity
Gabriele Di Rosa, Andrea Mocci, Marco D’AmbrosCodeLounge @ Software Institute,Universita della Svizzera italiana, Lugano, Switzerland
Abstract—Work fragmentation is a common phenomenon inthe workspace, and is detrimental to the actual work takingplace. To measure and study the impact of work fragmentation insoftware development, several studies exploited interaction data,i.e., the data generated by the events performed by the developersin the IDE. However, the absence of information on activitiesperformed outside the IDE could lead to a misclassification ofdevelopment time. In fact, sometimes leaving the IDE is notan interruption of the task at hand, e.g., when consulting APIdocumentation, or when discussing with colleagues in ad-hoccollaboration applications.
In this paper, we propose Ferax, a data analytics platform thatdevelopers can leverage for retrospection and possibly to improvetheir productivity. The capabilities of Ferax are twofold: First,it extends Tako, a profiler to record IDE interaction data forVisual Studio Code, with information about which applicationswere used and which websites were visited. Second, to enablethe understanding of productivity and interruptions on developersessions, Ferax provides interactive visualizations that show thedetailed sequence of events inside and outside the IDE, theswitches the developer performs by classifying them as productiveor possible interruptions, and the time distribution for applicationusage.
As a preliminary evaluation of Ferax we have collected andanalyzed real development sessions from a set of master studentsand two professional developers. We illustrate how a developercan leverage Ferax to characterize her usual habits, to elicit theimpact of interruptions, and to better characterize sessions whichwere only apparently unproductive.
Index Terms—interaction data, development productivity
I. INTRODUCTION
Software developers spend a considerable amount of their
working time in the Integrated Development Environment
(IDE) as well as in applications that support development,
like collaboration apps (e.g., Slack1) to discuss with their
colleagues, and the web browser typically to consult Q&A
websites (e.g., Stack Overflow2).
However, not all applications used while working are work
related: Developers may also consult other applications (e.g.,messaging apps) and websites (e.g., social networks) that may
cause distractions, interruptions, and thus a loss of focus [1].
These interruptions may occur frequently, causing a phe-
nomenon called work fragmentation that, with the increasing
adoption of social media, is becoming very common in the
workspace [2].
In the context of software development, Sanchez et al. [3]
observed that work fragmentation is correlated to lower ob-
1https://slack.com2https://stackoverflow.com
served productivity, considering time spent outside the IDE as
a workflow interruption. They noticed that when developers
are outside the IDE, and then come back writing code, they
need some time to resume their work (about 25 minutes on
average). Moreover, after the interruption, developers find it
more difficult to accomplish the interrupted tasks. In their
paper, Sanchez et al. leveraged interaction data to characterize
developer productivity. Interaction data can be defined as the
fine-grained information produced in the IDE during develop-
ment, e.g., keyboard/mouse events, and UI interactions.
Several studies on interaction data have been presented
[2]–[11], but only a few of them charaterize the time spent
outside the IDE, typically assuming that this is a form of
workflow interruption. However, since the work of developers
is not performed uniquely in the IDE, to properly characterize
developer productivity and interruptions it is essential to track
and characterize activities that happen outside of the IDE.
The contributions of this paper are twofold: First, we build
an approach that integrates the recording of IDE interaction
data with activities performed outside of the IDE. Second,
we provide an analytics platform that developers can use to
understand how they spend their time and to improve their
productivity by reasoning on their work habits.
Recording Interaction Data outside the IDE. As a source
for interaction data inside the IDE we leverage and extend
TAKO, an IDE plugin that collects, aggregates, and visualizes
interaction data for Visual Studio Code3 (VSC). VSC is a
popular IDE supporting a plethora of different programming
languages4.
FERAX extends TAKO’s data collection with two external
components: An application for macOS to record applicationusage, i.e., which application is in focus at any given point in
time, and a Chrome extension to track the website visits of the
developer. The former component records events when appli-
cations are opened, closed, or when the current application on
focus changes. The latter extracts information about the URL,
the timestamp in which the event occurred, the title of the
page and whether the page was opened, closed, or changed
at the specified timestamp. For privacy reasons, FERAX does
not share the collected data, and in the case of websites, it
records only minimal information if the website is detected as
non-work related.
3https://code.visualstudio.com4https://code.visualstudio.com/docs/languages/overview
38
2020 Working Conference on Software Visualization (VISSOFT)
978-1-7281-9914-6/20/$31.00 ©2020 IEEEDOI 10.1109/VISSOFT51673.2020.00009

Data Analytics Platform. Finally, FERAX provides a data
analytics platform for the recorded interaction data inside
and outside the IDE, allowing the developer to analyze their
sessions by means of interactive data visualizations. The
FERAX data analytics platform provides two main features:
• a global digest that helps developers reflect on how
they spend their time during the week, provides general
information about all collected sessions, and can be used
to understand which applications and website have the
larger impact on interruptions;
• single session visualizations that allow developers to
reflect on their productivity on a single recorded ses-
sion, e.g., by analyzing the most used applications and
websites, look at the detailed sequence of actions per-
formed inside and outside the IDE, and the most frequent
switches (moving from one app to another).
As a preliminary evaluation of our approach we show,
through a set of real sessions from developers, how FERAX
can help them to understand how they spend their time during
work and to give the developer a conscience over suboptimal
work habits.
Paper Structure. This paper is structured as follows. Sec-
tion II presents the related work concerning IDE interaction
data recording and time tracking tools for productivity. Sec-
tion III explores the components of the FERAX data recording
architecture. Section IV illustrates the FERAX data analytics
platform and its features. In Section V we perform a prelim-
inary evaluation of FERAX by illustrating a few development
stories coming from real development sessions. In Section VI
we conclude the paper and discuss future work.
II. RELATED WORK
In this section, we discuss approaches to track interaction
data as well as studies that leverage it.
Eclipse extensions. The pioneering research on interaction
data is the work by Murphy et al. [6], [12], [13] on MY-
LYN. MYLYN is a plug-in for the Eclipse IDE that records
interaction data to compute the degree-of-interest (DOI) of
all program entities the developer interacts with. Gu et al.developed IDE++, a plugin for Eclipse [14]. IDE++ is also
an extension of MYLYN that captures at a finer level of
granularity interactions. Kobayashi et al. developed PLOG, an
Eclipse plug-in for capturing interaction histories [15]. PLOG
can capture developers’ interactions at two levels of granularity
in Java programs, the file level and the method level, by
listening to various IDE events. All these approaches, though,
focus on interaction data inside the IDE, while FERAX focuses
on data outside the IDE as well.
DFLOW. DFLOW is an interaction data profiler for Pharo5,
a pure object-oriented programming language and a devel-
opment environment. The model of development activities
used in DFLOW consideers navigation events, edit events,
inspection events, and UI events. Interaction data recorded
by DFLOW has been used in many subsequent studies, e.g.,
5http://pharo.org
to visualize development sessions [11], or to visualize the
working set of developers [8], i.e., the group of program
entities (e.g., methods, classes) which a developer has in-
teracted with during a particular period of time. In another
work, Minelli et al. leveraged interaction data to understand
how developers spend their time [10]. The authors found
that the dominant activity is program understanding, which
amounts to 70% of development time on average. Finally,
DFLOW’s interaction data was also leveraged to charaterize
a phenomenon called window plague [16], proposing several
metrics to characterize and quantify the “level of chaos” for
the UI of Pharo [17]. TAKO, the interaction data profiler we
leverage in this paper, is the result of an ongoing technology
transfer effort to port the expertise of DFLOW into the VSC
IDE. TAKO collects fine-grained raw interaction data for VSC,
aggregates it, and provides a set of interactive visualizations
of the data to help developers reflect about their development
sessions. Both DFLOW and TAKO can recognize time spent
outside the IDE, but they do not characterize it like FERAX
by collecting application focus and website visits.
Usage patterns. Damevski et al. proposed a technique that
leverages Hidden Markov Models (HMMs) as a means of
mining high-level developer behavior from low-level IDE in-
teraction traces of many developers in the field [5]. The authors
also recorded and studied interaction data inside the Visual
Studio6 IDE to extract usage patterns (or sequences) [18].
Again, the main difference between their approach and FERAX
is that we support data collection outside the IDE.
FeedBaG. FeedBaG is an extension for Visual Studio that
tracks developers’ interactions with the IDE [19], [20]. It
records such interactions through ReSharper 7, a widely used
Visual Studio extension. FeedBag is a plugin that generates
interaction events and allows users to manage them, but does
not collect data outside the IDE, like FERAX.
ActivitySpace. Bao et al. devised ActivitySpace [21], an
approach to support the inter-application information needs in
software development. It consists of an infrastructure to track
the actions of a developer in the entire working environment
using operating-system windows and accessibility APIs [7].
ActivitySpace can collect the developer interactions with many
commonly used desktop and web applications in software de-
velopment, such as IDEs, web browsers, and text editors (e.g.,Notepad). Bao et al. try to reveal the developer’s intention
and activities by examining the surrounding actions before
and after an individual action. They also collect interaction
data on the commonly used desktop and web applications
(e.g., click events, the current working window information
and the current focused UI information) using Windows as
operating system. The main difference between FERAX and
ActivitySpace is that the former supports macOS, leverages
more detailed information on events occurring in the IDE, and
focuses on visual analytics regarding developers productivity.
6https://visualstudio.microsoft.com7https://www.jetbrains.com/resharper/
39

III. RECORDING INTERACTION DATA OUTSIDE THE IDE
In this section we discuss the FERAX approacch to record
interaction data outside the IDE. Section III-A introduces the
terminology used in FERAX. Section III-B details TAKO, the
profiler we leverage for interaction data inside the IDE, while
Section III-C presents the FERAX data recording architecture.
A. Terminology
We distinguish three categories of applications according to
productivity:
• productive applications are the ones related to develop-
ment and collaboration, e.g., VSC, Terminal, and Slack.
• non-productive applications are the ones that may cause
possible interruptions, e.g., WhatsApp, and Telegram.
• uncertain applications are applications that are difficult to
classify as productive or non-productive, e.g., other web
browsers (like Safari), Finder, and Calendar.
The purpose classification considers the purpose of the
application:
• Programming Apps are applications related to the pro-
gramming session, e.g., VSC, and Atom.
• Collaboration App are messaging applications related
to the productivity used normally in work settings -
since they are often hosted or managed by the employer
company, e.g., Microsoft Teams, and Slack.
• Social network App are distractive applications related to
socials, e.g., WhatsApp, and Telegram.
• Utility App are general purpose applications, e.g., Finder,
and Archive Utility.
• Browser App are applications that developers uses for
consulting websites, e.g., Google Chrome, and Safari.
• Other App are all the remaining, unclassified apps.
We classify websites as follows:
• productive websites are the websites related to the pro-
gramming session, e.g., Github and Stackoverflow.
• distractive websites are the websites that may interrupt
the task, e.g., Facebook and Twitter.
We define as chunk a piece of work time spent in a
single application or in a website. A chunk starts when the
application (or a website) goes on focus and ends when the
application (respectively, a website) stops being on focus.
We define as switch a change of the application or website
in focus. We classify switches as follows:
• A productive switch is a switch to a productive application
or website.
• An uncertain switch is a switch to an uncertain applica-
tion.
• A possible interruption switch is a switch to a non-
productive application, e.g., social network, or a distrac-
tive website.
For the time spent inside the IDE, we adopt the simplified
model by Sanchez et al. [3] distinguishing just edits, i.e., when
developers perform a sequence of keystrokes in a document,
and non-edits, i.e., all the other activities, like navigations and
selections.
B. Tako
TAKO is an IDE extension for VSC that collects and aggre-
gates fine-grained interaction data by recording the Language
Server Protocol (LSP) messages. LSP8 provides a uniform
API to support common IDE features like autocomplete, goto
definition, document symbols, or documentation on hover for
a given programming language. While traditionally the work
for each of these features must be repeated for each IDE
or development tool, implementing a language client/server
pair with LSP, automatically gives support for those language
features in a moltitude of IDEs, in particular VSC. In other
words, the purpose of a Language Server adhering to LSP is
to provide the language-specific features inside a server that
can communicate with the IDE over a standardized protocol.
At the current state, TAKO can record all messages ex-
changed in the LSP in both directions, i.e., the requests sent
from the language client to the server and the responses
sent from the server to the client. By recording LSP events,
TAKO supports any language supported by VSC for which
a language server exists, and for each of these languages,
it can record significant events related to specific groups of
features supported by LSP, like text synchronizations features
(e.g., save events), diagnostics (e.g., compilation problems
or linting errors), and programming language features (e.g.,refactorings).
While some of these features look relatively high-level,
some development activities still need to be extracted from the
LSP events, e.g., navigations and grouped edits. TAKO saves
the collected data into sessions.
TAKO does not collect any interaction data happening
outside the IDE. The goal of FERAX is to build an approach
to collect also data outside the IDE and integrate it with the
data collected by TAKO. To record activities happening outside
the IDE we built a pair of external applications that capture
information about website visits and the application focus.
C. Interaction Data Recording
Figure 1 presents the FERAX data recording architecture.
Fig. 1. FERAX data recording architecture
8https://microsoft.github.io/language-server-protocol/overviews/lsp/overview/
40

The FERAX data recording architecture is composed of
three components, which communicate through a WebSocket:
(1) TAKO to record interaction data inside the IDE, (2) the Ap-
plication Focus Recorder, and (3) the Website Visits Recorder.
Application Focus Recorder. The application focus
recorder component of FERAX is an application for the macOS
operating system. It records the application in focus and
sends the recorded data to TAKO. The application works as
an observer that looks for application focus changes. When
there is a switch from an application to another, the observer
is notified, produces the data to be sent to the server, and
forwards it. To get information about the running application
we use the dedicated API of NSRunningApplication9.
The macOS application registers the application state
change, and for each state change it generates one or
more change of focus events (didChangeAppWindowFocus).
Those events are then sent to TAKO through the Web-
Socket. Each event has the following structure: i) a type (i.e.,didChangeAppWindowFocus); ii) the application name; iii) a
focus, i.e., a flag to express if the focus is acquired or lost;
iv) and a timestamp.
Website Visits Recorder. The website visit recorder is
packaged as a Google Chrome Extension. As we discussed
in Section III-A, we can distinguish two websites categories:
productive websites and distractive websites.
The extension assumes a conservative default list of produc-
tive domain websites, i.e., a list that contains only websites
related to software development, and that can be customized.
It includes domains like stackoverflow.com and github.com.
The core of the extension manages communication with
TAKO, and generates events about website visit changes
by leveraging the Chrome tabs10 and windows API11.
Through those APIs, the core registers the tabs/windows
state change, and for each state change it generates one or
more didChangeBrowserTabURL events, that are then sent to
TAKO through the WebSocket. Each event has the following
structure: i) a type (i.e., didChangeBrowserTabURL); ii) a
URL, i.e., the full URL if the visited website is a productive
website, the domain otherwise; iii) a timestamp; iv) a focus
flag; v) a title, i.e., the page title, only for productive websites.
The extension generates such events when the following
window/tab events happen:
• Active tab change/Tab URL update: fired when the
selected tab in a Chrome window changes, or when the
current tab URL changes; the extension generates a pair
of events, one corresponding to the loss of focus on the
old tab/site, and one to the focus on the new tab/site.
• Window close/change: fired when a Chrome window
is closed or changed; in the former case, the extension
generates only a loss of focus event; in the latter, the
extension generates a new event representing a focus on
the URL of the active tab of the window on focus.
9https://developer.apple.com/documentation/appkit/nsrunningapplication10https://developer.chrome.com/extensions/tabs11https://developer.chrome.com/extensions/windows
IV. THE FERAX DATA ANALYTICS PLATFORM
The core component of FERAX is the data analytics plat-
form, which can be used to inspect developer sessions by
means of interactive visualizations. The platform is composed
of a component that processes the session data and injects it in
a database (Section IV-A), and a web application that provides
the visualizations (Section IV-B).
A. Data Processing
The first step to extract the activities and inject them in a
database is to parse the collected data. To perform this step
we devised a parser. The parser takes a session folder as input,
as produced by Tako, processes all the files contained in the
folder to extract the activities, and injects them in a NOSQL
database.
The essential task of the data processing component is to
parse the collected interaction data to extract activities. To
extract an activity, the parser merges two or more different
events, e.g., it merges the opening event of a website with the
closing event of the same website to create a Browser activity.
Each activity is composed of:
• session_id is an id for the current session.
• start is the timestamp that indicates the start of the
activity.
• end is the timestamp that indicates the end of the activity.
• origin_type indicates the application where the event
is recorded: App Focus for the recording app focus
application, Browser for the recording website visits
application, or IDE for Visual Studio Code.
• resource indicates the resource involved in the activity
(see Section III-A)
If the origin type is “Browser”, there are two possible
resources: Productive WebSite and Distracting WebSite. The
distinction between these two categories is made by a default
Productive WebSites list which provides a list of commonly
used websites related to coding. The Productive WebSites
list is customizable, all websites that are not present in
this list are intended as possible interruptions. If the ori-
gin type is “IDE”, there are two possible resources: Edit and
Non Edit. Since each digit produces an Edit event, according
to Sanchez et al. [3] the Edits can be aggregated if the distance
between the performed digits is below 1 second (Massive
Event) and the Edits belong to different documents. The
NonEdit events (e.g., navigations) can be aggregated if the
distance between the performed non-edit events is below 1
second. If the origin type is “App Focus”, there are more
possible purposes : Programming App, Collaboration App,
Social network App, Utility App, Browser App and Other App.
There are others fields that are intended only for specific
activities. For example, the “Edit” resource contains a text
field where the written text is stored and a document path
where the edit has been performed, and the “Browser” session
contains a website field where the entire URL (for documenta-
tion websites/Productive WebSite) or the hostname (for other
websites/Distractive Website) is stored.
41

Fig. 2. The Global Digest
B. Visual Analytics
The last component of FERAX is the frontend, that enables
users to inspect their sessions and reason about how they
spent working time through visual analytics. FERAX offers
four views:
• Global Digest offers a general view of the collected data;
• Digest provides general information of a single session;
• Timeline shows where the time was spent during working
hours;
• Chord Diagram provides a visualization to focus on
possible interruptions.
Global Digest
The first panel is the global digest, where developers can
inspect a set of collected sessions to get general information
about their working habits. The data in the global digest can
be complete, or can focus on the sessions belonging to the
last week or last month.
Figure 2 shows an example of the Global Digest panel,
composed of a summary table (1), chunk distribution (2), most
used apps duration (3), most used apps count (4), most visited
websites duration (5), most visited websites count (6) and
weekly app usage (7).
The summary table lists basic statistics like the sum of
all session durations, the number of save events in the IDE,
the number of switches between applications and average of
switches per hour, the number of edited documents and num-
ber of visited websites. From the specific digest in Figure 2,
we can notice that the developer tends to perform a lot of
saves in the IDE and he tends to change application focus
very frequently (almost 1 switch per minute).
The first chart is the chunk distribution visualization, where
it is possible to inspect the distribution of the chunks in custom
ranges according to their duration. In this chart, we group
the chunks into buckets according to their duration. During a
preliminary assessment of the chunk duration distribution, we
observed that those distributions were often long tailed when
using buckets of uniform duration. Instead, we preferred to use
nonlinear, custom duration ranges for the buckets that are easy
to understand by the user, and that likely capture meaningful
behaviors. For example, very short chunks (< 1s) are likely
to be mistakes (during alt-tab switches), while chunks greater
than 15 minutes are likely to be highly focused periods in
a single application. When hovering on the chart, the tooltip
shows the selected chunk app category, the range it belongs
to, and depending on the selected aggregation shows the
switches count or their cumulative duration. Figure 3 presents
an example of chunk distribution chart by count.
Fig. 3. Chunk distribution by count in the Global Digest
This chart groups the numbers of chunks belonging to a
category for each range. From this specific chart we notice
that most of the chunks are less than 1 minute long and the
most frequent ones are the chunks lasting between 10 seconds
and 1 minute.
42

Figure 4 presents the chunk distribution chart by duration.
Fig. 4. Chunk distribution by duration in the Global Digest
In this chart we sum the duration of the chunks instead of
their count. Differently from the previous chart, here we can
see that the developer spent most of the time in chunks lasting
between 1 and 5 minutes. We can also notice that most of the
time is spent in a Programming app and in the Browser.
The second group of charts (see Figure 5) is composed
of two bar charts showing the most used apps purposes,
considering either the chunk duration or the chunks count.
Fig. 5. App usage charts in Global Digest
From these specific charts, we can see that most of the
time spent by the developer was in programming applications
while the second most-used app purpose is Browser app. Since
it is difficult to understand if the time spent in the browser is
instrumental to the task at hand or not, there is a third group of
charts that helps developers understand how they spend time
in the browser. Figure 6 shows the time spent in distracting
websites and the top-4 most visited productive websites.
Fig. 6. Visited websites among the selected sessions
After analyzing the 4 graphs we can understand that the
developer has used a lot the IDE and that the most visited
website was an internal instance of Gitlab. We can also see
that the developer often consults distracting websites, but the
chunks are usually short.
The last chart of the Global Digest is the weekly app usage
chart that shows the application usage distributed over the
weekdays. As in the other bar charts, the developer can switch
between chunk count and chunk duration. When hovering on
the data, the tooltip shows the selected app category, the day
and depending on the selected aggregation shows the switches
count or the app duration. Figure 7 show an example of app
usage distribution divided into weekdays.
Fig. 7. Weekly app usage by duration charts in the Global Digest
From these graphs we can see that the developer spent most
of the time in programming apps and that most of the recorded
development was done on Friday.
Single Session Digest
The Digest allows the developer to get detailed information
about a specific session, like summary information about the
session, how they spend the time in applications, and the most
visited websites. The views of the single session Digest are the
same as the Global Digest except for the weekly app usage
chart that is not present since we are considering only one
session. Figure 8 shows an example of a Session Digest panel.
In this session we can see that the developer worked on six
different files of a project called Stormed, the session lasted 4
hours and 16 minutes, and comparing this session with the
Global Digest we can see that the number of switches is
lower than the average, the number of visited websites (5) is
low and the time spent on the Browser is almost completely
in productive websites. It is important to see the distinction
between chunk counts and duration. These chart show that the
chunks lasting above a minute are almost all in programming
apps and that chunks lasting below a minute have limited
impact. Moreover, from the most used apps chart come out that
there is an absolute dominance of programming applications
over all the others apps. What we can conclude after inspected
this session Digest is that the selected session was a productive
and focused session.
Timeline
The goal of the timeline panel is to allow developers to
inspect the exact sequence of activities happened during a
work session. Figure 9 shows the graphical interface of the
Timeline panel, that is composed of three separated timelines
for the App Focus, the IDE and the Browser.
The App Focus timeline shows the sequence of application
chunks. The color scheme we use for the apps are the same
as the ones used in the digests, the only difference is that
we set the VSC color to white instead of the green as the
Programming App category since the time spent in VSC is
implicitly evident and detailed from the IDE timeline above.
43

Fig. 8. The Digest panel for a single Development Session
Fig. 9. The graphical interface of the Timeline panel
By hovering a chunk, the tooltip shows details on the used
app and the exact time the chunk started and ended.
The IDE timeline shows how developer spent the time inside
the IDE. In their paper, Sanchez et al. leveraged the edit
ratio [3], i.e., the ratio of the number of edits over the total
number of events, as an indicator of productivity. We decided
to use the Sanchez et al. model to decompose the activities
happening inside the IDE in two different categories: NonEdits
and Edits, aggregated as discussed in Section IV-A. When
hovering on an edit activity, the tooltip shows the time in
which it occurred, the number of edited characters, the start,
the end, and the document where the edit is performed.
The last slot of the timeline pertains to the browser. We can
distinguish two different types of website visits: Productive
websites and Distractive websites (see Section III-A). To pro-
duce the result, we use a custom dictionary (customizable in
the settings) to distinguish Productive and Distractive websites.
We inspect the hostname of the visited websites to distinguish
if it is a productive website or not. Examples of productive
websites in the default list include stackoverflow.com, ora-
cle.com, spring.io, and developer.apple.com.
In the considered session timeline, we can notice that the
developer spent most of the time in VSC. The beginning of
the session is time spent in program comprehension while the
second part of the session was dedicated to writing, with a high
edit ratio. The last part of the session was spent in practice
only in Collaboration Apps and in the Browser, and we can
see that the edits are absent.
44

Chord Diagram
Figure 10 shows the last panel type in FERAX, i.e., a Chord
diagram that shows the switches between apps and websites
to find instances of possible interruptions.
Fig. 10. The Chord panel focusing on a Productive switch
To categorize a switch we define two different application
lists: Productive applications, depicted in blue, and uncertain
applications, depicted in yellow (see section Section III-A
for terminology). The productive applications include typical
programming and collaboration apps. The uncertain applica-
tions include, instead, the web browsers we do not track, like
Safari, and applications like Finder. We also filter switches
to very short chunks, because they are likely mistakes. All
the other applications, like social networks, are deemed as
non-productive, and depicted in red. A similar classification is
used for websites. The target application category determines
the type of switch. A Productive switch (depicted in blue)
is a switch from an application to a productive application
or a productive website. Figure 10 also presents an example
of productive switch. In the tooltip the developer can inspect
how many times she switched from the origin application to
the target productive application (VSC). An uncertain switch,
depicted in yellow, is a switch to an uncertain application. A
possible interruption switch is a switch to a non-productive
application, like a social network. These are the most interest-
ing switches since they represent the possible interruptions to
avoid. Figure 11 presents an example of a possible interruption
switch. In the tooltip we can inspect how many times we
switched from the selected application to the selected possible
interruption application.
C. Limitations and Threats
The first threat concerns the classification of visited web-
sites. In fact, the productive websites are defined in a custom
list, and it is impossible for this list to cover all the domains of
productive websites. For example, the list may not contain the
documentation website for a novel framework, and classify
it as non-productive website. A similar limitation involves
Fig. 11. An example of possible interruption switch
the classification of applications. Moreover, classifications
are static and do not depend on the context. For example,
messaging apps can be used for collaboration with other
developers. We plan to allow developers to customize clas-
sifications globally or per single session. Another limitation
concerns the actual developer activity outside the IDE. At
the moment, FERAX detects only the focus, and cannot detect
when the developer is idle. FERAX has also the limitation that
it records interaction data only on the computer, and not in
additional devices like the smartphone, that can be a source of
distractions. Finally, another limitation is that FERAX supports
only Google Chrome as a browser and macOS as an operating
system to track interaction data outside the IDE.
V. PRELIMINARY EVALUATION
We present a preliminary evaluation of FERAX through a set
of interesting sessions. Section V-A explains the methodology
we used to interpret the sessions. Section V-B presents a fo-
cused session, Section V-C presents a documentation session,
and Section V-D shows the impact of long interruptions.
A. Methodology
We distributed TAKO and FERAX to a group of volunteers
composed of 4 master students12 and 2 professional develop-
ers13. All participants were instructed beforehand on what kind
of data was being collected, and they were not instructed to
perform any specific development task, but just to use the tools
during their normal work. We collected a total of 20 sessions,
and then we filtered out the ones with fewer events happening
outside the IDE. We analyzed the remaining 12 sessions, and
for space reasons, we only report 3 of them in detail. For
each session we firstly analyzed the single session digest to
inspect general information about the session. Secondly, we
inspected the Timeline to investigate the sequence of activities.
12Students of the Master in Software and Data Engineering at USI13Professional developers with at least 3 years of experience from Code-
Lounge, a center for software R&D, part of the Software Institute at USI.
45

Thirdly, we analyzed the Chord diagram to find instances of
possible interruptions. Finally, we presented our impressions
to the developer to discuss and confirm the findings.
B. A Focused session
We discuss how a highly focused session appears in FERAX.
Figure 12 shows the chunk distribution by duration chart for
that session; we see that the vast majority of time was spent in
longer than 1 minute chunks, and the majority in longer than
5 minutes chunks.
Fig. 12. Chunk distribution aggregated by duration of a focused session
A small amount of time is spent in collaboration apps, but
by looking at the count, it seems that the developer frequently
uses them but for a short time. There is also a considerable
amount of time spent in the browser. To classify the time spent
in the browser we inspect the most visited websites chart,
where we can see that the majority of the time is spent in a
productive website. Most of the time was spent in IDE and the
timeline can shed light into how that time was spent (Figure 9).
The timeline shows that the first part of the session (before
17:00) could be a setup phase where the developer spent her
time in program comprehension since in this phase there is
a majority of NonEdit events. In a second phase (between
17:15 and 18:15) the number of edits increases. In the IDE
category there are gaps without any performed event (white
areas in the IDE category when VSC on focus). A possible
interpretation of these gaps is that the developer was collecting
her thoughts. We conclude the analysis of the session with the
chord diagram, to inspect the switches between application
and the amount of potential interruptions (Figure 13).
Fig. 13. Chord diagram of a focused session
This chart shows that the number of potential interruptions
was relatively low. We showed the graphs to the developer and
explained our interpretation, confirming that this was a very
focused session with few distractions.
C. A Documentation session
The chunk distribution in the session digest reports that the
average time spent in a chunk is below 5 minutes, and by
inspecting the most used apps chart and the chunk distribution
aggregated by duration (Figure 14) we can see that most of
the time was spent in the browser.
Fig. 14. Documentation session: chunk distribution by duration
The session information shows that the number of edited
documents in the IDE is 1, that there is a high number of
switches between applications (93, almost twice as much as
the average over all the sessions), a low number of visited
websites, and that most of the time was spent on productive
websites, with Gitlab being by far the most visited one.
This can be explained by continuous back and forth switches
between the IDE and Gitlab, where the project documentation
resides. We confirm this hypothesis by looking at the timeline
where we can see the detailed app usage over time (Figure 15).
Fig. 15. Timeline of a documentation session
The edit ratio is almost 0, and if we inspect each IDE
activity we can see that there are multiple visited source
files. We explained our interpretation to the developer, and
he confirmed that while the edit ratio was relatively low, this
was a productive session (despite low edit ratio) dedicated to
writing documentation on Gitlab.
D. Impact of long interruptions
For this session, the most used apps chart shows that the
developer spent the majority of his time in programming
applications. The second most used apps category is social
networks, that could be source of interruptions. In the chunk
distribution aggregated by duration (Figure 16) we can see that
more than 15 minutes were spent in a social network app.
46

Fig. 16. Chunk distribution by duration of a session with long interruptions
This long interruption may impact the developer produc-
tivity when resuming work. To inspect such an impact we
analyzed the Timeline, shown in Figure 17.
Fig. 17. Timeline of a session with long interruptions
The Timeline shows that the first part of the session has a
high edit ratio. After a focus in the IDE, there is a prolunged
interruption (≥ 15 minutes). We can see the impact of the
interruption in the activities that follows it: the performed edits
within 45 minutes from the interruption are minimal. This is
compatible with the findings of Sanchez et al. [3].
Figure 18 presents the Chord diagram of this session.
Fig. 18. Chord diagram of a session with long interruptions
The Chord diagram shows that there is a significant number
of edges from VSC to WhatsApp, representing possible inter-
ruptions. We showed the graphs to the developer and explained
our interpretation; she was surprised on how much a single
prolunged interruption impacted the session. The developer
did not expect that the edit ratio after the long interruption
was this low.
Wrapping up. FERAX offers developers an approach to
reflect about their work habits and the possibility to inspect
the time spent both inside and outside the IDE. We have shown
the importance of capturing information from outside the IDE
to have a more comprehensive and integrated view of the
activities, since development tasks are not performed uniquely
in the IDE. However, the preliminary analysis we presented in
this section provides only anecdotal evidence of the benefits
of FERAX. With a more extensive study, a catalog of patterns
and anti-patterns could be defined.
VI. CONCLUSION
We presented FERAX, an approach to integrate IDE inter-
action data with information on activities performed outside
of the IDE and to support retrospective visual analytics by
developers. FERAX provides two separate components that
record application usage on macOS, and website visits on
Google Chrome. It also leverages an existing interaction data
profiler for visual studio code called TAKO. FERAX provides
a data analytics platform for the recorded interaction data
inside and outside the IDE, allowing the developers to analyze
their sessions by means of interactive data visualizations.
FERAX provides 4 views: the Global Digest, which offers
a summary of the collected sessions, the Session Digest,which summarizes a single session, the Timeline, which shows
the detailed sequence of activities over time, and the Chorddiagram, which focuses on switches and may capture possible
interruptions. As a preliminary evaluation, we distributed the
tools to a group of volunteers composed of master students
and professional developers, finding occurrences of interesting
developer behaviors. For example, we presented a relevant
example of the importance of analyzing activities performed
outside the IDE in a documentation session. If we had no
data recorded outside of the IDE, this session would have
been categorized as non-productive. In addition, we observed
the impact of a long interruption on the edit ratio, a common
proxy for productivity [3]. The presented examples showed
anecdotal evidence on how the recording of interaction data
both inside and outside the IDE provides a more complete
context to reason on productivity and interruptions.
Future Work. The work presented in this paper can be
improved and extended in multiple ways. We identified the
following directions for possible future work. The first direc-
tion is about broadening the supported software, like other
operating systems (e.g., Windows and Linux) and browsers
(e.g., Safari and Mozilla). The second direction concerns the
session analysis: we plan to add more metrics and to define
a catalog of common patterns and anti-patterns, find them
automatically and alert developers when some anti-patterns
occur. The third direction is about a more comprehensive
usage coverage e.g., record interaction data on the phone, and
enhance the data collected in external applications to know if
the developer is idle.
Acknowledgements. This work has been partially funded
by the Swiss National Science Foundation under the SPARK
project No. 190305.
47

REFERENCES
[1] G. Mark, V. Gonzalez, and J. Harris, “No task left behind? examiningthe nature of fragmented work,” vol. 2005, 01 2005, pp. 321–330.
[2] V. M. Gonzalez and G. Mark, ““constant, constant, multi-taskingcraziness”: Managing multiple working spheres,” in Proceedings of theSIGCHI Conference on Human Factors in Computing Systems, ser. CHI’04. New York, NY, USA: Association for Computing Machinery, 2004,p. 113–120. [Online]. Available: https://doi.org/10.1145/985692.985707
[3] H. Sanchez, R. Robbes, and V. M. Gonzalez, “An empirical studyof work fragmentation in software evolution tasks,” in 2015 IEEE22nd International Conference on Software Analysis, Evolution, andReengineering (SANER), March 2015, pp. 251–260.
[4] R. Minelli, “Interaction-aware development environments,” Ph.D. dis-sertation, Universita della Svizzera italiana (USI), 11 2017.
[5] K. Damevski, H. Chen, D. Shepherd, and L. Pollock, “Interactiveexploration of developer interaction traces using a hidden markovmodel,” in Proceedings of the 13th International Conference onMining Software Repositories, ser. MSR ’16. New York, NY, USA:Association for Computing Machinery, 2016, p. 126–136. [Online].Available: https://doi.org/10.1145/2901739.2901741
[6] G. C. Murphy, M. Kersten, and L. Findlater, “How are java softwaredevelopers using the elipse ide?” IEEE Software, vol. 23, no. 4, pp.76–83, 2006.
[7] L. Bao, Z. Xing, X. Xia, D. Lo, and A. E. Hassan, “Inferenceof development activities from interaction with uninstrumentedapplications,” in Proceedings of the 40th International Conferenceon Software Engineering, ser. ICSE ’18. New York, NY, USA:Association for Computing Machinery, 2018, p. 897. [Online].Available: https://doi.org/10.1145/3180155.3182537
[8] M. L. Roberto Minelli, Andrea Mocci, “Visualizing the evolution ofworking sets,” in Proceedings of VISSOFT 2016 (4th IEEE WorkingConference on Software Visualization), 2016.
[9] Kersten, Mik, Murphy, and G. C., “Mylar: A degree-of-interest modelfor ides,” in Proceedings of the 4th International Conference onAspect-Oriented Software Development, ser. AOSD ’05. New York,NY, USA: Association for Computing Machinery, 2005, p. 159–168.[Online]. Available: https://doi.org/10.1145/1052898.1052912
[10] R. Minelli, A. Mocci, and M. Lanza, “I know what you did lastsummer – an investigation of how developers spend their time,” inProceedings of ICPC 2015 (23rd IEEE International Conference onProgram Comprehension), 2015, pp. 25–35.
[11] R. Minelli, A. Mocci, M. Lanza, and L. Baracchi, “Visualizing Devel-oper Interactions,” in Proceedings of VISSOFT 2014 (2nd IEEE WorkingConference on Software Visualization). IEEE, 2014, pp. 147–156.
[12] M. Kersten and G. C. Murphy, “Mylar: A Degree-of-Interest Model forIDEs,” in Proceedings of AOSD 2005 (4th International Conference onAspect-Oriented Software Development. ACM, 2005, pp. 159–168.
[13] ——, “Using Task Context to Improve Programmer Productivity,” inProceedings of FSE 2006 (14th ACM SIGSOFT International Sympo-sium on Foundations of Software Engineering). ACM, 2006, pp. 1–11.
[14] Z. Gu, D. Schleck, E. T. Barr, and Z. Su, “Capturing and exploiting ideinteractions,” in Proceedings of the 2014 ACM International Symposiumon New Ideas, New Paradigms, and Reflections on Programming &Software, ser. Onward! 2014. New York, NY, USA: Associationfor Computing Machinery, 2014, p. 83–94. [Online]. Available:https://doi.org/10.1145/2661136.2661144
[15] T. Kobayashi, N. Kato, and K. Agusa, “Interaction histories miningfor software change guide,” in 2012 Third International Workshop onRecommendation Systems for Software Engineering (RSSE), 2012, pp.73–77.
[16] D. Roethlisberger, O. Nierstrasz, and S. Ducasse, “Autumn leaves:Curing the window plague in ides,” in 2009 16th Working Conferenceon Reverse Engineering, 2009, pp. 237–246.
[17] R. Minelli, A. Mocci, R. Robbes, and M. Lanza, “Taming the idewith fine-grained interaction data,” in Proceedings of ICPC 2016 (24thInternational Conference on Program Comprehension), 2016.
[18] K. Damevski, D. C. Shepherd, J. Schneider, and L. Pollock, “Miningsequences of developer interactions in visual studio for usage smells,”IEEE Transactions on Software Engineering, vol. 43, no. 4, pp. 359–371,2017.
[19] S. Amann, S. Proksch, S. Nadi, and M. Mezini, “A Study of VisualStudio Usage in Practice,” in Proceedings of SANER 2016 (23rd
IEEE International Conference on Software Analysis, Evolution, andReengineering). IEEE, 2016, pp. 124–134.
[20] S. Amann, S. Proksch, and S. Nadi, “FeedBaG: An Interaction Trackerfor Visual Studio,” in Proceedings of ICPC 2016 (24th InternationalConference on Program Comprehension). IEEE, 2016, pp. 1–3.
[21] L. Bao, D. Ye, Z. Xing, X. Xia, and X. Wang, “Activityspace: A re-membrance framework to support interapplication information needs,” in2015 30th IEEE/ACM International Conference on Automated SoftwareEngineering (ASE), 2015, pp. 864–869.
48