Embed Size (px)
Citation preview

C:\Users\bturner\AppData\Local\Microsoft\Windows\INetCache\Content.Outlook\1F9QPZNT\Zoom - Agenda.docx 1
METROPOLITAN PLANNING ORGANIZATION
Commissioner Susan Adams Laura Moss -City of Vero Beach Commissioner Joseph E. Flescher, Vice-Chair Joe Graves -City of Vero Beach Commissioner Peter D. O’Bryan Rey Neville -City of Vero Beach, Alternate Commissioner Bob Solari Gerald “Jerry” Renick -City of Fellsmere Commissioner Tim Zorc Jessica Salgado-City of Fellsmere, Alternate Ed Dodd - City of Sebastian Bob McPartlan – City of Sebastian
Non-voting Ex-Officio-Member
Jim Hill – City of Sebastian, Alternate Tiffany Justice – IRC School Board
Harold Ofstie – Town of Orchid
Jacqueline Rosario -IRC School Board, Alternate FDOT District 4 Representative
Bob Auwaerter – MPO Chairman
VIRTUAL MEETING Wednesday, October 14, 2020
10:00 am
In accordance with the Centers for Disease Control and Prevention (CDC) Guidelines and the Governor's Executive Orders pertaining to the COVID-19 Pandemic, this meeting will be conducted entirely by web and teleconference accessible as follows: Accessing the meeting using Zoom: You can join the virtual meeting from a computer, telephone, or both. Please follow these two steps:
Step 1 Join the Zoom meeting by clicking on this link: https://ircgov.zoom.us/j/3107671195 Step 2 For your audio option, select either your computer microphone/speakers or
telephone. For telephone, use the “Call Me” option – you will receive a call within seconds.
Or Join by telephone: Call (602) 333-2017 or (888) 204-5987 (US Toll Free)
Conference code: 252340 Appearing in person: Communications media technology shall be made available to participate at the date and time of the virtual meeting at Indian River County, Administration Building B, Conference Room B1-501, 1800 27th Street, Vero Beach, FL. Because of CDC guidelines, reservations are encouraged for persons who prefer to attend in person. Please call (772) 226-1455 for additional information and to make a reservation.

C:\Users\bturner\AppData\Local\Microsoft\Windows\INetCache\Content.Outlook\1F9QPZNT\Zoom - Agenda.docx 2
AGENDA
1) Call to Order
2) Pledge of Allegiance
3) Roll Call
4) Approval of Minutes
September 9, 2020 Action Required
5) Status Report of MPO Advisory Committees No Action Required
6) Consideration of the Long Range Transportation Plan (LRTP) Cost Feasible Plan Action Required
7) Consideration of the Transportation Improvement Program (TIP) Amendments Action Required
8) Other Business a. Presentation by DBI, FDOT Maintenance Contractor
9) Comments from the Public
10) Adjournment
Next Meeting: MPO – December 9, 2020, 10:00 AM.
If you have any questions concerning the items on this agenda, please contact MPO staff at (772) 226-1455. Anyone who may wish to appeal any decision which may be made at this meeting will need to ensure that a verbatim record of the proceeding is made, which includes the testimony and evidence on which the appeal is based. Anyone who needs a special accommodation for this meeting must contact the County’s Americans with Disabilities Act (ADA) Coordinator at 772 226-1223 at least 48 hours in advance of the meeting. For complaints, questions or concerns about civil rights or nondiscrimination; or for special requests under the American with Disabilities Act, please contact MPO staff at (772) 226-1455 or [email protected].

C:\Users\bturner\AppData\Local\Microsoft\Windows\INetCache\Content.Outlook\1F9QPZNT\Zoom - Agenda.docx 3
Except for those matters specifically exempted under State Statute and Local Ordinance, the Committee shall provide an opportunity for public comment prior to the undertaking by the Committee of any action on the agenda. Public comment shall also be heard on any proposition which the Committee is to take action which was either not on the agenda or distributed to the public prior to the commencement of the meeting. Public participation is solicited without regard to race, color, national origin, age, sex, religion, disability or family status. Persons who require special accommodations under the Americans with Disabilities Act or persons who require translation services (free of charge) should contact MPO staff at (772) 226-1455 or [email protected] at least seven days prior to the meeting.

1 C:\Users\sjohnson\AppData\Local\Microsoft\Windows\INetCache\Content.Outlook\5F972PF7\2-MPO 09-09-2020 Unapproved.doc
METROPOLITAN PLANNING ORGANIZATION A meeting of the Indian River County (IRC) Metropolitan Planning Organization (MPO)
was held at 10:00 AM on Wednesday, September 9, 2020, conducted through Zoom, and hosted in County Administration Building “B”, Room B1-501, 1800 27th Street, Vero Beach, Florida for those unable to attend virtually.
Note: Audio and video recordings of the meeting can be found at
http://www.ircgov.com/Boards/MPO/2020.htm
MPO members present: IRC Commissioners: Commissioner Joseph Flescher, District 2; Commissioner Tim Zorc, District 3, (10:05am); Commissioner Peter O’Bryan, District 4; Commissioner Bob Solari, District 5; Chairman Bob Auwaerter, Vice Mayor, Town of Indian River Shores; Ed Dodd, Mayor, City of Sebastian; Jim Hill, Council Member, City of Sebastian; Laura Moss, Vice Mayor, City of Vero Beach; Joe Graves, Council Member, City of Vero Beach; Rey Neville, (alternate), City of Vero Beach; Michael Hicks and Christine Fasiska, FDOT (non-voting advisors).
Absent: Commissioner Susan Adams, District 1; Gerald “Jerry” Renick, City of
Fellsmere; Tiffany Justice, IRC School Board; Hal Ofstie, Mayor, Town of Orchid, (non-voting member).
IRC staff present: Brian Freeman, MPO Staff Director; Jim Mann, MPO Senior Planner; Phil Matson, IRC Community Development Director; Jason Brown, IRC Administrator; Rich Szpyrka, IRC Public Works Director, (10:11am); Dylan Reingold, IRC Attorney, (10:40am); Albert Alvarez, MPO Intern; Patti Johnson, MPO Staff Assistant 3/Recording Secretary.
Also present: Mark Plass and Josh Baker, FDOT; William Roll and Zach Chappell, Kimley-
Horn & Associates; Tom Lanahan, Treasure Coast Regional Planning Council; Melissa Reading, The Corradino Group; Sarah Kraum, Space Coast TPO; Karina Enrico and Bill Smithson, K-Factor, Inc.; Natalia Licari, McMahon Associates.
Call to Order
Chairman Auwaerter called the meeting to order at 10:00 AM.
Roll Call of the Metropolitan Planning Organization (MPO) Members. It was noted that a quorum was present.

2 C:\Users\sjohnson\AppData\Local\Microsoft\Windows\INetCache\Content.Outlook\5F972PF7\2-MPO 09-09-2020 Unapproved.doc
Approval of Minutes of the MPO Meeting of June 10, 2020 Action Required
Chairman Auwaerter asked if there were any additions or corrections to the MPO meeting minutes of May 13, 2020. There were none.
ON MOTION BY Commissioner Flescher and SECONDED by Chairman Auwaerter, the members voted (8-0) to approve the minutes of the Metropolitan Planning Organization June 10, 2020 meeting.
**Due to time conflicts, Item 13a, under Other Business, was presented at this time** Commissioner Zorc entered @ 10:05 am Indian River Blvd. /Merrill Barber Bridge Intersection Update Mr. Freeman gave a synopsis of the intersection safety improvements made so far as well as additional ones that are proposed. Mr. Mark Plass from FDOT and Natalia Licari from McMahon Associates were also available to discuss the intersection improvements. Chairman Auwaerter commented that the vegetation in the southeast corner had been obstructing visibility and he was happy to see that it was cleared out and expressed thanks to the appropriate parties responsible.
Commissioner O’Bryan mentioned that any changes to that intersection would come with a learning curve for those traveling in that area as it will be a change. Mr. Plass stated it would be good for his staff and Indian River County staff to have detailed meetings regarding any proposed changes with this intersection. Chairman Auwaerter thanked Mr. Plass for the update. Status Report of MPO Advisory Committees No Action Required
Mr. Freeman reviewed his memorandum, dated September 1 2020, included in the agenda packet and on file in the MPO Office. He also noted the next meeting dates for the MPO and its advisory committees.
Consideration of the Long Range Transportation Plan (LRTP) – Draft Cost Feasible Plan Concepts Action Required

3 C:\Users\sjohnson\AppData\Local\Microsoft\Windows\INetCache\Content.Outlook\5F972PF7\2-MPO 09-09-2020 Unapproved.doc
Mr. Freeman introduced William Roll, from Kimley-Horn and Associates, who provided a
brief overview of the Long Range Transportation Plan (LRTP) Draft Cost Feasible Plan Concepts. Mr. Roll was accompanied by Mr. Zach Chappell, also from Kimley-Horn and Associates who was there to assist in answering questions. A copy of this presentation is on file in the MPO office. Mr. Roll reminded the Committee that the deadline to approve this plan is December 2020. Failure to adopt the plan by the deadline risks the denial of federal funding for transportation projects. The next step in this process will be to develop a 25-year schedule for these projects. There was discussion about the Aviation Blvd. overpass at US 1 and the FEC railroad. Mr. Freeman explained currently there are no grade separated crossings in the County and the overpass will improve access to the hospital. Commissioner Zorc added he has been in conversations with the Airport Commission and County staff regarding the construction of a “flyover” at 36th Street as the cost for this location would be less than an overpass at Aviation Blvd.
Commissioner O’Bryan stated for the record, he is still opposed to four-laning of 43rd Avenue, south of 16th Street. The MPO will conduct virtual workshops on September 15th at 6:00pm and September 16th at 2:00pm. The MPO has publicized these workshops by using the MPO’s electronic newsletter, “The MPOverview”, the MPO website, and doing mass mailings through Constant Contact.
Mr. Freeman added, for those who are familiar with the 2040 plan that was adopted five years ago, if you look at the table of projects, it is basically the same as you see today. Projects that are high priority like the Oslo Road Interchange and CR510 are included in this plan. The overpass at the Aviation Blvd. and US 1 intersection is the only major addition to the plan, in comparison to the previous plan.
There being no additional comments, the item was open for motion.
ON MOTION BY Commissioner Zorc and SECONDED by Ms. Moss, the members voted (9-0) to recommend approval of the Consideration of the Long Range Transportation Plan (LRTP) – Draft Cost Feasible Plan Concepts.
Consideration of the 2020 Transit Development Plan Annual Update Action Required

4 C:\Users\sjohnson\AppData\Local\Microsoft\Windows\INetCache\Content.Outlook\5F972PF7\2-MPO 09-09-2020 Unapproved.doc
Mr. Freeman provided a power point presentation and explained that Transit
Development Plan (TDP) major updates are required every five years. The update is a component to obtain funding in the Public Transportation Block Grant. A copy of this power point presentation is on file in the MPO office.
Mr. Freeman described the public involvement undertaken for the major update. The
last time the survey was done, there were over 700 responses received. This demonstrates the level of community interest and their involvement in this service.
For the past 15 years, there has been a continued increase in ridership. Even during the
COVID shutdown, the numbers decreased but as of this month, we are showing the same numbers for the last year.
Under the capital program, vehicle replacements are ongoing as well as the construction
of several bus shelters. Bus shelters have increased with ten constructed this year alone. There was also a discussion on the construction of a new North County Transit Hub.
Chairman Auwaerter opened the floor for comments from the board. Chairman Auwaerter brought attention to the fluctuations in the dollar amounts, this is due to CARES money that has been received due to COVID and that does not have to be spent all at once.
Commissioner Flescher commented the operation of the current North County hub operates seamlessly and he hasn’t received calls or concerns from the residents. Most people have no idea the amount of traffic that goes through that Hub. Hopefully the new hub design and location will be just as respective to the neighborhood.
There being no comments, the item was open for motion.
ON MOTION BY Commissioner Flescher and SECONDED by Commissioner Zorc, the members voted (9-0) to recommend approval of the Consideration of the 2020 Transit Development Plan Annual Update.
Consideration of the Transportation Improvement Program (TIP) Amendments Action Required
Mr. Freeman introduced Mr. Jim Mann who gave a synopsis of the Transportation Improvement Program (TIP) Amendments. At the end of each state fiscal year, FDOT typically requests a roll-forward amendment to the TIP. Approval of the roll-forward amendment to the TIP ensures that the included projects can continue from FDOT’s FY 2019/20 Work Program into

5 C:\Users\sjohnson\AppData\Local\Microsoft\Windows\INetCache\Content.Outlook\5F972PF7\2-MPO 09-09-2020 Unapproved.doc
the new 2020/21 Work Program. The attached Roll-Forward Report, provided by FDOT, lists the projects that will carry forward into the new work program.
Chairman Auwaerter opened the floor for comments from the board. There being none, the item was open for motion.
ON MOTION BY Commissioner O’Bryan and SECONDED by Commissioner Flescher, the members voted (9-0) to recommend approval of the Transportation Improvement Program (TIP) Amendments.
Resolution with the Space Coast TPO Approving the Regional Trail Alignment Action Required
Mr. Jim Mann presented the joint resolution with the Space Coast TPO. Since the
completion of the I-95 Pedestrian Overpass in 2018, the Trans-Florida Central Railroad Trail has seen a tremendous increase in usage. In accordance with the North Indian River County Greenways Plan, future phases will extend the trail west through downtown Fellsmere to the Blue Cypress marsh and north to the Brevard County line.
Earlier this year, MPO staff coordinated with the Space Coast TPO to develop a regional trail concept connecting trails between Indian River and Brevard counties. At each end the combined regional trail concept connects to the East Coast Greenway along SR A1A, making a scenic detour for long-distance and local trail users alike. In so doing, the new regional trail concept could be included in the list of eligible priorities on the State Office of Greenways and Trails Priority’s Trails Network. Potentially, this will open up the Trans-Florida Central Railroad Trail and connecting trails in both counties to new sources of possible funding.
Ms. Sarah Kraum, Space Coast TPO, stated they are very excited about this project and it
will be going before their Board tomorrow. Chairman Auwaerter opened the floor for comments from the board. There being none, the item was open for motion.
ON MOTION BY Commissioner Flescher and SECONDED by Commissioner Solari, the members voted (9-0) to recommend approval of the Resolution with the Space Coast TPO Approving the Regional Trail Alignment.
Approval of an Amendment to the Public Transportation Grant Agreement with the Florida

6 C:\Users\sjohnson\AppData\Local\Microsoft\Windows\INetCache\Content.Outlook\5F972PF7\2-MPO 09-09-2020 Unapproved.doc
Department of Transportation (FDOT) for 49 USC CH. 53, Section 5305(d) Transit Planning Funds Action Required
Mr. Freeman spoke about the annual agreement for Section 5305(d) transit planning funds. This program is one of the main sources for funding the MPO’s planning activities.
To receive the FY 2020/21 Section 5305(d) funds, the MPO must adopt the attached resolution authorizing the MPO Chairman to execute the amendment to the Public Transportation Grant Agreement.
Chairman Auwaerter opened the floor for comments from the board. There being no additional comments, the item was open for motion.
ON MOTION BY Commissioner Flescher and SECONDED by Mr. Dodd, the members voted (9-0) to recommend approval of the Amendment to the Public Transportation Grant Agreement with the Florida Department of Transportation (FDOT) for 49 USC CH.53, Section 5305(d) Transit Planning Funds.
A1A Resurfacing Project Presentation by FDOT. No Action Required
Mr. Freeman introduced Melissa Reading, The Corradino Group, who in turn introduced Josh Baker, FDOT, and Bill Smithson, K-Factor, Inc., and this group conducted the presentation on the A1A Resurfacing Project.
In the summer of 2020, the Florida Department of Transportation commenced a
resurfacing project located on A1A from Tides Road to Coco Plum Lane. The project includes widening the paved roadway to accommodate seven-foot buffered bicycle lanes, signalization improvements, drainage improvements, new signs, and new pavement markings. Portions of the project are located in within the cities of Vero Beach and Indian River Shores as well as unincorporated Indian River County. The project length is 6.74 miles in length.
Chairman Auwaerter requested to have a copy of this presentation emailed to him. This is an informational item only and does not require an approval or motion.
Review of Progress Report and Reimbursement Invoice #4 for the 2019/20 Local Program Administrative Support Grant No Action Required

7 C:\Users\sjohnson\AppData\Local\Microsoft\Windows\INetCache\Content.Outlook\5F972PF7\2-MPO 09-09-2020 Unapproved.doc
Mr. Freeman briefly described the MPO’s Transportation Disadvantaged Planning
activities covered in the quarterly invoice. Because the invoice deadline was August 15, MPO staff has already submitted the invoice for reimbursement.
This is an informational item only and does not require an approval or motion.
Other Business Information about IRC Transportation Projects at Future MPO Meetings Mr. Freeman informed the Board the MPO will join Bike Walk of Indian River County (BWIRC) and County Public Works Department to conduct workshops and public information outreach to inform the citizens of upcoming projects and allow them to voice their concerns. Comments from the Public
There were none.
Adjournment There being none, the meeting was adjourned at 11:07 AM.

C:\Users\sjohnson\AppData\Local\Microsoft\Windows\INetCache\Content.Outlook\5F972PF7\3-Status Other Committees.docx
INDIAN RIVER COUNTY, FLORIDA
M E M O R A N D U M TO: Members of the Indian River County Metropolitan Planning Organization (MPO) THROUGH: Phillip J. Matson, AICP
Community Development Director
FROM: Brian Freeman, AICP MPO Staff Director
DATE: October 7, 2020 SUBJECT: Status Report of MPO Advisory Committees It is requested that the information presented herein be given formal consideration by the MPO at its meeting of October 14, 2020. TAC MEETING At its September 25, 2020 meeting, the TAC considered the 2045 Long Range Transportation – Cost Feasible Plan and the Transportation Improvement Program (TIP) amendments for 82nd Avenue and the A1A Bridge over the Sebastian Inlet. The TAC recommended approval of all items by the MPO. CAC MEETING At its October 6, 2020 meeting, the CAC considered the 2045 Long Range Transportation – Cost Feasible Plan and the Transportation Improvement Program (TIP) amendments for 82nd Avenue and the A1A Bridge over the Sebastian Inlet. The CAC recommended approval of all items by the MPO. Upcoming Meetings The MPO and its advisory committees will next meet as follows: BAC Meeting: October 27, 2020 – 2:00 pm TDLCB Meeting: November 19, 2020 – 10:00 am CAC Meeting: December 1, 2020 – 2:00 pm TAC Meeting: December 4, 2020 – 10:00 am MPO Meeting: December 9, 2020 – 10:00 am

C:\Users\sjohnson\AppData\Local\Microsoft\Windows\INetCache\Content.Outlook\5F972PF7\4-LRTP cost feasible plan.docx 1
INDIAN RIVER COUNTY, FLORIDA
M E M O R A N D U M TO: Members of the Indian River County Metropolitan Planning Organization (MPO) THROUGH: Phillip J. Matson, AICP
Community Development Director
FROM: Brian Freeman, AICP MPO Staff Director
DATE: October 7, 2020 SUBJECT: Consideration of the Long Range Transportation Plan – Cost Feasible Plan It is requested that the information presented herein be given formal consideration by the MPO at its meeting of October 14, 2020. DESCRIPTION AND CONDITIONS Among the most important tasks undertaken by any MPO is the development and adoption of a Long Range Transportation Plan (LRTP). One reason why the LRTP is important is that a roadway widening or other major transportation project must first be identified in the MPO’s Long Range Transportation Plan before it can receive state and federal gas tax funding. In order to reflect changing conditions, new Long Range Transportation Plan Updates must be adopted every five years and typically cover a 25-year planning horizon. Under Florida law, the Indian River County MPO must adopt its 2045 LRTP Update by December of 2020. The 2045 LRTP is being prepared by Kimley-Horn and Associates, one of the MPO’s general planning consultants. Earlier this year, Kimley-Horn prepared a Public Involvement Plan; Goals, Objectives, Policies, and Performance Measures; and a fiscal resources summary. Those efforts were subsequently followed by a Needs Assessment, which was approved by the MPO in May of this year. That Needs Assessment identified the set of roadway and transportation projects that need to be implemented by the year 2045 to maintain an adequate level of service. The set of projects identified in the Needs Assessment is not cost-constrained. Attached is the Draft Cost Feasible Plan Summary Report. Included in the report is the set of cost-feasible projects approved by the MPO on September 9. At its October 14 meeting, the MPO is scheduled to approve the Draft Cost Feasible Plan Summary Report and open a 30-day comment period. Final adoption of the LRTP is scheduled for the December MPO meeting.

C:\Users\sjohnson\AppData\Local\Microsoft\Windows\INetCache\Content.Outlook\5F972PF7\4-LRTP cost feasible plan.docx 2
ANALYSIS Earlier this year, a Needs Assessment was prepared that identifies all projects needed to address future congestion deficiencies on the County’s roadway network. After projecting the cost of those projects as well as future transportation revenues, staff and consultants determined that not all of the Needs Plan projects would be affordable in Indian River County by 2045. The attached Cost Feasible Plan Summary Report includes a set of affordable transportation improvements through the year 2045 (see pages 24-25). This set of cost-feasible projects includes long-standing MPO priorities, such as the widening of CR 510, Oslo Road, and US 1; the Oslo Road/I-95 interchange; a flyover for Aviation Blvd. at US 1/FEC railroad; and the improvement of 82nd Avenue as a two-lane road. In addition to those priorities, other cost-feasible projects include the extension of 53rd Street, the widening of 26th Street/Aviation Blvd, 43rd Avenue, and CR 512, and strategic intersection improvements on Indian River Blvd. between the causeways. That set of projects has been organized into an implementation schedule based on projected financial resources. Once adopted by the MPO, the adopted Cost Feasible Plan roadway network will constitute the basis for the MPOs final 2045 Long Range Transportation Plan. Since not all of the Needs Plan projects are affordable, there will still be some deficiencies on the roadway network, even after the Cost Feasible Plan improvements are adopted. Therefore, the final 2045 LRTP will also contain alternative strategies for meeting demand on the network. Some of those strategies may include traffic systems management solutions (such as signalization, intersection, and interchange improvements); demand management solutions (such as parking management); and alternative travel modes (such as transit and bicycle facilities). At its September 25 meeting, the Technical Advisory Committee (TAC) recommended approval of the Cost Feasible Plan. At its October 6 meeting, the Citizens Advisory Committee (CAC) recommended approval of the Cost Feasible Plan. RECOMMENDATION Staff recommends that the MPO review the attached report, consider the presentation at the October 14 MPO meeting, and approve the 2045 Cost Feasible Plan Summary Report. ATTACHMENT 1. Draft 2045 Cost Feasible Plan Summary Report

1
2045 LONG RANGE TRANSPORTATION PLAN
DRAFT
DRAFT September 24, 2020
SUMMARY/ADOPTION REPORT

CONNECTING IRCCONNECTING IRC
TABLE OF CONTENTS GOALS AND OBJECTIVES ............................................ 1
INTRODUCTION..................................................................................................................... 1
DEVELOPMENT OF THE GOALS, OBJECTIVES, AND PERFORMANCE MEASURES...........................................................................1
FEDERAL PERFORMANCE MEASURES................................................................2
INDIAN RIVER COUNTY MPO GOALS ..................................................................2
FLORIDA TRANSPORTATION PLAN (FTP) ..........................................................8
SYSTEM PERFORMANCE REPORT...........................................................................9
2045 LRTP REVENUE FORECAST.................................. 13 INTRODUCTION....................................................................................................................13
OVERVIEW OF FINANCIAL RESOURCES ..........................................................13
FINANCIAL PROJECTIONS............................................................................................14
REVENUE SUMMARY .......................................................................................................17
TRANSPORTATION PLAN............................................. 18 COST FEASIBLE PLAN DEVELOPMENT.............................................................18
COST FEASIBLE PLAN....................................................................................................22
BICYCLE AND PEDESTRIAN FACILITY IMPROVEMENTS ....................26
TRANSIT IMPROVEMENTS......................................................................................... 30
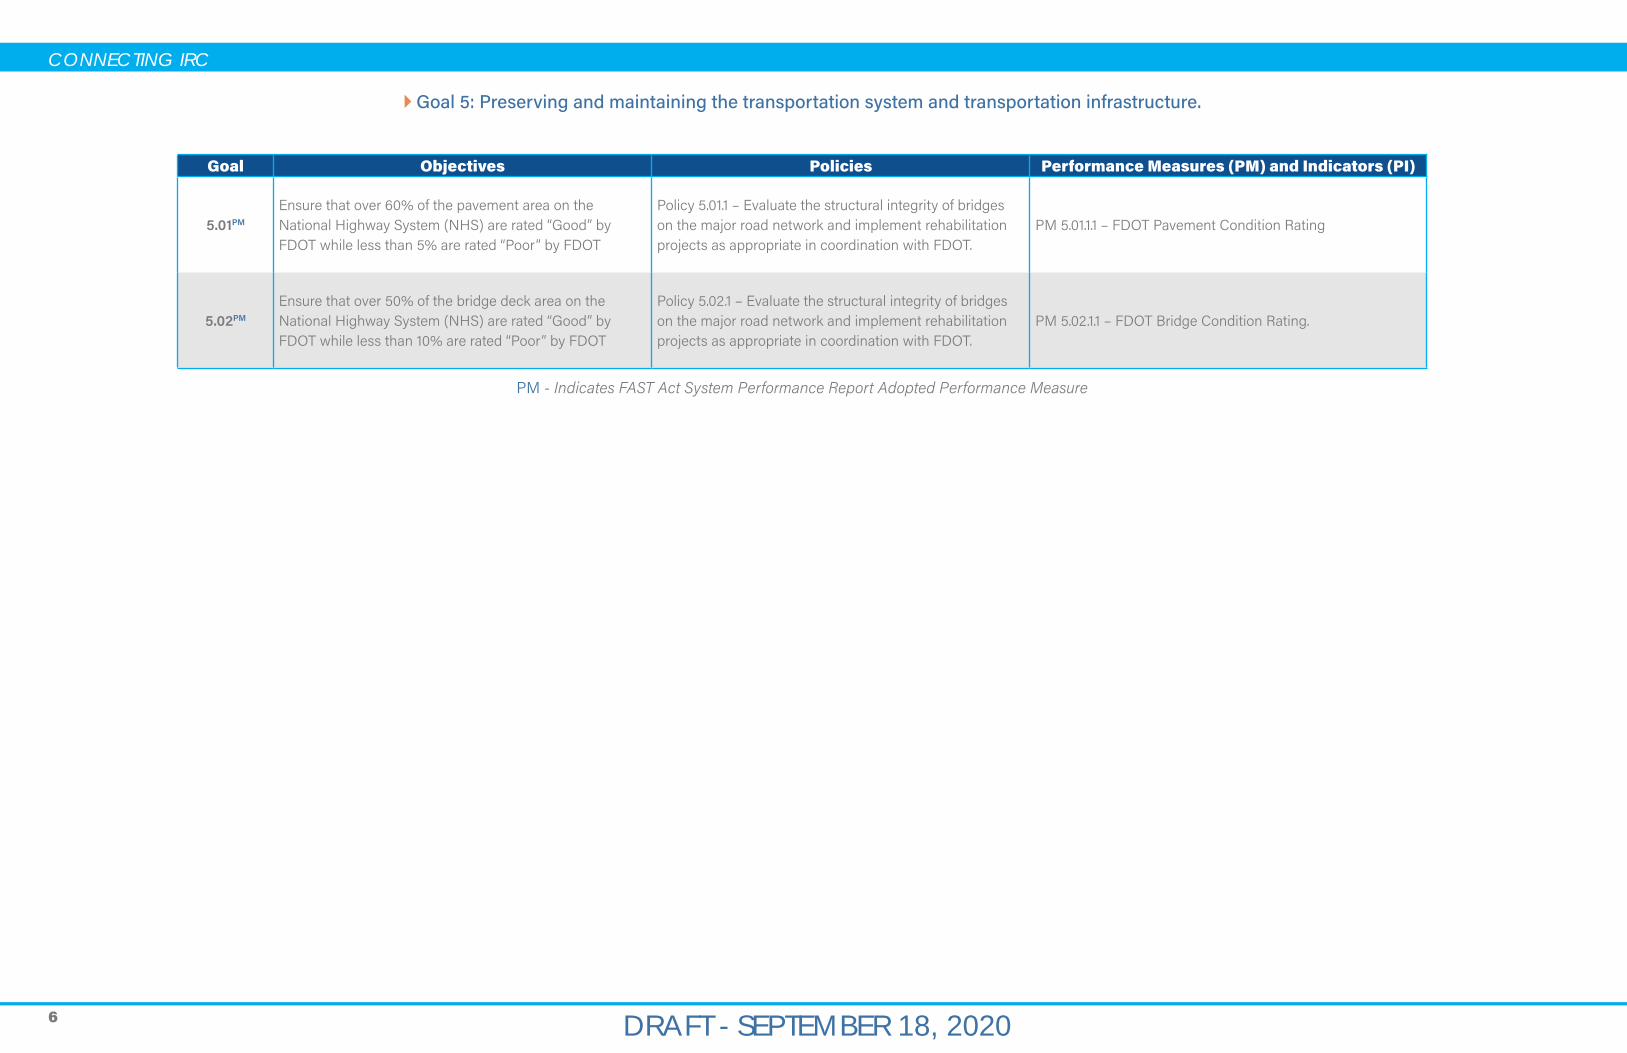
TRANSPORTATION OPERATIONS AND MANAGEMENT STRATEGIES ....................................................................................32
APPENDIX ....................................................................... SYSTEM PERFORMANCE REPORT..........................................................................A
COST FEASIBLE CAPACITY PROJECTS (YOE) ................................................ B
COST FEASIBLE CAPACITY PROJECTS (PDC) ................................................C
ASPIRATIONAL CAPACITY PROJECTS ..................................................................D
DRAFT - SEPTEMBER 18, 2020

DRAFT - SEPTEMBER 18, 2020
2045 LONG RANGE TRANSPORTATION PLAN
GOALS AND OBJECTIVES INTRODUCTION The Indian River County MPO Long Range Transportation Plan (LRTP) is revised and adopted every five years by the Indian River County MPO. The 2045 LRTP is known as Connecting IRC 2045.
Pursuant to the Moving Ahead for Progress in the 21st Century Act (MAP-21) enacted in 2012 and the Fixing America's Surface Transportation Act (FAST Act) enacted in 2015, state departments of transportation (DOT) and metropolitan planning organizations (MPO) must apply a transportation performance management approach in carrying out their federally required transportation planning and programming activities. The process requires the establishment and use of a coordinated, performance-based approach to transportation decision-making to support national goals for the federal-aid highway and public transportation programs.
On May 27, 2016, the Federal Highway Administration (FHWA) and the Federal Transit Administration (FTA) issued the Statewide and Nonmetropolitan Transportation Planning and Metropolitan Transportation Planning Final Rule (The Planning Rule). This rule details how state DOTs and MPOs must implement new MAP-21 and FAST Act transportation planning requirements, including the transportation performance management provisions.
In accordance with the Planning Rule, the Indian River County MPO must include a description of the performance targets that apply to the MPO planning area and a System Performance Report as an element of its LRTP. The System Performance Report evaluates the condition and performance of the transportation system with respect to required performance targets and reports on progress achieved in meeting the targets in comparison with baseline data and previous reports. For MPOs that elect to develop multiple scenarios, the System Performance Report must also include an analysis of how the preferred scenario has improved the performance of the transportation system and how changes in local policies and investments have impacted the costs necessary to achieve the identified targets.
DEVELOPMENT OF THE GOALS, OBJECTIVES, AND PERFORMANCE MEASURES The Connecting IRC 2045 Goals, Objectives, and Performance Measures are being updated based on federal, state, and local guidance. This section highlights the requirements and guidance used to develop the Goals, Objectives, and Performance Measures for the 2045 Long Range Transportation Plan.
Fixing America’s Surface Transportation (FAST) Act Enacted in 2015, the Fixing America’s Surface Transportation (FAST) Act (Public Law No. 114-94), provides support and enhancement to the Moving Ahead for Progress in the 21st Century Act (MAP-21). The FAST Act is the first federal law to provide long-term funding to infrastructure planning and investment for surface transportation since the Safe, Accountable, Flexible, Efficient Transportation Equity Act: A Legacy for Users (SAFETEA-LU) became law in 2005.
The FAST Act supports MAP-21 by continuing to create a streamlined, performance-based surface transportation program that builds on many of the multimodal transportation policies first established under the Intermodal Surface Transportation Efficiency Act (ISTEA) of 1991. Establishing a performance- and outcome-based program requires investment of financial resources in projects that will collectively make progress toward achieving national multimodal transportation goals. The 2045 LRTP has been developed to ensure compliance with the requirements of the FAST Act and includes a performance-based approach to the transportation decision-making process.
The FAST Act has established specific planning factors that call for the recognition and address the relationship between transportation, land use, and economic development. The federal planning factors form the cornerstone for the 2045 LRTP and include:
1. Supporting the economic vitality of the metropolitan area, especially by enabling global competi-tiveness, productivity, and efficiency.
2. Increasing the safety of the transportation system for motorized and non-motorized users.
3. Increasing the security of the transportation system for motorized and non-motorized users.
4. Increasing accessibility and mobility of people and freight.
5. Protecting and enhancing the environment, promote energy conservation, improve quality of life, and promote consistency between transportation improvements and state and local growth and economic development patterns.
6. Enhancing the integration and connectivity of the transportation system, across and between modes, for people and freight.
7. Promoting efficient system management and operation.
8. Emphasizing the preservation of the existing transportation system.
9. Improving the resiliency and reliability of the transportation system and reduce or mitigate storm-water impacts of surface transportation.
10.Enhancing travel and tourism.
1

2
CONNECTING IRC
DRAFT - SEPTEMBER 18, 2020
FEDERAL PERFORMANCE MEASURES
` PERFORMANCE MEASURE #1 - SAFETY
y Fatalities
y Serious Injuries
y Non-Motorized Fatalities and Serious Injuries
` PERFORMANCE MEASURE #2 - BRIDGE AND PAVEMENT CONDITION
y Pavement Condition
y Bridge Condition
` PERFORMANCE MEASURE #3 - TRAVEL TIME RELIABILITY
y Interstate Miles that are Reliable
y Truck Travel Time Reliability
The FAST Act has also established specific Performance Measures to evaluate critical needs by setting targets for safety, maintenance of assets, and travel time reliability. The federal Performance Measures are listed below.
INDIAN RIVER COUNTY MPO GOALS Listed below are the Indian River County MPO Goals for 2045 LRTP, Connecting IRC 2045.
Goal 1 – Providing an efficient transportation system that is connected, responsive, aesthetically pleasing and meets the needs of all users.
Goal 2 – Enhancing mobility for people and freight and provide travel alternatives.
Goal 3 – Protecting the natural and social environment.
Goal 4 – Maintaining a safe transportation system for all users.
Goal 5 – Preserving and maintaining the transportation system and transportation infrastructure.

2045 LONG RANGE TRANSPORTATION PLAN
DRAFT - SEPTEMBER 18, 2020 33
Table 1 expands on Connecting IRC 2045 Goals by listing related Objectives, Policies, and Performance Measures for each Goal.
Table 1: Connecting IRC 2045 Goals, Objectives, Policies, and Performance Measures
`Goal 1: Providing an efficient transportation system that is connected, responsive, aesthetically pleasing and meets the needs of all users.
Goal Objectives Policies Performance Measures (PM) and Indicators (PI)
1.01 Maintain the adopted level of service standard for all functionally classified roads through the year 2045.
Policy 1.01.1 – Implement roadway improvements identified in the 2045 Cost Feasible Plan, consistent with the Interim Year Roadway Improvement Sets.
Policy 1.02.1 – Implement roadway improvements identified in the 2045 Cost Feasible Plan for roadways designated as hurricane evacuation routes.
Policy 1.03.1 – Implement new corridor roadway improvements identified in the 2045 Cost Feasible Plan.
PI 1.01.1.1 – Percent of lane miles meeting the adopted level of service standard.
PI 1.02.1.1 – Hurricane evacuation clearance time measured through actual event. PI 1.02.1.2 – Lane miles of roadway improvements on hurricane evacuation routes.
PI 1.03.1.1- Average annual centerline miles of new roadway corridors constructed during the period from 2020 to 2045.
1.02 Maintain a 12 hour hurricane evacuation clearance time on roads designated as hurricane evacuation routes through the year 2045.
1.03 Enhance the grid roadway network by constructing an average of two centerline miles of new roadway corridors each year from 2020 to 2045.
1.04 Enhance the FDOT’s Strategic Intermodal System (SIS) by constructing one FEC railway flyover by 2045.
Policy 1.04.1 – Implement improvements to the SIS at the FEC Railroad by 2045.
PI 1.041.1 – New Flyover at the FEC Railroad.
1.05 Optimize functionality and efficiency of existing infrastructure and ROW through 2045.
Policy 1.05.1 – Incorporate Intelligent Transportation System (ITS) and/or Connected Vehicle architecture into all new roadway projects.
PI 1.05.1.1 Number of new roadways that incorporate ITS and Connected Vehicle Architecture.
1.06PM
Ensure that 50% of Person-Miles (Non-Interstate) and 75% of Person-Miles (Interstate) on the National Highway System are Reliable
Policy 1.06.1 – Implement roadway improvements identified in the 2045 Cost Feasible Plan, consistent with the Interim Year Roadway Improvement Sets.
PM 1.06.1 Percent of Person Trips that are Reliable (50% of Person-Miles (Non-Interstate) and 75% of Person-Miles (Interstate))
PM - Indicates FAST Act System Performance Report Adopted Performance Measure

4
CONNECTING IRC
DRAFT - SEPTEMBER 18, 2020
`Goal 2 Enhancing mobility for people and freight and provide travel alternatives.
Goal Objectives Policies Performance Measures (PM) and Indicators (PI)
2.01 Maintain Transit Quality and LOS “A” for reliability. Policy 2.01.1 – Make Capital and Operational improvements consistent with the adopted Transit Development Plan.
PI 2.01.1.1 – Percentage of buses arriving within 5 minutes of schedule.
2.02 Maintain Transit Quality and LOS “B” for Service Coverage. Policy 2.02.1 – Improve service coverage consistent with the adopted Transit Development Plan.
PI 2.02.1.1 – System compliance with adopted level of service standard
2.03
Expand weekday hours of service to 15 hours a day on at least one bus route every two years during the period from 2025 to 2045 so that all weekday bus routes operate at least 15 hours per day by 2045.
Policy 2.03.1 – Expand weekday hours of operation on fixed-route bus network consistent with the adopted Transit Development Plan.
PI 2.03.1.1 – Average number of weekday bus routes with 15 hours of service added during the period from 2025 to 2045.
2.04 Maintain Bike/Ped LOS “D” on 80% percent of roadways in Indian River County through 2045.
Policy 2.04.1 – Implement sidewalk improvements consistent with the adopted Bicycle/Pedestrian Plan.
Policy 2.04.2 – Implement bicycle facility improvements consistent with the adopted Bicycle/Pedestrian Plan.
PI 2.04.1 – Percentage of roadways meeting adopted level of service standard
2.05 Add an average of two miles of bicycle facilities on functionally classified roadways or trails each year during the period from 2020 to 2045.
Policy 2.051 – Implement bicycle facility improvements consistent with the adopted Bicycle/Pedestrian Plan.
Policy 2.05.2 – Adapt abandoned railroad corridors, roadway alignments and military trails for bicycle facilities, wherever possible.
PI 2.05.1.1 – Average annual number of new bicycle facilities added during the period from 2025 to 2045.
PM 2.06.1.1 – TTTR on the Interstate Highway System
(Truck Travel Time Reliability (TTTR) index on the Interstate Highways is less than 2.00)
PI 2.07.1.1 – Number of new shelters/improved transit hubs
2.06PM
Enhance freight mobility by ensuring that the Truck Travel Time Reliability (TTTR) index on the Interstate Highways is less than 2.00
Policy 2.06.1 – Implement the freight mobility improvements identified in the 2045 Cost Feasible Plan
2.07 Increase the efficiency and convenience of connecting multiple modes by adding an average of one shelter or transfer facility per year through 2045.
Policy 2.07.1 – Add bus shelters and improve hubs consistent with the Transit Development Plan.
PM - Indicates FAST Act System Performance Report Adopted Performance Measure

2045 LONG RANGE TRANSPORTATION PLAN
DRAFT - SEPTEMBER 18, 2020 55
`Goal 3: Protecting the natural and social environment.
Goal Objectives Policies Performance Measures (PM) and Indicators (PI)
3.01 Limit average increase in CO, HC, and NO emissions to less than 15 percent from the previous five-year period for each five year period from 2025 to 2045.
Policy 3.01.1 – Implement the transportation improvements identified in the 2045 Cost Feasible Plan.
PI 3.01.1.1 – Percent change in CO, HC, and NO emissions (in kilograms) for each five year period from the base year for the period from 2025 to 2045.
3.02 Ensure that all collector roadways are less than six lanes through the year 2045.
Policy 3.02.1 – Implement the transportation improvements identified in the 2045 Cost Feasible Plan.
PI 3.02.1.1 – Centerline miles of collector roadways with six or more lanes.
3.03 Increase resiliency of infrastructure for extreme weather and climate trends.
Policy 3.03.1 – Incorporate higher elevations, increased drainage capacity, and more resilient construction materials as appropriate into new projects.
PI 3.03.1.1 – Percentage of new projects incorporating enhanced features.
`Goal 4: Maintaining a safe transportation system for all users.
Goal Objectives Policies Performance Measures (PM) and Indicators (PI)
4.01 Reduce the number and rate of crash Fatalities to 0 by 2045
Policy 4.01.1 – Implement intersection and other improvements related to safety as identified in the Cost Affordable Plan including Congestion Management Process plan.
PI 4.01.1.1 – Annual percent change in the number and rate of Fatalities.
4.02PM Reduce the number and rate of Serious Injuries to 0 by 2045.
Policy 4.02.1 – Implement intersection and other improvements related to safety as identified in the Cost Affordable Plan including Congestion Management Process plan.
PM 4.02.1.1 – Annual percent change in the number and rate of Serious Injuries.
4.03PM Reduce the number and rate of Non-Motorized Fatalities and Serious Injuries to 0 by 2045.
Policy 4.03.1 – Implement intersection and other improvements related to safety as identified in the Cost Affordable Plan and Bike/Ped Plan
PM 4.03.1.1 – Annual percent change in the number and rate of Non-Motorized crashes.
PM - Indicates FAST Act System Performance Report Adopted Performance Measure
6
CONNECTING IRC
DRAFT - SEPTEMBER 18, 2020
`Goal 5: Preserving and maintaining the transportation system and transportation infrastructure.
Goal Objectives Policies Performance Measures (PM) and Indicators (PI)
5.01PM
Ensure that over 60% of the pavement area on the National Highway System (NHS) are rated “Good” by FDOT while less than 5% are rated “Poor” by FDOT
Policy 5.01.1 – Evaluate the structural integrity of bridges on the major road network and implement rehabilitation projects as appropriate in coordination with FDOT.
PM 5.01.1.1 – FDOT Pavement Condition Rating
5.02PM
Ensure that over 50% of the bridge deck area on the National Highway System (NHS) are rated “Good” by FDOT while less than 10% are rated “Poor” by FDOT
Policy 5.02.1 – Evaluate the structural integrity of bridges on the major road network and implement rehabilitation projects as appropriate in coordination with FDOT.
PM 5.02.1.1 – FDOT Bridge Condition Rating.
PM - Indicates FAST Act System Performance Report Adopted Performance Measure

2045 LONG RANGE TRANSPORTATION PLAN
DRAFT - SEPTEMBER 18, 2020 77
A matrix showing consistency between the LRTP Goals and the 10 planning factors from the FAST Act is shown in Table 2.
Table 2: Connecting IRC 2045 Goals and FAST Act Planning Factors Comparison
Relationship between the LRTP Goals and the FAST Act Planning
Factors
Economic Vitality
Safety Security Movement
of People & Freight
Environment and Quality of
Life
Integration / Connectivity
System Management &
Operation
System Preservation
Resiliency Tourism
Providing an efficient transportation system that is connected, responsive, aesthetically pleasing and meets the needs of all users.
n n n n n n n
Enhancing mobility for people and freight and provide travel alternatives. n n n n n n n n n n
Protecting the natural and social environment. n n n n n n n n n
Maintaining a safe transportation system for all users. n n n n n n n n
Preserving and maintaining the transportation system and transportation infrastructure.
n n n n n n n n n

8
CONNECTING IRC
DRAFT - SEPTEMBER 18, 2020
FLORIDA TRANSPORTATION PLAN (FTP) The Florida Transportation Plan (FTP) is the single overarching statewide plan guiding Florida’s transportation future. The plan was created by, and provides direction to, FDOT and all organizations that are involved in planning and managing Florida’s transportation system, including statewide, regional, and local partners. This includes the Indian River County MPO. The FTP Policy Element is Florida’s long-range transportation plan as required by both state and federal law and this element points toward a future transportation system that embraces all modes of travel, innovation, and change.
MPOs are required to address the goals included in the FTP. These goals include the following:
` Safety and security for residents, visitors, and businesses
` Agile, resilient, and quality infrastructure
` Efficient and reliable mobility for people and freight
` More transportation choices for people and freight
` Transportation solutions that support Florida’s global economic competitiveness
` Transportation solutions that support quality places to live, learn, work, and play
` Transportation solutions that enhance Florida’s environment and conserve energy
MPOs must also incorporate any performance targets which may be included in the Statewide Freight Plan and Asset Management Plan. Current guidance from FDOT indicates that no additional performance targets will be included in these plans. A matrix showing consistency between the LRTP Goals and the planning factors from the (FTP) is shown in Table 3.
Table 3: Connecting IRC 2045 Goals and Florida Transportation Goals Comparison
Relationship between the LRTP Goals and the Florida Transportation Plan Goals
Safety and Security
Resilience Efficiency Transportation
Choices Economic
Competitiveness Quality Places Environment
Providing an efficient transportation system that is connected, responsive, aesthetically pleasing and meets the needs of all users.
n n n n n n n
Enhancing mobility for people and freight and provide travel alternatives. n n n n n n n
Protecting the natural and social environment. n n n n n n n
Maintaining a safe transportation system for all users. n n n n n n n
Preserving and maintaining the transportation system and transportation infrastructure. n n n n n n n

2045 LONG RANGE TRANSPORTATION PLAN
DRAFT - SEPTEMBER 18, 2020 99
SYSTEM PERFORMANCE REPORT Performance Management is a strategic approach to connect investment and policy decisions to help achieve performance goals. Performance measures are quantitative criteria used to evaluate progress against adopted performance targets.
The Moving Ahead for Progress in the 21st Century Act (MAP-21) requires State DOTs and MPOs to conduct performance-based planning by tracking performance measures and setting data-driven targets to improve those measures. Performance-based planning ensures the most efficient investment of federal transportation funds by increasing accountability, transparency, and providing for better investment decisions that focus on key outcomes related to the national goals:
` Improving Safety;
` Maintaining Infrastructure Condition;
` Reducing Traffic Congestion;
` Improving the Efficiency of the System
` Improving Freight Movement;
` Protecting the Environment; and,
` Reducing Delays in Project Delivery.
The Fixing America’s Surface Transportation (FAST) Act supplements the MAP-21 legislation by establishing timelines for State DOTs and MPOs to comply with the requirements of MAP-21. State DOTs are required to establish statewide targets, and MPOs have the option to support the statewide targets or adopt their own.
The 2045 LRTP System Performance Report providing more details related to Indian River County MPO's performance measures can be found in Appendix A.
Performance Measure 1 - Safety Performance Measures Safety is the first national goal identified in the FAST Act. In March of 2016, the Highway Safety Improvement Program (HSIP) and Safety Performance Management Measures Rule (Safety PM Rule) was finalized and published in the Federal Register. The rule requires MPOs to set targets for the following safety-related performance measures and report progress to the State DOT:
` Fatalities;
` Serious Injuries;
` Nonmotorized Fatalities and Serious Injuries;
` Rate of Fatalities per 100 million Vehicle Miles Traveled (VMT); and
` Rate of Serious Injuries per 100 million VMT.
The 2016 Florida Strategic Highway Safety Plan (SHSP) is the statewide plan focusing on how to accomplish the vision of eliminating fatalities and reducing serious injuries on all public roads. The SHSP was developed in coordination with Florida’s metropolitan planning organizations (MPOs) through Florida’s Metropolitan Planning Organization Advisory Council (MPOAC). The SHSP development process included review of safety-related goals, objectives, and strategies in MPO plans. The SHSP guides FDOT, MPOs, and other safety partners in addressing safety and defines a framework for implementation activities to be carried out throughout the State.
The Florida SHSP and the Florida Transportation Plan (FTP) both highlight the commitment to a vision of zero deaths. The FDOT Florida Highway Safety Improvement Program (HSIP) annual report documents the statewide performance measures toward that zero deaths vision. As such, the MPO supports the adoption of the FDOT statewide HSIP safety performance measures and FDOT’s target of “0” for each safety performance measure to reflect the FDOT goal of zero deaths.
FDOT, with the understanding that zero fatalities/serious injuries is unable to be achieved within the 2018 Highway safety Plan (HSP), developed statistical data models to forecast the number of fatalities and serious injuries. Based on the forecasts of these statistical models, FDOT established targets and programmed projects that they expect will reduce the number of fatalities and serious injuries. The five federally-mandated Safety Performance Measures targets for 2019 for FDOT and the Indian River County MPO are presented below in Table 4.
Safety Performance Measure targets are required to be adopted on a yearly basis. In August of the current year, FDOT will report the following year’s targets in the HSIP Annual Report to the Federal Highway Administration. After FDOT adopts the targets, the MPO is required to either adopt FDOT’s targets or establish its own within six months (or the following February).
Table 4: Performance Measure 1 (PM1) - Safety Performance Measure Targets
Safety Performance Measure FDOT Statewide Targets
Indian River MPO Safety Targets
Number of Fatalities 0 0
Number of Serious Injuries 0 0
Rate of Fatalities per 100 Million Vehicle Miles Traveled (VMT)
0 0
Rate of Serious Injuries per 100 Million Vehicle Miles Traveled (VMT)
0 0
Total Number of Non-motorized Fatalities and Non-motorized Serious Injuries
0 0

10
CONNECTING IRC
DRAFT - SEPTEMBER 18, 2020
- -
- -
Performance Measure 2 - Bridge, Pavement, and System Performance Measures The second of the performance measures rules issued by Federal Highway Administration (FHWA) became effective on May 20, 2017, establishing measures to assess pavement and bridge condition on the National Highway System (NHS). Requirements involve measuring the condition of these facilities and reporting conditions that are considered “Good” and those considered “Poor.” Facilities rated as Good suggest that no major investments are needed. Facilities rated as Poor indicate major investments will be needed in the near term.
FDOT has the capability to collect and maintain data regarding bridge and pavement condition. In October 2018, the MPO adopted pavement and bridge condition performance targets in support of the measures and targets set by FDOT (see Table 5 below).
Table 5: Performance Measure 2 (PM2) - Bridge and Pavement Performance Targets
Bridge and Pavement Performance Measure
Florida 2 year Targets 1/1/2018 to 12/31/2019
Florida 4 year Targets 1/1/2018 to 12/31/2021
Percent of Interstate NHS Pavement in Good Condition
Not Required ≥ 60%
Percent of Interstate NHS Pavement in Poor Condition
Not Required ≤ 5%
Percent of Non-Interstate NHS Pavement in Good Condition
≥ 40% ≥ 40%
Percent of Non-Interstate NHS Pavement in Poor Condition
≤ 5% ≤ 5%
Percent of NHS Bridges by Deck Area in Good Condition
≥ 50% ≥ 50%
Percent of NHS Bridges by Deck Area in Poor Condition
≤ 10% ≤ 10%
PM3 Baseline Performance and Established Targets The System Performance Report discusses the condition and performance of the transportation system for each applicable PM3 target as well as the progress achieved by the MPO in meeting targets in comparison with system performance recorded in previous reports. Because the federal performance measures are new, performance of the system for each measure has only recently been collected and targets have only recently been established. Accordingly, this Indian River County MPO LRTP System Performance Report highlights performance for the baseline period, which is 2017. FDOT will continue to monitor and report performance on a biennial basis. Future System Performance Reports will discuss progress towards meeting the targets since this initial baseline report.
Table 6 presents baseline performance for each PM3 measure for the state and for the MPO planning area as well as the two-year and four-year targets established by FDOT for the state.
Table 6: Performance Measure 3 (PM3) - System Performance Targets
System Performance Measure
Statewide Performance
(2017 Baseline)
Florida 2 year Targets 1/1/2018 to 12/31/2019
Florida 4 year Targets
1/1/2018 to 12/31/2021
Percent of person-miles on the Interstate system that are reliable (Interstate LOTTR)
82.2% 75.0% 70.0%
Percent of person-miles on the non-Interstate NHS that are reliable (Non-Interstate NHS LOTTR
84.0% Not Required 50.0%
Truck travel time reliability index (TTTR)
1.43 1.75 2.00
The Indian River County MPO agreed to support FDOT’s PM3 targets on October 17, 2018. By adopting FDOT’s targets, the Indian River County MPO agrees to plan and program projects that help FDOT achieve these targets.
The Indian River County MPO recognizes the importance of linking goals, objectives, and investment priorities to established performance objectives, and that this link is critical to the achievement of national transportation goals and statewide and regional performance targets. As such, the Indian River County MPO 2045 LRTP reflects the goals, objectives, performance measures, and targets as they are described in other state and public transportation plans and processes, including the Florida Transportation Plan (FTP) and the Florida Freight Mobility and Trade Plan.
` The FTP is the single overarching statewide plan guiding Florida’s transportation future. It defines the state’s long-range transportation vision, goals, and objectives and establishes the policy framework for the expenditure of state and federal funds flowing through FDOT’s work program. One of the goals of the FTP is Efficient and Reliable Mobility for People and Freight.
` The Florida Freight Mobility and Trade Plan presents a comprehensive overview of the conditions of the freight system in the state, identifies key challenges and goals, provides project needs, and identifies funding sources. Truck reliability is specifically called forth in this plan, both as a need as well as a goal.
The Indian River County MPO 2045 LRTP seeks to address system reliability and congestion mitigation through various means, including capacity expansion and operational improvements, supported by the stated Goals and Objectives.
On or before October 1, 2020, FDOT will provide FHWA and the Indian River County MPO a detailed report of performance for the PM3 measures covering the period of January 1, 2018 to December 31, 2019. FDOT and the Indian River County MPO also will have the opportunity at that time to revisit the four-year PM3 targets.

2045 LONG RANGE TRANSPORTATION PLAN
DRAFT - SEPTEMBER 18, 2020 1111
Transit Asset Management Performance Measures Maintain and preserve the transportation system is one of 5 Major Goals of the 2045 LRTP. In addition, the LRTP sets forth numerous objectives and policies that promote infrastructure condition and
In addition to identifying the procedures for inventorying and rating the condition of pavement and bridges system reliability.in the state, the Florida Transportation Asset Management Plan also sets forth the following overarching asset management objectives: With the adoption of MAP-21, MPOs are now required to establish performance targets for the management
of transit assets. On September 12, 2018, the Indian River County MPO established the transit asset targets ` Achieve and maintain a state of good repair for transportation assets; shown in Tables 7 and 8 for the MPO’s planning area. Table 8 summarizes the required performance targets
for transit vehicles and equipment as well as the current status of each performance measure. Transit` Reduce the vulnerability and increase the resilience of critical infrastructure to the impacts of extreme
vehicles have a useful life benchmark of 4-12 years, based on the vehicle type. The performance measure for weather and events; and vehicles is the percent of vehicles that are within their respective useful life benchmark.
` Minimize damage to infrastructure from transportation vehicles.
Table 7: Performance Measures for Transit Vehicles and Equipment
Asset Category
Asset Class Individual Assets # of Vehicles
Vehicle Age in Years
Useful Life Benchmark (ULB) in Years
% Exceeding ULB (including spare vehicles) FY 19 Target Current Status (Active Fleet) Current Status (Active + Spare)
Revenue Vehicles (Fixed Route)
Bus (BU)
2013 Gillig 3 5 12
25% 0% 0%2015 Gillig 2 3 12
2016 Gillig 1 2 12
Cutaway Bus (CU)
2004 Turtle Top 2 14 5
50% 0% 35% 2009 Glaval 6 9 5
2013 Champion 4 5 7 2016 Turtle Top 5 2 5 2018 Champion 4 0 7
Revenue Vehicles (Demand Response)
Cutaway Bus (CU)
2005 Turtle Top 3 13 5
67% 45% 68%
2006 Turtle Top 3 12 5
2007 Turtle Top 3 11 5
2009 Turtle Top 4 9 5
2013 Champion 1 5 5
2015 Turtle Top 2 3 5
2017 Champion 1 1 5
2017 Turtle Top 1 1 5
2018 Champion 1 0 5
Van (VN) 2010 Braun Entervan 3 8 4
67% 0% 86%2012 MV1 3 6 4 2018 Braun Entervan 1 0 4
Equipment Truck 2014 Chevrolet 1 4 8 50% 0% 0%

12
CONNECTING IRC
DRAFT - SEPTEMBER 18, 2020
Table 8 summarizes the required performance targets for transit facilities as well as the current status of each performance measure. Transit facilities are rated using the Transit Economic Requirements Model (TERM) Scale. The TERM scale has a range of 1 to 5, with 5 representing facilities in the best condition. A TERM rating of 3.0 represents a facility in adequate condition. Each facility is assigned a rating based on its condition.
Table 8: Performance Targets for Transit Facilities and Current Status
Asset Category Asset Class Individual Assets Condition Assessment –
TERM Rating FY 19 Target (% Under
TERM 3.0) Current Status Notes
Facilities Administrative / Maintenance Transit Administration & Maintenance Facility 5.0 0% 0% Constructed in 2012
Passenger Main Transit Hub 5.0 0% 0% Constructed in 2017
The Indian River County TIP was developed and is managed in cooperation with Senior Resource Association, which operates Indian River County’s public transportation system. It reflects the investment priorities established in the previously adopted 2040 LRTP. Transit asset condition and state of good repair is a consideration in the methodology the MPO uses to select projects for inclusion in the TIP. The TIP includes specific investment priorities that support all of the MPO’s goals, including transit state of good repair, using a prioritization and project selection process established in the LRTP. This process evaluates projects that, once implemented, are anticipated to improve transit state of good repair in the MPO’s planning area. The MPO’s goal of improving transit asset condition is linked to this investment plan, and the process used to prioritize the projects within the TIP is consistent with federal requirements.
Enhance mobility for people and freight and provide travel alternatives is one of 5 Major Goals of the 2045 LRTP. To this end, the LRTP identifies numerous objectives and policies that promote alternative modes of mobility, including that capital and operational improvements be consistent with the MPO’s Transit Development Plan (TDP). By October 1, 2018, transit agencies were required to adopt Transit Asset Management (TAM) plans. In Indian River County, the TAM plan is required to include an inventory of assets, a condition assessment of inventoried assets, a description of decision support tools, and a prioritized list of investments. By following the Transit Asset Management plan, agencies can maintain transit systems in a state of good repair. The transit asset performance targets identified above are consistent with Indian River County’s TAM plan.

2045 LONG RANGE TRANSPORTATION PLAN
DRAFT - SEPTEMBER 18, 2020 1313
2045 LRTP REVENUE FORECAST INTRODUCTION An important focus of long range transportation planning includes projecting revenues reasonably expected for use in prioritizing the Needs Plan and in developing a Cost Feasible Plan. Projected revenues are a snapshot in time of the current revenue picture and anticipated trends. An important aspect of the revenue forecast is determining transportation revenues spent on capital versus operations and maintenance (O&M). Maintaining transportation infrastructure into the future will be a continuing and central focus.
This memorandum documents the financial resources projected to be available for the Indian River County Metropolitan Planning Organization (MPO) 2045 Long Range Transportation Plan (LRTP). Coordination was conducted with the following agencies and local governments in the preparation of this forecast:
` Florida Department of Transportation;
` Indian River County Staff County staff;
` Indian River County MPO Staff; and,
` MPO Technical Advisory Committee (TAC)
This memorandum outlines the projected financial resources available for transportation improvements in the Indian River County MPO area for the period of 2025 to 2045. Financial resources for the period prior to 2025 are identified in the MPO’s current Transportation Improvement Program (TIP). The projected financial resources include funds from the federal and state governments, as well as revenues generated locally, such as local fuel taxes and transportation impact fees. The analysis and documentation of the financial resources are organized into three sections:
OVERVIEW OF FINANCIAL RESOURCES The available revenues for the long range transportation plan can be categorized into two major categories:
` Federal and state revenues
` Local revenues
Federal and state revenues for roadway were obtained from the 2045 MPO Revenue Forecast provided by FDOT. Federal and state revenues for transit were sourced from the most recent Indian River County Transit Development Plan (TDP). Input from Indian River County staff was helpful in developing local revenue projections.
Federal and state revenues for roadway are derived from sources such as State fuel taxes, State tourism driven surcharges, vehicle related taxes, documentary stamp taxes, Turnpike tolls, and federal distributions. The revenue estimates for capacity projects presented in this document considered the following funding programs:
` Strategic Intermodal System (SIS) Highways Construction and Right-of-Way
` Other Roads Construction and Right-of-Way (ROW)
` Transportation Regional Incentive Program (TRIP)
` Transportation Alternatives Program (TAP) funds listed under FDOT codes TALL and TALT
` Federal/State Revenues and Grants for Transit
` Contributions from local revenues
The TRIP and TALT funds are shown as illustrative only and are not used in the development of cost feasible projects. FDOT only estimates TRIP funds at the District level and not at the county level; hence, the actual amount allocated to Indian River County is unknown. The TRIP funds identified in Section 3 are based on the population percentage of Indian River County within FDOT District 4 and represent a reasonable estimate of TRIP funds that may be captured within Indian River County. TRIP funds, given their regional focus, are selected through the Treasure Coast Transportation Council composed of the Martin, St. Lucie, and Indian River M/TPOs.
Local revenue forecasts considered the following sources:
` Fuel taxes
» 6-Cent Local Option Fuel Tax
» 9th Cent Fuel Tax (charged on diesel only)
» Constitutional Fuel Tax
» County Fuel Tax
` Traffic impact fees
` 1-Cent Local Option Sales Tax
Revenue sources for transit are detailed on the following page.

14
CONNECTING IRC
DRAFT - SEPTEMBER 18, 2020
FINANCIAL PROJECTIONS Revenue Estimates for Roadway Capacity Projects Table 9 provides a summary of the roadway revenue totals by revenue source estimated for capital projects for the 2025-2045 period. The revenues are provided in Year of Expenditure (YOE) dollars, which takes into account inflation on the current estimates. The Indian River County MPO will assume that 15% of their estimates for the Other Roads Construction & ROW program can be used for “off-system” roads according to FDOT guidance . The SIS funds are listed separate from the other State funds as SIS funds are programmed specifically for SIS projects.
Table 9: Total Revenue for Roadway Capital Projects (2025-2045) (Year of Expenditure)
Category Total Projected Revenues 2025-2045
State and Federal
Other Roads Construction and ROW $272,450,000
Other Roads – Product Support $59,939,000
TALL $3,854,000
TALT $4,200,000
TRIP $8,400,000
Impact Fees $88,500,000
Local 6-Cent Local Option Fuel Tax $36,256,000
9th Cent Fuel Tax $1,455,000
Infrastructure Sales Tax $211,950,000
Subtotal (Non-SIS) $674,404,000
Strategic Intermodal System $50,382,000
Total $732,993,000

2045 LONG RANGE TRANSPORTATION PLAN
DRAFT - SEPTEMBER 18, 2020 1515
Revenue Estimates for Roadway Operations and Maintenance Projects Operations and Maintenance (O&M) includes activities that support and maintain transportation infrastructure once it is constructed. As directed by FDOT policy, the Department places primary emphasis on safety and preservation of the transportation system by providing adequate funding in the Revenue Forecast to meet established maintenance performance standards. As such, funding for O&M on the State Highway System (SHS) are allocated before revenues are subsequently allocated for capacity improvement projects. Indian River County also allocates local resources for ensuring acceptable operating conditions on the county major roadway network. Table 10 provides a summary of the estimated revenues for O&M on the SHS and local roadways.
Table 10: Total Revenue for Roadway Operations and Maintenance (2025-2045) (Year of Expenditure)
Category Total Projected Revenues 2025-2045
State and Federal
Districtwide SHS $9,131,600,000
County Fuel Tax $20,938,000
Constitutional Fuel Tax $46,967,000
Local First Local Option Fuel Tax $63,623,000
9th Cent Fuel Tax $2,554,000
General Fund for Transportation $44,985,000
Local Subtotal $179,067,000

16
CONNECTING IRC
DRAFT - SEPTEMBER 18, 2020
Revenue Estimates for Transit Projects The Cost Feasible Plan for transit includes funding the existing transit service. Table 11 below displays the revenues forecasted to be available for GoLine and Community Coach services from 2025 to 2045. Both state and federal and local transit revenues were forecast using the 10-Year Service and Financial Plan section of the 2019-2028 GoLine Transit Development Plan. Revenues were forecast assuming linear growth based on the values presented in this document.
Table 11: Total Revenue for Transit (2025-2045) (Year of Expenditure)
Category Total Projected Revenues 2025-2045
State and Federal
Federal 5307 (for capital) $25,367,000
Federal 5339 (for capital) $5,500,000
Federal 5310 (for capital) $1,856,000
TD Commission Funds (for capital) $1,575,000
Federal 5307 (for O&M) $63,613,000
Federal 5310 (for O&M) $4,125,000
Federal 5311 (for O&M) $1,842,000
FDOT State Block Grant (for O&M) $13,875,000
FDOT Service Development (for O&M) $8,112,000
FDOT Corridor (for O&M) $3,270,000
TD Commission Funds (for O&M) $9,939,000
Local
Local (for capital) $207,000
County General Funds (for O&M) $29,964,000
Co-Pay/Donations/Other (for O&M) $475,000
Total $169,720,000

2045 LONG RANGE TRANSPORTATION PLAN
DRAFT - SEPTEMBER 18, 2020 1717
REVENUE SUMMARY The Indian River County revenue forecast for 2025 to 2045 is summarized in Table 12. It is estimated that the county will receive a total of $272.5 million in federal and state funding for SHS and off-system roads, as well as $60 million in funds for product support (PD&E and Engineering Design). An additional $3.8 million is projected to be available through the TALL program. SIS projects will receive an estimated $46 million during the plan horizon. Finally, the County is estimated to generate $517.2 million in local revenues during the LRTP period, as well as $169.7 million in transit revenues.
Table 12: Summary of Indian River County Revenues (2025-2045) (Year of Expenditure)
Category Total Projected Revenues 2025-2045
Projected State and Federal Revenues
Other Roads Construction & ROW $272,450,000
Other Roads - Product Support $59,939,000
TALL (TA funds for areas with populations between 5,000 and 200,000) $3,854,000
Strategic Intermodal System Projects
SIS Revenues $50,382,000
Projected Local Revenues
Indian River County Revenues $517,228,000
Projected Transit Revenues
Indian River County Transit Revenues $169,721,000
Total $1,073,574,000

18
CONNECTING IRC
DRAFT - SEPTEMBER 18, 2020
TRANSPORTATION PLAN COST FEASIBLE PLAN DEVELOPMENT In long range transportation planning, a Cost Feasible Plan (CFP) identifies financially viable improvements to an area’s transportation network. The CFP builds upon the Deficiencies Map, Needs Plan, Financial Resources, and Long Range Transportation Plan (LRTP) Goals and Objectives by prioritizing transportation improvements necessary to maintain satisfactory mobility conditions to the year 2045. The CFP is developed in a fiscally constrained manner based on transportation revenues anticipated to be available through 2045. The CFP is fiscally constrained; both costs of transportation improvements and revenues expected to be available to fund transportation improvements are taken into consideration.
Needs Assessment The identification of the transportation system capacity deficiencies was evaluated and analyzed to identify the initial roadway needs as part of the Indian River County 2045 Long Range Transportation Plan (LRTP). The purpose of a Needs Assessment is to identify the transportation infrastructure that is essential for accommodating future travel demand, addressing safety issues, and meeting community needs for the next 25 years. A Needs Assessment is fiscally unconstrained, meaning funding requirements for improvements are not considered. The Needs Assessment serves as the basis for the development of the Cost Feasible Plan, which is impacted by anticipated funds throughout the 25-year planning range.
Methodology The Treasure Coast Regional Planning Model version 5 (TCRPM5) was used to forecast future transportation conditions with the aid of socioeconomic data, which includes population and employment, and roadway network attributes. The TCRPM5 is a regional travel demand model that includes the three Treasure Coast counties (Martin, St. Lucie, and Indian River counties). This was developed by the Florida Department of Transportation (FDOT) District Four. Similar, to the previous model, the TCRPM5 is an activity-based model (ABM). An activity-based model is primarily influenced by household and individual characteristics and by the performance of the transportation system.
Model Refinement The Treasure Coast Regional Planning Model version 5 (TCRPM5) was used to forecast future transportation conditions with the aid of socioeconomic data, which includes population and employment, and roadway network attributes. The TCRPM5 is a regional travel demand model that includes the three Treasure Coast counties (Martin, St. Lucie, and Indian River counties). This was developed by the Florida Department of Transportation (FDOT) District Four. Similar, to the previous model, the TCRPM5 is an activity-based model (ABM). An activity-based model is primarily influenced by household and individual characteristics and by the performance of the transportation system.
2045 E+C Roadway Deficiencies The 2045 traffic demand projections used the TCRPM5 E+C network and made the assumption that no capacity-producing roadway improvements would be implemented from 2025-2045. In other words, it assessed the impact of the 25 years of growth on the E+C network. Volume-to-capacity (V/C) ratios were examined to identify roadway deficiencies resulting from the growth in travel demand model over the 25-year period. Deficient roadways are candidates for potential roadway improvements or indicators that parallel network improvements are essential. The level of service (LOS) D was utilized when estimating the V/C ratio. This method is consistent with Indian River County’s Concurrency Management System.
The results of the analysis demonstrate that a number of roadways will experience congestion by 2045 if additional improvements are not made beyond the improvements for which construction funding has been committed over the next five years.
Roadway Needs Assessment The 2045 E+C roadway deficiencies serve as the starting point for the development of the roadway improvement project needs. In addition to the 2045 E+C roadway deficiencies, roadways listed in the previously adopted 2040 LRTP were included. It should be noted that adjustments were made to the limits of the needs projects to provide logical termini. The final roadway Needs Assessment is shown in Figure 1 and listed in Table 13. Aspirational Projects were identified in the initial roadway needs assessment based on prior planning efforts. These projects may be associated with future development opportunities that are not currently quantified or on a projected schedule.

2045 LONG RANGE TRANSPORTATION PLAN
DRAFT - SEPTEMBER 18, 2020 1919
Table 13: 2045 Final Roadway Needs Projects
Facility From To Improvement New Interchange/Modify Intersection I-95 @ Oslo Road New Interchange I-95 @ 53rd Street New Interchange CR 510 @ US 1/SR 5 Intersection Improvement 26th Street/Aviation Blvd @ US 1/SR 5 New Interchange Widen from 2 to 4 Lane (or equivalent capacity)* CR 512 Willow Street I-95 Widen from 2L to 4L CR 510 CR 512 87th Street Widen from 2L to 4L CR 510 87th Street 82nd Avenue Widen from 2L to 4L CR 510 82nd Avenue 58th Avenue Widen from 2L to 4L CR 510 58th Avenue US 1 Widen from 2L to 4L 66th Avenue 49th Street 69th Street Widen from 2L to 4L 66th Avenue 69th Street 81st Street Widen from 2L to 4L 66th Avenue 81st Street CR 510 Widen from 2L to 4L 66th Avenue CR 510 Barber Street Widen from 2L to 4L 26th Street/Aviation Blvd 66th Avenue 43rd Avenue Widen from 2L to 4L 26th Street/Aviation Blvd 43rd Avenue US 1 Widen from 2L to 4L Aviation Blvd Extension US 1/SR 5 41st Street Widen from 2L to 4L 43rd Avenue St. Lucie County Line Oslo Road Widen from 2L to 4L 43rd Avenue Oslo Road 16th Street Widen from 2L to 4L Roseland Road CR 512 US 1 Widen from 2L to 4L 27th Avenue St. Lucie County Line Oslo Road Widen from 2L to 4L Oslo Road I-95 58th Avenue Widen from 2L to 4L SR 60 @ 43rd Avenue Intersection 18th Street 26th Street Widen from 2L to 4L Widen from 2 to 4 Lane (or equivalent capacity)* US 1 53rd Street CR 510 Widen from 4L to 6L CR 512 I-95 CR 510 Widen from 4L to 6L New 2 Lane or Substandard to 2 Lane 53rd Street 58th Avenue 66th Avenue New 2L 53rd Street 66th Avenue 82nd Avenue New 2L 53rd Street 82nd Avenue Fellsmere N-S Rd 1 New 2L
* If/when the projects advance to the Project Development and Environment (PD&E) or design phase, determine if alternative strategies such as two‐way left‐turn lanes, intersection improvements, operational enhancements, or multimodal solutions would effectively address level of service and mobility needs in lieu of the recommended road widening

20
CONNECTING IRC
DRAFT - SEPTEMBER 18, 2020
Table 13: 2045 Final Roadway Needs Projects (continued)
Facility From To Improvement 74th Avenue Oslo Road 12th Street New 2L 69th Street 82nd Avenue CR 512 New 2L 17th Street SW 27th Avenue 58th Avenue New 2L 21st Street SW 27th Avenue 58th Avenue New 2L St. John Hertiage Park Extension CR 512 County Line New 2L 13th Street SW 27th Avenue 58th Avenue New 2L Fellsmere N-S Rd 2 CR 512 69th Street New 2L 98th Avenue 12th Street 4th Street New 2L Fellsmere N-S Rd 1 CR 512 SR 60 New 2L 4th Street 66th Avenue 98th Avenue New 2L 25th Street SW 27th Avenue 58th Avenue New 2L 26th Street 82nd Avenue CR 507 New 2L 58th Avenue Oslo Road St. Lucie County Line New 2L 12th Street 74 Avenue 58th Avenue Substandard to 2L 82nd Avenue 26th Street 69th Street Substandard to 2L 82nd Avenue 69th Street CR 510 Substandard to 2L 82nd Avenue CR 510 Laconia Substandard to 2L 5th Street SW 20th Avenue 11th Square SW Substandard to 2L 5th Street SW 11th Square SW Old Dixie Highway Substandard to 2L Other Indian River Boulevard (SR 60) 20th Street Merrill P. Barber Bridge Strategic Improvements

2045 LONG RANGE TRANSPORTATION PLAN
DRAFT - SEPTEMBER 24, 2020
43R
DAV
E
45TH ST I
28TH
AVE
NDIAN R41ST ST IVER BLVD
MO
CK
ING
BIR
D D
R
37TH ST T
N SIAMRO
SELANDRD
D V30TH ST L
M BLA26TH ST
L P27TH ST AYO
SCH
UM
AN
N D
R
R23TH ST BARBERST
20TH PL 21TH ST 20TH ST 19TH PL
LAC
ON
IA S
T
10TH
AVE
60
14TH
AVE
16TH ST
12TH ST 58TH
AVE
43R
D A
VE
20TH
AVE
27TH
AVE
6TH
AVE
8TH ST
66TH
AVE
60
INDIANRIVER
BLVD
26TH ST
21ST ST 20TH ST
16TH ST 16TH ST
8TH ST 8TH ST
66TH
AVE
SW 4TH ST
1ST ST SW
Figure 1: 2045 Final Roadway Needs Projects
BREVARD ¯
605 1 77TH ST
FELLSMERE
98TH
AVE
G
82N
DAV
E
SEBASTIAN O c e a n 510 G
6043R
DAV
ESW
27TH
AVE
20TH
AVE
0 1 2 MilesVERO BEACH
G §̈95 512507
ORCHID 512
510 A t l a n t i c656
69TH ST 1
65TH ST
INDIAN £1 RIVER
53RD ST512 SHORESG
49TH ST
45TH ST
41ST ST
§̈95
58TH
AVE
SW
58
TH A
VE VERO BEACH
G 60 60
656
12TH STLegend Committed Projects Roadway Needs Aspirational Background 2021 - 2025 (2026 - 2045) Roadways Urban
1605Boundary2 Lanes2 Lanes 2 Lanes 5TH ST SW4 Lanes 4 Lanes CountyIntersectionG OSLO RDBoundary OSLO RD6 Lanes Improvement 607
Strategic Existing Roads Improvements £1 Intersection
G HIGHLAND DR SWImprovement
ST LUCIE
2121

22
CONNECTING IRC
DRAFT - SEPTEMBER 18, 2020
COST FEASIBLE PLAN Detailed tables of the Cost Feasible Plan projects are included in Appendix B and Appendix C of this document. Exhibit A includes the projects with the Year-of-Expenditure (YOE) costs, while Exhibt B includes the projects in terms of Present Day Value (PDV).
All 2045 LRTP-identified projects total $1.06 billion (YOE) of roadway costs. Unfunded Needs account for a third of that total, valuing about $354 million (YOE). Aspirational project costs are not reflected in these figures, as the uncertain time horizon of these projects makes cost estimation inaccurate. The tables included in Appendices B & C ensure that the proposed projects included in the Cost Feasible Plan are identified sufficiently per 23 C.F.R.
Table 14 includes Cost Feasible projects. The map in Figure 2 illustrates the projects shown in Table 14. The Map ID listed for each project in Table 14 are used to label the corresponding projects in Figure 2.

2045 LONG RANGE TRANSPORTATION PLAN
DRAFT - SEPTEMBER 18, 2020 2323
This page intentionally left blank.

24
CONNECTING IRC
DRAFT - SEPTEMBER 18, 2020
Table 14: Cost Feasible Plan Projects
2045 Capacity Projects: Fully Funded
Map ID On Street From Street To Street Improvement Implementation Timeframe
Strategic Intermodal System (SIS) Projects 1 SR-9/I-95 @ Oslo Road New Interchange 2026-2030
State Projects 2 26th Street/Aviation Blvd @ US 1/SR 5 New Interchange 2036-2045 3 CR 510 @ US 1/SR 5 Intersection Improvement 2031-2035 4 Indian River Blvd (SR 60) 20th Street Merrill P. Barber Bridge Strategic Improvements* 2036-2045 5 US 1 53rd Street CR 510 Widen from 4L to 6L 2036-2045 -- Operational/Technology Improvements N/A
Local Projects 6 Oslo Road I-95 58th Avenue Widen from 2L to 4L 2026-2030 7 74th Avenue Oslo Road 12th Street New 2L 2036-2045 8 43rd Avenue Oslo Road 16th Street Widen from 2L to 4L 2036-2045 9 26th Street/Aviation Blvd 66th Avenue 43rd Avenue Widen from 2L to 4L 2036-2045 10 26th Street/Aviation Blvd 43rd Avenue US 1 Widen from 2L to 4L 2031-2035 11 82nd Avenue 26th Street 69th Street Substandard to 2L 2031-2035 12 82nd Avenue 69th Street CR 510 New 2L 2026-2030 13 CR 510 87th Street 82nd Avenue Widen from 2L to 4L 2031-2035 14 CR 510 82nd Avenue 58th Avenue Widen from 2L to 4L 2026-2030 15 CR 510 58th Avenue US 1 Widen from 2L to 4L 2031-2035 16 82nd Avenue CR 510 Laconia Street New 2L 2036-2045 17 CR 512 I-95 CR 510 Widen from 4L to 6L 2036-2045 18 CR 512 Willow Street I-95 Widen from 2L to 4L 2036-2045
*Operational capacity projects to be determined
2045 Capacity Projects: Partially Funded
Map ID On Street From Street To Street Improvement Implementation Timeframe
Local Projects 19 53rd Street 66th Avenue 82nd Avenue New 2L Unfunded 20 12th Street 74 Avenue 58th Avenue Substandard to 2L Unfunded

2045 LONG RANGE TRANSPORTATION PLAN
DRAFT - SEPTEMBER 24, 2020
43R
DAV
E
GF
45TH ST I
28TH
AVE
NDIAN R41ST ST IVER BLVD
MO
CK
ING
BIR
D D
R
37TH ST T
N SIAMRO
SELANDRD
D
9 V30TH ST LM B
LA26TH ST L P27TH ST AYO
SCH
UM
AN
N D
R
R23TH ST BARBERST
20TH PL
10TH
AVE
21TH ST 20TH ST 19TH PL
LAC
ON
IA S
T
60
14TH
AVE
16TH ST
12TH ST 58TH
AVE
43R
D A
VE
20TH
AVE
27TH
AVE
6TH
AVE
8TH ST
66TH
AVE
INDIANRIVER
BLVD
26TH ST
21ST ST 20TH ST
16TH ST
8TH ST
66TH
AVE
SW 4TH ST
1ST ST SW
Figure 2: 2045 Cost Feasible Plan
BREVARD ¯
18 17
98TH
AVE
16
13 510 GF
GF OSLO RD
82N
DAV
E
43R
DAV
ESW
ORCHID
27TH
AVE
20TH
AVE
0 1 2 Miles
507
VERO BEACH 2
10 GF §̈95 512
512
154 510 A t l a n t i c656 SEBASTIAN O c e a n
8 3 605 1 14 77TH ST
12FELLSMERE 69TH ST
15 65TH ST
INDIAN 512 19 £1 RIVER
53RD ST SHORES 49TH ST
60 11 45TH ST
41ST ST
58TH
AVE
§̈95 2 9 10 GF 60
VERO60 60 BEACH20 65648
58TH
AVE
SW
Committed Projects (2021 - 2025) Cost Feasible Projects (2026 - 2045) 7 1605
StrategicNew road/ New road/ 5TH ST SWImprovementsImprove road Improve road
OSLO RD
Increase to 4 lanes Increase to 4 lanes GF Increase to 6 lanes
New Interchange/ 607
Modify Intersection 1 6 £1 HIGHLAND DR SW
ST LUCIE
2525

26
CONNECTING IRC
DRAFT - SEPTEMBER 18, 2020
BICYCLE AND PEDESTRIAN FACILITY IMPROVEMENTS Bicycle and pedestrian facility improvements may be implemented as part of overall roadway improvement projects or as standalone projects. Bicycle and pedestrian facility improvements may be incorporated as “complete streets” elements to overall roadway improvement projects. All cost feasible road projects assume the construction of sidewalks and bike lanes. Indian River County allocates a portion of gas tax revenues to construct bicycle and pedestrian facilities as standalone projects. In addition, Transportation Alternatives Program (TAP) funds may also be utilized to implement bicycle and pedestrian facility improvement projects.
Bicycle and pedestrian facility improvements are identified through the MPO’s planning process. The Indian River County’s Bicycle and Pedestrian Master Plan was developed January 2015. The Bicycle and Pedestrian Master Plan and Greenways Plans will continue to guide bicycle and pedestrian facilities improvements in Indian River County.
Figures 3 and 4 depict sidewalk/pedestrian enhancements, bicycle facility projects, and cost feasible road projects, which are expected to implement additional pedestrian and bicycle facilities.
The assessment of non-motorized enhances the quality of life and addresses long term transportation and environmental goals. The Indian River MPO has been actively engaged in identifying needs and opportunities for promoting alternative travel modes such as walking, cycling, and transit.

2045 LONG RANGE TRANSPORTATION PLAN
DRAFT - SEPTEMBER 24, 2020 2727
Figure 3: Sidewalk/Pedestrian Enhancements
49TH ST
65TH ST
58TH
AVE
69TH ST
77TH ST
45TH ST
£182N
DAV
E
43R
DAV
ESW
66TH
AVE
53RD ST
OSLO RD
ROSELAND
RD
98TH
AVE
27TH
AVE
INDIANRIVER
BLVD
5TH ST SW
1
20TH
AVE
43R
DAV
E
MAINST
£1
6060
§̈95
§̈95
20TH ST 21ST ST
1
4TH ST
1ST ST SW
66TH
AVE
SW
58TH
AVE
SW
HIGHLAND DR SW
41ST ST
26TH ST
LAC
ON
IA S
T
BARBERST
60
ST LUCIE
BREVARD
SCH
UM
AN
N D
R
60
OSLO RD
16TH ST
8TH ST
FELLSMERE
SEBASTIAN
VERO BEACH
INDIAN RIVER
SHORES
ORCHID 512
510
607
A t l a n t i c O c e a n
¯ 0 21 Miles
510
512
512
656
605
507
Legend Urban Boundary
County Boundary Sidewalk/Pedestrian Enhancements
in Conjunction with Road Projects
Proposed Sidewalk/ Pedestrian Enhancements
Existing Roads

28
CONNECTING IRC
DRAFT - SEPTEMBER 24, 2020
Figure 4: Bicycle Facility Projects
49TH ST
65TH ST
58TH
AVE
69TH ST
77TH ST
45TH ST
£182N
DAV
E
43R
DAV
ESW
66TH
AVE
53RD ST
OSLO RD
ROSELAND
RD
98TH
AVE
27TH
AVE
INDIANRIVER
BLVD
5TH ST SW
1
20TH
AVE
43R
DAV
E
MAINST
£1
6060
§̈95
§̈95
20TH ST 21ST ST
1
4TH ST
1ST ST SW
66TH
AVE
SW
58TH
AVE
SW
HIGHLAND DR SW
41ST ST
26TH ST
LAC
ON
IA S
T
BARBERST
60
ST LUCIE
BREVARD
SCH
UM
AN
N D
R
60
OSLO RD
16TH ST
8TH ST
FELLSMERE
SEBASTIAN
VERO BEACH
INDIAN RIVER
SHORES
ORCHID 512
510
607
A t l a n t i c O c e a n
¯ 0 21 Miles
510
512
512
656
605
507
Legend Urban Boundary
County Boundary Bicycle Facility Projects in
Conjunction with Road Projects
Proposed Bicycle Facility Projects
Existing Roads

2045 LONG RANGE TRANSPORTATION PLAN
DRAFT - SEPTEMBER 18, 2020 2929
This page intentionally left blank.

30
CONNECTING IRC
DRAFT - SEPTEMBER 18, 2020
TRANSIT IMPROVEMENTS The Indian River County Transit Development Plan (TDP) identifies needs for transit service and specific improvements to meet those needs over a ten‐year period.
The TDP is updated on an annual basis (minor TDP Updates), and a major TDP Update is required every five years. The most recent major update to the TDP was adopted in September 2018. Future TDP updates will continue to guide transit improvements in Indian River County. Potential funding sources for transit improvements may include the Federal Transit Administration (FTA) grants, FDOT Service Development Grants, local funding and partnerships with the private sector.
Figure 5 depicts existing routes, needs, and potential future service improvments.
Ten-Year Program Service Improvements
` Maintain existing weekday and Saturday levels of service
Capital Program ` Vehicle replacement & bus stop infrastructure
` North County Transit Hub
Unfunded Needs ` Extend weekday evening hours to 8-9 pm (now 7 pm)
` Extend Saturday hours to 7 am-7 pm (now 8 am-5 pm)
` Add Sunday service
` Increase frequencies on select routes

2045 LONG RANGE TRANSPORTATION PLAN
DRAFT - SEPTEMBER 18, 2020 3131
Figure 5: Transit Needs
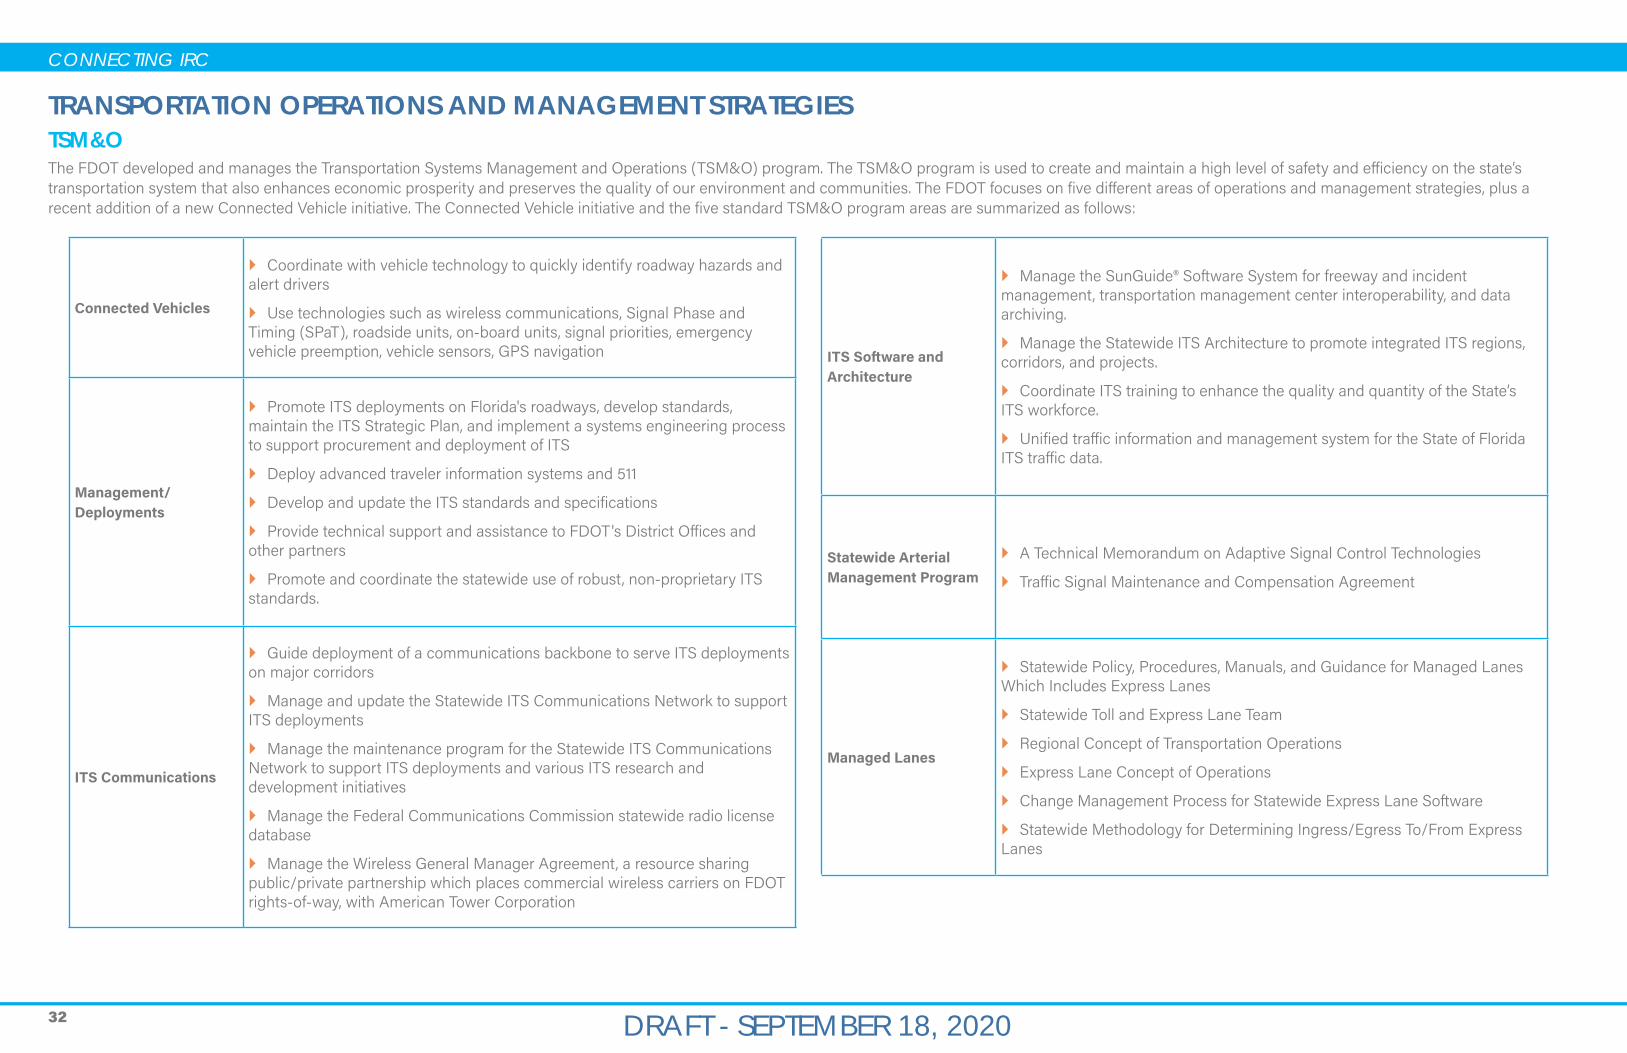
32
CONNECTING IRC
DRAFT - SEPTEMBER 18, 2020
TRANSPORTATION OPERATIONS AND MANAGEMENT STRATEGIES TSM&O The FDOT developed and manages the Transportation Systems Management and Operations (TSM&O) program. The TSM&O program is used to create and maintain a high level of safety and efficiency on the state’s transportation system that also enhances economic prosperity and preserves the quality of our environment and communities. The FDOT focuses on five different areas of operations and management strategies, plus a recent addition of a new Connected Vehicle initiative. The Connected Vehicle initiative and the five standard TSM&O program areas are summarized as follows:
Connected Vehicles
` Coordinate with vehicle technology to quickly identify roadway hazards and alert drivers
` Use technologies such as wireless communications, Signal Phase and Timing (SPaT), roadside units, on-board units, signal priorities, emergency vehicle preemption, vehicle sensors, GPS navigation
Management/ Deployments
` Promote ITS deployments on Florida's roadways, develop standards, maintain the ITS Strategic Plan, and implement a systems engineering process to support procurement and deployment of ITS
` Deploy advanced traveler information systems and 511
` Develop and update the ITS standards and specifications
` Provide technical support and assistance to FDOT's District Offices and other partners
` Promote and coordinate the statewide use of robust, non-proprietary ITS standards.
ITS Communications
` Guide deployment of a communications backbone to serve ITS deployments on major corridors
` Manage and update the Statewide ITS Communications Network to support ITS deployments
` Manage the maintenance program for the Statewide ITS Communications Network to support ITS deployments and various ITS research and development initiatives
` Manage the Federal Communications Commission statewide radio license database
` Manage the Wireless General Manager Agreement, a resource sharing public/private partnership which places commercial wireless carriers on FDOT rights-of-way, with American Tower Corporation
ITS Software and Architecture
` Manage the SunGuide® Software System for freeway and incident management, transportation management center interoperability, and data archiving.
` Manage the Statewide ITS Architecture to promote integrated ITS regions, corridors, and projects.
` Coordinate ITS training to enhance the quality and quantity of the State’s ITS workforce.
` Unified traffic information and management system for the State of Florida ITS traffic data.
Statewide Arterial Management Program
` A Technical Memorandum on Adaptive Signal Control Technologies
` Traffic Signal Maintenance and Compensation Agreement
Managed Lanes
` Statewide Policy, Procedures, Manuals, and Guidance for Managed Lanes Which Includes Express Lanes
` Statewide Toll and Express Lane Team
` Regional Concept of Transportation Operations
` Express Lane Concept of Operations
` Change Management Process for Statewide Express Lane Software
` Statewide Methodology for Determining Ingress/Egress To/From Express Lanes

2045 LONG RANGE TRANSPORTATION PLAN
DRAFT - SEPTEMBER 18, 2020 3333
FDOT District 4 developed a Treasure Coast TSM&O Master Plan for Martin, St. Lucie, and Indian River Counties Master Plan in March 2019. This TSM&O Master Plan has identified specific strategies and performance measures throughout Indian River County and the Treasure Coast region with the aim of “…’taking back’ the capacity lost to congestion, incidents, construction, weather, and traffic control delay."
The TSM&O Master Plan is framed by 5 questions as follows:
1. .Where are TSM&O projects needed?
2. What types of TSM&O projects are needed?
3. When should these TSM&O projects be implemented?
4. How do these TSM&O projects get implemented?
5. Who is involved in seeing projects planned, designed, implemented, operated, and maintained?
The plan establishes evaluation criteria that identify specific areas and corridors on which TSM&O projects are most likely to provide enhancement of the transportation system based on several factors including, existing technology, traffic, safety, and transit infrastructures. Table 15 lists the of potential projects was developed for both State Highway System (SHS) and non-SHS facilities, which are identified in Figure ##.
Table 15: TSM&O Potential Project List
Project ID Road Name From To Mile Priority
Score
State Highway System (SHS) Facilities A 20 ST 66 AVE 41 AVE 2.13 6.48 B 20 ST 98 AVE I-95 NB RAMP 0.84 5.16
C FEDERAL HWY SEBASTIAN BLVD JACKSON ST 1.50 5.00
D SR A1A BEACHLAND BLVD MANGO RD 0.82 5.00
E COMMERCE AVE 37 ST 14 ST 2.83 4.90
F INDIAN RIVER BLVD SR 60 20 ST 0.97 4.75
G WABASSO BEACH RD FEDERAL HWY SR A1A 2.61 4.00
H SR A1A OCEAN RIDGE CIR 17 ST 2.55 4.00
I 20 ST INDIAN RIVER BLVD 42 AVE 4.34 3.81
Non-State Highway System za 26 ST 66 AVE 58 AVE 1.02 6.00
zb SEBASTIAN BLVD 90 AVE ROSELAND RD 1.27 5.00
zc 43 AVE 25 ST OSLO RD 2.01 5.00
zd 58 AVE 20 ST 49 ST 3.03 4.66
ze 27 AVE 13 ST 20 ST 3.95 4.62
zf OLD DIXIE HWY 12 ST 19 PL 1.02 4.57
zg SEBASTIAN BLVD BARBER ST EAST ST 1.34 4.00
The Treasure Coast Master Plan also established guidelines for implementation and performance measures to continually assess the improvements to the system. These potential projects are included as warranted in the Indian River County MPO Connecting IRC 2045 LRTP Needs Assessment.

34
CONNECTING IRC
DRAFT - SEPTEMBER 18, 2020
Intelligent Transportation Systems (ITS) Intelligent Transportation Systems (ITS) includes variety of communications and other computer technologies focused on detecting and relieving congestion and improving safety within the transportation system by enabling drivers to make well-informed travel choices. ITS technology enables information to be shared with travelers in real-time regarding traffic issues and can provide alternative routes or modes to aid in the mitigation of congestion.
ITS may also alert officials to of the presence of crashes and request assistance in clearing the accident, which helps efficiently restore traffic flow. FDOT’s I-95 Master Plan and other various agencies in Indian River County have deployed, or are in the process of developing ITS improvements which include:
` Fiber optic infrastructure
` Dynamic message signs
` Traffic detection stations
` Archived data
` Fiber optic cables
` Incident detection
` Traffic Management Centers (TMC)
The potential for implementing new or extending existing ITS technology to congested corridors will be evaluated as additional corridor studies are completed and prioritized as part of the CMP.
CONGESTION MANAGEMENT Indian River County MPO developed a Congestion Management Process to “address congestion management through a process that provides for safe and effective integrated management and operation of the multi-modal transportation system.”
Maintenance of a Congestion Management Process is a requirement for all Metropolitan Planning Organizations (MPO) or TPOs under Florida law. Additionally, a robust congestion management process aids the MPO in identifying local and region transportation needs and potential improvements due to the following:
` Increased emphasis on transportation safety
` Physically or legally constrained roadway corridors
` Limited funding resources
The MPO’s congestion management process is based on five steps as follows:
1. Identify Segment Score and Rank
2. Eliminate Segments Controlled by and to be Improved by FDOT
3. Identify Priority Corridors
4. Conduct Strategy Evaluation
5. Prioritize CMP Strategies
The congestion management process is key in the development of Connecting IRC 2045 and continues to increase in importance to long range transportation planning in general, as populations and transportation systems grow. It is a helpful tool supportive of identifying congestion and selecting projects for prioritization and implementation.
Identified improvements resulting from the Congestion Management Process can include a full range of activities, including demand management and transit/multimodal improvements that may reduce usage of personal vehicles as well as intersection improvement and roadway expansion projects.

2045 LONG RANGE TRANSPORTATION PLAN
DRAFT - SEPTEMBER 18, 2020 3535
Figure 6: TSM&O Master Plan Potential Project Locations

CONNECTING IRC
DRAFT - SEPTEMBER 18, 2020
CONNECTING IRC
System Performance Report AAppendix

Indian River County Metropolitan Planning Organization
2045 Long-Range Transportation Plan System Performance Report
September 2020

TABLE OF CONTENTS
1 - PURPOSE BACKGROUND........................................................................................................ 2
2 - HIGHWAY SAFETY MEASURES (PM1) .................................................................................. 3
3 - PAVEMENT AND BRIDGE CONDITION MEASURES (PM2).............................................. 6
4 - SYSTEM PERFORMANCE, FREIGHT, AND CONGESTION MITIGATION & AIR
QUALITY IMPROVEMENT PROGRAM MEASURES (PM3).....................................................10
5 - TRANSIT ASSET MANAGEMENT MEASURES ....................................................................13
6 - TRANSIT SAFETY PERFORMANCE......................................................................................17
September 2020 1

1 - PURPOSE BACKGROUND
Pursuant to the Moving Ahead for Progress in the 21st Century Act (MAP-21) Act enacted in 2012 and the Fixing America's Surface Transportation Act (FAST Act) enacted in 2015, state departments of transportation (DOT) and metropolitan planning organizations (MPO) must apply a transportation performance management approach in carrying out their federally required transportation planning and programming activities. The process requires the establishment and use of a coordinated, performance-based approach to transportation decision-making to support national goals for the federal-aid highway and public transportation programs.
On May 27, 2016, the Federal Highway Administration (FHWA) and the Federal Transit Administration (FTA) issued the Statewide and Nonmetropolitan Transportation Planning; Metropolitan Transportation Planning Final Rule (The Planning Rule).1 This rule details how state DOTs and MPOs must implement new MAP-21 and FAST Act transportation planning requirements, including the transportation performance management provisions.
In accordance with the Planning Rule, the Indian River County MPO must include a description of the performance measures and targets that apply to the MPO planning area and a System Performance Report as an element of its Long-Range Transportation Plan (LRTP). The System Performance Report evaluates the condition and performance of the transportation system with respect to required performance targets, and reports on progress achieved in meeting the targets in comparison with baseline data and previous reports.
The Indian River County MPO 2040 Long-Range Transportation Plan was adopted on December 9, 2015. This plan will be superseded by the 2045 LRTP in December 2020. Per the Planning Rule, the System Performance Report for the Indian River is included for the required Highway Safety (PM1), Bridge and Pavement (PM2), System Performance (PM3), Transit Asset Management.
This document outlines the minimum roles of FDOT, the MPOs, and the public transportation providers in the MPO planning areas to ensure consistency to the maximum extent practicable in satisfying the transportation performance management requirements promulgated by the United States Department of Transportation in Title 23 Parts 450, 490, 625, and 673 of the Code of Federal Regulations (23 CFR).
1 The Final Rule modified the Code of Federal Regulations at 23 CFR Part 450 and 49 CFR Part 613.
September 2020 2

2 - HIGHWAY SAFETY MEASURES (PM1)
Effective April 14, 2016, the FHWA established five highway safety performance measures 2 to carry out the Highway Safety Improvement Program (HSIP). These performance measures are:
1. Number of fatalities;
2. Rate of fatalities per 100 million vehicle miles traveled (VMT);
3. Number of serious injuries;
4. Rate of serious injuries per 100 million VMT; and
5. Number of non-motorized fatalities and non-motorized serious injuries.
The Florida Department of Transportation (FDOT) publishes statewide safety performance targets in the HSIP Annual Report that it transmits to FHWA each year. Current safety targets address calendar year 2020. For the 2020 HSIP annual report, FDOT established statewide at “0” for each performancemeasure to reflect Florida’s vision of zero deaths.
The Indian River County MPO agreed to support FDOT’s statewide safety performance targets on February 12, 2020.
Statewide system conditions for each safety performancemeasure are included in Table 2.1, along with system conditions in the Indian River County metropolitan planning area. System conditions reflect baseline performance (2013-2017). The latest safety conditions will be updated annually on a rolling five-year window and reflected within each subsequent system performance report, to track performance over time in relation to baseline conditions and established targets.
Table 2.1. Highway Safety (PM1) Conditions and Performance
Performance Measures
Florida Statewide Baseline Performance (Five-Year Rolling Average)
2012-2016 2013-2017 2014-2018
Calendar Year 2020 Florida Performance Targets
Number of Fatalities 2,688.2 2,825.4 2,972.0 0
Rate of Fatalities per 100 Million VMT
1.33 1.36 1.39 0
Number of Serious Injuries 20,844.2 20,929.2 20,738.4 0
Rate of Serious Injuries per 100 Million VMT
10.36 10.13 9.77 0
Number of Non-Motorized Fatalities and Non-Motorized Serious Injuries
3,294.4 3,304.2 3,339.6 0
2 23 CFR Part 490, Subpart B
September 2020 3

Baseline Conditions
After FDOT set its Safety Performance Measures targets in 2018, both FDOT and the Indian River County MPO established 2017 Baseline Safety Performance Measures. To evaluate baseline Safety Performance Measures, the most recent five-year rolling average (2013-2017) of crash data and VMT were utilized. Table 2.2 presents the Baseline Safety Performance Measures for Florida and the Indian River County MPO.
Table 2.2. Baseline Safety Performance Measures
Performance Measure Florida Indian R iver County MPO
Number of Fatalities 2,825.4 24.4
Rate of Fatalities per 100 Million VMT 1.36 1.538
Number of Serious Injuries 20,929.2 129.9
Rate of Serious Injuries per 100 Million VMT 10.13 8.15
Number of Non-Motorized Fatalities and NonMotorized Serious Injuries
3,304.2 20.0
Trends Analysis
The process used to develop the MPO’s Long-Range Transportation Plan includes analysis of safety data trends, including the location and factors associated with crashes with emphasis on fatalities and serious injuries. These data are used to help identify regional safety issues and potential safety strategies for the LRTP and TIP.
Coordination with Statewide Safety Plans and Processes
The Indian River County MPO recognizes the importance of linking goals, objectives, and investment priorities to established performance objectives, and that this link is critical to the achievement of national transportation goals and statewide and regional performance targets. As such, the Indian River County 2045 LRTP reflects the goals, objectives, performance measures, and targets as they are available and described in other state and public transportation plans and processes; specifically the Florida Strategic Highway Safety Plan (SHSP), the Florida Highway Safety Improvement Program (HSIP), and the Florida Transportation Plan (FTP).
• The 2016 Florida Strategic Highway Safety Plan (SHSP) is the statewide plan focusing on how to accomplish the vision of eliminating fatalities and reducing serious injuries on all public roads. The SHSP was developed in coordination with Florida’s 27 metropolitan planning organizations (MPOs) through Florida’s Metropolitan Planning Organization Advisory Council (MPOAC). The SHSP guides FDOT,
September 2020 4

MPOs, and other safety partners in addressing safety and defines a framework for implementation activities to be carried out throughout the state.
• The FDOT HSIP process provides for a continuous and systematic process that identifies and reviews traffic safety issues around the state to identify locations with potential for improvement. The goal of the HSIP process is to reduce the number of crashes, injuries, and fatalities by eliminating certain predominant types of crashes through the implementation of engineering solutions.
• Transportation projects are identified and prioritized with the MPOs and non-metropolitan local governments. Data are analyzed for each potential project, using traffic safety data and traffic demand modeling, among other data. The FDOT Project Development and Environment Manual requires the consideration of safety when preparing a proposed project’s purpose and need, and defines several factors related to safety, including crash modification factor and safety performance factor, as part of the analysis of alternatives. MPOs and local governments consider safety data analysis when determining project priorities.
LRTP Safety Priorities
The Indian River County 2045 LRTP increases the safety of the transportation system for motorized and non-motorized users as required. The LRTP aligns with the Florida SHSP and the FDOT HSIP with specific strategies to improve safety performance focused on prioritized safety projects, pedestrian and/or bicycle safety enhancements, and traffic operation improvements to address our goal to reduce fatalities and serious injuries.
The LRTP identifies safety needs within the metropolitan planning area and provides funding for targeted safety improvements. One of the LRTP’s goals is “Maintaining a safe transportation system for all users.”, which includes the following objectives and policies:
• Reduce the number and rate of crash Fatalities to 0 by 2045 o Policy 4.01.1 – Implement intersection and other improvements related to safety as identified
in the Cost Affordable Plan including Congestion Management Process plan. • Reduce the number and rate of Serious Injuries to 0 by 2045.
o Policy 4.02.1 – Implement intersection and other improvements related to safety as identified in the Cost Affordable Plan including Congestion Management Process plan.
• Reduce the number and rate of Non-Motorized Fatalities and Serious Injuries to 0 by 2045. o Policy 4.03.1 – Implement intersection and other improvements related to safety as identified
in the Cost Affordable Plan and Bike/Ped Plan.
The Indian River County 2045 LRTP will provide information from the FDOT HSIP annual reports to track the progress made toward the statewide safety performance targets. The MPO will document the progress on any safety performance targets established by the MPO for its planning area.
September 2020 5

3 - PAVEMENT AND BRIDGE CONDITION MEASURES (PM2)
Pavement and Bridge Condition Performance Measures and Targets Overview
In January 2017, USDOT published the Pavement and Bridge Condition Performance Measures Final Rule, which is also referred to as the PM2 rule. This rule establishes the following six performance measures:
1. Percent of Interstate pavements in good condition;
2. Percent of Interstate pavements in poor condition;
3. Percent of non-Interstate National Highway System (NHS) pavements in good condition;
4. Percent of non-Interstate NHS pavements in poor condition;
5. Percent of NHS bridges (by deck area) classified as in good condition; and
6. Percent of NHS bridges (by deck area) classified as in poor condition.
The four pavement condition measures represent the percentage of lane-miles on the Interstate and non-Interstate NHS that are in good condition or poor condition. The PM2 rule defines NHS pavement types as asphalt, jointed concrete, or continuous concrete. Five metrics are used to assess pavement condition:
• International Roughness Index (IRI) - an indicator of roughness; applicable to asphalt, jointed concrete, and continuous concrete pavements;
• Cracking percent - percentage of the pavement surface exhibiting cracking; applicable to asphalt, jointed concrete, and continuous concrete pavements;
• Rutting - extent of surface depressions; applicable to asphalt pavements only;
• Faulting - vertical misalignment of pavement joints; applicable to jointed concrete pavements only; and
• Present Serviceability Rating (PSR) – a quality rating applicable only to NHS roads with posted speed limits of less than 40 miles per hour (e.g., toll plazas, border crossings). States may choose to collect and report PSR for applicable segments as an alternative to the other four metrics.
For each pavement metric, a threshold is used to establish good, fair, or poor condition. Using these metrics and thresholds, pavementcondition is assessed for each 0.1 mile section of the through travel lanes of mainline highways on the Interstate or the non-Interstate NHS. Asphalt pavement is assessed using the IRI, cracking, and rutting metrics, while jointed concrete is assessed using IRI, cracking, and faulting. For these two pavement types, a pavement section is rated good if the rating for all three metrics are good, and poor if the ratings for two or more metrics are poor.
Continuous concrete pavement is assessed using the IRI and cracking metrics. For this pavement type, a pavement section is rated good if both metrics are rated good, and poor if both metrics are rated poor.
If a state collects and reports PSR for any applicable segments, those segments are rated according to the PSR scale. For all three pavement types, sections that are not good or poor are rated fair.
September 2020 6

The good/poor measures are expressed as a percentage and are determined by summing the total lane-miles of good or poor highway segments and dividing by the total lane-miles of all highway segments on the applicable system. Pavement in good condition suggests that no major investment is needed and should be considered for preservation treatment. Pavement in poor condition suggests major reconstruction investment is needed due to either ride quality or a structural deficiency.
The bridge condition measures refer to the percentage of bridges by deck area on the NHS that are in good condition or poor condition. The measures assess the condition of four bridge components: deck, superstructure, substructure, and culverts. Each component has a metric rating threshold to establish good, fair, or poor condition. Each bridge on the NHS is evaluated using these ratings. If the lowest rating of the four metrics is greater than or equal to seven, the structure is classified as good. If the lowest rating is less than or equal to four, the structure is classified as poor. If the lowest rating is five or six, it is classified as fair.
The bridge measures are expressed as the percent of NHS bridges in good or poor condition. The percent is determined by summing the total deck area of good or poor NHS bridges and dividing by the total deck area of the bridges carrying the NHS. Deck area is computed using structure length and either deck width or approach roadway width.
A bridge in good condition suggests that no major investment is needed. A bridge in poor condition is safe to drive on; however, it is nearing a point where substantial reconstruction or replacement is needed.
Federal rules require state DOTs and MPOs to coordinate when setting pavement and bridge condition performance targets and monitor progress towards achieving the targets. States must establish:
• Four-year statewide targets for the percent of Interstate pavements in good and poor condition;
• Two-year and four-year targets for the percent of non-Interstate NHS pavements in good and poor condition; and
• Two-year and four-year targets for the percent of NHS bridges (by deck area) in good and poor condition.
MPOs must establish four-year targets for all six measures. MPOs can either agree to program projects that will support the statewide targets or establish their own quantifiable targets for the MPO’s planning area.
The two-year and four-year targets represent pavement and bridge condition at the end of calendar years 2019 and 2021, respectively.
Pavement and Bridge Condition Baseline Performance and Established Targets
This System Performance Report discusses the condition and performance of the transportation system for each applicable target as well as the progress achieved by the MPO in meeting targets in comparison with system performance recorded in previous reports. Because the federal performance measures are new, performance of the system for each measure has only recently been collected and targets have only recently been established. Accordingly, this first Indian River County MPO LRTP System Performance Report highlights performance for the baseline period, which is 2017. FDOT will continue to monitor and report performance on a biennial basis. Future System Performance Reports will discuss progress towards meeting the targets since this initial baseline report.
Table 3.1 presents baseline performance for each PM2 measure for the State and for the MPO planning area as well as the two-year and four-year targets established by FDOT for the State.
September 2020 7

Table 3.1. Pavement and Bridge Condition (PM2) Performance and Targets Indian River
Performance Measures
Statewide (2017
Baseline)
Statewide 2019
Actual Statewide 2-year
Target (2019)
Statewide 4-year Target (2021)
Indian River County
MPO (2017 Baseline)
CountyMPO 2019
Actual Percent of Interstate pavements in good condition
66.0% 68.5% n/a ≥60% 98.4% 84.3%
Percent of Interstate pavements in poor condition
0.1% 0.2% n/a <5% 0.0% 0.0%
Percent of non-Interstate NHS 76.4% 41.0% ≥40% ≥40% 51.5% 53.9% pavements in good condition Percent of non-Interstate NHS 3.6% 0.2% <5% <5% 1.0% 0.2% pavements in poor condition Percent of NHS bridges (by deck area) 67.7% 74.19% ≥50% ≥50% TBD TBD in good condition Percent of NHS bridges (by deck area) 1.2% 0.40% <10% <10% TBD TBD in poor condition
FDOT established the statewide PM2 targets on May 18, 2018. In determining its approach to establishing performance targets for the federal pavement and bridge condition performancemeasures, FDOT considered many factors. FDOT is mandated by Florida Statute 334.046 to preserve the state’s pavement and bridges to specific standards. To adhere to the statutory guidelines, FDOT prioritizes funding allocations to ensure the current transportation system is adequately preserved and maintained before funding is allocated for capacity improvements. These statutory guidelines envelope the statewide federal targets that have been established for pavements and bridges.
In addition, MAP-21 requires FDOT to develop a Transportation Asset Management Plan (TAMP) for all NHS pavements and bridges within the state. The TAMP must include investment strategies leading to a program of projects that would make progress toward achievement of the state DOT targets for asset condition and performance of the NHS. FDOT’s TAMP was updated to reflect MAP-21 requirements in 2018 and the final TAMP was approved on June 28, 2019.
September 2020 8
Further, the federal pavement condition measures require a new methodology that is a departure from the methods currently used by FDOT and uses different ratings and pavement segment lengths. For bridge condition, the performance is measured in deck area under the federal measure, while the FDOT programs its bridge repair or replacement work on a bridge by bridge basis. As such, the federal measures are not directly comparable to the methods that are most familiar to FDOT.
In consideration of these differences, as well as the unfamiliarity associated with the new required processes, FDOT took a conservative approach when setting its initial pavement and bridge condition targets.
The Indian River County MPO agreed to support FDOT’s pavement and bridge condition performance targets in October 2018. By adopting FDOT’s targets, the Indian River County MPPO agrees to plan and program projects that help FDOT achieve these targets.
The Indian River County MPO recognizes the importance of linking goals, objectives, and investment priorities to established performance objectives, and that this link is critical to the achievement of national transportation goals and statewide and regional performance targets. As such, the Indian River County MPO 2045 LRTP reflects the goals, objectives, performance measures, and targets as they are described in other state and public transportation plans and processes, including the Florida Transportation Plan (FTP) and the Florida Transportation Asset Management Plan.
• The FTP is the single overarching statewide plan guiding Florida’s transportation future. It defines the state’s long-range transportation vision, goals, and objectives and establishes the policy framework for the expenditure of state and federal funds flowing through FDOT’s work program. One of the seven goals defined in the FTP is Agile, Resilient, and Quality Infrastructure.
• The Florida Transportation AssetManagement Plan (TAMP) explains the processes and policies affecting pavement and bridge condition and performance in the state. It presents a strategic and systematic process of operating, maintaining, and improving these assets effectively throughout their life cycle.
The Indian River County 2045 LRTP seeks to address system preservation, identifies infrastructure needs within the metropolitan planning area, and provides funding for targeted improvements. Goal 5 of the 2045 LRTP is “Preserving and maintaining the transportation system and transportation infrastructure”, which includes the following objectives and policies:
• Ensure that over 60% of the pavement area on the National Highway System (NHS) are rated “Good” by FDOT while less than 5% are rated “Poor” by FDOT
o Policy 5.01.1 – Evaluate the structural integrity of bridges on the major road network and implement rehabilitation projects as appropriate in coordination with FDOT.
• Ensure that over 50% of the bridge deck area on the National Highway System (NHS) are rated “Good” by FDOT while less than 10% are rated “Poor” by FDOT
o Policy 5.02.1 – Evaluate the structural integrity of bridges on the major road network and implement rehabilitation projects as appropriate in coordination with FDOT.
On or before October 1, 2020, FDOT will provide FHWA and the Indian River County MPO a detailed report of pavement and bridge condition performance covering the period of January 1, 2018 to December 31, 2019. FDOT and the Indian River County MPO also will have the opportunity at that time to revisit the four-year PM2 targets.
September 2020 9

4 - SYSTEM PERFORMANCE, FREIGHT, AND CONGESTION MITIGATION & AIR QUALITY IMPROVEMENT PROGRAM MEASURES (PM3)
System Performance/Freight/CMAQ Performance Measures and Targets Overview
In January 2017, USDOT published the System Performance/Freight/CMAQ Performance Measures Final Rule to establish measures to assess passenger and freight performance on the Interstate and non-Interstate National Highway System (NHS), and traffic congestion and on-road mobile source emissions in areas that do not meet federal National Ambient Air Quality Standards (NAAQS). The rule, which is referred to as the PM3 rule, requires MPOs to set targets for the following six performance measures:
National Highway Performance Program (NHPP) 1. Percent of person-miles on the Interstate system that are reliable, also referred to as Level of Travel
Time Reliability (LOTTR);
2. Percent of person-miles on the non-Interstate NHS that are reliable (LOTTR);
National Highway Freight Program (NHFP) 3. Truck Travel Time Reliability index (TTTR);
Congestion Mitigation and Air Quality Improvement Program (CMAQ) 4. Annual hours of peak hour excessive delay per capita (PHED);
5. Percent of non-single occupant vehicle travel (Non-SOV); and
6. Cumulative 2-year and 4-year reduction of on-road mobile source emissions (NOx, VOC, CO, PM10, and PM2.5) for CMAQ funded projects.
In Florida, only the two LOTTR performance measures and the TTTR performance measure apply. Because all areas in Florida meet current NAAQS, the last three measures listed measures above pertaining to the CMAQ Program do not currently apply in Florida.
LOTTR is defined as the ratio of longer travel times (80th percentile) to a normal travel time (50th percentile) over all applicable roads during four time periods (AM peak, Mid-day, PM peak, and weekends) that cover the hours of 6 a.m. to 8 p.m. each day. The LOTTR ratio is calculated for each roadway segment, essentially comparing the segment with itself. Segments with LOTTR ≥ 1.50 during any of the above time periods are considered unreliable. The two LOTTR measures are expressed as the percent of person-miles traveled on the Interstate or non-Interstate NHS system that are reliable. Person-miles consider the number of people traveling in buses, cars, and trucks over these roadway segments. To obtain person miles traveled, the vehicle miles traveled (VMT) for each segment are multiplied by the average vehicle occupancy for each type of vehicle on the roadway. To calculate the percent of person miles traveled that are reliable, the sum of the number of reliable person miles traveled is divide by the sum of total person miles traveled.
TTTR is defined as the ratio of longer truck travel times (95th percentile) to a normal travel time (50th
percentile) over the Interstate during five time periods (AM peak, Mid-day, PM peak, weekend, and overnight) that cover all hours of the day. TTTR is quantified by taking a weighted average of the maximum TTTR from
September 2020 10

the five time periods for each Interstate segment. The maximum TTTR is weighted by segment length, then the sum of the weighted values is divided by the total Interstate length to calculate the Travel Time Reliability Index.
The data used to calculate these PM3 measures are provided by FHWA via the National Performance Management Research Data Set (NPMRDS). This dataset contains travel times, segment lengths, and Annual Average Daily Travel (AADT) for Interstate and non-Interstate NHS roads.
The PM3 rule requires state DOTs and MPOs to coordinate when establishing performance targets for these measures and to monitor progress towards achieving the targets. FDOT must establish:
• Two-year and four-year statewide targets for percent of person-miles on the Interstate system that are reliable;
• Four-year targets for the percent of person-miles on the non-Interstate NHS that are reliable3; and
• Two-year and four-year targets for truck travel time reliability
MPOs must establish four-year performance targets for all three measures within 180 days of FDOT establishing statewide targets. MPOs establish targets by either agreeing to program projects that will support the statewide targets or setting quantifiable targets for the MPO’s planning area.
The two-year and four-year targets represent system performance at the end of calendar years 2019 and 2021, respectively.
PM3 Baseline Performance and Established Targets
The System Performance Report discusses the condition and performance of the transportation system for each applicable PM3 target as well as the progress achieved by the MPO in meeting targets in comparison with system performance recorded in previous reports. Because the federal performance measures are new, performance of the system for each measure has only recently been collected and targets have only recently been established. Accordingly, this Indian River County MPO LRTP System Performance Report highlights performance for the baseline period, which is 2017. FDOT will continue to monitor and report performance on a biennial basis. Future System Performance Reports will discuss progress towards meeting the targets since this initial baseline report.
Table 4.1 presents baseline performance for each PM3 measure for the state and for the MPO planning area as well as the two-year and four-year targets established by FDOT for the state.
3 Beginning with the second performance period covering January 1, 2022 to December 31, 2025, two-year targets will be required in addition to four-year targets for the percent of person-miles on the non-Interstate NHS that are reliable measure.
September 2020 11

Table 4.1. System Performance and Freight (PM3) - Performance and Targets Indian River
Performance Measures
Statewide (2017
Baseline)
Statewide 2019
Actual
Statewide 2-year Target (2019)
Statewide 4-year Target (2021)
Indian River County MPO
(2017 Baseline)
CountyMPO 2019
Actual Percent of person-miles on the Interstate system 82.2% 83% ≥75.0% ≥70.0% 100% 100%
that are reliable Percent of person-miles on the non-Interstate NHS that are reliable
84.0% 87% n/a ≥50.0% 94% 94%
Truck travel time reliability index 1.43 1.45 ≤1.75 ≤2.00 1.08 1.06 (TTTR)
FDOT established the statewide PM3 targets on May 18, 2018. In setting the statewide targets, FDOT reviewed external and internal factors that may affect reliability, conducted a trend analysis for the performance measures, and developed a sensitivity analysis indicating the level of risk for road segments to become unreliable within the time period for setting targets. One key conclusion from this effort is that there is a lack of availability of extended historical data with which to analyze past trends and a degree of uncertainty about future reliability performance. Accordingly, FDOT took a conservative approach when setting its initial PM3 targets.
The Indian River County MPO agreed to support FDOT’s PM3 targets on October 17, 2018. By adopting FDOT’s targets, the Indian River County MPO agrees to plan and program projects that help FDOT achieve these targets.
The Indian River County MPO recognizes the importance of linking goals, objectives, and investment priorities to established performance objectives, and that this link is critical to the achievement of national transportation goals and statewide and regional performance targets. As such, the Indian River County MPO 2045 LRTP reflects the goals, objectives, performance measures, and targets as they are described in other state and public transportation plans and processes, including the Florida Transportation Plan (FTP) and the Florida Freight Mobility and Trade Plan.
• The FTP is the single overarching statewide plan guiding Florida’s transportation future. It defines the state’s long-range transportation vision, goals, and objectives and establishes the policy framework for the expenditure of state and federal funds flowing through FDOT’s work program. One of the seven goals of the FTP is Efficient and Reliable Mobility for People and Freight.
• The Florida Freight Mobility and Trade Plan presents a comprehensive overview of the conditions of the freight system in the state, identifies key challenges and goals, provides project needs, and identifies funding sources. Truck reliability is specifically called forth in this plan, both as a need as well as a goal.
The Indian River County MPO 2045 LRTP seeks to address system reliability and congestion mitigation through various means, including capacity expansion and operational improvements. Goal 1 of the 2045
September 2020 12

LRTP is “Providing an efficient transportation system that is connected, responsive, aesthetically pleasing and meets the needs of all users.”, which includes the following objectives and policies:
• Ensure that over 60% of the pavement area on the National Highway System (NHS) are rated “Good” by FDOT while less than 5% are rated “Poor” by FDOT
o Policy 1.05.1 – Incorporate Intelligent Transportation System (ITS) and/or Connected Vehicle architecture into all new roadway projects.
• Ensure that 50% of Person-Miles (Non-Interstate) and 75% of Person-Miles (Interstate) on the National Highway System are Reliable
o Policy 1.06.1 – Implement roadway improvements identified in the 2045 Cost Feasible Plan, consistent with the Interim Year Roadway Improvement Sets.
On or before October 1, 2020, FDOT will provide FHWA and the Indian River County MPO a detailed report of performance for the PM3 measures covering the period of January 1, 2018 to December 31, 2019. FDOT and the Indian River County MPO also will have the opportunity at that time to revisit the four-year PM3 targets.
5 - TRANSIT ASSET MANAGEMENT MEASURES
Transit Asset Performance
On July 26, 2016, FTA published the final Transit Asset Management rule. This rule applies to all recipients and subrecipients of Federal transit funding that own, operate, or manage public transportation capital assets. The rule defines the term “state of good repair,” requires that public transportation providers develop and implement transit asset management (TAM) plans, and establishes state of good repair standards and performance measures for four asset categories: equipment, rolling stock, infrastructure, and facilities. The rule became effective on October 1, 2018.
Table 5.1 below identifies performance measures outlined in the final rule for transit asset management.
Table 5.1. FTA TAM Performance Measures
Asset Category Performance Measure and Asset Class
1. Equipment Percentage of non-revenue, support-service and maintenance vehicles that have met or exceeded their useful life benchmark
2. Rolling Stock Percentage of revenue vehicles within a particular asset class that have either met or exceeded their useful life benchmark
3. Infrastructure Percentage of track segments with performance restrictions
4. Facilities Percentage of facilities within an asset class rated below condition 3 on the TERM scale
For equipment and rolling stock classes, useful life benchmark (ULB) is defined as the expected lifecycle of a capital asset, or the acceptable period of use in service, for a particular transit provider’s operating environment. ULB considers a provider’s unique operating environment such as geography and service frequency.
September 2020 13

Public transportation agencies are required to establish and report transit asset management targets annually for the following fiscal year. Each public transit provider or its sponsors must share its targets, TAM, and asset condition information with each MPO in which the transit provider’s projects and services are programmed in the MPO’s TIP.
MPOs are required to establish initial transit asset management targets within 180 days of the date that public transportation providers establish initial targets. However, MPOs are not required to establish transit asset management targets annually each time the transit provider establishes targets. Instead, subsequent MPO targets must be established when the MPO updates the LRTP.
When establishing transit asset management targets, the MPO can either agree to program projects that will support the transit provider targets or establish its own separate regional transit asset management targets for the MPO planning area. In cases where two or more providers operate in an MPO planning area and establish different targets for a given measure, the MPO has the option of coordinating with the providers to establish a single target for the MPO planning area, or establishing a set of targets for the MPO planning area that reflects the differing transit provider targets.
To the maximum extent practicable, transit providers, states, and MPOs must coordinate with each other in the selection of performance targets.
The TAM rule defines two tiers of public transportation providers based on size parameters. Tier I providers are those that operate rail service or more than 100 vehicles in all fixed route modes,or more than 100 vehicles in one non-fixed route mode. Tier II providers are those that are a subrecipient of FTA 5311 funds, or an American Indian Tribe, or have 100 or less vehicles across all fixed route modes, or have 100 vehicles or less in one non-fixed route mode. A Tier I provider must establish its own transit asset management targets, as well as report performance and other data to FTA. A Tier II provider has the option to establish its own targets or to participate in a group plan with other Tier II providers whereby targets are established by a plan sponsor, typically a state DOT, for the entire group.
A total of 20 transit providers participated in the FDOT Group TAM Plan and continue to coordinate with FDOT on establishing and reporting group targets to FTA through the National Transit Database (NTD) (Table 5.2). The participants in the FDOT Group TAM Plan are comprised of the Section 5311 Rural Program and open-door Section 5310 Enhanced Mobility of Seniors & Individuals with Disabilities FDOT subrecipients. The Group TAM Plan was adopted in October 2018 and covers fiscal years 2018-2019 through 2021-2022. Updated targets were submitted to NTD in 2019.
September 2020 14

Table 5.2. Florida Group TAM Plan Participants
District Participating Transit Providers DeSoto County Transportation
2 Suwannee Valley Transit Big Bend Transit Baker County Transit Nassau County Transit
Ride Solutions Levy County Transit Suwannee River Economic Council
3 Tri-County Community Council Big Bend Transit
Calhoun Transit Liberty County Transit
4 No participating providers
1 Good Wheels, Inc Central Florida Regional Planning Council
Gulf County ARC JTRANS Wakulla Transit
5 Sumter Transit Marion Transit
6 Key West Transit 7 No participating providers
The Indian River County MPO is served by GoLine, a Tier II provider. There are no Tier I providers within the MPO’s planning area.
On September 12, 2018, the Indian River County MPO agreed to support GoLine’s transit asset management targets, thus agreeing to plan and program projects in the TIP that once implemented, are anticipated to make progress toward achieving the transit provider targets.
The transit asset management targets are based on the condition of existing transit assets and planned investments in equipment, rolling stock, infrastructure, and facilities. The targets reflect the most recent data available on the number, age, and condition of transit assets, and expectations and capital investment plans for improving these assets. The table summarizes both existing conditions for the most recent year available, and the targets.
On September 12, 2018, the Indian River County MPO established transit asset targets for the MPO planning area, as summarized in Table 5.5:
September 2020 15

Table 5.5. Indian River County MPO Transit Asset Management Targets
Asset Category - Performance Measure Asset Class
Current Asset
Condition (Active Fleet)
Current Asset
Condition (Active + Spares)
FY2021 Target
Revenue Vehicles (Fixed Route)
Age - % of revenue vehicles within a particular asset class that have met or exceeded their ULB
Bus 0% 0% 25%
Cutaway Bus 0% 28% 50%
Revenue Vehicles (Demand Response)
Age - % of revenue vehicles within a particular asset class that have met or exceeded their ULB
Cutaway Bus 40% 61% 67%
Van 0% 75% 67%
Equipment
Age - % of non-revenue vehicles within a particular asset class that have met or exceeded their ULB
Truck 0% 0% 50%
Asset Category - Performance Measure Asset Class Current
Asset Condition
FY2021 Target
Facilities
Condition - % of facilities with a condition rating below 3.0 on the FTA Transit Economic Requirements Model (TERM) Scale
Administration/ Maintenance
0% 0%
Passenger Facilities 0% 0%
These targets for the MPO planning area reflect the targets established by GoLine through their Transit Asset Management Plans, as well as the statewide targets established by FDOT for those providers participating in the Group Transit Asset Management Plan.
TAM Performance
The Indian River County MPO recognizes the importance of linking goals, objectives, and investment priorities to stated performance objectives, and that establishing this link is critical to the achievement of national transportation goals and statewide and regional performance targets. As such, the LRTP directly reflects the goals, objectives, performance measures, and targets as they are described in other public transportation plans and processes, including the GoLine Transit Development Plan, and the current Indian River County MPO 2045 LRTP.
September 2020 16
To support progress towards TAM performance targets, transit investment and maintenance funding in the 2045 LRTP totals $169.7 million (YOE), approximately 16% of total LRTP funding. Improving the State of Good Repair (SGR) of capital assets is an overarching goal of this process.
6 - TRANSIT SAFETY PERFORMANCE
The Federal Transit Administration (FTA) published a final Public Transportation Agency Safety Plan (PTSAP) rule and related performance measures as authorized by Section 20021 of the Moving Ahead for Progress in the 21st Century Act (MAP– 21). The PTASP rule requires operators of public transportation systems that receive federal financial assistance under 49 U.S.C. Chapter 53 to develop and implement a PTASP based on a safety management systems approach. Development and implementation of PTSAPs is anticipated to help ensure that public transportation systems are safe nationwide.
The rule applies to all operators of public transportation that are a recipient or sub-recipient of FTA Urbanized Area Formula Grant Program funds under 49 U.S.C. Section 5307, or that operate a rail transit system that is subject to FTA’s State Safety Oversight Program. The rule does not apply to certain modes of transit service that are subject to the safety jurisdiction of another Federal agency, including passenger ferry operations that are regulated by the United States CoastGuard, and commuter rail operations that are regulated by the Federal Railroad Administration.
Transit Safety Performance Measures
The transit agency sets targets in the PTASP based on the safety performance measures established in the National Public Transportation Safety Plan (NPTSP). The required transit safety performance measures are:
1. Total number of reportable fatalities.
2. Rate of reportable fatalities per total vehicle revenue miles by mode.
3. Total number of reportable injuries.
4. Rate of reportable injuries per total vehicle revenue miles by mode.
5. Total number of reportable safety events.
6. Rate of reportable events per total vehicle revenue miles by mode.
7. System reliability - Mean distance between major mechanical failures by mode.
Each provider of public transportation that is subject to the rule must certify it has a PTASP, including transit safety targets for the above measures, in place no later than July 20, 2020. However, on April 22, 2020, FTA issued a Notice of Enforcement Discretion that extends the PTASP deadline to December 31, 2020 due to the extraordinary operational challenges presented by the COVID-19 public health emergency.
Once the public transportation provider establishes targets, it must make the targets available to MPOs to aid in the planning process. MPOs have 180 days after receipt of the PTASP targets to establish transit safety targets for the MPO planning area. In addition, the Indian River County MPO must reflect those targets in any LRTP and TIP updated on or after July 20, 2021.
September 2020 17

In Florida, each Section 5307 and 5311 transit provider must develop a System Safety Program Plan (SSPP) under Chapter 14-90, Florida Administrative Code. FDOT technical guidance recommends that Florida’s transit agencies revise their existing SSPPs to be compliant with the new FTA PTASP requirements.
Transit Provider Coordination with States and MPOs
Key considerations for MPOs and transit agencies:
• Transit operators are required to review, update, and certify their PTASP annually.
• A transit agency must make its safety performance targets available to states and MPOs to aid in the planning process, along with its safety plans.
• To the maximum extent practicable, a transit agency must coordinate with states and MPOs in the selection of state and MPO safety performance targets.
• MPOs are required to establish initial transit safety targets within 180 days of the date that public transportation providers establish initial targets. MPOs are not required to establish transit safety targets annually each time the transit provider establishes targets. Instead, subsequent MPO targets must beestablished when the MPO updates the TIP or LRTP. When establishing transit safety targets, the MPO can either agree to program projects that will support the transit provider targets or establish its own regional transit targets for the MPO planning area. In cases where two or more providers operate in an MPO planning area and establish different targets for a given measure, the MPO has the option of coordinating with the providers to establish a single target for the MPO planning area, or establishing a set of targets for the MPO planning area that reflects the differing transit provider targets.
• MPOs and states must reference those targets in their long-range transportation plans. States and MPOs must each describe the anticipated effect of their respective transportation improvement programs toward achieving their targets.
Over the course of 2020-2021, the Indian River County MPO will coordinate with public transportation providers in the planning area on the development and establishment of transit safety targets. LRTP amendments or updates after July 20, 2021 will include the required details about transit safety performance data and targets.
September 2020 18

CONNECTING IRC
DRAFT - SEPTEMBER 18, 2020
CONNECTING IRC
Cost Feasible Capacity Projects
Year of Expenditure (YOE) BAppendix

2045 LRTP Cost Feasible Capacity Projects (YOE) Indian River County
ID On Street From Street To Street Mi. Improv Type
PD&E Time PD&E Cost
(YOE) PD&E Source
PE Time PE Cost (YOE) PE
Source ROW Time
ROW Cost (YOE)
ROW Source
CST Time CST Cost (YOE) CST
Source Funded Level
Strategic Intermodal System (SIS) Projects 1 SR‐9/I‐95 @Oslo Rd ‐‐ N/A Int. Imp. COMPLETE N/A SIS COMPLETE N/A SIS COMPLETE N/A SIS 2026‐2030 $ 50,382,000 SIS Fully Funded
State Projects 2 26th Street/Aviation Blvd @US 1/SR 5 ‐‐ N/A Int. Imp. COMPLETE $ 1,250,000 OA 2020‐2024 $ 2,500,000 OA 2031‐2035 $ 31,000,000 OA 2036‐2045 $ 51,250,000 OA Fully Funded 3 CR 510 @US 1/SR 5 ‐‐ N/A Int. Imp. 2025 $ 536,000 OA 2026‐2030 $ 1,188,000 OA 2026‐2030 $ 6,600,000 OA 2031‐2035 $ 13,950,000 OA Fully Funded 4 Indian River Blvd (SR 60) 20th Street Merrill P. Barber Brg 1.00 4D‐4D* 2025 $ 292,000 OA 2026‐2030 $ 649,000 OA 2031‐2035 $ 6,096,000 OA 2036‐2045 $ 10,077,000 OA Fully Funded 5 US 1 53rd Street CR 510 4.80 4D‐6D 2020‐2024 $ 450,000 OA 2025 $ 2,808,000 OA 2026‐2030 $ 27,984,000 OA 2036‐2045 $ 48,381,000 OA Fully Funded ‐‐ Operations/Technology Improvements** 2026‐2030 $ 7,575,000 OA 2031‐2035 $ 4,109,000 OA 2036‐2045 $ 26,562,000 OA N/A N/A N/A Fully Funded
Local Projects 6 Oslo Road I‐95 58th Avenue 3.30 2U‐4D COMPLETE $ 884,000 County COMPLETE $ 1,768,000 County 2020‐2024 $ 5,633,000 County 2026‐2030 $ 23,339,000 County Fully Funded 7 74th Avenue Oslo Road 12th Street 2.57 00‐2U 2026‐2030 $ 830,000 County 2026‐2030 $ 1,661,000 County 2036‐2045 $ 12,896,000 County 2036‐2045 $ 25,792,000 County Fully Funded 8 43rd Avenue Oslo Road 16th Street 3.00 2U‐4D 2026‐2030 $ 1,061,000 County 2026‐2030 $ 2,122,000 County 2036‐2045 $ 16,475,000 County 2036‐2045 $ 32,950,000 County Fully Funded 9 26th Street/Aviation Blvd 66th Avenue 43rd Avenue 1.95 2U‐4D 2026‐2030 $ 690,000 County 2026‐2030 $ 1,379,000 County 2036‐2045 $ 8,567,000 County 2036‐2045 $ 21,418,000 County Fully Funded 10 26th Street/Aviation Blvd 43rd Avenue US 1 1.95 2U‐4D 2026‐2030 $ 690,000 County 2026‐2030 $ 1,379,000 County 2031‐2035 $ 6,478,000 County 2031‐2035 $ 16,194,000 County Fully Funded 11 82nd Avenue 26th Street 69th Street 5.02 2S‐2U 2026‐2030 $ 1,623,000 County 2026‐2030 $ 3,246,000 County COMPLETE $ 12,294,000 County 2031‐2035 $ 38,112,000 County Fully Funded 12 82nd Avenue 69th Street CR 510 2.05 2S‐2U COMPLETE $ 501,000 County COMPLETE $ 1,002,000 County 2020‐2024 $ 1,251,000 County 2025 $ 11,926,000 County Fully Funded 13 CR 510 87th Street 82nd Avenue 1.24 2U‐4D COMPLETE $ 333,000 OA COMPLETE $ 667,000 OA 2020‐2024 $ 4,667,000 OA 2031‐2035 $ 10,335,000 OA Fully Funded 14 CR 510 82nd Avenue 58th Avenue 3.26 2U‐4D COMPLETE $ 873,000 OA COMPLETE $ 1,747,000 OA 2020‐2024 $ 11,522,000 OA 2026‐2030 $ 23,056,000 OA Fully Funded 15 CR 510 58th Avenue US 1 0.60 2U‐4D 2020‐2024 $ 3,915,000 County 2026‐2030 $ 424,000 County 2026‐2030 $ 2,970,000 County 2031‐2035 $ 4,983,000 County Fully Funded 16 82nd Avenue CR 510 Laconia 0.55 2S‐2U 2025 $ 160,000 County 2026‐2030 $ 356,000 County 2026‐2030 $ 1,778,000 County 2036‐2045 $ 5,523,000 County Fully Funded 17 CR 512 I‐95 CR 510 2.56 4D‐6D 2026‐2030 $ 829,000 County 2026‐2030 $ 1,659,000 County 2026‐2030 $ 8,293,000 County 2036‐2045 $ 25,758,000 County Fully Funded 18 CR 512 Willow Street I‐95 2.45 2U‐4D 2026‐2030 $ 866,000 County 2026‐2030 $ 1,733,000 County 2031‐2035 $ 10,102,000 County 2036‐2045 $ 26,912,000 County Fully Funded
2045 Capacity Projects: Partially Funded
ID On Street From Street To Street Mi. Improv Type
PD&E Time PD&E Cost
(YOE) PD&E Source
PE Time PE Cost (YOE) PE
Source ROW Time
ROW Cost (YOE)
ROW Source
CST Time CST Cost (YOE) CST
Source Funded Level
Local Projects 19 53rd Street 66th Avenue 82nd Avenue 2.00 00‐2U 2026‐2030 $ 647,000 County 2026‐2030 $ 1,293,000 County 2026‐2030 $ 6,465,000 County Unfunded $ 20,082,000 OA Partially Funded 20 12th Street 74 Avenue 58th Avenue 2.00 2S‐2U 2026‐2030 $ 647,000 County 2026‐2030 $ 1,293,000 County COMPLETE $ 4,898,000 County Unfunded $ 20,082,000 County Partially Funded
2045 2045 Capacity Projects: Unfunded Needs
ID On Street From Street To Street Mi. Improv Type
PD&E Time PD&E Cost
(YOE) PD&E Source
PE Time PE Cost (YOE) PE
Source ROW Time
ROW Cost (YOE)
ROW Source
CST Time CST Cost (YOE) CST
Source Funded Level
Local Projects 21 66th Avenue CR 510 Barber Street 0.80 2U‐4D Unfunded $ 440,000 N/A Unfunded $ 880,000 N/A Unfunded $ 4,401,000 N/A Unfunded $ 8,801,000 N/A Unfunded 22 Roseland Road CR 512 US 1 4.70 2U‐4D Unfunded $ 2,583,000 N/A Unfunded $ 5,167,000 N/A Unfunded $ 25,834,000 N/A Unfunded $ 51,668,000 N/A Unfunded 23 5th Street SW 20th Avenue 11th Square SW 0.73 2S‐2U Unfunded $ 366,000 N/A Unfunded $ 733,000 N/A Unfunded $ 3,665,000 N/A Unfunded $ 7,330,000 N/A Unfunded 24 43rd Avenue Oslo Road St. Lucie County Line 2.08 2U‐4D Unfunded $ 1,142,000 N/A Unfunded $ 2,284,000 N/A Unfunded $ 11,422,000 N/A Unfunded $ 22,845,000 N/A Unfunded 25 27th Avenue Oslo Road St. Lucie County Line 2.03 2U‐4D Unfunded $ 1,117,000 N/A Unfunded $ 2,235,000 N/A Unfunded $ 11,175,000 N/A Unfunded $ 22,349,000 N/A Unfunded 26 58th Avenue Oslo Road St. Lucie County Line 2.09 00‐2U Unfunded $ 1,051,000 N/A Unfunded $ 2,101,000 N/A Unfunded $ 10,506,000 N/A Unfunded $ 21,011,000 N/A Unfunded 27 5th Street SW 11th Square SW Old Dixie Highway 0.69 2S‐2U Unfunded $ 348,000 N/A Unfunded $ 696,000 N/A Unfunded $ 3,479,000 N/A Unfunded $ 6,958,000 N/A Unfunded
*Operational capacity improvements to be determined **Use of funds may not correspond to the project phase shown here

CONNECTING IRC
DRAFT - SEPTEMBER 18, 2020
CONNECTING IRC
Cost Feasible Capacity Projects
Present Day Cost (PDC) CAppendix

2045 LRTP Cost Feasible Capacity Projects (PDC) Indian River County
ID On Street From Street To Street Mi. Improv Type
PD&E Time PD&E Cost
(PDC) PD&E Source
PE Time PE Cost (PDC) PE
Source ROW Time
ROW Cost (PDC)
ROW Source
CST Time CST Cost (PDC) CST
Source Funded Level
Strategic Intermodal System (SIS) Projects 1 SR‐9/I‐95 @Oslo Rd ‐‐ N/A Int. Imp. COMPLETE N/A SIS COMPLETE N/A SIS COMPLETE N/A SIS 2026‐2030 $ 38,168,182 SIS Fully Funded
State Projects 2 26th Street/Aviation Blvd @US 1/SR 5 ‐‐ N/A Int. Imp. COMPLETE $ 1,250,000 OA 2020‐2024 $ 2,500,000 OA 2031‐2035 $ 20,000,000 OA 2036‐2045 $ 25,000,000 OA Fully Funded 3 CR 510 @US 1/SR 5 ‐‐ N/A Int. Imp. 2025 $ 450,000 OA 2026‐2030 $ 900,000 OA 2026‐2030 $ 5,000,000 OA 2031‐2035 $ 9,000,000 OA Fully Funded 4 Indian River Blvd (SR 60) 20th Street Merrill P. Barber Brg 1.00 4D‐4D* 2025 $ 246,000 OA 2026‐2030 $ 492,000 OA 2031‐2035 $ 3,933,000 OA 2036‐2045 $ 4,916,000 OA Fully Funded 5 US 1 53rd Street CR 510 4.80 4D‐6D 2020‐2024 $ 450,000 OA 2025 $ 2,360,000 OA 2026‐2030 $ 21,200,000 OA 2036‐2045 $ 23,601,000 OA Fully Funded ‐‐ Operations/Technology Improvements** 2026‐2030 $ 5,739,000 OA 2031‐2035 $ 2,651,000 OA 2036‐2045 $ 12,957,000 OA N/A N/A N/A Fully Funded
Local Projects 6 Oslo Road I‐95 58th Avenue 3.30 2U‐4D COMPLETE $ 884,000 County COMPLETE $ 1,768,000 County 2020‐2024 $ 5,633,000 County 2026‐2030 $ 17,681,000 County Fully Funded 7 74th Avenue Oslo Road 12th Street 2.57 00‐2U 2026‐2030 $ 629,000 County 2026‐2030 $ 1,258,000 County 2036‐2045 $ 6,291,000 County 2036‐2045 $ 12,582,000 County Fully Funded 8 43rd Avenue Oslo Road 16th Street 3.00 2U‐4D 2026‐2030 $ 804,000 County 2026‐2030 $ 1,607,000 County 2036‐2045 $ 8,037,000 County 2036‐2045 $ 16,073,000 County Fully Funded 9 26th Street/Aviation Blvd 66th Avenue 43rd Avenue 1.95 2U‐4D 2026‐2030 $ 522,000 County 2026‐2030 $ 1,045,000 County 2036‐2045 $ 4,179,000 County 2036‐2045 $ 10,448,000 County Fully Funded 10 26th Street/Aviation Blvd 43rd Avenue US 1 1.95 2U‐4D 2026‐2030 $ 522,000 County 2026‐2030 $ 1,045,000 County 2031‐2035 $ 4,179,000 County 2031‐2035 $ 10,448,000 County Fully Funded 11 82nd Avenue 26th Street 69th Street 5.02 2S‐2U 2026‐2030 $ 1,229,000 County 2026‐2030 $ 2,459,000 County COMPLETE $ 12,294,000 County 2031‐2035 $ 24,588,000 County Fully Funded 12 82nd Avenue 69th Street CR 510 2.05 2S‐2U COMPLETE $ 501,000 County COMPLETE $ 1,002,000 County 2020‐2024 $ 1,251,000 County 2025 $ 10,022,000 County Fully Funded 13 CR 510 87th Street 82nd Avenue 1.24 2U‐4D COMPLETE $ 333,000 OA COMPLETE $ 667,000 OA 2020‐2024 $ 4,667,000 OA 2031‐2035 $ 6,668,000 OA Fully Funded 14 CR 510 82nd Avenue 58th Avenue 3.26 2U‐4D COMPLETE $ 873,000 OA COMPLETE $ 1,747,000 OA 2020‐2024 $ 11,522,000 OA 2026‐2030 $ 17,466,000 OA Fully Funded 15 CR 510 58th Avenue US 1 0.60 2U‐4D 2020‐2024 $ 3,915,000 County 2026‐2030 $ 321,000 County 2026‐2030 $ 2,250,000 County 2031‐2035 $ 3,215,000 County Fully Funded 16 82nd Avenue CR 510 Laconia 0.55 2S‐2U 2025 $ 135,000 County 2026‐2030 $ 269,000 County 2026‐2030 $ 1,347,000 County 2036‐2045 $ 2,694,000 County Fully Funded 17 CR 512 I‐95 CR 510 2.56 4D‐6D 2026‐2030 $ 628,000 County 2026‐2030 $ 1,256,000 County 2026‐2030 $ 6,282,000 County 2036‐2045 $ 12,565,000 County Fully Funded 18 CR 512 Willow Street I‐95 2.45 2U‐4D 2026‐2030 $ 656,000 County 2026‐2030 $ 1,313,000 County 2031‐2035 $ 6,517,000 County 2036‐2045 $ 13,128,000 County Fully Funded
2045 Capacity Projects: Partially Funded
ID On Street From Street To Street Mi. Improv Type
PD&E Time PD&E Cost
(PDC) PD&E Source
PE Time PE Cost (PDC) PE
Source ROW Time ROW Cost
ROW Source
CST Time CST Cost CST
Source Funded Level
Local Projects 19 53rd Street 66th Avenue 82nd Avenue 2.00 00‐2U 2026‐2030 $ 490,000 County 2026‐2030 $ 980,000 County 2026‐2030 $ 4,898,000 County Unfunded $ 9,796,000 OA Partially Funded 20 12th Street 74 Avenue 58th Avenue 2.00 2S‐2U 2026‐2030 $ 490,000 County 2026‐2030 $ 980,000 County COMPLETE $ 4,898,000 County Unfunded $ 9,796,000 County Partially Funded
2045 2045 Capacity Projects: Unfunded Needs
ID On Street From Street To Street Mi. Improv Type
PD&E Time PD&E Cost
(PDC) PD&E Source
PE Time PE Cost (PDC) PE
Source ROW Time ROW Cost
ROW Source
CST Time CST Cost CST
Source Funded Level
Local Projects 21 66th Avenue CR 510 Barber Street 0.80 2U‐4D Unfunded $ 215,000 N/A Unfunded $ 429,000 N/A Unfunded $ 2,147,000 N/A Unfunded $ 4,293,000 N/A Unfunded 22 Roseland Road CR 512 US 1 4.70 2U‐4D Unfunded $ 1,260,000 N/A Unfunded $ 2,520,000 N/A Unfunded $ 12,602,000 N/A Unfunded $ 25,204,000 N/A Unfunded 23 5th Street SW 20th Avenue 11th Square SW 0.73 2S‐2U Unfunded $ 179,000 N/A Unfunded $ 358,000 N/A Unfunded $ 1,788,000 N/A Unfunded $ 3,576,000 N/A Unfunded 24 43rd Avenue Oslo Road St. Lucie County Line 2.08 2U‐4D Unfunded $ 557,000 N/A Unfunded $ 1,114,000 N/A Unfunded $ 5,572,000 N/A Unfunded $ 11,144,000 N/A Unfunded 25 27th Avenue Oslo Road St. Lucie County Line 2.03 2U‐4D Unfunded $ 545,000 N/A Unfunded $ 1,090,000 N/A Unfunded $ 5,451,000 N/A Unfunded $ 10,902,000 N/A Unfunded 26 58th Avenue Oslo Road St. Lucie County Line 2.09 00‐2U Unfunded $ 512,000 N/A Unfunded $ 1,025,000 N/A Unfunded $ 5,125,000 N/A Unfunded $ 10,249,000 N/A Unfunded 27 5th Street SW 11th Square SW Old Dixie Highway 0.69 2S‐2U Unfunded $ 170,000 N/A Unfunded $ 339,000 N/A Unfunded $ 1,697,000 N/A Unfunded $ 3,394,000 N/A Unfunded
*Operational capacity improvements to be determined **Use of funds may not correspond to the project phase shown here

CONNECTING IRC
DRAFT - SEPTEMBER 18, 2020
CONNECTING IRC
Aspirational Capacity Projects DAppendix

2045 LRTP Cost Feasible Capacity Projects Indian River County
2045 Capacity Projects: Aspirational
ID On Street From Street To Street Mi. Improv Type PD&E Time PE Time ROW Time CST Time Funded Level
Local Projects 28 I‐95 @53rd Street ‐‐ N/A Int. Imp. Unfunded Unfunded Unfunded Unfunded Aspirational 29 13th Street SW 27th Avenue 58th Avenue 2.03 00‐2U Unfunded Unfunded Unfunded Unfunded Aspirational 30 17th Street SW 27th Avenue 58th Avenue 2.03 00‐2U Unfunded Unfunded Unfunded Unfunded Aspirational 31 21st Street SW 27th Avenue 58th Avenue 2.03 00‐2U Unfunded Unfunded Unfunded Unfunded Aspirational 32 25th Street SW 27th Avenue 58th Avenue 1.78 00‐2U Unfunded Unfunded Unfunded Unfunded Aspirational 33 26th Street 82nd Avenue CR 507 2.10 00‐2U Unfunded Unfunded Unfunded Unfunded Aspirational 34 4th Street 66th Avenue 98th Avenue 2.00 00‐2U Unfunded Unfunded Unfunded Unfunded Aspirational 35 53rd Street 82nd Avenue Fellsmere N‐S Rd 1 3.94 00‐2U Unfunded Unfunded Unfunded Unfunded Aspirational 36 69th Street 82nd Avenue CR 512 9.02 00‐2U Unfunded Unfunded Unfunded Unfunded Aspirational 37 98th Avenue 12th Street 4th Street 2.97 00‐2U Unfunded Unfunded Unfunded Unfunded Aspirational 38 Fellsmere N‐S Rd 1 CR 512 SR 60 9.74 00‐2U Unfunded Unfunded Unfunded Unfunded Aspirational 39 Fellsmere N‐S Rd 2 CR 512 69th Street 3.29 00‐2U Unfunded Unfunded Unfunded Unfunded Aspirational 40 St. John Hertiage Park Extension CR 512 County Line 5.71 00‐2U Unfunded Unfunded Unfunded Unfunded Aspirational

C:\Users\sjohnson\AppData\Local\Microsoft\Windows\INetCache\Content.Outlook\5F972PF7\6-TIP Amendments.docx 1
INDIAN RIVER COUNTY, FLORIDA
M E M O R A N D U M TO: Members of the Indian River County Metropolitan Planning Organization (MPO) THROUGH: Phillip J. Matson, AICP
Community Development Director Brian Freeman, AICP MPO Staff Director
FROM: Jim Mann, MPA Senior Planner DATE: October 7, 2020 SUBJECT: Consideration of Transportation Improvement Program (TIP) Amendments It is requested that the information presented herein be given formal consideration by the MPO at its meeting of October 14, 2020. DESCRIPTION, CONDITIONS & ANALYSIS FDOT has requested that the MPO approve two amendments to the Transportation Improvement Program (TIP) adopted by the Indian River County MPO earlier this year. Both amendments will enable FDOT to allocate funding earlier than anticipated for projects that are already included in the TIP. The two projects proposed for amendment are:
• 82nd Avenue, new road construction from 69th Street to CR 510: The TIP amendment moves all ROW funding into FY 20/21 and also adds $57,680 in preliminary engineering in FY 20/21. FDOT has indicated that ROW acquisition for this project is now complete. (FM# 2308792)
• SR A1A over Sebastian Inlet Bridge Replacement: The TIP amendment will change the project length from 0.292 miles to 0.915 miles. It will add $550,000 in environmental for FY 2022/23 and also add ROW funding totaling $6,154,884 into FY 2022/23 and FY 2023/24. (FM# 4456181)

C:\Users\sjohnson\AppData\Local\Microsoft\Windows\INetCache\Content.Outlook\5F972PF7\6-TIP Amendments.docx 2
At its September 25 meeting, the Technical Advisory Committee (TAC) recommended approval of the TIP amendments. At its October 6 meeting, the Citizens Advisory Committee (CAC) recommended approval of the TIP amendments. RECOMMENDATION Staff recommends that the MPO approve the proposed TIP amendments. ATTACHMENTS 1. Proposed TIP amendment for 82nd Avenue 2. Proposed TIP amendment for Sebastian Inlet Bridge (SR A1A)

Indian River MPO Transportation Improvement Program - FY 2020/21 - 2024/25 Roadway Capacity Projects
82nd Avenue (New Road Construction) 2308792 Non-SIS
Work Summary:
Lead Agency:
County:
NEW ROAD CONSTRUCTION
FDOT
Indian River
From:
To:
Length:
LRTP #:
69th Street
CR 510
2.046 miles
Table 7-1
Fund Phase Source 2020/21 2021/22 2022/23 2023/24 2024/25 Total
ROW GFSL 143,136 0 0 0 0 143,136 PE SN 57,680 0 0 0 0 57,680
ROW SN 427,023 551,403
656,897 0 0 0 1,083,920 551,403
ROW TALT 80,578 0 0 0 0 80,578 ENV SN 14,806 0 0 0 0 14,806 ROW CMSL 96,925 72,134 0 0 0 72,134
96,925 Total 522,407944,528 729,0310 0 0 0 1,251,438
944,528
Prior Cost < 2020/21: Future Cost > 2024/25: Total Project Cost: Project Description:
1,546,399 0 2,797,837 2,490,927 Construct a new 2-lane paved road between 69th Street and CR 510. Project length is 2.046 miles. ROW acquisition and Preliminary Engineering programmed for FY 2020/21. Construction to be programmed for future years.
Underlined text represents additions Strikethrough text represents deletions
Approved June 10, 2020 A-3 ATTACHMENT 1

Indian River MPO Transportation Improvement Program - FY 2020/21 - 2024/25 Traffic Operations, Maintenance, and Safety Projects
SR A1A over Sebastian Inlet Bridge Replacement 4456181 Non-SIS
Work Summary: BRIDGE REPLACEMENT From:
To:
Lead Agency:
County:
FDOT
Indian River
Length:
LRTP #:
.292.915 miles
Table 2-1
Fund Phase Source 2020/21 2021/22 2022/23 2023/24 2024/25 Total
PDE ACBR 2,600,000 2,650,000
50,000 0 0 0 2,600,000 2,700,000
PDE BRP 35,291 0 0 0 0 35,291 PDE DIH 2,525 0 0 0 0 2,525 PE ACBR 0 6,217,175 300,000 139,647 0 6,656,822
ROW ACBR 0 0 29,000 6,125,884 0 6,154,884 ENV ACBR 0 0 550,000 2,000,000
2,020,000 0 2,000,000
2,570,000 Total 2,687,816 6,267,175 879,000 8,285,531 0 18,119,522
Prior Cost < 2020/21: Future Cost > 2024/25: Total Project Cost: Project Description:
582,000 0 11,888,822 18,701,522 Replace Bridge 880005/SR A1A at Sebastian Inlet. PD&E is programmed for FY 2020/21 and 2021/22, preliminary engineering is programmed for FY 2021/22, 2022/23, and 2023/24. Environmental and ROW is programmed for FY 2023/24 and 2024/25. Project length is .915 miles.
Underlined text represents additions Strikethrough text represents deletions
Approved June 10, 2020 B-21 ATTACHMENT 2