Embed Size (px)
Citation preview

PN 383674 Rev. A
Vi-CELL XR Cell Viability Analyzer
REFERENCE MANUAL

PN 383674 Rev. A 2
READ PRODUCT MANUAL AND CONSULT BECKMAN COULTER TRAINED PERSONNEL BEFORE ATTEMPTING TO OPERATE INSTRUMENT. For Technical support call; 1-800-523-3713
11800 SW 147th Ave.
Miami, Florida 33116-9015
Beckman Coulter Incorporated urges its customers to comply with all national health and safety standards such as the use of barrier protection. This may include, but it is not limited to, protective eye wear, gloves, and suitable laboratory attire when operating or maintaining this or any other automated laboratory analyzer

PN 383674 Rev. A 3
TABLE OF CONTENTS
CHAPTER 1 VI-CELL XR INTRODUCTION.................................................................. 5 1.1 SCOPE ...................................................................................................................... 5 1.2 CONVENTIONS........................................................................................................ 5 2. SAFETY......................................................................................................................... 5 2.1 HAZARDOUS WASTE PRECAUTIONS ................................................................... 5 2.2 REAGENT SPECIFIC PRECAUTIONS...................................................................... 5 3. OTHER PRECAUTIONS.............................................................................................. 5 3.1 WARNINGS .............................................................................................................. 5 3.2 CAUTIONS ............................................................................................................... 6 CHAPTER 2 INTRODUCING THE VI-CELL XR ........................................................... 6 1. SYSTEM OVERVIEW............................................................................................ 6 2. MEASURING VIABILITY & CELLULAR PARAMETERS ............................... 6 3. HOW VIABILITY IS DETERMINED.................................................................... 7 3.1 THE TRYPAN BLUE DYE EXCLUSION METHOD........................................... 7 3.2 AN IMAGE ANALYSIS SOLUTION .................................................................... 7 CHAPTER 3 INSTALLATION AND VERIFICATION................................................. 10 1. INTRODUCTION........................................................................................................ 10 2. SPECIAL REQUIREMENTS – PRE-INSTALLATION CHECKS ........................... 10 3 CONNECTING THE HARDWARE..................................................................... 11 3.1 FUSE INSTALLATION AND VOLTAGE ADJUSTMENT ................................. 12 4 INSTALLING AND STARTING THE SOFTWARE .......................................... 14 4.1 Setting Up Preferences ........................................................................................... 14 4.2 SECURITY CONFIGURATION .......................................................................... 17 5.2 DAILY VERIFICATION ...................................................................................... 20 CHAPTER 4 QUICK START GUIDE............................................................................. 20 1. GETTING STARTED.................................................................................................. 20 1.3 LOG IN SAMPLE...................................................................................................... 23 1.4 SELECTING A CELL TYPE .................................................................................... 24 2. MANAGING THE AUTOSAMPLER QUEUE.......................................................... 25 2.1 LOG IN SAMPLES AND PERFORMING SAMPLE ANALYSIS ........................................... 27 (AUTO-SAMPLER) ......................................................................................................... 27 3. VIEWING DATA ........................................................................................................ 29 3.1 MANAGING DATA OUTPUT............................................................................. 29 3.2 DATA PLOTS........................................................................................................ 31 3.3 PRINTING ............................................................................................................. 35 PRINTING FROM AN EXPANDED PLOT:.......................................................... 38

PN 383674 Rev. A 4
CHAPTER 5 SOFTWARE MENUS ................................................................................ 39 1 FILE………….. ........................................................................................................... 39 2. VIEW… ....................................................................................................................... 41 3 INSTRUMENT ............................................................................................................ 41 4. DIAGNOSTICS ........................................................................................................... 42 5 SECURITY .................................................................................................................. 42 5.1 TYPES OF USERS ............................................................................................... 44 6. HELP…........................................................................................................................ 45 7. NAVIGATION BAR.................................................................................................... 46 8. INSTRUMENT CONTROL ........................................................................................ 47 9. RUN RESULTS ........................................................................................................... 48 CHAPTER 6 SPECIAL SOFTWARE FEATURES......................................................... 49 1. BIOPROCESS FEATURE........................................................................................... 49 1.2 CREATING A BIOPROCESS FILE ..................................................................... 50 1.3 MANAGING A BIOPROCESS............................................................................. 51 1.4 EXPORTING A BIOPROCESS FILE TO EXCEL .............................................. 52 2. CONTROL FEATURE................................................................................................ 52 2.1 WHAT IS THE CONTROL FEATURE?.............................................................. 52 2.2 CREATING A CONTROL CHART – FOR TOTAL CONCENTRATION / ML........... 53 2.3 MANAGING CONTROLS ................................................................................... 54 2.4 EXPORTING DATA TO EXCEL......................................................................... 54 2.5 MODIFYING A CONTROL FILE....................................................................... 55 3. CREATING AND MANAGING CELL TYPES......................................................... 56 3.1 WHAT IS A CELL TYPE?.................................................................................... 56 3.2 CREATING A NEW CELL TYPE........................................................................ 56 3.2 MODIFY CELL TYPE .......................................................................................... 58 CHAPTER 7 PRINTING & EXPORTING RESULTS.................................................... 61 1. PRINTING OPTIONS ................................................................................................ 61 2. EXPORTING DATA .................................................................................................. 64 2.1 EXPORTING THE BIOPROCESS DATA .......................................................... 65 2.2 EXPORTING THE CONTROL DATA................................................................. 65 CHAPTER 8 REGULATORY COMPLIANCE – 21 CFR PART 11.............................. 66 APPENDIX I – SYSTEM SPECIFICATIONS ................................................................ 75 APPENDIX II – CELL TYPES – Flow Chart .................................................................. 76 APPENDIX III – STATISTICS........................................................................................ 77 APPENDIX IV – TROUBLESHOOTING....................................................................... 78 APPENDIX V – MAINTAINING THE Vi-CELL XR .................................................... 79 APPENDIX VI - AUTO-FOCUS PROCEDURE….……………………………………80
PN 383674 Rev. A 5
CHAPTER 1 VI-CELL XR INTRODUCTION 1. MANUAL DESCRIPTION
1.1 SCOPE This manual is intended to provide the user with information needed to install, operate and maintain the Vi-CELL XR system safely and effectively.
1.2 CONVENTIONS
Menu and dialog items that can be selected or clicked appear in bold type. Warnings, Cautions and Important items also appear in bold type. CAUTIONS – indicates a situation or procedure that, if ignored, can cause damage to the instrument. WARNING – indicates a situation or procedure that, if ignored, can cause personal injury.
2. SAFETY
2.1 HAZARDOUS WASTE PRECAUTIONS Always observe local and state regulations regarding the handling and discarding of hazardous waste. Refer to the Material Safety Data Sheet for more information.
2.2 REAGENT SPECIFIC PRECAUTIONS
Observe warnings on the packaging of Reagents (Vi-CELL Reagent Pak) and other materials as well as Material Safety Data Sheets.
3. OTHER PRECAUTIONS
3.1 WARNINGS
1. Electrical – High voltages are present inside the instrument. Always disconnect the instrument from the power supply before removing the cover.
2. The instrument must be grounded correctly.
3. Toxicity, safety, and proper handling procedures for diluents and reagents
used should be adhered to at all times. Consult appropriate safety manuals and Material Safety Data Sheets for the items.
4. Mechanical – Do not use force when removing any glass item such as the syringe assembly.

PN 383674 Rev. A 6
5. To prevent any pinching injury, keep fingers away from the auto-sampler tray holes and hands from the sample aspiration tube.
3.2 CAUTIONS
Electrical – Use the Windows Shut Down command to turn the computer off before switching off power. Switching off power first will generate a Windows error message at the next computer start up.
CHAPTER 2 INTRODUCING THE VI-CELL XR 1. SYSTEM OVERVIEW The Vi-CELL XR Cell Viability Analyzer is a video imaging system for analyzing yeast, insect and mammalian cells in culture media or in suspension. It automates the widely accepted trypan blue dye exclusion protocol and is designed to analyze a wide variety of cell types. The software includes features to monitor bioreactors and other cell culture processes and is designed to comply with the US Food and Drug Administration’s (FDA) regulations on electronic records and electronic signatures (21 CFR Part 11). The main features of the system are: Cell Viability reported in percentage, concentration and cell count Concentration range of 50,000 to 10,000,000 cells per mL Cell size range of 3 µm to 70 µm Optional 12-position auto-sampler User-friendly reagent system 2. MEASURING VIABILITY & CELLULAR PARAMETERS
2.1 WHY MEASURE VIABILITY?
The measurement of overall health of cell cultures requires accurate measurements of both cell concentration and percentage of viable or live cells. This data is essential to the decision making process for basic tissue culture cell growth and maintaining optimum culture conditions in bioreactors.

PN 383674 Rev. A 7
2.2 HISTORICAL PERSPECTIVE – THE HEMACYTOMETER
Cell viability (Trypan Blue Dye Exclusion Method) determinations traditionally have been performed using a light microscope and hemacytometer. Unfortunately, this technique has numerous major shortcomings. The hemacytometer has a significant repeatability error. Different technicians analyzing the same cell sample obtain variations in results. In addition, the manual method is tedious and quite time consuming for today’s busy laboratory environment.
3. HOW VIABILITY IS DETERMINED
3.1 THE TRYPAN BLUE DYE EXCLUSION METHOD The widely accepted method for cell viability determination is the Trypan Blue Dye Exclusion Method. When cells die, their membranes become permeable allowing for the uptake of the trypan blue dye. As a result, the dead or non-viable cells become darker than the viable cells. This contrast is what is measured in order to determine viability. 3.2 AN IMAGE ANALYSIS SOLUTION
The Beckman Coulter Vi-CELL XR automates the Trypan Blue Dye Exclusion Method. Utilizing the latest in video capture technology and sample handling, the Vi-CELL XR takes the cell sample and delivers it to a flow cell and camera for imaging. The Vi-CELL XR will then capture up to 100 images for its determination of cellular viability. The software determines which cells have absorbed trypan blue dye and those that have not. Cells absorbing the trypan blue dye appears darker hence have lower gray scale values. Cells with higher gray scale values are considered viable.
Trypan Blue Dye Exclusion Method
Live Cells Exclude Dye
Dye Permeates Dead

PN 383674 Rev. A 8
4. SYSTEM COMPONENTS
The following image describes the main components of the Vi-CELL XR Cell Viability Analyzer.
Figure 1. Front view of the Vi-CELL XR Analyzer
Sample Cup Indicator
Sample Aspiration Tube
Fault Indicator
Power Indicator
Reagent valve(behind cover)
Sample Syringe
Reagent / WastecompartmentSample Carousel

PN 383674 Rev. A 9
Figure 2. Right side of the Vi-CELL XR showing reagent compartment
Reagent Pack
Used Cups Receptacle
Waste Container
Color Coded Reagent Tubing
Reagent Detection LED’s
PN 383674 Rev. A 10
4.1 SAMPLE DELIVERY OPTIONS
The Vi-CELL XR Cell Viability Analyzer represents the premier model in the Vi-CELL family of products.
4.2 COMPUTER SYSTEM
Windows: 2000 or XP Ram: 256 MB DRAM minimum Processor speed: Equivalent to Pentium 4, 1.5 GHz or better 40 GB hard drive minimum CD Rom Drive” 12X CD – ROM minimum, CD –RW preferred Monitor: XGA or better PCI graphics card with minimum 256-color palette. Screen resolution of 1024 x 768 OHCI compatible IEEE – 1394 FireWire card
4.3 SOFTWARE Beckman Coulter Inc. provides the Vi-CELL XR software and operating system software where PC’s are supplied.
CHAPTER 3 INSTALLATION AND VERIFICATION
1. INTRODUCTION 2. SPECIAL REQUIREMENTS – PRE-INSTALLATION CHECKS
The Vi-CELL XR will normally be installed only by Beckman Coulter approved and trained installation engineers. Unless otherwise agreed to by Beckman Coulter, DO NOT UNPACK the Vi-CELL XR.
2.1 ENVIRONMENT The instrument should be placed on a surface that is not subject to:
1. Excessive airborne dust 2. Strong vibrations 3. Extremes of temperature and humidity
2.2 POWER REQUIREMENTS
Power 50 watts (65 watts max.) Voltages 100, 120, 220, 240 VAC 50/60 Hz
2.3 TEMPERATURE AND HUMIDITY REQUIREMENTS

PN 383674 Rev. A 11
Temperature 100 to 400 C (500 to 1040 F) Humidity – 10% to 85 % 3 CONNECTING THE HARDWARE Make certain all connections between the PC and the analyzer are firm and connected as follows:
1. Connect the video capture cable (gray cable) from the FireWire connection on the computer to the Vi-CELL (see picture below). See illustration for correct connection to the PC.
2. Connect the serial cable (beige) cable from IO port number A/1 on the back of the
PC to the serial connection on the Vi-CELL XR instrument.
Connections from Computer to Vi-CELL
Rear of Vi-CELL
Rear of PC-Fire wire connection
PC Rear IO Port A/1

PN 383674 Rev. A 12
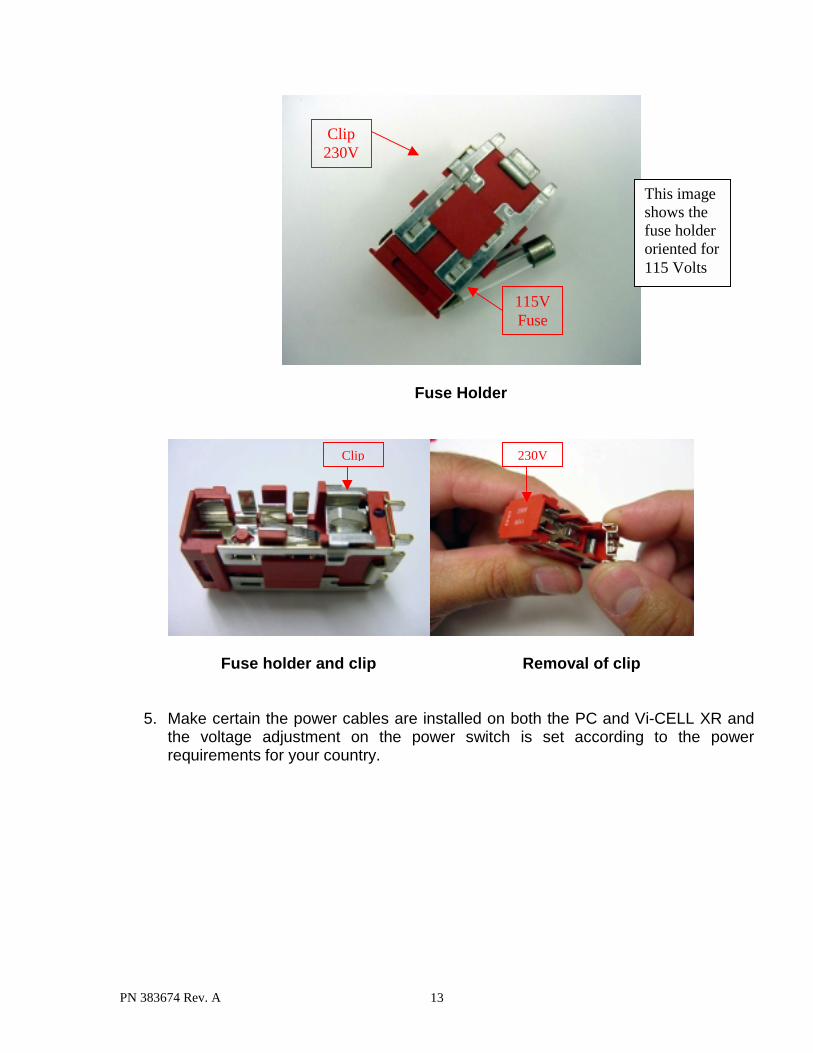
3.1 FUSE INSTALLATION AND VOLTAGE ADJUSTMENT
Caution! Always disconnect Power from the unit before attempting power adjustment or fuse
replacement.
1. Insert a screwdriver at the top of the power switch and fuse holder. With a slight twist of the screwdriver, open the fuse holder exposing the fuse.
2. Insert the screwdriver at the top of the fuse holder, and again with a slight twist pop
out the fuse holder. The voltage selected will be the one showing at the top. For 115 Volts, orient the fuse holder with the 115V at the top. Install fuse on the right hand side with appropriate size and rating (See label on back of Vi-CELL or specifications section for fuse rating and quantity).
3. Insert fuse holder and close fuse cover.
4. For 230 Volts power setting, remove fuse holder as in steps 1 and 2.
Orient the fuse holder with 230V at the top. Remove clip on the right side of the fuse holder (see images on next page) towards the back of the fuse holder. Save clip in a secure place. Insert fuses on both sides of the fuse holder (See label on back of Vi-CELL for fuse rating and quantity).
Power Switch and connection and voltage adjustment
PN 383674 Rev. A 13
Fuse Holder
Fuse holder and clip Removal of clip
5. Make certain the power cables are installed on both the PC and Vi-CELL XR and the voltage adjustment on the power switch is set according to the power requirements for your country.
Clip230V
115VFuse
This image shows the fuse holder oriented for 115 Volts
Clip 230V
PN 383674 Rev. A 14
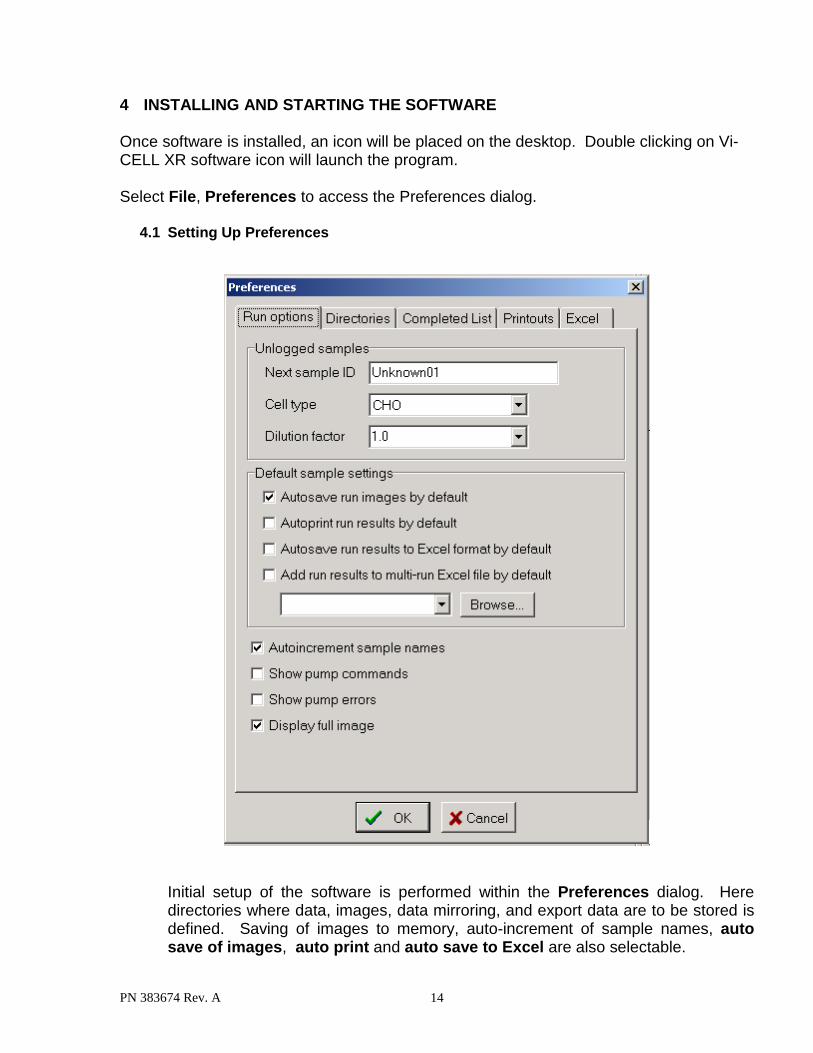
4 INSTALLING AND STARTING THE SOFTWARE Once software is installed, an icon will be placed on the desktop. Double clicking on Vi-CELL XR software icon will launch the program. Select File, Preferences to access the Preferences dialog.
4.1 Setting Up Preferences
Initial setup of the software is performed within the Preferences dialog. Here directories where data, images, data mirroring, and export data are to be stored is defined. Saving of images to memory, auto-increment of sample names, auto save of images, auto print and auto save to Excel are also selectable.
PN 383674 Rev. A 15
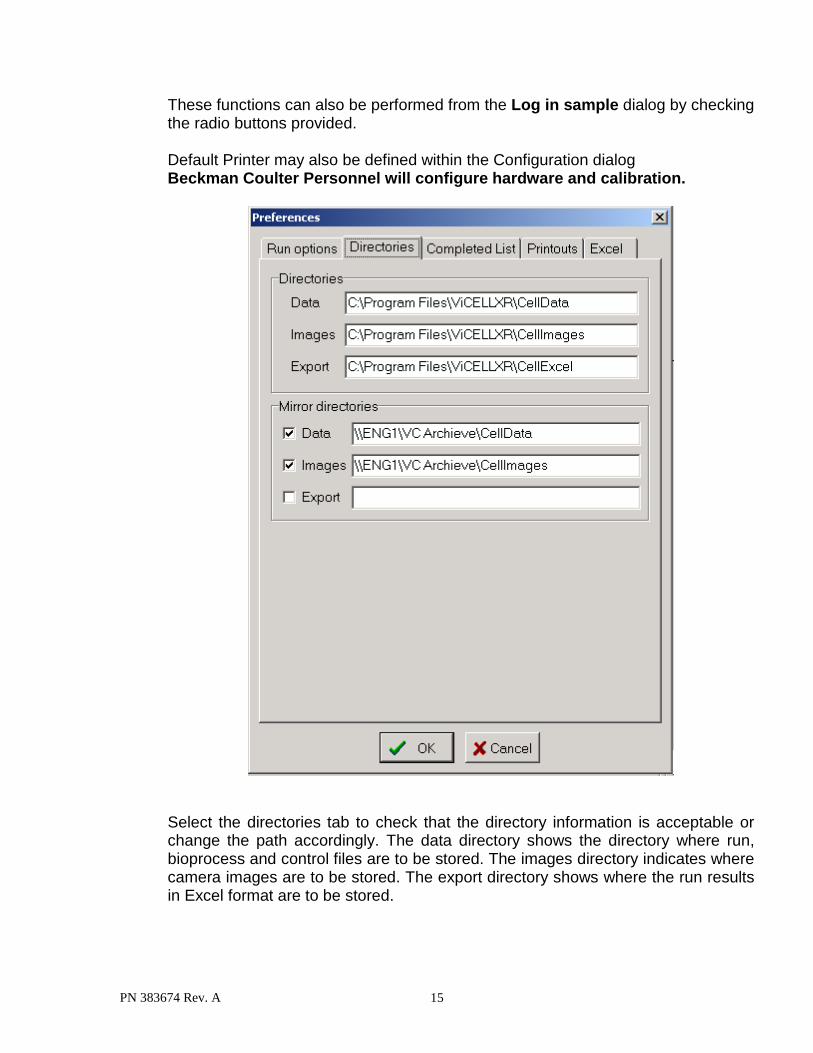
These functions can also be performed from the Log in sample dialog by checking the radio buttons provided. Default Printer may also be defined within the Configuration dialog Beckman Coulter Personnel will configure hardware and calibration.
Select the directories tab to check that the directory information is acceptable or change the path accordingly. The data directory shows the directory where run, bioprocess and control files are to be stored. The images directory indicates where camera images are to be stored. The export directory shows where the run results in Excel format are to be stored.

PN 383674 Rev. A 16
On this same tab, there is also provision for selecting mirror directories if connected to a server or network. This allows for the safe keeping of data or images by saving information to another location such as a network drive. To select, check off the desired selections and provide a path or address as to where the information is to be sent. Again, this may be a network drive. The Preferences printout tab allows for the selection of plots to appear on printed reports. These same options may also be selected from any of the print functions available throughout the software.

PN 383674 Rev. A 17
The Excel tabs allows for the selection of parameters to be archived in Excel (xls) format.
4.2 SECURITY CONFIGURATION
Selecting the Turn On button in the security configuration dialog turns on security. A valid Administrator name and password must then be entered to turn on security. With security on, the instrument has been designed to comply with the US Food and Drug Administration’s (FDA) regulations on electronic records and electronic signatures (21 CFR Part 11). Vi-CELL run files have been designed to meet the requirements for electronic records and to be submitted to the FDA in electronic form. The security tab allows for signature meanings to be defined.

PN 383674 Rev. A 18
Once signed on, click on Security, Add New User to define users and access levels. The Add New User dialog appears.

PN 383674 Rev. A 19
The Security Options Screen
• Passwords must be a minimum of 8 characters
• Password expiry is set at 60 days
• Activity disable is set at 15 minutes with a maximum of 1439.
Add New User dialog

PN 383674 Rev. A 20
5. INSTRUMENT PERFORMANCE VERIFICATION 5.1 POST-INSTALLATION VERIFICATION
The Beckman Coulter Service personnel will perform post installation verification checks.
5.2 DAILY VERIFICATION
A control should be run daily to ensure proper instrument performance. The Beckman Coulter Vi-CELL Concentration Control (PN 175478) has been developed for this purpose. CHAPTER 4 QUICK START GUIDE 1. GETTING STARTED
1.1 STARTING THE INSTRUMENT AND ITS CONTROL PROGRAM Once connections have been established and the instrument and computer are powered on, double click on the Vi-CELL XR software icon on the desktop to launch the software. Upon startup you should hear the pump initialize with the instrument going into “idle” mode. 1.2 INSTALLING REAGENT PACK Open the reagent compartment on the right side of the instrument and install the Vi-CELL Reagent Pak as well as the waste container and cup receptacle. The reagent lines and reagent pack are color coded for easy installation.
Important!
Make certain reagent lines are installed correctly (color coding). Improper installation may result in erroneous results!

PN 383674 Rev. A 21
Once reagents have been installed, click on the main screen toolbar, Instrument and Replace reagent pack. This will prime all lines with reagent and prepare the unit for sample analysis. The reagent level meter will reset to maximum number of runs. To verify reagent lines are primed and the unit is ready for analysis, check the five LED’s inside the reagent compartment. Make certain they are all illuminated. If any of the LED’s is not lighted, do a Prime under Instruments.
1) Attach color-coded tubing to reagent pack
2) Place reagent pack inside the Vi-CELL reagent compartment
3) Attach waste line to waste container and place inside the Vi-CELL

PN 383674 Rev. A 22
Reagent LED’s The following describe the LED’s from left to right as they appear on the analyzer
1. Green – Buffer Solution 2. Red – Disinfectant 3. Yellow – Cleaning Agent 4. Blue – Trypan Blue Reagent 5. Waste
Connection for waste bottle sensor

PN 383674 Rev. A 23
1.3 LOG IN SAMPLE
1. Place a minimum of 0.5 mL (max. 2.0 mL) of sample into a sample cup.
2. Place sample cup in next available carousel position. 3. Log in samples by clicking on the Log in sample button.
a. Select sample cup position on the carousel (if applicable).
b. Enter Sample ID. Cannot use special characters [ ] or = or , : or /
c. Choose a Cell type.
d. Select Dilution factor if pre-diluted.
e. Click OK
4. Press Start queue to begin the analysis.
Log in sample dialog

PN 383674 Rev. A 24
1.4 SELECTING A CELL TYPE
When logging in a sample, select the appropriate cell type. If a cell type does not exist, create a cell type as in section 3.2. Cell types may be viewed by clicking on the cell type icon on the navigation bar.
Cell type icon
Cell Type Screen
Each cell type provides pre-defined instrument and measurement parameters for ensuring accurate analysis results.

PN 383674 Rev. A 25
2. MANAGING THE AUTOSAMPLER QUEUE
You can log in a sample by clicking on the Log in sample button or by double clicking on a particular sample queue position. If the analysis is for a Bioprocess, the bioprocess icon appears to the left of the sample position. If during log in the radio buttons for Save Images, Printing or Exporting to Excel is checked, icons will appear to the left side of the sample position on the sample queue denoting each function.
The completed samples window (above the auto-sample queue log in screen) displays completed samples along with results. A check mark will appear indicating completion of analysis.
Double clicking on a given completed sample will show the results under the current results window on the right hand side of the screen. Clicking on Clear list will clear the window of all runs. For printing a list of completed samples, click the Print list icon. In order to print all runs on the completed list, simply

PN 383674 Rev. A 26
click on Print runs. There are also functions for signing runs, Sign runs (21 CFR part 11) or Export to Excel.
The information displayed in the completed list can be chosen and arranged in a particular order using the Completed List tab in the Preferences dialog that is accessed by selecting File, Preferences and then Completed list.

PN 383674 Rev. A 27
2.1 LOG IN SAMPLES AND PERFORMING SAMPLE ANALYSIS (AUTO-SAMPLER)
1. Place a minimum of 0.5 mL (max 2.0 mL) of sample into a sample cup
and place in the next available carousel position. The volume does not have to be precise. Cups have graduation marks every 0.5 mL.
2. Log in samples by clicking on the Log in sample function or by
clicking on the auto-sampler queue icon on the navigation bar.
a. Select sample cup position on the carousel (if applicable). b. Enter Sample ID. Cannot use special characters [ ] or = or : or / c. Choose a Cell type. (If none exists create a cell type as in section 3.1). If a bioprocess, select from an existing reaction type otherwise create a bioprocess by clicking on File, New Bioprocess (see Chapter 6).
d. Enter the correct Dilution factor if pre-diluted. e. Click OK
3. Double click on the sample Position within the auto-sampler queue to enter or modify sample information. If logging in sample, using the Log in sample button, go to the auto-sampler queue to check your sample is logged in correctly.
4. Place the sample cup onto the sample carousel at the corresponding position according to the sample queue.
5. Press Start queue to begin the analysis.

PN 383674 Rev. A 28
If a sample is entered in the Queue and the instrument finds that the sample is missing an audible alarm will sound, a warning message displayed and the queue stopped.

PN 383674 Rev. A 29
3. VIEWING DATA
3.1 MANAGING DATA OUTPUT
Opening a run:
To open previously saved data, on the main menu, click File, then Open Run. The Open command automatically displays the Open Data File dialog. To open any file, select the file and click Open. If a recalled run has been calculated with an earlier version of software the images will be displayed but will not be annotated. A warning message will be displayed. If images exist for the data, the run can be reanalyzed with the new software using the Reanalyze function under the instrument menu. The run results will then be updated and images annotated.
Opening a Bioprocess file: To open a previously saved file, on the main menu, click File, then
Open Bioprocess. The Open Bioprocess File dialog will be displayed. Select file and click Open.
Saving Images and Data: To save a run, on the main menu, click File, and then Save Run. The Save Data File dialog will appear. Enter a file name and
click Save. Another dialog, Save Run Images will appear. You can either select, Save run only, Save run and images or cancel.
Directories may also be specified.

PN 383674 Rev. A 30
Open an Image:
To open a single image for review, on the main menu, click File, then Image. Select Open. The Open Image File dialog will display. Select an image and Click Open.
Closing an image: On the main menu, click File, then Image and Close.

PN 383674 Rev. A 31
3.2 DATA PLOTS By selecting from the drop down window on the results section of the main screen, data can be viewed graphically.
Once a plot is selected, clicking on the button to the right side of the drop down will expand it. To close the plot, click on Close. Plots within the Bioprocess screen may also be expanded.
Click on this icon to expand a plot

PN 383674 Rev. A 32
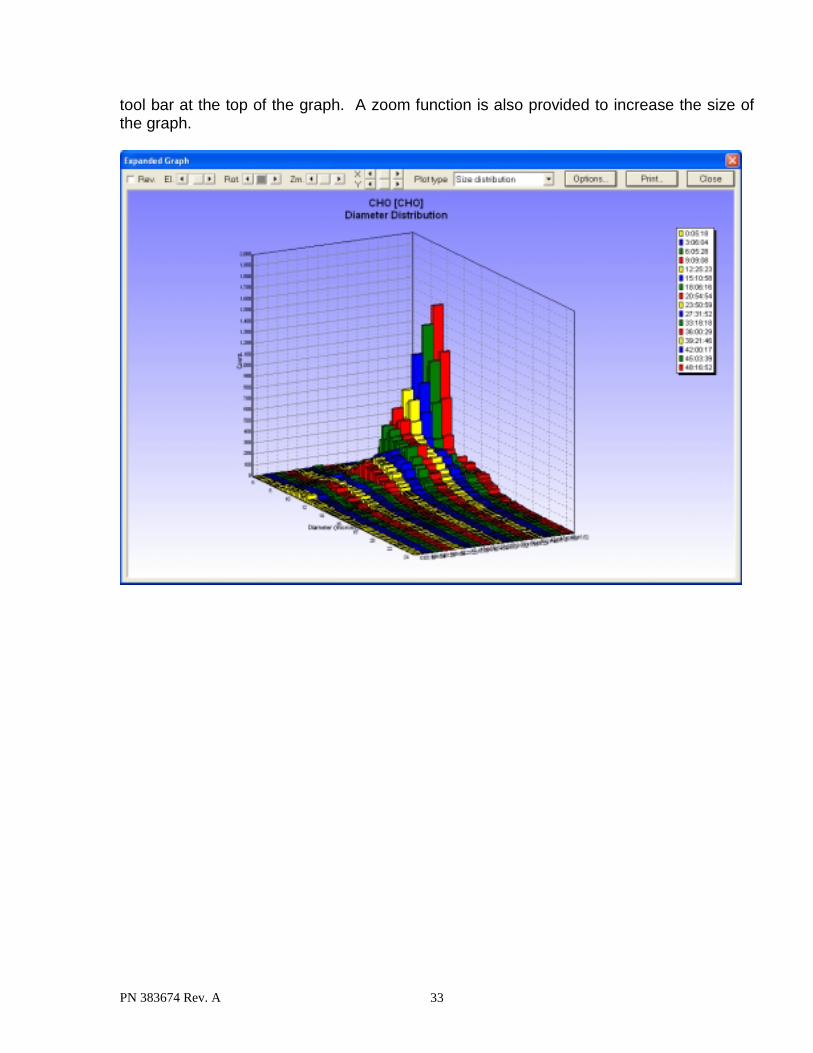
Once a plot has been expanded, statistics can be viewed as well as printed. Various plots can also be viewed from an expanded plot. Just select from the drop down a plot to be displayed. Cursors are also provided in order to isolate a particular region of a distribution. Simply double click on the plot and cursors will appear. Just drag the cursors around the region of interest. The statistics will automatically reflect the region of interest. Only the Size distribution, viable size, circ. distribution and viable circular distributions provide cursors for viewing statistics on a particular region of a plot. All other plots will provide a single cursor for selecting a given image and displays data related to that image. The Chart option dialog allows the user to change the appearance of the expanded graph and to add a comment that will be appended to the graph print out.
Size distributions can be viewed as 3-D plots. Utilizing the Rot function rotates plots. Utilizing the El function changes the plot elevation. These functions are located on the
PN 383674 Rev. A 33
tool bar at the top of the graph. A zoom function is also provided to increase the size of the graph.

PN 383674 Rev. A 34
Cluster Size Distribution
The number of cell clusters within a given analysis can be viewed by selecting cluster size distribution from the plot drop down window. From this distribution, the number of cell clusters as well as the number of cells per cluster may be viewed. By clicking on the plot, a cursor appears allowing to view statistics for a given point on the distribution.
Cursor

PN 383674 Rev. A 35
3.3 PRINTING
After requesting any print command, a Print Results dialog appears before printing occurs. Select Cancel or press Esc to Cancel the print command. Printing a report:
To print a report, on the main menu select File, Print. The Print Result dialog box appears.
Print Options tab:
To select the parameters to appear on the printed report, check any of the boxes corresponding to the item that is to appear on the printed report. Selecting the Run results check box will cause another tab to appear on the print results dialog called Run Results Options. Select Save as default to keep your settings.
PN 383674 Rev. A 36
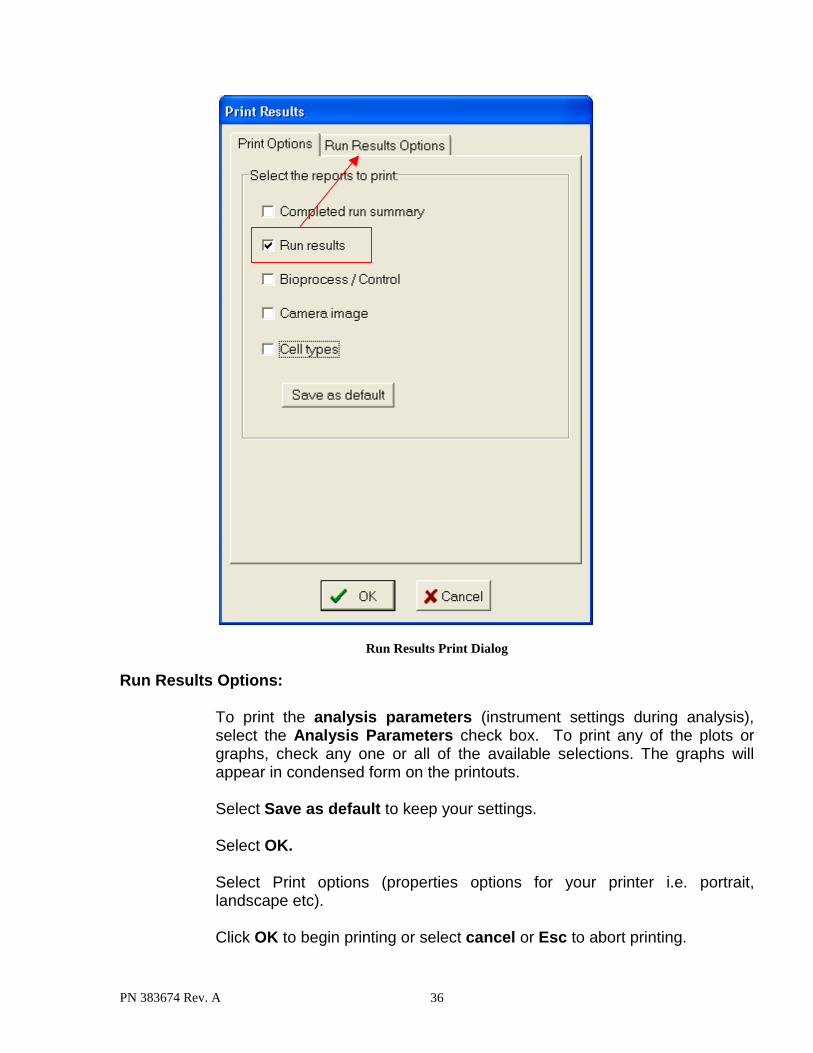
Run Results Print Dialog
Run Results Options:
To print the analysis parameters (instrument settings during analysis), select the Analysis Parameters check box. To print any of the plots or graphs, check any one or all of the available selections. The graphs will appear in condensed form on the printouts.
Select Save as default to keep your settings. Select OK.
Select Print options (properties options for your printer i.e. portrait, landscape etc).
Click OK to begin printing or select cancel or Esc to abort printing.

PN 383674 Rev. A 37
Run Results Print Options Dialog Print Run:
On the lower right hand corner of the main screen, select Print Run. This will generate a quick report showing the current run results as well as the analysis parameters.
Printing from the Bioprocess / Control Screens:
To print a report from either the Bioprocess or the Control screen, click the Print Bioprocess function or in the case of a control, the Print control function. This will generate a report containing all analysis information as well as the graphs appearing on the screen.
PN 383674 Rev. A 38
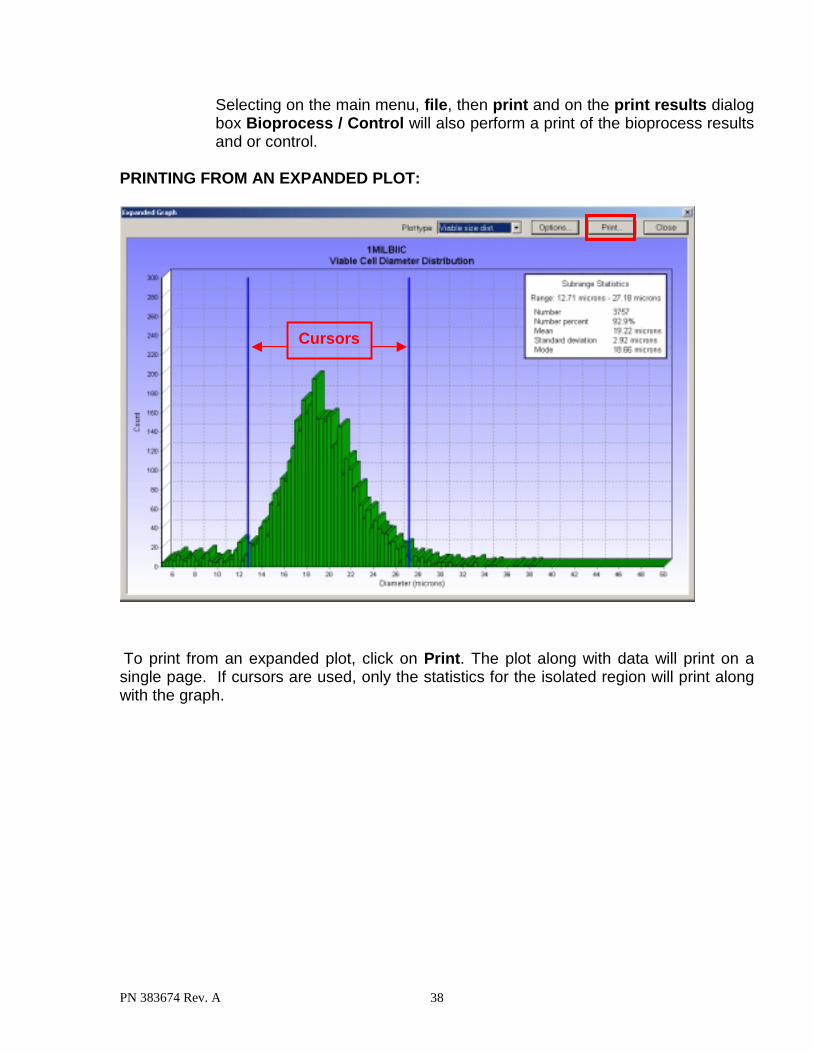
Selecting on the main menu, file, then print and on the print results dialog box Bioprocess / Control will also perform a print of the bioprocess results and or control.
PRINTING FROM AN EXPANDED PLOT:
To print from an expanded plot, click on Print. The plot along with data will print on a single page. If cursors are used, only the statistics for the isolated region will print along with the graph.
Cursors

PN 383674 Rev. A 39
CHAPTER 5 SOFTWARE MENUS
The controls contained in the main window will be described in the following sections.
1. FILE
Open Run…
This command brings up a dialog box to open a previously saved .txt file. If images are linked to the file, they too will be opened.
Save Run…
This option saves test data in the directory that is chosen in the dialog box. The filename will always end in .TXT. If you do not enter this extension, it will be added automatically. Images may also be saved.
Export Run as Excel file…
This option saves test results as an .XLS Microsoft Excel file.

PN 383674 Rev. A 40
New Bioprocess…
Allows for the creation of a new Bioprocess type. This will place a new icon on the left hand side of the main screen.
Open Bioprocess…
Opens any number of pre-saved bioprocesses.
Close Bioprocess…
Closes a Bioprocess.
Export Bioprocess as Excel file…
This option saves test results as an .XLS Microsoft Excel file. Control…
New: Allows creation of a control file for monitoring instrument performance.
Modify: For modifying a control file. Open: Opens an existing control file. Close: Closes any opened control files. Export as Excel file: Exports data as an Excel file. Image… Open: Opens a stored image file. Close: Closes an image being viewed.
Save as: Allows for the saving of images. Files are saved as. Tiff files. Reanalyze: This option “reanalyzes” a saved image. Cell Types… Add: Allows for the creation of cell types.
Modify: If a cell type requires the changing of certain parameters, use the ‘modify’ option to perform this task. Delete: Allows for the deletion of cell types.

PN 383674 Rev. A 41
Configuration…
Is where hardware such as printers are defined. Also, calibration and security information are defined.
Preferences…
Defines various parameters such as run options, directories where data is to be saved to, what auto-sampler completed list items to show, to appear on printouts and the items to appear on Excel spreadsheets. Auto-increment file name, Auto-save run images, Auto-print and Auto-save run results to Excel are other options available.
Print…
The Print Options dialog allows one to choose which elements of the report to print. Information in the Text window may be edited before printing (these changes do not affect the stored TXT file.
Exit…
Exits the program. Upon exit, if any test results remain open, a dialog will appear asking whether or not you wish to save your results.
2. VIEW
Camera Image: Provides ‘real time’ camera images. Auto-sampler Queue: Changes over to the Sample Queue screen. Cell Types: Changes over to the Cell Types Screen. Binary Image: Will convert images to black and white. Annotated Image: Turns on the red and green circles around cells on the images, which denote dead and live respectively.
3. INSTRUMENT
Log in Sample: A dialog appears for entering sample information. Clear Completed List: Clears the completed runs Queue. Start Queue: Begins an analysis.

PN 383674 Rev. A 42
Stop Queue: Will halt analysis on samples already in the auto-sampler queue Pause Run: Will pause analysis. Resume Run: Will continue with a run if paused. Cancel Run: Cancels a run. Prime: Will prime reagents through the lines ensuring no bubbles are in the system. Flush: Flushes the flow cell. Decontaminate: Takes you through a step-by-step decontamination procedure. Drain: Empties the reagent lines back into the reagent containers. Replace Reagent Pak: Provides instructions on how to properly replace reagents and also empty the waste container. Reanalyze: Re-calculates data on saved images.
4. DIAGNOSTICS
Set Focus: If the system requires re-focusing, this option takes you through a step-by-step procedure on performing an auto-focus routine using the Vi-CELL focus control (PN 175474). Set Reagent Level: Will set the reagent levels based on a percentage specified by the end user. Live Image: Show’s real-time images. Grey Level Histogram: This option shows a gray-scale histogram. This is for checking the quality of the light source.
5. SECURITY
Turn security off: Disables the security option. Add new user: The addition of operators to the system. Reset User’s password: If a password is forgotten, allows for the creation of another password. View Audit Trail: The system audit trail is displayed by selecting Audit Trail from the security menu.

PN 383674 Rev. A 43
The system audit trail is displayed by selecting the Audit Trail menu item from the security menu. It displays the time and details of the following events. Audit trail information may be archived using the move to archive feature.
Log In Login Failed Switch Users
Security On Security Off Add User Enable User Disable User Change Password Reset Password Checksum Failed

PN 383674 Rev. A 44
Lock Instrument: Will lock out a user from attempting to utilize the instrument. In order to gain access to the system, a password must be entered. Change Password: Allows for the creation of a new password. Switch User’s: Will allow change to another operator upon.
• Passwords must be a minimum of 8 characters
• Password expiry is set at 60 days
• Activity disable is set at 15 minutes with a maximum of 999. 5.1 TYPES OF USERS The following are the default conditions for the different user access levels: The types of users are: Normal, Advanced and Administrator, with the administrator assigning access levels.
Table 1. User Types and Access Levels
Menu Item Security Off Normal Advanced Administrator
File / Save Run Enabled Disabled Enabled EnabledFile / Export Run as Excel File Enabled Enabled Enabled EnabledFile / Image Enabled Disabled Enabled EnabledFile / Cell Types Enabled Disabled Enabled EnabledFile / Configuration Enabled Disabled Enabled EnabledFile / Configuration / Calibration parameters Disabled Not Accessible Read Only Read Only
Instrument / Log in Sample / Save Images Enabled Disabled Enabled EnabledInstrument / Log in Sample / Print Results Enabled Disabled Enabled EnabledInstrument / Log in Sample / Export to Excel Enabled Disabled Enabled EnabledInstrument / Reanalyze Enabled Disabled Enabled Enabled
Diagnostics Enabled Disabled Enabled EnabledDiagnostics / Set Focus Enabled Disabled Disabled EnabledDiagnostics / Repetitive Test Not Displayed Not Accessible Not Displayed Not DisplayedDiagnostics / Low Level Control Not Displayed Not Accessible Not Displayed Not DisplayedDiagnostics / Load Nudge Expel Not Displayed Not Accessible Not Displayed Not Displayed
Security / Turn Security On Enabled Not Displayed Not Displayed Not DisplayedSecurity / Turn Security Off Not Displayed Not Displayed Not Displayed EnabledSecurity / Add New User Not Displayed Not Displayed Not Displayed EnabledSecurity / Add New User / Service Not Displayed Not Accessible Not Accessible DisabledSecurity / Reset User's Password Not Displayed Not Displayed Not Displayed EnabledSecuruty / Reset Password / Service Not Displayed Not Accessible Not Accessible Disabled

PN 383674 Rev. A 45
Once a user has been established, the level of access is defined as described in Table 1.
6. HELP
Provides documentation related to the software version and access to the operators reference manual.
The first step is to setup a user via Add New User dialog.

PN 383674 Rev. A 46
7. NAVIGATION BAR
Determines what is displayed in the main window.
Camera Image: When selected allows for the viewing of the analysis
images during and after a run.
Auto-sampler Queue: Opens the sample queue for logging in of samples and verifying samples, which have been logged-in. This window also shows the completed sample list.
Cell Types: Opens the cell types window. This is where all pre-defined cell types are stored. This is also where new cell types can becreated and or removed.
Bioprocess: This icon represents Bioprocesses. Multiple bioprocess icons are possible.
Controls: Control file icons also appear on the Navigation window for easy access.

PN 383674 Rev. A 47
8. INSTRUMENT CONTROL
Log in Sample: Opens the login dialog box for entering sample and run information.
Stop / Start Queue: Begins an analysis. If clicked a second time, will stop an
analysis
Reagent Level Meter: Monitors reagent levels MANUAL RESET OF THE REAGENT LEVEL METER Clicking on Diagnostics, then Set Reagent level, will set the Reagent level meter. This is useful for when a reagent pack has been removed that still has reagent left in it. In the event a partly filled reagent pack must be removed, It is a good idea to record the Runs left before removing a reagent pack. When re-attaching the pack, enter the runs left in the New reagent level field.
Set Reagent Levels: Allows for manual reset of the reagent meter.

PN 383674 Rev. A 48
9. RUN RESULTS
This window contains the results for a given sample run. Results can either be obtained by opening a saved run (.TXT) file or by clicking on a run within the completed runs list within the auto-sampler queue. The Run Image review function allows for scrolling through images and their associated results. Also, within the Run Results screen is the Sign Run function (for 21 CFR part 11 compliance).

PN 383674 Rev. A 49
CHAPTER 6 SPECIAL SOFTWARE FEATURES 1. BIOPROCESS FEATURE
1.1 WHAT IS A BIOPROCESS? The Vi-CELL bioprocess feature allows convenient, automated “tracking” of any of the measured cell culture parameters and calculate growth rate, doubling time, all essential to optimum bioreactor productivity. Data points are recorded and stored, eliminating the necessity for manual recording of the cell culture measurements.
For Demonstration Purposes Only!
The Vi-CELL XR Bioprocess Screen.
The Bioprocess plots can be expanded for a more detailed view. Click on the icons above each plot to expand them accordingly. Selecting Print bioprocess will print bioprocess data.

PN 383674 Rev. A 50
The most up to date information about the bioprocess is given in the last run box. It shows the most up to date values of the two selected parameters together with the growth rate and doubling time of viable cells. Growth Rate and Doubling times are calculated from the results of the last two runs using the formulas: Growth rate per hour = ( ln V2 - ln V1 ) / ( t2 - t1 ) Doubling time in hours = ln 2 / Growth rate per hour Where V1 = Viable cell concentration in cells/ml at elapsed time t1 in hours V2 = Viable cell concentration in cells/ml at elapsed time t2 in hours
1.2 CREATING A BIOPROCESS FILE
.
1. Open File on the menu bar.
2. Select New Bioprocess.
3. Enter the information on the New Reaction dialog box
4. Click OK to close the dialog

PN 383674 Rev. A 51
A new icon will appear on the left side of the main screen with the name of your bioprocess. Click on the icon to access the Bioprocess screen.
Bioprocess Screen and Navigation bar Icons 1.3 MANAGING A BIOPROCESS Once a bioprocess file is created, to analyze subsequent bioprocess samples, simply double click on the bioprocess icon on the navigation bar and the bioprocess and log in dialogs appears. The cell type and sample ID are automatically selected as defaults. Simply place the sample on the carousel and select OK. Then click Start Queue.
Bioprocess Icon

PN 383674 Rev. A 52
1.4 EXPORTING A BIOPROCESS FILE TO EXCEL
2. CONTROL FEATURE
2.1 WHAT IS THE CONTROL FEATURE?
The control feature monitors Vi-CELL performance. Beckman Coulter provides Vi-CELL Concentration Control (PN 175478) for the monitoring of Total Cells / mL.
Bioprocess data may be exported in Excel format via the ‘Export Bioprocess as Excel File’ feature. Select File, Export Bioprocess as Excel File and data is saved as an Excel file.

PN 383674 Rev. A 53
2.2 CREATING A CONTROL CHART – FOR TOTAL CONCENTRATION / ML
To setup a control file, go to file then select Control then New. The New Control dialog box will appear.
The New Control dialog box
Enter the name and control information from the Vi-CELL concentration control assay sheet. Click Ok. Once completed, a control icon will appear on the Navigation bar on the left side of the main screen as well as the control screen.

PN 383674 Rev. A 54
Upon run completion, the data will be stored automatically within the control file.
2.3 MANAGING CONTROLS
To log in a control sample, double click on the control icon, which will display the log in screen. Log in the sample and click Ok. Press Start. Upon completion, the data will automatically be stored within the control file. As in the bioprocess screen, the plot within the control screen can be expanded for a more detailed view. Clicking on the icon above the plot will expand the view of the graph. Printing of control data can be achieved by selecting Print control.
2.4 EXPORTING DATA TO EXCEL Control data may be exported as an excel file via the export function available by selecting File, Control, and Export.

PN 383674 Rev. A 55
2.5 MODIFYING A CONTROL FILE To modify control file information, such as lot number or values, select File, control and modify.

PN 383674 Rev. A 56
3. CREATING AND MANAGING CELL TYPES
3.1 WHAT IS A CELL TYPE?
Cell types are files that store the optical settings required to correctly identify and quantify viable versus non-viable cells. Cells will vary in their optical characteristics and understanding how to establish the correct settings will be important . For many cell types, the default cell type values are suitable. In the event any of the parameters must be changed for a given sample, a new cell type may be created or an existing one modified. This section is an attempt to help you better understand how to setup the Vi-CELL for a given cell type. 3.2 CREATING A NEW CELL TYPE
1. On the menu bar click on File, Cell Types then Add.
2. The add new cell type dialog (as above) should appear.
3. Under the General tab, enter the appropriate information for your cell type, the minimum and maximum cell diameter, the number of images (max. 50) to

PN 383674 Rev. A 57
acquire for the particular cell type and dilution factor if necessary. Use the default settings as a starting point if necessary. Use the minimum diameter parameter for excluding cellular debris or unwanted cells. Use the trypan blue mixing cycle to adjust for cell lines that tend to shear under the stress of mixing. For insect cell lines, a mixing cycle of 1 is found to be suitable.
4. Under Image Analysis set the parameters accordingly. Utilize the default
settings as a starting point. The first four parameters control the image recognition portion of the Vi-CELL XR software. The first two control cell recognition whether viable or not, and the second set of parameters control whether a cell is viable or none-viable.
The minimum circularity parameter is for eliminating debris such as dead cell fragments. This parameter only works on dead cells or debris. The range is 0 to 1, with 1 representing a perfect circle. If you find viability results a bit low, and there is debris, begin with a setting of about 0.7 and adjust accordingly.
For steps 3 and 4, perform an initial analysis to get an approximation as to cell size.
PN 383674 Rev. A 58
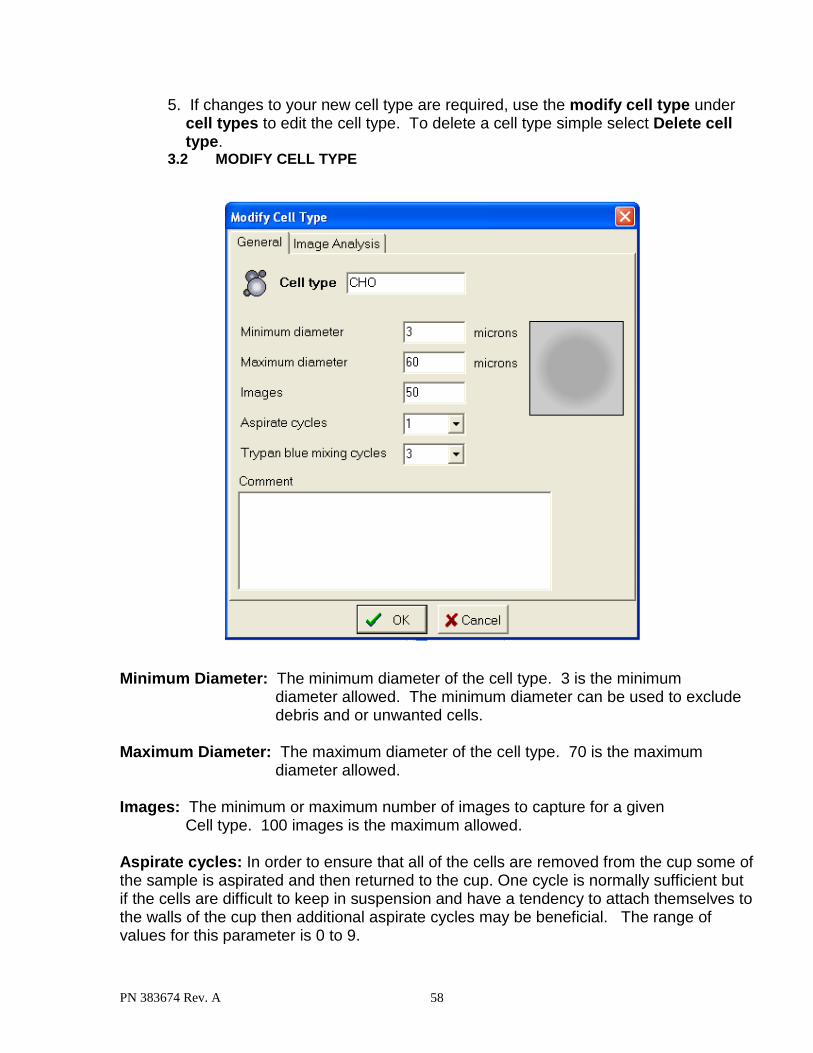
5. If changes to your new cell type are required, use the modify cell type under cell types to edit the cell type. To delete a cell type simple select Delete cell type.
3.2 MODIFY CELL TYPE
Minimum Diameter: The minimum diameter of the cell type. 3 is the minimum
diameter allowed. The minimum diameter can be used to exclude debris and or unwanted cells.
Maximum Diameter: The maximum diameter of the cell type. 70 is the maximum
diameter allowed. Images: The minimum or maximum number of images to capture for a given Cell type. 100 images is the maximum allowed. Aspirate cycles: In order to ensure that all of the cells are removed from the cup some of the sample is aspirated and then returned to the cup. One cycle is normally sufficient but if the cells are difficult to keep in suspension and have a tendency to attach themselves to the walls of the cup then additional aspirate cycles may be beneficial. The range of values for this parameter is 0 to 9.

PN 383674 Rev. A 59
Trypan blue mixing cycles: The trypan blue and sample are mixed by sending the mixture back and forth between the cup and syringe. This parameter determines the number of times that the mixture is returned to the cup. Normally three times is sufficient but if the sample is immiscible with trypan blue then a higher value may be necessary to achieve good mixing and even background intensities. The range of values allowable is 1 to 9. This feature is especially useful for cell types, which may shear due to excessive mixing. Lowering the number of mixing cycles will alleviate this situation. For insect cell lines, it has been determined that 1 mixing cycle is most suitable.
Important!
When modifying or deleting a cell type, the current active cell type is selected. Verify this is the cell type for modification or deletion.

PN 383674 Rev. A 60
Cell Brightness: Is the brightness of the cell boundary within a given image. The range is 50% (darkest) to 90% (lightest). Different cell types will have varying cell ‘brightness’ settings. The software detects the transition from dark (cell boundary pixels) to light (background of the image). A lower value means a dark boundary will be required for cell identification. A higher value means a lighter boundary.
Cell Sharpness: Represents the “clarity” of an image. Enter a range from 1 to 200. 1 represents sharpest, 200 opaque. This value also affects the transition from cell boundary (dark) to light (background).
Viable cell spot brightness: Is the brightness of the center spot of the cell. The range for spot brightness is 0 to 100%. 75% is a typical value.
Viable cell spot area: The cell spot area will be a percentage of the total area of the Cell. 5 to 10% are typical values. Any extremes in this value will either make the cells all viable or non-viable. Minimum circularity: (Least Circular=0, Perfectly Circular=1) A non-viable cell will only be accepted if its circularity is greater than or equal to the minimum circularity. This parameter can be used to reject debris that exceeds the minimum cell diameter and are too irregularly shaped to be treated as real cell. This parameter only affects dead cells.
Decluster Degree: The amount of ‘de-cluster’ applied to the sample. The selections are none, low, medium and high de-cluster. The default setting is medium. This function increases the ability of the software to detect cells that are clumped together. Set the de-cluster degree according to how well the cell clusters appear within the images(if not de-clustered properly).
Note!
The cell brightness and sharpness help determine whether or not the boundary “dark” pixels belong to a cell or are part of the background.
The cell spot brightness and area determine whether or not a cell is viable or non-viable.

PN 383674 Rev. A 61
CHAPTER 7 PRINTING & EXPORTING RESULTS
1.1 PRINTING OPTIONS
After requesting any print command, a Print Results dialog appears before printing occurs. Select Cancel or press Esc to Cancel the print command. Printing a report:
To print a report, on the main menu select File, Print. The Print Result dialog box appears.
Print Options tab:
To select the parameters to appear on the printed report, check any of the boxes corresponding to the item that is to appear on the printed report. Selecting the Run results check box will cause another tab to appear on the print results dialog called Run Results Options. Select Save as default to keep your settings.

PN 383674 Rev. A 62
Run Results Print Dialog
Run Results Options:
To print the analysis parameters (instrument settings during analysis), select the Analysis Parameters check box. To print any of the plots or graphs, check any one or all of the available selections. The graphs will appear in condensed form on the printouts.
Select Save as default to keep your settings. Select OK.
Select Print options (properties options for your printer i.e. portrait, landscape etc).
Click OK to begin printing or select cancel or Esc to abort printing.

PN 383674 Rev. A 63
Run Results Print Options Dialog Print Run:
On the lower right hand corner of the main screen, select Print Run. This will generate a quick report showing the current run results as well as the analysis parameters.
Printing from the Bioprocess / Control Screens:
To print a report from either the Bioprocess or the Control screen, click the Print Bioprocess function or in the case of a control, the Print control function. This will generate a report containing all analysis information as well as the graphs appearing on the screen.

PN 383674 Rev. A 64
Selecting on the main menu, file, then print and on the print results dialog box Bioprocess / Control will also perform a print of the bioprocess results and or control.
2. EXPORTING DATA
Data can be exported in Microsoft Excel file format (XLS) for archival or data manipulation. To setup archival format (parameters to be included within the Excel file) Select File, Preferences and check off the desired parameters.
On the main menu tool bar, select File, then Export run as Excel file. Another way of exporting as an Excel file is to click the Export to Excel radio button on the Log in dialog screen. For saving data to the same excel file, select the Add to multi-run Excel file.

PN 383674 Rev. A 65
The default value for the check box is determined by the Auto-save run results to Excel format by default setting in configuration.
2.1 EXPORTING THE BIOPROCESS DATA
Exporting of the bioprocess data is possible through the ‘Export Bioprocess as Excel file’ feature found by selecting File, Export Bioprocess as Excel file. All bioprocess data is exported to Excel and represented in Excel (xls) format.
2.2 EXPORTING THE CONTROL DATA
Exporting of the control data is a simple process. Select File, Control, and Export. The data is exported as an Excel file.

PN 383674 Rev. A 66
CHAPTER 8 REGULATORY COMPLIANCE – 21 CFR PART 11
1. 21 CFR PART 11
The Electronic Records and Electronic Signatures Rule (21 CFR Part 11) was established by the FDA to define the requirements for submitting documentation in electronic form and the criteria for approved electronic signatures. This rule, which has been in effect since August 20, 1997, does not stand in isolation; it defines the standards by which an organization can use electronic records to meet its record-keeping requirements. Organizations that choose to use electronic records must comply with 21 CFR Part 11. It is intended to improve an organization’s quality control while preserving the FDA’s charter to protect the public. Since analytical instrument systems such as the Vi-CELL Cell Viability Analyzer, generate electronic records, these systems must comply with the Electronic Records Rule. Here are described the relevant portions of the 21 CFR Part 11 regulations and their implementation using the Vi-CELL control software explained. It is important to realize that Implementation and compliance of the rule remains the responsibility of the organization or entity creating and signing the electronic records in question. Proper procedures and practices, such as GLP and GMP, are as much part of overall compliance with these regulations as are the features of the Vi-CELL XR control software.
2. ELECTRONIC RECORDS
Section 11.3 subpart A of 21 CFR Part 11 deals with the definitions assigned to electronic records, ‘electronic record means any combination of text, graphics, data, audio, pictorial, or other information representation in digital form that is created, modified, maintained, archived, retrieved or distributed by a computer system’. In reality this refers to any digital computer file submitted to the agency, or any information not submitted but which is necessary to be maintained. Public docket No 92S-0251 of the Federal Register (Vol.62, No 54) identifies the types of documents acceptable for submission in electronic form and where such submissions may be made.
3. FDA REQUIREMENTS
In the general comments section of the ruling the following is stated: ‘ The agency emphasizes that these regulations do not require, but rather permit, the use of electronic records and signatures’. In the introduction to the final ruling the following statement is made The use of electronic records as well as their submissions to FDA is voluntary’. If electronic submissions are made, Section 11.2 subpart A comes into play: ‘ persons may us electronic records in lieu of paper records or electronic signatures in lieu of traditional signatures provided that: (1) The requirements of this part are
PN 383674 Rev. A 67
met; and (2) The document or parts of a document to be submitted have been identified in public docket No. 92S-0251’. The Vi-CELL XR control software has been designed to allow users to comply with the electronic records and signatures rule. Any organization deciding to employ electronic signatures must declare to the FDA their intention to do so.
4. IMPLEMENTING ELECTRONIC RECORDS AND SIGNATURES
Section 11.3 Subpart A describes two classes of systems; “closed systems” and “open systems”. A closed system is one "in which system access is controlled by persons who are responsible for the content of electronic records". In other words, the people and organization responsible for creating and maintaining the information on the system are also responsible for operating and administering the system. In contrast, an open system is one "in which system access is not controlled by persons who are responsible for the content of electronic records". A typical Vi-CELL installation will need to have a procedure designed to ensure proper operation, maintenance and administration for system security and data integrity. Anyone who interacts with the system, from administrators to users, must abide by these procedures. Therefore the ultimate responsibility is with the organization generating electronic records and signatures. The Vi-CELL XR software is a component, albeit a vital one, of the overall process.
5. CONTROLS FOR ELECTRONNIC RECORDS
Subpart B, Section 11.10 describes the controls to be applied to a "closed system". Section 11.30 describes the controls for an "open system", which include "those identified in § 11.10, as appropriate, and additional measures such as document encryption and use of appropriate digital signature standards". Since a typical Vi-CELL system can be regarded as a closed system, additional controls for open systems will not be discussed in this document. The primary thrust of these controls is "to ensure the authenticity, integrity, and, when appropriate, the confidentiality of electronic records, and to ensure that the signer cannot readily repudiate the signed record as not genuine". In other words, to protect the data and to make it difficult for someone to say that this is not their "signature". Many of the controls described in Section 11.10 refer to written procedures (SOP's) required of an organization by the agency, for the purpose of data storage and retrieval, access control, training, accountability, documentation, record keeping, and change control. The other controls are addressed either by the Vi-CELL software itself, or in combination with end-user procedures. Of the other controls, perhaps the foremost is described in Section 11.10 Paragraph (a): "Validation of systems to ensure accuracy, reliability, consistent intended performance, and the ability to discern invalid or altered records." It is the complete and overall validation of the system, as developed by the organization, which ensures the integrity of the system and the data within. It is to this end that

PN 383674 Rev. A 68
the features of the Vi-CELL software comply with the specifications of these regulations.
6. ESTABLISHING AN ELECTRONIC RECORD The Vi-CELL XR software employs a system of usernames and passwords, consistent with the specifications of Subpart C, Section 11.300, "to ensure that only authorized individuals can use the system, electronically sign a record, access the operation or computer system input or output device, alter a record, or perform the operation at hand".
6.1 21 CFR PART 11 SECURITY If you select the security option (Security, Turn Security On) a dialog box appear requiring you to enter a user name and password and set the time in minutes for instrument timeout.
Once signed on, click on Security, Add New User to define users and access levels. The Add New User dialog appears.
The Security Options Screen
• Passwords must be a minimum of 8 characters • Password expiry is set at 60 days • Activity disable is set at 15 minutes with a maximum of 1439.

PN 383674 Rev. A 69
The Add New User dialog screen
New users can only be created and passwords reset by users with Administrator rights. This file is protected with a checksum and for each user name, contains information on when the user was created, by whom, at what level, the users password in encrypted form and the users file paths. If this file does not exist or if the checksum is missing or invalid then access to the system will only be possible to a limited number of special users.
6.2 FILE HISTORY The Vi-CELL XR software also performs data input and "operational checks", as specified in Subpart B, Section 11.10, "to determine, as appropriate, the validity of the source of data input or operational instruction", and "to enforce permitted sequencing of steps and events". These two features ensure that, as much as possible, valid data are being entered into the system, and all required steps have been completed to perform the task at hand. The purpose of all such data checking and validation is described in Section 11.10, Paragraph (b): "The ability to generate accurate and complete copies of records in both human readable and electronic form suitable for inspection, review, and copying by the agency". Consequently, strict procedures can be enforced within the Vi-CELL software system to record all changes that are made to data

PN 383674 Rev. A 70
generated from within Vi-CELL software, as defined in Section 11.10, Paragraph (e). When a change to a file is detected, the Vi-CELL software automatically records the identity of the user making the change, the date and timestamp of the change, the parameter that has changed, the old value and the new value. The user is also required to ‘re-sign’ the record electronically and enter a reason for the change, from a pre-defined list or as free text.
6.3 ELECTRONIC SIGNATURE In Subpart A, Section 11.3, an electronic signature is defined as "a computer data compilation of any symbol or series of symbols executed, adopted, or authorized by an individual to be the legally binding equivalent of the individual’s handwritten signature". Subpart C, Section 11.100 of the regulation defines the general requirements of such a manifestation. Paragraph (a) states that "each electronic signature shall be unique to one individual and shall not be reused by, or reassigned to, anyone else". These two paragraphs, taken together, mean that an electronic signature is some computer representation of a user's identity, developed to insure the distinct and unique identity of that user. The procedural aspect of Section 11.100 requires that before any such electronic representation is applied, the organization first must "verify" the identity of that individual. The subsequent use of electronic signatures as the "legally binding equivalent of traditional handwritten signatures" then must be "certified" to the agency in writing Subpart C, Section 11.200, refers to biometric and non-biometric forms of electronic signature. Biometric signatures are defined in Subpart A, Section 11.3 as a "a method of verifying an individual’s identity based on measurement of the individual’s physical feature(s) or repeatable action(s) where those features and/or actions are both unique to that individual and measurable". Biometrics are generally regarded as techniques such as fingerprints or retinal scans, which are considered to be totally unique to each individual and require specific forms of scanning devices to read and interpret. Non-biometric signatures are those that are computer generated and, as per Section 11.200, "Employ at least two distinct identification components such as an identification code and password". It is this form of electronic signature that is supported by the Vi-CELL software. 6.4 GENERATING ELECTRONIC SIGNATURES The Vi-CELL software employs User ID's and passwords to verify the identification of each user logging into the system. When using this technique, Subpart C, Section 11.300 of the regulation requires "maintaining the uniqueness of each combined identification code and password, such that no two individuals have the same combination of identification code and password". This section also requires that the "identification code and password issuance’s are periodically checked, recalled, or revised". Vi-CELL software supports both of these provisions.

PN 383674 Rev. A 71
The administration of the system requires that individuals are added to the list of valid Vi-CELL users via the Add a New User dialog screen. The "identification code" or username of each Vi-CELL user must be unique. No two users on the same Vi-CELL system can have the same user name. It is also required that these users supply a password to access the Vi-CELL software, thus satisfying the requirement to "employ at least two distinct identification components such as an identification code and password". Passwords can be controlled to prohibit the use of duplicates and to force the selection of new passwords after a prescribed period of time. By the implementation of these features, the Vi-CELL software can satisfy the requirement that "identification code and password issuance’s are periodically checked, recalled, or revised". Users may be authorized to generate electronic signatures by the administrator. This authorization is granted in the Security dialog box. When a user has been authorized, he can electronically sign a file. To generate the electronic signature, open a file as described in Section 3. Once the file is either opened, created or reviewed click on Sign Run on the lower right side of the screen to approve a run.

PN 383674 Rev. A 72
SIGNING A RUN
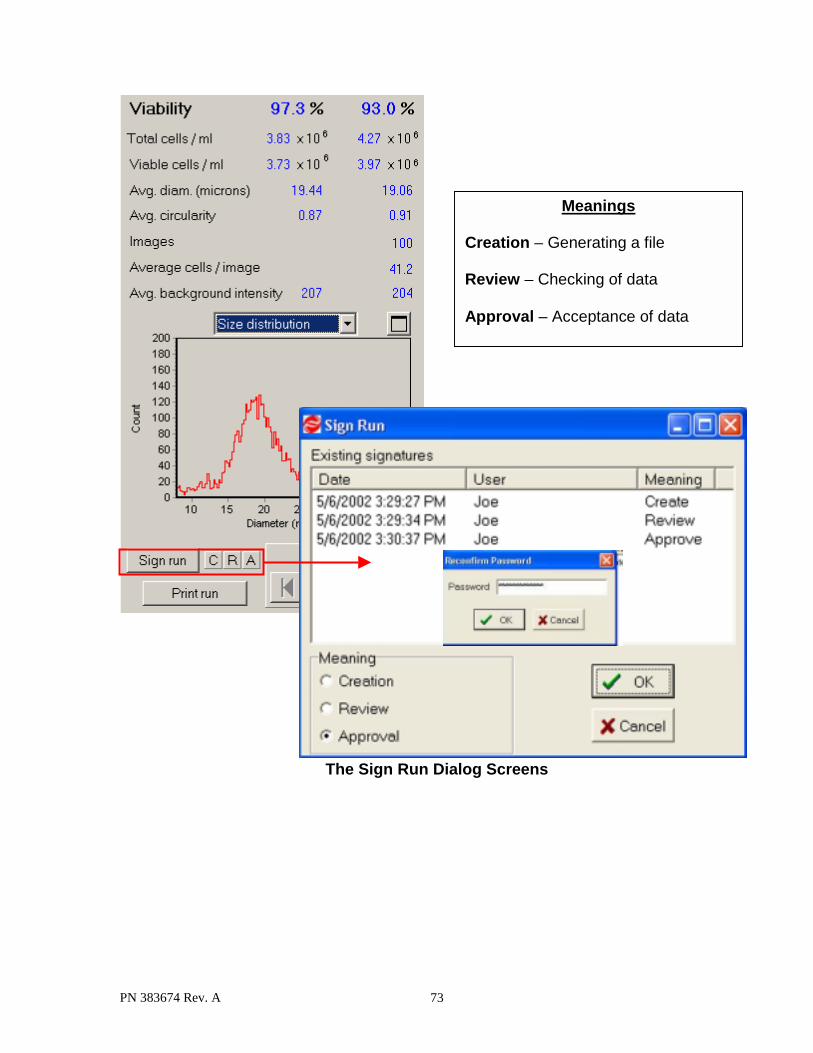
Once users have been created and access levels assigned, users given signing rights will be able to sign a run upon completion and review of analysis data. The Sign Run dialog will appear. From the list of user names, select the appropriate user ID and select Creation, Review or Approval. A Reconfirm Password dialog will appear. Enter the password. The results will then be electronically signed and saved.
PN 383674 Rev. A 73
The Sign Run Dialog Screens
Meanings
Creation – Generating a file Review – Checking of data Approval – Acceptance of data

PN 383674 Rev. A 74
6.5 APPLYING ELECTRONIC SIGNATURES
Subpart C, Section 11.200 stipulates several requirements for the control of electronic signatures. Procedurally, the regulations require that electronic signatures "be used only by their genuine owners" and that they "be administered and executed to ensure that attempted use of an individual’s electronic signature by anyone other than its genuine owner requires collaboration of two or more individuals". Through the application of Vi-CELL user and password configuration procedures, the system can be configured to "ensure" that inappropriate use of these identifiers can be performed only by the intentional divulgence of security information. Section 11.200 further specifies the use of electronic signature components during a period "when an individual executes a series of signings during a single, continuous period of controlled system access", and "when an individual executes one or more signings not performed during a single, continuous period of controlled system access". This section of the document represents the "heart" of electronic signature application. To comply with these provisions, the Vi-CELL software uses the application of the username and password to authenticate the user making and saving the changes, in conjunction with file history and audit trailing, "to independently record the date and time of operator entries and actions that create, modify, or delete electronic records”.

PN 383674 Rev. A 75
APPENDIX I – SYSTEM SPECIFICATIONS Data Acquisition Operating principle: analysis of video images Sample type: spatial data Overall diameter range: 3 microns to 70 microns Analysis rate: up to 50 Images in 2.5 minutes Digitizing resolution: 1.45 mega-pixels Cell Viability / Concentration / Cell Count Concentration Range: 5 x 10⁴ to 1 x 10⁷ Cells / mL Viability Range: 0% to 100% Counting Accuracy: ±6% PHYSICAL REQUIREMENTS Power 50 watts (65 watts max.) Voltages 100, 120, 220, 240 VAC 50/60 Hz Temperature 10 degrees to 40 degrees C (50 to 104 F) Fuses 1- 120V 1A SLO-BLO 2 – 240V 2.5A SLO-BLO Unit Dimensions Analyzer: 17.5 in. (44.5cm) x 15.0 in. (38cm) x 16.0 in. (41cm) Weight: 25 lbs. (11.3 kg.)

PN 383674 Rev. A 76
APPENDIX II – CELL TYPES – Flow Chart Creating and modifying a cell type

PN 383674 Rev. A 77
APPENDIX III – STATISTICS Circularity: a value from 0 to 1, with 1 representing a perfect circle. Computed as
Da / Dp, where Da = square root (4 A / π ), Dp = P / π ; A = pixel area, P = pixel perimeter.
*The circularity distribution is based on individual cells, not cells that are part of clusters
System Performance Run Statistics Cell Count: the actual number of cells recorded per frame and for the total number of
frames. Viable Cells: the number of viable cells per image and for the total number of images. Viability: the percentage of viable cells per image and for the total number of images. Total Cells / mL: the concentration of cells per mL. Viable cells / mL: the concentration of viable or “live” cells per mL. Avg. Diameter: the average size of cells per image and for total images. Avg. Circularity: the average “roundness” of the cells. Images: The total number of images analyzed Average cells / image: the number of cells captured per image Background intensity: the average pixel value, from 0 to 255, of the image background. Calibration Micron/pixel ratio: the micron distance that a linear pixel represents. Magnification: the increase in size, as a factor, from an actual object to its image on the
CCD array. Image size: the area in square cm that each image encompasses.

PN 383674 Rev. A 78
APPENDIX IV – TROUBLESHOOTING Black Image Possible causes are: • Light source failure • Camera failure or camera cable problem • Digitizer board problem • Light completely obstructed by an object or extremely high cell density Error messages during program start “Open device fail”: an instance of Vi-CELL is already running on the computer, or there
is a problem with the board driver. Erratic or delayed image capture Possible causes are: • Interrupt conflict • Network connection
In this case, the network driver must be disabled when running Vi-CELL (simply disconnecting from the network or removing cables will not work).
“Out of reagent” message and one or more reagent LED’s off. Possible causes are: • Out of one or more reagents • Reagent tubing coming from Vi-CELL to the Reagent pack has been pulled, causing
optical sensor to not see fluid in the line. To remedy, first ensure there is indeed reagent in the lines and the reagent pack then grab the tubing near the opening where the tubing exits the instrument and press in the tubing slightly until the LED comes on.

PN 383674 Rev. A 79
APPENDIX V – MAINTAINING THE Vi-CELL The Vi-CELL performs the following procedure via the on-board wizard. Should the system require decontamination, perform the following procedure.
All instrument decontamination must be conducted under universal precautions for blood-borne pathogens. Instrument effluents should be regarded as a biohazard. Special care is required when opening pressurized fluid lines. Appropriate safety equipment must be worn (eye protection, latex gloves, and lab coat).
1. Purge the system for 15 minutes with a solution of 0.5% sodium hypochlorite (10%
bleach, prepared by mixing 1 part household bleach with 9 parts water).
2. Flush the system with water for at least 5 minutes to completely wash the Bleach from the system. Purge rinse water from the system. Ensure system is thoroughly drained.
3. Decontaminate the external aspects of the system by washing with 0.5% Sodium hypochlorite solution (10% bleach, prepared as in step 1 above). Remove all dried blood or cell culture media from the instrument surface before disinfection. To remove these substances and prevent scattering potentially biohazardous material, the blood or culture media should be wetted and softened with the .5% sodium hypochlorite solution. After removal of the dried substances, decontaminate the surface of the Vi-CELL with the bleach solution again. If complete removal is not possible, expose the instrument surface to the 10% bleach solution for 20-30 minutes. Rinse the surface with water to remove the bleach. In the Vi-CELL software, there is a Decontamination wizard, which “walks” the operator through this standard procedure (for the internal components). Select Instrument and, from the dropdown box, decontaminate.

PN 383674 Rev. A 80
APPENDIX VI – AUTO-FOCUSING PROCEDURE A focusing wizard is provided that automatically checks and if necessary adjusts the focus. Selecting the set focus item in the diagnostic menu and using the Vi-CELL XR Focus Control that is supplied with the instrument (or can be supplied by Beckman Coulter) begins the process. It is especially important to run the wizard after the instrument has been physically moved to insure optimum results.

PN 383674 Rev. A 81

PN 383674 Rev. A 82