Embed Size (px)
Citation preview

Feasibility Study
for a
Proposed Multi-Purpose Arena on UVM Property
presented to:
Vermont Arena Commission
presented by: February 4, 2005
Proposed Arena

Conventions, Sports & Leisure International 2121 W. Spring Creek Parkway, Suite 108 • Plano, TX 75023 • Telephone 972.491.6900 • Facsimile 972.491.6903
February 4, 2005 Mr. Kevin Dorn Chairman Vermont Arena Commission Agency of Commerce and Community Development National Life Building, Drawer 20 Montpelier, Vermont 05620-0501 Dear Mr. Dorn: Conventions, Sports & Leisure International (“CSL”) is pleased to present this report regarding the market, building program, financial, cost, economic impact and funding potential for a new multi-purpose arena in northwest Vermont. The attached report summarizes our research and analyses and is intended to assist members of the Vermont Arena Commission with their decisions regarding a new arena. The information contained in this report is based on estimates, assumptions and other information developed from research of the market, knowledge of the public assembly facility industry and other factors, including certain information you have provided. All information provided to us by others was not audited or verified and was assumed to be correct. Because procedures were limited, we express no opinion or assurances of any kind on the achievability of any projected information contained herein and this report should not be relied upon for that purpose. Furthermore, there will be differences between projected and actual results. This is because events and circumstances frequently do not occur as expected, and those differences may be material. We have no responsibility to update this report for events and circumstances occurring after the date of this report.
Mr. Kevin Dorn February 4, 2005 Page 2 of 2
We sincerely appreciate the opportunity to assist you with this project, and would be pleased to be of further assistance in the interpretation and application of the study’s findings. Very truly yours, CSL International
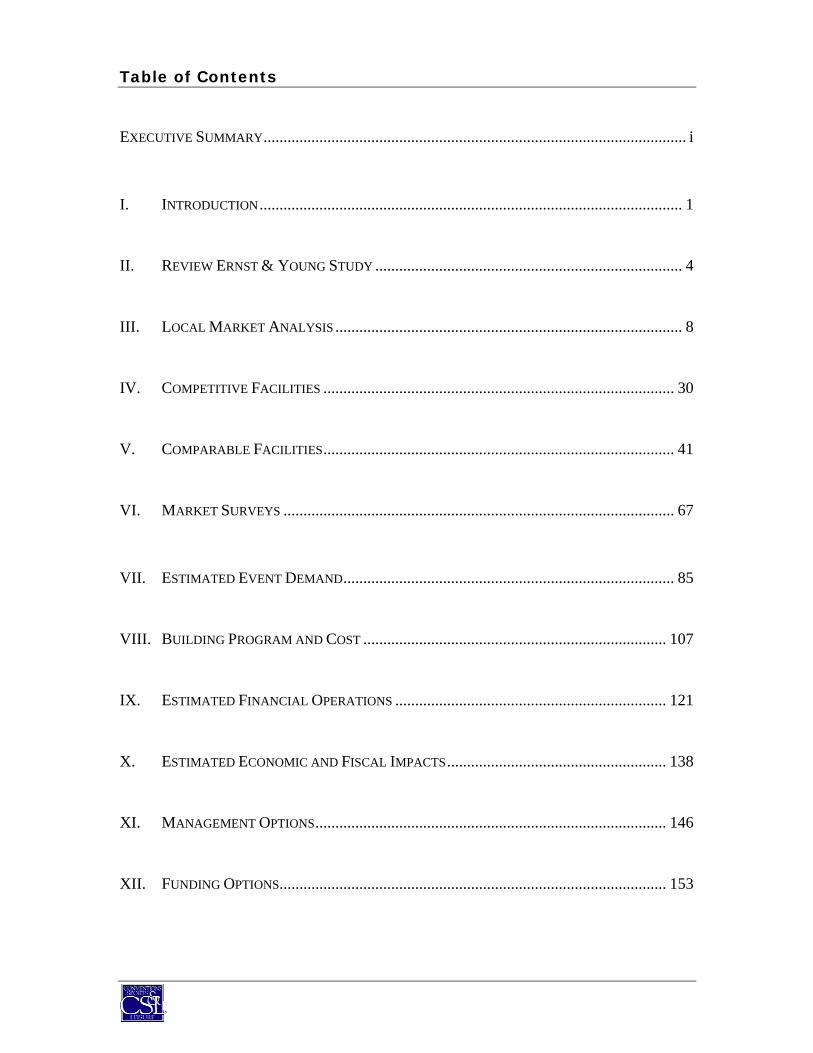
Table of Contents
EXECUTIVE SUMMARY.......................................................................................................... i I. INTRODUCTION.......................................................................................................... 1 II. REVIEW ERNST & YOUNG STUDY ............................................................................. 4 III. LOCAL MARKET ANALYSIS ....................................................................................... 8 IV. COMPETITIVE FACILITIES ........................................................................................ 30 V. COMPARABLE FACILITIES........................................................................................ 41 VI. MARKET SURVEYS .................................................................................................. 67 VII. ESTIMATED EVENT DEMAND................................................................................... 85 VIII. BUILDING PROGRAM AND COST ............................................................................ 107 IX. ESTIMATED FINANCIAL OPERATIONS .................................................................... 121 X. ESTIMATED ECONOMIC AND FISCAL IMPACTS....................................................... 138 XI. MANAGEMENT OPTIONS........................................................................................ 146 XII. FUNDING OPTIONS................................................................................................. 153

CONFIDENTIAL DRAFTFor Discussion Purposes Only
For Internal Use
Executive Summary
I. Introduction
II. Review of Ernst & Young Study
III. Local Market Analysis
IV. Competitive Facilities
V. Comparable Facilities
VI. Market Surveys
VII. Estimated Event Demand
VIII. Building Program and Cost
IX. Estimated Financial Operations
X. Estimated Economic and Fiscal Impacts
XI. Management Options
XII. Funding Options
Executive Summary

Executive Summary
i
The Lake Champlain Regional Chamber of Commerce (“LCRCC”) commissioned a study in 1997 regarding the feasibility of a convention/civic center to be located in Chittenden County. The results of the Ernst & Young (“E&Y)” study indicted that while there was marginal demand for a convention center facility, it would not likely sustain itself through annual operations nor would it meet the goals established by the Convention/Civic Center Task Force. However, the study did recommend that the area could potentially support a new civic arena seating upwards of 10,000 seats with a minor league hockey tenant. At the time of that study, the University of Vermont (“UVM”) was not contemplated as a tenant in the arena. Since this time, UVM has come under new leadership. On January 31, 2003, UVM President Daniel Mark Fogel articulated a bold and dynamic vision for UVM that includes the development of a 9,000-seat arena through a public-private partnership, with the UVM’s hockey and basketball programs serving as anchor tenants along with a minor league hockey team. As a result of President Fogel’s vision and the recommendations stemming from the 1997 report, Governor James Douglas appointed the Vermont Arena Commission (“Commission”) to determine the feasibility of a new arena on UVM property. As an initial step, LCRCC, on behalf of itself and other members of the Commission, engaged Conventions, Sports & Leisure (“CSL”) to conduct a comprehensive feasibility study for a new multi-purpose arena to be built on UVM property, with UVM to serve as anchor tenants for hockey and basketball. Oftentimes, conclusions as to project “feasibility” can be assessed in various ways, including:
• Market Feasibility – the ability of the arena to attract and support levels of event activity and facility utilization that is consistent with, or in excess of, industry standards.
• Financial Feasibility – the ability of the arena to “break-even” or generate an operating profit focusing only on direct arena-related operating revenues and expenses.
• Economic Spending – the ability of the arena to generate new spending activity in the local community (i.e. direct and indirect spending that is attributable to out-of-town arena event attendees/participants that would not otherwise occur in the local area).

Executive Summary (cont’d)
ii
• Tax Generation – the ability of the arena to generate new tax revenue for the local area (i.e. tax revenue resulting from direct, indirect and induced spending that is attributable to out-of-town arena event attendees/participants that would not otherwise occur in the local area).
• Cost/Benefit/Return on Investment – the ability of the arena to generate new revenues (i.e., from taxes, operating income and ancillary arena-related revenues, etc.) in excess of quantifiable arena-related costs (i.e. construction costs, operating costs, capitals reserves, etc.).
• Intangible Benefits / Public Goods – the ability of the arena to represent an important resource for the local community, regardless of financial or economic concerns. The facility would represent an important entertainment option that the local community presently lacks – a benefit that is not easily quantifiable. These types of facilities add to the local community’s “quality of life” in the same way that libraries, museums and theaters do, without directly generating the economic impacts that a facility such as a convention center might.
In order to assess the feasibility of the proposed arena, CSL reviewed the findings contained in the E&Y report, reviewed local market demographic and socioeconomic characteristics, analyzed competitive and comparable facilities, interviewed arena event promoters, and surveyed local corporations, UVM students and the general public. Research results were used to estimate potential demand for the proposed arena, define general building program elements necessary to accommodate demand, estimate potential project costs, estimate potential financial operating results, estimate potential economic benefits, assess potential management options, and identify and quantify potential funding sources.
Financial, Economic Impacts,
Funding&
Management Options
Financial, Economic Impacts,
Funding&
Management Options
Local Interviews
Local Interviews
Historical Operations
Historical Operations
Market Surveys
Market Surveys
Market DemandBuilding Program,
& Potential Costs
Market DemandBuilding Program,
& Potential Costs
Competitive/ Comparable
Facilities
Competitive/ Comparable
Facilities
Internal Analysis &
Project Planning
Internal Analysis &
Project Planning
Review Previous
E&Y Study
Review Previous
E&Y Study
Study Components
Local Market
Characteristics
Local Market
Characteristics
Study Methodology

Executive Summary (cont’d)
iii
The following are key conclusions from a comprehensive, market-based study of the viability of a new multi-purpose arena to be located on the UVM campus. MARKET ANALYSIS
• The Burlington metropolitan area has approximately 203,629 people and is the 209th largest among 323 metropolitan areas in the United States. A total of 477,301 residents live within 50 miles of the proposed arena, an area comprising the proposed arena’s primary and secondary market area and the area from which virtually all arena attendees will be drawn.
• A comparison of the primary and secondary market sizes of 29 arenas that have been built since 1995 with fixed seating capacities between 5,000 and 10,000 seats indicates that the Burlington marketplace ranks 28th out of 30 markets in terms of population.
• The age and income characteristics of the market indicate a potential for a moderate to high level of attendance penetration in the local market.
• Overall, the local market has a relatively small corporate base which could negatively impact the ability to sell premium seating and sponsorships at the proposed arena, support multiple tenants and demand for meetings, conferences and other events.
• While located in a relatively small market, the proposed arena will face limited competition from existing sports and entertainment facilities, teams and events in the marketplace (locally and within the State). Most new arenas in other markets compete with one or more other commercially operated arenas as well as numerous other sports and entertainment options within their respective marketplaces. The lack of significant competition in the local marketplace will be critical to the long-term success of a multi-purpose arena in the Burlington marketplace.
• Over 700 random surveys were completed with local households, corporations and UVM students to assess potential demand for a new arena. The following are key results:
The majority of respondents indicated a positive attitude towards the development of a multi-purpose arena on the UVM campus. Specifically, 72 percent of corporations, 61 percent of the general public and 58 percent of UVM students have a positive attitude towards arena development.
Interest in attending sports and entertainment events at a new arena is high, with 88 percent of corporate respondents, 81 percent of the general

Executive Summary (cont’d)
iv
public and 80 percent of UVM students indicating a positive interest in attending future events at a new arena.
Respondents indicated the most interest in attending concerts, UVM men’s basketball games, UVM men’s hockey games and family shows. The least desired events included professional wrestling and motor sports.
Interest in private boxes at a new arena was limited to moderate with 18 to 26 percent of the corporate community indicating potential interest in private boxes, depending on the price.
Interest in club seats at a new arena was higher with 37 to 49 percent of the corporate community and 14 to 23 percent of the general public indicating potential interest in club seats, depending on the price.
Interest in donor (or priority) seating for UVM sporting events at a new arena was comparable to club seat interest.
• According to the large majority of arena event promoters (concerts, family shows, sporting events, etc.) contacted as part of this study, the Burlington metropolitan area’s location relative to other regional markets with major sports and entertainment arenas (Montreal, Albany, Manchester, etc.) is considered attractive when developing a routing schedule for their acts, as it represents a convenient stop between larger markets.
• However, Burlington’s relatively remote location and lack of direct flights to national and regional cities limits the ability of the market to serve as a major national or regional convention, tradeshow or conference market. Further, the marketability of the community for major conventions, tradeshows and conferences is somewhat limited based on the availability of convention-quality hotel rooms during peak periods from late Spring trough early Fall.
• There are a limited number of sporting and entertainment facility options within the immediate Burlington area that could offer the same state-of-the-art amenities as the new proposed arena. While there may be some degree of competition among local facilities to host certain events, competition is expected to come primarily in the form of competing for corporate sponsorship dollars and the discretionary spending of local residents. A review of other markets throughout the country indicates that this competition would not be any greater than what is experienced by similar facilities in comparable markets.
• However, it should be noted that the long-term master plan for Champlain Valley Exposition includes the development of a 9,000-seat multi-purpose arena. Given local market demographics, it is unlikely that the market could successfully support two new commercially operated arenas on a long-term basis. Prior to the development of a new arena on the UVM campus, it is imperative that the

Executive Summary (cont’d)
v
Vermont Arena Commission work with CVE representatives to determine the appropriate pubic assembly facility development options that would be most beneficial to the local area.
• The physical, operational and financial characteristics of nine comparable facilities were analyzed in order to provide a benchmark from which to assess the potential feasibility for a multi-purpose arena on the UVM campus. The following are key findings from comparable facilities:
Comparable facilities had an average capacity of approximately 7,840 fixed seats and a total capacity of 9,233 seats (fixed plus portable).
The average total development cost of the recently built comparable facilities was a total of approximately $56.2 million. On average, the level of private funding participation for these facilities averaged 35.5 percent of the total costs while the remaining 64.5 percent of funding was derived from various public sources.
Ownership of comparable venues tends to be primarily through a university or a public entity. However, private contract management firms, such as Global Spectrum or SMG, which specialize in arena management, dominate daily operations and management of comparable facilities.
Comparable arenas hosted an average of 111 events, ranging from a low of 71 events at the Ryan Center in Kingston, Rhode Island to a high of 150 events at both the Resch Center in Green Bay, Wisconsin and Paul Tsongas arena in Lowell, Massachusetts. Facilities with the highest event activity hosted both collegiate and minor league sports tenants.
In terms of non-tenant events, comparable facilities hosted an average of 68 events, ranging from a low of 36 events at the Ryan Center to a high of 94 events at the Resch Center. Non-tenant events typically included concerts, family shows, high school sports, graduations, flat floor shows, and other miscellaneous events.
Seven out of nine comparable facilities have private suites. The average number of private suites was 18 at facilities with private suites, ranging from a low of 8 to a high of 29. The average annual suite price was $25,733.
Five out of nine comparable facilities have club seats. The average number of club seats was 568 at facilities with club seats, ranging from a low of 100 to a high of 1,020. The average annual club seat price was $1,770.

Executive Summary (cont’d)
vi
• The following table presents a summary of the estimated annual events and attendance that could be attracted to a new multi-purpose arena operating on the UVM campus in a stabilized year of operations, assuming only UVM hockey and basketball as major tenants.
• As depicted above, it is estimated that a new multi-purpose arena operating on the UVM campus with only UVM hockey and basketball as the main tenants could host 100 to 118 events, drawing approximately 247,700 to 286,500 paid attendees annually and 302,200 to 346,000 turnstile attendees annually.
• While a minor league tenant has not been assumed in the base assumptions of this analysis, a sensitivity analysis has been prepared to provide an indication of potential arena utilization if a minor league hockey team and/or indoor football were to become tenants in the arena.
Estimated Events and Attendance - UVM as Only Major TenantsProposed Multi-Purpose Arena on UVM Campus
Average AverageEvents Paid Turnstile Total Paid Attendance Total Turnstile Attendance
Event Type Base Case Best Case Attendance Attendance Base Case Best Case Base Case Best Case
Tenant Events:UVM Men's Basketball 12 12 1,800 2,700 21,600 21,600 32,400 32,400UVM Women's Basketball 12 12 1,200 1,600 14,400 14,400 19,200 19,200UVM Men's Hockey 18 20 3,700 4,750 66,600 74,000 85,500 95,000
Subtotal 42 44 102,600 110,000 137,100 146,600
Non-Tenant Events:Concerts 10 10 4,700 5,000 47,000 47,000 50,000 50,000Ice Shows 6 8 4,500 4,500 27,000 36,000 27,000 36,000Family Shows 10 12 3,500 3,750 35,000 42,000 37,500 45,000High School Sports 8 10 2,200 2,200 17,600 22,000 17,600 22,000Motor Sports 1 2 3,500 3,500 3,500 7,000 3,500 7,000Other Sports 4 6 3,750 3,750 15,000 22,500 15,000 22,500Flat Floor Shows 9 12 0 1,000 0 0 9,000 12,000Miscellaneous Events 10 14 0 350 0 0 3,500 4,900
Subtotal 58 74 145,100 176,500 163,100 199,400
Total 100 118 247,700 286,500 300,200 346,000
Exhibit VII-8Estimated Events and Attendance - UVM and Minor League Sports as Tenants
Proposed Multi-Purpose Arena on UVM Campus
Average AverageEvents Paid Turnstile Total Paid Attendance Total Turnstile Attendance
Event Type Base Case Best Case Attendance Attendance Base Case Best Case Base Case Best Case
Tenant Events:UVM Men's Basketball 12 12 1,800 2,700 21,600 21,600 32,400 32,400UVM Women's Basketball 12 12 1,200 1,600 14,400 14,400 19,200 19,200UVM Men's Hockey 18 20 3,330 4,275 59,940 66,600 76,950 85,500ECHL 36 36 3,500 4,000 126,000 126,000 144,000 144,000af2 0 8 3,750 4,000 0 30,000 0 32,000
Subtotal 78 88 221,940 258,600 272,550 313,100
Non-Tenant Events:Concerts 10 12 4,700 5,000 47,000 56,400 50,000 60,000Ice Shows 4 5 4,750 5,000 19,000 23,750 20,000 25,000Family Shows 8 10 3,500 3,750 28,000 35,000 30,000 37,500High School Sports 8 10 2,200 2,200 17,600 22,000 17,600 22,000Motor Sports 1 2 3,600 3,600 3,600 7,200 3,600 7,200Other Sports 4 5 4,500 4,500 18,000 22,500 18,000 22,500Flat Floor Shows 7 8 0 1,000 0 0 7,000 8,000Miscellaneous Events 8 10 0 350 0 0 2,800 3,500
Subtotal 50 62 133,200 166,850 149,000 185,700
Total 128 150 355,140 425,450 421,550 498,800

Executive Summary (cont’d)
vii
• As depicted above, it is estimated that a new multi-purpose arena operating on the UVM campus and hosting minor league sports tenants could host 128 to 150 events, drawing approximately 355,140 to 425,450 paid attendees annually and 421,550 to 498,800 turnstile attendees annually.
• It should be noted that there are limited examples of a minor league hockey franchise and a Division I hockey program co-existing in the same facility in a market comparable in size to Burlington. As a result, it is not known what impact, if any, a minor league hockey team could have on the attendance of UVM men’s hockey program or their ability to generate advertising and sponsorship sales. This is of particular concern in a market with limited resources (population and corporate base), such as Burlington.
BUILDING PROGRAM AND COST
• The recommended physical characteristics of the proposed arena are based on the needs of primary tenants of the facility, physical characteristics of arenas located in similar markets and the requirements of other potential events that would likely use the proposed arena.
• A building program consisting of the following general elements is suggested based on market demand:
6,500 fixed seats for ice hockey with the capability of expanding to 8,000 total seats for concerts and other events through use of portable seating;
20,000 to 25,000 square foot arena floor capable of accommodating an 85’ by 200’ ice sheet;
2,500 to 3,000 square feet of sub-dividable meeting space (4 to 6 rooms);
10 to 12 private boxes;
450 to 500 club seats;
5,000 to 6,000 square foot club lounge;
Ancillary ice sheet to accommodate UVM hockey practices and demand from local community; and,
2,200 to 2,700 parking spaces within walking distance.
• CSL enlisted the services of Cannon Design to provide a general indication of potential project costs based on the recommended building program being constructed in the Burlington marketplace. It is estimated that project costs, excluding land, parking and infrastructure costs, associated with a new 6,500-

Executive Summary (cont’d)
viii
fixed seat arena on the UVM campus could range from $42.6 million to $59.5 million in 2008 dollars, assuming a 250,000 square foot facility.
• A site analysis and specific facility design would need to be developed before more precise estimates of total project costs could be made.
FINANCIAL OPERATIONS
• Potential financial operating results of the proposed arena were made based on the results of the market analysis, industry trends, knowledge of the marketplace and historical financial results from comparable facilities. Further, the financial analysis was reviewed by key executives within the arena industry with extensive operating histories with comparable arenas.
• Several key assumptions were made in estimating potential revenues and expenses associated with the proposed arena:
The facility will contain 6,500 seats, expandable to 8,000 seats with temporary floor seating.
The facility will be developed as a quality, state-of-the-art venue and would accommodate the needs of various user types.
The facility will be owned by UVM or a public entity and will be exempt from property taxes.
UVM men’s hockey and UVM men’s and women’s basketball will serve as the primary tenants in the arena and will remain competitive within their respective conferences.
A professional, competent and experienced facility management company will manage the facility.
The facility is aggressively marketed, providing competitive guarantees and, where applicable, rental rates.
Ample parking and related infrastructure will be provided to accommodate demand.
There are no significant or material changes in the supply or quality of existing venues in the marketplace.
All dollar amounts are stated in 2008 dollars, the first year of arena operations, and assume a stabilized year of operations.
Executive Summary (cont’d)
ix
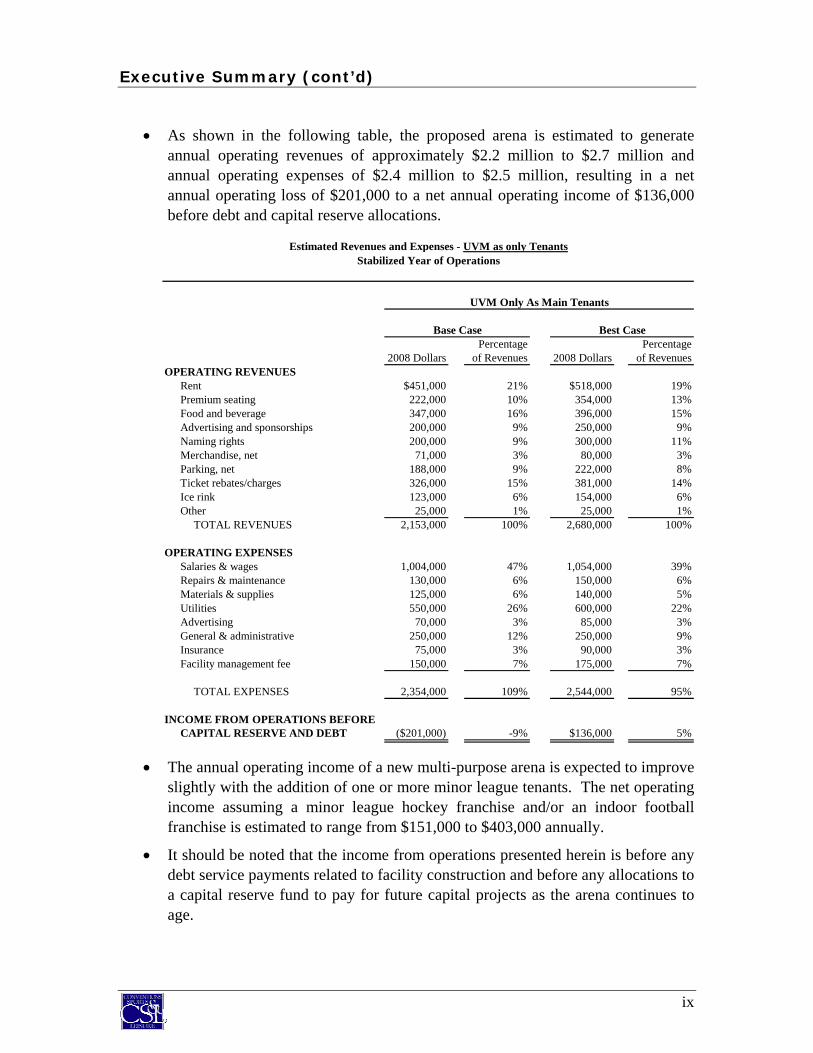
• As shown in the following table, the proposed arena is estimated to generate annual operating revenues of approximately $2.2 million to $2.7 million and annual operating expenses of $2.4 million to $2.5 million, resulting in a net annual operating loss of $201,000 to a net annual operating income of $136,000 before debt and capital reserve allocations.
• The annual operating income of a new multi-purpose arena is expected to improve slightly with the addition of one or more minor league tenants. The net operating income assuming a minor league hockey franchise and/or an indoor football franchise is estimated to range from $151,000 to $403,000 annually.
• It should be noted that the income from operations presented herein is before any debt service payments related to facility construction and before any allocations to a capital reserve fund to pay for future capital projects as the arena continues to age.
Estimated Revenues and Expenses - UVM as only TenantsStabilized Year of Operations
UVM Only As Main Tenants
Base Case Best CasePercentage Percentage
2008 Dollars of Revenues 2008 Dollars of RevenuesOPERATING REVENUES
Rent $451,000 21% $518,000 19%Premium seating 222,000 10% 354,000 13%Food and beverage 347,000 16% 396,000 15%Advertising and sponsorships 200,000 9% 250,000 9%Naming rights 200,000 9% 300,000 11%Merchandise, net 71,000 3% 80,000 3%Parking, net 188,000 9% 222,000 8%Ticket rebates/charges 326,000 15% 381,000 14%Ice rink 123,000 6% 154,000 6%Other 25,000 1% 25,000 1%
TOTAL REVENUES 2,153,000 100% 2,680,000 100%
OPERATING EXPENSESSalaries & wages 1,004,000 47% 1,054,000 39%Repairs & maintenance 130,000 6% 150,000 6%Materials & supplies 125,000 6% 140,000 5%Utilities 550,000 26% 600,000 22%Advertising 70,000 3% 85,000 3%General & administrative 250,000 12% 250,000 9%Insurance 75,000 3% 90,000 3%Facility management fee 150,000 7% 175,000 7%
TOTAL EXPENSES 2,354,000 109% 2,544,000 95%
INCOME FROM OPERATIONS BEFORECAPITAL RESERVE AND DEBT ($201,000) -9% $136,000 5%

Executive Summary (cont’d)
x
ECONOMIC AND FISCAL IMPACTS
• While many of the perceived benefits of a multi-purpose arena are intangible including regional and national media exposure; sports, entertainment and recreation opportunities for local residents; and enhanced community pride; the construction and operation of a multi-purpose arena can provide quantifiable benefits to an area. These quantifiable benefits often serve as the “return on investment” of public dollars that are contributed to develop these facilities.
• In terms of construction impacts, the following one-time impacts have been estimated:
• Total economic and fiscal activity associated with the construction of a multi-purpose arena is estimated to generate $42.6 million to $59.5 million in total direct spending, $76.0 million to $106.3 million in total output, 730 to 1,020 full and part-time jobs generating $33.8 million to $47.3 million in total earnings and $2.7 million to $3.8 million in total tax revenues. Approximately 60 percent and 85 percent of these amounts represent net new impacts to Chittenden County and the State of Vermont, respectively.
• In terms of operations impacts, the proposed arena is estimated to have the following impacts on the local economy on an annually recurring basis.
Estimated Economic and Fiscal Impacts - 2008 DollarsConstruction - One-Time Impacts
Total Economic Activity Net New Economic Activity
Chittenden County State of Vermont
Low High Low High Low High
Direct Spending $42,550,000 $59,513,000 $25,530,000 $35,708,000 $36,168,000 $50,586,000Total Output $76,001,000 $106,300,000 $45,601,000 $63,780,000 $64,601,000 $90,355,000Jobs (1) 730 1,020 440 610 620 1,000Earnings $33,788,000 $47,258,000 $20,273,000 $28,355,000 $28,720,000 $40,170,000
Tax Revenues:Sales $1,500,000 $2,098,000 n/a n/a $1,200,000 $1,678,000Meals & Rooms $63,000 $87,000 n/a n/a $56,000 $79,000Personal Income $1,019,000 $1,425,000 n/a n/a $866,000 $1,211,000Corporate Income $105,000 $147,000 n/a n/a $40,000 $125,000
Total Tax Revenue $2,687,000 $3,757,000 n/a n/a $2,162,000 $3,093,000
(1) Includes full and part-time jobs.

Executive Summary (cont’d)
xi
• Total direct, indirect and induced spending associated with a multi-purpose arena operating on the UVM campus is estimated to range from $24.9 million to $28.6 million. Total spending is estimated to support 490 to 560 full and part time jobs, generate $10.9 million to $12.5 million in personal earnings, and $1.7 million to $2.0 million in tax revenues annually. Approximately 43 percent and 20 percent of this amount represents net new impacts to Chittenden County and the State of Vermont, respectively.
• Over a 30-year period, the total net present value of tax revenues generated by the operations of the proposed arena is estimated to range from $37.0 million to $43.0 million. Of this amount, approximately 25 percent is estimated to be net new taxes generated to the State of Vermont.
• In addition to the more quantifiable benefits generated from the construction and operations of the proposed arena, some benefits cannot be quantitatively measured. Potential qualitative benefits for the local and regional market area could include:
Diversified, affordable entertainment alternatives for families in the local area;
Enhanced community pride, self-image, exposure and reputation;
Enhanced economic growth and ancillary private sector development spurred by arena operations;
New advertising opportunities for local businesses; and,
Other such benefits.
Estimated Economic and Fiscal Impacts - 2008 DollarsOperations - Annually Recurring
Total Economic Activity Net New Economic Activity
UVM as Only Tenants
Chittenden County State of Vermont
Base Case Best Case Base Case Best Case Base Case Best Case
Direct Spending $14,633,000 $16,828,000 $6,259,000 $7,514,000 $2,801,000 $3,493,000Total Output $24,914,000 $28,633,000 $10,542,000 $12,648,000 $4,695,000 $5,852,000Jobs (1) 490 560 210 250 90 120Earnings $10,894,000 $12,469,000 $4,420,000 $5,285,000 $1,936,000 $2,407,000
Tax Revenues:Sales $830,000 $955,000 n/a n/a $157,000 $196,000Meals & Rooms $494,000 $593,000 n/a n/a $170,000 $218,000Personal Income $328,000 $376,000 n/a n/a $58,000 $73,000Corporate Income $34,000 $40,000 n/a n/a $6,000 $8,000
Total Tax Revenue $1,686,000 $1,964,000 n/a n/a $391,000 $495,000
30-Year Tax Benefit (2) $37,000,000 $43,000,000 n/a n/a $8,600,000 $10,900,000
(1) Includes full and part-time jobs.(2) Net present value (2008 dollars) of expected benefits over the expected useful life of the arena assuming 3 percent annual revenue growth and a 6 percent discount rate.

Executive Summary (cont’d)
xii
MANAGEMENT OPTIONS
• An important issue impacting the viability of the multi-purpose arena will be governance-related issues. Governance issues generally relate to facility ownership and management.
• Of new arenas between 5,000 and 10,000 seats that have been built since 1995, the majority of arenas are owned by public sector entities (city, county or state government), comprising approximately 55 percent of ownership of new arenas. Universities comprised the next largest ownership group at approximately 35 percent. Public authorities own approximately seven percent and private entities own approximately three percent of these new facilities.
• Perhaps more than other factors, high-quality management and marketing affect an arena’s utilization and financial performance. Professional and aggressive management can positively influence the number of events hosted at a facility, the ability to attract and retain minor league sports tenants, operate efficiently and provide attendees with an enjoyable experience.
• Of new arenas between 5,000 and 10,000 seats that have been built since 1995, the majority of arenas are privately managed. Specifically, approximately 62 percent are managed by private arena management companies (Global Spectrum, SMG, etc.) whereas 31 percent are managed by a university (athletics/student affairs/facilities department) and 7 percent are managed by a public sector entity.
• The appropriate facility ownership will depend on the various parties that may ultimately be involved in the planning, development, financing and on-going operations of the proposed arena. Should there be multiple parties involved, it is recommended the proposed arena ownership be in the form of an authority or a commission. The authority or commission should have representation from each of the potential project stakeholders, which may include, but are not necessarily limited to UVM, the State, local municipalities, corporate community, hospitality industry and others, as appropriate.
• Given the market size and geographic location of Burlington relative to other markets, it is recommended that the proposed arena be managed by a private arena management company. This will allow that market and the facility to benefit from the expertise of experienced arena managers and to “tap into” the network of events and relationships established by private arena management companies.
• The advantages and disadvantages of various governance options have been delineated in the full report.

Executive Summary (cont’d)
xiii
FUNDING OPTIONS
• It is estimated that a proposed 6,500 fixed seat, multi-purpose arena on the UVM campus could cost between $43 million and $60 million depending upon the building program and finish-out, excluding land acquisition, parking or infrastructure costs. Assuming an interest rate of 5.5 percent and 30-year bonds, annual debt service payments could approximate $3.0 million to $4.1 million annually if the entire amount is financed.
• The net operating income of a multi-purpose arena operating on the UVM campus is not expected to be sufficient to service debt related to total project costs. However, this is typical of virtually all arenas operating today. Historically, the development of arenas has generally involved varying degrees of public-private partnerships.
• A review of 28 comparable arena built in recent years indicates that arenas, on average, were funded 45 percent from public sector sources and 55 percent by private sources.
• Public sector sources used to fund comparable arenas included state grants or appropriations, hotel taxes, meals and rooms taxes, sales taxes, and community development block grants. Based on survey results, upwards of 84 percent of local corporations, 72 percent of the local general public and 69 percent of UVM students indicated some level of potential support for the use of public funds to construct a new arena on the UVM campus.
• Private sector sources used to fund comparable arenas included student fees, naming rights, donations, premium seating, personal seat licenses (PSLs), ticket surcharges, arena revenues and university general funds.
• It is clear that the funding sources for the proposed arena cannot be relied, to any large degree, on the revenue generating capabilities of the arena. Funding for the arena will, in large part, need to come from outside arena operating sources whether that be sources such as student fees, donations, tax revenues, grants or other such sources.
• Quantified estimates of specific public and private funding sources have been made in the full report.
This Executive Summary contains key highlights from the report. The report should be read in its entirety to obtain the background, methods and assumptions underlying the findings.
CONFIDENTIAL DRAFTFor Discussion Purposes Only
For Internal Use
Executive Summary
I. Introduction
II. Review of Ernst & Young Study
III. Local Market Analysis
IV. Competitive Facilities
V. Comparable Facilities
VI. Market Surveys
VII. Estimated Event Demand
VIII. Building Program and Cost
IX. Estimated Financial Operations
X. Estimated Economic and Fiscal Impacts
XI. Management Options
XII. Funding Options
I. Introduction

I. Introduction
1
In 1997, the Lake Champlain Regional Chamber of Commerce (“LCRCC”) commissioned Ernst & Young (“E&Y”) to study the feasibility of a convention/civic center to be located in Chittenden County, Vermont. The results of the study indicted that while there was marginal demand for a convention center facility, it would not likely sustain itself through annual operations. Based on its inability to sustain itself, project representatives elected not to move forward with the development of a convention center in Chittenden County. A by-product of the study was a recommendation that the area could potentially support a new civic arena seating upwards of 10,000 seats with a minor league hockey tenant. At the time of that study, the University of Vermont (“UVM”) was not contemplated as a tenant in the arena. Since this time, UVM has come under new leadership. On January 31, 2003, UVM President Daniel Mark Fogel articulated a bold and dynamic vision for UVM that includes the development of a 9,000-seat arena through a public-private partnership, with the UVM’s hockey and basketball programs serving as anchor tenants along with a minor league hockey team. As a result of President Fogel’s vision and the recommendations stemming from the E&Y report, Governor James Douglas appointed the Vermont Arena Commission (“Commission”) to determine the feasibility of a new arena on UVM property. As an initial step, Conventions, Sports and Leisure International (“CSL”) was engaged by the LCRCC, on behalf of itself, and the other members of the Commission to conduct a comprehensive feasibility study for a new multi-purpose arena to be built on UVM property, with UVM to serve as anchor tenants for hockey and basketball. It is anticipated that the proposed multi-purpose arena could host other events such as a minor league sports, concerts, family shows, high school sports, conventions, tradeshows, public shows, graduations and other community events. It is also envisioned that the arena could contribute to the quality of life of local residents by providing affordable entertainment opportunities, generating economic impacts and, depending upon its location, facilitating ancillary commercial developments. The overall purpose of this study is to evaluate the feasibility of the proposed arena. Oftentimes, conclusions as to project “feasibility” can be assessed in various ways, including:
• Market Feasibility – the ability of the arena to attract and support levels of event activity and facility utilization that is consistent with, or in excess of, industry standards.

I. Introduction (cont’d)
2
• Financial Feasibility – the ability of the arena to “break-even” or generate an operating profit focusing only on direct arena-related operating revenues and expenses.
• Economic Spending – the ability of the arena to generate new spending activity in the local community (i.e. direct and indirect spending that is attributable to out-of-town arena event attendees/participants that would not otherwise occur in the local area).
• Tax Generation – the ability of the arena to generate new tax revenue for the local area (i.e. tax revenue resulting from direct, indirect and induced spending that is attributable to out-of-town attendees/participants that would not otherwise occur in the local area).
• Cost/Benefit/Return on Investment – the ability of the arena to generate new revenues (i.e., from taxes, operating income and ancillary arena-related revenues, etc.) in excess of quantifiable arena-related costs (i.e. construction costs, operating costs, capitals reserves, etc.).
• Intangible Benefits / Public Goods – the ability of the arena to represent an important resource for the local community, regardless of financial or economic concerns. The facility would represent an important entertainment option that the local community presently lacks – a benefit that is not easily quantifiable. These types of facilities add to the local community’s “quality of life” in the same way that libraries, museums and theaters do, without directly generating the economic impacts that a facility such as a convention center might.
In order to assess the feasibility of the proposed arena, CSL reviewed the findings contained in the E&Y report, reviewed local market demographic and socioeconomic characteristics, analyzed competitive and comparable facilities, interviewed arena event promoters and surveyed local corporations, UVM students and the general public. Research results were used to estimate potential demand for the proposed arena, define general building program elements necessary to accommodate demand, estimate potential project costs, estimate potential financial operating results, estimate potential economic benefits, assess potential management options, and identify and quantify potential funding sources.

I. Introduction (cont’d)
3
The study’s findings are presented in the following sections:
Executive Summary I. Introduction II. Review of Ernst & Young Study III. Local Market Analysis IV. Competitive Facilities V. Comparable Facilities VI. Market Surveys VII. Estimated Event Demand VIII. Building Program and Cost IX. Estimated Financial Operations X. Estimated Economic and Fiscal Impacts XI. Management Options XII. Funding Options
This report outlines the key findings of the feasibility study for the proposed multi-purpose arena to be located on the UVM campus. This study is designed to assist project representatives in making informed decisions regarding the development of the proposed multi-purpose arena. The report should be read in its entirety to obtain the background, methods and assumptions underlying the findings.

CONFIDENTIAL DRAFTFor Discussion Purposes Only
For Internal Use
Executive Summary
I. Introduction
II. Review of Ernst & Young Study
III. Local Market Analysis
IV. Competitive Facilities
V. Comparable Facilities
VI. Market Surveys
VII. Estimated Event Demand
VIII. Building Program and Cost
IX. Estimated Financial Operations
X. Estimated Economic and Fiscal Impacts
XI. Management Options
XII. Funding Options
II. Review of Ernst & Young Study

II. Review of Ernst & Young Study
4
In January 1997, the Lake Champlain Regional Chamber of Commerce (“LCRCC”) engaged Ernst & Young LLP (“E&Y”) to analyze the market potential surrounding the development of a convention/civic center in Chittenden County. The study, entitled Convention/Civic Center Market Study, was designed to address several key parameters set forth by the Convention/Civic Center Task Force, including but not limited to:
• The facility should fill hotel rooms during the winter months, a traditionally slow period for local hoteliers.
• The facility should generate significant demand from outside the state and represent new spending to Vermont.
• The facility should provide a positive return on investment in terms of new tax revenues to the State.
In assessing the market potential of a convention/civic center, E&Y conducted interviews with 35 representatives of the local community, provided an analysis of community attributes and local/regional facilities, completed over 100 interviews and mail surveys with potential facility users, interviewed local employers and regional promoters and analyzed the operations of comparable facilities.
Convention Center A convention center is generally characterized as a facility that provides exhibition, meeting and banquet facilities to host a variety of events including conventions, tradeshows, conferences, consumer shows, meetings, receptions and other similar events. Convention centers often serve as “loss leaders” for a community in order to fill hotel rooms, generate economic impacts and enhance the quality of life of local citizens. Key conclusions reached by E&Y regarding the marketability of a convention center in Chittenden County included:
• Chittenden County faces a competitive disadvantage in attracting convention
center bookings, including but not limited to the following:
Limited hotel availability in peak season (late Spring to early Fall);
No large headquarter hotel (i.e. at least 500 to 1,000 rooms);
Harsh winter weather;
Difficult air access;
Lack of proximity to delegates; and,
Limited destination appeal.

II. Review of Ernst & Young Study (cont’d)
5
• Based on these factors, E&Y determined that a convention center facility could achieve only moderate success in attracting regional conventions, state conventions and consumer shows. E&Y concluded that a convention center would achieve limited success in attracting national or international conventions.
• E&Y indicated that a starter facility could include approximately 60,000 square feet of exhibition space, a ballroom to seat 1,000 or more and 10 to 20 meeting rooms. E&Y further indicated that a facility of this nature would comprise approximately 165,000 gross square feet and would cost approximately $25 million, exclusive of land and financing costs.
• E&Y projected that a facility of this nature would likely operate with a $500,000 or more operating deficit each year.
• Given the potential public investment and the limited market potential, E&Y concluded that it would be difficult to achieve Chittenden County’s objective of return on investment in terms of new tax revenues to the State.
• E&Y suggested that one alternative to grow Chittenden County’s convention business and to limit pubic investment may be to pursue a public-private partnership with an existing or new hotel.
Civic Arena A civic arena is generally characterized as a facility that has a large fixed seating capacity surrounding an event floor capable of accommodating a variety of events including sporting events, concerts, family shows, graduations and other similar events requiring large seating capacities or a moderate-sized flat floor space. Key conclusions made by E&Y regarding the marketability of a civic arena in Chittenden County included:
• E&Y concluded that there appeared to be market demand for a civic arena.
• The study indicated that a facility with 10,000 seats would be appropriate and could host 146 events (comprising 178 event days) and attract 436,000 attendees annually, assuming a minor league hockey franchise.
• The study also indicated this type of facility would help fulfill the community need for exhibition space, providing upwards of 20,000 to 25,000 square feet of flat-floor space.
II. Review of Ernst & Young Study (cont’d)
6
• E&Y indicated that the recommended civic arena could cost $25 million to $40 million, depending on the level of finish and amenities, and that is was highly likely that an arena would experience annual operating deficits of approximately $200,000 to $250,000.
Over seven years have past since the E&Y study was completed. In this time, a variety of changes have occurred which could impact the conclusions reached by E&Y regarding a new arena. These changes include:
• Involvement of UVM as a major tenant in the arena;
• Potential land donation by UVM;
• Inclusion of an attached ice practice facility;
• Consolidation within the concert industry;
• Proliferation of the number and type of touring arena events;
• Enhancement of facility technology and advertising/sponsorship opportunities;
• Changes to the economic and political climate in Vermont and the U.S.;
• Changes in the competitive facility landscape including, but not limited to:
Expansion and improvement of Champlain Valley Exposition facilities;
Past or expected additions or enhancements of regionally competitive facilities including, but not limited to the Bell Center in Montreal; Verizon Wireless Arena in Manchester; Pepsi Arena in Albany; and Agganis Arena in Boston.
Notwithstanding these changes since 1997, the E&Y study’s focus was primarily on determining the market demand for a convention/civic center and the resulting building program necessary to accommodate demand. In order to develop a comprehensive analysis of the viability of a new multi-purpose arena, the following analyses are also necessary to make fully informed decisions:
• Development of detailed operating proforma including specific revenues and expenses likely to be incurred;
• Detailed estimates of the potential economic and fiscal benefits generated by a multi-purpose arena including direct, indirect and induced spending, jobs, personal earning and tax revenues.

II. Review of Ernst & Young Study (cont’d)
7
• Estimation of potential project costs based on the costs associated with recent comparable arena developments; and,
• Identification and quantification of various potential private and public funding sources.
The remainder of this report presents an updated analysis of the market potential for a multi-purpose arena in light of the changes that have taken place in the industry since the E&Y study. Additionally, the remainder of this report addresses additional research and analysis to provide a comprehensive assessment of the viability of a multi-purpose arena to be built on UVM property, with UVM to serve as anchor tenants for hockey and basketball.

CONFIDENTIAL DRAFTFor Discussion Purposes Only
For Internal Use
Executive Summary
I. Introduction
II. Review of Ernst & Young Study
III. Local Market Analysis
IV. Competitive Facilities
V. Comparable Facilities
VI. Market Surveys
VII. Estimated Event Demand
VIII. Building Program and Cost
IX. Estimated Financial Operations
X. Estimated Economic and Fiscal Impacts
XI. Management Options
XII. Funding Options
III. Local Market Analysis

III. Local Market Analysis
8
The ability of a multi-purpose arena to attract events, attendees and generate revenues is measured, to some extent, by the size of the regional market area population, corporate base and its spending characteristics in the context of other local factors such as transportation access, competition from local attractions and facilities, hotel supply and weather, among other factors. This section provides an overview of the local market in terms of key market characteristics that can impact the market potential of the proposed multi-purpose arena. Accordingly, this section is presented in the following components:
• Demographic and socioeconomic characteristics;
• Transportation access;
• Hotel inventory and issues;
• Local attractions; and,
• Climate.
Demographic and Socioeconomic Characteristics An important component in assessing the potential success of the proposed multi-purpose arena is the demographic and socioeconomic profile of the local market. Specific demographic and socioeconomic information that can provide an indication of the ability of a market to support a multi-purpose arena includes population, age, household income and corporate base. Event organizers typically consider these factors when selecting the appropriate markets for their events. The demographic and socioeconomic data presented in this report is based on the anticipated primary and secondary markets of the proposed arena. The primary market is the geographic area from which it is anticipated that the majority of attendees and corporate partners are expected to originate. The size of this primary market area can be influenced by such factors as transportation systems, site accessibility, media coverage and competing sports and entertainment venues in the surrounding region. For purposes of this analysis, the primary market is estimated to comprise the Burlington Metropolitan Statistical Area (“MSA). An MSA defines a county or group of counties having a large population center and economic ties to adjacent communities. The Burlington MSA comprises Chittenden County, Franklin County, and Grand Isle County.

III. Local Market Analysis (cont’d)
9
In addition to the assessment of the primary market area, the analysis presented herein also includes an assessment of the combined primary and secondary market for the proposed arena, which is anticipated to include a 50-mile radius from the proposed facility. This represents a market within an approximate one-hour drive and includes the market area from which most attendees will be drawn. Exhibit III-1 illustrates the geographic area comprising the proposed arena’s primary and secondary markets. Depending on the market and the event, it is recognized that certain events may occasionally draw attendees beyond these areas. For purposes of this study and because a specific site on the UVM campus has not been determined, the intersection of I-89 and Williston Road in South Burlington was identified as a proxy location for the proposed arena. Population The level of population from which to draw can impact the ability of the proposed arena to draw events and attendees. Exhibit III-2 on the following page depicts the historical, current and projected population within the primary and secondary markets of the proposed arena.
Exhibit III-1Primary and Secondary Markets
50-Mile Radius
Burlington
50 Miles
III. Local Market Analysis (cont’d)
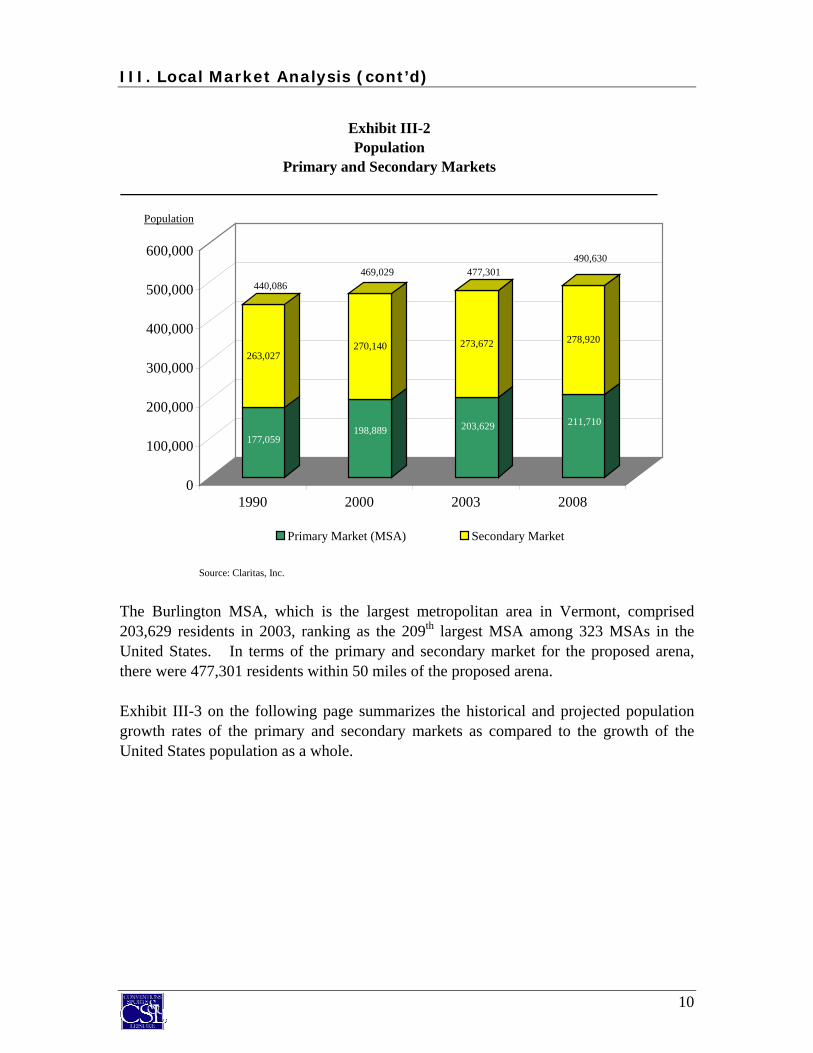
10
The Burlington MSA, which is the largest metropolitan area in Vermont, comprised 203,629 residents in 2003, ranking as the 209th largest MSA among 323 MSAs in the United States. In terms of the primary and secondary market for the proposed arena, there were 477,301 residents within 50 miles of the proposed arena. Exhibit III-3 on the following page summarizes the historical and projected population growth rates of the primary and secondary markets as compared to the growth of the United States population as a whole.
Exhibit III-2Population
Primary and Secondary Markets
Source: Claritas, Inc.
177,059
263,027
198,889
270,140
203,629
273,672
211,710
278,920
0
100,000
200,000
300,000
400,000
500,000
600,000
1990 2000 2003 2008
Primary Market (MSA) Secondary Market
440,086469,029 477,301
490,630
Population

III. Local Market Analysis (cont’d)
11
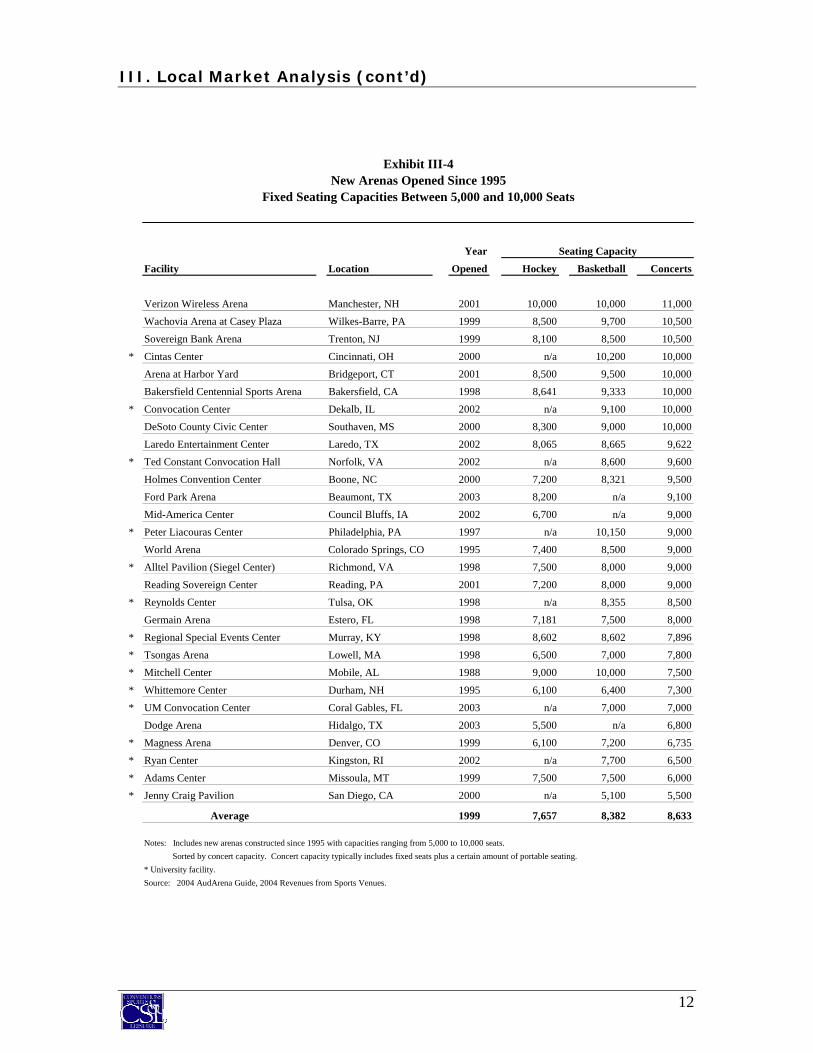
The historical and projected population growth of proposed arena’s primary market area generally mirrors the growth rate of the population of the United States, with a historical compounded annual growth rate of approximately 1.2 percent from 1990 to 2000 and 0.8 percent from 2000 to 2003. The projected growth rate over the next five years is estimated to be 0.8 percent per year. The historical and projected growth rate of the proposed arena’s secondary market is below that of the primary market, ranging from 0.3 percent to 0.4 percent per year. The modest projected growth rate of the primary and secondary markets of the proposed arena indicates that the market and attendance potential for the proposed arena will not likely be enhanced over time with a significant increase in the market size. In assessing the population base of the proposed arena’s primary and secondary markets, it is also important to understand the local market population in the context of markets with comparable arenas. On the following page, Exhibit III-4 presents a list of new arenas that have opened since 1995 with fixed seating capacities between 5,000 and 10,000 seats. It should be noted that this capacity range was chosen based on the expressed desires of UVM athletics representatives as well as a review of the seating capacities of arenas located in markets comparable in size to the Burlington metropolitan area.
Exhibit III-3Population Growth Rate
Primary and Secondary Markets
* CAGR = Compounded Annual Growth Rate.
Source: Claritas, Inc.
1.2%
0.8%0.8%
0.3%
0.4% 0.4%
0.9%0.9%
1.2%
0.0%
0.2%
0.4%
0.6%
0.8%
1.0%
1.2%
1.4%
1990 to 2000 2000 to 2003 2003 to 2008
Primary Market Secondary Market U.S.
CAGR *
III. Local Market Analysis (cont’d)
12
Exhibit III-4New Arenas Opened Since 1995
Fixed Seating Capacities Between 5,000 and 10,000 Seats
Year Seating CapacityFacility Location Opened Hockey Basketball Concerts
Verizon Wireless Arena Manchester, NH 2001 10,000 10,000 11,000Wachovia Arena at Casey Plaza Wilkes-Barre, PA 1999 8,500 9,700 10,500Sovereign Bank Arena Trenton, NJ 1999 8,100 8,500 10,500
* Cintas Center Cincinnati, OH 2000 n/a 10,200 10,000Arena at Harbor Yard Bridgeport, CT 2001 8,500 9,500 10,000Bakersfield Centennial Sports Arena Bakersfield, CA 1998 8,641 9,333 10,000
* Convocation Center Dekalb, IL 2002 n/a 9,100 10,000DeSoto County Civic Center Southaven, MS 2000 8,300 9,000 10,000Laredo Entertainment Center Laredo, TX 2002 8,065 8,665 9,622
* Ted Constant Convocation Hall Norfolk, VA 2002 n/a 8,600 9,600Holmes Convention Center Boone, NC 2000 7,200 8,321 9,500Ford Park Arena Beaumont, TX 2003 8,200 n/a 9,100Mid-America Center Council Bluffs, IA 2002 6,700 n/a 9,000
* Peter Liacouras Center Philadelphia, PA 1997 n/a 10,150 9,000World Arena Colorado Springs, CO 1995 7,400 8,500 9,000
* Alltel Pavilion (Siegel Center) Richmond, VA 1998 7,500 8,000 9,000Reading Sovereign Center Reading, PA 2001 7,200 8,000 9,000
* Reynolds Center Tulsa, OK 1998 n/a 8,355 8,500Germain Arena Estero, FL 1998 7,181 7,500 8,000
* Regional Special Events Center Murray, KY 1998 8,602 8,602 7,896* Tsongas Arena Lowell, MA 1998 6,500 7,000 7,800* Mitchell Center Mobile, AL 1988 9,000 10,000 7,500
* Whittemore Center Durham, NH 1995 6,100 6,400 7,300* UM Convocation Center Coral Gables, FL 2003 n/a 7,000 7,000
Dodge Arena Hidalgo, TX 2003 5,500 n/a 6,800* Magness Arena Denver, CO 1999 6,100 7,200 6,735* Ryan Center Kingston, RI 2002 n/a 7,700 6,500* Adams Center Missoula, MT 1999 7,500 7,500 6,000* Jenny Craig Pavilion San Diego, CA 2000 n/a 5,100 5,500
Average 1999 7,657 8,382 8,633
Notes: Includes new arenas constructed since 1995 with capacities ranging from 5,000 to 10,000 seats. Sorted by concert capacity. Concert capacity typically includes fixed seats plus a certain amount of portable seating.* University facility.Source: 2004 AudArena Guide, 2004 Revenues from Sports Venues.

III. Local Market Analysis (cont’d)
13
A total of 29 arenas have been identified that have opened since 1995 and have a fixed seating capacity of 5,000 to 10,000 seats. Exhibit III-5 illustrates the ranking of the proposed arena’s primary and secondary market areas relative to other markets with new, comparable arenas.
As illustrated above, the proposed arena’s primary and secondary market population of 477,301 ranks 28th largest out of 30 markets. Markets with comparable arenas ranged in size from a low of 153,000 in Missoula, Montana (Adams Center) to a high of 12.4 million in Bridgeport, Connecticut (Arena at Harbor Yards). The average market size for comparable new arenas is 2.9 million and the median market size is 1.7 million. One key factor that impacts the viability of an arena is the competition in the local marketplace. A new arena in the Burlington area would serve as the only major sports and entertainment arena in the marketplace, assuming Patrick Gymnasium and Gutterson Fieldhouse were not used for competing purposes.
Exhibit III-5New Arenas Opened Since 1995 (1)
Primary and Secondary Market Population (in thousands)
(1) Arenas with fixed seating capacities of 5,000 to 10,000 seats.
153
233
477479
544
737
796
873
968
981
1,007
1,022
1,060
1,354
1,405
1,693
1,739
2,365
2,734
2,792
2,831
3,001
4,227
4,346
4,548
5,758
6,228
7,857
11,323
12,408
0 2,000 4,000 6,000 8,000 10,000 12,000 14,000
Adams Center
Laredo Entertainment Center
Proposed Burlington Arena
Regional Special Events Center
Ford Park Arena
Bakersfield Centennial Sports Arena
Mitchell Center
World Arena
Mid-America Center
Dodge Arena
Germain Arena
Holmes Convention Center
Reynolds Center
Alltel Pavilion (Siegel Center)
DeSoto County Civic Center
Wachovia Arena at Casey Plaza
Ted Constant Convocation Hall
Ryan Center
Whittemore Center
Magness Arena
Cintas Center
Jenny Craig Pavilion
Verizon Wireless Arena
UM Convocation Center
Convocation Center
Tsongas Arena
Reading Sovereign Center
Peter Liacouras Center
Sovereign Bank Arena
Arena at Harbor Yard
Burlington Population: 477,301Burlington Market Rank: 28 out of 30Average Market Size: 2.9 millionMedian Market Size: 1.7 million
Population (in thousands)

III. Local Market Analysis (cont’d)
14
Exhibit III-6 depicts the population ranking of the proposed arena compared to other comparable arenas based on the population available per competing arena in the marketplace.
Based on a comparison of population per arena in the marketplace, the proposed arena’s market ranks 16th out of 30 markets with 447,301 residents per arena. The population per arena for comparable arenas ranges from a low of 117,000 in Laredo, Texas to a high of 4.3 million in Bridgeport, Connecticut. The average population per arena is 818,835 and the median population per arenas is 510,870. A potentially critical success factor for the proposed arena would be the lack of competition from a comparable arena in the greater Burlington marketplace.
Exhibit III-6New Arenas Opened Since 1995 (1)
Primary and Secondary Market Population Per Arena in Marketplace (in thousands)
(1) Arenas with fixed seating capacities of 5,000 to 10,000 seats.
117
153
181
239
271
281
291
323
327
336
353
398404
435
477
511
558
737
823869
910
1,000
1,183
1,246
1,309
1,367
1,409
1,693
1,887
4,136
0 500 1,000 1,500 2,000 2,500 3,000 3,500 4,000 4,500
Laredo Entertainment Center
Adams Center
Ford Park Arena
Regional Special Events Center
Alltel Pavilion (Siegel Center)
DeSoto County Civic Center
World Arena
Mid-America Center
Dodge Arena
Germain Arena
Reynolds Center
Mitchell Center
Cintas Center
Ted Constant Convocation Hall
Proposed Burlington Arena
Holmes Convention Center
Magness Arena
Bakersfield Centennial Sports Arena
Tsongas Arena
UM Convocation Center
Convocation Center
Jenny Craig Pavilion
Ryan Center
Reading Sovereign Center
Peter Liacouras Center
Whittemore Center
Verizon Wireless Arena
Wachovia Arena at Casey Plaza
Sovereign Bank Arena
Arena at Harbor Yard
Burlington Population: Burlington Market Rank: Average Market Size: Median Market Size:
Population per Arena (in thousands)
477,30116 out of 30
818,835510,870

III. Local Market Analysis (cont’d)
15
Age Another demographic characteristic that is important to the overall viability of the proposed arena is the age of the local population. Generally, sports and entertainment events attract patrons of various ages with the core group of patrons clustered within the 15 to 54 age group. Exhibit III-7 presents age statistics for the proposed arena market area.
As depicted in the exhibit, the median age of the primary market area of the proposed arena is 35.9 years. The median age of the combined primary and secondary markets of the proposed arena is 37.1 years. In comparison, the median age of residents in the United States is 36.1 years. The primary market area of the proposed arena can be characterized as slightly younger, with a slightly lower proportion of residents within the prime ages for attending sporting and entertainment events. Exhibit III-8 on the following page illustrates the median age of the primary market for comparable arenas.
Exhibit III-7Median Age
35.9
37.1
36.1
30.0
31.0
32.0
33.0
34.0
35.0
36.0
37.0
38.0
Primary Market Primary & SecondaryMarkets
U.S.
Median Age

III. Local Market Analysis (cont’d)
16
The primary market area of the proposed arena ranks 16th youngest out of 30 markets. The median age for comparable arena markets ranges from a low of 26.9 years in Laredo, Texas (Laredo Entertainment Center) to a high of 44.9 years in Estero, Florida (Germain Arena). The average median age is 35.3 years and the median age is 35.9 years.
Exhibit III-8New Arenas Opened Since 1995 (1)
Median Age of Primary Market
(1) Arenas with fixed seating capacities of 5,000 to 10,000 seats.
44.9
41.1
38.1
38.0
37.6
37.4
37.3
36.9
36.9
36.8
36.5
36.4
36.4
35.9
35.9
35.9
35.7
34.6
34.6
34.5
34.4
34.2
34.0
33.8
33.8
33.6
30.7
29.6
27.5
26.9
15 17 19 21 23 25 27 29 31 33 35 37 39 41 43 45
Germain Arena
Wachovia Arena at Casey Plaza
Reading Sovereign Center
Arena at Harbor Yard
Ryan Center
Peter Liacouras Center
Tsongas Arena
UM Convocation Center
Verizon Wireless Arena
Sovereign Bank Arena
Ford Park Arena
Mitchell Center
Alltel Pavilion (Siegel Center)
Cintas Center
Proposed Burlington Arena
Reynolds Center
Regional Special Events Center
Magness Arena
Adams Center
Convocation Center
Mid-America Center
Ted Constant Convocation Hall
DeSoto County Civic Center
World Arena
Jenny Craig Pavilion
Whittemore Center
Bakersfield Centennial Sports Arena
Holmes Convention Center
Dodge Arena
Laredo Entertainment Center
Burlington Median Age: Burlington Market Rank: Average Market: Median Market:
Median Age
35.916 out of 30
35.335.9

III. Local Market Analysis (cont’d)
17
Income An important socioeconomic variable that can be indicative of the potential success of the proposed arena is household income. Household income can be used as a measure for the ability to purchase tickets, concessions, novelties, parking and other such items. Exhibit III-9 presents the median household incomes for the primary area and the combined primary and secondary area of the proposed arena as compared to the United States.
As shown in the exhibit, the median household income in the primary market is $50,551. The median household income in the combined primary and secondary market is $45,897, indicating that household incomes in the secondary market are generally lower than those in the primary market. In comparison, the median U.S. household income is $47,065. It should be noted that any comparison of household incomes among different geographic regions should consider the cost of living characteristics of an area. Burlington’s cost of living index is 104.9 compared to a national average of 100. Exhibit III-10 on the following page presents a comparison of the median household income of comparable arenas opened since 1995.
Exhibit III-9Median Household Income
$50,551
$45,897$47,065
$30,000
$35,000
$40,000
$45,000
$50,000
$55,000
Primary Market Primary & SecondaryMarkets
U.S.
MedianHH Income

III. Local Market Analysis (cont’d)
18
The median household income of the primary market area of the proposed arena ranks 12th highest out of 30 markets. The median household income for markets with arenas markets ranges from a low of $27,483 in Hidalgo, Texas (Dodge Arena) to a high of $72,600 in Bridgeport, Connecticut (Arena at Harbor Yards). The average median household income is $46,897 and the median household income is $46,626. Corporate Base
Local corporations could play a significant role in the overall success of the proposed arena by hosting meetings, conferences and trade shows at the facility and through the purchase of tickets, advertising and sponsorships. Exhibit III-11 on the following page presents the number of corporate headquarters and branches with at least 25 employees within the proposed arena’s primary market.
Exhibit III-10New Arenas Opened Since 1995 (1)
Median Household Income of Primary Market
(1) Arenas with fixed seating capacities of 5,000 to 10,000 seats.
$27,483$31,274
$32,592$36,472
$37,183
$37,772
$37,932
$38,230$38,290
$38,615
$42,051
$43,464
$45,029
$45,653
$46,626
$48,303
$48,888$49,578
$50,551
$51,268$52,497
$52,579
$53,000
$54,289
$57,219
$58,490
$59,175$59,557
$63,896
$72,600
$0 $10,000 $20,000 $30,000 $40,000 $50,000 $60,000 $70,000 $80,000
Dodge Arena
Laredo Entertainment Center
Regional Special Events Center
Holmes Convention Center
Wachovia Arena at Casey Plaza
Adams Center
Ford Park Arena
Bakersfield Centennial Sports Arena
UM Convocation Center
Mitchell Center
Reynolds Center
DeSoto County Civic Center
Ryan Center
Germain Arena
Ted Constant Convocation Hall
Reading Sovereign Center
Cintas Center
Mid-America Center
Proposed Burlington Arena
Alltel Pavilion (Siegel Center)
Peter Liacouras Center
World Arena
Jenny Craig Pavilion
Whittemore Center
Convocation Center
Magness Arena
Tsongas Arena
Verizon Wireless Arena
Sovereign Bank Arena
Arena at Harbor Yard
Burlington Median HH Inc: Burlington Market Rank: Average Market: Median Market:
Median Household Income
$50,55112 out of 30
$46,897$46,626

III. Local Market Analysis (cont’d)
19
As depicted in the exhibit, the primary market of the proposed arena has 447 corporate headquarters of which approximately 55 percent have annual sales of $5.0 million or more. Additionally, the primary market area has 146 corporate branch locations with 25 or more employees. Exhibit III-12 summarizes the major employers in the primary market area. The largest employer in the area is IBM, which employs 6,200 people in the local area. Other large employers in the area include Fletcher Allen Healthcare, the University of Vermont and Chittenden Corporation, all with over 1,000 employees. Overall, the local market area has a relatively small corporate base which could negatively impact the ability to sell premium seating and sponsorships at the proposed arena, support multiple tenants, as well as demand for meetings, conferences and other events.
Exhibit III-11Corporate Base
Primary Market Area
BurlingtonMSA
Companies PercentageHeadquarters: (Sales)
Unknown 5 0.8%Under $1,000,000 52 8.8%$1,000,000 to $4,999,999 206 34.7%$5,000,000 to $9,999,999 74 12.5%$10,000,000 to $24,999,999 58 9.8%$25,000,000 to $49,999,999 27 4.6%$50,000,000 to $99,999,999 13 2.2%Over $100,000,000 12 2.0%Total Headquarters 447 75.4%
Branches (1) 146 24.6%Total 593 100.0%
(1) Branches with at least 25 employees, excluding retail stores.Source: Dun & Bradstreet.
Exhibit III-12
Number ofCompany Name Employees
IBM 6,200Fletcher Allen Health Care 4,674University of Vermont 3,461Chittenden Corporation 1,208Verizon 950Banknorth Group, Inc. 765IDX Corporation 752Ben & Jerry's Homemade, Inc. 735Visiting Nurses Association 730General Dynamic Armament Systems 500
Source: Book of Lists, 2002-2003
Major EmployersPrimary Market Area

III. Local Market Analysis (cont’d)
20
Exhibit III-13 summarizes the corporate base of the Burlington metropolitan area in the context of other market areas supporting new arenas with fixed seating capacities between 5,000 and 10,000 seats.
The corporate base of the primary market area of the proposed arena ranks 26th out of 30 markets. The corporate base for markets with comparable arenas ranges from a low of 40 in Murray, Kentucky (Regional Special Events Center) to a high of 15,150 in Dekalb, Illinois (Convocation Center). The average corporate base consists of 2,381 companies and the median corporate base consists of 984 companies. Exhibit III-14 on the following pages compares the number of corporations available per arena in the marketplace for comparable arenas.
Exhibit III-13New Arenas Opened Since 1995 (1)
Corporate Base of Primary Market
(1) Arenas with fixed seating capacities of 5,000 to 10,000 seats.Note: Corporate invenstory is based on headquarters with $5.0 million or more in sales and corporate branch locations with 25 or more employees.
4084
170241
330
446
537
607655
667
723
751
756
841
890
984
1,4781,504
1,711
2,0102,210
2,442
2,512
3,418
3,525
4,419
4,6057,208
8,460
15,150
0 2,000 4,000 6,000 8,000 10,000 12,000 14,000 16,000
Regional Special Events Center
Holmes Convention Center
Adams Center
Laredo Entertainment Center
Proposed Burlington Arena
Verizon Wireless Arena
Dodge Arena
Reading Sovereign Center
Ford Park Arena
Arena at Harbor Yard
Sovereign Bank Arena
Germain Arena
Bakersfield Centennial Sports Arena
World Arena
Mitchell Center
Wachovia Arena at Casey Plaza
Reynolds Center
Mid-America Center
Ryan Center
Alltel Pavilion (Siegel Center)
DeSoto County Civic Center
Ted Constant Convocation Hall
Whittemore Center
Cintas Center
UM Convocation Center
Magness Arena
Jenny Craig Pavilion
Tsongas Arena
Peter Liacouras Center
Convocation Center
Burlington Corp Base: Burlington Market Rank: Average Market: Median Market:
Corporate Headquarters and Branches
33026 out of 30
2,381984

III. Local Market Analysis (cont’d)
21
The number of companies per competing arena in the primary market area of the proposed arena ranks 19th out of 30 markets. The number of companies per arena for markets with comparable arenas ranges from a low of 20 in Murray, Kentucky (Regional Special Events Center) to a high of 3,030 in Dekalb, Illinois (Convocation Center). The average number of corporations per competing arena consists of 628 companies and the median number of companies per competing arena consists of 488 companies.
Exhibit III-14New Arenas Opened Since 1995 (1)
Corporations per Arena in Primary Market
(1) Arenas with fixed seating capacities of 5,000 to 10,000 seats.Note: Corporate invenstory is based on headquarters with $5.0 million or more in sales and corporate branch locations with 25 or more employees.
2042
121121
149
170
179
218
222
250
280
330
402
442
445
488
493501
607
611705
756
856
884
984
1,030
1,256
1,410
1,535
3,030
0 500 1,000 1,500 2,000 2,500 3,000 3,500
Regional Special Events Center
Holmes Convention Center
Laredo Entertainment Center
Sovereign Bank Arena
Verizon Wireless Arena
Adams Center
Dodge Arena
Ford Park Arena
Arena at Harbor Yard
Germain Arena
World Arena
Proposed Burlington Arena
Alltel Pavilion (Siegel Center)
DeSoto County Civic Center
Mitchell Center
Cintas Center
Reynolds Center
Mid-America Center
Reading Sovereign Center
Ted Constant Convocation Hall
UM Convocation Center
Bakersfield Centennial Sports Arena
Ryan Center
Magness Arena
Wachovia Arena at Casey Plaza
Tsongas Arena
Whittemore Center
Peter Liacouras Center
Jenny Craig Pavilion
Convocation Center
Burlington Corp Base: Burlington Market Rank: Average Market: Median Market:
Corporate Headquarters and Branches per Competing Arena in Market
33019 out of 30
628488

III. Local Market Analysis (cont’d)
22
Transportation Access Transportation access is vital to the success of any public assembly facility. Ease of access is not only important from the perspective of attracting patrons, but also factors into the venue selection process of national and regional touring acts which choose venues based on how the market fits in the context of the overall routing of an act, among other reasons. Additionally, meeting planners of various flat floor events (conventions, tradeshows, consumer shows, etc.) consider ease of access a critical factor when selecting a market/venue to host their events. Various forms of transportation access that are important to the viability of a multi-purpose arena include highway, air, rail, and local transportation access.
Highway Access Exhibit III-15 illustrates the regional roadway access to the Burlington area. Serving as the state’s largest metropolitan area, Burlington has good highway access via Interstate 89. Interstate 89 is a toll-free highway that spans from the southeast to the northwest of Vermont. It connects with Interstates 91 and 93 to complete a multi-state network to New Hampshire, Massachusetts, Connecticut and New York. U.S. Route 2 bisects Vermont westward to New York and eastward to New Hampshire and Maine.
Exhibit III-15Regional Roadway Access

III. Local Market Analysis (cont’d)
23
Exhibit III-16 presents a summary of major cities in regional proximity including their distance and estimated drive time to Burlington.
Most promoters representing national and regional touring acts that were contacted as part of this study indicated that the Burlington metropolitan area was an attractive market given the lack of competition from a similar facility in the marketplace and its location relative to other regional markets with multi-purpose arenas such as Montreal, QC; Manchester, NH; and Albany, NY; among others. These promoters indicated that Burlington’s location among these regional markets make it an attractive destination when determining the routing patterns of their acts as it serves as a convenient stop between these markets. Air Access Air access is a critical factor in attracting events with attendees originating from a regional or national basis, such as conventions, trade shows or conferences. Handling over 550,000 passengers annually, Burlington International Airport is one of the most traveled airports in New England and is Vermont’s only international airport. The airport provides direct service and international connections to and from major cities by United, USAirways, Continental, Delta, Independence, jetBlue and Northwest. Cities with direct service to Burlington International Airport including Boston, Chicago, Cincinnati, Cleveland, Detroit, Philadelphia, Pittsburgh, Newark, New York and Washington D.C. Beyond the regional area, air access to Burlington can require one or more additional
Exhibit III-16Distance from Major Regional Metropolitan Areas
Miles from Drive Time MarketMetropolitan Area Burlington in Hours Population
Montreal, QC 92 1.5 3,908,000Albany, NY 147 2.5 881,500Manchester, NH 165 2.8 396,000Springfield, MA 209 3.5 611,400Boston, MA 215 3.6 4,059,600Worcester, MA 235 3.9 770,900Hartford, CT 235 3.9 1,173,300Providence, RI 271 4.5 989,700
III. Local Market Analysis (cont’d)
24
connecting flights, which can negatively impact the marketability of the area to attract events with patrons originating beyond the regional area. Rail Access Several arena events, such as circuses, utilize railroads to transport animals and equipment from market to market. The Vermont Railway and the New England Central Railroad provide rail freight transport to Canada, New England states and Albany-area markets, in addition to other North American regions. Local Transportation Infrastructure Facility ingress and egress via vehicular traffic and public transportation is critical to the viability of a multi-purpose arena. A facility that is located in an area that is easily accessible to local residents will enhance the overall patron experience and encourage repeat attendance. While a specific arena site has not yet been determined, it will be important to locate the proposed facility in an area that is capable of handling ingress and egress of upwards of 2,500 to 3,000 cars for heavily attended events within a 15 to 20-minute time period. This vehicular volume would be in addition to any normal vehicular traffic in the area, typically during evening hours.
Hotel Inventory and Issues The inventory and quality of hotel rooms and supporting meeting space is critical in determining the marketability of a community to accommodate conventions, trade shows, conferences and other events drawing out-of-town attendees. Approximately 3,600 rooms serve the Burlington metropolitan area, consisting of variety of full-service, limited service and extended stay accommodations. The following exhibit summarizes the hotel characteristics of the primary hotels accommodating the largest conventions and conferences in the Burlington area.

III. Local Market Analysis (cont’d)
25
As shown in the exhibit, the largest single conference space provided by local hotels is approximately 30,000 square feet and the biggest group that can be accommodated is 1,000 people, both provided by the Sheraton Burlington Hotel & Conference Center. With the largest hotel providing 309 rooms, any large-scale convention, trade show or conference that attracts out-of-town visitors must use multiple properties of varying quality to accommodate visitors, placing the Burlington metropolitan area at a competitive disadvantage to other communities providing more higher quality and/or more proximate hotel rooms. In addition to limited hotel and exhibit/meeting space, hotel occupancies are stronger from late Spring through early Fall due to high leisure travel activity and seasonality associated with convention, tradeshows and conferences, often exceeding 90 percent in peak months. As a result, room rates are generally higher during this period and are difficult to secure, which can have negative implications in attracting conventions, trade shows and consumer shows. Attractions The Burlington metropolitan and surrounding regional area offers numerous historical, cultural, recreational and entertainment attractions and activities throughout the year. These attractions and activities make Burlington area a unique, quaint destination that appeals to leisure and business travelers alike throughout the year.
Exhibit III-17Primary Convention / Conference Hotels
Meeting Rooms TotalMaximum Conference
Property Rooms Number People Capacty Square Footage
Sheraton Burlington Hotel & Conference Center 309 16 1,000 30,000Wyndham Burlington Hotel 256 15 900 16,000Clarion Hotel & Suites 163 8 500 6,000Holiday Inn 174 5 500 4,200

III. Local Market Analysis (cont’d)
26
Specific area attractions and activities include, but are not limited to: • Arts Alive; • Bed and breakfasts – various; • Ben & Jerry’s Ice Cream Factory; • Ben & Jerry’s Outdoor Movie Festival; • Birds of Vermont Museum; • Burlington Latino Festival; • Champlain Valley Fair; • Champlain Valley Folk Festival; • Church Street Marketplace; • Discover Jazz Festival; • ECHO at the Leahy Center; • Leaf / Foliage Tours; • Ethan Allen Homestead; • Flynn Theater; • Hermann’s Royal Lipizzan Stallions; • Intervale Farm & Garden Festival; • Lane Performing Artist Series; • Lake Champlain Basin Science Center; • Lake Champlain Int’l Fishing Derby; • Lake Champlain Maritime Museum; • Main Street Landing;
• Numerous Outdoor Activities; • Rokeby Museum; • St. Michaels College; • St. Michaels Playhouse; • Shelburne Farms; • Shelburne Museum; • Stowe Ski Resort; • University of Vermont; • UVM’s Perkins Geology Museum; • UVM’s Fleming Museum; • UVM’s Francis Colburn Gallery • Vermont International Film Festival; • Vermont Brewers Festival; • Vermont City Marathon & Relay; • Vermont Expos; • Vermont Foodfest; • Vermont Maple Festival; • Vermont Mozart Festival; • Vermont Symphony Orchestra; • Vermont Stage Company; and, • Vermont Teddy Bear Company.
Climate A key consideration in meeting planners’ decisions to book a facility is the climate of the local area, particularly during times of extreme cold or heat. This is of particular importance for events such as meetings, conferences and conventions, which draw delegates from other geographic regions. Like all of New England, Vermont experiences four seasons and extended periods of unusually high or low temperatures are uncommon. Lake Champlain, the western boundary of Vermont, and its lake effect tend to moderate temperatures during colder months and extend summer weather into the Fall. Exhibit III-18 on the following page summarizes the mean daily minimum and maximum temperatures and precipitation by month for the Burlington area.

III. Local Market Analysis (cont’d)
27
Harsh winter conditions characteristic of the Burlington area from November through March generally limit the marketability of the community in attracting regional or national conventions, trade shows or meetings. This is underscored by the fact that hotel occupancies in the local market typically drop to below 60 percent during winter months. As is common with many northern climate cities that experience harsh winter seasons, the residents of Vermont generally prefer outdoor activities during the summer months, indicating that the proposed multi-purpose indoor arena could compete with non-traditional means of leisure and entertainment such as fishing, hunting, weekend/summer cabin retreats and other activities not as common to other regions of the county. Further, during winter months, attendance by local and regional residents could be impacted to some degree by occasional hazardous driving conditions.
Exhibit III-18Climatological Information
Burlington Metro Area
Mean Temperature (Fahrenheit) Mean MeanDaily Daily Precipitation Precipitation
Month Minimum Maximum (Inches) (Days)
January 7.5 25.2 1.8 8.2February 9.0 27.5 1.6 6.7March 21.9 39.4 2.2 9.1April 34.2 53.6 2.8 9.8May 45.3 67.3 3.1 10.9June 54.7 75.7 3.5 10.6July 59.7 81.1 3.6 9.2August 57.9 77.9 4.1 10.6September 48.7 69.1 3.3 8.7October 38.7 57.0 2.9 8.9November 29.7 44.1 3.1 10.9December 15.4 30.4 2.4 10.0
Note: Precipitation includes both rain and snow. Mean number of precipitation days equal to mean number of days with at least 0.04 inches of precipitation.Source: World Meteorological Organization.
III. Local Market Analysis (cont’d)
28
Summary
As previously mentioned, the demographic and socioeconomic characteristics of a market are an important component in assessing the potential success of the proposed arena. The strength of a market in terms of its ability to attract events and spectators and generate revenues is predicated, somewhat, on the size of the regional market area population and its spending characteristics in the context of competition within the market. The following are key conclusions of the proposed arena’s market:
• The Burlington metropolitan area has approximately 203,629 people and is the 209th largest among 323 metropolitan areas in the United States.
• A total of 477,301 residents live within 50 miles of the proposed arena, an area comprising the proposed arena’s primary and secondary market area and the area from which virtually all arena attendees will be drawn.
• While located in a relatively small market, the proposed arena will face limited competition from existing sports and entertainment facilities, teams and events in the marketplace.
• The Burlington metropolitan area’s location relative to other regional markets with major sports and entertainment arenas is considered attractive by arena event promoters when developing a routing schedule for their acts.
• However, Burlington’s relatively remote location and lack of direct flights to regional destinations and beyond limits the ability of the market to serve as a major national or regional convention, tradeshow or conference market.
• Further, the marketability of the community for major or regional convention, tradeshow or conferences is somewhat limited based on the availability of convention-quality hotel rooms during peak periods from late Spring through early Fall.
• The median age and age distribution of the local market is younger than the national average and has a large portion of residents within the prime ages for sports and entertainment event attendance. This bodes well for sports and entertainment event attendance.
• The household income in the primary market of the proposed arena ranks above the national average, but the household incomes of the combined primary and secondary markets fall below the national average. This indicates that the primary market may have a higher propensity to allocate discretionary dollars to entertainment activities associated with a new arena.

III. Local Market Analysis (cont’d)
29
• The corporate base within the primary and secondary markets is relatively small, which may likely limit the ability of the proposed arena to market premium seating, tickets and advertising/sponsorship opportunities to the corporate market.
• The seasonal climate of Vermont will likely limit the marketability of the facility during winter months for conventions, tradeshows, conferences and other similar events that draw attendees from outside the local area.
The demographic and socioeconomic characteristics of the proposed arena’s market are considered together with an assessment of the competitive facilities in the marketplace, the historical operations of comparable facilities, and interviews with potential facility users to estimate demand.

CONFIDENTIAL DRAFTFor Discussion Purposes Only
For Internal Use
Executive Summary
I. Introduction
II. Review of Ernst & Young Study
III. Local Market Analysis
IV. Competitive Facilities
V. Comparable Facilities
VI. Market Surveys
VII. Estimated Event Demand
VIII. Building Program and Cost
IX. Estimated Financial Operations
X. Estimated Economic and Fiscal Impacts
XI. Management Options
XII. Funding Options
IV. Competitive Facilities

IV. Competitive Facilities
30
The number and type of local facilities that would possibly compete for the limited supply of events, spectators, attendees and sponsorship dollars within the marketplace will impact the market potential for the proposed multi-purpose arena. The purpose of this section is to assess facilities in the local and regional area that could provide some level of competition to the proposed facility. Exhibit IV-1 presents a summary of potentially competitive venues.
The remainder of this section provides an overview of each potentially competitive facility including a physical description of the facility, an overview of historical operations and conclusions regarding the degree of competition among facilities. Local Competition Within the Burlington metropolitan area, there are a variety of existing and planned facilities that may compete to some degree with the multi-purpose arena. Most of the existing facilities in the local marketplace were built many years ago and serve specific purposes or market segments. In general, it is not expected that a new arena would represent significant competition to existing and planned facilities in the marketplace from the perspective of booking events because each generally caters to unique market segments. However, a new multi-purpose arena would most likely compete with existing and planned local venues to attract the discretionary spending of local residents and the corporate sponsorship dollars of local companies.
Exhibit IV-1Local and Regional Competitive Facilities
Driving Year SeatingFacility Location Distance (mi.) Facility Type Opened Capacity
Local Competition
Champlain Valley Exposition Essex Junction, VT 7 Exposition, Granstand, etc. 1922 10,088Flynn Center for the Performing Arts South Burlington, VT 1 Theater 1930 1,453Memorial Auditorium South Burlington, VT 1 Theater 1927 2,500Gutterson Fieldhouse South Burlington, VT 1 Arena 1963 4,035Patrick Gymnasium South Burlington, VT 1 Gym 1963 3,228The Green at Shelburne Museum Shelburne, VT 8 Concert n/a 3,000Centennial Field South Burlington, VT 1 Ballpark 1906 4,400St. Michael's College Arena - proposed Colchester, VT 5 Arena n/a 2,200Performing Arts Center - proposed Stowe, VT 36 Theater n/a 3,000
Regional Competition
Olympic Center Lake Placid, NY 61 Arena 1921 8,000Glens Falls Civic Center Glens Falls,NY 84 Arena 1979 7,806Bell Centre Montreal, Quebec 95 Arena 1996 21,500Saratoga Performing Arts Center Saratoga Springs, NY 120 Amphitheater 1965 25,300Pepsi Arena Albany, NY 129 Arena 1990 17,500Verizon Wireless Arena Manchester, NH 137 Arena 2001 11,000

IV. Competitive Facilities (cont’d)
31
Champlain Valley Exposition Essex Junction, Vermont The Champlain Valley Exposition (“CVE”) is located in Essex Junction, Vermont. The mission of the Exposition is to promote agriculture, education, commerce and entertainment activities. In 2003 and according to Expo representatives, over 600,000 people attended special events at CVE with an overall economic impact of more than $450 million. CVE drew 297,680 in attendance over the 10-day Champlain Valley Fair, which was held August through September. Per CVE management, in 1989, 10 non-fair events occurred at the Expo, producing eight percent of its revenues and in 2004, the site will host approximately 100 non-fair special events, which will account for 25 percent of its revenues. While CVE has generally been successful, its market potential is limited somewhat by the lack of nearby overnight accommodations, restaurants and retail establishments. The Expo includes several exhibit and public assembly facilities covering nearly 130 acres. The various facilities host a variety of large public assembly events, consumer and trade shows, and banquets and conventions, among other events. Exhibit IV-2 summarizes the major facilities at CVE. Year Square Seating
Opened Feet Dimensions Capacity
New Building 2005 26,000 NA NARobert E. Miller Expo Centre 1999 33,000 130 x 260 NABlue Ribbon Pavilion NA 11,440 80 x 143 2,000Ware Building 1971 5,280 60 x 88 750State Building (1) 1950 12,000 100 x 120 1,500Grandstand 1966 7,200 39 x 200 10,088Barns, Livestock and Education Buildings NA NA NA NAMall Areas (2) NA NA NA NA
Total 94,920 14,338
(1) Insulated building(2) Adsit Mall, AG Mall, Northwest Mall consist of nearly 5-acres of presentation space.NA = Not AvailableSource: CSL research and facility management.
Champlain Valley Exposition FacilitiesExhibit IV-2

IV. Competitive Facilities (cont’d)
32
As depicted in the previous exhibit, the Champlain Valley Expo offers a variety of facilities that accommodate a wide spectrum of events including conventions, consumer shows, trade shows, concerts, motor sports, rodeos, indoor soccer and other such usage. The Champlain Valley Expo offers a variety of facilities that can accommodate events requiring seating. Most notably is the Coca-Cola Grandstand, which opened in 1966 and has 10,088 total seats in a covered, outdoor environment and hosts several concerts, family shows and other spectator events during the summer months. In addition to free shows and entertainment hosted at the 2004 Champlain Valley Fair, the Grandstand featured six concert performances with ticket prices (including gate admission, facility fee and surcharge) ranging from a high of $54.75 for Toby Keith, a top national artist, to a low of $22.25 for Strangefolk/Samples, a local favorite Vermont band. The average ticket price is approximately $40 for the overall summer concert series. Motor sports are also a big attraction during the Fair featuring an Extreme Motorcycle Show, Championship Figure-8 racing, Demolition Derby and a Grand National Tractor and Truck Pull event. The average ticket price, excluding gate admission to the fair, is $12 over the four events. In June 2004, CVE announced plans to replace the existing Grandstand with a new $9 million Pavilion for Music and Special Events that will have a total seating capacity of 10,000, including 7,700 covered seats. The new facility is expected to increase the number of concerts and other special events hosted at CVE. In addition to the spectator seating, the Champlain Valley Exposition offers a total of 94,920 square feet of flat floor space in five buildings. The Expo includes the Robert E. Miller Expo Centre, which offers 33,000 square feet of open floor space and a combined total of 44,440 square feet when including the connection to the Blue Ribbon Pavilion, which offers 11,440 square feet. Both facilities are air-conditioned and offer open floor space, modern bathroom facilities and one food court area. The grounds also offer a variety of livestock buildings that are typically used during the annual exposition by competitive exhibitors. In January 2005, a $2.5 million, 40,000 square foot building will open. The facility will target indoor soccer, special events, trade shows and conventions. The new building will include a 26,000 square foot open space area for soccer and special events. The Nordic Spirit Soccer Club will lease the facility from October to April each year, leaving open dates for the Exposition of April to November, including four weeks during the soccer play period, in which to book outside special events. The Exposition is projected to target large events and conventions that are now bypassing the state. In addition to the recent expansion announcement, it should be noted that the long-range master plan for CVE includes a 9,000-seat multi-purpose arena that could host minor league hockey. Overall, CVE and a new arena would likely compete to host certain consumer or flat floor shows, but are not expected to compete directly for spectator type events on a

IV. Competitive Facilities (cont’d)
33
regular basis. However, the future plans of CVE with respect to building a new arena envisioned in its long-range master plan could represent future, and potentially, significant competition to a new multi-purpose arena operating on the UVM campus. Given local market demographics, it is unlikely that the market could successfully support two new commercially operated arenas on a long-term basis. As such, the Vermont Arena Commission should work with CVE representatives to determine the most appropriate pubic assembly facility development options that would be most beneficial to the local area. Flynn Center for the Performing Arts South Burlington, Vermont Opened in 1930, the Flynn Theater operated as a vaudeville house and movie theater for more than 50 years. With the decline in the movie business in the 1970’s, the Flynn Theater was restored and converted to a performing arts venue. Today, the 55,824 square foot Flynn Center for the Performing Arts, which underwent a significant renovation in 2000, offers two performance venues including the 1,453-seat original theatre, or MainStage, and the FlynnSpace, an intimate 200-seat performance space located downstairs at the Flynn Center. Located in downtown Burlington, the Flynn Center for the Performing Arts serves as the state’s largest and most popular performing arts venue. Exhibit IV-3 summarizes the annual operations of the Flynn Center for the Performing Arts.

IV. Competitive Facilities (cont’d)
34
As depicted above, the Flynn Center hosted 132 events and drew 203,115 attendees in 2003. Flynn Center events included a broad spectrum of activity including Broadway, theater, dance, music and family performances in addition to the Burlington Discover Jazz Festival. Additionally, the Flynn Center offers a variety of educational programs, workshops and courses. While the Flynn Theater presents many of its own performances, it also provides a home to many community arts organizations and regional promoters including the UVM Lane Series, Vermont Symphony Orchestra, Vermont Youth Orchestra, Lyric Theatre Company, Vermont State Company, Albany-Berkshire Ballet and All-Points Booking, among others. Stated rentals rates for the Flynn Center are $2,420 (weekdays) and $2,840 (weekends).
Exhibit IV-3Summary of Operations - Flynn Center
Events:FlynnSpace 48Education Programs 43Flynn MainStage 41Total Events 132
Attendance:Outside Rentals 70,000Public Performances 51,090Education Performances 47,825Special Event 30,000FlynnArts 4,200Total Attendees 203,115
FY'04 Budget:Operating Revenues $2,966,000Contributed Support (2) 1,441,800
Total Revenues 4,407,800Operating Expenses 4,421,000
Net Income ($13,200)
(1) Includes ticket sales, education program fees, rentals and FlynnTix.(2) Annual support from individuals, foundations, corporations, and government.Source: Flynn Center management.

IV. Competitive Facilities (cont’d)
35
Total operating expenses for the Flynn Center are budgeted to be $4.4 million for fiscal year 2004, slightly exceeding total revenues. It is important to note that approximately a third of Flynn Center’s revenues are derived from contributed support from individuals and corporations. Operating revenues account for nearly three-quarters of Flynn Center revenues and consist of ticket sales, educational program fees, rental and associated services and FlynnTix. FlynnTix is an in-house ticketing service provided by the Flynn Center for various local facilities including the Flynn Center, Champlain Valley Exposition, Memorial Auditorium, Lyric Theatre, and the Vermont Symphony Orchestra, among others. Most modern arenas have curtaining systems that allow the facility to offer half-house and other more intimate seating configurations to enable them to host performing arts events. While a new arena could host several performing arts events each year, it is not expected to compete directly with the Flynn Center on a consistent basis for events. However, based on discussions with Flynn Center management, there is a concern that a new multi-purpose arena will compete with the Flynn Center in attracting corporate sponsorships, which is a vital revenue source needed to sustain Flynn Center operations. Management also expressed concern over the potential impact that increased traffic associated with a new arena may have on Flynn Center events and downtown merchants on arena event days. Further, management expressed concerns over a potentially competing ticketing system at a new arena that could undermine a key revenue source for the Flynn. Memorial Auditorium Burlington, Vermont Located in downtown Burlington, Memorial Auditorium is one of the oldest performance venues in the area. Owned by the City of Burlington, Memorial Auditorium has a total seating capacity of 2,500, of which 825 are permanent seats. The facility floor offers approximately 12,000 square feet of space. Stated daily rental rates for the facility are $2,350 plus expenses. Memorial Auditorium hosts recreation activities, concerts, consumer shows, and other miscellaneous events.

IV. Competitive Facilities (cont’d)
36
Overall, Memorial Auditorium is dated and does not offer adequate parking, sound quality or concession opportunities and is oftentimes overlooked by promoters to host concerts or major events. Because of these limitations, Memorial Coliseum is under utilized and generally has a negative stigma by local residents. Given the physical limitations and the negative perception of the facility by local residents, Memorial Auditorium is not expected to represent direct competition to the arena for hosting events. It is likely that a portion of concert activity that occurs at Memorial Auditorium could shift to the new arena given that it will likely have more modern amenities and more flexible seating configurations. Gutterson Fieldhouse South Burlington, Vermont Opened in 1963, Gutterson Fieldhouse is located on the campus of the University of Vermont and has a seating capacity of 4,035 seats. Gutterson Fieldhouse, affectionately known as “The Gutt”, is the home venue for the men and women’s hockey programs. The venue also hosts the Vermont Principal Association’s (VPA) Division I and II boy’s hockey semi-final and finals each year and occasional ice shows. Since 1995, the facility also has also served as the pre-season training camp home for the New York Rangers. Exhibit IV-4 summarizes the annual events and attendance hosted at Gutterson Fieldhouse in a recent year.
Exhibit IV-4Gutterson Fieldhouse
Annual Events and Attendance
Average TotalTurnstile Turnstile
Events Attendance Attendance
UVM Men's Hockey 17 3,868 65,756UVM Women's Hockey 17 220 3,740High School Hockey 4 1,599 6,396Ice Show 2 1,540 3,080
Total 40 1,974 78,972
Note: Excludes New York Rangers' training camp.Source: UVM

IV. Competitive Facilities (cont’d)
37
As depicted in the exhibit, Gutterson Fieldhouse typically hosts approximately 40 event each year, drawing nearly 80,000 attendees. In addition to these events, Gutterson Fieldhouse serves as the practice facility for both the men’s and women’s hockey programs. With the development a new multi-purpose arena on the UVM campus, it is expected that all events hosted in Gutterson Fieldhouse, with the exception of women’s hockey, would be transferred to the new arena. While the long-term plans for Gutterson Fieldhouse are not definitive, it is likely that the facility would be used for hockey practices and women’s hockey games in the short-term. Long-term, Gutterson Fieldhouse may be converted to other UVM sports and recreational uses by removing the ice surface. In such a case, practices and women’s hockey games may be hosted in the ancillary ice sheet envisioned as part of the new arena development. Regardless of its future use, Gutterson Fieldhouse is not expected to compete with the new arena to host events. Patrick Gymnasium South Burlington, Vermont Patrick Gymnasium, which opened in 1963, is located on the campus of the University of Vermont near Gutterson Fieldhouse. The gymnasium seats up to 3,228 and is home court of UVM men’s and women’s basketball programs. The venue has also hosted a variety of athletic and non-athletic events such as concerts, comedians, community shows, guest speakers and other non-University related events. Exhibit IV-5 on the following page summarizes the annual events and attendance hosted at Patrick Gymnasium in a recent year.
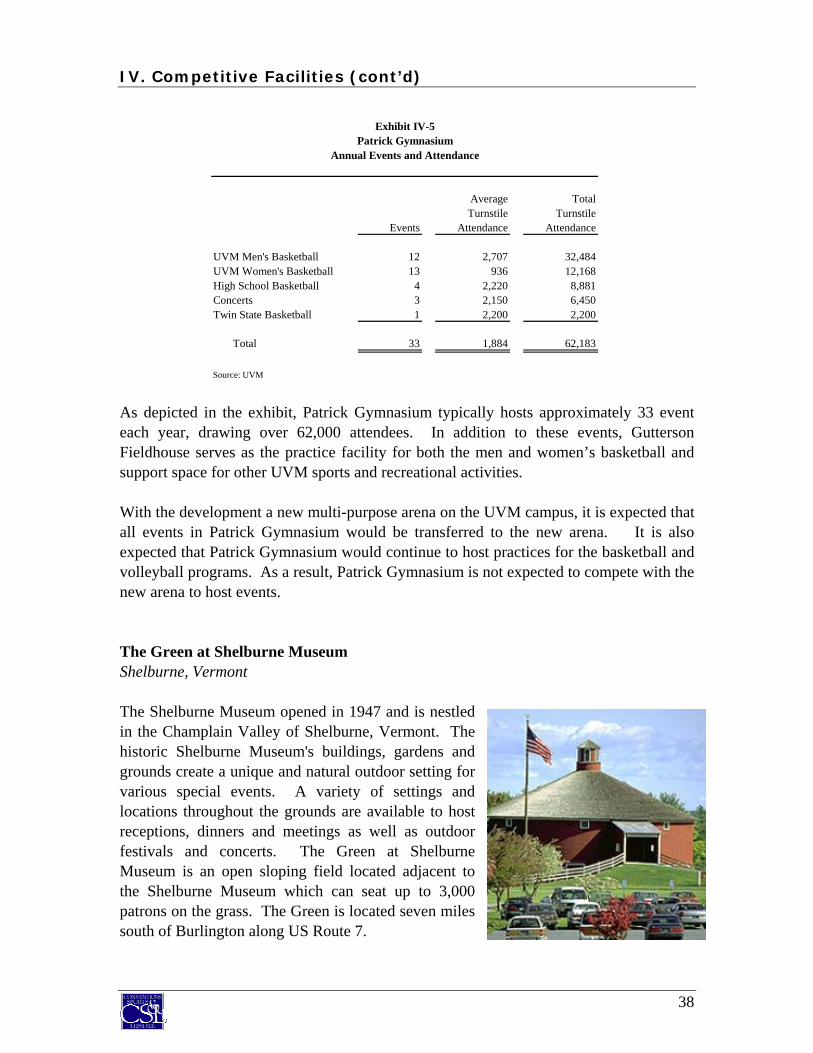
IV. Competitive Facilities (cont’d)
38
As depicted in the exhibit, Patrick Gymnasium typically hosts approximately 33 event each year, drawing over 62,000 attendees. In addition to these events, Gutterson Fieldhouse serves as the practice facility for both the men and women’s basketball and support space for other UVM sports and recreational activities. With the development a new multi-purpose arena on the UVM campus, it is expected that all events in Patrick Gymnasium would be transferred to the new arena. It is also expected that Patrick Gymnasium would continue to host practices for the basketball and volleyball programs. As a result, Patrick Gymnasium is not expected to compete with the new arena to host events. The Green at Shelburne Museum Shelburne, Vermont The Shelburne Museum opened in 1947 and is nestled in the Champlain Valley of Shelburne, Vermont. The historic Shelburne Museum's buildings, gardens and grounds create a unique and natural outdoor setting for various special events. A variety of settings and locations throughout the grounds are available to host receptions, dinners and meetings as well as outdoor festivals and concerts. The Green at Shelburne Museum is an open sloping field located adjacent to the Shelburne Museum which can seat up to 3,000 patrons on the grass. The Green is located seven miles south of Burlington along US Route 7.
Exhibit IV-5Patrick Gymnasium
Annual Events and Attendance
Average TotalTurnstile Turnstile
Events Attendance Attendance
UVM Men's Basketball 12 2,707 32,484UVM Women's Basketball 13 936 12,168High School Basketball 4 2,220 8,881Concerts 3 2,150 6,450Twin State Basketball 1 2,200 2,200
Total 33 1,884 62,183
Source: UVM

IV. Competitive Facilities (cont’d)
39
The primary music event hosted by the Museum is the annual ‘Concert on the Green Series’, which comprises five concerts during July and August. Higher Ground presents shows in conjunction with Gillett Entertainment. The ‘Concert on the Green Series’ advance purchase ticket prices range from a high of $57.00, excluding service fees, for Crosby Stills & Nash to a low of $40.00, excluding fees, for Lucinda Williams. The average ticket price is approximately $50 for advanced early bird ticket purchases; however, prices increase to $56 for tickets bought the day of the show. The Museum, given its outdoor environment, limited seating capacity and seasonal operations, will not likely compete to any significant degree with the proposed arena to attract concerts. A large majority of arena events, in particular indoor touring concerts, occur in the Fall, Winter and Spring months. Further, based on discussions with Gillett Entertainment officials, which promotes the summer concerts at the Museum, a new arena would draw additional, incremental concerts to the market and would not likely impact the summer concert series at the Museum. Centennial Field Burlington, Vermont Opened in 1906, Centennial Field is an open-air baseball stadium that is located on the University of Vermont campus. The facility, which can seat up to 4,400 patrons, is home to a variety of UVM athletics including baseball, soccer and lacrosse, averaging a combined total of 30 home game events per year. In addition, the facility is home to the Vermont Expos of the New York Penn League, a single A, short season affiliate of the Montreal Expos. The Vermont Expos’ season runs from mid-June until early September, playing an average of 38 home games. The venue will host the 2005 America East Baseball Championship and has been the site of several America East Conference men's and women's soccer championships. Before the soccer and lacrosse teams called Centennial their home, the stadium was the home of the Catamount football teams up until 1974 when the program was discontinued. Centennial, like its counterpart, Archie Post Field, also hosts several Vermont state high school championships throughout the year. While Centennial Field and a new arena will not compete directly to host the same events, the facilities and their tenants will likely compete, particularly during the summer

IV. Competitive Facilities (cont’d)
40
months, to attract patrons and their discretionary spending and corporate sponsorship dollars. Regional Competition While there is not a state-of-the-art multi-purpose arena operating in the Burlington metropolitan area (or the State of Vermont), there are several such facilities that are located within regional proximity of northwestern Vermont. Because of the lack of an appropriate local facility, area residents must often travel to other cities in the region to attend major concerts, family shows and other such events that currently bypass the market. Regionally competitive sports and entertainment facilities include, but are not limited to:
• Bell Centre (Montreal, Quebec); • Olympic Center (Lake Placid, New York); • Glen Falls Civic Center (Glen Falls, New York); • Pepsi Arena (Albany, New York); • Saratoga Performing Arts Centre (Saratoga Springs, New York); and, • Verizon Wireless Arena (Manchester, New Hampshire).
These facilities represent competition to the extent that certain event promoters may prefer to route events through these facilities/markets versus a new arena in Burlington for certain events. These types of events are likely to be high-profile events with a large regional draw. However, the degree of this type of competition is expected to be limited as most promoters contacted as part of this study indicated that the Burlington area is considered a separate market and, in most cases, is ideally situated among these regional facilities from an event routing perspective. Summary There are a limited number of sporting and entertainment facility options within the immediate Burlington area that could offer the same state-of-the art amenities as the new proposed arena. While there will be some degree of competition to host certain events, local competition is expected to come primarily in the form of competing for corporate sponsorship dollars and the discretionary spending of local residents.

CONFIDENTIAL DRAFTFor Discussion Purposes Only
For Internal Use
Executive Summary
I. Introduction
II. Review of Ernst & Young Study
III. Local Market Analysis
IV. Competitive Facilities
V. Comparable Facilities
VI. Market Surveys
VII. Estimated Event Demand
VIII. Building Program and Cost
IX. Estimated Financial Operations
X. Estimated Economic and Fiscal Impacts
XI. Management Options
XII. Funding Options
V. Comparable Facilities

V. Comparable Facilities
41
The purpose of this section is to present an overview of selected comparable facilities to provide a benchmark from which to assess the market potential for a multi-purpose arena on the UVM campus. An assessment of the physical, operational and financial characteristics of comparable facilities is an important component in assessing the market potential for the proposed arena. Exhibit V-1 summarizes the comparable facilities identified as a part of this analysis.
The multi-purpose facilities reviewed in this section were selected based on variety of criteria including, but not limited to one or more of the following: (a) university venue, (b) seating capacity of between 5,000 and 10,000 seats, (c) northern locations, (d) built in recent years, and (e) minor league tenants, among other factors. The remainder of this section provides an overview of each comparable facility including a variety of information such as physical attributes, event utilization, financial performance, event priorities, construction funding sources and other such information.
YearFacility Location Tenant(s) (1) Built Fixed (2) Total
Harry Agganis Arena Boston, MA University 2005 6,300 8,000University of Miami Convocation Center Miami, FL University 2003 7,000 10,000Resch Center Green Bay, WI University, af2, USHL 2002 9,877 10,200Thomas M. Ryan Center Kingston, RI University 2002 7,571 9,000Ted Constant Convocation Center Norfolk, VA University 2002 8,639 9,520Paul Tsongas Arena Lowell, MA University, AHL 1998 6,496 8,000Liacouras Center Philadelphia, PA University 1997 10,200 10,500Whittemore Center Arena Durham, NH University 1995 6,086 (3) 7,381William D. Mullins Memorial Center Amherst, MA University 1993 8,389 (3) 10,500
Average 2000 7,840 9,233
(1) The following are sports league tenants at the above facilities, where listed:af2: Arena Football 2
AHL: American Hockey League
University: University athletic teams (i.e. hockey, basketball)
USHL: United States Hockey League(2) Includes basketball fixed seating capacities.(3) Includes hockey fixed seating capacities.Source: CSL Research, facility management, Sales & Marketing Management (2003), Claritas, Inc.
Comparable Facilities
Seating Capacity
Exhibit V-1

V. Comparable Facilities (cont’d)
42
Harry Agganis Arena
Located within Boston University’s new student village, the Agganis Arena is expected to open in January 2005 as a new multi-purpose event center in Boston, Massachusetts. The 286,134 square foot venue will offer 6,300 fixed seats for hockey and ice shows, 7,200 for basketball games and is expandable to over 8,000 for center stage shows. Agganis Arena will be owned and operated by Boston University (BU). Agganis Arena will host the Terrier men’s and women’s basketball games as well as Terrier hockey matches. Additionally, the venue is projected to host a variety of sporting events such as figure skating, gymnastics, volleyball, boxing, and tennis, among others. As shown in Exhibit V-2, management projects that the new arena will host approximately 92 events annually, including 45 tenant-related events and 47 non-tenant events including concerts, family shows, motor sports and other sporting events. The athletic department indicated that BU athletic teams will receive first right to all dates at the venue and priority scheduling for its athletic events. The arena will incorporate 29 loge suites which will include regular season tickets for Terrier hockey and basketball games, reserved VIP parking, and priority rights to purchase tickets for other entertainment events. There are 20 suites including four-seats for $14,000, eight suites include six-seats for $21,000 and one is a 12-seat box for $42,000. Loge suites will be offered for 3-, 5-, and 7-year lease agreements. Loge suite holders will have access to the Private Club Room located on the Concourse Level.
Number of % ofEvents Events EventsCollegiate Tenant 45 49%Concerts 13 14%Family Shows 15 16%Motorsports 3 3%Other Sporting Events 16 17%
Tenant Events 45 49%Non-Tenant Events 47 51%Total 92 100%
Source: CSL research and facility interviews.
Harry Agganis ArenaProjected Event Days and Performances
Exhibit V-2
Location: Boston, MAYear Opened: 2005Capacity: 6,300 (hockey), 8,000 (concert)Size: 286,134 sq. ft.Cost: $97 millionFunding: 41.2% (public), 58.8% (private)Ownership: Boston UniversityManagement: Boston UniversityTotal Events: 92Total Paid Attd.: NA

V. Comparable Facilities (cont’d)
43
Additional suite amenities include private elevator access, private suite entrance with nameplate recognition, upholstered fixed seating with drink rail and bar stools, catering and beverage service, refrigerator and wet bar, internet access and private telephone service. The arena will incorporate 1,020 premium club seats which will include regular season tickets for Terrier hockey and basketball games, reserved Varsity Level parking, as well as priority rights to purchase tickets for other events. There are three different pricing packages depending on the privileges. Players Level seats are $1,250 per seat, Varsity Level seats are $1,500 per seat and Olympic Circle seats are $5,000 for two-seats of which all are offered on a five-year basis. The arena will be the centerpiece of the $225 million John Hancock Student Village, which was named in recognition of a corporate sponsorship of $20 million from John Hancock Financial Services, Inc. As shown in Exhibit V-3, of the total project cost, the arena represents approximately $97 million “all-in” including furniture, fixtures and equipment. To date, the University has raised approximately $57 million through its ongoing fundraising activities, which will continue. More than 600 individuals have donated money to the project and the majority of donations range from $50,000 to $2 million. The balance of financing is being secured through tax-exempt bonds issued by the University.
Tax-Exempt University Bonds
$40.0 million
Fundraising - Gifts & Donations
$57.0 million
Exhibit V-3Harry Agganis Arena
Boston University
Public Participation: $40.0 million 41.2%Private Participation: $57.0 million 58.8%
Public Participation: $40.0 million 41.2%Private Participation: $57.0 million 58.8%

V. Comparable Facilities (cont’d)
44
University of Miami Convocation Center
The Convocation Center is located on the University of Miami campus in Coral Gables, Florida. The multi-purpose center opened in January 2003. The 200,000 square foot venue offers 7,000 permanent seats, expanding to 10,000 with portable seating. The facility offers 21,160 square feet of space on the arena floor for conventions and trade shows as well an additional 4,500 square feet of banquet space. The Center is owned by the University and managed by Global Spectrum. The University of Miami Convocation Center is the home of the Hurricanes men's and women's basketball teams. As shown in Exhibit V-4, in a recent 12-month period, the Convocation Center hosted a total of 85 events. Of these events, 35 consisted primarily of University of Miami sporting events such as men’s and women’s basketball. The facility hosted 50 external non-tenant events including 12 concerts, 11 family-oriented shows, two trade shows, and 25 other miscellaneous events. The venue also hosts a variety of lecture series, university events and sporting events. The Convocation Center is currently under a management contract agreement with Global Spectrum. Under this agreement, Global Spectrum charges the athletic department $5,000 in rent plus a $2.25 parking surcharge on every ticket sold for men’s basketball home games. Global Spectrum charges the athletic department $2,500 in rent for women’s basketball home games. The athletic department is also required to reimburse the management company for all direct game-day expenses for all athletic events. On average, the athletic department is responsible for total costs of
Number of % ofEvents Events EventsCollegiate Tenant 35 41%Concerts 12 14%Family Shows 11 13%Trade / Consumer Shows 2 2%Other 25 29%
Tenant Events 35 41%Non-Tenant Events 50 59%Total 85 100%
Source: CSL research and facility interviews.
University of Miami Convocation CenterEvent Days and Performances
Exhibit V-4
Location: Coral Gables, FLYear Opened: 2003Capacity: 7,000 (basketball), 10,000 (concert)Size: 200,000 sq. ft.Cost: $48 millionFunding: 100% (private)Ownership: University of MiamiManagement: Global SpectrumTotal Events: 85Total Paid Attd.: 116,659

V. Comparable Facilities (cont’d)
45
approximately $20,000 to $25,000, including rent, per game. The facility also charges the athletic department for practice time due to the use of the arena sports lighting which during off-season is at a rate of $75 per hour for half-lights and is $125 per hour for use of full-lights. The athletic department is also charged an additional $1,100 to put the basketball floor down if it is not already in place. The athletic department retains 100 percent of ticket revenues, naming rights, premium seating revenue, which is generated by a surcharge of $100 per center court seat, and suite revenue. The department dedicates all of the private suite revenue to pay back debt-service on the facility. All parking, concession, merchandise revenue goes to the University. For the first three years of operations, the athletic department is responsible for paying the annual operating loses of the arena. In the most recent year, management indicated that they incurred a $100,000 loss. Also in the agreement, the Hurricanes receive first right to scheduling dates for the men’s and women’s basketball games and practices. However, management indicated that there have been approximately 10 times in the recent year that the practice schedule of the basketball teams has been bumped due to a more lucrative event opportunity. The athletic department has access to the former on-campus facility, Knights Sports Complex; however, the volleyball team also utilizes this facility, which can sometimes make scheduling displaced events complicated for the department. The department and Global Spectrum remain in constant communication due to the limited number of practice facilities. The Convocation Center has 25 suites. Each suite is equipped with twelve box seats with three additional bar stools, a lounge area, television and phones, and a kitchen area with a bar and refrigerator. Suite holders also have access to the Hurricane 100 reception room, a special room that hosts pre-game and post-game events. This reception room includes concessions, rest rooms, and meeting space available to members and their guests. Suites average $30,000 and were offered on a 10-year lease. The facility does not offer club seating; however, they do offer a premium center court section of floor seats which are sold at a surcharge of $100 plus the purchase of season tickets.

V. Comparable Facilities (cont’d)
46
The $48 million Convocation Center was funded entirely through private sources. The University was able to construct the Convocation Center on lead gifts from Ryder System, Inc. and the Dauer Family and received remaining support from gifts and donations. As a private institution, no state or local tax funds were involved in the construction of this facility. As of 2004, the athletic department had collected $17 million of the total amount. The athletic department is responsible for a $3.0 million debt service payment to the University which is secured primarily through private suite revenues and other sources.
Private Donations$48.0 million
Public Participation: $0.0 million 0%Private Participation: $48.0 million 100%
Public Participation: $0.0 million 0%Private Participation: $48.0 million 100%
Exhibit V-5University of Miami Convocation Center
University of Miami
Private Donations$48.0 million
Public Participation: $0.0 million 0%Private Participation: $48.0 million 100%
Public Participation: $0.0 million 0%Private Participation: $48.0 million 100%
Exhibit V-5University of Miami Convocation Center
University of Miami

V. Comparable Facilities (cont’d)
47
Resch Center
The 10,200-seat Resch Center in Green Bay, Wisconsin, opened in August 2002. The facility serves as the home of the United States Hockey League (USHL) Green Bay Gamblers, the University of Wisconsin-Green Bay (UWGB) men’s basketball team, and an af2 franchise. The arena is owned by Brown County and is operated by PMI, a Wisconsin-based management company. The Resch Center’s premium seating offerings include 25 suites and 608 club seats. The suites can be leased on five year contracts, with annual prices ranging from $30,000 to $35,000, which includes tickets to UWGB basketball games. Club seats are leased on three or five year contracts at a price of $1,000 per seat per year. The club seat price includes tickets to four events each year: one sporting event, one concert, one family show, and one other event. Club seat holders also have the right to purchase season tickets for the arena’s tenant sports at discounted prices. Facility management indicated the arena hosts approximately 150 events per year, with a total of 180 to 190 days of utilization annually. These events include 30 Gamblers games, 16 UWGB games, eight af2 games, and various concerts, family shows and other events. The facility charges a flat rental rate for concerts and other such events. The rate varies from $15,000 to $45,000 per concert. The UWGB athletic department has an agreement with PMI in which they are given the first right to arena dates as long as dates are submitted by April 15th of each year. In addition to the 16 home games, the men’s basketball team is provided 15 to 20 practice dates each year, of which typically occur the day before their home games. The facility requires the University to lease the facility at a minimal rate if additional practice times are requested. Events other than regular season home games, such as tournaments, are not guaranteed dates. During times when the arena is not booked for ice events, the arena will typically leave the basketball floor down for the University to use when necessary.
Location: Green Bay, WIYear Opened: 2002Capacity: 9,877 (basketball), 10,200 (concert)Size: 245,000 sq. ft.Cost: $49 millionFunding: 89% (public), 11% (private)Ownership: Brown CountyManagement: PMI (private)Total Events: 150Total Paid Attd.: NA

V. Comparable Facilities (cont’d)
48
As shown in the illustration below, the development costs of the Resch Center were almost entirely publicly funded. Public sources included revenue bonds backed by proceeds from a hotel-motel sales tax in five area communities. The bonds are due to be paid off by June 2029. The State of Wisconsin contributed $1.5 million as well as the Village of Ashwaubenon, which contributed $1.2 million. In addition, naming rights of various locations in the arena, such as concourses, the lobby and meeting rooms, were sold generating $5.5 million in funding. Another source of naming rights revenue came from the sale of bricks in the front plaza in which people or organizations could have their names or other messages printed on the bricks in which they purchased.
Exhibit V-6Resch Center
University of Wisconsin – Green Bay
Public Participation: $43.5 million 89%Private Participation: $5.5 million 11%
Public Participation: $43.5 million 89%Private Participation: $5.5 million 11%
Naming Rights$5.5 million
State of Wisconsin$1.5 million
Village of Ashwaubenon $1.2 million
Revenue Bonds backed by Hotel /
Motel Tax Proceeds
$40.8 million
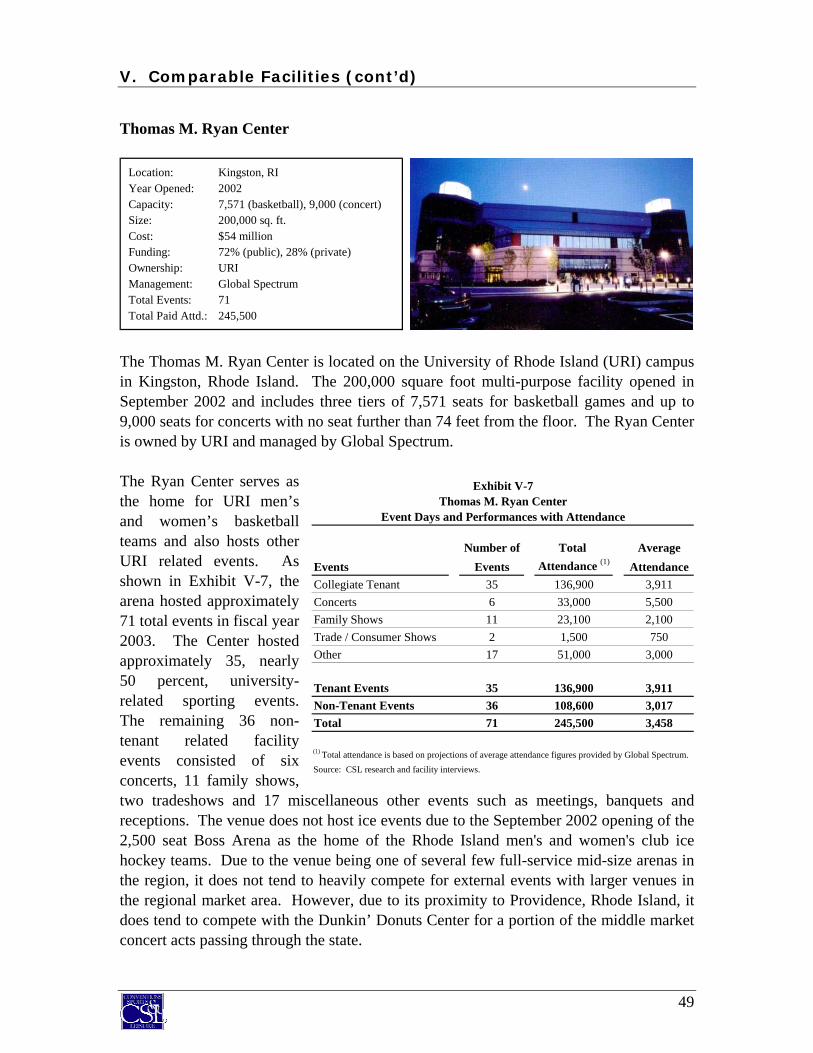
V. Comparable Facilities (cont’d)
49
Thomas M. Ryan Center
The Thomas M. Ryan Center is located on the University of Rhode Island (URI) campus in Kingston, Rhode Island. The 200,000 square foot multi-purpose facility opened in September 2002 and includes three tiers of 7,571 seats for basketball games and up to 9,000 seats for concerts with no seat further than 74 feet from the floor. The Ryan Center is owned by URI and managed by Global Spectrum. The Ryan Center serves as the home for URI men’s and women’s basketball teams and also hosts other URI related events. As shown in Exhibit V-7, the arena hosted approximately 71 total events in fiscal year 2003. The Center hosted approximately 35, nearly 50 percent, university-related sporting events. The remaining 36 non-tenant related facility events consisted of six concerts, 11 family shows, two tradeshows and 17 miscellaneous other events such as meetings, banquets and receptions. The venue does not host ice events due to the September 2002 opening of the 2,500 seat Boss Arena as the home of the Rhode Island men's and women's club ice hockey teams. Due to the venue being one of several few full-service mid-size arenas in the region, it does not tend to heavily compete for external events with larger venues in the regional market area. However, due to its proximity to Providence, Rhode Island, it does tend to compete with the Dunkin’ Donuts Center for a portion of the middle market concert acts passing through the state.
Number of Total AverageEvents Events Attendance (1) AttendanceCollegiate Tenant 35 136,900 3,911Concerts 6 33,000 5,500Family Shows 11 23,100 2,100Trade / Consumer Shows 2 1,500 750Other 17 51,000 3,000
Tenant Events 35 136,900 3,911Non-Tenant Events 36 108,600 3,017Total 71 245,500 3,458
(1) Total attendance is based on projections of average attendance figures provided by Global Spectrum.Source: CSL research and facility interviews.
Thomas M. Ryan CenterEvent Days and Performances with Attendance
Exhibit V-7
Location: Kingston, RIYear Opened: 2002Capacity: 7,571 (basketball), 9,000 (concert)Size: 200,000 sq. ft.Cost: $54 millionFunding: 72% (public), 28% (private)Ownership: URIManagement: Global SpectrumTotal Events: 71Total Paid Attd.: 245,500

V. Comparable Facilities (cont’d)
50
The Ryan Center is currently in a three year management contract agreement with Global Spectrum. Under this agreement, Global Spectrum charges the URI athletic department a flat $5,000 rent payment per men’s basketball game versus 12 percent of gross ticket revenue. Global Spectrum charges the athletic department a flat $1,500 rent payment per women’s basketball game versus 15 percent of gross ticket revenue. In addition, Global Spectrum receives $2 per ticket for parking and debt service. The management company does not charge for practice time using the court, assuming the court is down and available. However, if the athletic department requires a changeover for practice set-ups, an additional $500 payment is required and an additional $1,500 is charged for game court set-up, if it is not already down. Due to the shared nature of the Ryan Center with the football field, the athletic department is also responsible for the football staffing expenses. In the 2004 season, Global Spectrum is projected to charge the athletic department a minimum of $3,600 per football game. Additional expenses required by Global Spectrum include payment of the vision and sound crew as well as extra charges incurred with any Cox broadcast games, as this is not a component of the building costs in which Global Spectrum would normally incur. The athletic department receives 100 percent of football ticket sales revenue; however, tickets sales revenue from basketball events is split. The athletic department also receives all revenue from their temporary signage, which is displayed only during URI athletic events. In contrast, Global Spectrum receives $2 per ticket off the top of the ticket price for parking and debt-service from women’s and men’s basketball games as well as 100 percent of revenues from concessions, catering, premium seating, permanent signage, and naming rights while splitting merchandise revenue with the URI bookstore which runs the store. Also in the agreement, the URI athletic department receives first right to scheduling dates for the men’s and women’s basketball games and practices. Global Spectrum is in constant communication with the athletic department regarding the basketball conference schedule to ensure there is not a conflict in scheduling events. The management company receives a draft of conference game dates and is required to hold the dates open for URI events. To date, there has only been one instance where a non-conference game was cancelled due to an external event. However, there have been a few more occasions where an external revenue-generating event has superseded a practice whereby the team utilizes their alternative practice facility, Keaney Gymnasium, the former home of the URI basketball programs. The venue offers an exclusive Suite Level on the third level featuring eight hospitality suites that are fully furnished offering VIP amenities. The suites overlook both the Meade Stadium football field and the Ryan Center basketball court and are available to lease on a per game/event basis. Suites for URI football and URI women’s basketball home contests are $250 per game. Suite rentals for all other events including URI men’s

V. Comparable Facilities (cont’d)
51
basketball and concerts are $400 per event. Tickets must be purchased in addition to the suite rental fee. A minimum of 10 and maximum of 20 tickets to each suite must be purchased. The facility also offers an Alumni Room for pre-and post-game events. The lounge is available as a function room for parties up to 125 when events are not occupying the arena and is open to priority seat holders with food and beverage service during basketball games. Total development costs for the Ryan Center amounted to $54 million. Over a three year period, the University conducted a $15 million private fund drive that helped support the project. Nearly 28 percent of the facility financing was generated through private participation while the remaining 72 percent game from the public sector in the form of $18 million in state appropriations and $21 million in revenue bonds. The revenue bonds are secured by student fees and a $1 from each ticket sold at all men’s basketball games.
Exhibit V-8Thomas M. Ryan Center
University of Rhode Island
Public Participation: $39.0 million 72%Private Participation: $15.0 million 28%
Public Participation: $39.0 million 72%Private Participation: $15.0 million 28%
State of Rhode Island
Appropriations$18.0 million
Private Gifts and Donations
$15.0 million
Revenue Bondsbacked by
Student Fees and
Ticket Surcharge$21.0 million
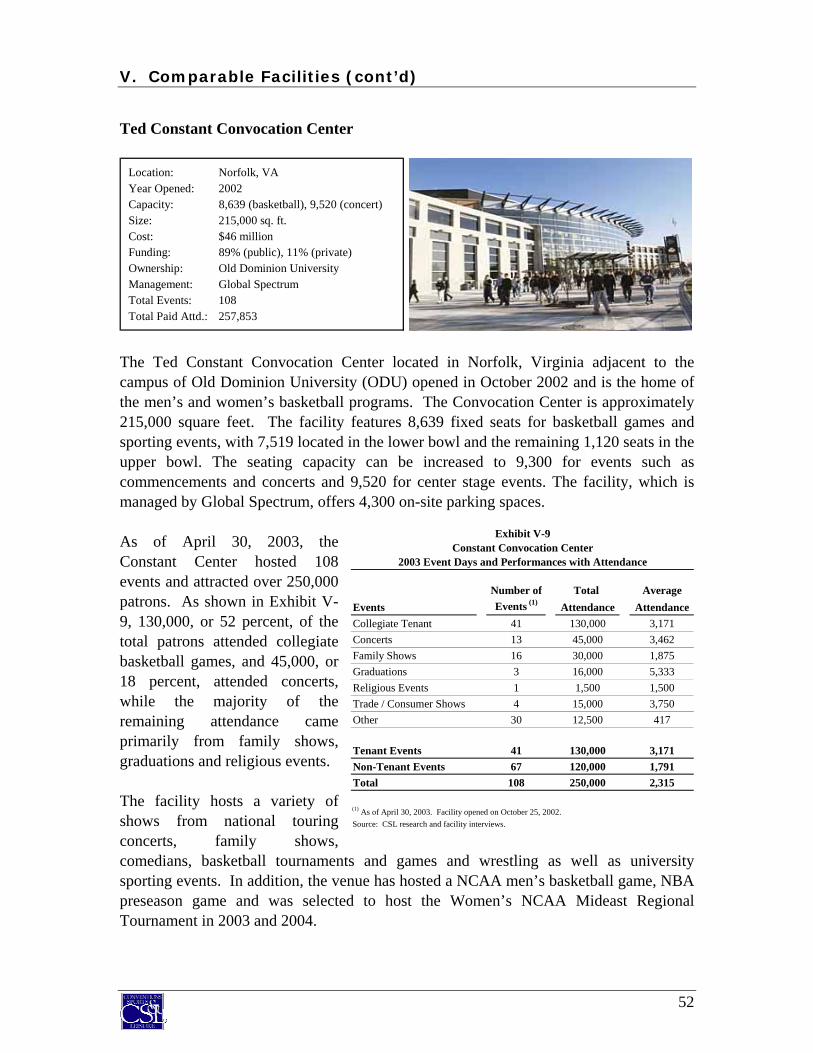
V. Comparable Facilities (cont’d)
52
Ted Constant Convocation Center
The Ted Constant Convocation Center located in Norfolk, Virginia adjacent to the campus of Old Dominion University (ODU) opened in October 2002 and is the home of the men’s and women’s basketball programs. The Convocation Center is approximately 215,000 square feet. The facility features 8,639 fixed seats for basketball games and sporting events, with 7,519 located in the lower bowl and the remaining 1,120 seats in the upper bowl. The seating capacity can be increased to 9,300 for events such as commencements and concerts and 9,520 for center stage events. The facility, which is managed by Global Spectrum, offers 4,300 on-site parking spaces. As of April 30, 2003, the Constant Center hosted 108 events and attracted over 250,000 patrons. As shown in Exhibit V-9, 130,000, or 52 percent, of the total patrons attended collegiate basketball games, and 45,000, or 18 percent, attended concerts, while the majority of the remaining attendance came primarily from family shows, graduations and religious events. The facility hosts a variety of shows from national touring concerts, family shows, comedians, basketball tournaments and games and wrestling as well as university sporting events. In addition, the venue has hosted a NCAA men’s basketball game, NBA preseason game and was selected to host the Women’s NCAA Mideast Regional Tournament in 2003 and 2004.
Number of Total AverageEvents Events (1) Attendance AttendanceCollegiate Tenant 41 130,000 3,171Concerts 13 45,000 3,462Family Shows 16 30,000 1,875Graduations 3 16,000 5,333Religious Events 1 1,500 1,500Trade / Consumer Shows 4 15,000 3,750Other 30 12,500 417
Tenant Events 41 130,000 3,171Non-Tenant Events 67 120,000 1,791Total 108 250,000 2,315
(1) As of April 30, 2003. Facility opened on October 25, 2002.Source: CSL research and facility interviews.
Constant Convocation Center2003 Event Days and Performances with Attendance
Exhibit V-9
Location: Norfolk, VAYear Opened: 2002Capacity: 8,639 (basketball), 9,520 (concert)Size: 215,000 sq. ft.Cost: $46 millionFunding: 89% (public), 11% (private)Ownership: Old Dominion UniversityManagement: Global SpectrumTotal Events: 108Total Paid Attd.: 257,853
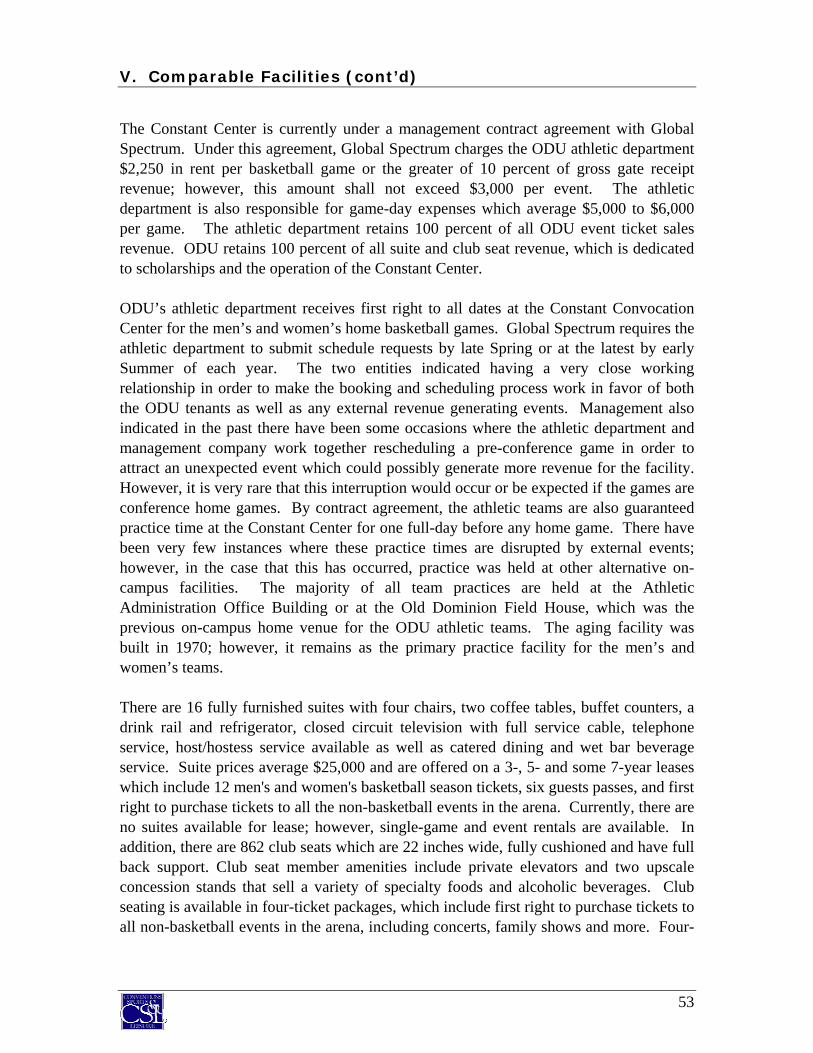
V. Comparable Facilities (cont’d)
53
The Constant Center is currently under a management contract agreement with Global Spectrum. Under this agreement, Global Spectrum charges the ODU athletic department $2,250 in rent per basketball game or the greater of 10 percent of gross gate receipt revenue; however, this amount shall not exceed $3,000 per event. The athletic department is also responsible for game-day expenses which average $5,000 to $6,000 per game. The athletic department retains 100 percent of all ODU event ticket sales revenue. ODU retains 100 percent of all suite and club seat revenue, which is dedicated to scholarships and the operation of the Constant Center. ODU’s athletic department receives first right to all dates at the Constant Convocation Center for the men’s and women’s home basketball games. Global Spectrum requires the athletic department to submit schedule requests by late Spring or at the latest by early Summer of each year. The two entities indicated having a very close working relationship in order to make the booking and scheduling process work in favor of both the ODU tenants as well as any external revenue generating events. Management also indicated in the past there have been some occasions where the athletic department and management company work together rescheduling a pre-conference game in order to attract an unexpected event which could possibly generate more revenue for the facility. However, it is very rare that this interruption would occur or be expected if the games are conference home games. By contract agreement, the athletic teams are also guaranteed practice time at the Constant Center for one full-day before any home game. There have been very few instances where these practice times are disrupted by external events; however, in the case that this has occurred, practice was held at other alternative on-campus facilities. The majority of all team practices are held at the Athletic Administration Office Building or at the Old Dominion Field House, which was the previous on-campus home venue for the ODU athletic teams. The aging facility was built in 1970; however, it remains as the primary practice facility for the men’s and women’s teams. There are 16 fully furnished suites with four chairs, two coffee tables, buffet counters, a drink rail and refrigerator, closed circuit television with full service cable, telephone service, host/hostess service available as well as catered dining and wet bar beverage service. Suite prices average $25,000 and are offered on a 3-, 5- and some 7-year leases which include 12 men's and women's basketball season tickets, six guests passes, and first right to purchase tickets to all the non-basketball events in the arena. Currently, there are no suites available for lease; however, single-game and event rentals are available. In addition, there are 862 club seats which are 22 inches wide, fully cushioned and have full back support. Club seat member amenities include private elevators and two upscale concession stands that sell a variety of specialty foods and alcoholic beverages. Club seating is available in four-ticket packages, which include first right to purchase tickets to all non-basketball events in the arena, including concerts, family shows and more. Four-

V. Comparable Facilities (cont’d)
54
seat packages are $3,000 per year for three years, and include membership in the Big Blue Club. The facility features include upholstered seats and backs, a center hung jumbo video board, four corner hung LED boards, a kitchen that can accommodate 1,500 people for a seated dinner, closed-circuit television throughout the arena and suites, up-scale concessions, private catering on the VIP concourse, full commissary, a retail store in the lobby and a sports Hall of Fame area with hands-on activities and exhibits. The advertised base rental structure for ticketed events is $3,500 per day. The $45 million facility was funded through a $40 million State of Virginia Higher Education revenue bond and a $5 million cash donation from Ted Constant. Revenues generated from student fees repay the revenue bonds. Currently each student pays nearly $62 per credit hour, which is used to support various university projects and developments.
Higher Education Revenue Bonds
backed by Student Fees $40.0 million
Ted Constant Donation
$5.0 million
Exhibit V-10Ted Constant Convocation Center
Old Dominion University
Public Participation: $40.0 million 89%Private Participation: $5.0 million 11%
Public Participation: $40.0 million 89%Private Participation: $5.0 million 11%

V. Comparable Facilities (cont’d)
55
Paul Tsongas Arena
The Paul Tsongas Arena is located in downtown Lowell, Massachusetts adjacent to the University of Massachusetts, Lowell (UML) campus. Tsongas Arena is a multi-purpose indoor facility that opened in January 1998 that has a capacity of 6,496 for hockey and up to 8,000 for concerts. The arena also maintains a lawn with a 3,500 person capacity for outdoor concerts, festivals, and special events. The venue offers 30,000 square feet of exhibit space. The venue is owned by the City of Lowell and is privately managed by SMG. The arena is home to two hockey teams including the Carolina Hurricanes’ AHL affiliate, Lowell Lock Monsters and the NCAA Division I University of Massachusetts, Lowell River Hawks hockey team. Arena management indicated that the facility filled approximately 148 event days in the most recent fiscal year as illustrated in the following exhibit. Facility events included 44 AHL games, 24 UML related sporting events, 19 concerts, 11 family shows, and a number of tradeshows and conferences. The 2006 World Men’s Curling Championship will be held in the arena. The venue’s highest average attendance of 4,818 was for concerts held at the arena. Also, on average, the AHL games draw an average attendance of 3,044 while the UML hockey team draws an average of 2,641 attendees.
Number of Total AverageEvents Events Attendance Attendance
Tenant Hockey 44 133,941 3,044Collegiate Tenant 24 63,392 2,641Concerts 19 91,547 4,818Family Shows 11 19,043 1,731Other Sporting Events 6 25513 4,252Graduations 6 19,303 3,217Trade / Consumer Shows 1 100 100Other 37 43,560 1,177
Tenant Events 68 197,333 2,902Non-Tenant Events 80 199,066 2,488Total 148 396,399 2,678
Source: CSL research and facility interviews.
Paul Tsongas ArenaFY02 Event Days and Performances with Attendance
Exhibit V-11
Location: Lowell, MAYear Opened: 1998Capacity: 6,496 (basketball), 8,000 (concert)Size: 175,000 sq. ft.Cost: $28 millionFunding: 85.7% (public), 14.3% (private)Ownership: City of LowellManagement: SMGTotal Events: 148Total Paid Attd.: 396,399

V. Comparable Facilities (cont’d)
56
In January 1998, the University and SMG entered into a 20-year management agreement for Tsongas Arena. Because the State and City of Lowell funded nearly 86 percent of the total development costs, SMG was capped at charging a base rental fee of $3,000 per event with an escalator of the average CPI, or 3.0 percent for the lifetime of the contract. In 2004, the approximate rental payment per event is $3,580. On average, the athletic department hosts one to two basketball events and 15 to 19 hockey events per year. Game day expenses are included with the rent payment. The athletic department retains revenue from all UML athletic events ticket sales. In addition to ticket revenue, the athletic department receives an additional $30 per ticket sold for club seats, which are controlled by the Lowell Lock Monsters. The department also receives between 10 to 15 percent of concession revenue, of which the remaining are retained by the Lock Monsters with a small percentage going to SMG. The athletic department also controls the merchandise revenue; however, it also pays some overhead costs to the bookstore, which is responsible for the sale and inventory cost of the merchandise. In order to generate additional revenue, the athletic department is also creating opportunities for temporary signage and digital display advertising, which is generating incremental revenue for the department. Parking revenue is split by the SMG and the City of Lowell. SMG controls and receives all parking revenue for the two surface lots which are reserved for staff, event management, the team and club seat holders. The City manages and receives the revenue from the five-story parking garage of which the cost of parking fee was capped by the athletic department, for athletic events only, to never be more than the lowest UML event ticket price. As part of the AHL negotiation with Tsongas Arena, all naming rights, scoreboard signage and permanent advertising revenue was turned over to the Lowell Lock Monsters. Also in the agreement, the UML River Hawks have priority to lock-in ice dates and schedule events because the facility was state funded for the primary tenant, which is the state’s university hockey team. Management confirmed that the AHL schedule usually comes out first with the majority of home games played on Saturday evenings while the University’s home games are on Friday evenings which generally does not pose any scheduling conflicts. Practice schedules are also organized with the River Hawks receiving priority, which is typically in the afternoon or evening while the AHL practices in the early morning or whenever the University is not utilizing the ice. Also in the contract agreement, SMG has the right to request within a 30-day period for a practice to be relocated due to the potential of an external event being held in the facility. However, if SMG exercises the right to supersede the River Hawks’ practice more than five times, the management company incurs a penalty fee. In the event of practice relocation, the athletic department still has access to their former playing facility, Chelmsford Forum, and as long as a 30-day advance is provided to the Forum, the athletic department does not have to pay a facility rental fee. UML management indicated this is a rare occurrence

V. Comparable Facilities (cont’d)
57
and if an event requires rescheduling, SMG typically communicates the schedule change three to five weeks in advance. The arena does not have any private suites, but incorporates approximately 250 club seats at an average annual fee of $350. Seats can be leased on a 1- or 3-year basis. The club seat prices include season tickets to all regular season home games for River Hawks hockey and the first right to purchase tickets for these seats for other arena events including concerts and family shows. Club seat amenities include center-ice location with optimum sightlines, padded seats with cup holders, and one VIP parking pass for every two seats purchased. Tsongas Arena is located 30 miles northwest of Boston drawing from an audience of six million residents. However, a facility representative indicated that despite its proximity to Boston and its facilities, Paul Tsongas Arena has been successful in drawing events due to its niche as the only full service, mid-sized arena in the region, its ease of access relative to facilities in downtown Boston, and its intimate size, which provides better sightlines than the larger FleetCenter in Boston. The following exhibit illustrates the $28 million facility was funded through a $4 million City of Lowell municipal bond and $4 million from the University fund. The late U.S. Senator Paul Tsongas, which the arena is named after, was also instrumental in acquiring state funding for the project. The remaining $20 million was funded by a state grant, including $3 million for a canal and river walkway around the arena and $3.5 million for an access road and rotary connecting the arena with an existing parking garage.
State Grant $20.0 million
University Fund $4.0 million
City of Lowell Municipal
Obligation Bond $4.0 million
Exhibit V-12Paul Tsongas Arena
University of Massachusetts - Lowell
Public Participation: $24.0 million 85.7%Private Participation: $4.0 million 14.3%
Public Participation: $24.0 million 85.7%Private Participation: $4.0 million 14.3%

V. Comparable Facilities (cont’d)
58
Liacouras Center
The Liacouras Center is located in Philadelphia, Pennsylvania on the campus of Temple University. The multi-purpose Center opened in 1997. The venue offers 10,200 fixed seats for basketball and is expandable to over 10,500 for center stage shows. Rows of retractable seating were created to allow for different event configurations. The 340,000 square foot venue offers 22,000 square feet of space on the arena floor that converts to an open exhibition floor accommodating various exhibit set-ups. Additional space includes several auxiliary rooms for meetings. In addition to the arena and exhibit space, the Liacouras Center also features the Esther Boyer Theater, which is a 1,963 seat theater for smaller events. The Liacouras Center also has an attached 1,300 space indoor parking garage with an enclosed walkway linking it to the venue. The Center is owned by the University and managed by Global Spectrum. The Liacouras Center is home to Temple's men and women’s basketball teams. As shown in Exhibit V-13, in the most year, the Liacouras Center hosted 116 events. Of these events, 28 consisted of Temple sporting events such as men’s and women’s basketball. The facility hosted 88 external events including 13 concerts, two high school sporting events and 73 other miscellaneous events. The venue also hosted drama and fine-arts exhibitions, convocation events, sports exhibitions, banquets and seminars. The Center drew 175,552 in total paid attendance and 328,162 in turnstile attendance in the most recent fiscal year.
Number of % ofEvents Events EventsCollegiate Tenant 28 24%Concerts 13 11%High School Sporting Events 2 2%Other 73 63%
Tenant Events 28 24%Non-Tenant Events 88 76%Total 116 100%
Source: CSL research and facility interviews.
Liacouras CenterEvent Days and Performances
Exhibit V-13
Location: Philadelphia, PAYear Opened: 1997Capacity: 10,200 (basketball), 10,500 (concert)Size: 340,000 sq. ft. (1)
Cost: $107 millionFunding: 39.3% (public), 60.7% (private)Ownership: Temple UniversityManagement: Global SpectrumTotal Events: 116Total Paid Attd.: 350,000(1) Includes the Esther Boyer Theater.
V. Comparable Facilities (cont’d)
59
In 2001, the University and Global Spectrum entered into a management agreement for the Liacouras Center. Under this agreement, Global Spectrum charges the Temple athletic department, their primary tenant, a flat $6,100 rent payment plus game-day expenses for men’s basketball games. Global Spectrum charges the athletic department a flat $5,000 plus game-day expenses for women’s basketball games. If the teams play a doubleheader, the rent is reduced to $6,100 for both. The athletic department retains 100 percent of revenues generated from athletic event ticket sales and 50 percent of revenues generated from private suites. In addition, the athletic department receives a percentage of the concession and merchandise licensing as well as pays a flat fee for the rights to all signage thereby generating all signage and advertising revenue. The University retains revenue from parking and all naming rights revenue. Global Spectrum retains the remaining 50 percent of revenues generated from private suites and a portion of all concession, catering, and merchandise revenue generated at the Liacouras Center. Temple University men and women’s basketball teams receive the first right to lock-in home game dates and are allotted practice times based on the athletic department’s schedule request. Athletic department management indicated that it is rare for practices to be relocated; however, is not an issue due to their access and availability to their previous home facility, McGonigal Hall. In recent years, there has only been one women’s basketball home game, which had to be relocated due to a large revenue opportunity with an external event. The Liacouras Center incorporates 10 private suites for varying rates ranging from $30,000 to $35,000 on an annual basis, for a lease term of five years. Each suite includes seating for 10 to 14 persons and includes 17 tickets to all Temple University regular season basketball games. Currently, the venue has six suites rented on an annual basis. The venue does not incorporate club seating.

V. Comparable Facilities (cont’d)
60
The Liacouras Center is part of a four building, $107 million complex. The majority of the funding, approximately 65 percent, came through private funding participation. Private sources included $65 million in gifts and donations while public sources included a $42 million grant from Commonwealth of Pennsylvania.
Whittemore Center Arena
The Whittemore Center Arena opened in November 1995 and is located on the University of New Hampshire (UNH) campus in Durham, New Hampshire. The multi-purpose arena seats 6,086 for hockey and other ice events and can be arranged to seat up to 7,381 for end-stage concerts, family shows and other events. The facility is owned by UNH and privately operated by Global Spectrum.
Private Contributions $65.0 million
Grant from Commonwealth of Pennsylvania $42.0 million
Exhibit V-14Liacouras Center
Temple University
Public Participation: $42.0 million 39.3%Private Participation: $65.0 million 60.7%
Public Participation: $42.0 million 39.3%Private Participation: $65.0 million 60.7%
Location: Durham, NHYear Opened: 1995Capacity: 6,086 (hockey), 7,381 (concert)Size: 163,000 sq. ft.Cost: $30 millionFunding: NAOwnership: UNHManagement: Global SpectrumTotal Events: 124Total Paid Attd.: 197,751

V. Comparable Facilities (cont’d)
61
The Whittemore Center Arena is the home of the UNH Wildcats men’s and women’s hockey teams. Currently, the men’s and women’s basketball teams host their home games and practices at the Lundholm Gymnasium. However, the arena has hosted various basketball games, concerts, ice shows, athletic events, family shows, trade shows and conventions, and many other events. The NCAA National Collegiate Women's Ice Hockey Committee has named the Whittemore Center Arena its 2005 site for the Women's Frozen Four. As shown in Exhibit V-15, in the most recent 12-month period, Whittemore Center Arena hosted a total of 124 events of which 34 consisted of UNH tenant related sporting events. The facility hosted 90 external events including four concerts, four family shows, nine high school sporting events, four trade shows, and 69 other miscellaneous events such at the Republican Fundraising Dinner, Lord of the Dance, and Expo and House Show. The Whittemore Center draws from an immediate market population of 1.3 million people and competes for events primarily with one regional venue, the Verizon Wireless Arena in Manchester which seats up to 11,000. Under the agreement with Global Spectrum, the athletic department does not pay a per event rental fee; however they are responsible to pay approximately a total lump sum of $481,000 which is an annual contribution to the bond expenses of the building. This is a “below the line” contribution. In addition to this, the department is also responsible to pay all reimbursable expenses of events held at the Whittemore. The University is responsible for a management fee which is 50 percent fixed and 50 percent incentive, based on volume of activity. The cost of the management fee is covered by operating income. The UNH athletic department receives priority scheduling for its men’s and women’s hockey games. The athletic department sets the women’s hockey schedule around the men’s schedule approximately eight to 12 months in advance before providing to Global Spectrum. Based on the management contract with the University, Global Spectrum is directed to schedule all external events around this pre-set schedule of athletic games. During this time, there is continuous communication between the athletic department and management company in the chance that there may be a large touring show or act that would bring in large sums of revenue to the University and facility, in which games could
Number of % ofEvents Events EventsCollegiate Tenant 34 27%Concerts 4 3%Family Shows 4 3%High School Sporting Events 9 7%Trade / Consumer Shows 4 3%Other 69 56%
Tenant Events 34 27%Non-Tenant Events 90 73%Total 124 100%
Source: CSL research and facility interviews.
Event Days and PerformancesWhittemore Center Arena
Exhibit V-15

V. Comparable Facilities (cont’d)
62
possibly be moved. Management indicated that there have been very few occasions where there has been a lapse of scheduling a large external event and a UNH hockey game. There have been slightly more instances where practices have been interrupted by external events organized by private management during weekdays; however, the athletic department has alternative local ice-rinks in which they book, if necessary. There is also an agreement required by Global Spectrum in which the external event pays for the UNH team’s transportation and ice rental fee when the team is displaced due to a scheduling conflict. The athletic department indicated this is a rare occasion and when done so, it can be financially beneficial to the athletic department and/or University. Because the facility does not have air-conditioning, the venue stays dark the majority of the months in the high summer time and when classes are on summer break. The arena features 19,500 square feet of column free exhibition space. The floor can be designed to accommodate up to 134 display booths (8' x 10'). In addition to exhibition space, the facility offers a Skybox Function Room which has banquet seating for 80, cocktail reception style for 175 and theater seating for 150. This room also has a private kitchen and two private restrooms as well as an in-house public address system. The multipurpose arena incorporates 14 sky boxes at an average price of $15,000 for 6-seat boxes and $20,000 for 8-seat boxes. Both sky box options include three to four parking passes, tickets to all UNH athletic events with the first right to purchase all non-athletic events and championship tournaments, refrigerator, catering, and a function room area with a television. Sky boxes are also offered on per event basis including tickets ranging from $600 to $800 for men’s ice hockey games and ranging from $300 to $400 for all other UNH athletic events. Club seats are also sold on an individual basis for approximately $1,700 including tickets to UNH regular season home athletic events. Amenities include refrigerator access in each box, one parking space, catering and first right of refusal for all other arena events. Total development costs for the Whittemore Center Arena amounted to $30 million in 1995. Project costs were funded from four sources including proceeds from tax-exempt revenue bonds, fund raising, service contracts and internally designated funds of the University. The business plan to fund the annual debt service, cost of operating the facility and repairs relies upon six general funding sources or operating income: (1) a mandatory student fee; (2) a fixed sum from annual men’s hockey ticket receipts; (3) promotional fees from a pouring rights agreement; (4) net proceeds for special events through leases with promoters, artists and artist’s agents related to concerts, family shows, non-intercollegiate sporting events, etc.; (5) additional income is generated from hourly ice rentals; room rentals; concession sales; novelty sales; and an add-on amount to the ticket price of special events that is dedicated to cover facility costs; and, (6) promotional agreements from local businesses generate revenue.

V. Comparable Facilities (cont’d)
63
William D. Mullins Memorial Center
The William D. Mullins Memorial Center opened in February 1993 and is located in Amherst, Massachusetts on the campus of the University of Massachusetts (UMass), Amherst. The multi-purpose indoor facility has a capacity of 9,493 for basketball, 8,389 for hockey and upwards of 10,500 for staged concerts. The venue is owned by the University of Massachusetts and is privately managed by Global Spectrum. The Mullins Memorial Center serves as the home for UMass men’s and women’s basketball teams, as well as the men’s hockey team. As shown in Exhibit V-16, the Center hosted approximately 107 total events in fiscal year 2003 including convocations, commencements, cultural events, conferences, concerts and fine arts productions. As shown, in a recent fiscal year, the Center hosted approximately 49, or 46 percent, university related sporting events. The remaining 54 percent of facility events consisted of five concerts, two family shows, three other sporting events, 24 conferences, six tradeshows and 11 miscellaneous other events. The Mullins Center is also scheduled to host the 2005 NCAA Men's Ice Hockey Northeast Regional. The base rental structure for ticketed events is the greater of $3,500 or an average of 12 percent of gross receipts after applicable taxes and facility charge, per day. The Mullins Center does not currently incorporate premium seating.
Number of % ofEvents Events EventsCollegiate Tenant 49 46%Concerts 5 5%Family Shows 2 2%Other Sporting Events 3 3%Trade / Consumer Shows 5 5%Other (1) 43 40%
Tenant Events 49 46%Non-Tenant Events 58 54%Total 107 100%
Source: CSL research and facility interviews.
Event Days and PerformancesWilliam D. Mullins Center
(1) Other includes 26 conferences, two banquets, four rehearsals, five camps and six miscellaneous events.
Exhibit V-16
Location: Amherst, MAYear Opened: 1993Capacity: 8,389 (hockey), 10,500 (concert)Size: 258,000 sq. ft (1)
Cost: $48 millionFunding: 100% (public)Ownership: U of Mass - AmherstManagement: SMGTotal Events: 107Total Paid Attd.: NA(1) Includes the adjacent practice facility ice sheet.
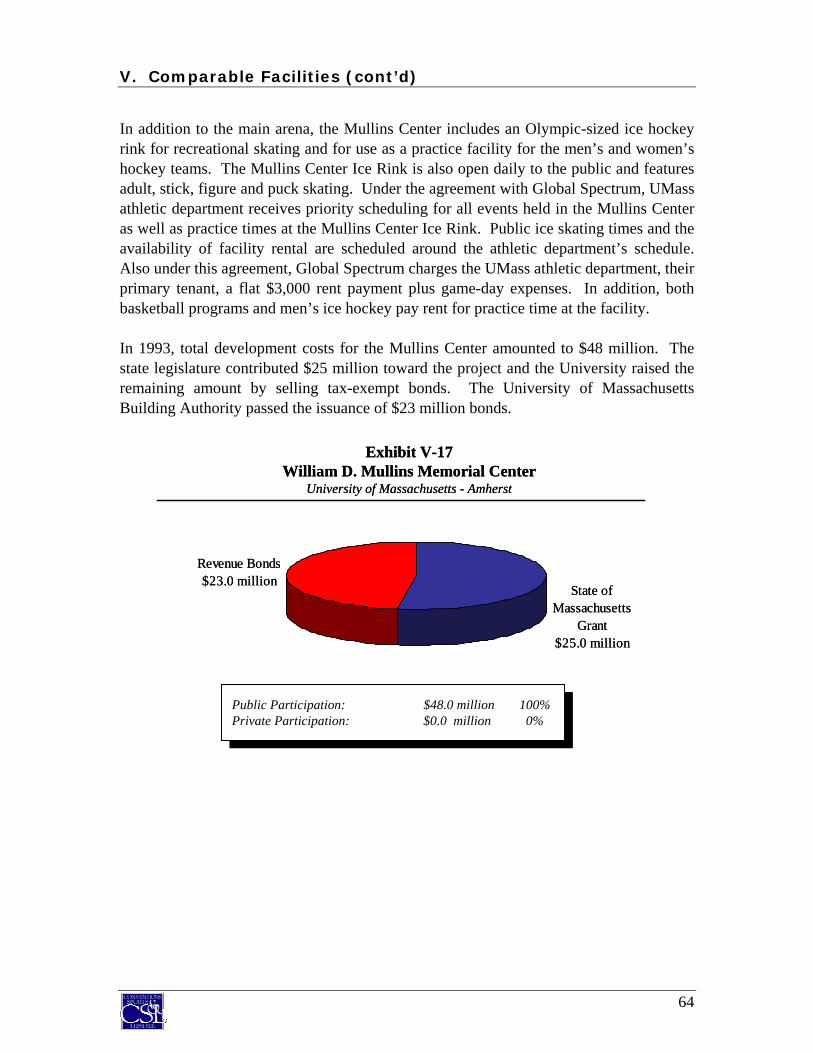
V. Comparable Facilities (cont’d)
64
In addition to the main arena, the Mullins Center includes an Olympic-sized ice hockey rink for recreational skating and for use as a practice facility for the men’s and women’s hockey teams. The Mullins Center Ice Rink is also open daily to the public and features adult, stick, figure and puck skating. Under the agreement with Global Spectrum, UMass athletic department receives priority scheduling for all events held in the Mullins Center as well as practice times at the Mullins Center Ice Rink. Public ice skating times and the availability of facility rental are scheduled around the athletic department’s schedule. Also under this agreement, Global Spectrum charges the UMass athletic department, their primary tenant, a flat $3,000 rent payment plus game-day expenses. In addition, both basketball programs and men’s ice hockey pay rent for practice time at the facility. In 1993, total development costs for the Mullins Center amounted to $48 million. The state legislature contributed $25 million toward the project and the University raised the remaining amount by selling tax-exempt bonds. The University of Massachusetts Building Authority passed the issuance of $23 million bonds.
Revenue Bonds$23.0 million
State of Massachusetts
Grant$25.0 million
Exhibit V-17William D. Mullins Memorial Center
University of Massachusetts - Amherst
Public Participation: $48.0 million 100%Private Participation: $0.0 million 0%
Public Participation: $48.0 million 100%Private Participation: $0.0 million 0%

V. Comparable Facilities (cont’d)
65
Summary The following exhibit summarizes key characteristics of the comparable venues including their location, year built, seating capacities, building cost and funding, premium seating, and other operational characteristics.
Agganis University of Miami Thomas M. Ted ConstantArena Convocation Center Resch Center Ryan Center Convocation Center
Location Boston, MA Coral Gables, FL Green Bay, WI Kingston, RI Norfolk, VAYear Opened 2005 2003 2002 2002 2002
PopulationMSA 6,181,628 2,376,330 236,147 995,963 1,609,109Per Arena 618,163 339,476 236,147 497,982 321,822
Seating CapacityFixed 6,300 7,000 9,877 7,571 8,639Total 8,000 10,000 10,200 9,000 9,520
Building Cost ($M) $97.0 $48.0 $49.0 $54.0 $45.0Public Funding 41.2% 0.0% 89.0% 72.0% 89.0%Private Funding 58.8% 100.0% 11.0% 28.0% 11.0%
Premium SeatingLuxury Suites 29 25 25 8 16Average Annual Price $16,900 $30,000 $32,500 $250 - $400 (1) $25,000Club Seats 1,020 0 608 0 862Average Annual Price $1,500 -- $1,000 -- $3,000
Tenants University University University, AF2, USHL University UniversityTenant Events 45 35 56 35 41Non-Tenant Events 47 50 94 36 67Total Events 92 85 150 71 108Owner Boston University University of Miami Brown County University of Rhode Island Old Dominion UniversityOperator Boston University Global Spectrum PMI Global Spectrum Global Spectrum
Comparable Arena ComparisonExhibit V-18
Paul Tsongas Whittemore William D. Mullins Arena Liacouras Center Center Arena Memorial Center Average
Location Lowell, MA Philadelphia, PA Durham, NH Amherst, MA --Year Opened 1998 1997 1995 1993 2000
PopulationMSA 6,181,628 5,185,565 1,317,496 614,304 2,744,241Per Arena 321,822 740,795 658,748 307,152 449,123
Seating CapacityFixed 6,496 10,200 6,086 8,389 7,840Total 8,000 10,500 7,381 10,500 9,233
Building Cost ($M) $28.0 $107.0 $30.0 $48.0 $56.2Public Funding 85.7% 39.3% NA 100.0% 64.5%Private Funding 14.3% 60.7% NA 0.0% 35.5%
Premium SeatingLuxury Suites 0 10 14 0 18Average Annual Price -- $32,500 $17,500 -- $25,733Club Seats 250 0 100 0 568Average Annual Price $350 -- $3,000 -- $1,770
Tenants University, AHL University University University --Tenant Events 68 28 34 49 43Non-Tenant Events 82 88 90 58 68Total Events 150 116 124 107 111Owner City of Lowell Temple University University of New Hampshire University of Massachusetts --Operator SMG Global Spectrum Global Spectrum SMG --
(1) Suites are sold on a per event/game basis for $250 for URI football and women's basketball and $400 for URI men's basketball and concerts. Suite prices exclude event tickets.N/A: Not AvailableSource: CSL research, facility management, and Claritas Inc.

V. Comparable Facilities (cont’d)
66
In summary, the findings regarding the proposed arena in comparison to other comparable venues include the following:
• Comparable facilities had an average capacity of approximately 7,840 fixed seats and a total capacity of 9,233 seats (fixed plus portable).
• The average total development cost of the recently built comparable facilities was a total of approximately $56.2 million. On average, the level of private funding participation for these facilities averaged 35.5 percent of the total costs while the remaining 64.5 percent of funding was derived from various public sources.
• Ownership of comparable venues tends to be primarily through a university or a municipal entity. However, private contract management firms, such as Global Spectrum or SMG, which specialize in arena management, dominate daily operations and management of comparable facilities.
• Comparable arenas hosted an average of 111 events, ranging from a low of 71 events at the Ryan Center in Kingston, Rhode Island to a high of 150 events at both the Resch Center in Green Bay, Wisconsin and Paul Tsongas arena in Lowell, Massachusetts. Facilities with the highest event activity hosted both collegiate and minor league sports tenants.
• In terms of non-tenant events, comparable facilities hosted an average of 68 events, ranging from a low of 36 events at the Ryan Center to a high of 94 events at the Resch Center. Non-tenant events typically included concerts, family shows, high school sports, graduations, flat floor shows, and other miscellaneous events.
• Seven out of nine comparable facilities have private suites. The average number of private suites was 18 at facilities with private suites, ranging from a low of 8 to a high of 29. The average annual suite price was $25,733.
• Five out of nine comparable facilities have club seats. The average number of club seats was 568 at facilities with club seats, ranging from a low of 100 to a high of 1,020. The average annual club seat price was $1,770.
While comparisons with the facilities described in detail within this section may be useful, the actual physical characteristics and ultimate operational philosophy adopted by a new arena in Burlington will depend on the specific needs and preferences of the facility operators. In developing a building program, estimating potential demand and a utilization plan for a new facility, the review of comparable facilities is considered together with an assessment of local market characteristics, competitive facilities and potential user interviews.

CONFIDENTIAL DRAFTFor Discussion Purposes Only
For Internal Use
Executive Summary
I. Introduction
II. Review of Ernst & Young Study
III. Local Market Analysis
IV. Competitive Facilities
V. Comparable Facilities
VI. Market Surveys
VII. Estimated Event Demand
VIII. Building Program and Cost
IX. Estimated Financial Operations
X. Estimated Economic and Fiscal Impacts
XI. Management Options
XII. Funding Options
VI. Market Surveys

VI. Market Surveys
67
As part of the evaluation of the viability of a multi-purpose arena, surveys were completed with local corporations, households and UVM students. Random surveys were conducted via telephone and email to determine interest and opinions related to the potential development of a multi-purpose arena including:
• awareness of arena project; • support for arena project; • interest in attending events at the arena; and, • interest in premium seating and support for various potential funding sources.
A total of 723 surveys were completed. Exhibit VI-1 presents a breakdown of the population and corresponding completed surveys by local corporations, local households and UVM students.
Awareness of Proposed Arena Survey respondents were asked if they were aware, prior to the survey, that Governor James Douglas had formed the Vermont Arena Commission in order to study the viability of a multi-purpose sports and entertainment arena to be located on the UVM campus. Exhibit VI-2 on the following page summarizes their responses.
Exhibit VI-1Market Survey Overview
CompletedPopulation Surveys
Corporations 1 330 116General Public (Households) 2 78,763 250Students 3 7,500 357
Total 723
1) Corporations include corporate headquarters with $5 million or more in sales or corporate branches with 25 or more employees located in Burlington MSA.2) Households located in Burlington MSA.3) UVM students
Note: Corporate and houshold surveys were conducted via telephone. Student surveys were conducted via email.

VI. Market Surveys (cont’d)
68
As illustrated in the exhibit, approximately 56 percent of corporate respondents in the Burlington MSA indicated that they were aware of the proposed arena project compared to 34 percent of general public respondents from the Burlington MSA and 27 percent of UVM student respondents. Overall, there is not currently a significant awareness of the proposal for a new arena on the UVM campus. The low level of awareness is to be expected given the limited public exposure the project has received to date. While the low level of awareness of the proposed arena can be viewed as neither a positive or a negative at this stage of the process, it is important to realize that the results of the market surveys are based on attitudes and opinions that have been developed with limited or no information regarding the proposed arena. It is important to note that as the project planning continues to move forward and information is disseminated to the public regarding the arena project, attitudes and opinions presented herein could change. Attitude Towards Potential Arena Development Respondents were then asked to characterize their attitude towards the development of a multi-purpose arena on the UVM campus. Exhibit VI-3 summarizes their responses.
Exhbit VI-2Awareness of Proposed Arena Project
56%
34%
27%
0%
10%
20%
30%
40%
50%
60%
Corporations General Public Students

VI. Market Surveys (cont’d)
69
As illustrated in the exhibit, a majority of respondents indicated a positive attitude towards the development of a multi-purpose arena on the UVM campus. Specifically, 72 percent of corporations, 61 percent of the general pubic and 58 percent of UVM students have a positive attitude towards arena development. Limited negative attitudes toward arena development were reported by local corporations and the general public. However, UVM students expressed the largest negative attitude towards arena development, with approximately 28 percent of students being negative towards arena development on the UVM campus. Interest in Attending Events at New Arena Respondents were asked to describe their interest in attending events at a new arena if it were built on the UVM campus. Exhibit VI-4 on the following page summarizes their responses. As illustrated in the exhibit, interest in attending sports or entertainment events at a new arena on the UVM campus is high. Specifically, 88 percent of corporate respondents, 81 percent of general public respondents and 80 percent of UVM student respondents indicated a positive interest in attending future events at a new arena.
Exhbit VI-3Awareness of Proposed Arena Project
58% 14% 28%
61% 29% 9% 2%
72% 24% 4% 1%
0% 10% 20% 30% 40% 50% 60% 70% 80% 90% 100%
Students
General Public
Corporations
Positive Neutral Negative Don't Know
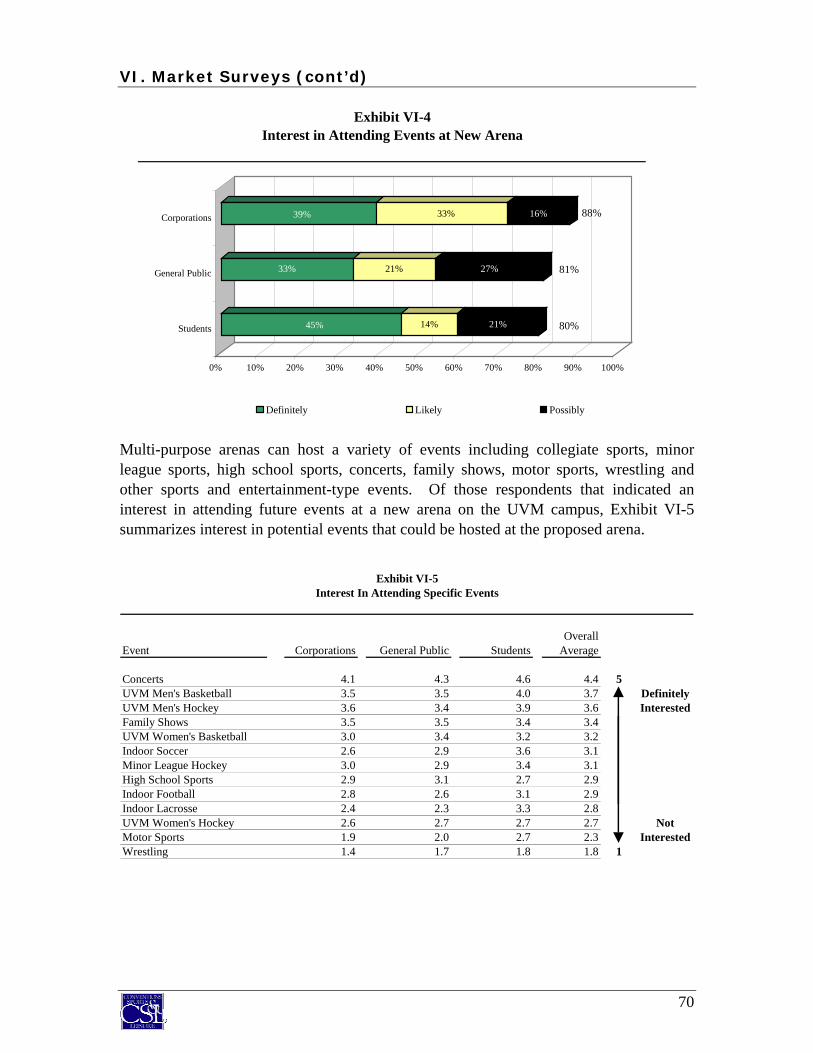
VI. Market Surveys (cont’d)
70
Multi-purpose arenas can host a variety of events including collegiate sports, minor league sports, high school sports, concerts, family shows, motor sports, wrestling and other sports and entertainment-type events. Of those respondents that indicated an interest in attending future events at a new arena on the UVM campus, Exhibit VI-5 summarizes interest in potential events that could be hosted at the proposed arena.
Exhibit VI-4Interest in Attending Events at New Arena
45% 14% 21%
33% 21% 27%
39% 33% 16%
0% 10% 20% 30% 40% 50% 60% 70% 80% 90% 100%
Students
General Public
Corporations
Definitely Likely Possibly
88%
81%
80%
Exhibit VI-5Interest In Attending Specific Events
OverallEvent Corporations General Public Students Average
Concerts 4.1 4.3 4.6 4.4 5UVM Men's Basketball 3.5 3.5 4.0 3.7 DefinitelyUVM Men's Hockey 3.6 3.4 3.9 3.6 InterestedFamily Shows 3.5 3.5 3.4 3.4UVM Women's Basketball 3.0 3.4 3.2 3.2Indoor Soccer 2.6 2.9 3.6 3.1Minor League Hockey 3.0 2.9 3.4 3.1High School Sports 2.9 3.1 2.7 2.9Indoor Football 2.8 2.6 3.1 2.9Indoor Lacrosse 2.4 2.3 3.3 2.8UVM Women's Hockey 2.6 2.7 2.7 2.7 NotMotor Sports 1.9 2.0 2.7 2.3 InterestedWrestling 1.4 1.7 1.8 1.8 1

VI. Market Surveys (cont’d)
71
As illustrated in the exhibit, respondents were asked to rank each event on a scale of 1 to 5, with 5 being “definitely interested” in attending an event and 1 being “not interested” in attending an event. The events receiving the high rankings included concerts (average ranking: 4.4), UVM men’s basketball (average ranking: 3.7), UVM men’s hockey (average ranking: 3.6) and family shows (average ranking 3.4). The least desired events included wrestling (average ranking: 1.8) and motor sports (average ranking 2.3). Interest in several minor league sports was tested including hockey, soccer, football and lacrosse. Interest in indoor soccer ranked the highest among respondents (average ranking: 3.1) followed by minor league hockey (average ranking 3.1). The least preferred minor league sports tested was indoor lacrosse (average ranking 2.8). Interest in Private Boxes Private boxes are exclusive seating areas that typically command the highest ticket price in the arena. Because private boxes are expensive relative to other arena seating, companies generally comprise the market for private boxes. As such and for purposes of this study, only corporate respondents were asked to characterize their interest in leasing a private box at a new arena on the UVM campus. Corporate respondents were informed that boxes would be located at the top of the seating bowl with excellent sightlines to the event floor. Respondents were further informed that private boxes, which would not be fully enclosed, but would rather be in an “open-air” environment, could include seating for approximately 10 to 14 people and provide amenities such as tickets to all UVM sporting events held at the arena, preferred parking, availability of alcohol, catering services, private restrooms, TV monitors and access to an exclusive club in the arena.
Exhibit VI-6Private Box Example

VI. Market Surveys (cont’d)
72
Exhibit V-7 summarizes corporate respondents interest in leasing a private box at a new arena on the UVM campus at annual prices of $35,000, $25,000 or $15,000 per suite, including the cost of tickets to UVM sporting events.
As illustrated in the exhibit, positive interest in private boxes ranged from 18 percent at $35,000 per private box to 26 percent at $15,000 per private box. It should be noted that very few respondents recorded a high degree of interest (“definite interest”) in private boxes. In the collegiate environment, it is not uncommon for companies and/or individuals (typically high-end donors) to share private boxes with one another to defray the cost and to enhance social interaction. Approximately 80 percent of the corporate respondents indicating an interest in leasing a private box at a new arena indicated that they would likely share a box with one or more other parties. The average number of parties per shared box was 2.9. Based on an extrapolation of the survey results, Exhibit VI-8 summarizes the estimated demand and resulting revenue potential for private boxes in a new multi-purpose arena on the UVM campus. It should be noted that while only corporate respondents were asked about their interest in suites, the demand estimates presented herein include an assumption for demand from individuals (i.e. individuals could account for 1/3 of private box market).
Exhibit VI-7Interest in Private Suites
4% 12% 10%
1% 4% 17%
1%1% 16%
0% 5% 10% 15% 20% 25% 30% 35%
$15,000
$25,000
$35,000
Definitely Likely Possibly
18%
22%
26%

VI. Market Surveys (cont’d)
73
As illustrated above, it is estimated that there is demand for 3 to 9 private boxes, depending upon the annual price. Based on these results, it is estimated that 9 private boxes could be sold at an average price of $15,000 per box. Interest in Club Seats Survey respondents were asked to characterize their interest level in club seats. Club seats were described to survey respondents as being located in prime areas in the new arena and would include tickets to both UVM men’s hockey and basketball home games. Club seats were further described as potentially having amenities such as preferred parking and access to a private club inside the arena that would have upscale food and beverage service, availability of alcohol and private restrooms. Exhibit VI-9 provides an illustrative example of club seats.
Exhibit VI-8Estimated Private Box Demand
Note: Demand includes an assumption for potential demand from individuals.
9
34
0
1
2
3
4
5
6
7
8
9
10
$35,000 $25,000 $15,000$0$10,000$20,000$30,000$40,000$50,000$60,000$70,000$80,000$90,000$100,000$110,000$120,000$130,000$140,000$150,000
Demand Revenue
Private Boxes
AnnualRevenue
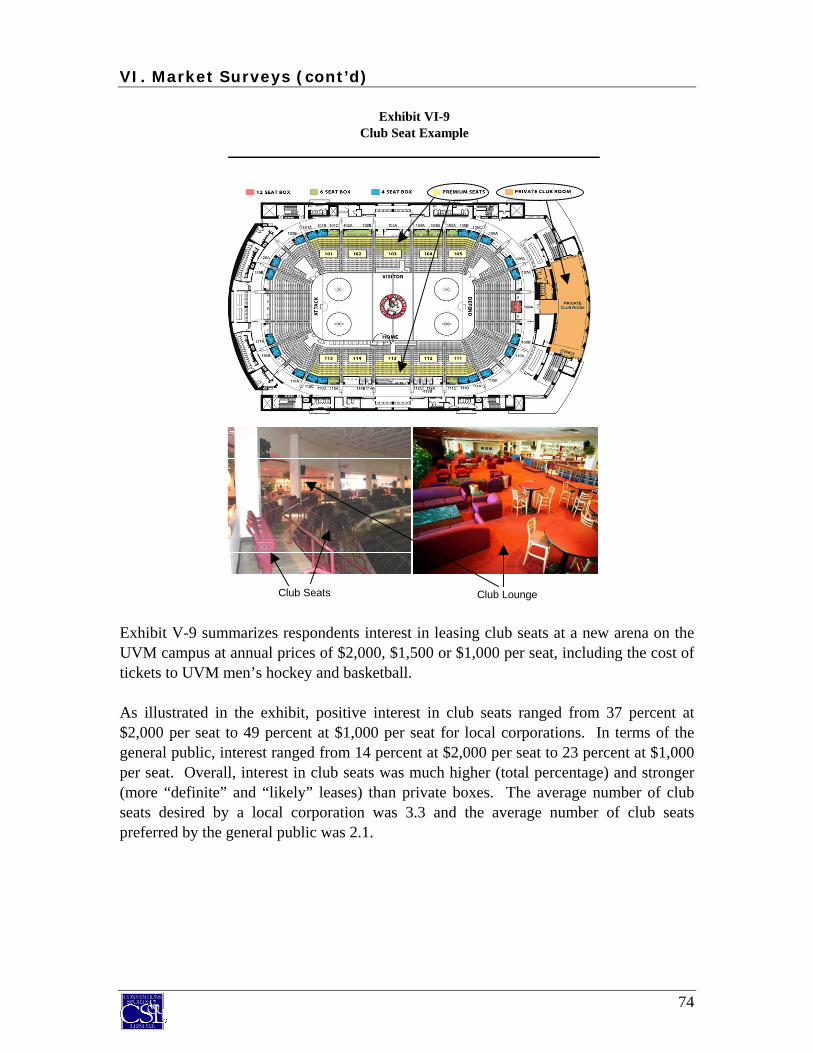
VI. Market Surveys (cont’d)
74
Exhibit V-9 summarizes respondents interest in leasing club seats at a new arena on the UVM campus at annual prices of $2,000, $1,500 or $1,000 per seat, including the cost of tickets to UVM men’s hockey and basketball. As illustrated in the exhibit, positive interest in club seats ranged from 37 percent at $2,000 per seat to 49 percent at $1,000 per seat for local corporations. In terms of the general public, interest ranged from 14 percent at $2,000 per seat to 23 percent at $1,000 per seat. Overall, interest in club seats was much higher (total percentage) and stronger (more “definite” and “likely” leases) than private boxes. The average number of club seats desired by a local corporation was 3.3 and the average number of club seats preferred by the general public was 2.1.
Exhibit VI-9Club Seat Example
Club Seats Club Lounge

VI. Market Surveys (cont’d)
75
Based on an extrapolation of the survey results, Exhibit VI-11 summarizes the estimated demand and resulting revenue potential for club seats in a new multi-purpose arena on the UVM campus.
Exhibit VI-10Interest in Private Suites
4% 5% 14%
2% 3% 11%
2% 2% 10%
11% 19% 19%
3% 17% 22%
2% 13% 22%
0% 5% 10% 15% 20% 25% 30% 35% 40% 45% 50% 55%
$1,000
$1,500
$2,000
$1,000
$1,500
$2,000
Definitely Likely Possibly
37%
43%
49%
14%
16%
23%
Corporations
General Public
Exhibit VI-11Estimated Club Seat Demand
660
270
470
0
100
200
300
400
500
600
700
$2,000 $1,500 $1,000$300,000
$350,000
$400,000
$450,000
$500,000
$550,000
$600,000
$650,000
$700,000
$750,000
$800,000
Demand Revenue
Club Seats
AnnualRevenue

VI. Market Surveys (cont’d)
76
As illustrated in the exhibit, it is estimated that there is demand for 270 club seats if they are priced at $2,000 per seat to upwards of 660 club seats if they are priced at $1,000 per seat. Based on these results, it is estimated that 470 club seats could be sold at an average price of $1,500 per seat. Interest in Donor Seating In collegiate athletics, many athletic programs offer donor seating programs as a method to secure prime seats in an athletic facility. Donor seating programs vary significantly among athletic programs, but essentially are based on either assigning seats based on priority points accumulated for amount of giving and length of giving or by assigning a donation value for a specific seat.
For purposes of this study, interest in priority seating programs in a new arena were tested for UVM men’s hockey, UVM men’s basketball and UVM women’s basketball. Exhibit VI-13 on the following pages summarizes the interest levels in donor seating, assuming seating donations of $500 $300 or $100 per seat.
Exhibit VI-12Donor Seat Example

VI. Market Surveys (cont’d)
77
The corporate market expressed the most interest in donor seating for UVM men’s hockey with 38 to 46 percent of local corporations reporting an interest annual donations ranging from $100 to $500 per seat for prime seats. Corporate interest in UVM men’s basketball was slightly lower, ranging from 33 to 42 percent, while corporate interest in women’s basketball ranged from 22 to 28 percent. The general public’s interest in donor seating was lower than the corporate community, ranging from 13 to 21 percent for UVM men’s hockey, 12 to 22 percent for UVM men’s basketball and 7 to 15 percent for UVM women’s basketball.
Exhibit VI-13Interest in Donor Seating
5% 2% 8%
3% 1% 7%
1%1% 5%
4% 10% 14%
1% 3% 21%
3% 19%
7% 6% 9%
2% 3% 11%
2% 2% 8%
12% 15% 15%
3% 11% 22%
3% 5% 25%
7% 8% 6%
2% 4% 10%
1% 2% 10%
16% 16% 14%
5% 11% 27%
3% 7% 28%
0% 5% 10% 15% 20% 25% 30% 35% 40% 45% 50% 55%
$100
$300
$500
$100
$300
$500
$100
$300
$500
$100
$300
$500
$100
$300
$500
$100
$300
$500
Definitely Likely Possibly
38%
43%
46%
13%
16%
21%
Corporations
General Public
Corporations
General Public
Corporations
General Public
UV
M W
omen
's B
aske
tbal
lU
VM
Men
's B
aske
tbal
lU
VM
Men
's H
ocke
y
33%
36%
42%
12%
16%
22%
22%
25%
28%
7%
11%
15%
Annual Donation

VI. Market Surveys (cont’d)
78
Based on an extrapolation of the survey results, Exhibit VI-14 summarizes the estimated demand and resulting revenue potential for donor seating in a new multi-purpose arena on the UVM campus for UVM men’s hockey, UVM men’s basketball and UVM women’s basketball.
It is estimated that there is demand for 360 donor seats for UVM men’s hockey if they are priced at $500 per seat to upwards of 1,620 donor seats for UVM men’s hockey if they are priced at $100 per seat, potentially generating annual donations of $162,000 to $180,000 annually. It is estimated that there is demand for 370 donor seats for UVM men’s basketball if they are priced at $500 per seat to upwards of 1,200 donor seats for UVM men’s basketball if they are priced at $100 per seat, potentially generating annual donations of $120,000 to $185,000 annually. It is estimated that there is demand for 360 donor seats for UVM women’s basketball if they are priced at $500 per seat to upwards of 770 donor seats for UVM women’s basketball if they are priced at $100 per seat, potentially generating annual donations of $77,000 to $180,000 annually.
Exhibit VI-14Estimated Donor Seat Demand
360
560
1,620
370480
1,200
360
500
770
0
200
400
600
800
1,000
1,200
1,400
1,600
1,800
$500 $300 $100 $500 $300 $100 $500 $300 $100$50,000
$75,000
$100,000
$125,000
$150,000
$175,000
$200,000
Demand Revenue
Donor Seats
AnnualRevenue
UVM Men's Hockey UVM Men's Basketball UVM Women's Basketball

VI. Market Surveys (cont’d)
79
Impact of Alcohol Availability on Premium Seat Demand An important issue related to arenas located on college campuses is whether alcohol is permitted to be sold in the facility. Typically, college-related facilities handle the alcohol issue in one of several ways:
• Forbid consumption of alcohol throughout the facility; • Do not hold a liquor license, but allow private box patrons to bring their own
alcohol into the facility prior to the event day; • Hold a liquor license and sell alcohol in only the premium seating areas (suites or
club lounge) and forbid consumption in general seating areas; and, • Hold a liquor license and sell alcohol throughout the facility.
In order to understand the potential impact that not serving alcohol in premium seating areas could have on potential demand, survey respondents interested in premium seating were asked if they would still purchase premium seating if alcohol were not allowed. Exhibit VI-15 summarizes their responses.
Exhibit VI-15Impact of Alcohol Availability on Premium Seat Demand
59% 41%
69% 31%
0% 20% 40% 60% 80% 100%
General Public
Corporate
Would Still Purchase Wound Not Purchase
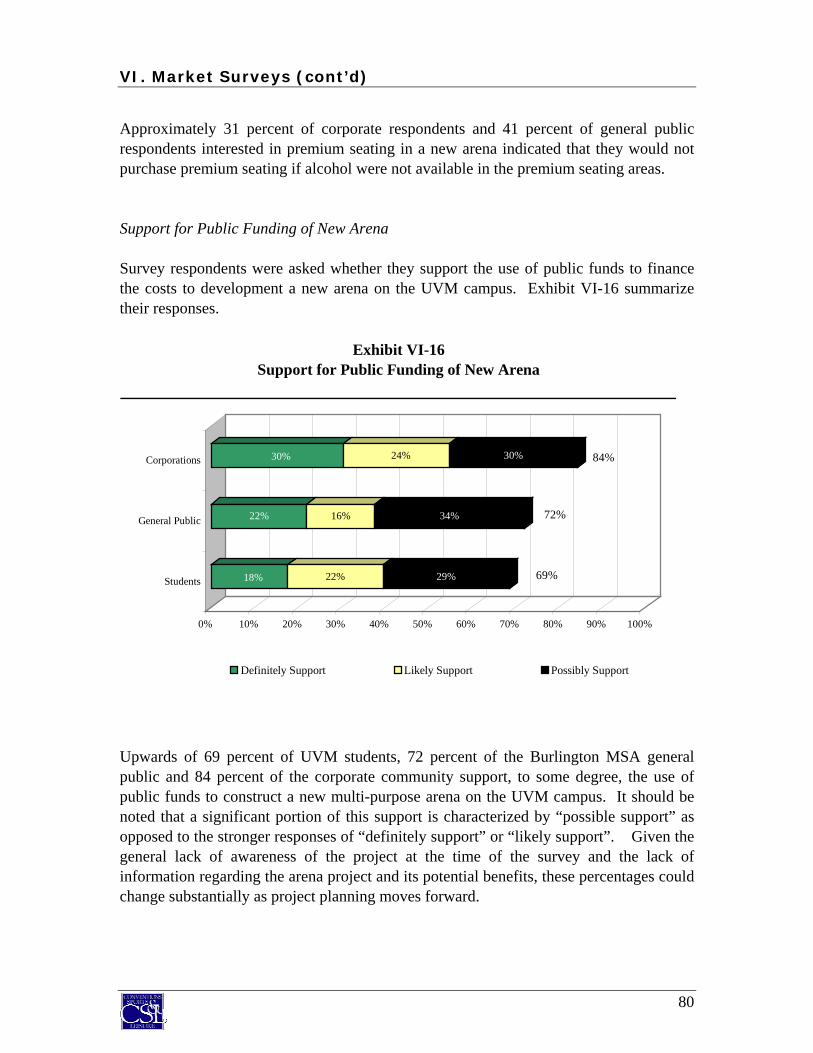
VI. Market Surveys (cont’d)
80
Approximately 31 percent of corporate respondents and 41 percent of general public respondents interested in premium seating in a new arena indicated that they would not purchase premium seating if alcohol were not available in the premium seating areas. Support for Public Funding of New Arena Survey respondents were asked whether they support the use of public funds to finance the costs to development a new arena on the UVM campus. Exhibit VI-16 summarize their responses.
Upwards of 69 percent of UVM students, 72 percent of the Burlington MSA general public and 84 percent of the corporate community support, to some degree, the use of public funds to construct a new multi-purpose arena on the UVM campus. It should be noted that a significant portion of this support is characterized by “possible support” as opposed to the stronger responses of “definitely support” or “likely support”. Given the general lack of awareness of the project at the time of the survey and the lack of information regarding the arena project and its potential benefits, these percentages could change substantially as project planning moves forward.
Exhibit VI-16Support for Public Funding of New Arena
18% 22% 29%
22% 16% 34%
30% 24% 30%
0% 10% 20% 30% 40% 50% 60% 70% 80% 90% 100%
Students
General Public
Corporations
Definitely Support Likely Support Possibly Support
84%
36%
69%
72%

VI. Market Surveys (cont’d)
81
Survey respondents were asked if they would support an increase in the meals and rooms tax, either statewide or on a regionalized basis, to fund arena development costs. Exhibit VI-17 summarizes their support of an increased meals and rooms tax.
As illustrated in the exhibit, approximately 43 percent of UVM students, 48 percent of the Burlington MSA general public and 61 percent of local corporations support, to some degree, an increase in the meals and rooms tax to fund a new arena on the UVM campus. Survey respondents were also asked if they would support an increase in the sales tax, either statewide or on a regionalized basis, to fund arena development costs. Exhibit VI-18 summarizes their support of an increased sales tax.
Exhibit VI-17Support for Use of Meals and Rooms Tax to Fund New Arena
10% 11% 22%
13% 10% 25%
16% 22% 23%
0% 10% 20% 30% 40% 50% 60% 70% 80% 90% 100%
Students
General Public
Corporations
Definitely Support Likely Support Possibly Support
61%
48%
43%

VI. Market Surveys (cont’d)
82
Approximately 42 percent of UVM students, 36 percent of the Burlington MSA general public and 48 percent of local corporations support, to some degree, an increase in the sales tax to fund a new arena on the UVM campus. Support for Student Fees to Fund New Arena UVM student survey respondents were asked whether they would support the use of student fees to finance the development costs associated with a new arena on the UVM campus. Exhibit VI-19 summarize their responses.
Exhibit VI-18Support for Use of Sales Tax to Fund New Arena
9% 9% 24%
8% 8% 20%
8% 16% 24%
0% 10% 20% 30% 40% 50% 60% 70% 80% 90% 100%
Students
General Public
Corporations
Definitely Support Likely Support Possibly Support
48%
36%
42%

VI. Market Surveys (cont’d)
83
The large majority of UVM student surveyed indicated that they would not support an increase in student fees to fund the development of a new multi-purpose arena. Summary A total of 723 random telephone surveys were completed with local corporations, households and UVM students to determine interest and opinions related to the potential development of a multi-purpose arena. Key findings included:
• The majority of respondents indicated a positive attitude regarding the potential development of a new multi-purpose arena. Specifically, 72 percent of corporations, 61 percent of the general public and 58 percent of UVM students have a positive attitude towards arena development.
• Interest in attending sports and entertainment events at a new arena on the UVM campus is high. Specifically, 88 percent of corporate respondents, 81 percent of general public respondents and 80 percent of UVM student respondents indicated an interest in attending future events at a new arena.
• Interest in private boxes at a new arena was limited to moderate with 18 to 26 percent of the corporate community indicating potential interest in private boxes,
Exhibit VI-19Support for Use of Student Fees to Fund New Arena
73%
12%
9%
6%
0% 10% 20% 30% 40% 50% 60% 70% 80%
Wound Not Support
Possibly Support
Likely Support
Definitely Support

VI. Market Surveys (cont’d)
84
depending on the price. Overall, it is estimated that the arena could support 9 private boxes at an average annual price of $15,000 per box.
• Interest in club seats at a new arena was moderate with 37 to 49 percent of the corporate community and 14 to 23 percent of the general public indicating potential interest in club seats, depending on the price. Overall, it is estimated that the arena could support 450 to 500 club seats at an average annual price of $1,000 per seat.
• Interest in a donor (or priority) seating program for UVM sporting events at a new arena was comparable to club seat interest. It is estimated that UVM could generate $440,000 to $545,000 in donor seating revenues annually, assuming donor seating priority is sold separately for men’s hockey, men’s basketball and women’s basketball.
• Approximately 31 percent of the corporate market and 41 percent of the general public market interested in premium seating at anew arena would not purchase premium seating if alcohol were not served in the boxes or in the club lounge.
• Initial support for public funding of a new multi-purpose arena was positive with upwards of 84 percent of the corporate community, 72 percent of the general public and 69 percent of UVM students potential supporting the use of public funds to construct a new arena.
The results of the market surveys are considered together with assessment local market characteristics, competitive facilities in the marketplace, historical operations of comparable facilities and interviews with potential facility users to estimate demand. The remainder of this section presents the market survey results.

CONFIDENTIAL DRAFTFor Discussion Purposes Only
For Internal Use
Executive Summary
I. Introduction
II. Review of Ernst & Young Study
III. Local Market Analysis
IV. Competitive Facilities
V. Comparable Facilities
VI. Market Surveys
VII. Estimated Event Demand
VIII. Building Program and Cost
IX. Estimated Financial Operations
X. Estimated Economic and Fiscal Impacts
XI. Management Options
XII. Funding Options
VII. Estimated Event Demand

VII. Estimated Event Demand
85
The purpose of this section is to estimate the potential event mix and attendance levels that could be attracted to a new multi-purpose arena located on the UVM campus. A variety of factors have been analyzed in order to gauge the ability of a new facility to attract various events, including:
• Event levels and physical characteristics of comparable arenas were used as benchmarks to gain an understanding of the types and number of events typically hosted by similar arenas;
• Competitive facilities in the Burlington and regional market were analyzed to gauge the level of competition present in the market, and to identify strengths and niches that may give the proposed arena an advantage over the competition in attracting events; and,
• Interviews with local, regional and national arena promoters and event organizers as well as with officials from various minor leagues were conducted to obtain opinions on the potential new facility and gauge interest in utilizing the venue.
This information, along with the knowledge of potential event markets, industry trends, and previous experience was used to estimate the number of events that a new multi-purpose arena operating on the UVM campus could potentially attract. Several event types have been considered for potential facility usage at a new multi-purpose arena to be located on the UVM campus. Potential events have been categorized into two types, tenant events and market driven events. Tenant Events Tenant events typically consist of games played by sports teams that are tenants of the venue. Tenant events are usually scheduled well in advance and provide a facility with a predictable level of facility usage. The majority of multi-purpose arenas have at least one sports tenant. Tenant events evaluated as part of this analysis include:
• UVM Sports:
o Men’s Hockey;
o Men’s Basketball; and,
o Women’s Basketball.
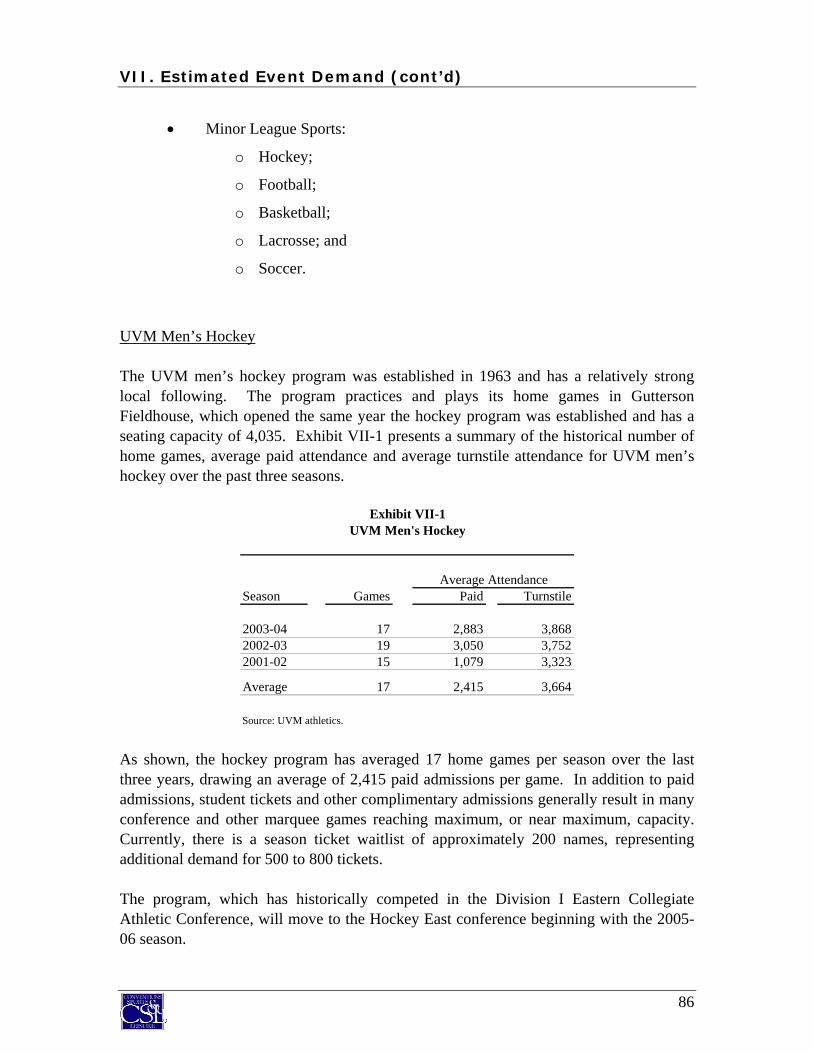
VII. Estimated Event Demand (cont’d)
86
• Minor League Sports:
o Hockey;
o Football;
o Basketball;
o Lacrosse; and
o Soccer.
UVM Men’s Hockey The UVM men’s hockey program was established in 1963 and has a relatively strong local following. The program practices and plays its home games in Gutterson Fieldhouse, which opened the same year the hockey program was established and has a seating capacity of 4,035. Exhibit VII-1 presents a summary of the historical number of home games, average paid attendance and average turnstile attendance for UVM men’s hockey over the past three seasons.
As shown, the hockey program has averaged 17 home games per season over the last three years, drawing an average of 2,415 paid admissions per game. In addition to paid admissions, student tickets and other complimentary admissions generally result in many conference and other marquee games reaching maximum, or near maximum, capacity. Currently, there is a season ticket waitlist of approximately 200 names, representing additional demand for 500 to 800 tickets. The program, which has historically competed in the Division I Eastern Collegiate Athletic Conference, will move to the Hockey East conference beginning with the 2005-06 season.
Exhibit VII-1UVM Men's Hockey
Average AttendanceSeason Games Paid Turnstile
2003-04 17 2,883 3,8682002-03 19 3,050 3,7522001-02 15 1,079 3,323
Average 17 2,415 3,664
Source: UVM athletics.

VII. Estimated Event Demand (cont’d)
87
For purposes of this analysis, it is estimated that UVM hockey will represent 18 to 20 annual events at a new arena and could draw approximately 3,700 paid admissions per game and 4,750 turnstile attendees per game in a stabilized year of operations. This represents a significant increase over recent attendance levels and is attributed to a variety of factors including but not limited to an increase in seating capacity to accommodate high demand games, accommodation of the season ticket wait list, historical attendance for the Hockey East Conference, and the general attendance impact associated with new arenas. The weighted average ticket price for the men’s hockey program was $13.10 in 2003. Based on analysis of ticket price changes for other sports tenants moving into new buildings coupled with inflation, it is estimated that the average ticket price for UVM men’s hockey in a new arena will be approximately $17.40 in 2008. For purposes of this analysis, it is assumed that the men’s hockey program would host a majority of its practices on the attached ice sheet or at Gutterson Fieldhouse, using the main ice surface of the new arena only for games and game-day skate sessions. This would allow the proposed arena to maximize its event potential for other events. Lease agreements between UVM and the building owner should establish priority for events and practices. It should be noted that UVM athletic officials do not intend for women’s hockey to become a tenant in the new arena. As the program matures and, if demand warrants at a later date, consideration will be given to moving the women’s hockey games to the new arena. UVM Men’s Basketball The UVM men’s basketball program was established in 1900 and competes in the Division I America East Conference. The program practices and plays its home games in Patrick Gymnasium, which has a seating capacity of 3,228. Exhibit VII-2 on the following page presents a summary of the historical number of home games played, average paid attendance and average turnstile attendance for UVM men’s basketball over the past three seasons.

VII. Estimated Event Demand (cont’d)
88
As depicted, the men’s basketball program has averaged 12 home games per season over the last three years, drawing an average of 1,410 paid admissions and 2,339 turnstile attendees per game. For purposes of this analysis, it is estimated that UVM men’s basketball will represent 12 annual events at a new arena and could draw approximately 1,800 paid admissions per game and 2,700 turnstile attendees per game. This represents a moderate increase over recent attendance levels at Patrick Gymnasium and represents the general attendance impact associated with new arenas. The average ticket price for the men’s basketball program was $6.41 in 2003. Based on analysis of ticket price changes for other sports tenants moving into new buildings coupled with inflation, it is estimated that the average ticket price for UVM men’s basketball in a new arena will be approximately $8.60 in 2008. It is assumed that men’s basketball practices would remain at Patrick Gymnasium with the exception of day of game shooting practice. UVM Women’s Basketball The UVM women’s basketball program was established in 1979 and competes in the Division I America East Conference. The program practices and plays its home games in Patrick Gymnasium. Exhibit VII-3 presents a summary of the historical number of home games played, average paid attendance and average turnstile for UVM women’s basketball over the past three seasons.
Exhibit VII-2UVM Men's Basketball
Average AttendanceSeason Games Paid Turnstile
2003-04 12 1,617 2,7072002-03 12 1,297 1,9552001-02 12 1,317 2,354
Average 12 1,410 2,339
Source: UVM athletics.

VII. Estimated Event Demand (cont’d)
89
As depicted, the women’s basketball program has averaged 12 home games per season over the last three years, drawing an average of 924 paid admissions and 1,362 turnstile attendees per game. For purposes of this analysis, it is estimated that UVM women’s basketball will represent 12 annual events at a new arena and could draw approximately 1,200 paid admissions per game and 1,600 turnstile attendees per game. This represents a moderate increase over recent attendance levels at Patrick Gymnasium and represents the general attendance impact associated with new arenas. The average ticket price for the women’s basketball program was $6.10 in 2003. Based on analysis of ticket price changes for other sports tenants moving into new buildings coupled with inflation, it is estimated that the average ticket price for UVM men’s basketball in a new arena will be approximately $8.10 in 2008. It is assumed that women’s basketball practices would remain at Patrick Gymnasium with the exception of day of game shooting practice.
Exhibit VII-3UVM Women's Basketball
Average AttendanceSeason Games Paid Turnstile
2003-04 13 936 9362002-03 11 1,046 1,3662001-02 12 799 1,819
Average 12 924 1,362
Source: UVM athletics.

VII. Estimated Event Demand (cont’d)
90
Minor League Hockey Given the substantial interest in hockey in the local and regional area, a minor league hockey team could potentially become a tenant in the multi-purpose arena. There are five minor hockey leagues and one Tier I junior league based in the U.S., consisting of varying degrees of skill and geographic locations, including:
• American Hockey League; • Central Hockey League; • ECHL; • United Hockey League; • United States Hockey League; and, • Western Hockey League.
Interviews with various minor hockey leagues indicate that the ECHL may be the most suitable for the market. As with any potential minor league tenant, the ability to attract a minor league team will be dependent on many factors including, but not limited to providing an appropriate facility, identifying a local and/or existing ownership, providing favorable lease terms to the franchise and meeting certain season ticket and/or sponsorship sales thresholds, among other factors.
ECHL The ECHL, formerly known as the East Coast Hockey League, is a premier AA hockey league that has been in existence since 1988. The ECHL is comprised of 28 teams. Historically, teams were primarily located in the eastern portion of the U.S. However, in ECHL recently added several teams from the now defunct West Coast Hockey League. As a result, ECHL franchises are now located throughout the U.S. Each ECHL team has a 72-game (36 home) regular season schedule, spanning late October through early May, culminating in the Kelly Cup championship in late May. Exhibit VII-4 on the following page provides an overview of the ECHL’s markets, arenas and attendance.

VII. Estimated Event Demand (cont’d)
91
As shown, the average ECHL market has a population of approximately 986,400. Long Beach, CA with 9,911,500 residents, is the largest market in the league, while Florence, SC is the smallest market with a population of 125,800. The Burlington marketplace would rank as the third smallest in the league during the 2003-04 season. It should be noted that a new franchise will begin play in a new arena in Bloomington, Illinois during the 2005-06 season, which has a market population of approximately 156,000. The average ECHL arena seats 8,930 spectators, with a high capacity of 17,909 at Firstar Center in Cincinnati, Ohio, and a low of 4,050 at the Cambria County War Memorial in Johnston, Pennsylvania. On average, ECHL teams drew approximately 3,904 fans per game during the 2003-04 season, ranging from an average low of 2,204 per game for the Cincinnati Cyclones to a high of 6,214 per game for the Florida Everblades. The average attendance of ECHL teams playing in smaller markets (300,000 residents or less) was 3,244.
Exhibit VII-4ECHL - 2003-04 Season
2003-04Market Hockey Average
Team City Population Arena Capacity Attendance
Long Beach Ice Dogs Long Beach, CA 9,911,500 Long Beach Arena 6,176 2,624San Diego Gulls San Diego, CA 2,960,100 San Diego Sports Arena 12,920 4,772Las Vegas Wranglers Las Vegas, NV 1,774,900 Orleans Arena 7,773 4,981Cincinnati Cyclones Cincinnati, OH 1,675,500 Firstar Center 17,909 2,204Charlotte Checkers Charlotte, NC 1,599,800 Cricket Arena 9,570 4,517Greensboro Generals Greensboro, NC 1,299,000 Greensboro Coliseum 10,388 3,269Greenville Grrrowl Greenville, SC 991,900 Bi-Lo Center 16,000 4,617
^ Fresno Falcons Fresno, CA 971,800 Save Mart Center 13,800 4,742^ Dayton Bombers Dayton, OH 944,800 Nutter Center 9,950 3,461^ Bakersfield Condors Bakersfield, CA 698,700 Bakersfield Centennial Garden 9,000 4,513
Toledo Storm Toledo, OH 618,200 Toledo Sports Arena 5,353 3,799^ South Carolina Stingrays N. Charleston, SC 564,000 North Charleston Coliseum 10,529 5,056
Columbia Inferno Columbia, SC 553,900 Carolina Coliseum 6,231 4,087Augusta Lynx Augusta, GA 491,700 Richmond County Civic Center 6,604 2,980Florida Everblades Estero, FL 477,800 TECO Arena 7,209 6,214Idaho Steelheads Boise, ID 468,700 Bank of America Centre 5,006 4,513Pensacola Ice Pilots Pensacola, FL 429,700 Pensacola Civic Center 8,150 3,617
^ Louisiana Ice Gators Lafayette, LA 390,300 Cajundome 11,384 3,398Texas Wildcatters Beaumont, TX 389,900 Ford Arena 7,500 2,884Reading Royals Reading, PA 383,100 Sovereign Center 7,200 5,371Mississippi Sea Wolves Biloxi, MS 372,300 Mississippi Coast Coliseum 9,150 3,329Atlantic City Boardwalk Bullies Atlantic City, NJ 365,800 Historic Boardwalk Hall 10,500 3,217Trenton Titans Trenton, NJ 361,600 Sovereign Bank Arena 7,850 5,059
^ Peoria Rivermen Peoria, IL 349,300 Peoria Civic Center (Carver Arena) 9,894 5,101Columbus Cottonmouths Columbus, GA 277,900 Columbus Civic Center 7,600 2,524
^ Alaska Aces Anchorage, AK 270,700 Sullivan Arena 6,251 4,340Gwinnett Gladiators Duluth, GA 241,400 The Arena at Gwinnett Center 11,355 5,034Roanoke Express Roanoke, VA 238,400 Roanoke Civic Center 8,706 2,918Johnston Chiefs Johnston, PA 229,500 Cambria County War Memorial 4,050 2,551New Burlington Franchise Burlington, VT 203,700 Proposed New Arena 6,500 n/aWheeling Nailers Wheeling, WV 149,800 Wheeling Civic Center 5,406 2,835Pee Dee Pride Florence, SC 126,800 Florence Civic Center 7,426 2,505
ECHL Average - All Markets 986,400 8,930 3,904ECHL Average - Markets below 300,000 Population 217,275 7,162 3,244
Sources: ECHL and Sales & Marketing Management.^ An intercollegiate athletic program is also a tenant in the building.Notes: Cincinnati Cyclones have requested a voluntary suspension for the 2004/05 season. Columbus Cottonmouths will not play during 2004/05 season but will relocate to Bradenton, FL, and begin play there in 2005/06. A new Bloomington, IL, franchise will begin play in 2005/06 season. A new Victoria, BC franchise will begin play in 2004/05.

VII. Estimated Event Demand (cont’d)
92
It is interesting to note that of the 33 teams in the ECHL, only 4 teams share a facility with a Division I athletics program, none of which field hockey programs. Based on discussions with ECHL officials, ideal markets for an ECHL franchise would range in population from 200,000 to 600,000. According to league representatives, an ECHL franchise generally needs to attract 3,300 paid admissions and 4,000 turnstile attendees per game to breakeven, with ticket prices averaging approximately $10.50. Further, ECHL officials indicated that sponsorships, advertising, promotional and concessions revenue generated to the team needs to be in the range of $400,000 to $500,000 in order to breakeven. Based on discussions with ECHL officials, the league has commitments to expand the league by five franchises over the next few years, including the following markets:
• Burlington, Vermont; • Bloomington, Illinois; • Bradenton, Florida; • Cincinnati, Ohio; and, • Reno, Nevada.
The Lexington Men O’ War were purchased by Minor League Hockey of Vermont, Inc. several years ago with the anticipation that the ECHL franchise would move to Burlington. An agreement to use existing facilities in the Burlington market could not be reached, and, as a result, the Lexington franchise could not relocate and therefore suspended operations after the 2002-03 season. Minor League Hockey of Vermont, Inc. still owns the territorial rights to an ECHL franchise in the Burlington market area, but no progress had been made to date in securing a home facility for an ECHL franchise in the local market. A new arena in the Burlington marketplace with favorable lease terms could bring a Burlington ECHL franchise to fruition. However, an alternative to an ECHL franchise could be an AHL franchise. The AHL is considered a league above the ECHL, with many teams affiliated with a National Hockey League (“NHL”) team. A market with a sophisticated hockey fan base, such as Burlington and the greater Vermont area, may provide a higher level of support for a league more known for developing players for the NHL. The AHL fielded 28 teams during the 2003-04 season, averaging 5,594 attendees per game. The Burlington market would rank as the smallest market among AHL markets, which has an average market size of 1.8 million persons. However, geographic rivalries could be developed with teams such as Manchester Monarchs (New Hampshire); Springfield Falcons (Massachusetts); Worcester Ice Cats (Massachusetts); Albany

VII. Estimated Event Demand (cont’d)
93
River Rats (New York); and Lowell Lock Monsters (Massachusetts), among others. It should be noted that there are limited examples of a minor league hockey franchise and Division I hockey program co-existing in the same facility in a market comparable in size to Burlington. As a result, it is not known what impact, if any, an ECHL team could have on the attendance of UVM men’s hockey program or their ability to generate advertising and sponsorship sales. This is of particular concern in a market with limited resources (population and corporate base), such as Burlington.
Indoor Football There are currently three established indoor football leagues operating in the U.S., including:
• Arena Football League; • af2; and, • National Indoor Football League.
The Arena Football League (“AFL”) is comprised mostly of teams owned by National Football League (“NFL”) owners and play in large arenas in major U.S. cities. The af2 and National Indoor Football League (“NIFL”) are comprised of teams playing in smaller facilities in secondary and tertiary markets. Based on discussions with each of the indoor football leagues, it appears that af2 would potentially be the league most suitable for the Burlington marketplace given the geographic location of existing franchises.
af2 The af2 league played its first season in 2000 with a total of 15 teams. There are currently 20 teams for the upcoming 2005 season. Each af2 franchise plays a 16-game schedule (8 home) spanning from early April through late July, culminating in the ArenaCup championship in late August. Exhibit VII-5 on the following page summarizes af2 markets, arenas and attendance.

VII. Estimated Event Demand (cont’d)
94
The average af2 market has a population of approximately 702,076, with a high of 2,960,100 in San Diego and a low of 211,700 in Laredo. As such, an af2 franchise in Burlington would operate in the smallest market in the league. The league’s arenas range in size from the 18,000-seat Ford Center in Oklahoma City to the 5,500-seat Dodge Arena in Hidalgo, Texas, with a league average capacity of 11,531 seats. On average, af2 teams drew approximately 5,248 fans per game, ranging from an average low of 3,043 per game for the Wichita Stealth to a high of 10,089 per game for the Oklahoma City Yard Dawgz. The average attendance of ECHL teams playing in smaller markets (300,000 or less) was 3,909. According to af2 representatives, the priority of the league is to expand in the West, locate another team in Florida, and expand in the Northeast. A league representative indicated that a new arena in the Burlington area could potentially be an attractive option for future expansion or relocation in the Northeast. Representatives of af2 indicated that a team would need to average 5,000 attendees (with a season ticket base approximating 3,000) at an average ticket price of $14.00 per game in order to breakeven. Also, representatives indicated that a franchise needs to generate
Exhibit VII-5af2 - 2004 Season
2004Market Footaball Average
Team City Population Arena Capacity Attendance
San Diego Riptide San Diego, CA 2,960,100 San Diego Sports Arena 12,000 4,127Memphis Xplorers Southaven, MS 1,160,600 DeSoto County Civic Center 10,000 3,605Oklahoma City Yard Dawgz Oklahoma City, OK 1,109,400 Ford Center 18,000 10,089
^ Louisville Fire Louisville, KY 1,043,200 Freedom Hall 17,200 8,724Central Valley Coyotes Fresno, CA 971,800 Selland Arena 8,912 3,924Birmingham Steeldogs Birmingham, AL 933,200 Birmingham-Jefferson Civic Center 16,850 6,708Hawaiian Islanders Honolulu, HI 899,900 Neal Blaisdell Arena 6,600 3,609
^ Albany Conquest Albany, NY 881,500 Pepsi Arena 14,000 5,883Tulsa Talons Tulsa, OK 823,900 Tulsa Convention Center 7,096 5,161
^ Bakersfield Blitz Bakersfield, CA 698,700 Centennial Garden 8,700 5,398Wilkes-Barre/Scranton Pioneers Willkes-Barre, PA 621,400 First Union Arena 8,300 5,239Rio Grande Valley Dorados Hidalgo, TX 619,800 Dodge Arena 5,500 5,458
^ Arkansas Twisters N. Little Rock, AR 596,200 Alltel Arena 16,058 8,691Wichita Stealth Wichita, KS 519,600 Kansas Coliseum 9,686 3,043Florida Firecats Estero, FL 477,800 TECO Arena 7,082 5,494Manchester Wolves Manchester, NH 396,000 Verizon Wireless Arena 10,019 7,490Bossier City Battlewings Bossier City, LA 392,800 CenturyTel Center 12,400 3,829Quad City Steamwheelers Davenport, IA 358,100 MARK of the Quad Cities 9,200 6,175
^ Tennessee Valley Vipers Huntsville, AL 350,600 Von Braun Center 6,624 5,067^ Peoria Pirates Peoria, IL 349,300 Peoria Civic Center 9,772 4,552
Cape Fear Wildcats Fayetteville, NC 333,600 Crown Coliseum 13,500 4,025^ Macon Knights Macon, GA 331,200 Macon Coliseum 7,182 3,177
Columbus Wardogs Columbus, GA 277,900 Columbus Civic Center 7,600 3,810^ Green Bay Blizzard Green Bay, WI 233,600 Resch Center 11,000 3,683
Laredo Law Laredo, TX 211,700 Laredo Entertainment Center 10,000 4,234Proposed Franchise Burlington, VT 203,700 Proposed Arena 6,500 n/a
af2 Average - 702,076 10,531 5,248
af2 Average - Markets Below 300,000 Population 241,067 9,533 3,909
^ An intercollegiate athletic program is also a tenant in the building.Sources: af2 and Sales & Marketing Management.

VII. Estimated Event Demand (cont’d)
95
$250,000 to $350,000 annually in cash advertising/sponsorships to meet breakeven performance levels. For purposes of this analysis, an af2 franchise was assumed only in the “Best Case” event demand scenario including minor league sports presented in this report. Minor League Basketball Minor league basketball has historically been unstable, with a number of leagues forming, folding, or restructuring from year to year. Currently there are four established minor league basketball leagues in the U.S., which include the National Basketball Development League (NBDL), United States Basketball League (USBL), Continental Basketball Association (CBA), and the American Basketball Association (ABA). The ABA was formed in 2000 and the NBDL began operating in 2001. The remaining two leagues have been in existence for longer periods of time but have historically experienced league and franchise instability. Based on discussions with minor league basketball representatives, a review of the geographic locations of existing teams, and historical support for basketball in the local area, a minor league basketball franchise would not be an ideal tenant for a new multi-purpose arena in Burlington. Indoor Lacrosse Currently, there is one major professional indoor lacrosse league operating in the U.S. The National Lacrosse League (“NLL”) began operations in 1986 as the Major Indoor Lacrosse League. In 2004, NLL fielded 10 teams primarily playing in large markets in National Hockey League (“NHL”) arenas, as NHL owners own most NLL teams. NLL teams play a 16 game regular season schedule (8 home games) that spans from January through April, culminating in the Champions’ Cup in early May. In 2004, average league attendance was 10,088 per game.

VII. Estimated Event Demand (cont’d)
96
Based on discussions with NLL officials, the league would not likely approve a team for the Burlington marketplace given its market size and the league’s tie to NHL markets. However, league representatives indicated they are planning a new league, NL2, which could debut in June 2005 and would serve as a developmental league for NLL. The NL2 would serve as the NLL's minor league, with teams playing in small to medium sized markets across North America. Initially, it is expected that all teams would be concentrated in the northeast to limit travel expenses. NLL officials indicated that Burlington would be an ideal market for a NL2 franchise. League officials anticipate that each NL2 franchise would have an operating budget of approximately $350,000 and would need to average 2,000 paid attendees per game at a ticket price of $10.00 per game to breakeven. The season is anticipated to span 20 games (10 home games) primarily played on weekends from June through August of each year. While the Burlington marketplace may an ideal market for NL2, it is not certain if the league will be formed. Given the uncertainty of the NL2 at the time of this report and the lack of any league operating history, an NL2 franchise has not been included in the event estimates for a new multi-purpose arena on the UVM campus. Indoor Soccer There is currently one professional indoor soccer league operating in the U.S. The Major Indoor Soccer League (“MISL”) was formed in 2001 following the folding of the National Professional Soccer League. Currently, MISL has seven franchises operating in some of the largest markets in the North America with a strong base of soccer participation including Philadelphia, Chicago, Baltimore, Milwaukee, Kansas City, St. Louis and Cleveland. MISL will add an additional team in Stockton, California for the 2005-06 season. The average market population for MISL teams is approximately 3.2 million, ranging from 635,600 in Stockton, CA to 8.6 million in Chicago. The franchises play in large arenas, averaging 12,225 seats, ranging from a low of 9,000 at the U. S. Cellular Arena to a high of 18,000 at Kemper Arena in Kansas City. Average league attendance during the 2003-04 season was 5,579 per game. Based on discussion with MISL representatives and given the disparity of market demographics between Burlington and traditional MISL markets, it is unlikely that a new multi-purpose arena on the UVM campus could attract an MISL franchise.

VII. Estimated Event Demand (cont’d)
97
Market-Driven Events Market-driven events are defined as those events that are affected by local market forces and characteristics. The number of market-driven events in a given community is typically a function of the size of the marketplace and the number of available facilities to host these events. The types of market-driven events evaluated in this section include:
• Concerts;
• Ice Shows;
• Family Shows;
• High School Sports;
• Motor Sports;
• Other Sports;
• Flat Floor Shows; and,
• Miscellaneous Events. Concerts The greatest opportunity to attract concerts to a new arena in Burlington will likely be derived from the “middle market” concert category. Middle market concert acts generally draw between 3,000 and 10,000 spectators to a single performance. While smaller acts often play in clubs or theaters and larger acts generally perform in large arenas, the middle market performers often lack ideal venues for their shows. A mid-sized arena is often ideal for these performances, offering enough seats to accommodate fan demand while providing a more intimate setting than a large arena or stadium venue. The Burlington market currently lacks a facility capable of hosting large popular touring concerts. The majority of Burlington residents travel to the Bell Centre in Montreal or visit the Saratoga Performing Arts Center in Saratoga Springs, New York as well as other regional cities to attend these larger concerts. Having an 8,000 to 10,000-seat indoor venue would make Burlington attractive for acts that attract bigger audiences. A new arena in Burlington could potentially bring a variety of concert performances including middle market acts and potentially a couple of larger acts.

VII. Estimated Event Demand (cont’d)
98
Currently, Flynn Theater, Memorial Auditorium and Patrick Gymnasium serve as the market’s primary indoor concert venues. Each venue hosts a few concerts each year; however, the number and quality of concerts held at the venues are somewhat limited due to the physical characteristics of the facility. Among other issues with the two venues, the floor areas are not large enough to accommodate the elaborate stages and sets used by many acts, and the buildings’ seating layouts are less than ideal for concerts. These limitations, among others, negatively impact the ability of the venues to continue hosting concert events. The proposed arena could potentially experience heavier competition during the summer months due to the number of outdoor venues within the area presenting summer concert programs. Venues such as the Green at the Shelburne Museum hosts approximately five concerts in its’ summer music series while the Champlain Valley Exposition Coca-Cola Grandstand hosts approximately four concerts in its summer concert series which is held during the Champlain Valley Fair. However, even with these venues and summer series, concert promoters do not feel the Vermont event market is competitive, primarily due to the lack of adequate indoor venues. In order to help determine the number of concerts that could potentially be held at a new arena in Burlington, conversations were held with a number of promoters familiar with the region’s event and facility market, including but not limited to:
• AEG Live; • Alex Caruthers; • Clear Channel Entertainment; • Gillett Entertainment; • Higher Ground; • House of Blues; • Jack Utsick Presents; • Jay Strauser; • Mass Concerts; • Tom Collins Entertainment; and, • UVM Student Association, among others.
Promoters expressed optimism, support and generally agreed that the Burlington market is a relatively strong untapped concert market, but most felt that a new facility is needed in the market before there could be a formidable concert presence. Promoters believed that construction of a new arena would considerably increase the number of performing acts that would target Burlington as a touring market. The majority of concert promoters felt that the presence of a new arena with a larger floor area and better amenities would allow them to come to Burlington more often and bring more popular acts to the city and region.

VII. Estimated Event Demand (cont’d)
99
The following is a summary of comments and opinions gathered through promoter interviews:
• Burlington is generally seen as an attractive market and has been “on the radar” of many promoters and acts;
• Currently, many promoters and popular touring concerts bypass the Burlington market due to a lack of an adequate venue;
• Burlington is a natural routing destination between regional markets;
• Lack of comparable venue competition and non-competing markets is attractive; and,
• Promoters felt it was likely that other Vermont residents would drive to Burlington for performances.
Regarding the concert industry and market potential in Burlington, it is important to note the dominant presence of Clear Channel in the radio and broadcasting industry in Vermont. Currently, Clear Channel Radio owns and operates approximately six stations in the Champlain Valley, two stations in Rutland, and approximately four stations in the Connecticut River Valley. As of the past year, Clear Channel Radio created the first “Vermont Catamount Basketball Radio Network” which will entitle the radio network to broadcast all UVM men’s basketball games live to local communities throughout Vermont. With such dominance in the radio/broadcasting market, it is important to note that these medians are oftentimes used to sole promote Clear Channel’s concerts which could be beneficial to a new venue attracting concerts away from competing regional venues. Based on interviews with concert promoters and concert activity at similar venues in comparable markets, it is estimated that a multi-purpose arena on the UVM campus could host 10 concerts per year with an average paid attendance of 4,700 and an average turnstile attendance of 5,000 per concert. Ice Shows Due to its location in the northeast and the large number of ice sport participants and spectators in the area, Burlington could potentially host a number of ice shows/spectaculars, competitions, and exhibitions. There are a number of ice events held at various facilities in Massachusetts, New Hampshire, Maine and New York,

VII. Estimated Event Demand (cont’d)
100
among other bordering states. Promoters and organizers of events such as Champions on Ice, Smuckers Stars on Ice, Disney on Ice, US Figure Skating performances, Ice Dance competitions and the Vermont Skate Club indicated interest in utilizing the proposed venue due to the extra amenities and potential quality of the ice sheet in a new venue. Also, a number of organizers expressed interest in Burlington due to its location and proximity to Montreal and other ice-hockey markets. Based on interviews with ice show promoters and ice show activity at similar venues in comparable markets, it is estimated that a new multi-purpose arena on the UVM campus could host 6 to 8 ice show performances annually, attracting an average paid and turnstile attendance of 4,500 per performance. Family Shows Family shows are events that cater to spectators of all ages and include a wide variety of events including Sesame Street Live, Ringling Brothers and Barnum Bailey Circus, Barney, and Nickelodeon shows, among others. A new facility’s ability to attract events such as family shows will depend somewhat on the physical characteristics of the facility. Depending on the amenities incorporated into the proposed arena, it may be able to attract a number of family shows that do not currently come to Burlington. For example, organizers of the Barnum & Bailey/Ringling Brothers Circus indicated that they are unable to use local and many of the regional facilities because they are too small to accommodate their needs. However, if a new arena is built, they could potentially come to Burlington on a regular basis. A promoter of large family shows indicated that people around the state and region will likely be willing to make the drive to Burlington to see some of their more popular shows. Many family shows hold multiple performances over a few days in each tour stop. Based on the results of family show promoter interviews and historical family show event activity at similar arenas in comparable markets, it is estimated that a new multi-purpose arena on the UVM campus could host 10 to 12 family show performances annually with average paid attendance of 3,500 and an average turnstile attendance of 3,750 per performance.

VII. Estimated Event Demand (cont’d)
101
High School Sports Gutterson Fieldhouse currently hosts the Vermont Principal Association’s (“VPA”) Division I and II boys hockey semifinal and final games. Patrick Gymnasium hosts the VPA’s Division I boys and girls hockey semifinal and final games. Exhibit VII-6 presents a summary of the historical event activity and attendance associated with VPA events currently hosted at UVM facilities. Based on discussion with UVM and VPA officials, it is assumed these events would move to a new arena on the UVM campus. In addition to these events, the new multi-purpose arena could also potentially host occasional high school hockey or basketball tournaments and other marquee high school sporting events. Based on discussions with VPA officials and a review of high school events hosted at similar arenas in comparable markets, it is assumed that a new multi-purpose arena on the UVM campus could host 8 to 10 days, with average daily attendance of 2,220 per event day.
Exhibit VII-6VPA High School Events
Event Turnstile AttendanceYear Days Average Total
Boys Division I Hockey:2003-04 2 2,316 4,6312002-03 2 2,141 4,282
Boys Division II Hockey:2003-04 2 883 1,7652002-03 2 956 1,912
Boys Division I Basketball:2003-04 2 3,067 6,1342002-03 2 3,196 6,392
Girls Division I Basketball:2003-04 2 1,374 2,7472002-03 2 1,012 2,024
Source: UVM athletics.

VII. Estimated Event Demand (cont’d)
102
Motor Sports Despite the relatively small size of their floors in comparison with larger stadiums and outdoor venues, mid-sized arenas can still host motor sports events including motocross, monster truck races and tractor pulls. The presence of a hockey-sized floor and some flexible seating options would allow a new arena in Burlington to host these events. Motor sports promoters interviewed for this project indicated that they oftentimes hold two to five shows over several days in some markets. This helps offset the cost of facility set-up and takedown, making the event more practical and profitable, particularly in midsized arenas in relatively small markets. Motor sports promoters indicated that the Burlington market could potentially be an attractive market for motor sports events, and would consider stopping in Burlington, provided a new arena’s amenities and rental structures were adequate. Based on discussions with motor sports representatives and historical motor sports event activity at similar arenas in comparable facilities, it is estimated that a new multi-purpose arena on the UVM campus could host 1 to 2 motor sports events annually. Average attendance is estimated at approximately 3,500 per event. Other Sports Other sports include a variety of events including, but not limited to the Harlem Globetrotters, professional wrestling, rodeos and amateur sports, among other events. Based on a discussion with various other sporting event promoters and a review of historical event activity at similar arenas in comparable markets, it is estimated that a new multi-purpose arena on the UVM campus could host 4 to 6 other sporting events with an average attendance of approximately 3,750 per event.

VII. Estimated Event Demand (cont’d)
103
Flat Floor Shows Flat floor shows include conventions, trade shows and consumer shows. Several existing facilities in the marketplace serve to accommodate flat floor show demand in the Burlington area including facilities such as the Champlain Valley Expo, the Sheraton Burlington Hotel & Conference Center, the Wyndham Burlington Hotel, and Clarion Hotel & Suites, among other facilities. It is expected that even with the development of a new multi-purpose arena that these facilities would continue to host the large majority of flat floor shows in the marketplace. It is expected that a new multi-purpose arena alone could accommodate flat floor shows seeking upwards of 25,000 square feet of space. Currently, this amount of space is larger than any current offerings by local hotel groups, but smaller than existing and planned facilities at the Champlain Valley Exposition. The Champlain Valley Exposition hosts the majority of major consumer shows in the marketplace and is expected to continue to do so subsequent to the development of a new arena. However, given the lack of nearby hotel rooms, entertainment and shopping, the Champlain Valley Exposition does not currently host a significant number of conventions or trade shows. As a result, the arena, if used effectively in conjunction with existing hotels nearby the UVM campus could be used to accommodate larger flat floor events that currently do not come to the Burlington marketplace due to a lack of the appropriate facilities. However, it is unlikely that the proposed arena would result in a significant number of incremental events being attracted to the market given many of the fundamental shortcomings of the market including lack of hotel rooms during peak season, limited air access, and the lack of centrality to the New England states, among other reasons. Based on discussions with local hoteliers, state and regional association meeting planners and lost business lists compiled by the Vermont Convention Bureau and local hoteliers, it is estimated that a new multi-purpose arena could host upwards of 9 to 12 flat floor event days annually, drawing an average of 1,000 attendees per day.

VII. Estimated Event Demand (cont’d)
104
Miscellaneous Events Based on the analyses of comparable facilities, other events that are often held in multi-purpose arenas include high school and collegiate graduation ceremonies, religious services, festivals, professional certification testing, community events, holiday parties and private catered functions, among other events. Most of these miscellaneous events are not ticketed events. The number of community-type events held at the multi-purpose venue will depend somewhat on the operating philosophy of facility management and competition from other facilities in the marketplace. In general, these events do not represent a significant income sources to an arena, but rather serve to increase the utilization of the building and meet the needs of the local community. Based on a review of the number of miscellaneous event held at similar facilities in comparable markets as well as discussions with local event planners, it is estimated that a multi-purpose arena could host 10 to 14 miscellaneous events annually, with an average attendance of approximately 350 per event. Depending on the management philosophy of the arena and its potential synergies with existing hotel and other local facility event activity depending on the location of the arena, actual miscellaneous events hosted at the arena could exceed the estimates presented herein by a substantial margin. However, it is not expected that is would materially impact the financial operations of the facility. Summary In general, strong interest was expressed by various event promoters in using a new multi-purpose arena operating on the UVM campus. The potential strength of a new arena in the Burlington area would be the lack of competition from any modern mid-sized to large spectator seating venues, locally, and with in the state of Vermont. Overall, despite a relatively small population base, a multi-purpose arena operating on the UVM campus is estimated to attract event and attendance levels comparable to other similar arenas in comparably-sized and slightly larger markets. However, it is the relatively small population base and corporate base that could prove difficult to support both UVM athletic events and certain minor league sports tenants over the long-term. As a result, the base assumptions in this report assume no minor league tenant operating in the building.

VII. Estimated Event Demand (cont’d)
105
Exhibit VII-7 on the following pages summarizes the estimated annual events and attendance that could be attracted to a new multi-purpose arena operating on the UVM campus in a stabilized year of operations, assuming only UVM hockey and basketball as major tenants.
As depicted in the exhibit, it is estimated that a new multi-purpose arena operating on the UVM campus could host 100 to 118 events, drawing approximately 247,700 to 286,500 paid attendees annually and 300,200 to 336,000 turnstile attendees annually. While a minor league tenant has not been assumed in the base assumptions of this analysis, a sensitivity analysis has been prepared to provide an indication of potential arena utilization if a minor league hockey team and/or indoor football were to become tenants in the arena. Exhibit VII-8 summarized the estimated utilization.
Exhibit VII-7Estimated Events and Attendance - UVM as Only Major Tenants
Proposed Multi-Purpose Arena on UVM Campus
Average AverageEvents Paid Turnstile Total Paid Attendance Total Turnstile Attendance
Event Type Base Case Best Case Attendance Attendance Base Case Best Case Base Case Best Case
Tenant Events:UVM Men's Basketball 12 12 1,800 2,700 21,600 21,600 32,400 32,400UVM Women's Basketball 12 12 1,200 1,600 14,400 14,400 19,200 19,200UVM Men's Hockey 18 20 3,700 4,750 66,600 74,000 85,500 95,000
Subtotal 42 44 102,600 110,000 137,100 146,600
Non-Tenant Events:Concerts 10 10 4,700 5,000 47,000 47,000 50,000 50,000Ice Shows 6 8 4,500 4,500 27,000 36,000 27,000 36,000Family Shows 10 12 3,500 3,750 35,000 42,000 37,500 45,000High School Sports 8 10 2,200 2,200 17,600 22,000 17,600 22,000Motor Sports 1 2 3,500 3,500 3,500 7,000 3,500 7,000Other Sports 4 6 3,750 3,750 15,000 22,500 15,000 22,500Flat Floor Shows 9 12 0 1,000 0 0 9,000 12,000Miscellaneous Events 10 14 0 350 0 0 3,500 4,900
Subtotal 58 74 145,100 176,500 163,100 199,400
Total 100 118 247,700 286,500 300,200 346,000
Exhibit VII-8Estimated Events and Attendance - UVM and Minor League Sports as Tenants
Proposed Multi-Purpose Arena on UVM Campus
Average AverageEvents Paid Turnstile Total Paid Attendance Total Turnstile Attendance
Event Type Base Case Best Case Attendance Attendance Base Case Best Case Base Case Best Case
Tenant Events:UVM Men's Basketball 12 12 1,800 2,700 21,600 21,600 32,400 32,400UVM Women's Basketball 12 12 1,200 1,600 14,400 14,400 19,200 19,200UVM Men's Hockey 18 20 3,330 4,275 59,940 66,600 76,950 85,500ECHL 36 36 3,500 4,000 126,000 126,000 144,000 144,000af2 0 8 3,750 4,000 0 30,000 0 32,000
Subtotal 78 88 221,940 258,600 272,550 313,100
Non-Tenant Events:Concerts 10 12 4,700 5,000 47,000 56,400 50,000 60,000Ice Shows 4 5 4,750 5,000 19,000 23,750 20,000 25,000Family Shows 8 10 3,500 3,750 28,000 35,000 30,000 37,500High School Sports 8 10 2,200 2,200 17,600 22,000 17,600 22,000Motor Sports 1 2 3,600 3,600 3,600 7,200 3,600 7,200Other Sports 4 5 4,500 4,500 18,000 22,500 18,000 22,500Flat Floor Shows 7 8 0 1,000 0 0 7,000 8,000Miscellaneous Events 8 10 0 350 0 0 2,800 3,500
Subtotal 50 62 133,200 166,850 149,000 185,700
Total 128 150 355,140 425,450 421,550 498,800

VII. Estimated Event Demand (cont’d)
106
As depicted in the exhibit, it is estimated that a new multi-purpose arena operating on the UVM campus with an AHL minor league hockey franchise as a tenant could host 128 to 150 events, drawing approximately 335,140 to 425,450 paid attendees annually and 421,550 to 498,800 turnstile attendees annually.

CONFIDENTIAL DRAFTFor Discussion Purposes Only
For Internal Use
Executive Summary
I. Introduction
II. Review of Ernst & Young Study
III. Local Market Analysis
IV. Competitive Facilities
V. Comparable Facilities
VI. Market Surveys
VII. Estimated Event Demand
VIII. Building Program and Cost
IX. Estimated Financial Operations
X. Estimated Economic and Fiscal Impacts
XI. Management Options
XII. Funding Options
VIII. Building Program and Cost

VIII. Building Program and Cost
107
The purpose of this section is to evaluate the physical characteristics and amenities that are estimated to be market supportable for a new multi-purpose events center to be located on the UVM campus. In effort to best understand the facility needs of the greater Burlington area, it is first necessary to assess the present ability of existing local facilities to accommodate indoor public assembly events. Exhibit VIII-1 presents a subjective outline of the market’s current ability to accommodate Burlington’s measured event demand. As outlined in the matrix, Burlington’s existing local indoor facilities have significant limitations in hosting minor league sports (i.e., hockey, indoor football, soccer, lacrosse, etc.). Similarly, there are also significant limitations in the ability to accommodate traditional touring events such as concert, family shows, motor events and other such ticketed events. In part, this is a result of Burlington’s lack of a traditional, commercially operated, modern arena facility. Due to these limitations, touring event promoters have often overlooked Burlington, resulting in the market losing numerous potential entertainment events. In contrast, the community’s accommodation of existing and potential high school and collegiate events are largely satisfied through UVM’s athletic facilities and local high school and other recreation facilities.
Exhibit VIII-1Present Ability of Local Facilities
To Accommodate Indoor Public Assembly Event Demand
Limited Strong
1 2 3 4 5 6 7 8 9 10
UVM Men's Hockey y y y y y yUVM Men's Basketball y y y y y y y yUVM Women's Basketball y y y y y y y yMinor League Sports yHigh School Events y y y y y y y yConcerts y yFamily Shows / Other Ticketed Events y y y
Conventions / Tradeshows y y y y y y yPublic / Consumer Shows y y y y y y yNon-Local Conferences / Meetings y y y y y yLocal Meetings / Banquets / Receptions y y y y y y y yFl
at F
loor
Eve
nts
Spec
tato
r Eve
nts

VIII. Building Program and Cost (cont)
108
Overall, it is believed that existing Burlington flat floor venues (i.e., Champlain Valley Exposition, Sheraton Burlington Hotel & Conference Center, Wyndham Burlington Hotel, and other facilities) are able to accommodate much of the area’s flat floor event demand (i.e., conventions, tradeshows, conferences, public/consumer shows, etc.). Importantly, with respect to needs between seating and flat floor event space, the matrix visually illustrates that seating represents the more deficient area within the Burlington community. While some facilities exist nationwide that integrate a large amount of flat floor space with significant plenary seating (i.e., Holt Arena in Pocatello, Idaho and the Fargodome in Fargo, North Dakota, etc.), the integration of these two concepts can be problematic in attracting both traditional seated events and traditional flat floor events. For instance, promoters of traditional touring events (i.e., concerts, family shows, etc.) strongly prefer more intimate arena settings with superior sightlines for events expected to draw up to 8,000 to 10,000 attendees. Holding a concert in a covered stadium-type venue such as Holt Arena can provide a number of problems, including seating configuration, sightlines, acoustics, staging, rigging and the like. Similarly, the integration of ice to host hockey games or ice shows is extremely difficult in large stadium facilities. Similarly, most conventions and tradeshows strongly prefer traditional convention/exhibition center facilities with breakout meeting space and upscale amenities rather than sports-focused facility environments. Facilities such as Holt Arena and the Fargodome tend to have important, long-term football or soccer tenants as primary facility users (i.e., college football in both cases). In general, the analysis presented herein suggests that a traditional arena venue would be the most appropriate fit for the Burlington community. The remainder of this section summarizes the recommended building program components and preliminary costs estimates in the following sections:
• Seating capacity; • Flat floor space; • Meeting rooms; • Premium seating; • Parking; • Other building components; and, • Preliminary cost estimates.
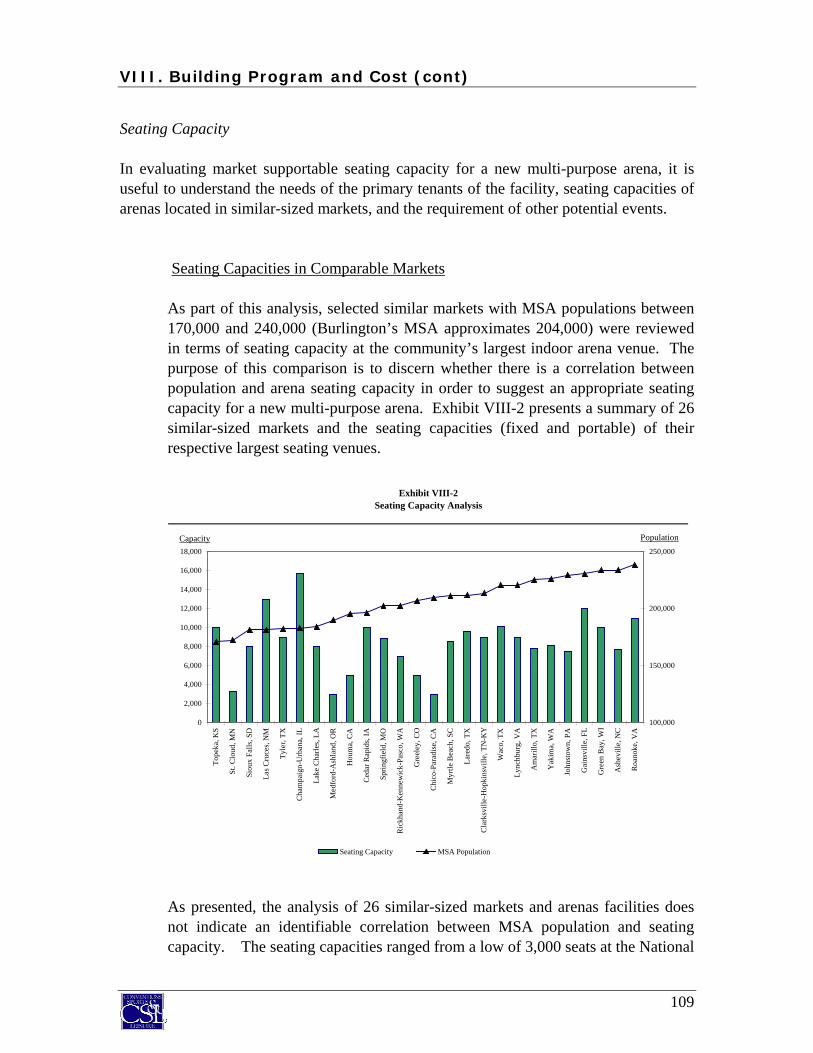
VIII. Building Program and Cost (cont)
109
Seating Capacity In evaluating market supportable seating capacity for a new multi-purpose arena, it is useful to understand the needs of the primary tenants of the facility, seating capacities of arenas located in similar-sized markets, and the requirement of other potential events.
Seating Capacities in Comparable Markets As part of this analysis, selected similar markets with MSA populations between 170,000 and 240,000 (Burlington’s MSA approximates 204,000) were reviewed in terms of seating capacity at the community’s largest indoor arena venue. The purpose of this comparison is to discern whether there is a correlation between population and arena seating capacity in order to suggest an appropriate seating capacity for a new multi-purpose arena. Exhibit VIII-2 presents a summary of 26 similar-sized markets and the seating capacities (fixed and portable) of their respective largest seating venues. As presented, the analysis of 26 similar-sized markets and arenas facilities does not indicate an identifiable correlation between MSA population and seating capacity. The seating capacities ranged from a low of 3,000 seats at the National
Exhibit VIII-2Seating Capacity Analysis
0
2,000
4,000
6,000
8,000
10,000
12,000
14,000
16,000
18,000
Tope
ka, K
S
St. C
loud
, MN
Siou
x Fa
lls, S
D
Las C
ruce
s, N
M
Tyle
r, TX
Cha
mpa
ign-
Urb
ana,
IL
Lake
Cha
rles,
LA
Med
ford
-Ash
land
, OR
Hou
ma,
CA
Ced
ar R
apid
s, IA
Sprin
gfie
ld, M
O
Ric
khan
d-K
enne
wic
k-Pa
sco,
WA
Gre
eley
, CO
Chi
co-P
arad
ise,
CA
Myr
tle B
each
, SC
Lare
do, T
X
Cla
rksv
ille-
Hop
kins
ville
, TN
-KY
Wac
o, T
X
Lync
hbur
g, V
A
Am
arill
o, T
X
Yak
ima,
WA
John
stow
n, P
A
Gai
nsvi
lle, F
L
Gre
en B
ay, W
I
Ash
evill
e, N
C
Roa
noke
, VA
100,000
150,000
200,000
250,000
Seating Capacity MSA Population
Capacity Population

VIII. Building Program and Cost (cont)
110
Guard Armory Arena in Medford, Oregon to a high of 15,665 at the Assembly Hall in Champaign, Illinois. In the case of Assembly Hall, the large capacity need is primarily for the University of Illinois men’s basketball team. Building management indicates that it generally markets the building as a 9,000-seat venue for other events. Exhibit VIII-3 presents an extrapolation of population to seating capacity for Burlington using the 26 comparably-sized community arenas.
As shown, among facilities located in markets with populations of between 170,000 and 240,000, the average facility has a total seating capacity of approximately 8,429, with 35 percent having capacities under 8,000 seats, 46 percent having capacity of 8,000 to 10,000 seats and 19 percent having capacities over 10,000 seats.
Exhbit VIII-3Seating Penetration AnalysisComparable-Sized Markets
Arena PopulationMSA Seating Per
Market Facility Population Capacity Seat
Topeka, KS Kansas Expocentre 170,800 10,000 17.1St. Cloud, MN St. Cloud Civic Center Arena 172,300 3,300 52.2Sioux Falls, SD Sioux Falls Arena 181,300 8,000 22.7Las Cruces, NM Pan American Center 181,400 13,000 14.0Tyler, TX The Oil Palace 182,300 9,000 20.3Champaign-Urbana, IL Assembly Hall 183,000 15,665 11.7Lake Charles, LA Suddeuth Coliseum 184,200 8,000 23.0Medford-Ashland, OR National Guard Armory Arena 189,900 3,000 63.3Houma, CA Terrebonne Civic Center Arena 195,700 5,000 39.1Cedar Rapids, IA U.S. Cellular Center 196,400 10,000 19.6Springfield, MO SMSU Student Center 202,700 8,848 22.9Rickhand-Kennewick-Pasco, WA Tri-Cities Coliseum 202,700 7,000 29.0Greeley, CO Butler-Hancock Gym 207,100 5,000 41.4Chico-Paradise, CA Acker Gym 209,700 3,000 69.9Mytrle Beach, SC Proposed Arena 211,100 8,500 24.8Laredo, TX Laredo Entertainment Center 211,700 9,622 22.0Clarksville-Hopkinsville, TN-KY Dunn Center 213,400 9,000 23.7Waco, TX Ferrell Center 220,400 10,084 21.9Lyncburg, VA Vines Center 220,600 9,000 24.5Amarillo, TX Cal Farley Coliseum 225,200 7,850 28.7Yakima, WA Yakima Valley Sundome 226,000 8,100 27.9Johnstown, PA Cambria County War Memorial Arena 229,500 7,500 30.6Gainsville, FL Stephen C. O'Connell Center 230,500 12,000 19.2Green Bay, WI Resch Center 233,600 10,000 23.4Asheville, NC Asheville Civic Center 233,900 7,674 30.5Roanoke, VA Roanoke Civic Center 238,400 11,000 21.7
Average 205,915 8,429 28.7
Median 208,400 8,674 23.5
Burlington, VT (Estimated Capacity Using Average Pop. Per Seat) 203,700 7,109 28.7
Burlington, VT (Estimated Capacity Using Median Pop. Per Seat) 203,700 8,655 23.5
Source: 2004 AudArena Guide, 2004 Sales & Marketing.

VIII. Building Program and Cost (cont)
111
Based on a market penetration ratio analysis utilizing the average and median penetration ratios of population to seating capacity of the largest arena in the selected markets (average = 28.7 people per seat and median = 23.5 people per seat) and applying it to the population of Burlington (203,700), the analysis indicates that the Burlington market could support a venue of approximately 7,109 to 8,655 seats. UVM Seating Requirements
UVM athletics officials indicated that a facility seating approximately 6,000 for hockey and basketball would be appropriate for their programs. In comparison, the current capacity of Gutterson Fieldhouse is 4,035 seats. Historically, the men’s hockey program has averaged 3,648 turnstile attendees per game over the past three years, often selling out conference games and other marquee games. There is a current waiting list of approximately 200 names for men’s hockey, representing additional demand for 500 to 800 tickets. In terms of basketball, the current capacity of Patrick Gymnasium is 3,228 seats. Over the past three years, the men’s basketball program has averaged 2,339 turnstile attendees per game and the women’s basketball program has averaged 1,374 turnstile attendees per game. UVM will become a member of the Hockey East Conference for hockey in 2005-06 and is currently a member of the America East conference for basketball. Exhibit VIII-4 on the following page depicts the facility capacities of all schools in both conferences.

VIII. Building Program and Cost (cont)
112
As shown in the Exhibit, the hockey seating capacity in the Hockey East Conference ranges from 3,000 seats to 8,200 seats. The conference average is 5,717 seats. In the 2003-04 season, current members of the Hockey East Conference averaged 3,944 attendees per game, representing an average seat occupancy of 67 percent. The University of New Hampshire had the highest average attendance at 6,410 per game, while Merrimack College had the lowest average attendance at 1,642 per game. Basketball seating capacities in the America East Conference range from 1,800 to 5,641, with an average seating capacity of 4,074. In the 2003-04 season, America East Conference average attendance was 1,594 for men’s basketball and 833 for women’s basketball.
Hockey East Conference
Year
Facility Location Tenant(s) Built / Renovated Fixed (1) Total
Mullins Memorial Center Amherst, MA U of Mass - Amherst 1993 8,200 10,500Conte Forum Newton, MA Boston College 1988 7,784 8,606Tsongas Arena Lowell, MA U of Mass - Lowell 1998 6,500 7,800Whittemore Center Arena Durham, NH U of New Hampshire 1995 6,501 7,500Agganis Arena Boston, MA Boston University 2005 6,300 7,200Harold Alfond Sports Arena Orono, ME U of Maine 1977 / 1998 5,641 5,712Matthews Arena Boston, MA Northeastern University 1909 / 1995 4,500 4,500Lawler Arena North Andover, MA Merrimack College 1972 / 2001 3,000 3,617Schneider Arena Providence, RI Providence College 1973 3,030 3,030
Average 1979 / 1998 5,717 6,496
Gutterson Fieldhouse Burlington, VT University of Vermont 1963 3,987 3,987
America East Conference
YearFacility Location Tenant(s) Built / Renovated Fixed (2) Total
SBU Arena Stony Brook, NY Stony Brook University 1990 5,226 6,000Harold Alfond Sports Arena Orono, ME U of Maine 1977/1998 5,641 5,712Recreation and Convocation Center Albany, NY U of Albany 1992 5,000 5,000Events Center Vestal, NY Binghamton University 2004 4,500 4,660The Chase Family Arena West Hartford, CT U of Hartford 1990 4,475 4,475RAC Arena Baltimore, MD U of Maryland - Baltimore County 1973 4,024 4,024Lundholm Gymnasium Durham, NH U of New Hampshire 1968 3,500 3,500Solomon Court Boston, MA Northeastern University 1954 2,500 2,500Case Gymnasium Boston, MA Boston University 1972 1,800 1,800Average 1980 / 1998 4,074 4,186
Patrick Gymnasium Burlington, VT University of Vermont 1963 3,228 4,500
(1) Fixed-seating capacities for hockey games.(2) Fixed-seating capacities for basketball games.
Seating Capacity
Exhibit VIII-1
Seating Capacity
Seating Capacity of Conference Peers
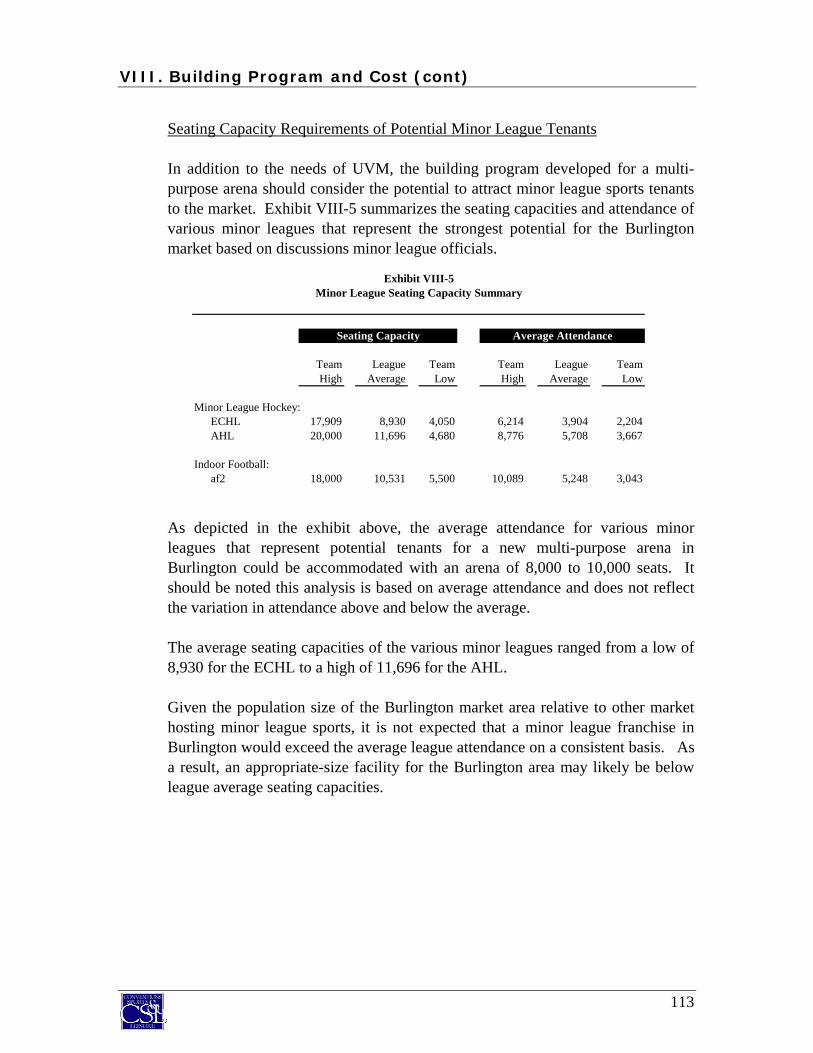
VIII. Building Program and Cost (cont)
113
Seating Capacity Requirements of Potential Minor League Tenants In addition to the needs of UVM, the building program developed for a multi-purpose arena should consider the potential to attract minor league sports tenants to the market. Exhibit VIII-5 summarizes the seating capacities and attendance of various minor leagues that represent the strongest potential for the Burlington market based on discussions minor league officials. As depicted in the exhibit above, the average attendance for various minor leagues that represent potential tenants for a new multi-purpose arena in Burlington could be accommodated with an arena of 8,000 to 10,000 seats. It should be noted this analysis is based on average attendance and does not reflect the variation in attendance above and below the average. The average seating capacities of the various minor leagues ranged from a low of 8,930 for the ECHL to a high of 11,696 for the AHL. Given the population size of the Burlington market area relative to other market hosting minor league sports, it is not expected that a minor league franchise in Burlington would exceed the average league attendance on a consistent basis. As a result, an appropriate-size facility for the Burlington area may likely be below league average seating capacities.
Exhibit VIII-5Minor League Seating Capacity Summary
Seating Capacity Average Attendance
Team League Team Team League TeamHigh Average Low High Average Low
Minor League Hockey:ECHL 17,909 8,930 4,050 6,214 3,904 2,204AHL 20,000 11,696 4,680 8,776 5,708 3,667
Indoor Football:af2 18,000 10,531 5,500 10,089 5,248 3,043
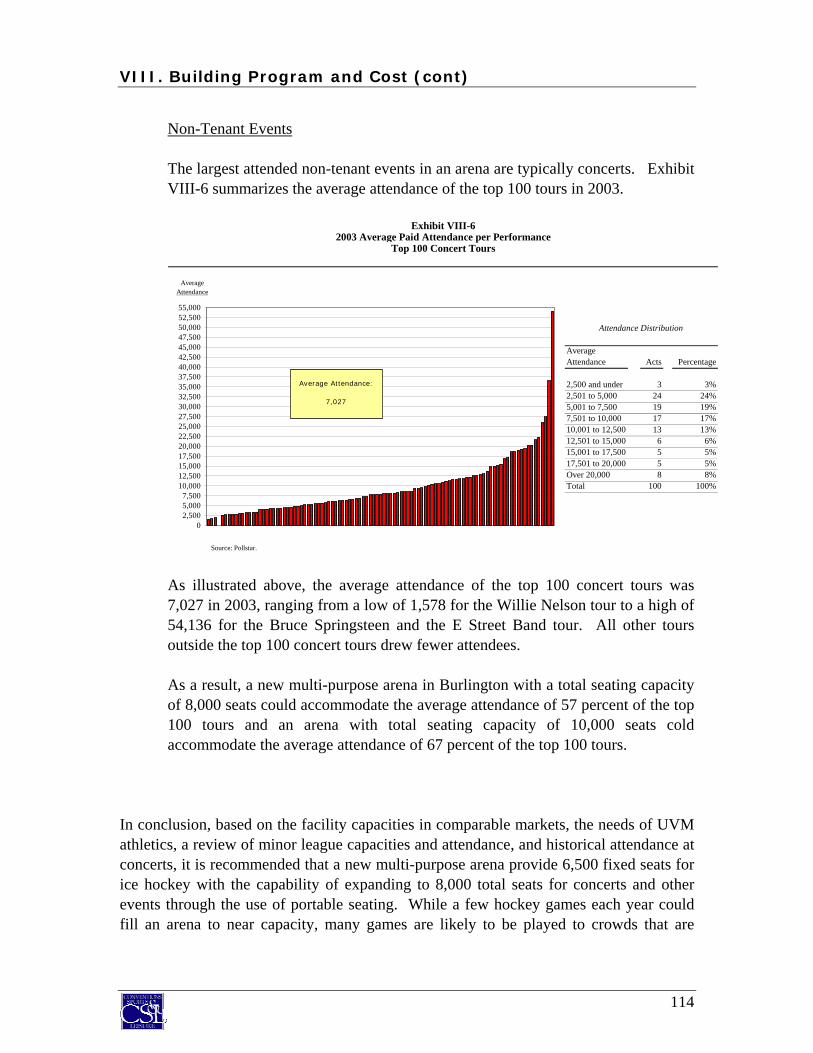
VIII. Building Program and Cost (cont)
114
Non-Tenant Events The largest attended non-tenant events in an arena are typically concerts. Exhibit VIII-6 summarizes the average attendance of the top 100 tours in 2003.
As illustrated above, the average attendance of the top 100 concert tours was 7,027 in 2003, ranging from a low of 1,578 for the Willie Nelson tour to a high of 54,136 for the Bruce Springsteen and the E Street Band tour. All other tours outside the top 100 concert tours drew fewer attendees. As a result, a new multi-purpose arena in Burlington with a total seating capacity of 8,000 seats could accommodate the average attendance of 57 percent of the top 100 tours and an arena with total seating capacity of 10,000 seats cold accommodate the average attendance of 67 percent of the top 100 tours.
In conclusion, based on the facility capacities in comparable markets, the needs of UVM athletics, a review of minor league capacities and attendance, and historical attendance at concerts, it is recommended that a new multi-purpose arena provide 6,500 fixed seats for ice hockey with the capability of expanding to 8,000 total seats for concerts and other events through the use of portable seating. While a few hockey games each year could fill an arena to near capacity, many games are likely to be played to crowds that are
Exhibit VIII-62003 Average Paid Attendance per Performance
Top 100 Concert Tours
Attendance Distribution
AverageAttendance Acts Percentage
2,500 and under 3 3%2,501 to 5,000 24 24%5,001 to 7,500 19 19%7,501 to 10,000 17 17%10,001 to 12,500 13 13%12,501 to 15,000 6 6%15,001 to 17,500 5 5%17,501 to 20,000 5 5%Over 20,000 8 8%Total 100 100%
Source: Pollstar.
02,5005,0007,500
10,00012,50015,00017,50020,00022,50025,00027,50030,00032,50035,00037,50040,00042,50045,00047,50050,00052,50055,000
Average Attendance
Average Attendance:
7,027

VIII. Building Program and Cost (cont)
115
below the venue’s total seating capacity. The same is true with other sporting events, in addition to concerts, family shows and other potential event types. It should be noted that a few additional events might be attracted to the market if a larger capacity arena were offered. However, it is unlikely that the revenue benefit from these few additional events would offset the increased construction and operating costs required to build and operate a larger arena. Additionally, it is important that the multi-purpose arena maintains a perception of a scarcity of seats for marquee events in order to induce demand and drive early ticket sales. Flat Floor Space Arena floors can be used to accommodate flat floor events such as conventions, tradeshows or consumer shows that are traditionally housed in convention centers, civic centers, hotels or other similar facilities. Existing facilities in the Burlington area that provide the large amounts of flat floor space include the Miller Building at the Champlain Valley Exposition (33,000 square feet), the Wyndham Burlington Hotel (16,000 square feet) and the Sheraton Burlington Hotel and Conference Center (12,500 square feet). These facilities accommodate the large majority of conventions, tradeshows and consumers shows hosted in the Burlington area. The floor space accommodated in an arena design is a function of the size of the event floor and the use of moveable or telescopic seating. Exhibit VIII-7 presents a summary of the arena floor square footage of comparable arenas constructed since 1995.
Exhibit VII-7Arena Floor Square FootageComparable New Facilities
SquareFeet
High 45,000 (1)
Average 23,060Median 20,000Low 13,875 (2)
(1) Facility has all retractable seating.(2) Facility constructed to accommodate basketball floor. Facility does not accommodate hockey

VIII. Building Program and Cost (cont)
116
Based on the need to accommodate an 85’ by 200’ ice sheet to meet the needs of UVM hockey and other ice shows that may be hosted at the arena, it is anticipated that the new arena could offer between 20,000 to 25,000 square feet of column-free arena floor space that could be used host flat floor shows, depending on arena design and the number of moveable or telescopic floor seating in the arena. This amount of space could accommodate 1,330 to 1,670 people for banquet-style events and upwards of 200 to 250 10’ x 10’ booths for exhibition events. A key marketing advantage for the arena floor space is that it will be contiguous and column-free, key considerations of meeting planners when selecting a venue. Based on the results of the market analysis, which included interviews with meeting planners and a review of local market characteristics, it appears that this amount of exhibition space (20,000 to 25,000 square feet) is sufficient to meet demand. The facility, particularly if located on the UVM campus, could be used in conjunction with flat floor space at existing nearby hotels (such as the Sheraton Burlington Hotel & Conference Center or Wyndham Burlington Hotel) to accommodate larger events that currently bypass the market due to lack of appropriate flat floor space square footage. Meeting Rooms Comparable arenas typically provide a nominal number of meeting rooms to meet the needs of arena business operations, to provide meeting rooms to meet local community needs, or serve as break-out meeting rooms for other events hosted at the facility. Exhibit VIII-8 presents a summary of the meeting rooms at comparable arenas constructed since 1995.
Based on a review of comparable arenas and the needs expressed by potential events that may be hosted at the proposed arena, it anticipated that a new arena could offer between 4 to 6 meeting rooms accommodating 25 to 40 people for small meetings and upwards of 250 to 300 people for large meetings. A total of approximately 2,500 to 3,000 square
Exhibit VII-8Meeting Rooms
Comparable New Arenas
People CapacityNumber Minimum Maximum
High 10 180 1,200Average 5 37 367Median 5 25 220Low 1 8 80
VIII. Building Program and Cost (cont)
117
feet of sub-dividable meeting space would be necessary to accommodate the recommended number of rooms and people capacity. Premium Seating Based on the results of the market surveys and a review of premium seating available at similar facilities located in similar markets, the building program should include the following premium areas:
Private boxes – The facility should offer upward of 10 to 12 private boxes. The boxes should be located at the top of the seating bowl and be designed as open-air boxes with seating for between 8 to 12 persons. Club Seats – The facility should offer upwards of 450 to 500 club seats that would be located in prime location near the center of the event floor. Club seats should be physically differentiated from other arena seating and could include such distinguishing features as wider seats, more leg room, cup holders and, potentially, a different color or material from other arena seats.
Arena Club – The facility should include an upscale arena club that would be available to club seat patrons and private box patrons before, during and after events. The club space could also be rented on non-event days for luncheons, banquets, receptions and other private affairs. The size of the club space should range from 5,000 to 6,000 square feet of space to accommodate premium seat patrons.
Parking The availability of sufficient parking will be critical to the success of the proposed arena. It is a generally accepted industry standard that approximately one parking space should be provided for every three seats. Given the recommended capacity of the facility to be 6,500, expandable to 8,000 with floor seating, it is estimated that approximately 2,200 to 2,700 parking spaces within walking distance would be needed to meet potential demand. Local codes should be reviewed to ensure that the development not only meets industry standards, but also local codes with respect to parking spaces.
VIII. Building Program and Cost (cont)
118
Other Building Components Other building components that are integral to the success of the arena include, but are not limited to:
• Minimum of 200’ x 85’ ice surface in main arena including 2 players benches, 2
penalty boxes and 1 announcer’s box.
• Ancillary ice sheet of 200’ x 85’ in attached facility to host UVM hockey practices, minor league hockey tenant (if applicable) practices and to meet the demand for public skating (hockey practices/games, figure skating, public skate, etc.)
• Sufficient concession points of sale should be provided to maximize per capita spending revenues. Industry standards dictate that there should be approximately one concession point of sale for every 300 seats.
• Sufficient restrooms should be provided to ensure an enjoyable patron experience. Industry standards dictate that there should be one water closet per 50 seats and one urinal per 100 seats.
• Sufficient number and quality of dressing rooms including a home team locker room, visiting team locker room and 2 to 4 smaller dressing rooms for other event performers and officials.
• Rigging grid capable of holding required poundage of touring acts with appropriate stage clearance.
• State-of-the-art audio, video and lighting equipment.
• Sufficient storage space for equipment, materials, supplies and other needs.
• Administrative offices for full-time and season staff for UHL team and arena personnel.
• Ticket or box office for walk-up ticket sales, will call and other ticketing needs.
As facility planning progresses, it will be important that project architects experienced in arena design work closely with team officials and event promoters to create a design that would maximize the market and revenue potential of the facility. It should be noted that the general building program presented herein does not include space requirements for components such as dressing rooms, storage, administrative offices, box office, food service space and other such spaces as may be determined by project planners and architects.
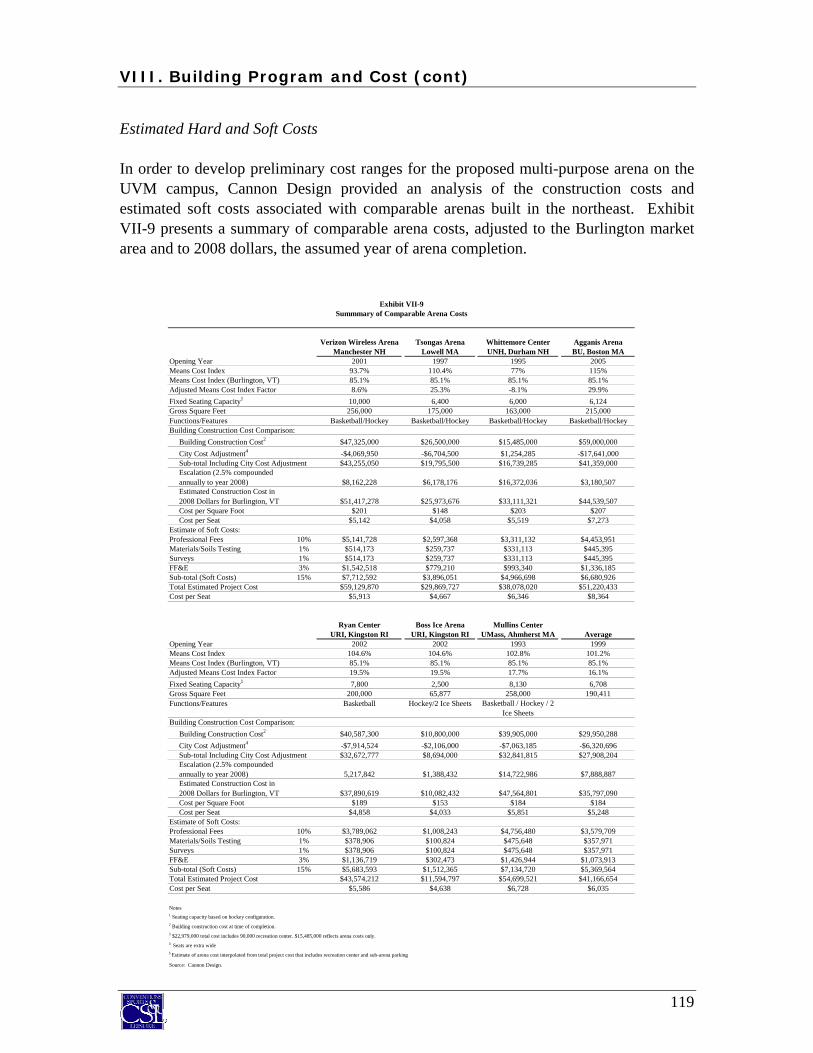
VIII. Building Program and Cost (cont)
119
Estimated Hard and Soft Costs In order to develop preliminary cost ranges for the proposed multi-purpose arena on the UVM campus, Cannon Design provided an analysis of the construction costs and estimated soft costs associated with comparable arenas built in the northeast. Exhibit VII-9 presents a summary of comparable arena costs, adjusted to the Burlington market area and to 2008 dollars, the assumed year of arena completion.
Exhibit VII-9Summmary of Comparable Arena Costs
Verizon Wireless Arena Tsongas Arena Whittemore Center Agganis ArenaManchester NH Lowell MA UNH, Durham NH BU, Boston MA
Opening Year 2001 1997 1995 2005Means Cost Index 93.7% 110.4% 77% 115%Means Cost Index (Burlington, VT) 85.1% 85.1% 85.1% 85.1%Adjusted Means Cost Index Factor 8.6% 25.3% -8.1% 29.9%Fixed Seating Capacity1 10,000 6,400 6,000 6,124Gross Square Feet 256,000 175,000 163,000 215,000Functions/Features Basketball/Hockey Basketball/Hockey Basketball/Hockey Basketball/HockeyBuilding Construction Cost Comparison:
Building Construction Cost2 $47,325,000 $26,500,000 $15,485,000 $59,000,000City Cost Adjustment4 -$4,069,950 -$6,704,500 $1,254,285 -$17,641,000Sub-total Including City Cost Adjustment $43,255,050 $19,795,500 $16,739,285 $41,359,000Escalation (2.5% compounded annually to year 2008) $8,162,228 $6,178,176 $16,372,036 $3,180,507Estimated Construction Cost in 2008 Dollars for Burlington, VT $51,417,278 $25,973,676 $33,111,321 $44,539,507Cost per Square Foot $201 $148 $203 $207Cost per Seat $5,142 $4,058 $5,519 $7,273
Estimate of Soft Costs:Professional Fees 10% $5,141,728 $2,597,368 $3,311,132 $4,453,951Materials/Soils Testing 1% $514,173 $259,737 $331,113 $445,395Surveys 1% $514,173 $259,737 $331,113 $445,395FF&E 3% $1,542,518 $779,210 $993,340 $1,336,185Sub-total (Soft Costs) 15% $7,712,592 $3,896,051 $4,966,698 $6,680,926Total Estimated Project Cost $59,129,870 $29,869,727 $38,078,020 $51,220,433Cost per Seat $5,913 $4,667 $6,346 $8,364
Ryan Center Boss Ice Arena Mullins CenterURI, Kingston RI URI, Kingston RI UMass, Ahmherst MA Average
Opening Year 2002 2002 1993 1999Means Cost Index 104.6% 104.6% 102.8% 101.2%Means Cost Index (Burlington, VT) 85.1% 85.1% 85.1% 85.1%Adjusted Means Cost Index Factor 19.5% 19.5% 17.7% 16.1%Fixed Seating Capacity1 7,800 2,500 8,130 6,708Gross Square Feet 200,000 65,877 258,000 190,411Functions/Features Basketball Hockey/2 Ice Sheets Basketball / Hockey / 2
Ice SheetsBuilding Construction Cost Comparison:
Building Construction Cost2 $40,587,300 $10,800,000 $39,905,000 $29,950,288City Cost Adjustment4 -$7,914,524 -$2,106,000 -$7,063,185 -$6,320,696Sub-total Including City Cost Adjustment $32,672,777 $8,694,000 $32,841,815 $27,908,204Escalation (2.5% compounded annually to year 2008) 5,217,842 $1,388,432 $14,722,986 $7,888,887Estimated Construction Cost in 2008 Dollars for Burlington, VT $37,890,619 $10,082,432 $47,564,801 $35,797,090Cost per Square Foot $189 $153 $184 $184Cost per Seat $4,858 $4,033 $5,851 $5,248
Estimate of Soft Costs:Professional Fees 10% $3,789,062 $1,008,243 $4,756,480 $3,579,709Materials/Soils Testing 1% $378,906 $100,824 $475,648 $357,971Surveys 1% $378,906 $100,824 $475,648 $357,971FF&E 3% $1,136,719 $302,473 $1,426,944 $1,073,913Sub-total (Soft Costs) 15% $5,683,593 $1,512,365 $7,134,720 $5,369,564Total Estimated Project Cost $43,574,212 $11,594,797 $54,699,521 $41,166,654Cost per Seat $5,586 $4,638 $6,728 $6,035
Notes1 Seating capacity based on hockey configuration.2 Building construction cost at time of completion.3 $22,979,000 total cost includes 90,000 recreation center. $15,485,000 reflects arena costs only.4 Seats are extra wide5 Estimate of arena cost interpolated from total project cost that includes recreation center and sub-arena parking
Source: Cannon Design.

VIII. Building Program and Cost (cont)
120
As illustrated in the previous exhibit, the building construction cost, or hard costs, of similar facilities ranged from approximately $148 to $207 per square foot in 2008 dollars if built in the Burlington area. The cost per seat of comparable facilities ranged from $4,058 to $7,273, adjusted for Burlington and in 2008 dollars. While the soft costs of each project were unknown, industry standards dictate that 15 percent is an appropriate assumption to estimate soft construction costs which can include costs such as professional fees, soil testing, surveys and furniture, fixtures and equipment (FF&E). It is important to note that the costs presented in Exhibit VII-4 do not include costs associated with land acquisition or required infrastructure improvements (i.e. parking, roadways, utilities, etc.). Assuming the proposed multi-purpose arena has a fixed seating capacity of 6,500 seats (capable of expanding to 8,000 seats with the use of temporary floor seating) and a practice/community ice sheet, it is estimated that the facility could encompass approximately 250,000 total square feet. Exhibit VII-10 presents an estimated of potential project costs for a multi-purpose arena in Burlington assuming no land acquisition costs, which may likely be provided at no cost by UVM, and excluding any necessary infrastructure improvements. It is estimated that project costs, excluding land and infrastructure costs, associated with a new 6,500-fixed seat arena in the Burlington marketplace could range from $42.6 million to $59.5 million in 2008 dollars, assuming a 250,00 square foot facility and comparable finish-out as other comparable arenas presented herein. A site analysis and specific facility design would need to be developed before more precise estimates of total project costs estimates could be made.
Exhibit VII-10Estimated Total Project Costs
Low High
Multi-Purpose Arena Square Footage 250,000 250,000Cost per Square Foot of Comparable Facilities $148 $207Estimated Hard Costs $37,000,000 $51,750,000Soft Cost as Percentage of Hard Cost 15% 15%Estimated Soft Costs $5,550,000 $7,763,000
Estimated Total Project Costs (1) $42,550,000 $59,513,000
(1) Excludes land acquisition, parking and infrastructure costs.

CONFIDENTIAL DRAFTFor Discussion Purposes Only
For Internal Use
Executive Summary
I. Introduction
II. Review of Ernst & Young Study
III. Local Market Analysis
IV. Competitive Facilities
V. Comparable Facilities
VI. Market Surveys
VII. Estimated Event Demand
VIII. Building Program and Cost
IX. Estimated Financial Operations
X. Estimated Economic and Fiscal Impacts
XI. Management Options
XII. Funding Options
IX. Estimated Financial Operations

IX. Estimated Financial Operations
121
The purpose of this section is to present estimated operating revenues and expenses for the proposed multi-purpose arena to be located on the UVM campus. Since facility design, configuration and cost estimates have not yet been completed, the assumptions used in this analysis are based on the results of the market analysis, industry trends, knowledge of the marketplace and financial results from comparable facilities. Additional physical development planning must be completed before more precise estimations of the proposed arena’s operating costs can be made. Also, upon completion of preliminary planning, revenue and expense assumptions should be updated to reflect changes to the assumptions made herein. These changes could significantly affect the analysis of future operating results. This presentation is designed to assist the Commission and other project representatives in estimating the financial attributes of the proposed arena and cannot be considered to be a presentation of expected future results. Accordingly, this analysis may not be useful for any other purpose. The assumptions disclosed herein are not all inclusive, but are those deemed to be significant; however, there will be differences between estimated and actual results may be material. Key assumptions used to estimate the potential financial operations of the proposed multi-purpose arena include, but are not limited to the following:
• The facility will contain 6,500 fixed seats, expandable to 8,000 with temporary floor seating.
• The facility will be developed as a quality, state-of-the-art venue and would accommodate the needs of various types of users.
• The facility will be owned by UVM or a public sector entity and will be exempt from property taxes.
• UVM men’s hockey and UVM men’s and women’s basketball will serve as the primary tenants in the arena and will remain competitive within their respective conferences.
• A professional, competent and experienced facility management company will manage the facility.
• The facility is aggressively marketed, providing competitive guarantees and, where applicable, rental rates.
• Ample parking will be provided to accommodate demand.
• There are no significant or material changes in the supply or quality of existing venues in the marketplace.

IX. Estimated Financial Operations (cont’d)
122
The presentation of financial operating results is divided into the following components:
• Operating Revenues; • Operating Expenses; and, • Financial Summary.
For purposes of this analysis, it is assumed that UVM’s men’s hockey and basketball and women’s basketball would be the primary tenants in the multi-purpose arena. Further, the analysis presented herein presents a range of expected financial operations based on the key assumptions stated in this report. A sensitivity analysis has also been prepared to show the potential impact of the addition of minor league tenants. Operating Revenues Revenue generated by the operations of a multi-purpose arena typically consist of rent, premium seating, food and beverage, advertising and sponsorships, merchandise, parking ticketing fees, and other such sources. A brief description of each revenue sources is provided below.
Rent Rent generally comprises one of the largest revenue sources for a multi-purpose arena. Arena rental agreements typically incorporate a flat rental rate versus a percentage of gate receipts generated by the event, whichever is greater. Therefore, estimated rent for the multi-purpose arena is a function of several assumptions including the number of events, attendance, ticket price and rental rates. Exhibit IX-1 on the following page summarizes the assumptions used to estimate rent revenue for the proposed multi-purpose arena. As depicted in the exhibit, it is estimated that the rental rates could range from 8 to 10 percent of gross ticket sales or $1,500 to $3,000 per event depending on the event. Rental rate assumptions were developed based on the historical rental rates charged by comparable arenas as well as local facilities. Based on the estimated event and attendance levels and associated average ticket prices, it is estimated that a multi-purpose arena operating on the UVM campus could generate $451,000 to $518,000 in annual rental revenue.

IX. Estimated Financial Operations (cont’d)
123
Private Box and Club Seat Premiums Premium seating revenue is typically derived from the sale of private boxes and club seats. Exhibit IX-2 on the following page summarizes the estimated premium seating revenue potential for the multi-purpose arena.
Exhibit IX-1Estimated Rental Income
Stabilized Year of Operations - 2008 Dollars
Average Annual Average Gross Arena's Share ArenaPaid Paid Ticket Ticket Percentage Flat Rental
Events Events Attendance Attendance Price Revenue of Tickets Fee Revenue
Base Case
UVM Sports:UVM Men's Basketball 12 1,800 21,600 $8.60 $185,760 0% $2,500 $30,000UVM Women's Basketball 12 1,200 14,400 $8.10 116,640 0% $2,500 30,000UVM Men's Hockey 18 3,700 66,600 $17.40 1,158,840 0% $2,500 45,000
Subtotal 42 102,600 1,461,240 105,000
Other Events:Concerts 10 4,700 47,000 $40.00 1,880,000 8% $0 150,000Ice Shows 6 4,500 27,000 $22.50 607,500 10% $0 61,000Family Shows 10 3,500 35,000 $17.00 595,000 10% $0 60,000High School Sports 8 2,200 17,600 $8.00 140,800 8% $0 11,000Motor Sports 1 3,500 3,500 $13.50 47,250 8% $0 4,000Other Sports 4 3,750 15,000 $15.00 225,000 8% $3,000 18,000Flat Floor Shows 9 0 0 $0.00 0 0% $3,000 27,000Miscellaneous Events 10 0 0 $0.00 0 0% $1,500 15,000
Subtotal 58 145,100 3,495,550 346,000
Total 100 247,700 $4,956,790 $451,000
Best Case
UVM Sports:UVM Men's Basketball 12 1,800 21,600 $8.60 $185,760 0% $2,500 $30,000UVM Women's Basketball 12 1,200 14,400 $8.10 116,640 0% $2,500 30,000UVM Men's Hockey 20 3,700 74,000 $17.40 1,287,600 0% $2,500 50,000
Subtotal 44 110,000 1,590,000 110,000
Other Events:Concerts 10 4,700 47,000 $40.00 1,880,000 8% $0 150,000Ice Shows 8 4,500 36,000 $22.50 810,000 10% $0 81,000Family Shows 12 3,500 42,000 $17.00 714,000 10% $0 71,000High School Sports 10 2,200 22,000 $8.00 176,000 8% $0 14,000Motor Sports 2 3,500 7,000 $13.50 94,500 8% $0 8,000Other Sports 6 3,750 22,500 $15.00 337,500 8% $3,000 27,000Flat Floor Shows 12 0 0 $0.00 0 0% $3,000 36,000Miscellaneous Events 14 0 0 $0.00 0 0% $1,500 21,000
Subtotal 74 176,500 4,012,000 408,000
Total 118 286,500 $5,602,000 $518,000

IX. Estimated Financial Operations (cont’d)
124
The assumptions used to estimate premium-seating revenue potential for the multi-purpose arena were based on the results of the random market surveys completed with corporations and households in the Burlington metropolitan area as well as premium seating at comparable facilities. As depicted in the exhibit above, it is estimated that the proposed multi-purpose arena could support upwards of 10 to 12 private boxes and 500 club seats. This premium seating potential would be in addition to any priority-seating program that may be implemented separately by UVM. It is assumed that UVM would sell priority seating that would be separate from the premium seating (boxes and club seats) developed in the arena. Based on market survey results, it is estimated that UVM could sell approximately 350 to 400 donor seats separately for men’s hockey, men’s basketball and women’s hockey. At an estimated donation of $500 per seat, this could generate approximately $525,000 to $600,000 annually to the Victory Club. This revenue is not considered in the context of the financial analysis presented herein. For purposes of this analysis, it has been assumed that 80 to 90 percent of the premium-seating inventory would be leased and that the arena would retain all premiums associated with premium seating after deducting the value of tickets included in the annual price. It is important to note the assumption that the arena would retain all premiums related to premium seating. A review of other comparable facilities with University tenants, indicates that premium seating revenue premiums are usually allocated to the Athletics Department versus the arena. The allocation of premiums to the arena could have donation-related tax implications. Based on the aforementioned assumptions, it is estimated that a multi-purpose arena operating on the UVM campus could generated approximately $222,000 to $354,000 in annual premium seating revenue, net of tickets.
Exhibit IX-2Estimated Premium Seating Revenue
Stabilized Year of Operations - 2008 Dollars
Base Case Best Case
Suites Club Seats Total Suites Club Seats Total
Inventory 10 500 12 500Sold 8 400 10 450Occupancy % 80% 80% 83% 90%Annual Price:
Total $15,000 $1,000 $20,000 $1,150 Less Ticket Value ($5,100) ($642) ($5,500) ($685)Net Premium $9,900 $358 $14,500 $465
Total Annual Premiums $79,200 $143,200 $145,000 $209,250% Retained by Arena 100% 100% 100% 100%
Net Arena Revenue $79,200 $143,200 $222,400 $145,000 $209,250 $354,250

IX. Estimated Financial Operations (cont’d)
125
Food and Beverage, net Food and beverage revenue consists of sales of various food and beverage items at concession stands throughout the arena as well as catering offered in premium seating areas within the arena. Revenue assumptions are based on estimated event and attendance levels, concession spending at comparable facilities and discussions with event promoters and facility managers. Exhibit IX-3 summarizes the estimated food and beverage revenue that could be generated at a multi-purpose arena on the UVM campus.
Exhibit IX-3Estimated Food and Beverage Revenue
Stabilized Year of Operations - 2008 Dollars
Average Annual Average Gross ArenaTurnstile Turnstile F&B F&B Arena's F&B
Events Events Attendance Attendance Per Cap Revenue Share (1) Revenue
Base Case
UVM Sports:UVM Men's Basketball 12 2,700 32,400 $4.00 $129,600 28.1% $36,500UVM Women's Basketball 12 1,600 19,200 $4.00 76,800 28.1% 21,600UVM Men's Hockey 18 4,750 85,500 $4.00 342,000 28.1% 96,200
Subtotal 42 137,100 548,400 154,300
Other Events:Concerts 10 5,000 50,000 $4.75 237,500 37.5% 89,100Ice Shows 6 4,500 27,000 $2.25 60,750 37.5% 22,800Family Shows 10 3,750 37,500 $2.25 84,375 37.5% 31,600High School Sports 8 2,200 17,600 $2.00 35,200 37.5% 13,200Motor Sports 1 3,500 3,500 $5.00 17,500 37.5% 6,600Other Sports 4 3,750 15,000 $4.00 60,000 37.5% 22,500Flat Floor Shows 9 1,000 9,000 $1.75 15,750 37.5% 5,900Miscellaneous Events 10 350 3,500 $1.00 3,500 37.5% 1,300
Subtotal 58 163,100 514,575 193,000
Total 100 300,200 $1,062,975 $347,300
Best Case
UVM Sports:UVM Men's Basketball 12 2,700 32,400 $4.00 $129,600 28.1% $36,500UVM Women's Basketball 12 1,600 19,200 $4.00 76,800 28.1% 21,600UVM Men's Hockey 20 4,750 95,000 $4.00 380,000 28.1% 106,900
Subtotal 44 146,600 586,400 165,000
Other Events:Concerts 10 5,000 50,000 $4.75 237,500 37.5% 89,100Ice Shows 8 4,500 36,000 $2.25 81,000 37.5% 30,400Family Shows 12 3,750 45,000 $2.25 101,250 37.5% 38,000High School Sports 10 2,200 22,000 $2.00 44,000 37.5% 16,500Motor Sports 2 3,500 7,000 $5.00 35,000 37.5% 13,100Other Sports 6 3,750 22,500 $4.00 90,000 37.5% 33,800Flat Floor Shows 12 1,000 12,000 $1.75 21,000 37.5% 7,900Miscellaneous Events 14 350 4,900 $1.00 4,900 37.5% 1,800
Subtotal 74 199,400 614,650 230,600
Total 118 346,000 $1,201,050 $395,600
(1) Arena's share refers to amount of gross concession revenues retained after paying cost of goods sold, concessionaire profits and event revenue allocations.

IX. Estimated Financial Operations (cont’d)
126
Based on industry trends, the profit margin on food and beverage operations is generally in the range of 37.5 percent (weighted average of general concessions and premium seat catering) of gross sales, with the remaining percentage being allocated to the vendor to cover the cost of labor and products and to provide a profit. In most arenas, the facility retains all, or a very significant portion, of the net food and revenue after sharing agreements with the concessionaire/caterer. For purposes on this analysis, it was assumed that the arena would retain 75 percent of the net concessions revenue for UVM sporting events and 100 percent of the net concessions revenue for all other events. As depicted in the exhibit on the previous page, it is estimated that net food and beverage revenue generated to the multi-purpose arena could range from $347,000 to $396,000 annually. It is important to note that the per capita spending assumptions presented herein assume that alcohol is served in the premium seating areas (private boxes and club lounge) for UVM events and is allowed throughout the facility for non-University events. Should the decision be made to prohibit alcohol sales in the facility, the per capita spending assumptions used herein should be modified. Advertising and Sponsorships Advertising and sponsorship revenues are derived from the sale of signage related to scoreboards, scorer’s table, concourse, interior and exterior fascia, courtside (dorna signage), dasher boards, vomitories, outdoor marquee displays and promotions. Ultimately, the rates the proposed arena is able to charge for advertising will rely on factors such as the total estimated number of events and total attendance at the facility, the number of televised events at the arena and the amount of tie-ins such as program advertising and public address announcements that are included with advertising packages. Based on a review of historical advertising and sponsorship levels at UVM’s existing athletic facilities, a review of the breadth and depth of the local corporate community and a review of advertising/sponsorship levels at comparable new arenas, it is estimated that $200,000 to $250,000 in advertising and sponsorship revenue could be generated to the proposed arena each year. It is assumed that this revenue is generated from permanent building signage such as the scoreboard signage, fascia signage, and concourse signage. Non-permanent advertising is assumed to be allocated to UVM. Examples of non-permanent advertising include dasher boards/in-ice signage for hockey and courtside/floor signage for basketball.

IX. Estimated Financial Operations (cont’d)
127
Naming Rights Facility naming rights are often sold to either individual donors or corporations for university-related athletic venues. The naming rights for community-based, multi-purpose are most often sold to corporations. Naming rights can be sold for various parts of the facility including, but not limited to the building, court/rink, club lounge, locker rooms, practice rink, administrative offices and other such areas. Exhibit IX-4 summarizes corporate naming rights terms for several university and minor league arenas.
Based on a review of other naming rights agreements, it is estimated that a multi-purpose arena could generate naming rights ranging from $200,000 to $300,000 annually.
Exhibit IX-4Corporate Naming Rights
Collegiate and Minor League Arenas
EstimatedMarket Total Term Annual
Facility Facility Type Location Population Amount (Years) Payment
Allstate Arena Minor league arena Rosemont, IL (Chicago) 8,489,500 $11,000,000 10 $1,100,000Comcast Center Collegiate arena Washington DC/Baltimore, MD 5,187,800 20,000,000 25 800,000Wells Fargo Arena Collegiate arena Phoenix, AZ 3,552,700 5,000,000 10 500,000Cox Arena Collegiate arena San Diego, CA 2,960,100 12,000,000 12 1,000,000Jenny Craig Pavilion Collegiate arena San Diego, CA 2,960,100 7,000,000 na naFirst Mariner Arena Minor league arena Baltimore, MD 2,635,600 750,000 10 75,000Bank of America Arena Collegiate arena Seattle, WA 2,509,200 9,000,000 10 900,000Coors Event Center Collegiate arena Boulder, CO 2,237,600 5,000,000 na naFifth Third Arena Collegiate arena Cincinnati, OH 1,675,500 10,000,000 na naCricket Arena Minor league arena Charlotte, NC 1,599,800 750,000 5 150,000Value City Arena Collegiate arena Columbus, OH 1,597,300 12,500,000 na naPepsi Coliseum Minor league arena Indianapolis, IN 1,548,100 650,000 5 130,000US Cellular Arena Minor league arena Milwaukee, WI 1,512,400 2,000,000 6 333,333Ford Center Minor league arena Oklahoma City, OK 1,109,400 8,100,000 15 540,000Blue Cross Arena Minor league arena Rochester, NY 1,078,800 2,975,000 15 198,333SaveMart Center Collegiate arena Fresno, CA 971,800 40,000,000 20 2,000,000Bi-Lo Center Minor league arena Greenville, SC 936,000 3,000,000 10 300,000Dunkin Donuts Arena Minor league arena Providence, RI 910,000 7,000,000 10 700,000Pepsi Center Minor league arena Albany, NY 870,500 3,000,000 10 300,000First Union Center Minor league arena Wilkes-Barre, PA 608,800 2,300,000 10 230,000Alltel Arena Minor league arena Little Rock, AR 564,300 7,000,000 15 466,667Colonial Center Collegiate arena Columbia, SC 553,900 5,500,000 12 458,333TECO Arena Minor league arena Estero, FL 421,400 7,000,000 20 350,000CenturyTel Center Minor league arena Bossier City, LA 378,100 5,000,000 10 500,000Verizon Wireless Arena Minor league arena Manchester, NH 372,100 11,000,000 15 733,333Reading Sovereign Center Minor league arena Reading, PA 360,400 1,500,000 5 300,000Sovereign Bank Arena Minor league arena Trenton, NJ 337,600 2,675,000 10 267,500Big Sandy Arena Minor league arena Huntington, WV 314,400 1,400,000 10 140,000United Spirit Center Collegiate arena Lubbock, TX 249,800 10,000,000 20 500,000Budweiser Events Center Minor league arena Loveland, CO 155,800 1,500,000 20 75,000Midwest Wireless Center Collegiate arena Mankato, MN 85,700 6,000,000 20 300,000BancorpSouth Center Minor league arena Tupelo, MS 75,500 2,500,000 12 208,333
Average - Overall 1,525,625 $6,971,875 13 $484,137
Average - Markets with Population Under 500,000 275,080 $4,857,500 14 $337,417

IX. Estimated Financial Operations (cont’d)
128
Merchandise, net Merchandise sales consist of clothing, souvenirs, programs and other miscellaneous items sold during events at the arena. Revenue assumptions are based on estimated event and attendance levels, concession spending at comparable facilities and discussions with event promoters and facility managers. Exhibit IX-5 summarizes the estimated merchandise revenue that could be generated at a multi-purpose arena on the UVM campus.
Exhibit IX-5Estimated Merchandise Revenue
Stabilized Year of Operations - 2008 Dollars
Average Annual Average Gross Net ArenaTurnstile Turnstile Merchandise Merchandise Profit Merchandise Arena's Merchandise
Events Events Attendance Attendance Per Cap Revenue Margin Revenue Share Revenue
Base Case
UVM Sports:UVM Men's Basketball 12 2,700 32,400 $1.00 $32,400 15% $4,860 50% $2,430UVM Women's Basketball 12 1,600 19,200 $1.00 19,200 15% 2,880 50% 1,440UVM Men's Hockey 18 4,750 85,500 $1.00 85,500 15% 12,825 50% 6,413
Subtotal 42 137,100 137,100 20,565 10,283
Other Events:Concerts 10 5,000 50,000 $5.00 250,000 15% 37,500 100% 37,500Ice Shows 6 4,500 27,000 $2.50 67,500 15% 10,125 50% 5,063Family Shows 10 3,750 37,500 $2.25 84,375 15% 12,656 50% 6,328High School Sports 8 2,200 17,600 $1.00 17,600 15% 2,640 100% 2,640Motor Sports 1 3,500 3,500 $4.00 14,000 15% 2,100 100% 2,100Other Sports 4 3,750 15,000 $3.00 45,000 15% 6,750 100% 6,750Flat Floor Shows 9 1,000 9,000 $0.00 0 15% 0 100% 0Miscellaneous Events 10 350 3,500 $0.00 0 15% 0 100% 0
Subtotal 58 163,100 478,475 71,771 60,381
Total 100 300,200 $615,575 $92,336 $70,663
Best Case
UVM Sports:UVM Men's Basketball 12 2,700 32,400 $1.00 $32,400 15% $4,860 50% $2,430UVM Women's Basketball 12 1,600 19,200 $1.00 19,200 15% 2,880 50% 1,440UVM Men's Hockey 20 4,750 95,000 $1.00 95,000 15% 14,250 50% 7,125
Subtotal 44 146,600 146,600 21,990 10,995
Other Events:Concerts 10 5,000 50,000 $5.00 250,000 15% 37,500 100% 37,500Ice Shows 8 4,500 36,000 $2.50 90,000 15% 13,500 50% 6,750Family Shows 12 3,750 45,000 $2.25 101,250 15% 15,188 50% 7,594High School Sports 10 2,200 22,000 $1.00 22,000 15% 3,300 100% 3,300Motor Sports 2 3,500 7,000 $4.00 28,000 15% 4,200 100% 4,200Other Sports 6 3,750 22,500 $3.00 67,500 15% 10,125 100% 10,125Flat Floor Shows 12 1,000 12,000 $0.00 0 15% 0 100% 0Miscellaneous Events 14 350 4,900 $0.00 0 15% 0 100% 0
Subtotal 74 199,400 558,750 83,813 69,469
Total 118 346,000 $705,350 $105,803 $80,464
IX. Estimated Financial Operations (cont’d)
129
For purposes of this analysis, a profit margin of 15 percent has been assumed for merchandise sales, which is consistent with industry averages. As with concession revenue, the profit margin for merchandise is sometimes shared between the arena and an event. As shown in the previous exhibit, it is estimated that $71,000 to $80,000 in net merchandise revenue could be generated to the proposed arena. Parking, net For purposes of this analysis, it is assumed that 1,800 parking spaces would be developed and operated under the control of arena management, with approximately 1,500 parking spaces available for general admission parking. Complimentary parking is assumed to be provided to private box holders, with three parking passes provided for each box sold. Club seat and donor seat patrons are assumed to be required to purchase their parking. Additional parking is assumed to be provided offsite, but within walking or shuttling distance. Exhibit IX-6 on the following page presents a summary of the estimated parking revenue that could be generated to the multi-purpose arena. As depicted in the exhibit, assuming an average parking charge of $3.00 per car, 1.5 to 4.5 persons per car depending on the event and a profit margin of 80 percent, it is estimated the net parking revenue generated to the arena could range from $187,000 to $221,000 per year.

IX. Estimated Financial Operations (cont’d)
130
Ticket Rebates / Charges Arenas and other such sports and entertainment facilities often assess a facility fee on tickets sold for events at the facility as a means of generating additional revenue. Additionally, arenas often utilize a third party ticket seller, such as Ticketmaster, to handle the majority of ticket sales to events at the venue. The ticket seller generally collects a convenience charge on each ticket sold, a portion of which is often times allocated to the arena. Currently, Flynn Theater management provides ticketing services to many of the facilities in the Burlington area.
Exhibit IX-6Estimated Parking Revenue
Stabilized Year of Operations - 2008 Dollars
Non-PremiumAverage Persons Parking Parking Annual Arena
G.A. Turnstile Per Demand Inventory Parking Parking Profit ParkingEvents Attendance (1) Car (2) Per Game (Spaces) Fee Revenue Margin Revenue
Base Case
UVM Sports:UVM Men's Basketball 12 2,700 4.5 595 1,500 $3.00 $21,000 80% $17,000UVM Women's Basketball 12 1,600 4.5 350 1,500 $3.00 $13,000 80% 10,000UVM Men's Hockey 18 4,750 4.5 1,050 1,500 $3.00 $57,000 80% 46,000
Subtotal 42 73,000
Other Events:Concerts 10 5,000 4.5 1,111 1,500 $3.00 $33,000 80% 26,000Ice Shows 6 4,500 3.5 1,286 1,500 $3.00 $23,000 80% 18,000Family Shows 10 3,750 3.5 1,071 1,500 $3.00 $32,000 80% 26,000High School Sports 8 2,200 3.5 629 1,500 $3.00 $15,000 80% 12,000Motor Sports 1 3,500 3.5 1,000 1,500 $3.00 $3,000 80% 2,000Other Sports 4 3,750 3.5 1,071 1,500 $3.00 $13,000 80% 10,000Flat Floor Shows 9 1,000 1.5 667 1,500 $3.00 $18,000 80% 14,000Miscellaneous Events 10 350 1.5 233 1,500 $3.00 $7,000 80% 6,000
Subtotal 58 114,000
Total 100 $187,000
Best Case
UVM Sports:UVM Men's Basketball 12 2,700 4.5 593 1,500 $3.00 $21,000 80% $17,000UVM Women's Basketball 12 1,600 4.5 349 1,500 $3.00 $13,000 80% 10,000UVM Men's Hockey 20 4,750 4.5 1,049 1,500 $3.00 $63,000 80% 50,000
Subtotal 44 77,000
Other Events:Concerts 10 5,000 4.5 1,111 1,500 $3.00 $33,000 80% 26,000Ice Shows 8 4,500 3.5 1,286 1,500 $3.00 $31,000 80% 25,000Family Shows 12 3,750 3.5 1,071 1,500 $3.00 $39,000 80% 31,000High School Sports 10 2,200 3.5 629 1,500 $3.00 $19,000 80% 15,000Motor Sports 2 3,500 3.5 1,000 1,500 $3.00 $6,000 80% 5,000Other Sports 6 3,750 3.5 1,071 1,500 $3.00 $19,000 80% 15,000Flat Floor Shows 12 1,000 1.5 667 1,500 $3.00 $24,000 80% 19,000Miscellaneous Events 14 350 1.5 233 1,500 $3.00 $10,000 80% 8,000
Subtotal 74 144,000
Total 118 $221,000
(1) Parking is assumed to be included in the premium for boxes and club seats. Two parking passes are assumed per box. A parking pass is assumed for every three club seats sold.
Complimentary parking for premium seating holders is assumed for only UVM sports. All other events would require an additional fee for parking.
(2) Industry standards dictate an average of 3.0 persons per car. However, given that nearby students will comprise a portion of attendance, a high ratio was used for certain events
to reflect students arriving at events by foot or pubic transportation.

IX. Estimated Financial Operations (cont’d)
131
Exhibit IX-7 summarizes the estimated ticket rebates / charges that could be generated to the arena.
For purposes of this analysis, it is assumed that the arena would receive 25 percent of the convenience charges and that the arena would collect a $1.00 facility fee per paid admission for all ticketed events (excludes consumer shows and other events). It is estimated that the arena could generate $336,000 to $381,000 annually from convenience charge rebates and facility fees.
Exhibit IX-7Estimated Ticketing Revenue
Stabilized Year of Operations - 2008 Dollars
Convenience Charge RebateAverage Annual % Sold by Average Facility Arena
Paid Paid Ticketing Convenience % Rebate Fee TicketingEvents Events Attendance Attendance Service Charge to Arena Per Ticket Revenue
Base Case
UVM Sports:UVM Men's Basketball 12 1,800 21,600 0% $0.00 25% $1.00 $21,600UVM Women's Basketball 12 1,200 14,400 0% $0.00 25% $1.00 14,400UVM Men's Hockey 18 3,700 66,600 0% $0.00 25% $1.00 66,600
Subtotal 42 102,600 102,600
Other Events:Concerts 10 4,700 47,000 70% $3.50 25% $1.00 75,800Ice Shows 6 4,500 27,000 70% $3.50 25% $1.00 43,500Family Shows 10 3,500 35,000 70% $3.50 25% $1.00 56,400High School Sports 8 2,200 17,600 0% $0.00 25% $1.00 17,600Motor Sports 1 3,500 3,500 70% $3.50 25% $1.00 5,600Other Sports 4 3,750 15,000 70% $3.50 25% $1.00 24,200Flat Floor Shows 9 0 0 0% $0.00 25% $0.00 0Miscellaneous Events 10 0 0 0% $0.00 25% $0.00 0
Subtotal 58 145,100 223,100
Total 100 247,700 $325,700
Best Case
UVM Sports:UVM Men's Basketball 12 1,800 21,600 0% $0.00 25% $1.00 $21,600UVM Women's Basketball 12 1,200 14,400 0% $0.00 25% $1.00 14,400UVM Men's Hockey 20 3,700 74,000 0% $0.00 25% $1.00 74,000
Subtotal 44 110,000 110,000
Other Events:Concerts 10 4,700 47,000 70% $3.50 25% $1.00 75,788Ice Shows 8 4,500 36,000 70% $3.50 25% $1.00 58,050Family Shows 12 3,500 42,000 70% $3.50 25% $1.00 67,725High School Sports 10 2,200 22,000 0% $0.00 25% $1.00 22,000Motor Sports 2 3,500 7,000 70% $3.50 25% $1.00 11,288Other Sports 6 3,750 22,500 70% $3.50 25% $1.00 36,281Flat Floor Shows 12 0 0 0% $0.00 25% $0.00 0Miscellaneous Events 14 0 0 0% $0.00 25% $0.00 0
Subtotal 74 176,500 271,131
Total 118 286,500 $381,131
IX. Estimated Financial Operations (cont’d)
132
Ice Rentals It is envisioned that the multi-purpose arena would include an attached ice sheet that would be available for UVM hockey practices and general community uses. Existing ice sheets in the metropolitan area are generally heavily utilized. The addition of another ice sheet to the market could serve to meet unmet demand in the marketplace. Given that the facility will be used for UVM hockey practices and that its operations could be impacted somewhat by other events taking place in the main arena, conservative assumptions have been used for the estimated utilization of the secondary ice sheet. Specifically, it is assumed the ice sheet would be leased 10 to 25 percent of the time during a typical 16-hour a day schedule, depending on the time of year. With an assumed rental rate of $135 per hour, it is estimated the ice rental revenue could approximate $123,000 to $154,000 annually. Other Revenues Other revenues may include fees charged for providing various services to facility users, equipment rentals and other such sources. Other revenues are estimated to total approximately $25,000 per year.
Operating Expenses Expense generated by the operations of a multi-purpose arena typically consist of salaries & wages, repairs & maintenance, materials and supplies, utilities, advertising, general and administrative, insurance, facility management fee, capital reserve and other such expenses. A brief description of each major source of expense is provided below.
Salaries, Wages and Benefits Salary and wage estimates are based on estimated staffing levels, industry average salaries and wages and local demographic characteristics. Estimated salaries and wages are assumed to account for full- and part-time operating staff for which expenses are not directly reimbursed by facility users. Based on an estimated requirement of 17 full time equivalent employees, total salaries, wages and benefits are estimated to be $1.0 million annually.

IX. Estimated Financial Operations (cont’d)
133
It is assumed that functions such as food and beverages, catering, parking, custodial and other such services would be outsourced. Repairs and Maintenance General maintenance and service of a facility, equipment and surrounding areas are primarily the responsibility of facility operations personnel, and are often performed by in-house personnel. More specialized needs, such as HVAC system maintenance, electrical work, and maintenance of other mechanical systems often must be contracted out to specialized third parties. Total annual repairs and maintenance expenses for the proposed arena are estimated to be approximately $130,000 to $150,000 per year.
Exhibit IX-8Estimated Salaries, Wages and Benefits
Employees Salaries
General Manager 1 $75,000Admininstrative Assistant 1 $30,000Busines Manager 1 $45,000Payroll Clerk 1 $30,000Marketing/Sales Director 1 $50,000Group Sales Manager 1 $30,000Operations Director/Assistant GM 1 $50,000Electrical / Mechanical Technician 1 $40,000Chief Engineer 1 $45,000Changeover/Custodial Supervisor 1 $30,000Facility Workers 3 $75,000Box Office Manager 1 $40,000Assistant Box Office Manager 1 $25,000Ice Rink Manager 1 $50,000Ice Rink Assistant 1 $30,000
Total Positions and Salaries 17 $645,000
Employee Benefits (30%) $194,000Additional Compensation $30,000Part-Time Non-Event Labor $100,000Part-Time Event Labor $35,000
Total Salaries, Wages and Benefits $1,004,000

IX. Estimated Financial Operations (cont’d)
134
Materials and Supplies Materials and supplies include items needed for administrative duties, cleaning and general maintenance throughout the facility. While event specific expenses are often billed directly to event organizers and promoters, general materials and supplies are necessary for day-to-day upkeep and operation of the facility. Based on expenses incurred at comparable facilities, materials and supplies expenses are estimated to total $125,000 to $140,000 per year at the proposed arena.
Utilities Utilities often represent one of the largest expenses incurred by facility operators. Through an analysis of operations at comparable facilities, cost estimates for utilities including electricity, gas, water, steam, trash removal and other such costs have been prepared. Annual utilities expenses at the proposed arena are estimated at $550,000 to $600,000 per year. Advertising Advertising expense for the new facility relates to advertising and promotions used to promote the facility and its events. This expense will vary depending on the number of events hosted each year, how aggressively the events and facility are promoted and whether the facility or the event promoter holds the primary advertising responsibility. For purposes of this analysis, it is estimated that the proposed arena’s annual marking budget could total approximately $70,000 to $85,000. General and Administrative General and administrative expenses typically consist of various office and administrative expenses incurred as a result of day-to-day facility operations. Such expenses typically include travel, telephone, printing, permits and other miscellaneous services, and are estimated to total $250,000 per year at the proposed arena.
IX. Estimated Financial Operations (cont’d)
135
Insurance The insurance expense estimate includes property and liability insurance for the proposed facility. While each event is generally required to carry its own liability insurance, facilities often carry additional insurance to cover areas such as common areas, restrooms and other facility components. Insurance costs will vary in proportion to the number of events and total attendance at the facility. Annual insurance expenses for the proposed arena are estimated to total $75,000 to $90,000 per year. Facility Management Fee It is assumed that the proposed arena will be privately managed in order to maximize event potential and achieve operating efficiencies. In consideration for managing the facility, a private management company typically charges a flat fee plus an incentive fee, provided certain agreed upon operating or financial targets are met. Based on a review of management fees at similar arenas in comparable markets, it is estimated that the based management and incentive fees for the proposed arena could be approximately $150,000 to $175,000 annually.
Financial Summary Exhibit IX-9 on the following page presents the operating revenues and expenses estimated to be generated by a multi-purpose arena operating on the UVM campus. All estimates are presented in 2008 dollars and represent a stabilized year of operations.

IX. Estimated Financial Operations (cont’d)
136
As depicted above, it is estimated that a new multi-purpose arena on the UVM campus could generate $2.2 million to $2.7 million in annual revenues and incur approximately $2.4 million to $2.5 million in annual expenses, resulting in annual operating income before debt service ranging from a $201,000 operating deficit to a $136,000 operating profit. An operating proforma was also developed for the arena assuming an ECHL team under a moderate scenario and ECHL and af2 teams under an aggressive scenario. Exhibit IX-10 on the following page presents a summary of the estimated revenues and expenses under these operating scenarios.
Exhibit IX-9Estimated Revenues and Expenses - UVM as only Tenants
Stabilized Year of Operations
UVM Only As Main Tenants
Base Case Best CasePercentage Percentage
2008 Dollars of Revenues 2008 Dollars of RevenuesOPERATING REVENUES
Rent $451,000 21% $518,000 19%Premium seating 222,000 10% 354,000 13%Food and beverage 347,000 16% 396,000 15%Advertising and sponsorships 200,000 9% 250,000 9%Naming rights 200,000 9% 300,000 11%Merchandise, net 71,000 3% 80,000 3%Parking, net 188,000 9% 222,000 8%Ticket rebates/charges 326,000 15% 381,000 14%Ice rink 123,000 6% 154,000 6%Other 25,000 1% 25,000 1%
TOTAL REVENUES 2,153,000 100% 2,680,000 100%
OPERATING EXPENSESSalaries & wages 1,004,000 47% 1,054,000 39%Repairs & maintenance 130,000 6% 150,000 6%Materials & supplies 125,000 6% 140,000 5%Utilities 550,000 26% 600,000 22%Advertising 70,000 3% 85,000 3%General & administrative 250,000 12% 250,000 9%Insurance 75,000 3% 90,000 3%Facility management fee 150,000 7% 175,000 7%
TOTAL EXPENSES 2,354,000 109% 2,544,000 95%
INCOME FROM OPERATIONS BEFORECAPITAL RESERVE AND DEBT ($201,000) -9% $136,000 5%

IX. Estimated Financial Operations (cont’d)
137
As depicted above, it is estimated that a new multi-purpose arena on the UVM campus with an ECHL minor league hockey franchise and/or af2 arena football team could generate $2.7 million to $3.2 million in annual revenues and incur approximately $2.5 million to $2.8 million in annual expenses, resulting in annual operating income before debt service ranging from $151,000 to $403,000 operating profit.
Exhibit IX-10Estimated Revenues and Expenses - UVM and Minor Leagues as Tenants
Stabilized Year of Operations
UVM and Minor League Hockey As Main Tenants
Base Case Best CasePercentage Percentage
2008 Dollars of Revenues 2008 Dollars of RevenuesOPERATING REVENUES
Rent $506,000 19% $595,000 19%Premium seating 310,000 11% 277,000 9%Food and beverage 491,000 18% 582,000 18%Advertising and sponsorships 250,000 9% 300,000 9%Naming rights 250,000 9% 350,000 11%Merchandise, net 80,000 3% 97,000 3%Parking, net 270,000 10% 322,000 10%Ticket rebates/charges 426,000 16% 506,000 16%Ice rink 92,000 3% 123,000 4%Other 25,000 1% 25,000 1%
TOTAL REVENUES 2,700,000 100% 3,177,000 100%
OPERATING EXPENSESSalaries & wages 1,104,000 41% 1,214,000 38%Repairs & maintenance 145,000 5% 165,000 5%Materials & supplies 135,000 5% 150,000 5%Utilities 600,000 22% 625,000 20%Advertising 80,000 3% 95,000 3%General & administrative 250,000 9% 250,000 8%Insurance 85,000 3% 100,000 3%Facility management fee 150,000 6% 175,000 6%
TOTAL EXPENSES 2,549,000 94% 2,774,000 87%
INCOME FROM OPERATIONS BEFORECAPITAL RESERVE AND DEBT $151,000 6% $403,000 13%

CONFIDENTIAL DRAFTFor Discussion Purposes Only
For Internal Use
Executive Summary
I. Introduction
II. Review of Ernst & Young Study
III. Local Market Analysis
IV. Competitive Facilities
V. Comparable Facilities
VI. Market Surveys
VII. Estimated Event Demand
VIII. Building Program and Cost
IX. Estimated Financial Operations
X. Estimated Economic and Fiscal Impacts
XI. Management Options
XII. Funding Options
X. Estimated Economic and
Fiscal Impacts

X. Estimated Economic and Fiscal Impacts
138
While many of the perceived benefits of a multi-purpose arena are intangible including regional and national media exposure; sports, entertainment and recreation opportunities for local residents; and enhanced community pride; the construction and operation of a multi-purpose arena can provide quantifiable benefits to an area. These quantifiable benefits often serve as the “return on investment” of public dollars that are contributed to develop these facilities. Quantifiable measurements of the effects that multi-purpose arenas have on an economy are typically characterized in terms of economic impacts and fiscal impacts. Economic Impacts Economic impacts are typically conveyed through measures of direct spending, total output, personal earnings and employment. Each of the measures of economic impact are further described below:
• Direct spending represents spending generated by the arena including in-facility expenditures on tickets, rent, concessions, novelties and parking; out-of-facility spending on hotels, food and beverages, retail, transportation, and entertainment; and spending related to athletics including advertising, sponsorships, premium seating and broadcast revenues.
• Total output represents the total direct, indirect and induced spending effects generated by the arena.
• Personal earnings represent the wages and salaries earned by employees of businesses involved with a public assembly facility.
• Employment is expressed in terms of full- or part-time jobs.
Direct Spending The construction phase of a multi-purpose arena represents a significant one-time impact on a local economy. This impact is determined by the volume and nature of the construction expenditures as well as the region in which they take place. Direct spending on construction typically consists primarily of a large number of purchases of materials and labor. Since these large purchases tend to take place in a relatively short timeframe, a distinct and visible impact on the community is typically created during the construction phase.

X. Estimated Economic and Fiscal Impacts (cont’d)
139
The operation of public assembly facilities and their tenants can impact the local economy in a variety of ways. Direct spending is generated during events on tickets, concessions, merchandise and parking, as well as before and after events throughout local hotel, restaurant, retail and other establishments. In addition, the operations of a sports franchise can generate facility-related spending in areas such as advertising, premium seating, naming rights and sponsorships. Exhibit X-1 summarizes the primary sources of direct spending associated with the construction and operations of a multi-purpose arena.
Direct spending represents the beginning of the calculation of economic impacts within the economy, or what is termed the initial change in final demand. For purposes of this report, impacts are presented as total economic activity and net new economic activity. Total economic activity represents gross spending associated with the construction and operations of the arena regardless of the origin of spending and whether or not the spending would have taken place in another form within the local economy (i.e. displaced spending). Net new economic activity represents gross spending that has been adjusted to account for only the spending that (a) originates from outside the area, (b) originates from inside the area but normally occurs outside the area (i.e. a concert attendee that normally would travel to Montreal can now see the concert in Burlington), or displaced spending.
Exhibit X-1Direct Spending
Tickets/RentalsConcessionsMerchandiseParkingPremium seatingAdvertisingSponsorhipsNaming RightsOthers
Total Initial Spending
HotelRestaurants/barsRetailEntertainmentTransportation
Sources of Spending
Out-of-FacilityIn-Facility Construction
MaterialsSuppliesLaborProfessional fees

X. Estimated Economic and Fiscal Impacts (cont’d)
140
Multiplier Effects Economic impacts are further increased through re-spending of the direct spending. The total impact is estimated by applying an economic multiplier to initial direct spending to account for the total economic impact. The total output multiplier is used to estimate the aggregate total spending that takes place beginning with direct spending and continuing through each successive round of re-spending. Successive rounds of re-spending are generally discussed in terms of their indirect and induced effects on the area economy. Each are discussed in more detail as follows:
Indirect effects consist of the re-spending of the initial or direct expenditures. These indirect impacts extend further as the dollars constituting the direct expenditures continue to change hands. This process, in principle, could continue indefinitely. However, recipients of these expenditures may spend all or part of it on goods and services outside the market area, put part of these earnings into savings, or pay taxes. This spending halts the process of subsequent expenditure flows and does not generate additional spending or impact within the community after a period of time. This progression is termed leakage and reduces the overall economic impact. Indirect impacts occur in a number of areas including the following: • wholesale industry as purchases of food and merchandise products are made; • transportation industry as the products are shipped from purchaser to buyer; • manufacturing industry as products used to service arena, sports franchise(s),
vendors and others are produced; • utility industry as the power to produce goods and services is consumed; and, • other such industries.
Induced effects consist of the positive changes in spending, employment, earnings and tax collections generated by personal income associated with the operations of the franchises and facilities. Specifically, as the economic impact process continues, wages and salaries are earned, increased employment and population are generated, and spending occurs in virtually all business, household and governmental sectors. This represents the induced spending impacts generated by direct expenditures.
The appropriate multipliers to be used are dependent upon certain regional characteristics and also the nature of the expenditure. An area which is capable of producing a wide range of goods and services within its border will have high multipliers, a positive

X. Estimated Economic and Fiscal Impacts (cont’d)
141
correlation existing between the self-sufficiency of an area's economy and the higher probability of re-spending occurring within the region. If a high proportion of the expenditures must be imported from another geographical region, lower multipliers will result.
The multiplier estimates used in this analysis are based on the IMPLAN system, which is currently used by hundreds of universities and government entities throughout the country. IMPLAN is a microcomputer program that performs regional input-output analysis based on 528 industrial sectors. Fiscal Impacts In addition to the economic impacts generated by public assembly facilities and their tenants throughout the market area, the public sector benefits from increased tax revenues. In preparing estimates of fiscal impacts, total tax revenues attributable to the direct spending were estimated. In addition, estimates of the effect of total output and earnings on the tax collections have been estimated. Tax revenues estimated herein include state and local sales, hotel taxes and income taxes. Other taxes may apply, but have not been included in this report.
Exhibit X-2Multiplier Effect
BusinessServices
HouseholdSpending
GovernmentalSpending
All OtherEconomic
Sectors
Direct
Induced
IndirectFood &
MerchandiseWholesaler
TransportCompany
Manufacturers Energy/Utilities
NumerousOther
Industries
Out-of-ArenaIn-ArenaConstruction
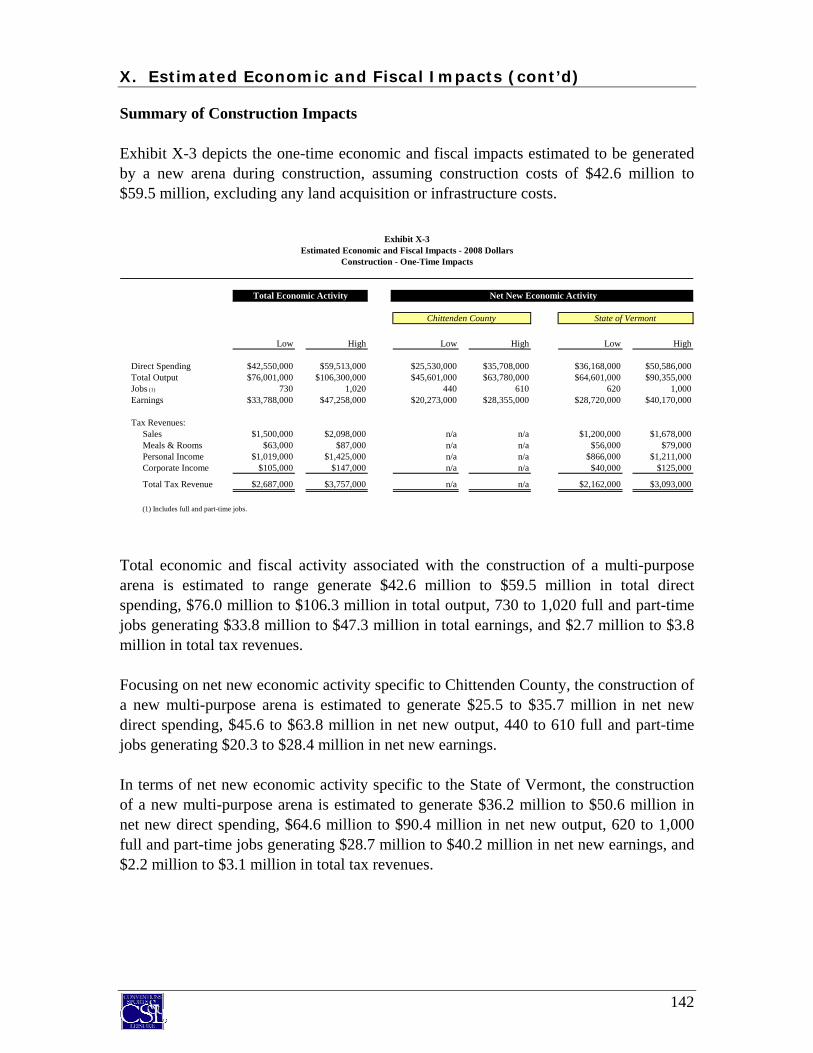
X. Estimated Economic and Fiscal Impacts (cont’d)
142
Summary of Construction Impacts Exhibit X-3 depicts the one-time economic and fiscal impacts estimated to be generated by a new arena during construction, assuming construction costs of $42.6 million to $59.5 million, excluding any land acquisition or infrastructure costs.
Total economic and fiscal activity associated with the construction of a multi-purpose arena is estimated to range generate $42.6 million to $59.5 million in total direct spending, $76.0 million to $106.3 million in total output, 730 to 1,020 full and part-time jobs generating $33.8 million to $47.3 million in total earnings, and $2.7 million to $3.8 million in total tax revenues. Focusing on net new economic activity specific to Chittenden County, the construction of a new multi-purpose arena is estimated to generate $25.5 to $35.7 million in net new direct spending, $45.6 to $63.8 million in net new output, 440 to 610 full and part-time jobs generating $20.3 to $28.4 million in net new earnings. In terms of net new economic activity specific to the State of Vermont, the construction of a new multi-purpose arena is estimated to generate $36.2 million to $50.6 million in net new direct spending, $64.6 million to $90.4 million in net new output, 620 to 1,000 full and part-time jobs generating $28.7 million to $40.2 million in net new earnings, and $2.2 million to $3.1 million in total tax revenues.
Exhibit X-3Estimated Economic and Fiscal Impacts - 2008 Dollars
Construction - One-Time Impacts
Total Economic Activity Net New Economic Activity
Chittenden County State of Vermont
Low High Low High Low High
Direct Spending $42,550,000 $59,513,000 $25,530,000 $35,708,000 $36,168,000 $50,586,000Total Output $76,001,000 $106,300,000 $45,601,000 $63,780,000 $64,601,000 $90,355,000Jobs (1) 730 1,020 440 610 620 1,000Earnings $33,788,000 $47,258,000 $20,273,000 $28,355,000 $28,720,000 $40,170,000
Tax Revenues:Sales $1,500,000 $2,098,000 n/a n/a $1,200,000 $1,678,000Meals & Rooms $63,000 $87,000 n/a n/a $56,000 $79,000Personal Income $1,019,000 $1,425,000 n/a n/a $866,000 $1,211,000Corporate Income $105,000 $147,000 n/a n/a $40,000 $125,000
Total Tax Revenue $2,687,000 $3,757,000 n/a n/a $2,162,000 $3,093,000
(1) Includes full and part-time jobs.

X. Estimated Economic and Fiscal Impacts (cont’d)
143
Summary of Operations Impacts Exhibit X-4 shows the annual economic and fiscal impacts estimated to be generated by a new arena as well as the net present value of the tax revenues over a 30-year period.
Benefits - UVM as Only Tenant As shown in the exhibit, a new multi-purpose arena with UVM as the only tenants is estimated to generate $14.6 million to $16.8 million in total annual direct spending, $24.9 million to $28.6 million in total annual output, 490 to 560 full and part-time jobs generating $10.8 million to $12.3 million in total annual earnings, and $1.7 million to $2.0 million in total tax revenues. The net present value of total tax benefits over a 30-year period is estimated to be $37.0 to $43.0 million.
Exhibit X-4Estimated Economic and Fiscal Impacts - 2008 Dollars
Operations - Annually Recurring
Total Economic Activity Net New Economic Activity
UVM as Only Tenants
Chittenden County State of Vermont
Base Case Best Case Base Case Best Case Base Case Best Case
Direct Spending $14,633,000 $16,828,000 $6,259,000 $7,514,000 $2,801,000 $3,493,000Total Output $24,914,000 $28,633,000 $10,542,000 $12,648,000 $4,695,000 $5,852,000Jobs (1) 490 560 210 250 90 120Earnings $10,894,000 $12,469,000 $4,420,000 $5,285,000 $1,936,000 $2,407,000
Tax Revenues:Sales $830,000 $955,000 n/a n/a $157,000 $196,000Meals & Rooms $494,000 $593,000 n/a n/a $170,000 $218,000Personal Income $328,000 $376,000 n/a n/a $58,000 $73,000Corporate Income $34,000 $40,000 n/a n/a $6,000 $8,000
Total Tax Revenue $1,686,000 $1,964,000 n/a n/a $391,000 $495,000
30-Year Tax Benefit (2) $37,000,000 $43,000,000 n/a n/a $8,600,000 $10,900,000
UVM and Minor League Team(s) as Tenants
Chittenden County State of Vermont
Base Case Best Case Base Case Best Case Base Case Best Case
Direct Spending $17,649,000 $19,894,000 $8,226,000 $9,172,000 $4,097,000 $4,703,000Total Output $29,971,000 $33,779,000 $13,819,000 $15,406,000 $6,850,000 $7,861,000Jobs (1) 590 670 270 300 140 160Earnings $12,929,000 $14,538,000 $5,735,000 $6,388,000 $2,803,000 $3,211,000
Tax Revenues:Sales $1,000,000 $1,127,000 n/a n/a $230,000 $264,000Meals & Rooms $699,000 $798,000 n/a n/a $289,000 $334,000Personal Income $390,000 $438,000 n/a n/a $85,000 $97,000Corporate Income $41,000 $47,000 n/a n/a $9,000 $11,000Total Tax Revenue $2,130,000 $2,410,000 n/a n/a $613,000 $706,000
30-Year Tax Benefit (2) $46,700,000 $52,800,000 n/a n/a $13,400,000 $15,500,000
(1) Includes full and part-time jobs.(2) Net present value (2008 dollars) of expected benefits over the expected useful life of the arena assuming 3 percent annual revenue growth and a 6 percent discount rate.

X. Estimated Economic and Fiscal Impacts (cont’d)
144
Focusing on net new economic activity specific to Chittenden County, a new multi-purpose arena with UVM as the only tenant is estimated to generate $6.3 million to $7.5 million in net new annual direct spending, $10.5 million to $12.6 million in net new annual output, 210 to 250 full and part-time jobs generating $4.4 million to $5.3 million in net new annual earnings. In terms of net new economic activity specific to the State of Vermont, a new multi-purpose arena with UVM as the only tenant is estimated to generate $2.8 million to $3.5 million in net new annual direct spending, $4.7 million to $5.9 million in net new annual output, 90 to 120 full and part-time jobs generating $2.0 million to $2.4 million in net new annual earnings, and $391,000 to $495,000 in net annual tax revenues. The net present value of net new tax benefits over a 30-year period is estimated to be $8.6 million to $10.9 million. Benefits - UVM and Minor League Team(s) as Tenants In general, the economic and fiscal impacts generated by a multi-purpose arena with both UVM and minor league team(s) as tenants is expected to be greater than UVM as tenants alone. The impact is expected to be greater because there will likely be more events and attendees attracted to the facility. Additionally, the impacts associated with visiting teams increased. As shown depicted in the exhibit on the previous page, a new multi-purpose arena with UVM and a minor league team(s) as tenants is estimated to generate $17.6 million to $19.9 million in total annual direct spending, $30.0 million to $33.8 million in total annual output, 590 to 670 full and part-time jobs generating $12.9 million to $14.5 million in total annual earnings, and $2.1 million to $2.4 million in total tax revenues. The net present value of total tax benefits over a 30-year period is estimated to be $46.7 million to $52.8 million. Focusing on net new economic activity specific to Chittenden County, a new multi-purpose arena with UVM and a minor league team(s) as tenants is estimated to generate $8.2 million to $9.2 million in net new annual direct spending, $13.8 million to $15.4 million in net new annual output, 270 to 300 full and part-time jobs generating $5.7 million to $6.4 million in net new annual earnings.

X. Estimated Economic and Fiscal Impacts (cont’d)
145
In terms of net new economic activity specific to the State of Vermont, a new multi-purpose arena with UVM and a minor league team(s) as tenants is estimated to generate $4.1 million to $4.7 million in net new annual direct spending, $6.9 million to $7.9 million in net new annual output, 140 to 160 full and part-time jobs generating $2.8 million to $3.2 million in net new annual earnings, and $613,000 to $706,000 in net annual tax revenues. The net present value of net new tax benefits over a 30-year period is estimated to be $13.4 million to $15.5 million. Non-Quantifiable Benefits In addition to the economic effects of money spent on facility construction and at facility events, communities can generate additional benefits from the development of a new arena through the development of restaurants, bars, hotels and other establishments in the surrounding area. Several communities have found that the development of entertainment facilities can spur new business growth and revitalize the immediate area in which the new facility is developed. The effects of attracting patrons to a concentrated area will impact numerous industries and enhance economic activity throughout the market area. Primary visitor industries including hotel, restaurant, retail and related industries can benefit directly from the proposed arena. Indirect impacts can benefit support industries including transportation, wholesale, manufacturing, warehousing and other such industries. In addition to the more quantifiable benefits generated from the construction and operations of the proposed arena, some benefits cannot be quantitatively measured. Potential qualitative benefits for the local and regional market area could include:
• enhanced economic growth and ancillary private sector development spurred by the operation of an arena;
• diversified, affordable entertainment alternatives for families in the local area;
• additional youth hockey and recreational programs for local residents;
• new advertising opportunities for local businesses;
• enhanced community pride, self-image, exposure and reputation; and,
• other such benefits.
The proposed arena could create a working synergy in conjunction with other downtown initiatives and existing businesses. Together these establishments could enhance the area's reputation as an entertainment destination.

CONFIDENTIAL DRAFTFor Discussion Purposes Only
For Internal Use
Executive Summary
I. Introduction
II. Review of Ernst & Young Study
III. Local Market Analysis
IV. Competitive Facilities
V. Comparable Facilities
VI. Market Surveys
VII. Estimated Event Demand
VIII. Building Program and Cost
IX. Estimated Financial Operations
X. Estimated Economic and Fiscal Impacts
XI. Management Options
XII. Funding Options
XI. Management Options

XI. Management Options
146
An important issue impacting the viability of the multi-purpose arena will be governance-related issues. Governance issues generally relate to facility ownership and management. The purpose of this section of the report is to provide a review of various governance issues related to multi-purpose arenas. Facility Ownership In general, arenas are either owned by the public (government) sector, a university (public or private), an authority, or a private sector entity. Exhibit XI-1 summarizes the ownership of comparable arenas with seating capacities between 5,000 and 10,000 seats, which have been built since 1995.
As illustrated in the exhibit, the majority of arenas are owned by public sector entities (city, county or state government), comprising approximately 55 percent of the ownership of new arenas. Universities comprised the next largest ownership group at approximately 35 percent. Public authorities own approximately seven percent and private entities own approximately three percent of the comparable facilities analyzed.
Exhibit XI-1Facility Ownership
New Arenas Opened Since 1995 (1)
(1) Arenas with fixed seating capacities between 5,000 and 10,000 seats.
University Owned34.5%
Government Owned55.2%
Authority Owned6.9%
Privately Owned3.4%

XI. Management Options
147
Facility Management Perhaps more than other factors, high-quality management and marketing affect an arena’s utilization and financial performance. Professional and aggressive management can positively influence the number of events hosted at a facility, the ability to attract and retain minor league sports tenants, operate efficiently and provide attendees with an enjoyable experience. There are generally three types of management options related to arena facility operations. These management options include:
• University Management; • Public Management; and, • Private Management.
Exhibit XI-2 summarizes the ownership of comparable arenas with seating capacities between 5,000 and 10,000 seats, which have been built since 1995.
Exhibit XI-2Facility Management
New Arenas Opened Since 1995 (1)
(1) Arenas with fixed seating capacities between 5,000 and 10,000 seats.
University Managed
31.0%
Privately Managed
62.1%
Publicly Managed
6.9%

XI. Management Options
148
As shown in previous exhibit, the majority of comparable arenas are privately managed. Specifically, approximately 62 percent of comparable arenas analyzed are managed by a private arena management company where as 31 percent are managed by a university (athletics/student affairs/facilities department) and 7 percent are managed by a public sector entity. The remainder of this section summarizes the various arena management options and the associated advantages and disadvantages of each. University Management Arena management by a university entity typically occurs when the facility is located on campus and university athletics serves as the primary tenants. The advantage of this type of management structure for the university is control over all revenue sources and date scheduling. However, the university would incur the cost of operating the facility and would be required to staff facility operations. Additionally, if the proposed facility is to be positioned as a community facility, it will be essential that non-university events be attracted to the facility. If this is the case, then the University would be operating outside its core missions and using its resources for those purposes. This type of facility structure is appropriate when the facility is generally exclusively used for athletics or is capable of leveraging additional revenue streams for athletics due to a strong demand for other events. Examples of facilities that are managed by university athletics departments include the Kohl Center at the University of Wisconsin or Haas Pavilion at the University of California – Berkeley. An alternative to management by athletics is university management by another university group such as student affairs or facility services. Under this management scenario, athletics programs are tenants in the building and typically pay a flat rent per game plus reimbursements to the facility for event-related costs. Oftentimes, the priority for events under this management option is for university athletic events, followed by non-athletic university events and, finally, non-university events. Examples of facilities that are managed by a non-athletic department of the university include the Reynolds Center at the University of Tulsa and Assembly Hall at the University of Illinois. A summary of key advantages and disadvantages associated with university management include, but are not limited to:
Advantages:
• Owner control; • Athletics/university scheduling priorities; • University financial support;

XI. Management Options
149
• Coordination/sharing of staff/support functions; and, • Bulk-price purchasing.
Disadvantages:
• Purchasing procedures; • University operating constraints; • Contract approval requirements; • Lack of incentives; and, • Limited flexibility.
Public Management Public management of arenas and other public assembly facilities was commonplace prior to the 1990’s. Facility operational control within a government is typically accomplished either by creating a separate department that is responsible for arena management or by designating facility management the responsibility of a department which already exists within the government. Often a government will already have other existing public assembly facilities such as stadiums, auditoriums or theatres under their control prior to the development of a new facility. In these cases, the governmental departments currently overseeing the other pubic assembly facilities could control the new arena as well. An advantage of government management pertains to the ability to maintain control of all aspects of facility operations. Within this structure, the management’s primary responsibility is to the city/county government and the facility. The ability to combine the purchase of goods and services with other governmental departments provides an advantage in maximizing purchasing power and rate structures. In addition, the ability to use governmental employees from other departments when needed can be advantageous. Further, assuming day-to-day management of the facility is also handled internally, the need to pay additional fees to a management contractor is not required. A number of potential disadvantages can be associated with the management of the facility within a governmental department. The primary disadvantages relate to the additional burden placed on governmental departments and the additional level of bureaucracy sometimes required to facilitate building operating decisions. The decisions that are made regarding the operation of a facility may be slowed due to the nature of the particular governmental department in terms of requirements for approvals and other regulations and procedures. When competing with other facilities and markets for potential events, this aspect can sometimes hinder an arena’s ability to effectively compete.

XI. Management Options
150
A summary of key advantages and disadvantages associated with public management include, but are not limited to: Advantages:
• Owner control; • Financial support; • Coordination/sharing of staff/support functions; and, • Bulk-price purchasing
Disadvantages:
• Purchasing procedures; • Civic service constraints; • Contract approval requirements; • Changing political policies; • Lack of incentives; and, • Limited flexibility.
Private Management Intense and increasing levels of competition among facilities coupled with increased pressure from governmental entities for the facilities to break even has forced many governments to attempt changes in the fundamental process of managing arenas. As a result, a number of arenas across the country have day-to-day operations contracted to a private management company. Oftentimes, contract management supplies full facility management services, consulting and project services. Under full or contract management, the owner retains all of the rights and privileges of ownership while the contract management firm performs assigned management functions. The owner sets policies while the contract management firm establishes procedures in order to implement the policies. The following are some of the major arena management companies.
• Compass Facility Management, Inc. (Compass);
• Global Spectrum;
• SMG;
• Volume Services America (Centerplate Management division).

XI. Management Options
151
The private management company is typically an agent of the hiring body (either a government department or an Authority). The firm is usually compensated with a flat annual fee plus incentive payment designed to reward the contractor for producing desired results. Incentives could be based on achieving specific revenue goals, attendance, events, room night generation, or other targets. Operating contracts usually stipulate that operating budgets must be submitted by the management company to the governing body of the facility for approval. The governing body is responsible for providing the funds necessary to operate the facility. Private management solutions are typically responsible for various key operational and fiscal facility factors such as policies and directives, organization structure, leadership, job classifications, competition, scheduling and booking, finance and accounting, and capital repairs. In addition to the day-to-day operation of the venue, a number of private management firms also offer project services such as pre-opening management services, audit services of various operations and marketing support which is an alternative approach to full facility management. A summary of key advantages and disadvantages associated with private management include, but are not limited to:
Advantages:
• Greatest operating autonomy; • Efficiency incentives; • Network of relationships to leverage event bookings; • Internal network of knowledge/experience; • More independence in negotiations; • Greater staffing resources; • More objective criteria for accountability; • More efficient procurement process; • Design and pre-opening services; and, • Less financial risk for owner.
Disadvantages:
• Less direct control; • Profit motive versus economic impact motive; • Facility management fees; and, • Management personnel turnover.
XI. Management Options
152
Summary The appropriate facility ownership will depend on the various parties that may ultimately be involved in the planning, development, financing and on-going operations of the proposed arena. Should there be multiple parties involved, it is recommended the proposed arena ownership be in the form of an authority or a commission. The authority or commission should have representation from each of the potential project stakeholders, which may include, but are not necessarily limited to UVM, the State, local municipalities, corporate community, hospitality industry and others, as appropriate. Examples of these types of entities include the Harris County-Houston Sports Authority or the New Jersey Exposition Authority, among others. Given the market size and geographic location of Burlington relative to other markets, it is recommended that the proposed arena be managed by a private arena management company. This will allow that market and the facility to benefit from the expertise of experienced arena managers and to “tap into” the network of events and relationships established by private arena management companies. It should be noted that the event estimates and financial projections presented in this report assume that the proposed arena is managed by a competent and experienced arena management company.

CONFIDENTIAL DRAFTFor Discussion Purposes Only
For Internal Use
Executive Summary
I. Introduction
II. Review of Ernst & Young Study
III. Local Market Analysis
IV. Competitive Facilities
V. Comparable Facilities
VI. Market Surveys
VII. Estimated Event Demand
VIII. Building Program and Cost
IX. Estimated Financial Operations
X. Estimated Economic and Fiscal Impacts
XI. Management Options
XII. Funding Options
XII. Funding Options

XII. Funding Options
153
It is estimated that a proposed 6,500 fixed seat, multi-purpose arena on the UVM campus could cost between $43 million and $60 million depending upon the building program and finish-out, excluding land acquisition, parking or infrastructure costs. Assuming an interest rate of 5.5 percent and 30-year bonds, annual debt service payments could approximate $3.0 million to $4.1 million annually if the entire amount is financed. Based on the financial analysis presented earlier in this report, it is estimated that the proposed multi-purpose arena’s financial operating results could range from a deficit of $199,000 to an operating surplus of $425,000 before debt service (and capital reserve) each year. As a result, the net operating income of a multi-purpose arena operating on the UVM campus is not expected to be sufficient to service debt related to total project costs. However, this is typical of virtually all arenas operating today. Historically, the development of arenas has generally involved varying degrees of public-private partnerships. The purpose of this section is to summarize various funding sources that could be used to construct a multi-purpose arena on the UVM campus. The funding analysis of the proposed arena is presented in the following sections:
• Overview of Comparable Arena Funding; • Financing Techniques and Vehicles; and, • Quantified Funding Sources.
Overview of Comparable Arena Funding A review of funding sources used to fund comparable arenas can be useful in identifying various sources of funds that could be used to fund the construction of the proposed multi-purpose arena. Exhibit XII-1 on the following page presents a summary of public and private funding participation for the comparable facilities profiled previously in the report, as well as the specific sources of funds used. Of the venues analyzed herein, the public and private sector accounted for, on average, approximately 45.0 percent and 55.0 percent of funding, respectively. The average public sector contribution was approximately $21.7 million and the average private sector contribution was approximately $31.7 million. It should be noted that public sector financing generally originates from government-related sources with no ties to arena operations. Such funds could include general funds or tax revenues. Private sector financing can take many forms and can include revenues generated from arena operations, private donations, student fees and other such sources.

XII. Funding Options (con’t)
154

XII. Funding Options (con’t)
155
In reviewing only those facilities that were associated with a university, the public sector contributed, on average, 36.1 percent of project funding and the private sector contributed approximately 63.9 percent. For purposes of this analysis, funds contributed by universities, whether public or private, that are secured by student fees, general funds, university facility revenues, or other sources are characterized as private sources of funds as they do not represent funds from governmental revenue sources such as tax revenues or general funds. In reviewing those facilities that are not affiliated with a university, the public sector contributed 67.1 percent towards projects costs, while private sources of funds paid for approximately 32.9 percent of project costs. Of the arenas analyzed herein, public funding sources included:
• State grant or appropriations; • Hotel taxes; • Meals and rooms taxes; • Sales taxes; and, • Community development block grant.
Private funding sources included:
• Student fees; • Naming rights; • Donations; • Premium seating; • Private management rights; • Personal seat license (PSLs); • Ticket surcharge; • Arena revenues; and, • University general funds.
The remainder of this section provides a summary of various financing vehicles that have been used to finance comparable arena projects as well as a quantified analysis of specific funding sources that may be available to fund a multi-purpose arena on the UVM campus.

XII. Funding Options (con’t)
156
Financing Techniques and Vehicles The development and financing of sports and entertainment facilities throughout the country in recent years has largely relied on a combination of both public and private sector financing. The enhanced revenue-generating capabilities of new facilities have encouraged more public/private partnerships whereby public sector financing vehicles are supplemented with private sector revenue streams. In many cases, a public sector entity will issue some form of bond to wholly or partially finance the construction of the facility. The annual debt service required to retire the bonds is then sourced from a general fund and/or from various tax revenues including sales, hotel/motel, restaurant, entertainment and other taxes, as well as other revenue sources such as facility-related revenues. The types of financing mechanisms typically used in funding sports and entertainment facilities are summarized below.
Revenue Bonds A frequently used method of sports and entertainment facility financing is the issuance of revenue bonds. Revenue bonds are special obligations issued by the respective State for which payment is dependent upon a particular source of funds, such as revenues generated by the project, to provide the amount needed for bond repayment. The issuer of the bonds pledges to the bondholders the revenues generated by the project being financed. No pledge of state or local ad valorem tax revenues is required; however, other taxes may be assessed and/or pledged in whole or in part by a municipality or by the state, often with legislative approval, to provide funds necessary to pay off the revenue bond offering. It may be the case, however, that any change in tax rates or allocation would have to be approved by public referendum. The major disadvantage associated with revenue bonds relates to interest rates that are typically higher than those associated with general obligation bonds. This is largely due to the fact that revenue bonds are not backed by the full faith and credit of the issuing entity. In addition, funding of a debt service reserve and other credit enhancement out of bond proceeds makes the required bond size larger with higher annual debt service payments. Revenue bond financing may be structured in such a way that payments may be tied to a lower variable rate in the initial years of operation and converted to a higher fixed rate in later years. This is often advantageous in situations where the particular revenue stream or streams that are pledged to bond debt service are expected to increase annually. Representatives from the State of Vermont’s

XII. Funding Options (con’t)
157
Treasurer’s Office indicated they were unaware of any capital projects funded through state-issued revenue bonds in the past. General Obligation (GO) Bonds The Office of the State Treasurer is responsible for the issuance and management of general obligation bonds. In the State of Vermont, general obligation bonds are used for numerous purposes including construction and renovation of state office buildings, state recreational, cultural, health, correctional and educational facilities, and for other capital projects. General obligation bonds are backed by the full faith and credit of the local government and paid for through general fund property taxes. This pledge is generally supported by a commitment from the issuer to repay the principal and interest through whatever means may be necessary, including levying additional taxes. The advantages associated with general obligations bonds revolve around the strength of the credit. It typically results in a simple financing that lowers the cost of issuance and reduces the bond size, since a debt service reserve fund is often not required. Also, the strength of the pledge provides a higher credit rating and, therefore, a lower cost of financing the project. Similar to revenue bonds, general obligation bond financing may also be structured with a lower variable interest rate in the early years of the project with conversion to a fixed rate in later years; however, this could require legislation to be enacted. The primary disadvantage associated with general obligation indebtedness is that the bonding capacity for other capital needs is reduced. Projects financed with general obligation bonds in Vermont typically do not need voter approval and do not require a public referendum. Certificates of Participation
Certificates of Participation (COPs) represent another financial instrument that has been used to finance sports facilities. COP holders are repaid through an annual lease appropriation by a sponsoring governmental agency. COPs do not legally commit the governmental entity to repay the certificate holder beyond the annual appropriations, and therefore do not typically require voter approval. Further, this type of instrument is not subject to many of the limitations and restrictions typically associated with general obligation bonds. As COPs generally offer the issuing authority less financial risk and more flexibility than other financing instruments, they tend to be more cumbersome due to the reliance
XII. Funding Options (con’t)
158
of the trustee for appropriations while typically carrying a higher coupon rate relative to traditional general obligation bonds.
COPs could allow the City of South Burlington, State of Vermont or UVM to enhance a revenue source with a pledge to make up any revenue deficiencies from other funds. This issue would be subject to annual appropriation. The certificates usually imply that some other security, such as revenue from operations or a sales tax, will be relied on as the primary source of credit worthiness.
The primary advantage associated with certificates of participation is that the obligation enhances the issue, resulting in an interest rate more favorable than a standard revenue bond issue. The disadvantage associated with COPs is that primary credit must still be established. Private Placement
Although not commonplace, several sports facilities have been financed with private placements issued by a team or private entity. Examples of facilities that have been funded through private placements include the Save Mart Center at Fresno State University, American Airlines Arena in Miami, Florida and the Pepsi Arena in Denver, Colorado. Private placements are often secured by revenue streams, usually contractually-obligated revenue streams, of the facility. Given the potential economics of the proposed arena and any minor league franchise that could be a tenant in the facility, it is unlikely that a private placement would be used to fund the proposed arena.
Quantified Funding Sources The purpose of this section is to present a summary of the estimated funding potential of various private and public sector revenue sources that could represent potential sources of project funding. The funding analysis presented herein is not intended to an exhaustive review of all potential funding sources, but rather a review of the more common funding sources that may be available specific to this project.
XII. Funding Options (con’t)
159
Private Sources Based on a review of local facility and comparable facility funding sources, the most likely potential sources of private sector funding for the proposed arena could include but is not limited to:
• Student fees; • Private donations (capital gifts); • Ticket surcharges; • Permanent seat licenses; • Contractually-obligated income; • Arena operating income; • Incremental income to UVM; • Concessionaire/vendor rights; and, • Other sources.
Student Fees The use of student fees to fund construction of university athletic facilities is commonplace. Of the university arenas analyzed in this section, 30 percent used student fee proceeds to fund all or a portion of arena project costs, with contributions ranging from $3 million to $40 million. Examples of facilities that have been funded, all or in part, by students fees include the Ryan Center (University of Rhode Island), Ted Constant Center (Old Dominion University), Convocation Center (University of Northern Illinois), and United Spirit Arena (Texas Tech University), among others. The current level of combined tuition and student fee assessments at UVM is among the highest of universities in the regional area. In 2003-04, UVM’s average tuition and fees were $9,636 for state residents and $22,688 for non-residents. A comparison of student charges among 21 selected public institutions indicated that UVM had the second highest charges. Exhibit XII-2 on the following page summarizes the estimated student fees for the 2004-05 school year, excluding tuition, room and board, and other charges.

XII. Funding Options (con’t)
160
To gain an understanding of the potential support by students to increase student fees to fund all or a portion of arena costs, UVM students were asked whether they would support the use of student fees to fund a new arena. Exhibit XII-3 summarizes the responses from 357 random surveys of UVM students.
As shown in the Exhibit, the overwhelming majority of UVM students would not support the use of student fees to fund a new arena. Given the strong negative response of students and the fact that UVM’s existing student fees are relatively high, it is unlikely that an increase in student fees could be used to fund a significant portion of project costs
Exhibit XII-2UVM Comprehensive Student Fees - 2004-05
ComprehensiveFee
Credit Hours Per Semester
Full-Time Undergraduate 12 to 18 $557Full-Time Graduate 12 $498Part-Time Undergraduate and Graduate 4 $158Part-Time Undergraduate and Graduate 5 $186Part-Time Undergraduate and Graduate 6 $206Part-Time Undergraduate and Graduate 7 $234Part-Time Undergraduate and Graduate 8 $260
Note: Other fees apply for on-campus students and other situations.
Exhibit XII-3Support for Use of Student Fees to Fund New Arena
73%
12%
9%
6%
0% 10% 20% 30% 40% 50% 60% 70% 80%
Wound Not Support
Possibly Support
Likely Support
Definitely Support
XII. Funding Options (con’t)
161
associated with a new arena without placing the university at a significant competitive disadvantage with respect to student recruiting and enrollment. Exhibit XII-4 has been prepared to illustrate the amount of incremental revenues that could be generated by an increase in student fees. The growth in student enrollment and the number of credit hours enrolled could impact the level of fees realized.
As shown in the exhibit, it is estimated that an increase in the average student fee of $50 per year (not per semester or credit hour) could generate $550,000 in annual revenue. A $250 increase in the student could generate approximately $2.8 million in annual revenue. Private Donations (Capital Gifts) Universities often implement capital campaigns to raise money to fund all or portions of project costs associated with athletic facilities. Of the university facilities analyzed herein, 70 percent involved funding that included private donations or capital gifts, totaling $5 million to $65 million. Examples of facilities that have been funded, all or in part, by private donations (capital gifts) include the Harry Agganis Arena (Boston University), Convocation Center (University of Miami), Jenny Craig Pavilion (University of San Diego) and the Ryan Center (University of Rhode Island), among others. If a capital campaign is undertaken for the proposed arena, it is likely that a comprehensive naming rights program would need to be developed to honor those individuals or corporations that make donations to the project. Comprehensive naming rights programs include the development of numerous naming opportunities for various aspects of the facility that may include, but are not limited to areas such as the arena, practice facility, rink, court, entrances, locker rooms, offices, club lounge, concession areas, concourse and other such areas.
Exhibit XII-4Student Fee Increase Revenue Potential
AssumedAverage Incremental Estimated EstimatedAnnual Student AnnualStudent Fee Enrollment Revenue
$50.00 11,000 $550,000$100.00 11,000 $1,100,000$150.00 11,000 $1,650,000$200.00 11,000 $2,200,000$250.00 11,000 $2,750,000

XII. Funding Options (con’t)
162
It is important to note that facility naming rights associated with the title name to the arena were assumed in the operating revenues projected in this report. Therefore, if naming rights of the arena were used to fund a portion of project costs, the operating projections presented in this report would need to be adjusted to reflect the use of those revenues for non-operating costs. Based on a review of private donation amounts for comparable universities, it is estimated that UVM could raise between $5 million and $15 million from private donations. While outside the scope of this study, primary market research via personal interviews with top donors and area corporations should be considered to assess the market potential for private donations specific to the arena project in the Burlington marketplace. Many universities establish a capital campaign goal for facility construction as part of the overall funding plan and do not proceed with construction until they meet their capital campaign goal. Ticket Surcharges A surcharge on all tickets sold at the proposed arena that would be dedicated specifically to facility debt retirement could be implemented. Exhibit XII-5 on the following page presents a summary of the estimated revenue potential of various ticket surcharge amounts that could be levied and applied toward debt service retirement. It should be noted that the ticket surcharges assumed below would be in addition to any facility fees, ticket taxes, convenience or handling charges.

XII. Funding Options (con’t)
163
As shown above, it is estimated that for every $0.50 in surcharges added to each ticket sold at the arena a total of $123,850 to $210,125, could be generated annually. A $2.00 surcharge on all paid admissions at the proposed arena could generate $495,400 to $840,500 annually towards project funding. It should be noted that increases in the cost to attend events, even through ticket surcharges, could have negative implications on demand. Personal Seat Licenses The sale of personal seat licenses, or PSLs, can generate upfront money to pay for arena project costs. PSLs are licenses that essentially give the purchaser the right to buy tickets to a particular seat in the arena. Approximately 10 percent of the collegiate arenas summarized in this section used proceeds from PSLs to fund arena project costs. These facilities included the United Spirit Arena at Texas Tech University ($7 million in PSL proceeds) and the Value City Arena at Ohio State University ($17 million from PSL and premium seating). Given the modest capacity size of the proposed arena and the local market demographics, a PSL program is not expected to generate significant levels of upfront funding for the arena project. As an example, if one-half of the 6,500 fixed seats, or 3,250 seats, were subject to the PSL program, an average one-time PSL fee of $1,000 per seat would be required to raise $3.2 million in upfront funding.
Exhibit XII-5Ticket Surcharge Revenue Potential
UVM as Only Tenants UVM and Minor League Hockey as Tenants
Annual AnnualSurcharge Paid Annual Paid AnnualPer Ticket Attendance Revenue Attendance Revenue
Base Case
$0.50 247,700 $123,850 355,140 $177,570$1.00 247,700 $247,700 355,140 $355,140$1.50 247,700 $371,550 355,140 $532,710$2.00 247,700 $495,400 355,140 $710,280
Best Case
$0.50 286,500 $143,250 420,250 $210,125$1.00 286,500 $286,500 420,250 $420,250$1.50 286,500 $429,750 420,250 $630,375$2.00 286,500 $573,000 420,250 $840,500

XII. Funding Options (con’t)
164
While not specifically market tested as part of this study, it is unlikely that a PSL of that price magnitude could be successfully marketed to a high volume of seats. More realistically, it is estimated that a PSL program could generate in the range of $1.0 to $1.5 million. This level of upfront funding relative to the total potential cost of the facility would not likely justify implementing such a program. Contractually-Obligated Income Contractually-obligated income has become a popular source of private funding participation. Contractually-obligated income refers to those revenue streams that are secured through multi-year contracts and include revenue sources such as naming rights, advertising/sponsorship agreements, and private boxes. In the case of contractually-obligated income, it is likely that a private operator would secure financing through a private placement or some other form of financing. It is possible to structure a deal with a public sector entity in which the public sector entity would issue revenue bonds that would be secured by the contractually-obligated income that would be allocated to the public sector entity via a lease. It is important to note that the financial analysis presented previously assumed that these revenue sources were available to fund operations. Should all the aforementioned contractually-obligated income be used as a source of funding, the income from operations of the proposed arena would decrease. Arena Operating Income The net operating income of the arena could represent a potential source of project funding. Based on the financial analysis presented in this report, the estimated operating income of the proposed arena before debt service and capital reserve allocations ranges from a deficit of $199,000 to a surplus of $425,000, as shown in Exhibit XII-6 on the following page.

XII. Funding Options (con’t)
165
Incremental Income to UVM A new arena will likely generate incremental income to UVM through increased attendance at UVM sporting events hosted at the arena, the ability to charge higher ticket prices, and the ability to enhance its priority seating through its Victory Club, among other potential sources of additional revenues. UVM will also likely experience increased costs through rental payments to the arena and increased game-day expenses. Exhibit XII-7 summarizes the estimated net incremental income that could be realized by UVM athletics playing in the proposed arena.
Overall, it is estimated that UVM athletics could realize upwards of $500,000 to $700,000 in incremental revenues each year.
Exhibit XII-6Arena Operating Income
EstimatedAnnual Arena
Operating Scenario Operating Income
UVM as Only Main TenantBase Case Scenario ($201,000)Best Case Scenario $136,000
UVM and Minor Leagues as Main TenantsBase Case Scenario $151,000Best Case Scenario $403,000
Exhibit XII-7UVM Incremental Income
EstimatedUVM Incremental
Operating Scenario Annual Income
Base Case $500,000Best Case $700,000

XII. Funding Options (con’t)
166
Concessionaire / Vendor Rights The operation of concession and novelty sales is generally performed by outside contractors. A significant trend in public assembly facility financing is the sale of the rights to a facility’s concessions operations. Concessionaire fees provide a concessionaire the right to the concession profits for a specified period of time. The concessionaire fee represents a portion of the capitalized revenue streams that are anticipated to be received by the concessionaire over the term of the agreement. Should a concessionaire rights agreement be reached which provides upfront funds, it could lower the annual concession revenue contained by the facility in this report. Another example of a right that could be sold is facility pouring rights. Total funding potential from these types of rights would be in the range of several hundred thousand dollars to a few million dollars. Other Sources Other potential private sources of revenues could come from local foundations, contributions from a minor league hockey tenant, other major facility users, parking surcharges, facility operating profits, sale of brick pavers, land contribution, investment income and other such sources.
Public Sources In addition to private sector funding sources, public sector revenue sources are often used to fund development of multi-purpose arenas. In order to understand the potential acceptance public funding, local residents, businesses and UVM students were asked whether they would support the use of public funds to fund, all or a portion, of a new multi-purpose arena on the UVM campus. On the following page, Exhibit XII-8 summarizes their responses based on random surveys.

XII. Funding Options (con’t)
167
As shown in the Exhibit, upwards of 84 percent of local corporations, 72 percent of the local general public and 69 percent of UVM students indicated some level of potential support for the use of public funds to construct a new arena on the UVM campus. In interpreting this data, it is important to focus on the strength of the positive response (definite, likely or possibly) with the understanding that these percentages could change as more information related to the proposed multi-purpose arena is disseminated to the public. Nonetheless, it initially appears that there could be relatively strong support to use public funds to help pay for a new multi-purpose arena. Based on a review of comparable facility funding sources and discussions with local officials, the most likely sources of public sector funding for the proposed arena could include, but is not limited to:
• Meals and rooms taxes; • Sales and use taxes; and, • Car rental taxes. • Tax-increment financing; • Other taxes; and, • General funds.
Meals and Rooms Tax
Vermont imposes a 9 percent meals and rooms tax on taxable meals and the rent of each occupancy less than thirty days. The liquor portion of the meals tax is 10 percent. Proceeds from the meals and rooms tax are allocated to the state’s General Fund,
Exhibit XII-8Support for Public Funding of New Arena
18% 22% 29%
22% 16% 34%
30% 24% 30%
0% 10% 20% 30% 40% 50% 60% 70% 80% 90% 100%
Students
General Public
Corporations
Definitely Support Likely Support Possibly Support
84%
36%
69%
72%

XII. Funding Options (con’t)
168
accounting for about 10 percent of total fund revenue. In certain cases, a local option tax can increase the meals and rooms tax rate beyond the 9 percent state rate. For example, Williston imposes a 1 percent local options tax in addition to the state rate. Exhibit XII-9 presents a summary of the 2003 taxable receipts and collections from the state meals and rooms tax by various geographic areas including the City of South Burlington, Chittenden County and Vermont.
As shown above, meals and rooms tax revenue generated to the State of Vermont was approximately $100 million in 2003. Of this amount, approximately $25 million was generated in Chittenden County and $8 million was generated in the City of South Burlington. Over the past few years, the meals and rooms tax revenue has grown approximately 5.3 percent per year at the state level. Exhibit XII-10 presents a summary of the estimated annual revenues that could be generated with an increase in the meals and rooms tax in 2006 dollars.
Exhibit XII-92003 Meals and Rooms Taxable Receipts and Revenues
2003 Taxable Receipts9.0% 9.0% 10.0% 2003 Tax Revenues
Geographic Area Meals Rooms Alcohol Amount % of Total
City of South Burlington $53,095,748 $26,559,676 $5,723,609 $7,741,349 7.7%Chittenden County $183,575,401 $59,330,822 $34,160,773 $25,277,637 25.1%Vermont $666,059,298 $323,328,111 $117,301,751 $100,775,042 100.0%
Source: State of Vermont.
Exhibit XII-10Meals and Rooms Tax Revenue Potential
Incremental Estimated Annual Revenue from Tax IncreaseIncrease in City of Chittenden State ofMeals and Rooms Tax South Burlington County Vermont
0.5% $430,000 $1,404,000 $5,599,0001.0% $860,000 $2,809,000 $11,197,0001.5% $1,290,000 $4,213,000 $16,796,000
Note: Presented in 2006 dollars.

XII. Funding Options (con’t)
169
As shown above, a local option meals and rooms tax implemented in the City of South Burlington could generate approximately $430,000 annually for every ½ percent increase in the existing tax rate. At the County level, every ½ percent increase in the meals and rooms tax via a local option tax (currently not allowed at the county level) could generate $1.4 million in annual revenues. A statewide increase in the meals and rooms tax of ½ percent could generate approximately $5.6 million annually. It is important to note that the estimated meals and rooms tax revenues would likely increase over time as spending increases due to population growth, additional hotel rooms, inflation or other such factors. In order to understand the potential support for an increase in the meals and rooms tax to fund all or a portion of arena project costs, local residents, corporations and UVM students were asked to characterize their potential support. Exhibit XII-11 summarizes their responses.
As illustrated in the exhibit, 61 percent of corporate respondents, 48 percent of general public respondents and 43 percent of students indicated some level of positive support for the use of meals and rooms taxes to fund the arena. Again, it is important to note that information regarding the cost, benefits and other parameters of a new arena were not publicly available at the time of the survey. As a result, as more information is disseminated about the arena project, opinions and attitudes could change significantly from those presented in this study.
Exhibit XIII-11Support for Use of Meals and Rooms Tax to Fund New Arena
10% 11% 22%
13% 10% 25%
16% 22% 23%
0% 10% 20% 30% 40% 50% 60% 70% 80% 90% 100%
Students
General Public
Corporations
Definitely Support Likely Support Possibly Support
61%
48%
43%

XII. Funding Options (con’t)
170
Sales and Use Tax Vermont imposes a 6 percent sales and use tax. The general sales and use tax rate is imposed on the buyer on the purchase price of tangible personal property, amusement charges, fabrication charges, some public utility charges and some service contracts. There are 46 exemptions to the tax. Proceeds from the sales and use tax are allocated to the State’s General Fund. In FY 2004, the sales and use tax proceeds are estimated to be approximately $254 million, accounting for about 28 percent of General Fund revenues. In certain cases, local communities have implemented a local options tax in addition to the State sales and use tax rate of 6 percent. Examples of communities that have implemented the local options tax include Manchester, Stratton and Williston. Exhibit XII-12 presents a summary of the 2003 taxable receipts and collections from the state sales and use tax by various geographic areas including the City of South Burlington, Chittenden County and Vermont.
As shown above, sales tax revenue generated to the State of Vermont was upwards of $260 million in 2003. Of this amount, nearly $81 million was generated in Chittenden County and nearly $18 million was generated in the City of South Burlington. Over the past few years, the sales and use tax revenue has grown approximately 2.7 percent per year at the state level. Exhibit XII-13 presents a summary of the estimated annual revenue, in 2006 dollars, which could be associated with an increase in the sales and use tax.
Exhibit XII-122003 Sales and Use Taxable Receipts and Revenues
2003 Taxable Receipts6.0% 6.0% 2003 Estimated Tax Revenues
Geographic Area Gross Retail Use Amount % of Total
City of South Burlington $1,106,955,304 $276,610,508 $18,908,936 $17,731,167 6.7%Chittenden County $4,772,864,201 $1,282,555,825 $66,152,663 $80,922,509 30.4%Vermont $21,263,695,491 $4,214,777,723 $226,024,992 $266,448,163 100.0%
Source: State of Vermont.

XII. Funding Options (con’t)
171
As shown above, local option sales and use tax implemented in the City of South Burlington could generate approximately $985,000 in annual revenue for every ½ percent increase over the existing state tax rate. At the County level, every ½ percent increase in the sales and use tax via a local option tax (currently not allowed at the county level) could generate nearly $4.5 million in annual revenues. A statewide increase in the sales and use tax of ½ percent could generate annual revenues of approximately $14.8 million. It is important to note that the estimated sales tax revenues would likely increase over time as spending increases due to population growth, inflation or other such factors. To understand the potential support for an increase in the sales and use tax to fund all or a portion of arena project costs, local residents, corporations and UVM students were asked to characterize their potential support. Exhibit XII-14 summarizes their responses.
Exhibit XII-14Support for Use of Sales Tax to Fund New Arena
9% 9% 24%
8% 8% 20%
8% 16% 24%
0% 10% 20% 30% 40% 50% 60% 70% 80% 90% 100%
Students
General Public
Corporations
Definitely Support Likely Support Possibly Support
48%
36%
42%
Exhibit XII-13Sales and Use Tax Revenue Potential
Incremental Estimated Annual Revenue from Tax IncreaseIncrease in City of Chittenden State ofSales and Use Tax South Burlington County Vermont
0.5% $985,000 $4,496,000 $14,803,0001.0% $1,970,000 $8,991,000 $29,605,0001.5% $2,955,000 $13,487,000 $44,408,000
Note: Presented in 2006 dollars.

XII. Funding Options (con’t)
172
As illustrated in the exhibit, 48 percent of corporate respondents, 36 percent of general public respondents and 42 percent of students indicated some level of positive support for the use of sales and use taxes to fund the arena. Car Rental Tax
Car rental taxes and other predominately visitor-related taxes have been used in the past to fund sports and entertainment facilities. In addition to other fees charged by other entities (airport, municipalities, etc.), the State of Vermont imposes a seven percent tax on pleasure cars, trailer coaches (with gross weight of 26,000 pounds or less), and trailers (having a gross weight of 3,000 pounds or less) rented on a short-term basis of a period less than one year. Exhibit VII-15 presents a summary of the historical car rental tax revenues collected by the State of Vermont over the past 5 years.
As depicted above, the rental car tax revenue generated to the State was approximately $2.2 million in fiscal year 2004. Exhibit VII-16 presents a summary of the estimated annual revenue that could be generated with an increase in the state car rental tax.
Exhibit VII-15State Car Rental Tax Collections
Taxable Tax TaxFiscal Year Receipts Rate Revenue
2000 $30,000,000 5.0% $1,500,0002001 $36,000,000 5.0% $1,800,0002002 $32,000,000 5.0% $1,600,0002003 $31,286,000 7.0% $2,190,0002004 $31,714,000 7.0% $2,220,000
Exhibit VII-16State Car Rental Tax Revenue Potential
Incremental IncrementalCar Rental Tax AnnualIncrease Revenue
2.0% $634,0003.5% $1,110,0005.0% $1,586,000
Note: Presented in 2006 dollars

XII. Funding Options (con’t)
173
As depicted on the previous page, a 2.0 percent increase in the state’s car rental tax could generate approximately $634,000 annually, a 3.5 percent increase could generate nearly $1.1 million annually, and a 5.0 percent increase could generate nearly $1.6 million annually. Tax Increment Financing (TIF) Tax increment financing (TIF) essentially involves capturing assessed valuation growth within a specific area (i.e. TIF district) related to a particular development. TIF often requires enactment of legislation by the State legislature. Typically, a redevelopment agency delineates a project area and declares a base year. The existing base-assessed valuation is taxed as before by each overlapping taxing entity covering a portion of the project area. The additional assessed valuation, added to the tax rolls over the base, is taxed at the same rate as the base valuation. However, the tax revenues attributed to the new incremental assessed valuation are remitted to the redevelopment agency and used to pay debt service. In November 1996, with the approval of Burlington voters, the City established the Waterfront Tax Increment Financing (TIF) District. The district included all portions of the Waterfront Urban Renewal District north of and including Maple Street. In 1997, the TIF District was expanded to include part of the downtown. Within the TIF district, public investment can be financed by isolating and designating incremental increases in property tax revenues that result from the redevelopment of deteriorated properties. This mechanism is used when a public investment can directly result in subsequent redevelopment efforts by the private sector. To date, the Lake Street reconstruction and the downtown parking garage development are projects in which the City has used the TIF mechanism. Due to the on-campus site location for the proposed arena, it is unlikely that the TIF mechanism could feasibly be a potential funding option due to the site being outside of the district or downtown area. General Funds
The State of Vermont currently manages a budgeted amount of approximately $900 million in General Funds. As of 6/30/03, the State had an outstanding debt on General Funds of approximately $418 million, representing an annual debt service payment of nearly $60 million per year.

XII. Funding Options (con’t)
174
The Vermont Legislature created the Capital Debt Affordability Advisory Committee in 1990 to estimate annually the maximum amount of long-term general obligation debt that may be authorized by the State each year. The Committee’s estimate is required by law to be based on a number of considerations, historic and projected, including debt service requirements, debt service as a percent of General and Transportation Fund revenues, outstanding debt as a percentage of personal income, and per capita debt ratios. On the following page, Exhibit XII-17 summarizes the amount of general obligation debt that has been authorized and issued by the State of Vermont since 1993.
As depicted above, the Capital Debt Affordability Advisory Committee has generally authorized approximately $40 million in bonds in each of the past 8 years. The State’s bond rating from Fitch Investors Service, Inc is AA+, Moody’s Investors Service is Aa1 and Standard and Poor’s AA+. In 2004, the General Fund and Appropriations had an operating surplus of $45.2 million, which was preceded by operating deficits in 2003 and 2002 of $5.9 million and $16.5 million, respectively, and operating surpluses in 2001 and 2000 of $40.7 million and $40.2 million, respectively.
Exhibit XII-17General Bond Debt History
State of Vermont
Debt - ($ millions)Year Authorized Issued
1993 $73.7 $0.01994 64.3 105.01995 60.9 70.01996 50.0 65.01997 42.8 53.01998 42.9 43.51999 39.0 34.32000 39.0 37.02001 34.0 0.02002 39.0 15.02003 39.0 67.42004 39.0 42.2

XII. Funding Options (con’t)
175
Other Public Sources Other taxes that generate revenues, either locally or at the state level, include property, personal income, corporate income, gasoline, insurance, cigarette, liquor, beverage, estate and lottery taxes, among others. Certain taxes such as lottery and gasoline taxes are earmarked for certain uses such as the Education Fund or the Transportation Fund. Others do not generate significant levels of revenue relative to other taxes and would not result in meaningful funding levels if incremental taxes were imposed specifically for the arena project. As a result, proceeds from increases in these taxes have not been estimated as part of this analysis. Additionally, federal funds related to infrastructure improvements may be available to fund portions of the project. Summary An analysis was conducted to evaluate specific funding sources for a multi-purpose arena operating on the UVM campus. A variety of funding vehicles and revenue sources were evaluated. It should be noted that the list of sources is by no means intended to be an exhaustive or cumulative in nature. Rather, the funding analysis developed herein was intended to identify the most typical or likely sources of project funding based on a review of comparable arenas and the resources that may be specifically available in the local market. A review of comparable arena funding indicates that each new arena that has been developed has a unique funding structure and set of goals. The ultimate financing structure of a public assembly facility is dependent on the political, economic and other issues of the related parties. In some markets, the public sector has the ability to finance a substantial portion of the project cost, while in other markets they do not. The same is true of the private sector. Hypothetical funding examples for a multipurpose arena operating on the UVM campus have been developed under several different funding models for the base case scenario assuming UVM as the only tenants. The funding models include three scenarios: (a) both public and private funding sources approximating the average percentage participation of recently developed university-related arenas, (b) public-sector only funding sources, and (c) private-sector only funding sources. For purposes of this hypothetical example, total projects costs of $60 million have been assumed. Additionally, the funding analysis also provides for payment of a capital reserve and arena operating losses accounting for an additional $4.1 million and $5.1 million, respectively, in necessary project funding. In total, it is estimated that total uses of funds could be approximately $69.3 million.

XII. Funding Options (con’t)
176
Under the public-private example, it is assumed that public funds would pay approximately 40 percent of projects costs and private funds would pay approximately 60 percent of project costs. Exhibit XII-18 presents a hypothetical funding scenario assuming revenue from car rental taxes, city sales taxes, student fees, incremental UVM arena income and ticket surcharges.
Under this example, public funding would total $28.5 million and could be derived from a 3.5 percent increase in the State’s car rental tax and a 1.0 percent City of South Burlington sales tax. Private funding would approximate $40.7 million and is assumed to be comprised of revenue from a $150 student fee increase, incremental UVM income generated from the arena, ticket surcharges, and $15 million in capital funding raising. Under this example, debt coverage would range from 1.3 to 2.0.

XII. Funding Options (con’t)
177
Under the public example, it is assumed that 100 percent of project costs would be paid by public funds. Exhibit XII-19 presents a hypothetical funding scenario assuming revenue from meals and rooms tax and a car rental tax.
Under this example, public funding would total $69.3 million and could be derived from a 1.5 percent increase in the meals and rooms tax on a county basis ($50.8 million), a 3.5 percent increase in the State’s car rental tax ($13.4 million) and a $5.0 million State grant or appropriation. Under this example, debt coverage would range from 1.3 to 2.1.
Exhibit XII-1930-Year Funding Analysis
Base Case Scenario - UVM as Only TenantsPublic Example
Total Income Net Income DebtNet Operating Other Sources of Income Before Estimated After Debt andIncome From 1.5% County Meals 3.5% State Debt and Annual Capital and Before Reserve
Year Operations (1) and Rooms Tax (1) Car Rental Tax (1) Capital Reserve Debt Service (2) Reserve (3) Capital Reserve Coverage
2008 ($201,000) $4,213,000 $1,110,000 $5,122,000 ($3,784,000) ($250,000) $1,088,000 1.32009 ($207,000) $4,297,000 $1,132,000 $5,222,000 ($3,784,000) ($258,000) $1,180,000 1.32010 ($213,000) $4,383,000 $1,155,000 $5,325,000 ($3,784,000) ($266,000) $1,275,000 1.32011 ($219,000) $4,471,000 $1,178,000 $5,430,000 ($3,784,000) ($274,000) $1,372,000 1.32012 ($226,000) $4,560,000 $1,202,000 $5,536,000 ($3,784,000) ($282,000) $1,470,000 1.42013 ($233,000) $4,651,000 $1,226,000 $5,644,000 ($3,784,000) ($290,000) $1,570,000 1.42014 ($240,000) $4,744,000 $1,251,000 $5,755,000 ($3,784,000) ($299,000) $1,672,000 1.42015 ($247,000) $4,839,000 $1,276,000 $5,868,000 ($3,784,000) ($308,000) $1,776,000 1.42016 ($254,000) $4,936,000 $1,302,000 $5,984,000 ($3,784,000) ($317,000) $1,883,000 1.52017 ($262,000) $5,035,000 $1,328,000 $6,101,000 ($3,784,000) ($327,000) $1,990,000 1.52018 ($270,000) $5,136,000 $1,355,000 $6,221,000 ($3,784,000) ($337,000) $2,100,000 1.52019 ($278,000) $5,239,000 $1,382,000 $6,343,000 ($3,784,000) ($347,000) $2,212,000 1.52020 ($286,000) $5,344,000 $1,410,000 $6,468,000 ($3,784,000) ($357,000) $2,327,000 1.62021 ($295,000) $5,451,000 $1,438,000 $6,594,000 ($3,784,000) ($368,000) $2,442,000 1.62022 ($304,000) $5,560,000 $1,467,000 $6,723,000 ($3,784,000) ($379,000) $2,560,000 1.62023 ($313,000) $5,671,000 $1,496,000 $6,854,000 ($3,784,000) ($390,000) $2,680,000 1.62024 ($322,000) $5,784,000 $1,526,000 $6,988,000 ($3,784,000) ($402,000) $2,802,000 1.72025 ($332,000) $5,900,000 $1,557,000 $7,125,000 ($3,784,000) ($414,000) $2,927,000 1.72026 ($342,000) $6,018,000 $1,588,000 $7,264,000 ($3,784,000) ($426,000) $3,054,000 1.72027 ($352,000) $6,138,000 $1,620,000 $7,406,000 ($3,784,000) ($439,000) $3,183,000 1.82028 ($363,000) $6,261,000 $1,652,000 $7,550,000 ($3,784,000) ($452,000) $3,314,000 1.82029 ($374,000) $6,386,000 $1,685,000 $7,697,000 ($3,784,000) ($466,000) $3,447,000 1.82030 ($385,000) $6,514,000 $1,719,000 $7,848,000 ($3,784,000) ($480,000) $3,584,000 1.82031 ($397,000) $6,644,000 $1,753,000 $8,000,000 ($3,784,000) ($494,000) $3,722,000 1.92032 ($409,000) $6,777,000 $1,788,000 $8,156,000 ($3,784,000) ($509,000) $3,863,000 1.92033 ($421,000) $6,913,000 $1,824,000 $8,316,000 ($3,784,000) ($524,000) $4,008,000 1.92034 ($434,000) $7,051,000 $1,860,000 $8,477,000 ($3,784,000) ($540,000) $4,153,000 2.02035 ($447,000) $7,192,000 $1,897,000 $8,642,000 ($3,784,000) ($556,000) $4,302,000 2.02036 ($460,000) $7,336,000 $1,935,000 $8,811,000 ($3,784,000) ($573,000) $4,454,000 2.02037 ($474,000) $7,483,000 $1,974,000 $8,983,000 ($3,784,000) ($590,000) $4,609,000 2.1
Total ($9,560,000) $170,927,000 $45,086,000 $206,453,000 ($113,520,000) ($11,914,000) $81,019,000 1.6
NPV (4) ($4,122,000) $76,628,000 $20,209,000 $92,714,000 ($54,996,000) ($5,139,000) $32,580,000 1.5
SOURCES: Amount PercentCounty Meals and Rooms Tax - 1.5% $50,849,000 73.4%State Car Rental Tax - 3.5% $13,412,000 19.4%State Contribution $5,000,000 7.2%
TOTAL SOURCES $69,261,000 100.0%
USES:Construction $60,000,000 86.6%Operating Losses $4,122,000 6.0%Capital Reserve $5,139,000 7.4%
TOTAL USES $69,261,000 100.0%
(1) Estimated to grow two percent per year.(2) Debt service payment based on financing $55 million ($60 million less $5 million state contribution) over 30 years at a 5.5 percent interest rate.(3) Estimated to grow three percent per year.(4) Net present value calculation assumes a 5.5 percent discount rate.
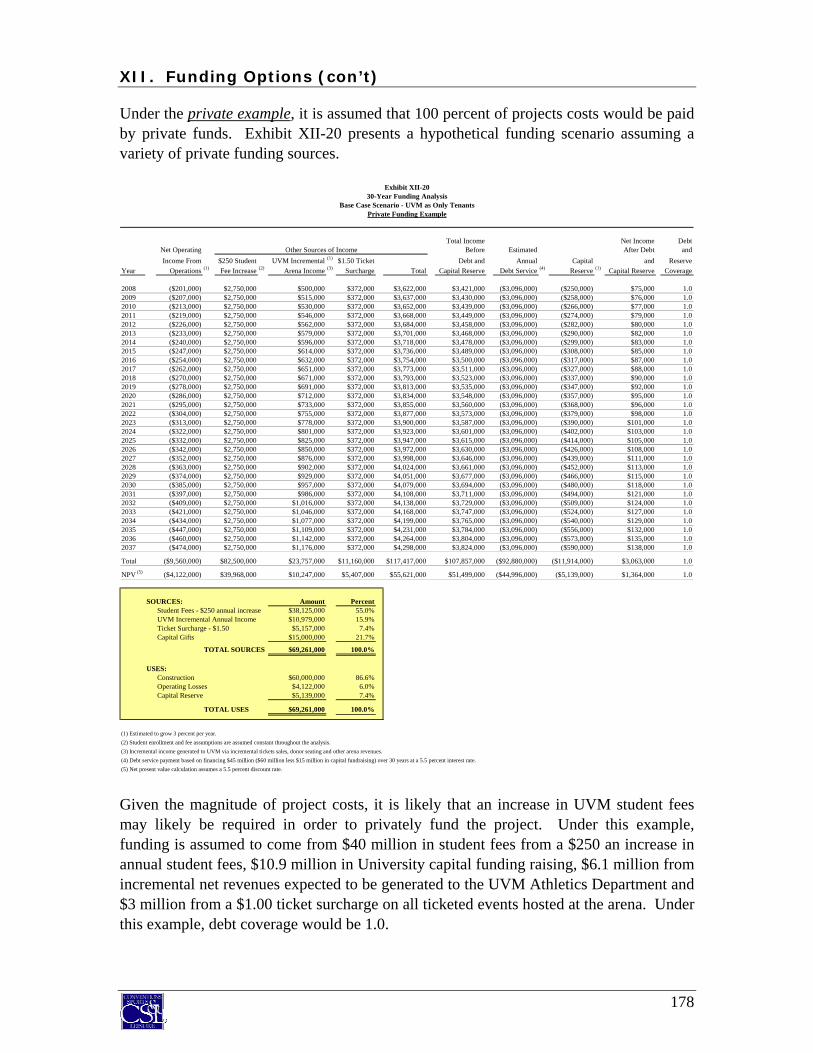
XII. Funding Options (con’t)
178
Under the private example, it is assumed that 100 percent of projects costs would be paid by private funds. Exhibit XII-20 presents a hypothetical funding scenario assuming a variety of private funding sources.
Given the magnitude of project costs, it is likely that an increase in UVM student fees may likely be required in order to privately fund the project. Under this example, funding is assumed to come from $40 million in student fees from a $250 an increase in annual student fees, $10.9 million in University capital funding raising, $6.1 million from incremental net revenues expected to be generated to the UVM Athletics Department and $3 million from a $1.00 ticket surcharge on all ticketed events hosted at the arena. Under this example, debt coverage would be 1.0.
Exhibit XII-2030-Year Funding Analysis
Base Case Scenario - UVM as Only TenantsPrivate Funding Example
Total Income Net Income DebtNet Operating Other Sources of Income Before Estimated After Debt andIncome From $250 Student UVM Incremental (1) $1.50 Ticket Debt and Annual Capital and Reserve
Year Operations (1) Fee Increase (2) Arena Income (3) Surcharge Total Capital Reserve Debt Service (4) Reserve (1) Capital Reserve Coverage
2008 ($201,000) $2,750,000 $500,000 $372,000 $3,622,000 $3,421,000 ($3,096,000) ($250,000) $75,000 1.02009 ($207,000) $2,750,000 $515,000 $372,000 $3,637,000 $3,430,000 ($3,096,000) ($258,000) $76,000 1.02010 ($213,000) $2,750,000 $530,000 $372,000 $3,652,000 $3,439,000 ($3,096,000) ($266,000) $77,000 1.02011 ($219,000) $2,750,000 $546,000 $372,000 $3,668,000 $3,449,000 ($3,096,000) ($274,000) $79,000 1.02012 ($226,000) $2,750,000 $562,000 $372,000 $3,684,000 $3,458,000 ($3,096,000) ($282,000) $80,000 1.02013 ($233,000) $2,750,000 $579,000 $372,000 $3,701,000 $3,468,000 ($3,096,000) ($290,000) $82,000 1.02014 ($240,000) $2,750,000 $596,000 $372,000 $3,718,000 $3,478,000 ($3,096,000) ($299,000) $83,000 1.02015 ($247,000) $2,750,000 $614,000 $372,000 $3,736,000 $3,489,000 ($3,096,000) ($308,000) $85,000 1.02016 ($254,000) $2,750,000 $632,000 $372,000 $3,754,000 $3,500,000 ($3,096,000) ($317,000) $87,000 1.02017 ($262,000) $2,750,000 $651,000 $372,000 $3,773,000 $3,511,000 ($3,096,000) ($327,000) $88,000 1.02018 ($270,000) $2,750,000 $671,000 $372,000 $3,793,000 $3,523,000 ($3,096,000) ($337,000) $90,000 1.02019 ($278,000) $2,750,000 $691,000 $372,000 $3,813,000 $3,535,000 ($3,096,000) ($347,000) $92,000 1.02020 ($286,000) $2,750,000 $712,000 $372,000 $3,834,000 $3,548,000 ($3,096,000) ($357,000) $95,000 1.02021 ($295,000) $2,750,000 $733,000 $372,000 $3,855,000 $3,560,000 ($3,096,000) ($368,000) $96,000 1.02022 ($304,000) $2,750,000 $755,000 $372,000 $3,877,000 $3,573,000 ($3,096,000) ($379,000) $98,000 1.02023 ($313,000) $2,750,000 $778,000 $372,000 $3,900,000 $3,587,000 ($3,096,000) ($390,000) $101,000 1.02024 ($322,000) $2,750,000 $801,000 $372,000 $3,923,000 $3,601,000 ($3,096,000) ($402,000) $103,000 1.02025 ($332,000) $2,750,000 $825,000 $372,000 $3,947,000 $3,615,000 ($3,096,000) ($414,000) $105,000 1.02026 ($342,000) $2,750,000 $850,000 $372,000 $3,972,000 $3,630,000 ($3,096,000) ($426,000) $108,000 1.02027 ($352,000) $2,750,000 $876,000 $372,000 $3,998,000 $3,646,000 ($3,096,000) ($439,000) $111,000 1.02028 ($363,000) $2,750,000 $902,000 $372,000 $4,024,000 $3,661,000 ($3,096,000) ($452,000) $113,000 1.02029 ($374,000) $2,750,000 $929,000 $372,000 $4,051,000 $3,677,000 ($3,096,000) ($466,000) $115,000 1.02030 ($385,000) $2,750,000 $957,000 $372,000 $4,079,000 $3,694,000 ($3,096,000) ($480,000) $118,000 1.02031 ($397,000) $2,750,000 $986,000 $372,000 $4,108,000 $3,711,000 ($3,096,000) ($494,000) $121,000 1.02032 ($409,000) $2,750,000 $1,016,000 $372,000 $4,138,000 $3,729,000 ($3,096,000) ($509,000) $124,000 1.02033 ($421,000) $2,750,000 $1,046,000 $372,000 $4,168,000 $3,747,000 ($3,096,000) ($524,000) $127,000 1.02034 ($434,000) $2,750,000 $1,077,000 $372,000 $4,199,000 $3,765,000 ($3,096,000) ($540,000) $129,000 1.02035 ($447,000) $2,750,000 $1,109,000 $372,000 $4,231,000 $3,784,000 ($3,096,000) ($556,000) $132,000 1.02036 ($460,000) $2,750,000 $1,142,000 $372,000 $4,264,000 $3,804,000 ($3,096,000) ($573,000) $135,000 1.02037 ($474,000) $2,750,000 $1,176,000 $372,000 $4,298,000 $3,824,000 ($3,096,000) ($590,000) $138,000 1.0
Total ($9,560,000) $82,500,000 $23,757,000 $11,160,000 $117,417,000 $107,857,000 ($92,880,000) ($11,914,000) $3,063,000 1.0
NPV (5) ($4,122,000) $39,968,000 $10,247,000 $5,407,000 $55,621,000 $51,499,000 ($44,996,000) ($5,139,000) $1,364,000 1.0
SOURCES: Amount PercentStudent Fees - $250 annual increase $38,125,000 55.0%UVM Incremental Annual Income $10,979,000 15.9%Ticket Surcharge - $1.50 $5,157,000 7.4%Capital Gifts $15,000,000 21.7%
TOTAL SOURCES $69,261,000 100.0%
USES:Construction $60,000,000 86.6%Operating Losses $4,122,000 6.0%Capital Reserve $5,139,000 7.4%
TOTAL USES $69,261,000 100.0%
(1) Estimated to grow 3 percent per year.(2) Student enrollment and fee assumptions are assumed constant throughout the analysis.(3) Incremental income generated to UVM via incremental tickets sales, donor seating and other arena revenues.(4) Debt service payment based on financing $45 million ($60 million less $15 million in capital fundraising) over 30 years at a 5.5 percent interest rate.(5) Net present value calculation assumes a 5.5 percent discount rate.