Embed Size (px)
Citation preview

Ž .Chemical Geology 159 1999 191–204
Vegetation, phytomass and carbon storage in Northern Eurasiaduring the last glacial–interglacial cycle and the Holocene
A.A. Velichko ), E.M. Zelikson, O.K. BorisovaLaboratory of EÕolutionary Geography, Institute of Geography RAS, Staromonetny, 29 Moscow, Russian Federation
Received 7 April 1998; received in revised form 10 September 1998; accepted 27 November 1998
Abstract
Ž .The phytomass the biomass of terrestrial vegetation is one of the main reservoirs of carbon, as carbon makes upwapproximately 0.45 of the phytomass by weight Ajtay, G.L., Ketner, P., Duvigneaud, P., 1979. Terrestrial primary
Ž .production and phytomass. In: Bolin, B., Degens, E.T., Kempe, S., Ketner, P. Eds. , The Global Carbon Cycle, SCOPE 13,xWiley, Chichester, pp. 123–181. . During the glacial–interglacial climatic rhythm both composition and geographical
distribution of vegetation over Northern Eurasia have been repeatedly subjected to major changes, accompanied bycorresponding changes of phytomass and carbon storage. Of special interest are three key intervals within the last 125,000
Ž .years: the Mikulino Eem Interglacial optimum, about 125 ka BP; the Last Glacial maximum, 18–20 ka BP and theHolocene optimum, 5.5–6 ka BP. These intervals correspond to the extreme states of the environment. Vegetation whichexisted in Northern Eurasia 125, 18–20 and 5.5–6 ka BP, accumulated 377.1 Gt, 66.1 Gt and 292.1 Gt of phytomass, whichcorresponds to 169.7 Gt, 29.9 Gt and 131.4 Gt of carbon, respectively. Compared to present-day carbon storage in the
Ž .phytomass of potential vegetation taken as 100% , these values are 155%, 27% and 120%, respectively. q 1999 ElsevierScience B.V. All rights reserved.
Keywords: Vegetation; Phytomass; Carbon
1. Introduction
The phytomass of terrestrial vegetation is one ofthe main reservoirs of carbon storage. Carbon makes
Žup about 45% of the phytomass by weight Ajtay et.al., 1979 . During the last glacial–interglacial cli-
matic cycle vegetation cover was subjected to majorchanges. As a result, the phytomass and carbonstorage also changed. Phytomass and carbon storage
) Corresponding author. Tel.: q7-095-2380298; fax: q7-095-9590033; e-mail: [email protected]
in terrestrial vegetation are reconstructed for fourperiods of time, corresponding to different values of
Ž .global heat supply: 1 for the mean global tempera-Žture 18C higher than the present-day one the cli-
. Ž .matic optimum of the Holocene ; 2 for the maxi-mum cooling of the Last Ice Age, when the meanglobal temperature was 3–48C lower than at present;Ž .3 for the mean global temperature approximately
Ž28C higher than the present-day one the optimum of. Ž .the last, MikulinosEem Interglacial ; 4 for the
Žpresent-day climatic conditions modern carbon stor-age in terrestrial phytomass has been calculated for
Ž . .potential reconstructed vegetation .
0009-2541r99r$ - see front matter q 1999 Elsevier Science B.V. All rights reserved.Ž .PII: S0009-2541 99 00029-7
( )A.A. Velichko et al.rChemical Geology 159 1999 191–204192
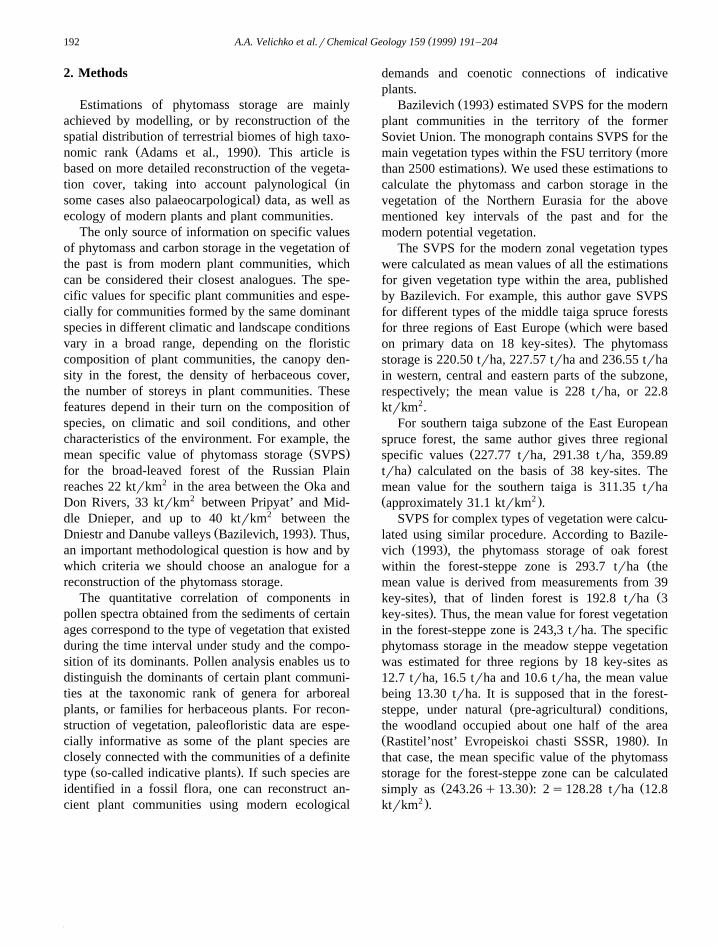
2. Methods
Estimations of phytomass storage are mainlyachieved by modelling, or by reconstruction of thespatial distribution of terrestrial biomes of high taxo-
Ž .nomic rank Adams et al., 1990 . This article isbased on more detailed reconstruction of the vegeta-
Žtion cover, taking into account palynological in.some cases also palaeocarpological data, as well as
ecology of modern plants and plant communities.The only source of information on specific values
of phytomass and carbon storage in the vegetation ofthe past is from modern plant communities, whichcan be considered their closest analogues. The spe-cific values for specific plant communities and espe-cially for communities formed by the same dominantspecies in different climatic and landscape conditionsvary in a broad range, depending on the floristiccomposition of plant communities, the canopy den-sity in the forest, the density of herbaceous cover,the number of storeys in plant communities. Thesefeatures depend in their turn on the composition ofspecies, on climatic and soil conditions, and othercharacteristics of the environment. For example, the
Ž .mean specific value of phytomass storage SVPSfor the broad-leaved forest of the Russian Plainreaches 22 ktrkm2 in the area between the Oka andDon Rivers, 33 ktrkm2 between Pripyat’ and Mid-dle Dnieper, and up to 40 ktrkm2 between the
Ž .Dniestr and Danube valleys Bazilevich, 1993 . Thus,an important methodological question is how and bywhich criteria we should choose an analogue for areconstruction of the phytomass storage.
The quantitative correlation of components inpollen spectra obtained from the sediments of certainages correspond to the type of vegetation that existedduring the time interval under study and the compo-sition of its dominants. Pollen analysis enables us todistinguish the dominants of certain plant communi-ties at the taxonomic rank of genera for arborealplants, or families for herbaceous plants. For recon-struction of vegetation, paleofloristic data are espe-cially informative as some of the plant species areclosely connected with the communities of a definite
Ž .type so-called indicative plants . If such species areidentified in a fossil flora, one can reconstruct an-cient plant communities using modern ecological
demands and coenotic connections of indicativeplants.
Ž .Bazilevich 1993 estimated SVPS for the modernplant communities in the territory of the formerSoviet Union. The monograph contains SVPS for the
Žmain vegetation types within the FSU territory more.than 2500 estimations . We used these estimations to
calculate the phytomass and carbon storage in thevegetation of the Northern Eurasia for the abovementioned key intervals of the past and for themodern potential vegetation.
The SVPS for the modern zonal vegetation typeswere calculated as mean values of all the estimationsfor given vegetation type within the area, publishedby Bazilevich. For example, this author gave SVPSfor different types of the middle taiga spruce forests
Žfor three regions of East Europe which were based.on primary data on 18 key-sites . The phytomass
storage is 220.50 trha, 227.57 trha and 236.55 trhain western, central and eastern parts of the subzone,respectively; the mean value is 228 trha, or 22.8ktrkm2.
For southern taiga subzone of the East Europeanspruce forest, the same author gives three regional
Žspecific values 227.77 trha, 291.38 trha, 359.89.trha calculated on the basis of 38 key-sites. The
mean value for the southern taiga is 311.35 trhaŽ 2 .approximately 31.1 ktrkm .
SVPS for complex types of vegetation were calcu-lated using similar procedure. According to Bazile-
Ž .vich 1993 , the phytomass storage of oak forestŽwithin the forest-steppe zone is 293.7 trha the
mean value is derived from measurements from 39. Žkey-sites , that of linden forest is 192.8 trha 3.key-sites . Thus, the mean value for forest vegetation
in the forest-steppe zone is 243,3 trha. The specificphytomass storage in the meadow steppe vegetationwas estimated for three regions by 18 key-sites as12.7 trha, 16.5 trha and 10.6 trha, the mean valuebeing 13.30 trha. It is supposed that in the forest-
Ž .steppe, under natural pre-agricultural conditions,the woodland occupied about one half of the areaŽ .Rastitel’nost’ Evropeiskoi chasti SSSR, 1980 . Inthat case, the mean specific value of the phytomassstorage for the forest-steppe zone can be calculated
Ž . Žsimply as 243.26q13.30 : 2s128.28 trha 12.82 .ktrkm .

( )A.A. Velichko et al.rChemical Geology 159 1999 191–204 193
Similarly, the SVPS can be estimated for theforest-tundra. At present, woods occupy 2% to 3% ofthe area in the north of the subzone and 20% to 30%
Ž .in its southern part Alekhin, 1951 . The rest of thearea is covered by tundra and marsh vegetation.
Ž .According to Bazilevich 1993 , marsh communitiesare very close to tundra by SVPS.
To choose modern analogues to the vegetationŽ . Žtypes of the Mikulino Eemian and Valdai Last
.Glacial maximum plant communities, one has to usevarious approaches, depending upon availability ofpaleofloristic data. It is especially difficult to esti-mate SVPS for the periglacial steppes and forest-steppes, which occupied vast areas in Eurasia duringglacial epochs, because such communities have nocomplete analogue in the present-day vegetation.
If the paleofloristic data available are sufficient,we can use a method of modern concentration areaof plant species of the fossil flora, that is the regionwhere the majority of plant species—components of
Ž .certain fossil flora—grow at present Grichuk, 1979 .It was shown that modern vegetation of such aregion represents the closest analogue of the oneexisted at the site during the studied time interval.
For example, the SVPS for the spruce and birchforest with broad-leaved trees, spread over the north-ern part of the East Europe during the Mikulino
Ž .optimum unit 6 on the map , was estimated by thefollowing procedure. The composition of speciestypical for such forest in Mikulino Interglacial canbe found at present in the territory adjacent to Fen-nish and Riga Gulfs of the Baltic Sea. The estima-tions of the SVPS for modern forests within the area,based on 11 key-sites, are published by Bazilevich:220.50 and 247.16 trha, the mean of these values is
Ž 2 .233.83 trha approximately 23.4 ktrkm .With the use of the method, modern plant com-
munities closest to the periglacial steppe of the cen-tral East Europe at the maximum of the ValdaiGlacial were identified: those of the dry steppe in the
Žcold and continental Altai region about 6 trha,. 1Kuminova, 1960 .
1 We accepted here the value of 0.7 ktrkm2, taking intoconsideration the presence of arboreal plant communities withhigher SVPS in the periglacial steppe vegetation, though suchcommunities occupied only a small part of the area.
If the paleofloristic data available are insufficientto apply the method of the modern concentrationregions, one can take into consideration specificfeatures of the past vegetation, indicated by thepresence of characteristic plants in the fossil flora.One can suppose that such estimations based on thefloristic indications are less reliable than those calcu-lated by SVPS in the regions of maximum modernconcentration of the plant species—components ofthe fossil flora. But usually the estimations attainedby the two methods are similar, for example, theSVPS characteristic for the modern analogues of the
Žperiglacial steppe found by floristic indicators dry.and salt steppes in East Europe are also close to 6
Žtrha 6.50, 5.76 and 5.70 trha, according to Bazile-.vich .
A similar approach was used in the case whenpresent-day plant communities in the region of con-centration of the fossil flora do not correspond tothose of the past vegetation. For example, the closestmodern floristic analogue to the broad-leaved forestwith hornbeam, that occupied a major part of EastEurope during the Mikulino Interglacial, can be foundin the Upper Elba River catchment basin. It means,that at present, the majority of plant species, whichgrew in the central region of the East European Plainduring the Mikulino Interglacial, can be found in thearea. As the broad-leaved forests with hornbeam atthe Elba River basin occupy places with the most
Žfertile soil broadly used for agriculture for a long.time they are considerably disturbed, so that their
modern SVPS cannot be used for reconstruction.Instead, the specific values of the other broad-leavedforest with similar composition of dominant treesand coenotic structure were used for calculations ofthe phytomass storage in the floristically rich broad-leaved forest of the Mikulino Interglacial optimum.
The vegetation maps compiled by Khotinski forthe Holocene optimum and by Grichuk for the Val-dai Glacial maximum and the Mikulino Interglacial
Ž .optimum Velichko, in print were used to calculateareas occupied by various vegetation types. All themaps were based on abundant palynological data:information on 290, 285 and about 400 sites wasused to compile the vegetation maps of the MikulinoInterglacial optimum, Valdai Glacial maximum andthe Holocene optimum, respectively. First drafts ofthese maps were published in the monograph Late
( )A.A. Velichko et al.rChemical Geology 159 1999 191–204194
Quaternary environments of the Soviet UnionŽ .Velichko, 1984 , where the methods of vegetationreconstruction, used by above mentioned authors,were described. To estimate the phytomass and car-bon storage in the modern potential vegetation, the
Ž . Žmap by Sochava et al. 1964 was used disturbancesof the vegetation due to agricultural and industrial
.activities were not taken into consideration . All thefour maps were simplified by merging the areas ofplant communities with similar features and phy-tomass storage indexes.
3. Results
The total phytomass storage in the modern poten-tial Õegetation in the Northern Eurasia within theFSU boundaries amounts to 248.1 Gt, implying acarbon content of 111.6 Gt. The bulk of the storageis made up by dark coniferous and larch forest, thetwo most widespread formations within the areaŽ .Fig. 1 and Table 1 .
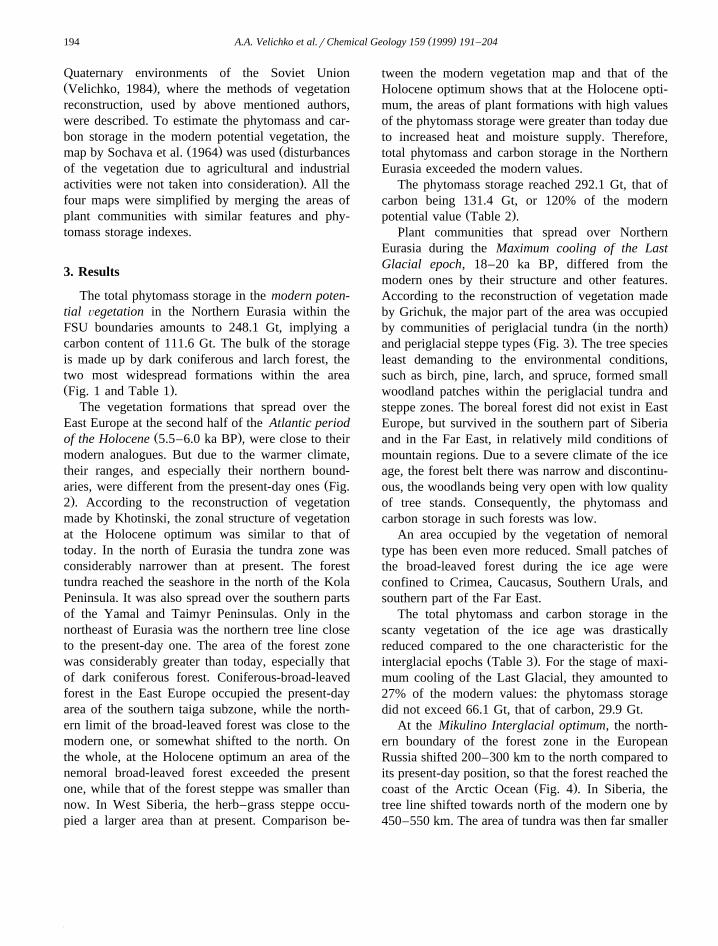
The vegetation formations that spread over theEast Europe at the second half of the Atlantic period
Ž .of the Holocene 5.5–6.0 ka BP , were close to theirmodern analogues. But due to the warmer climate,their ranges, and especially their northern bound-
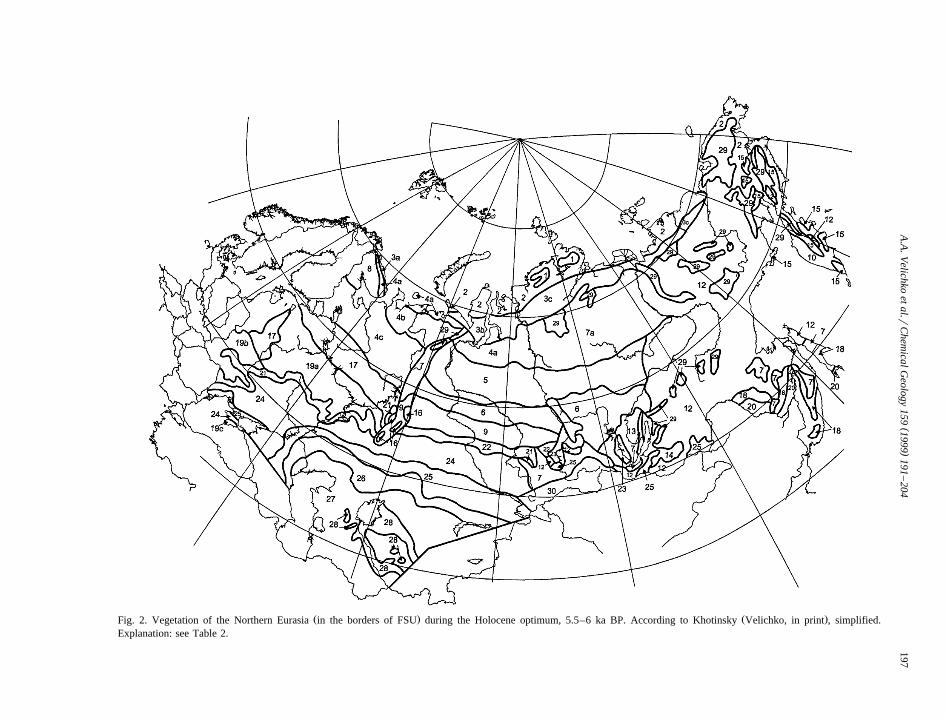
Žaries, were different from the present-day ones Fig..2 . According to the reconstruction of vegetation
made by Khotinski, the zonal structure of vegetationat the Holocene optimum was similar to that oftoday. In the north of Eurasia the tundra zone wasconsiderably narrower than at present. The foresttundra reached the seashore in the north of the KolaPeninsula. It was also spread over the southern partsof the Yamal and Taimyr Peninsulas. Only in thenortheast of Eurasia was the northern tree line closeto the present-day one. The area of the forest zonewas considerably greater than today, especially thatof dark coniferous forest. Coniferous-broad-leavedforest in the East Europe occupied the present-dayarea of the southern taiga subzone, while the north-ern limit of the broad-leaved forest was close to themodern one, or somewhat shifted to the north. Onthe whole, at the Holocene optimum an area of thenemoral broad-leaved forest exceeded the presentone, while that of the forest steppe was smaller thannow. In West Siberia, the herb–grass steppe occu-pied a larger area than at present. Comparison be-
tween the modern vegetation map and that of theHolocene optimum shows that at the Holocene opti-mum, the areas of plant formations with high valuesof the phytomass storage were greater than today dueto increased heat and moisture supply. Therefore,total phytomass and carbon storage in the NorthernEurasia exceeded the modern values.
The phytomass storage reached 292.1 Gt, that ofcarbon being 131.4 Gt, or 120% of the modern
Ž .potential value Table 2 .Plant communities that spread over Northern
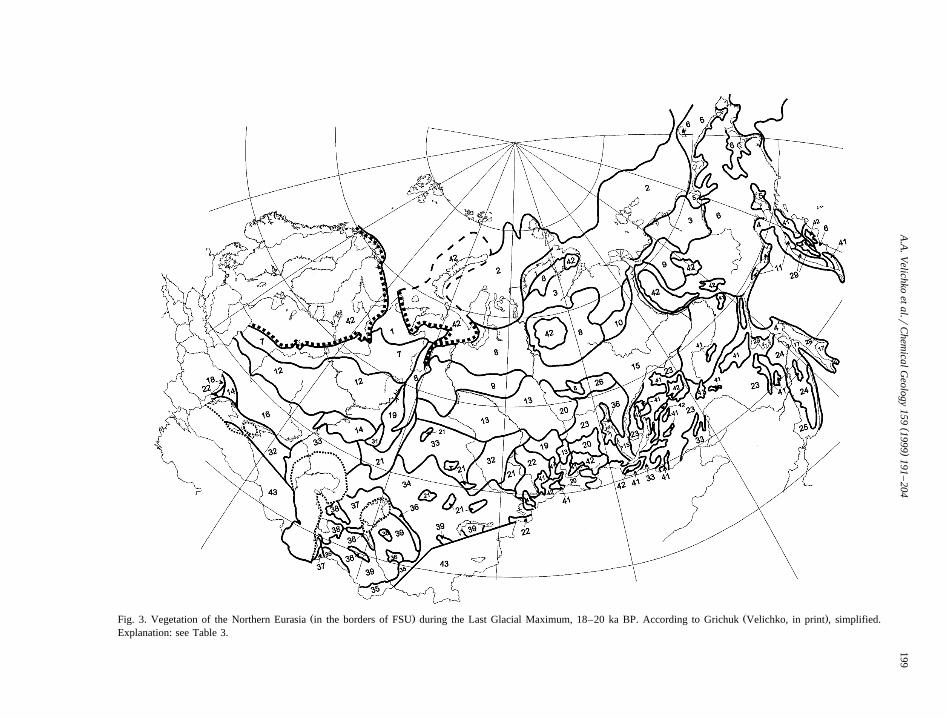
Eurasia during the Maximum cooling of the LastGlacial epoch, 18–20 ka BP, differed from themodern ones by their structure and other features.According to the reconstruction of vegetation madeby Grichuk, the major part of the area was occupied
Ž .by communities of periglacial tundra in the northŽ .and periglacial steppe types Fig. 3 . The tree species
least demanding to the environmental conditions,such as birch, pine, larch, and spruce, formed smallwoodland patches within the periglacial tundra andsteppe zones. The boreal forest did not exist in EastEurope, but survived in the southern part of Siberiaand in the Far East, in relatively mild conditions ofmountain regions. Due to a severe climate of the iceage, the forest belt there was narrow and discontinu-ous, the woodlands being very open with low qualityof tree stands. Consequently, the phytomass andcarbon storage in such forests was low.
An area occupied by the vegetation of nemoraltype has been even more reduced. Small patches ofthe broad-leaved forest during the ice age wereconfined to Crimea, Caucasus, Southern Urals, andsouthern part of the Far East.
The total phytomass and carbon storage in thescanty vegetation of the ice age was drasticallyreduced compared to the one characteristic for the
Ž .interglacial epochs Table 3 . For the stage of maxi-mum cooling of the Last Glacial, they amounted to27% of the modern values: the phytomass storagedid not exceed 66.1 Gt, that of carbon, 29.9 Gt.
At the Mikulino Interglacial optimum, the north-ern boundary of the forest zone in the EuropeanRussia shifted 200–300 km to the north compared toits present-day position, so that the forest reached the
Ž .coast of the Arctic Ocean Fig. 4 . In Siberia, thetree line shifted towards north of the modern one by450–550 km. The area of tundra was then far smaller

()
A.A
.Velichko
etal.r
Chem
icalGeology
1591999
191–
204195
Ž . Ž .Fig. 1. Modern vegetation of the Northern Eurasia in the borders of FSU . According to Sochava et al. 1964 , simplified. Explanation: see Table 1.
( )A.A. Velichko et al.rChemical Geology 159 1999 191–204196
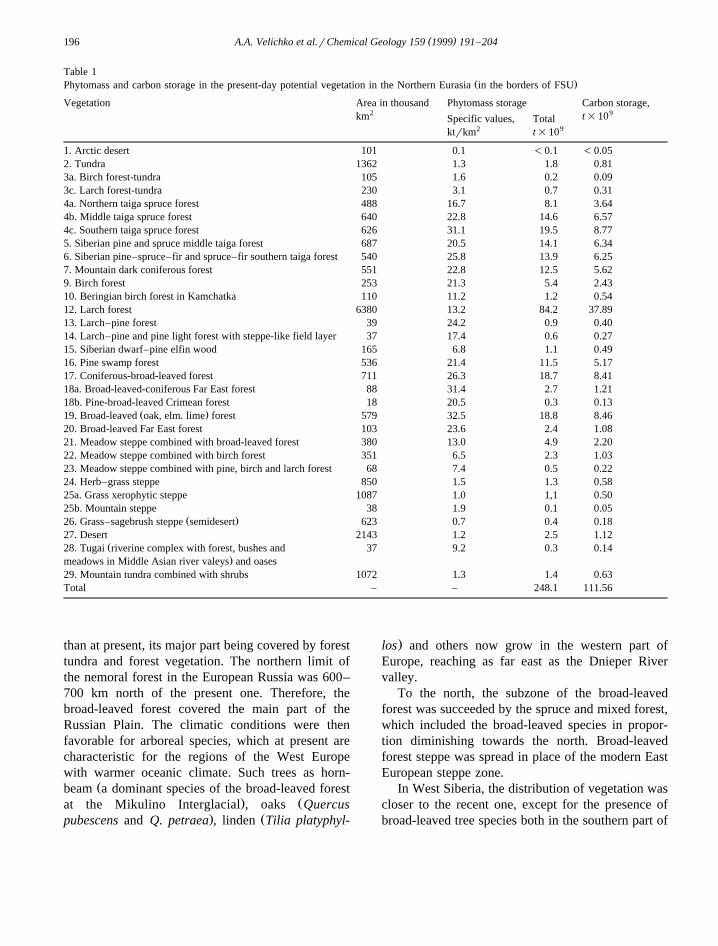
Table 1Ž .Phytomass and carbon storage in the present-day potential vegetation in the Northern Eurasia in the borders of FSU
Vegetation Area in thousand Phytomass storage Carbon storage,2 9km t=10Specific values, Total
2 9ktrkm t=10
1. Arctic desert 101 0.1 -0.1 -0.052. Tundra 1362 1.3 1.8 0.813a. Birch forest-tundra 105 1.6 0.2 0.093c. Larch forest-tundra 230 3.1 0.7 0.314a. Northern taiga spruce forest 488 16.7 8.1 3.644b. Middle taiga spruce forest 640 22.8 14.6 6.574c. Southern taiga spruce forest 626 31.1 19.5 8.775. Siberian pine and spruce middle taiga forest 687 20.5 14.1 6.346. Siberian pine–spruce–fir and spruce–fir southern taiga forest 540 25.8 13.9 6.257. Mountain dark coniferous forest 551 22.8 12.5 5.629. Birch forest 253 21.3 5.4 2.4310. Beringian birch forest in Kamchatka 110 11.2 1.2 0.5412. Larch forest 6380 13.2 84.2 37.8913. Larch–pine forest 39 24.2 0.9 0.4014. Larch–pine and pine light forest with steppe-like field layer 37 17.4 0.6 0.2715. Siberian dwarf–pine elfin wood 165 6.8 1.1 0.4916. Pine swamp forest 536 21.4 11.5 5.1717. Coniferous-broad-leaved forest 711 26.3 18.7 8.4118a. Broad-leaved-coniferous Far East forest 88 31.4 2.7 1.2118b. Pine-broad-leaved Crimean forest 18 20.5 0.3 0.13
Ž .19. Broad-leaved oak, elm. lime forest 579 32.5 18.8 8.4620. Broad-leaved Far East forest 103 23.6 2.4 1.0821. Meadow steppe combined with broad-leaved forest 380 13.0 4.9 2.2022. Meadow steppe combined with birch forest 351 6.5 2.3 1.0323. Meadow steppe combined with pine, birch and larch forest 68 7.4 0.5 0.2224. Herb–grass steppe 850 1.5 1.3 0.5825a. Grass xerophytic steppe 1087 1.0 1,1 0.5025b. Mountain steppe 38 1.9 0.1 0.05
Ž .26. Grass–sagebrush steppe semidesert 623 0.7 0.4 0.1827. Desert 2143 1.2 2.5 1.12
Ž28. Tugai riverine complex with forest, bushes and 37 9.2 0.3 0.14.meadows in Middle Asian river valeys and oases
29. Mountain tundra combined with shrubs 1072 1.3 1.4 0.63Total – – 248.1 111.56
than at present, its major part being covered by foresttundra and forest vegetation. The northern limit ofthe nemoral forest in the European Russia was 600–700 km north of the present one. Therefore, thebroad-leaved forest covered the main part of theRussian Plain. The climatic conditions were thenfavorable for arboreal species, which at present arecharacteristic for the regions of the West Europewith warmer oceanic climate. Such trees as horn-
Žbeam a dominant species of the broad-leaved forest. Žat the Mikulino Interglacial , oaks Quercus
. Žpubescens and Q. petraea , linden Tilia platyphyl-
.los and others now grow in the western part ofEurope, reaching as far east as the Dnieper Rivervalley.
To the north, the subzone of the broad-leavedforest was succeeded by the spruce and mixed forest,which included the broad-leaved species in propor-tion diminishing towards the north. Broad-leavedforest steppe was spread in place of the modern EastEuropean steppe zone.
In West Siberia, the distribution of vegetation wascloser to the recent one, except for the presence ofbroad-leaved tree species both in the southern part of
()
A.A
.Velichko
etal.r
Chem
icalGeology
1591999
191–
204197
Ž . Ž .Fig. 2. Vegetation of the Northern Eurasia in the borders of FSU during the Holocene optimum, 5.5–6 ka BP. According to Khotinsky Velichko, in print , simplified.Explanation: see Table 2.
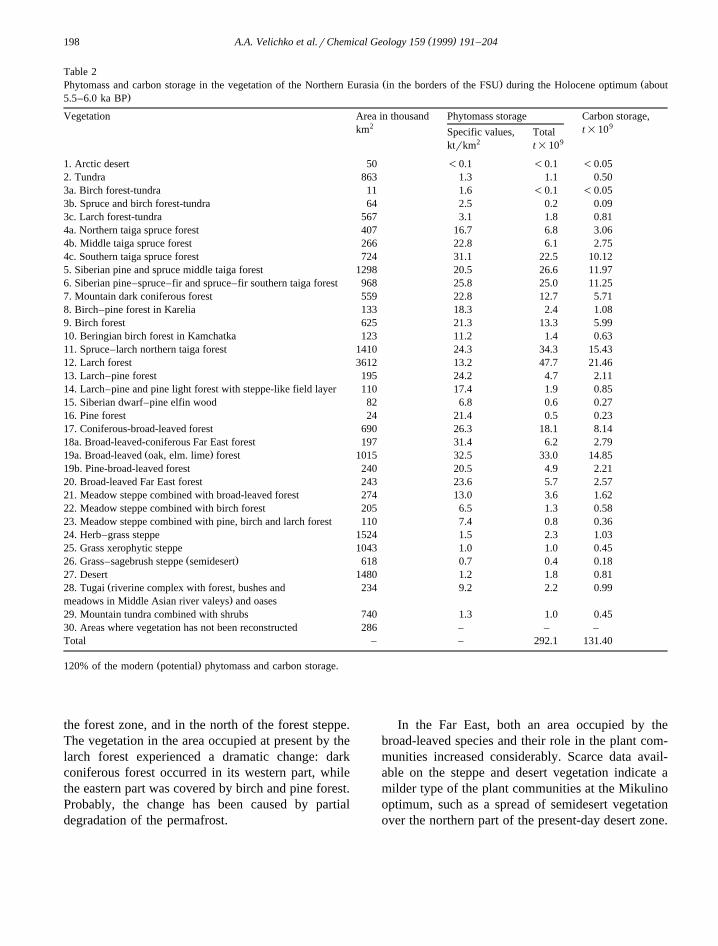
( )A.A. Velichko et al.rChemical Geology 159 1999 191–204198
Table 2Ž . ŽPhytomass and carbon storage in the vegetation of the Northern Eurasia in the borders of the FSU during the Holocene optimum about
.5.5–6.0 ka BP
Vegetation Area in thousand Phytomass storage Carbon storage,2 9km t=10Specific values, Total
2 9ktrkm t=10
1. Arctic desert 50 -0.1 -0.1 -0.052. Tundra 863 1.3 1.1 0.503a. Birch forest-tundra 11 1.6 -0.1 -0.053b. Spruce and birch forest-tundra 64 2.5 0.2 0.093c. Larch forest-tundra 567 3.1 1.8 0.814a. Northern taiga spruce forest 407 16.7 6.8 3.064b. Middle taiga spruce forest 266 22.8 6.1 2.754c. Southern taiga spruce forest 724 31.1 22.5 10.125. Siberian pine and spruce middle taiga forest 1298 20.5 26.6 11.976. Siberian pine–spruce–fir and spruce–fir southern taiga forest 968 25.8 25.0 11.257. Mountain dark coniferous forest 559 22.8 12.7 5.718. Birch–pine forest in Karelia 133 18.3 2.4 1.089. Birch forest 625 21.3 13.3 5.9910. Beringian birch forest in Kamchatka 123 11.2 1.4 0.6311. Spruce–larch northern taiga forest 1410 24.3 34.3 15.4312. Larch forest 3612 13.2 47.7 21.4613. Larch–pine forest 195 24.2 4.7 2.1114. Larch–pine and pine light forest with steppe-like field layer 110 17.4 1.9 0.8515. Siberian dwarf–pine elfin wood 82 6.8 0.6 0.2716. Pine forest 24 21.4 0.5 0.2317. Coniferous-broad-leaved forest 690 26.3 18.1 8.1418a. Broad-leaved-coniferous Far East forest 197 31.4 6.2 2.79
Ž .19a. Broad-leaved oak, elm. lime forest 1015 32.5 33.0 14.8519b. Pine-broad-leaved forest 240 20.5 4.9 2.2120. Broad-leaved Far East forest 243 23.6 5.7 2.5721. Meadow steppe combined with broad-leaved forest 274 13.0 3.6 1.6222. Meadow steppe combined with birch forest 205 6.5 1.3 0.5823. Meadow steppe combined with pine, birch and larch forest 110 7.4 0.8 0.3624. Herb–grass steppe 1524 1.5 2.3 1.0325. Grass xerophytic steppe 1043 1.0 1.0 0.45
Ž .26. Grass–sagebrush steppe semidesert 618 0.7 0.4 0.1827. Desert 1480 1.2 1.8 0.81
Ž28. Tugai riverine complex with forest, bushes and 234 9.2 2.2 0.99.meadows in Middle Asian river valeys and oases
29. Mountain tundra combined with shrubs 740 1.3 1.0 0.4530. Areas where vegetation has not been reconstructed 286 – – –Total – – 292.1 131.40
Ž .120% of the modern potential phytomass and carbon storage.
the forest zone, and in the north of the forest steppe.The vegetation in the area occupied at present by thelarch forest experienced a dramatic change: darkconiferous forest occurred in its western part, whilethe eastern part was covered by birch and pine forest.Probably, the change has been caused by partialdegradation of the permafrost.
In the Far East, both an area occupied by thebroad-leaved species and their role in the plant com-munities increased considerably. Scarce data avail-able on the steppe and desert vegetation indicate amilder type of the plant communities at the Mikulinooptimum, such as a spread of semidesert vegetationover the northern part of the present-day desert zone.
()
A.A
.Velichko
etal.r
Chem
icalGeology
1591999
191–
204199
Ž . Ž .Fig. 3. Vegetation of the Northern Eurasia in the borders of FSU during the Last Glacial Maximum, 18–20 ka BP. According to Grichuk Velichko, in print , simplified.Explanation: see Table 3.

( )A.A. Velichko et al.rChemical Geology 159 1999 191–204200
Table 3Ž .Phytomass and carbon storage in the vegetation of the Northern Eurasia during the maximum of the last, Valdai Weichselian glaciation
Vegetation Area in thousand Phytomass storage Carbon storage,2 9km t=10Specific values, Total
2 9ktrkm t=10
1. Arctic deserts combined with moss and low shrub–moss tundra 276.7 0.3 0.1 0.462. Arctic deserts combined with grass–moss tundra and with 2303.7 0.3 0.7 0.31halophytes at the emerged parts of the continental shelf3. Low shrub, moss and grass tundra, combined in the East 986.5 1.6 1.5 0.67with steppe communities4. Sedge–cotton grass tundra and subarctic meadows with 353.9 1.3 0.5 0.22halophytes at the emerged parts of shelf5. Grass–sagebrush steppe combined with sedge–cotton 670.0 1.2 0.8 0.36grass tundra6. Mountain tundra with dwarf shrub communities and 1709.9 1.0 1.7 0.76xerophytes on rocky slopes7. Tundra and steppe communities combined with birch and 482.5 2.3 1.1 0.49larch open woodlands8. Combination of mountain and lowland tundra and 1166.3 3.3 3.8 1.71birch, spruce and Siberian pine woodlands9. Spruce, larch and birch open woodlands 332.8 3.8 1.3 0.5810. Birch open woodland combined with steppe communities 123.0 3.3 0.4 0.1811. Shrub alder and Siberian dwarf–pine plant formations 47.1 4.5 0.2 0.17
Ž12. Periglacial forest-steppe periglacial steppe communities 839.1 2.2 1.8 0.65combined with birch and pine forest, with tundra elements
.and halophytes13. Periglacial steppe communities and birch, spruce and 776.7 3.5 2.7 1.21
Ž .Siberian pine–pine forest with tundra elements14. Meadow steppe and pine–birch forest with oak and elm 164.1 5.0 0.8 0.3615. Herb–grass steppe combined with birch and larch forest 994.9 4.4 4.4 1.9816. Periglacial steppe 443.0 0.7 0.3 0.1017. Meadows combined with the primitive aggregations 65.7 1.0 0.06 0.02of halophytes
Ž .18. Mixed pine, larch and birch and coniferous 4.7 13.7 0.06 0.02Ž .spruce and fir forest in low mountains and plains19. Pine, Siberian pine and birch forest with fir and spruce 179.0 14.9 2.7 1.2020. Siberian pine forest with spruce, fir, larch and birch 298.3 13.3 3.9 1.7521. Pine–birch and pine forest with steppe elements 265.4 13.7 3.6 1.60
Ž .22. Dark coniferous spruce, fir forest with oak and lime 184.9 18.1 3.3 1.50tree in Europe, Siberian pine and lime in Siberia23. Larch forest 1466.9 11.6 17.0 7.65
Ž .24. Spruce–pine and birch forest with larch in the Far East 263.4 17.2 4.5 2.0025. Birch and spruce–Siberian pine forest with fir, 99.3 18.8 1.9 0.85
Ž .oak and elm in the Far East26. Larch–Siberian pine and larch–spruce forest combined 645.9 3.3 2.1 0.90with steppe and tundra plant communities27. Birch and larch–pine forest combined with meadow steppe 56.1 6.0 0.3 0.1328. Herb–grass steppe combined with pine and birch forest 85.0 5.2 0,4 0.1829. Larch, spruce–larch and birch open woodlands 176.0 3.8 0.7 0.3130. Pine-broad-leaved and mixed forest in Crimea 11.7 23.8 0.3 0.1331. Pine-oak and mixed South Ural forest 21.5 18.1 0.4 0.1832. Grass and herb–grass steppe 447.7 1.3 0.6 0.27
Ž .33. Sagebrush, herb–sagebrush and salt bush steppe semidesert 717.0 0.7 0.5 0.2234. Grass–sagebrush lowland and mountain steppe combined 1921.5 0.5 1.0 0.45with the desert plant communities

( )A.A. Velichko et al.rChemical Geology 159 1999 191–204 201
Ž .Table 3 continued
Vegetation Area in thousand Phytomass storage Carbon storage,2 9km t=10Specific values, Total
2 9ktrkm t=10
35. Semisavanna 84.5 1.1 0.1 0.0436. Herb–grass steppe combined with the forest in river valleys 66.2 0.7 -0.1 -0.0137. Shrub and salt bush desert 12.0 0.3 -0.1 -0.0138. Sagebrush and ephemeral plant desert 128.6 0.2 -0.1 -0.0139. Psammophitic bush desert 29.6 0.8 -0.1 -0.0140. Mountain juniper and pistache open woodlands 11.4 0.6 -0.1 -0.0141. High mountain tundra and dwarf shrub communities 470.1 1.3 0.6 0.2742. Ice-sheetsTotal – – 66.1 29.94
Ž .27% of the modern potential phytomass and carbon storage.
In the areas where the floristic composition wassimilar to that of today, coenotic role of more ther-mofilous species increased. Thus, the proportion offir was greater in the forests of the northeasternEurope, as well as in some parts of the West andCentral Siberia. On the contrary, the role of spruce inthe East European mixed forest diminished. In the
Žsouthern part of its present-day range south of the.Upper Volga valley spruce was absent at the
Mikulino optimum phase. Over the northern parts ofthe West and Central Siberia the taiga forest zonewas similar to the modern one. On the whole, at theoptimum of the Mikulino Interglacial plant forma-tions with high specific values of the phytomass and
Žcarbon storage those of the broad-leaved and mixed.forests, and the meadow steppe extended over
greater areas than nowadays or at the Holoceneclimatic optimum. On the contrary, the areas occu-
Žpied by formations with low phytomass storage suchas larch forests and open woodlands, dry steppes and
.semideserts were reduced. As the result, the totalphytomass storage within the FSU territory amountedto 377.1 Gt, that of carbon, 169.7 Gt, which makes
Ž .155% of the modern values Table 4 .
4. Discussion
The comparison of the calculated values of thephytomass storage in the terrestrial vegetation on theterritory of FSU reveals large-scale oscillations be-
Žtween the warm and cold epochs interglacial opti-mums, the Holocene optimum included, and the Late
.Glacial maximum , as well as between warm epochsŽwith different heat supply the Holocene and
.Mikulino–Eemian optimums . It is evident, that suchchanges constituted an important influence on thecarbon balance during the Pleistocene and theHolocene.
The comparison of the presented values of thephytomass and carbon storage in the North Eurasiaat 5.5, 18 and 125 ka BP with the parameters
Žobtained for East-European Plain Zelikson et al.,.1998 show that the correlation of the values for
Mikulino, as well as for the Holocene optimums, andŽpresent time is similar in both regions the first value
reaches about 150% and 120% of the second one,.respectively . During the Last Glacial Maximum, the
phytomass and carbon storage was higher on theterritory of North Eurasia because the degradation ofthe forest and woodland, as well as of the steppevegetation in the continental areas of the Asian partof the territory was less expressed than in the EastEurope.
Our estimations are in good agreement with thoseŽ .made by Gliemeroth 1995 for the territory of Eu-
rope at the key intervals of the last 22,000 years. Forinstance, according to Gliemeroth, the biomass stor-
Ž .age consisting largely of the phytomass storage forthe Holocene optimum 7 ka BP amounted to about116% of the modern potential one. The biomassstorage in Europe at the Pleniglacial phase of the
Ž .Late Wistulian 22 ka BP was as low as 4.8% of themodern value. Similar estimations were made by
Ž .Monserud et al. 1995 for Siberia, where the phy-Žtomass storage at the Middle Holocene 4.6–6.0 ka

()
A.A
.Velichko
etal.r
Chem
icalGeology
1591999
191–
204202
Ž . Ž . Ž .Fig. 4. Vegetation of the Northern Eurasia in the borders of FSU during the Mikulino Eem optimum, about 125 ka BP. According to Grichuk Velichko, in print , simplified.Explanation: see Table 4.

( )A.A. Velichko et al.rChemical Geology 159 1999 191–204 203
Table 4Ž . Ž .Phytomass and carbon storage in the vegetation of the Northern Eurasia in the borders of FSU during the optimum of Mikulino Eemian
Ž .Interglacial about 125 ka BP
Vegetation Area in thousand Phytomass storage Carbon storage,2 9km t=10Specific values, Total
2 9ktrkm t=10
1. Tundra 629 2.0 1.3 0.592. Spruce and larch forest-tundra 342 4.4 1.5 0.683. Birch forest with pine and spruce 223 7.1 1.6 0.724. Birch and pine open woodland 506 7 3.5 1.575. Birch and mixed forest 1511 16.7 25.2 11.346. Spruce and birch forest with broad-leaved tree species 1285 28 36.0 16.208. Dark coniferous forest with broad-leaved tree species 205 23.4 4.8 2.169. Coniferous-broad-leaved forest 311 34.0 10.6 4.77
Ž .10. Dark coniferous Siberian pine, spruce, fir forest 813 22.6 18.4 8.2811. Birch forest with Siberian pine, spruce and broad-leaved tree species 1304 21.5 28.0 12.6012. Pine and birch light forest with oak an lime and steppe-like field layer 70 15.1 1.0 0.4513. Larch forest 1681 13.2 22.2 9.9914. Larch forest with pine and birch 1209 24.2 29.3 13.1915. Siberian pine–pine and Siberian pine–spruce forest 703 20.5 14.4 6.4816. Spruce–Siberian pine and pine forest with fir, larch, elm and lime 798 28.1 224 10.0817a. Polydominant Far East coniferous-broad-leaved forest 256 31.4 8.0 3.6017b. Polydominant coniferous-broad-leaved forest in Crimea and 104 20.5 2.1 0.95South Ukrain18. Pine and birch forest 720 23.1 16.6 7.4719. Mountain Siberian pine forest with spruce and larch 307 20.2 6.2 2.7920. Hornbeam forest with oak and lime 2048 35.0 71.7 32.2721. Mixed hornbeam forest with Mongolian oak 163 23.6 3.8 1.7122. Meadow steppe combined with hornbeam and oak forest 941 13.0 12.2 5.4923. Meadow steppe combined with pine forest with elm, oak and lime 1023 9.6 9.8 4.4124. Meadow steppe combined with pine and birch forest 498 7.2 3.6 1.6225. Meadow steppe combined with larch and birch forest 53 7.2 0.4 0.1826. Grass steppe 392 1.3 0.45 0.20
Ž .27. Grass–sagebrush steppe semidesert 729 0.7 0.5 0.2228. Sagebrush and salt bush desert 496 6.7 3.3 1.4929. Psammophytic desert with Haloxylon and psammophillous bushes 591 19.6 11.6 5.2230. High mountain woodlands, tundra-like and meadow plant formations 795 5.4 4.3 1.9431. Semisavanna 143 3.5 0.7 0.3232. Mountain grass communities combined with xerophillous bushes 55 1.3 0.1 0.0533. Kamchatka birch woodland 96 11.2 1.1 0.50Total – – 377.1 169.7
Ž .155% of the modern potential phytomass and carbon storage.
.BP reached 105 Gt, that is, 122% of the phytomassŽ .storage in the modern potential vegetation 85.9 Gt .
References
Adams, J.M., Faure, H., Faure-Denard, L., McGlade, J.M., Wood-ward, F.I., 1990. Increases in terrestrial carbon storage fromthe Last Glacial Maximum to the present. Nature 348, 711–714.
Ajtay, G.L., Ketner, P., Duvigneaud, P., 1979. Terrestrial primaryproduction and phytomass. In: Bolin, B., Degens, E.T., Kempe,
Ž .S., Ketner, P. Eds. , The Global Carbon Cycle. SCOPE 13,Wiley, Chichester, pp. 123–181.
Alekhin, V.V., 1951. Rastitel’nost’ SSSR. Sovetskaya Nauka,Ž .Moscow, 512 pp. in Russian .
Bazilevich, N.I., 1993. Biologicheskaya productivnost’ ecosistemŽ .Severnoi Evrazii. Nauka, Moscow, 293 pp. in Russian .
Gliemeroth, A.-K., 1995. Palaookologische Untersuchungen uber¨die letzten 22000 Jahre in Europa. Gustav Fischer Verlag,Stuttgart, 252 pp.

( )A.A. Velichko et al.rChemical Geology 159 1999 191–204204
Grichuk, V.P., 1979. Metodika interpretatsii paleobotanicheskikhmaterialov dlya resheniya zadach stratigrafii i korrelyatsii
Ž .pozdnego kainozoya. In: Grichuk, V.P. Ed. , Palinologich-eskiye issledovaniya na severo-vostoke SSSR. AkademiyaNauk SSSR, Dal’nevostochny Nauchny Tsentr, Vladivostok,
Ž .pp. 5–22 in Russian .Kuminova, A.V., 1960. Rastitel’nyi pokrov Altaya. Izdatel’stvo
ŽAN SSSR. Sibirskoye Otdelenie. Novosibirsk, 450 pp. in.Russian .
Monserud, R.A., Denissenko, O.V., Kolchugina, T.P.,Tchebakova, N.M., 1995. Global Biogeochemical Cycles 9Ž .2 , 213–226.
Rastitel’nost’ Evropeiskoi chasti SSSR, 1980. In: Gribov, S.A.,Ž .Isachenko, T.I., Lavrenko, E.M. Eds. , Nauka, Leningrad-Ž .skoye otdelenie, Leningrad, 429 pp. in Russian .
Sochava, V.B., et al., 1964. Fiziko-geograficheskiy atlas mira,1964. Akademiya Nauk SSSR i Glavnoye Upravleniye
ŽGeodezii i Kartografii GGK. SSSR, Moscow, pp. 280–288 in.Russian .
Ž .Velichko, A.A. Ed. , 1984. Late Quaternary environments of theSoviet Union, University of Minnesota Press, Minneapolis,327 pp.
Ž .Velichko, A.A., Ed. , in print. Razvitiye landshaftov i klimataŽterritorii Severnoi Evrazii. Atlas-monografiya, tom 2 in Rus-
.sian .Zelikson, E.M., Borisova, O.K., Kremenetsky, C.V., Velichko,
A.A., 1998. Phytomass and carbon storage during the Eemianoptimum, Late Weichselian maximum and Holocene optimumin Eastern Europe. Global and Planetary Change 16–17, pp.181–195.