Embed Size (px)
Citation preview

Variations of Ion Drifts in the Ionosphere at
Low- and Mid- Latitudes
Edgardo E. Pacheco
Jicamarca Radio Observatory
Jul, 2014

E.E. Pacheco - JRO JIREP - Jul, 2014
Outline • Motivation • Introduction to Ionospheric Electrodynamics • Objectives and Approach • Instrumentation for Observations • Quiet time :
– Statistical Analysis: Latitudinal/apex-height variations of the vertical (meridional) and zonal ion drifts
• Methodology • Results • Conclusions
• Summary of Results

E.E. Pacheco - JRO JIREP - Jul, 2014
Motivation • Electric fields and plasma drifts
are important parameters for the understanding of the ionosphere.
• It is possible to infer the effects of the magnetosphere on the ionosphere by studying the differences in the dynamic processes during quiet and disturbed times.
• Ionospheric drifts are main inputs for modeling the low and mid-latitude ionosphere/thermosphere system.
• Improved models give more reliable space weather predictions.
• On a global scale, the latitudinal and longitudinal dependence of the drifts require a more detailed study.
• The ion density distribution in the ionosphere is most affected by the ion motions.

E.E. Pacheco - JRO JIREP - Jul, 2014
INTRODUCTION
E.E. Pacheco - JRO JIREP - Jul, 2014
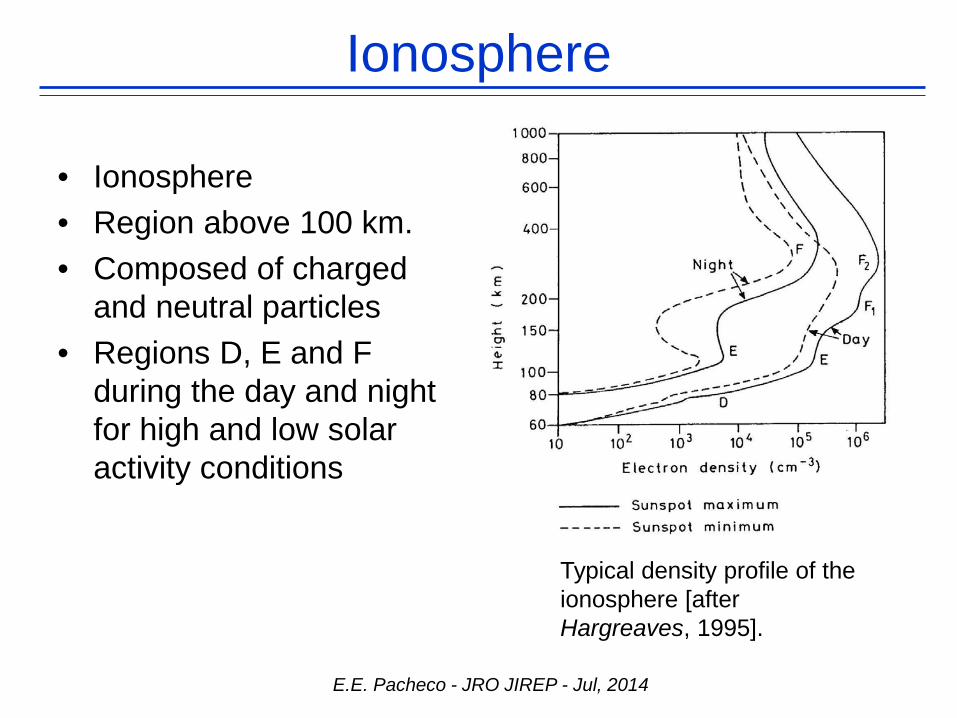
Ionosphere
Typical density profile of the ionosphere [after Hargreaves, 1995].
• Ionosphere • Region above 100 km. • Composed of charged
and neutral particles • Regions D, E and F
during the day and night for high and low solar activity conditions

E.E. Pacheco - JRO JIREP - Jul, 2014
Conductivities
• Ionosphere: conductor with anisotropic conductivity (Hall, Pedersen and Direct).
• Ion-neutral collisions and gyromotion produce anisotropic conductivity.
• Hall and Pedersen conductivities are highest between 100 and 200 km.
– Usually assumed to be a conducting layer (E region).
• Pedersen conductivity is also high between 200 and 400 km.
– Usually assumed to be a conducting layer (F region).
• Electric fields can drive plasma motions at places away from conductivity regions in collisionless regime. V=(ExB)/B2
Representation of the altitude variation of the conductivities [Heelis, 2004].

E.E. Pacheco - JRO JIREP - Jul, 2014
U: neutral wind velocity Vi : ion velocity Ve: electron velocity Ni: number density e: electron charge
Electric Field Drivers
For ions
For electrons
Ni = Ne
• Any force that produces a relative motion between the ions and electrons will drive a current
j = Nie(Vi - Ve)
Neutral wind produces a momentum exchange force through collisions between neutral particles and charged particles.
Momentum equation for ions and electrons – quasi steady state: • Dominant terms are Electric field, Lorentz force and collisions.

E.E. Pacheco - JRO JIREP - Jul, 2014
Currents in the Ionosphere
j = σ 0 (E'|| ) + σ P (E'⊥ ) - σ H (E'⊥ × b̂) j = Nie(Vi - Ve)
Direct Pedersen Hall conductivities
E' = E + U × B ,
∇ • j = 0
Current must be divergence free
E is given in terms of and U σ
E.E. Pacheco - JRO JIREP - Jul, 2014
• Ionospheric region: Middle and low latitudes • Neutral winds drive currents in the E and F region • Divergence in the currents produce electric polarization fields
E- and F- region Dynamo

E.E. Pacheco - JRO JIREP - Jul, 2014
from Heelis 2001
E- region dynamo: dominant during the daytime
E- region conductivity dominates during the day Effect of poleward winds and Pedersen conductivity near the terminators:
Eastward electric field (day) Westward electric field (night)
Effect of poleward winds and Hall conductivity near noon
Poleward electric field (day) Equatorward electric field (night)

F region dynamo
E.E. Pacheco - JRO JIREP - Jul, 2014
F- region dynamo: dominant during the nighttime
E-region conductivity goes away at night Eastward wind downward E (equatorward) Westward wind upward E (poleward)
from Heelis 2001

E.E. Pacheco - JRO JIREP - Jul, 2014
from Heelis 2001

E.E. Pacheco - JRO JIREP - Jul, 2014
Local Time Variation in Ion Drift • Low latitude E- and F- region
wind dynamo effects • We can calculate E given the
neutral wind and conductivity: models
• Models to compare with our observations
• Daytime: – Westward and upward drifts
• Nighttime: – Eastward and downward drifts
• Pre-reversal enhancement near
1800 LT • Jicamarca measurements (solid
line) • Numerical simulation model
(dash line) [Crain et al., 1993] Equinox solar maximum conditions (from Fejer, 1997)
E.E. Pacheco - JRO JIREP - Jul, 2014
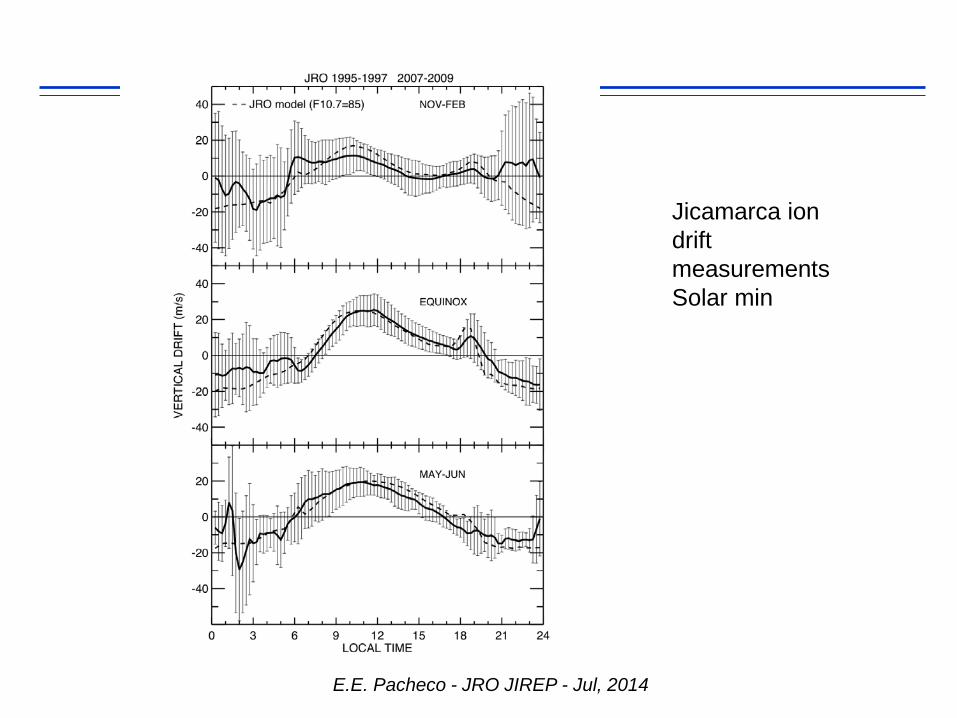
Jicamarca ion drift measurements Solar min
E.E. Pacheco - JRO JIREP - Jul, 2014
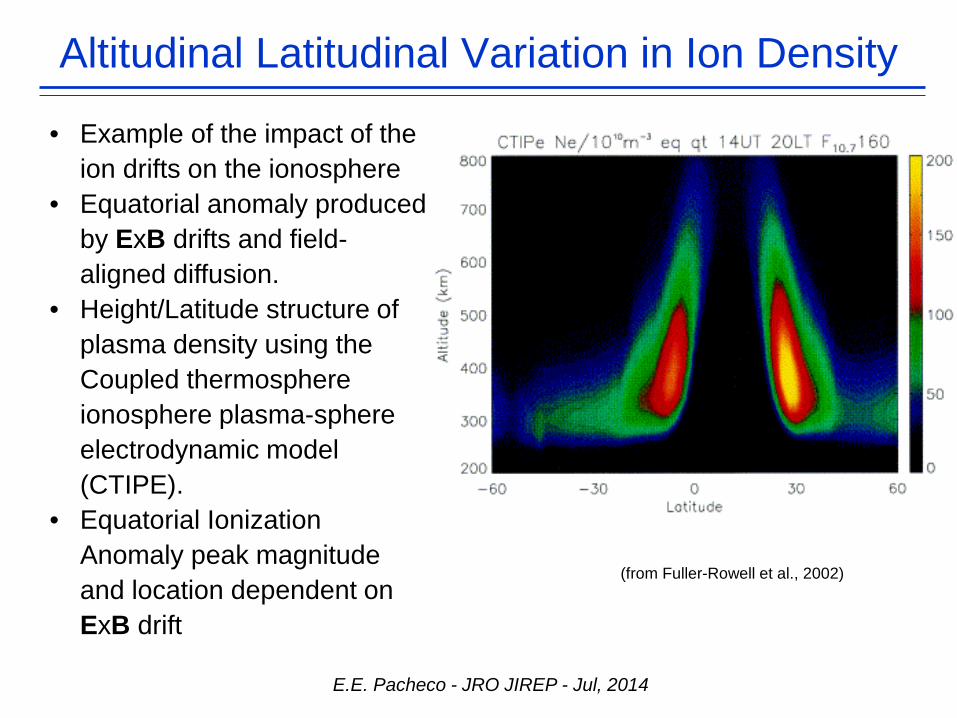
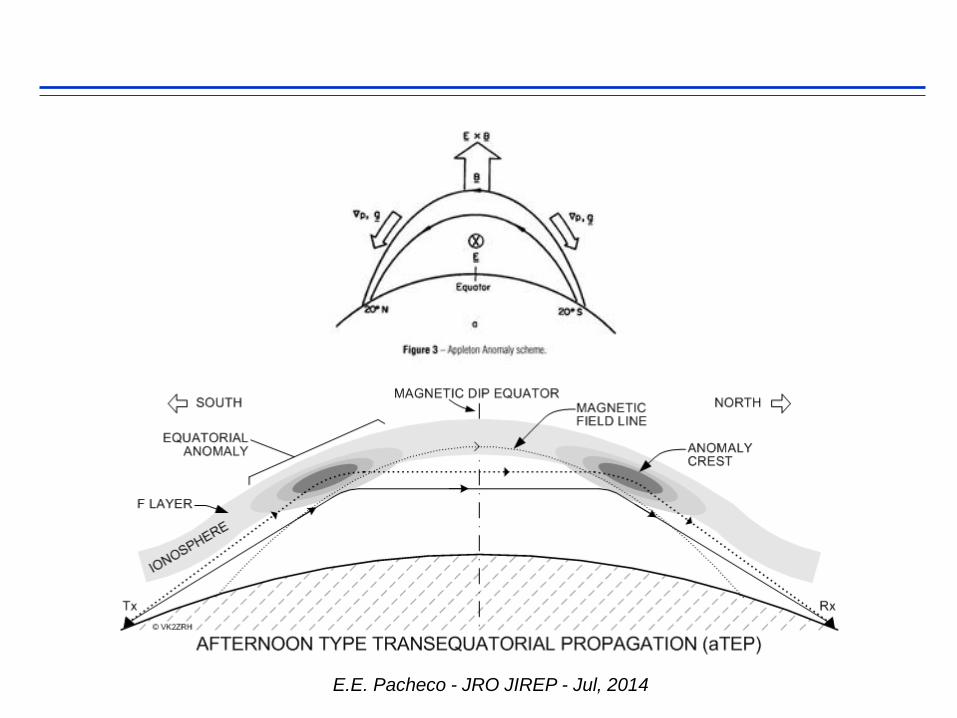
Altitudinal Latitudinal Variation in Ion Density
• Example of the impact of the ion drifts on the ionosphere
• Equatorial anomaly produced by ExB drifts and field-aligned diffusion.
• Height/Latitude structure of plasma density using the Coupled thermosphere ionosphere plasma-sphere electrodynamic model (CTIPE).
• Equatorial Ionization Anomaly peak magnitude and location dependent on ExB drift
(from Fuller-Rowell et al., 2002)
E.E. Pacheco - JRO JIREP - Jul, 2014

E.E. Pacheco - JRO JIREP - Jul, 2014
Latitudinal Variations in Meridional ExB Drift
Mag. Lat near 0° Mag. Lat near 30 °
(from Fejer et al., 1991)
• Jicamarca drifts have dominant diurnal variations with pre-reversal enhancement. • Arecibo drifts have dominant semi-diurnal variations with no pre-reversal
enhancement. • How do we evolve from one to the other in latitude?
(from Fejer, 1993)

E.E. Pacheco - JRO JIREP - Jul, 2014
Latitudinal Variations in Zonal Ion Drift
(from Fejer et al., 1991) (from Fejer, 1993)
• Jicamarca drifts reverse at 1600 and 0600 with magnitudes near 100 m/s.
• Arecibo drifts reverse at 1600 and 0300 with magnitudes near 50 m/s.
• How do we evolve from one to the other?
E.E. Pacheco - JRO JIREP - Jul, 2014
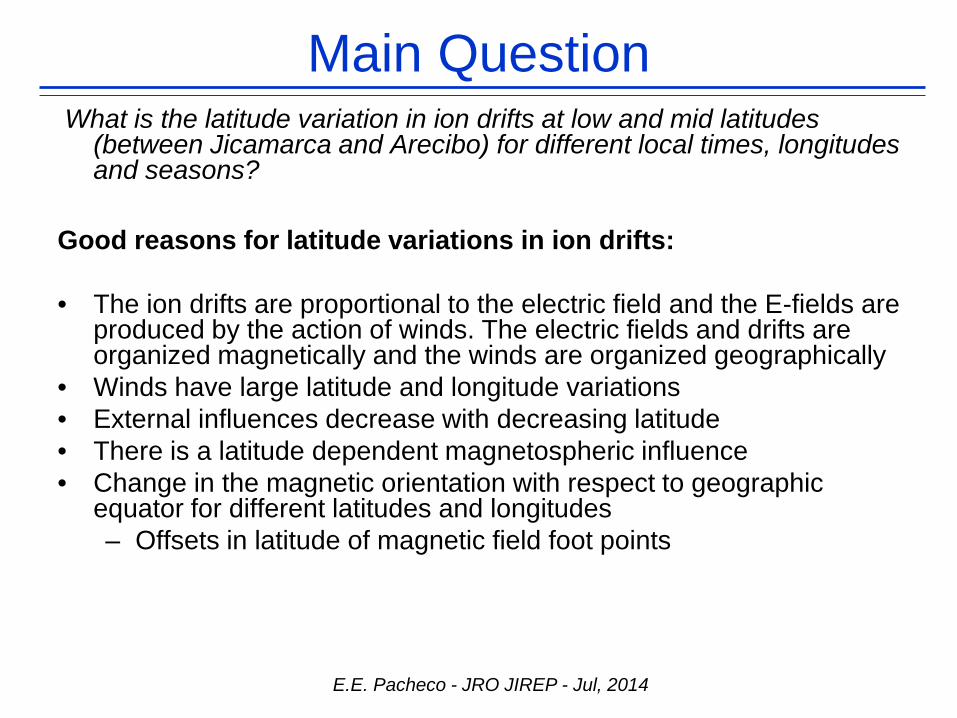
Main Question What is the latitude variation in ion drifts at low and mid latitudes
(between Jicamarca and Arecibo) for different local times, longitudes and seasons?
Good reasons for latitude variations in ion drifts: • The ion drifts are proportional to the electric field and the E-fields are
produced by the action of winds. The electric fields and drifts are organized magnetically and the winds are organized geographically
• Winds have large latitude and longitude variations • External influences decrease with decreasing latitude • There is a latitude dependent magnetospheric influence • Change in the magnetic orientation with respect to geographic
equator for different latitudes and longitudes – Offsets in latitude of magnetic field foot points

E.E. Pacheco - JRO JIREP - Jul, 2014
Objectives
• Study of the ion drifts and electric fields in the ionosphere at low- and mid- latitudes using satellite measurements.
• Describe the quiet time latitudinal variations of the ion drifts
between ± 25 º magnetic latitude.

E.E. Pacheco - JRO JIREP - Jul, 2014
Approach • Utilize ROCSAT & DMSP data • Separate storm time data from quiet time measurements. Storm time – Event Studies
– Identify the super storm events from 2000 to 2004. – Study the ExB vertical ion drift storm perturbations at the
magnetic equator. Quiet time – Statistical Study
– Select quiet time data from 1999 to 2003 – Divide the space in latitude, longitude and local time bins
and find the average values of the ion drifts inside those bins.
– Resolve ion drifts parallel and perpendicular to B – Describe quiet time local time variations at different
latitudes, longitudes.

E.E. Pacheco - JRO JIREP - Jul, 2014
Satellite Instrument Specification
• DMSP – fixed LT ~ polar orbit. Altitude: 840 km.
• ROCSAT
– Coverage of ± 35º in geographic latitude
– Altitude: 600 km. – Full coverage in longitude
and local time every 52 days
– Main source for quiet time study
Instrument RPA IDM IT Measurement Ion temperatures
and Ram velocity
Transverse Ion Velocity components
Total Ion concentration

E.E. Pacheco - JRO JIREP - Jul, 2014
Ion Drift Vector Measurements in the Spacecraft Reference Frame
• ROCSAT-1: • Circular orbit at 600 km altitude,
35º inclination, period: 97 min. • Spacecraft reference frame:
Positive VX is defined in the ram direction
• Positive VZ in the nadir (pointing in the vertical direction inward to the Earth) and VY to complete a right handed coordinate system.
• Jicamarca (JRO) and Arecibo (ARO) positions are shown.
• DMSP similar reference frame but VY and VZ with inverted sign.
• For storm times the Vz component is the local vertical at the equator.

E.E. Pacheco - JRO JIREP - Jul, 2014
Methodology • Data analysis for quiet time not
trivial: Consider Kp<3, Dst>-100 ROCSAT: • Remove corotation. • Distribute the data in space bins,
CGM – GEO coordinates (30º longitude, 5º latitude, 30 minutes in LT).
• Data available at both conjugate latitudes.

E.E. Pacheco - JRO JIREP - Jul, 2014
Methodology
ROCSAT orbit mapped projection for 24 hours All local times covered in 26 days

E.E. Pacheco - JRO JIREP - Jul, 2014
Quiet Time Methodology (cont.)
180º 270º 290º 310º 0º 90º 180º
ROCSAT-1 orbit: (blue line)
Space bin representation: (red box).
5º wide in latitude and 30º wide in longitude
• The average vector velocity is determined for each bin and for each ion drift
component (VX, VY, VZ) in the spacecraft reference frame. • ExB drifts are derived from these average values after removing biases. Our
observations correspond to longitude sectors near the Central American (270º), Peruvian (290º), Brasilian (310º), African (0º), Indian (90º) and Pacific (180º) sectors.

E.E. Pacheco - JRO JIREP - Jul, 2014
ROCSAT-1 Raw Data
•ROCSAT data Vx, Vy, Vz vs LT, considering
Kp<3 Ion density > 104 cm-
3 From Nov 2001 to Feb 2002 Long. sector: 90º ± 15º Lat: 0º ± 2.5º Vz upward during day downward during night Vx includes an irregular behavior near 0600 LT Vz without bias Bias in Vz =average value of Vz in local time Vx, Vy still with bias
ascending descending
Vz(m/s)
Vx(m/s)
Vy(m/s)
Vz(m/s)
Vx(m/s)
Vy(m/s)

E.E. Pacheco - JRO JIREP - Jul, 2014
Quiet Time Meridional Drifts Results at the equator
similar to those obtained by previous studies
First time we observe Latitude Variations: • PRE • Daytime drifts
– Semi-diurnal component present
• Downward drift enhancement
– Does not have seasonal and longitudinal dependences like PRE
• Reversal times

E.E. Pacheco - JRO JIREP - Jul, 2014
Ion Density-Meridional Drifts
• Intensity of history of Ion density and drifts are correlated • Large meridional drifts – large density values • EIA signature – large PRE • Small density values – small meridional drifts

E.E. Pacheco - JRO JIREP - Jul, 2014
Apex Height Variations • PRE – large
positive drift
• PRE extended in latitude in northern winter
• Small variations below 1000 km apex height
• PRE latitude extension and location associated with seasonal variation of Pedersen conductance
• Peaks in the Pedersen conductance coincide with reversal from up to down
Geo Long: 270º : Central American 290º : Peruvian 310º : Brasilian 0º : African 90º : Indian 180º : Pacific
Apex
hei
ght (
km)
Apex
hei
ght (
km)
Apex
hei
ght (
km)
Apex
hei
ght (
km)
Apex
hei
ght (
km)
• Negative daytime drifts – semi-diurnal contribution
• Semi-diurnal contribution larger in summer
• Independent of longitude
Apex
hei
ght (
km)
VperpM (m/s) VperpM (m/s)

E.E. Pacheco - JRO JIREP - Jul, 2014
Quiet Time Meridional Drifts • PRE and downward enhancement
produced by F-region dynamo. Polarization fields at base of F-region.
• PRE produced by a fringing field • Extends to peak of Pedersen
conductance near 1500 km in winter and near 800 km in summer
• Daytime drifts driven by E-region
dynamo, diurnal and semi-diurnal wind fields.
• Semi-diurnal E-region tides most effective in northern summer at different longitudes.
• Means geographic differences are not dominant seasonal drivers.
• Differences due to seasonal differences in phase of winds rather than changes in latitude.
• Downward drift enhancement attributed to the reversal in the F-region zonal wind in darkness before dawn.
E.E. Pacheco - JRO JIREP - Jul, 2014
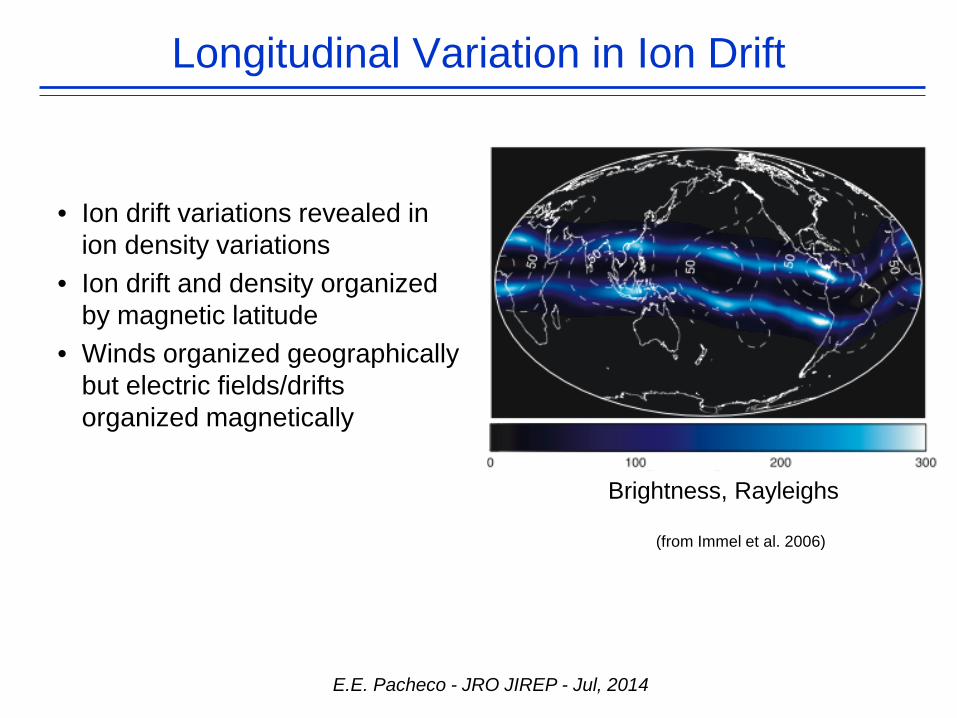
Longitudinal Variation in Ion Drift
• Ion drift variations revealed in ion density variations
• Ion drift and density organized by magnetic latitude
• Winds organized geographically but electric fields/drifts organized magnetically
(from Immel et al. 2006)
Brightness, Rayleighs

Satellite ion drift measurements
E.E. Pacheco - JRO JIREP - Jul, 2014

Longitudinal variation
E.E. Pacheco - JRO JIREP - Jul, 2014
From Fejer et al 2008
E.E. Pacheco - JRO JIREP - Jul, 2014
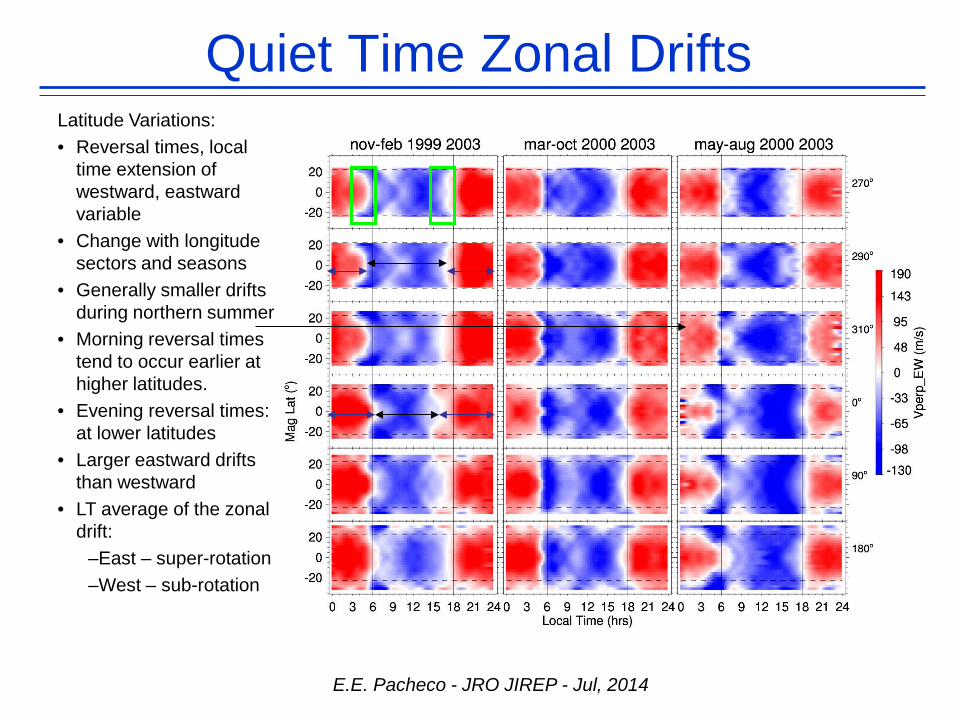
Quiet Time Zonal Drifts Latitude Variations: • Reversal times, local
time extension of westward, eastward variable
• Change with longitude sectors and seasons
• Generally smaller drifts during northern summer
• Morning reversal times tend to occur earlier at higher latitudes.
• Evening reversal times: at lower latitudes
• Larger eastward drifts than westward
• LT average of the zonal drift:
–East – super-rotation –West – sub-rotation

E.E. Pacheco - JRO JIREP - Jul, 2014
Super-rotation • E region contributes to
westward flows
• F region contributes to eastward flows
• Latitude variations in eastward drifts due to latitude variations in Pedersen conductance
• Changes in height of Pedersen peak conductance produces seasonal changes in super-rotation with latitude
• Same latitude change with season as seen for PRE
• Change from super-rotation to sub-rotation coincides with latitude extent of PRE Net super-rotation
vs mag lat Eastward and westward zonal averages vs mag lat
Different regions of east- and west- drifts produce super-rotation Geo Long: 270º : Central American 290º : Peruvian 310º : Brasilian 0º : African 90º : Indian 180º : Pacific

E.E. Pacheco - JRO JIREP - Jul, 2014
Conclusions • Electric field and ion drifts are important for the understanding of the
ionosphere. • We have examined the ExB ion drifts using radar and satellite
measurements. • As expected, the daytime plasma drifts are generally upward and
westward during the day and downward and eastward during the night.
• Evidence of latitudinal (apex-height), longitudinal, local time and seasonal variability of the meridional and east-west plasma drifts.
• Variations in the PRE, daytime meridional drifts and downward sunrise enhancement.

E.E. Pacheco - JRO JIREP - Jul, 2014
Thank you!

E.E. Pacheco - JRO JIREP - Jul, 2014


