Embed Size (px)
Citation preview

RESEARCH ARTICLE Open Access
Variation in fat content between liver lobesand comparison with histopathologicalscores in dairy cows with fatty liverC. Gerspach1*, S. Imhasly2, R. Klingler1, M. Hilbe3, S. Hartnack4 and M. Ruetten3
Abstract
Background: The assessment of a liver biopsy remains the gold standard for diagnosing and staging fatty liver indairy cows, which is often necessary for diagnostic and research purposes. Accuracy of the diagnosis relays on thequality of the biopsy, the assumed representativeness of a small tissue sample for a disease process throughout theliver and accurate human evaluation of histologic specimens. The objective of the present study was to assess thedistribution of triacylglycerol (TAG) infiltration throughout the parenchyma of livers with different degrees of fattyliver in dairy cows. In addition, histopathological scores from the corresponding specimens were compared to aquantitative measurement of TAG, as well as the agreement between two observers.
Methods: Thirty livers with different degrees of lipid infiltration were selected and 10 different locations throughoutthe liver were assessed. The TAG content was measured enzymatically, calculated in % or mg/g wet weight, andassigned to a scoring system. Corresponding tissue specimens were stained with hematoxylin-eosin (H&E) and Oilred O (ORO) for histopathological evaluation, using a scoring system.
Results: The difference in TAG content between any locations was less than 2%. Based on the scoring system theTAG concentration was even distributed in 79.3% of the livers. Based on kappa statistics the agreement betweentwo pathologists and staining technique in scoring histological specimens was moderate to fair.
Conclusions: Overall the distribution of TAG throughout the liver and the accuracy of human evaluation of liverbiopsies may lead to acceptable diagnoses for clinical purposes. Within the liver lobules a common pattern of lipiddistribution depending on severity could be observed. For the staging of lipid infiltration for research projects,some degree of variation needs to be considered.
BackgroundFatty liver is a metabolic disease occurring during thetransition period in dairy cattle. Diagnosis and staging offatty liver is often necessary for diagnostic and researchpurposes. Lipid infiltration can reach from a physio-logical state, in response to negative energy balance inearly lactation, to a progressed state, with altered liverfunction and clinical disease. The clinical symptoms areunspecific [1]. Therefore, the main reasons to evaluateliver biopsies are establishing a morphological diagnosisand to assess the severity of disease. The lipid content ofliver tissue can be evaluated by biochemically,
histologically or by specific gravity [1]. For quantitativedetermination of triacylglycerol (TAG) or total lipidcontent, the TAG content of liver tissue can be quantita-tively measured enzymatically using an automatedanalyzer [2]. The histologic evaluation of liver tissue is atechnique, routinely used for clinical but also forresearch purposes.Two issues influencing an accurate diagnosis have been
reported in different species. First the tissue sampleshould be representative for the disease which depends onthe method of collection, size and number of percu-taneous biopsies [3–7]. In addition, the assessment of abiopsy is only successful in diffuse hepatopathies. A percu-taneous liver biopsy is always taken from the right lobeand represents 0.002 to 0.1% of the whole liver paren-chyma, depending on the size of the biopsy needle [8].
* Correspondence: [email protected] of Farm Animals, Vetsuisse Faculty, University of Zurich,Winterthurerstrasse 260, Zurich, SwitzerlandFull list of author information is available at the end of the article
© The Author(s). 2017 Open Access This article is distributed under the terms of the Creative Commons Attribution 4.0International License (http://creativecommons.org/licenses/by/4.0/), which permits unrestricted use, distribution, andreproduction in any medium, provided you give appropriate credit to the original author(s) and the source, provide a link tothe Creative Commons license, and indicate if changes were made. The Creative Commons Public Domain Dedication waiver(http://creativecommons.org/publicdomain/zero/1.0/) applies to the data made available in this article, unless otherwise stated.
Gerspach et al. BMC Veterinary Research (2017) 13:98 DOI 10.1186/s12917-017-1004-9

Fatty liver in cattle is reported to be diffuse [8]. However,in beef bulls concentrations of cholesterol and phospho-lipids were higher in the intermediate lobe, compared tothe right and left lobes [9]. Local foci of fatty degenerationin livers of dairy cows have been reported, which are dueto tension and resulting in ischemia at the insertion of aserosal attachment (tension lipidosis) [10]. Focal fatty liverwith unknown etiology has been diagnosed in a heifer[11]. In dogs and cats liver lesions of different etiologywere partially uneven distributed in disorders usuallyregarded as diffuse [5].Second, histological evaluation of liver tissue is prone to
bias [12–15]. In a study investigating human evaluation ofliver steatosis in people revealed a high level of variabilitybetween human observation and standardized computermeasurement. At the same time a disagreement of up to37% between observers was determined [13].Despite several attempts to find and develop alterna-
tive and less invasive diagnostic methods in the past, theevaluation of a liver biopsy remains the current goldstandard in diagnosing and investigating fatty liver indairy cows.The goal of our study was to investigate the distribution
of TAG infiltration throughout livers with different stagesof fatty liver, by comparing biopsies from 10 different lo-calizations. In addition, we compared histopathologicalscores to a quantitative measurement of triacylglycerol inliver tissue and the agreement between two observers,using two different 2 embedding methods.
MethodsCollection of liver tissueWedge biopsy specimens of livers were taken at an abat-toir. The selection was focused on livers with potentiallipid infiltration. Liver samples were excised immediatelyafter slaughter from 10 different localizations of eachliver, using a scalpel (Fig. 1). The tissue samples fromthe corresponding localizations were placed intoappropriate tubes for histopathologic examination andmeasurement of TAG.
HistopathologyFor histopathology, tissue samples were collected with asize of 1 cm × 1 cm × 1 cm approximately 1 cm underthe surface and fixed in 10% buffered formalin, andsmall samples were snap frozen in liquid nitrogen. Thesamples fixed in formalin were dehydrated by an ascen-ding alcohol series ending in xylol and finally embeddedin paraffin. The specimens were sectioned at a thicknessof 2–3 μm and sections were stained with hematoxylin-eosin (H&E), periodic acid-Schiff stain (PAS) or Oil redO (ORO). The snap frozen samples were cut directly in3–4 μm sections and stained with PAS and ORO with-out any prior fixation (alcohol) applied. The histologicallesions were staged, according to a scoring system, into4 categories: 0 = no abnormalities; 1 = moderate fattyliver (only cells from one zone are affected; periportal,midzonar or zentrolobular); 2 = severe fatty liver (theperiportal and midzonal or midzonal to centrolobular
Fig. 1 Liver with 10 locations for tissue sampling (1–3 = right lobe; 4–5 = left lobe, diaphragmatic surface; 6–8 = left lobe, visceral surface;9 = quadrate lobe; 10 = caudate lobe)
Gerspach et al. BMC Veterinary Research (2017) 13:98 Page 2 of 11

Fig. 2 Bright field images of different histological grades of fatty liver degeneration. a Grade 0: one lobule with a central vein of a normal liver,no lipid vacuoles in the cytoplasm. b Grade 1: small rim of hepatocytes with clear demarcated fatty vacuoles round a central vein (star). Theportal field marking the edge of the liver lobule is marked with an arrow. c Grade 2: half of the hepatocytes show fatty vacuoles, central vein(star) and portal field (arrows) are marked. d Grade 3: all hepatocytes of the lobule show lipid vacuoles. The vacuoles in hepatocytes around thecentral vein are bigger (arrow)
Fig. 3 Bright field images ORO staining of different histological grades of fatty liver degeneration. a Grad 0: normal liver, no fat deposition visible.b Grade 1: Positive red signal intracytoplasmatically in hepatocytes around central vein. c Grade 2: half of hepatocytes of a liver lobule show clearred stained fatty vacuoles. The edge to an area with only finely red stained lipid droplets is marked with arrows. d Grade 3: entire liver lobuleshows red stained, clear demarcated fatty vacuoles in hepatocytes
Gerspach et al. BMC Veterinary Research (2017) 13:98 Page 3 of 11

areas are affected); 3 = very severe fatty liver (allthree zones are affected, including the Kupffer cells)for both, H&E (Fig. 2) and ORO (Fig. 3). Respectively,the same grading scale was used for intracellularglycogen depositions. All specimens were evaluated bytwo board-certified pathologists (MR, MH) with ahigh level of experience, blinded to liver localizationsand animal identification.The intracellular vacuoles were classified according
to morphology either as fatty vacuoles or glycogendeposition. Clearly demarcated vacuoles with orwithout displacement of the nucleus, was classified asfatty vacuole. Foamy cytoplasm and a centrally placednucleus within slightly swollen hepatocytes wasconsidered as glycogen deposition. These findingswere verified by using either PAS (glycogen) or ORO(fat) staining.
Liver tissue triglyceride measurementSmall samples of liver tissue were placed in 2 ml EppendorfSafe-Lock tubes (Eppendorf, Germany) immediately snapfrozen in liquid nitrogen, and stored at −85 °C for laterdetermination of TAG content. After thawing, analysis wasperformed by tissue saponification in ethanolic KOH asdescribed [16]. In short, approximately 100 mg of tissuesamples were transferred to new pre-weighed 2 ml tubes,after removing non-parenchymatos tissue, and the exactweight recorded. By adding 350 μl of ethanolic KOH (2parts EtOH: 1 part 30% KOH) incubation was performedovernight, at 55 °C in a thermos shaker until tissue was
Fig. 4 (a) Liver tissue with heterogeneous distribution of lipidinfiltration (A: normal liver, B: area with suspected fattydegeneration), (b) H&E stained tissue from corresponding specimen(A: normal liver, B: area with suspected fatty degeneration), arrow:border between macroscopically different appearance; no differenceof fat deposition could be found within the hepatocytes
Table 1 Overall scores for 30 livers. HE, H&E stain; ORO, Oil RedStain; MR and MH, pathologists
H&E ORO
liver MR MH MR MH
1 0 0 0 1
2 0 0 0 1
3 0 0 0 1
4 3 3 3 3
5 0 0 0 0
6 0 0 0 0
7 0 0 0 0
8 0 0 0 0
9 0 0 0 1
10 0 0 0 0
11 0 0 0 2
12 0 0 0 1
13 1 2 2 2
14 0 0 0 1
15 1 2 1 3
16 2 3 3 3
17 0 1 1 3
18 0 1 1 1
19 3 3 3 3
20 1 2 1 3
21 1 1 2 2
22 0 0 0 1
23 1 1 1 2
24 0 0 0 1
25 1 2 2 2
26 3 3 3 3
27 3 3 3 3
28 0 1 0 1
29 2 2 3 3
30 2 2 3 3
κ kappa reliability test, CI confidence interval
Gerspach et al. BMC Veterinary Research (2017) 13:98 Page 4 of 11

completely digested. 650 μl water:EtOH (1:1) were addedand centrifuged at a speed of 16′000 G for 5 min. Super-natant was transferred in a new tube and 200 μl water:E-tOH (1:1) were added and vortexed. 200 μl of the mixturewere transferred in a new tube and 215 μl 1 M MgCl2 wereadded and vortexed and left on ice for 10 min. Finally, thetubes were centrifuged at 16′000 G for 5 min and thesupernatant was transferred in a new tube and stored at−20 °C until measurement.The TAG content was measured enzymatically with
the free glycerol reagent (Sigma-Aldrich). As trioleinequivalent (CTE) standard curve were produced byglycerol standard (Sigma-Aldrich). In a 96 well plate,6 μl of the sample were added to 200 μl of the free gly-cerol reagent, incubated for 15 min at room temperatureand read at 540 nm. The blank were subtracted from thesamples/standards and the concentration was calculatedcomparing to the standard curve. Each sample wasmeasured in triplicates.The results were also calculated in mg/g wet liver
and assigned to a scoring system as used by Haudumet al. (2011): 0 = ≤ 50 mg/g (mild); 1 = ≥ 51–100 mg/g (moderate); 2 = ≥ 100–150 mg/g (severe);3 = ≥ 150 mg/g (very severe).
Data analysisDescriptive statistics was performed using GraphPadPrism (Prism 6.05, GraphPad Software, Inc., La Jolla,CA, USA). The agreement between two observers,assessing the same samples, was calculated using the κtest (unweighted kappa, www.vassarstats.net). Values of0–0.2 represented a slight agreement, 0.21–0.4 a fair,0.41–0.60 a moderate, 0.61–0.8 substantial and >0.8almost perfect agreement [17].
Linear mixed effects models were utilized to assess ifTAG concentration differed significantly betweenlocations.Generalized linear mixed effect models were used to
assess if disagreement between the two observers couldbe explained by the TAG concentration. Animal wasconsidered as random effect, TAG concentration andlocalisation as fixed effects. Model selection was basedon AIC (Akaike’s information criterion) with lowervalues indicating a better model fit. The analysis wasperformed with the software R (R Core Team 2015) andthe package lme4 [18].The intra-assay coefficient of variation (CV) expressed as
a percent value was calculated as CV = within-assay stan-dard deviation/mean × 100. The intra-assay CV was 4.8%.
ResultsAnimalsA total of 300 liver samples from 30 animals were exa-mined for histologic findings and TAG content. Thecows were between 2.5 and 9 years old and 4 to 500 dayspost-partum. They belonged to the breeds Red Holstein(n = 11), Brown Swiss (n = 6), Holstein Frisian (n = 6),and Montbeliard (n = 1). In 3 animals breed, age, andnumber of days in milk could not be determined.
Pathological assessment of liver tissueMacroscopically 29 of 30 livers had a homogenousappearance with a slightly brighter brownish colorationthan normal liver tissue. One liver showed few, ran-domly distributed clearly demarcated, light brown toyellowish foci that were not associated to any ligamentinsertion site (Fig. 4a). The histopathological exami-nation did not reveal obvious differences in the degreeof lipid infiltration in that liver (Fig. 4b).
Table 2 Agreement between observers for each localizationand overall (whole livers)
Liver H&E ORO
κ 95% CI κ 95% CI
1 0.70 0.49–0.90 0.29 0.08–0.50
2 0.60 0.38–0.81 0.29 0.08–0.50
3 0.54 0.31–0.76 0.37 0.15–0.59
4 0.56 0.33–0.78 0.30 0.09–0.51
5 0.62 0.40–0.85 0.29 0.07–0.50
6 0.64 0.41–0.86 0.29 0.08–0.51
7 0.45 0.22–0.68 0.21 0.01–0.41
8 0.54 0.32–0.76 0.22 0.01–0.42
9 0.49 0.27–0.71 0.23 0.03–0.44
10 0.74 0.54–0.93 0.29 0.08–0.49
overall 0.58 0.51–0.65 0.28 0.21–0.35
Table 3 Agreement between H&E and ORO for eachlocalization and overall (whole liver)
Liver MR MH
κ 95% CI κ 95% CI
1 0.64 0.40–0.87 0.38 0.14–0.62
2 0.59 0.34–0.83 0.43 0.20–0.66
3 0.53 0.28–0.79 0.48 0.25–0.71
4 0.47 0.20–0.74 0.20 0.00–0.42
5 0.57 0.31–0.82 0.34 0.12–0.58
6 0.57 0.32–0.83 0.35 0.11–0.58
7 0.57 0.32–0.83 0.34 0.11–0.58
8 0.58 0.34–0.83 0.36 0.13–0.59
9 0.54 0.29–0.79 0.52 0.29–0.74
10 0.53 0.28–0.79 0.29 0.06–0.51
overall 0.56 0.48–0.64 0.34 0.29–0.44
κ kappa reliability test, CI confidence interval
Gerspach et al. BMC Veterinary Research (2017) 13:98 Page 5 of 11
Based on the average score of 10 different localizationsfrom each liver, the histological assessment revealed anoverall diagnosis of fatty liver in up to 25/30 livers,depending on the pathologist and staining technique(Table 1). No concomitant liver lesions ore evidence ofinflammation were detected. In specimens stained withHE, the scores were evenly distributed throughout all 10localizations in agreement of both observers, in 22/30livers (73.3%). In 4/30 (13.3%) livers the observersdisagreed in their grading.The scores were even distributed in 17/30 (56.7%)
livers stained with ORO throughout all 10 localizationsand were in agreement of both observers. In 1/30 (3.3%)livers, findings were not distributed diffuse throughoutall localizations, observed by both pathologists. In 11/30(36.7%) livers, there was a disagreement between
observers. Overall the agreement between the twoobservers was fair to moderate in evaluating samplesstained with H&E and fair in samples stained with ORO(Table 2). The agreement between H&E and ORO wasfair to moderate (Table 3). Both observers gave slightlyhigher scores when evaluating ORO stained samples.The evaluation of H&E stained specimens revealed 76/
300 (25.3%) samples being diagnosed with differentscores. Of those only 2/300 (0.7%) differed by 2 scores.In liver tissue stained with ORO, there was a disagree-ment in 163/300 (54%) specimens. In 35/300 (11.7%)specimens there was a difference of 2 scores.The distribution of intracellular glycogen was nega-
tively correlated with the distribution of fatty depositions(data not shown). There were no significant differencesfound between formalin fixed and snap frozen samples.
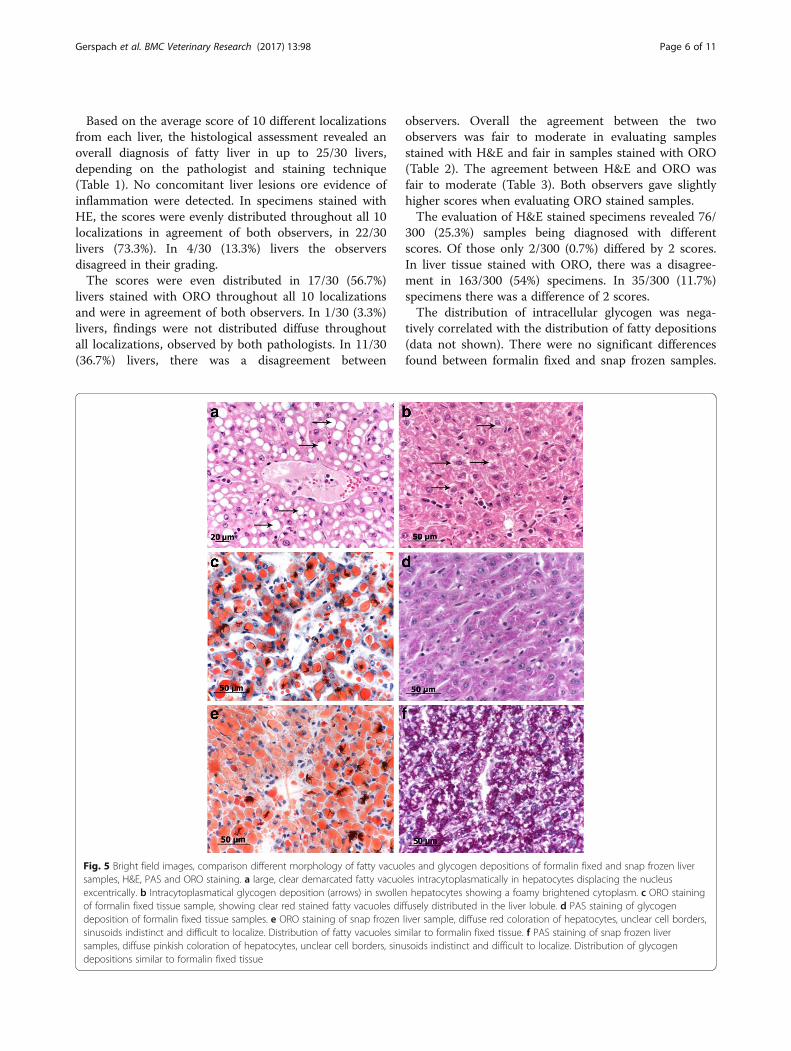
Fig. 5 Bright field images, comparison different morphology of fatty vacuoles and glycogen depositions of formalin fixed and snap frozen liversamples, H&E, PAS and ORO staining. a large, clear demarcated fatty vacuoles intracytoplasmatically in hepatocytes displacing the nucleusexcentrically. b Intracytoplasmatical glycogen deposition (arrows) in swollen hepatocytes showing a foamy brightened cytoplasm. c ORO stainingof formalin fixed tissue sample, showing clear red stained fatty vacuoles diffusely distributed in the liver lobule. d PAS staining of glycogendeposition of formalin fixed tissue samples. e ORO staining of snap frozen liver sample, diffuse red coloration of hepatocytes, unclear cell borders,sinusoids indistinct and difficult to localize. Distribution of fatty vacuoles similar to formalin fixed tissue. f PAS staining of snap frozen liversamples, diffuse pinkish coloration of hepatocytes, unclear cell borders, sinusoids indistinct and difficult to localize. Distribution of glycogendepositions similar to formalin fixed tissue
Gerspach et al. BMC Veterinary Research (2017) 13:98 Page 6 of 11

However, the morphology of the cell borders, vacuolesand nucleus of hepatocytes in the slightly thicker, notfixed sections were more difficult to assess. The intensityand distribution of coloration of the special staining wascomparable in either method (Fig. 5).
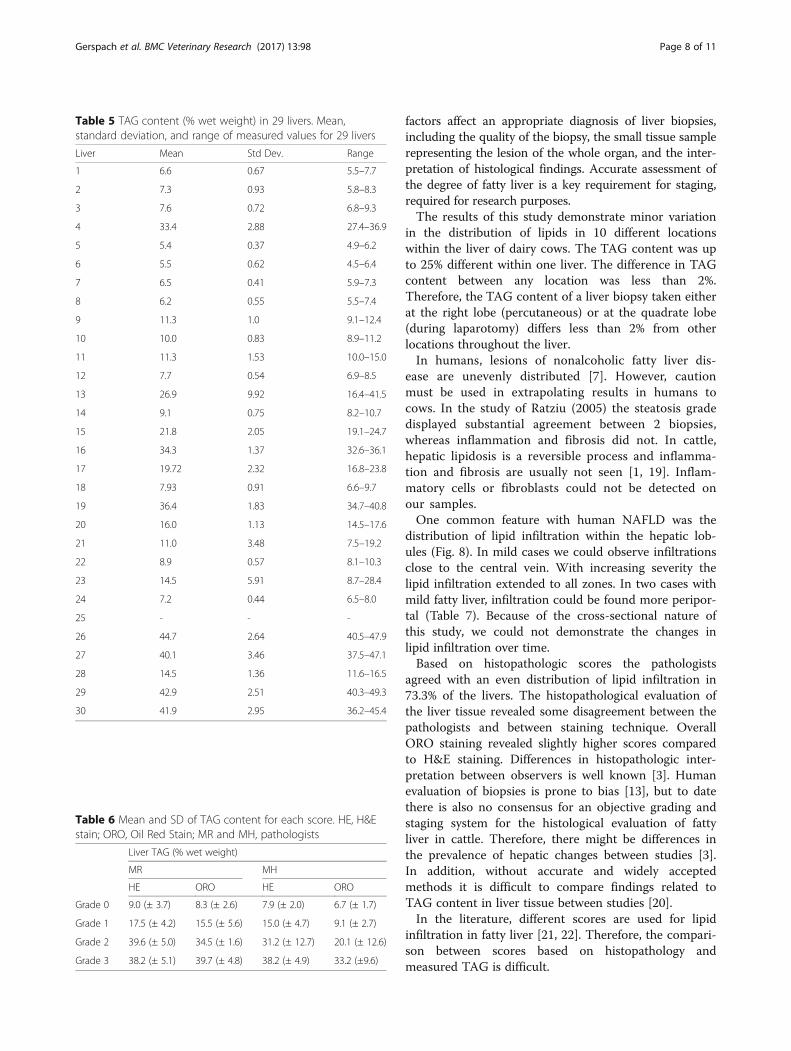
Biochemical analysis of hepatic TAG contentThe percentage of TAG from wet liver of 10 locationsfrom 29 livers was measured (Fig. 6). Tissue fromliver no. 25 was not available for TAG measurement.Based on a linear mixed effect model approach, loca-tion was found to be significantly associated with
TAG concentration (p = 0.003), albeit the differencebetween any two localizations was smaller than 2%.Table 4 demonstrates the comparison of localization1, which is usually the side for percutaneous biopsy, withlocalizations 2 to 10. Localizations 4,5,6,8, and 9 had signifi-cantly different TAG concentrations, all of them being lessthan 2%. Scoring of 290 liver tissue samples revealed 124specimens with moderate, 49 with severe, and 117 speci-mens with very severe fatty liver. Based on the scoring sys-tem the TAG concentration was even distributed in 79.3%of the livers. In 4 of 29 livers, the scores differed by 1 andin 2 livers by 2 scores. Mean, standard deviation and rangeof the measured values of each liver are shown in Table 5.The highest variation in TAG content within one liver was25% (liver no. 13). Since the TAG content was >150 mg/gin all 10 locations, the scores were equally throughout theliver. The same liver was diagnosed with marked variation,based on histopathological evaluation. The variation be-tween locations was significantly higher in livers diagnosedwith scores 2 or 3 compared to livers with a score of 1.In Table 6 the mean TAG content is listed for each grade
of fatty liver, using H&E and ORO stains (also Fig. 7).The TAG concentration did not influence the agree-
ment between observers, which was tested using a gen-eralized linear mixed effect model.
DiscussionThe examination of a liver biopsy remains the gold stan-dard for diagnosing and staging fatty liver. Important
1 2 3 4 5 6 7 8 9 1 00
20
40
60
0
20
40
60
0
20
40
60
30
40
50
60
Grade 0 Grade 1
Grade 2 Grade 3
localizations localizations
localizations localizations
% T
AG
% T
AG
% T
AG
% T
AG
1 2 3 4 5 6 7 8 9 1 0
1 2 3 4 5 6 7 8 9 1 0 1 2 3 4 5 6 7 8 9 1 0
Fig. 6 TAG content (% wet weight) of 10 localizations from 29 livers with degree 0 to 3
Table 4 Comparison of the localizations 2–10 to localization 1(baseline; usual side for percutaneous biopsy) using a linearmixed effect model approach
Localization Value Std. Error p-value
1 (intercept) 18.8 2.5 0.0000
2 0.1 0.7 0.8892
3 −0.4 0.7 0.5607
4 −1.5 0.7 0.0279
5 −1.4 0.7 0.0389
6 −2.0 0.7 0.0048
7 −0.8 0.7 0.2532
8 −1.9 0.7 0.0056
9 −1.8 0.7 0.0090
10 −0.2 0.7 0.7654
Gerspach et al. BMC Veterinary Research (2017) 13:98 Page 7 of 11
factors affect an appropriate diagnosis of liver biopsies,including the quality of the biopsy, the small tissue samplerepresenting the lesion of the whole organ, and the inter-pretation of histological findings. Accurate assessment ofthe degree of fatty liver is a key requirement for staging,required for research purposes.The results of this study demonstrate minor variation
in the distribution of lipids in 10 different locationswithin the liver of dairy cows. The TAG content was upto 25% different within one liver. The difference in TAGcontent between any location was less than 2%.Therefore, the TAG content of a liver biopsy taken eitherat the right lobe (percutaneous) or at the quadrate lobe(during laparotomy) differs less than 2% from otherlocations throughout the liver.In humans, lesions of nonalcoholic fatty liver dis-
ease are unevenly distributed [7]. However, cautionmust be used in extrapolating results in humans tocows. In the study of Ratziu (2005) the steatosis gradedisplayed substantial agreement between 2 biopsies,whereas inflammation and fibrosis did not. In cattle,hepatic lipidosis is a reversible process and inflamma-tion and fibrosis are usually not seen [1, 19]. Inflam-matory cells or fibroblasts could not be detected onour samples.One common feature with human NAFLD was the
distribution of lipid infiltration within the hepatic lob-ules (Fig. 8). In mild cases we could observe infiltrationsclose to the central vein. With increasing severity thelipid infiltration extended to all zones. In two cases withmild fatty liver, infiltration could be found more peripor-tal (Table 7). Because of the cross-sectional nature ofthis study, we could not demonstrate the changes inlipid infiltration over time.Based on histopathologic scores the pathologists
agreed with an even distribution of lipid infiltration in73.3% of the livers. The histopathological evaluation ofthe liver tissue revealed some disagreement between thepathologists and between staining technique. OverallORO staining revealed slightly higher scores comparedto H&E staining. Differences in histopathologic inter-pretation between observers is well known [3]. Humanevaluation of biopsies is prone to bias [13], but to datethere is also no consensus for an objective grading andstaging system for the histological evaluation of fattyliver in cattle. Therefore, there might be differences inthe prevalence of hepatic changes between studies [3].In addition, without accurate and widely acceptedmethods it is difficult to compare findings related toTAG content in liver tissue between studies [20].In the literature, different scores are used for lipid
infiltration in fatty liver [21, 22]. Therefore, the compari-son between scores based on histopathology andmeasured TAG is difficult.
Table 5 TAG content (% wet weight) in 29 livers. Mean,standard deviation, and range of measured values for 29 livers
Liver Mean Std Dev. Range
1 6.6 0.67 5.5–7.7
2 7.3 0.93 5.8–8.3
3 7.6 0.72 6.8–9.3
4 33.4 2.88 27.4–36.9
5 5.4 0.37 4.9–6.2
6 5.5 0.62 4.5–6.4
7 6.5 0.41 5.9–7.3
8 6.2 0.55 5.5–7.4
9 11.3 1.0 9.1–12.4
10 10.0 0.83 8.9–11.2
11 11.3 1.53 10.0–15.0
12 7.7 0.54 6.9–8.5
13 26.9 9.92 16.4–41.5
14 9.1 0.75 8.2–10.7
15 21.8 2.05 19.1–24.7
16 34.3 1.37 32.6–36.1
17 19.72 2.32 16.8–23.8
18 7.93 0.91 6.6–9.7
19 36.4 1.83 34.7–40.8
20 16.0 1.13 14.5–17.6
21 11.0 3.48 7.5–19.2
22 8.9 0.57 8.1–10.3
23 14.5 5.91 8.7–28.4
24 7.2 0.44 6.5–8.0
25 - - -
26 44.7 2.64 40.5–47.9
27 40.1 3.46 37.5–47.1
28 14.5 1.36 11.6–16.5
29 42.9 2.51 40.3–49.3
30 41.9 2.95 36.2–45.4
Table 6 Mean and SD of TAG content for each score. HE, H&Estain; ORO, Oil Red Stain; MR and MH, pathologists
Liver TAG (% wet weight)
MR MH
HE ORO HE ORO
Grade 0 9.0 (± 3.7) 8.3 (± 2.6) 7.9 (± 2.0) 6.7 (± 1.7)
Grade 1 17.5 (± 4.2) 15.5 (± 5.6) 15.0 (± 4.7) 9.1 (± 2.7)
Grade 2 39.6 (± 5.0) 34.5 (± 1.6) 31.2 (± 12.7) 20.1 (± 12.6)
Grade 3 38.2 (± 5.1) 39.7 (± 4.8) 38.2 (± 4.9) 33.2 (±9.6)
Gerspach et al. BMC Veterinary Research (2017) 13:98 Page 8 of 11

The content of TAG was significantly higher in liversdiagnosed with fatty liver compared to livers with ahistopathologic score of 0. However, there was nosignificant difference in TAG content between the histo-pathologic scores 2 and 3. Best agreement with thequantitative TAG content could be achieved with OROstaining. This is in agreement with another study, per-formed with human and rat livers, which revealed goodagreement between histopathologists based on H&Eassessment but an inaccuracy compared to the truehepatic TAG concentrations [15]. The ORO stain wasmore accurate, because ORO identifies mainly TAG andless phospholipids and cholesterol [15]. A steriologicalanalysis of fatty livers revealed a highly significant corre-lation with the hepatic TAG content in cattle [8]. Also
Collins et al. revealed a high correlation between TAGcontent and volume fraction of fat droplets determinedstereologically [23]. In our study we used a more prac-tical technique, which is routinely used for the diagnosisof fatty liver and H&E stained specimens are oftenavailable for retrospective evaluation of cases.In addition, one observer appeared to be stricter in
scoring the specimens. A disagreement by one grademight also be due to the fact, that a categorical scoringsystem is used for a continuous disease process.Formalin fixing and routine processing of the tissue
samples can be an accurate method for histologicalassessment and grading. Even with the loss of fat orglycogen content a grading can be accomplished. Themorphological appearance of cytoplasmic vacuoles,
Grade 0
Grade 1
Grade 2
Grade 3
Grade 0
Grade 1
Grade 2
Grade 3
Grade 0
Grade 1
Grade 2
Grade 3
Grade 0
Grade 1
Grade 2
Grade 3
HE MR HE MH
ORO MR ORO MH
0
20
40
60
% T
AG
0
20
40
60
% T
AG
0
20
40
60
% T
AG
0
20
40
60
% T
AG
Fig. 7 TAG content (% wet weight) of 29 livers, according to staining technique (H&E, ORO) and pathologists (MR, MH)
I II IIIFig. 8 Distribution of lipid infiltration within hepatic lobules, according to the severity of fatty liver. I = grade 1 (infiltration in one zone, aroundcentral vein); II = grade 2 (infiltration periportal to midzonal or zentrolobular to midzonal); III = grade 3 (infiltration panlobular)
Gerspach et al. BMC Veterinary Research (2017) 13:98 Page 9 of 11

well demarcated versus foamy depositions/appearance,can be distinct enough to differentiate between fattyand glycogen depositions in H&E staining. However,special staining techniques improve the accuracy,especially when droplet size is quantified, althoughnot being practical [15].We suspected focal lipid infiltration macroscopically in
one liver. However, the histopathological examinationdid not reveal obvious differences in the degree of lipidinfiltration between the corresponding tissue samples.Focal fatty liver in cattle was rarely reported in theliterature. Mohamed et al. [11] diagnosed focal fatty liverby ultrasonography in a heifer. In a study population of106 Holstein cattle focal fatty liver was observed in 24%of the cows [10]. Focal lipid infiltration occurs adjacentto the insertion of serosal attachments [24] and is notrelated to the pathogenesis of fatty liver in cattle. Incontrast to our results Raoofi et al. [10] and Mohamedet al. [11] observed a higher amount of fat vacuolescompared to the surrounding tissue.Overall the distribution of TAG throughout the liver
and the accuracy of human evaluation of liver biopsiesmay lead to acceptable diagnoses for clinical purposes.For the staging of lipid infiltration for research projects,some degree of variation needs to be considered.A consensus on histopathologic diagnosing and
staging of hepatic lipid infiltration should be established.In our study, we used a scoring system including the ob-servation of lipid infiltration in the different lobularzones in order to divide into 4 categories (grade 0 to 3).We observed that mild infiltration was mainly locatedcentrolobular and with increasing severity the distribu-tion was panlobular. Although experienced pathologistsevaluated the tissue, the assignment to the lobular zonesmay be somewhat subjective. An objective measurementof the lobules may have increased the accuracy. Inaddition, we used samples that were obtained at onepoint in time for every individual cow. In order to estab-lish a reliable protocol for histopathological diagnostics,the development of fat infiltration over time should alsobe investigated.
ConclusionIn the present study, the difference in TAG contentbetween any locations was less than 2%.
Therefore, the TAG content of a liver biopsy taken atany side differs less than 2% from other locationsthroughout the liver. Based on the scoring system theTAG concentration was even distributed in 79.3% of thelivers. The agreement between two pathologists in scor-ing histological specimens was moderate to fair. Overallthe distribution of TAG throughout the liver and theaccuracy of human evaluation of liver biopsies may leadto acceptable diagnoses for clinical purposes. For thestaging of lipid infiltration for research projects, somedegree of variation needs to be considered. A consensuson histopathologic diagnosing and staging of hepaticlipid infiltration should be established.
AbbreviationsH&E: Hematoxylin-eosin; ORO: Oil red O; PAS: Periodic acid-Schiff stain;TAG: Qtriacylglycerol
AcknowledgementsWe would like to thank Dr. Clemens Bauer and Dr. Frank Götz (abattoirZurich) for their assistance in collecting liver tissue, and Ms. Jeanne Peter forthe preparation of the drawing (Fig. 1). Further we would like to thank Ms.Belinda Senn and Ms. Eliane Steiner for preparing and staining the tissuesamples.
FundingThis research had no funding sources.
Availability of data and materialsThe dataset supporting the conclusions of this article is included within thearticle.
Authors’ contributionsCG and MR initiated and organized the study. CG and RK were responsiblefor sample collection, SI and CG measured the TAG concentrations, MR andMH assessed the tissue samples, SH participated in statistical evaluation, CGdrafted the manuscript, which was read and approved by all authors.
Competing interestsThe authors declare that they have no potential conflicts of interest todisclose.
Consent for publicationNot applicable.
Ethics approval and consent to participateAll material was sampled after slaughter and did not require any ethicalapproval.
Publisher’s noteSpringer Nature remains neutral with regard to jurisdictional claims inpublished maps and institutional affiliations.
Author details1Department of Farm Animals, Vetsuisse Faculty, University of Zurich,Winterthurerstrasse 260, Zurich, Switzerland. 2Institute of Pharmacology andToxicology, Vetsuisse Faculty, University of Zurich, Winterthurerstrasse 260,8057 Zurich, Switzerland. 3Institute of Veterinary Pathology, Vetsuisse Faculty,University of Zurich, Winterthurerstrasse 268, Zurich, Switzerland. 4Section ofEpidemiology, Vetsuisse Faculty, University of Zurich, Winterthurerstrasse 270,Zurich, Switzerland.
Table 7 Number of whole livers with different grades inassociation to the localization of lipid infiltration within hepaticlobules
Periportal Zentrolobular Zentro-panlobular Panlobular
Grade 1 2 4 0 0
Grade 2 0 0 4 0
Grade 3 0 0 1 5
Gerspach et al. BMC Veterinary Research (2017) 13:98 Page 10 of 11
Received: 6 August 2015 Accepted: 28 March 2017
References1. Bobe G, Young JW, Beitz DC. Invited review: pathology, etiology, prevention,
and treatment of fatty liver in dairy cows. J Dairy Sci. 2004;87:3105–24.2. Starke A, Haudum A, Busche R, Beyerbach M, Dänicke S, Rehage J. Technical
note: analysis of total lipid and triacylglycerol content in small liver biopsysamples in cattle. J Anim Sci. 2010;88:2741–50.
3. Kemp SD, Zimmerman KL, Panciera DL, Monroe WE, Leib MS. Histopathologicvariation between liver lobes in dogs. J Vet Intern Med. 2015;29:58–62.
4. Janiec DJ, Jacobson ER, Freeth A, Spaulding L, Blaszyk H. Histologic variationof grade and stage of non-alcoholic fatty liver disease in liver biopsies. ObesSurg. 2005;15:497–501.
5. Cole TL, Center SA, Flood SN, Rowland PH, Valentine BA, Warner KL, Erb HN.Diagnostic comparison of needle and wedge biopsy specimens of the liverin dogs and cats. J Am Vet Med Assoc. 2002;220:1483–90.
6. Maharaj B, Maharaj RJ, Leary WP, Cooppan RM, Naran AD, Pirie D, Pudifin DJ.Sampling variability and its influence on the diagnostic yield of percutaneousneedle biopsy of the liver. Lancet. 1986;1:523–5.
7. Ratziu V, Charlotte F, Heurtier A, Gombert S, Giral P, Bruckert E, Grimaldi A,Capron F, Poynard T. Sampling variability of liver biopsy in nonalcoholicfatty liver disease. Gastroenterology. 2005;128:1898–906.
8. Gaal T, Reid IM, Collins RA, Roberts CJ, Pike BV. Comparison of biochemicaland histological methods of estimating fat content of liver of dairy cows.Res Vet Sci. 1983;34:245–8.
9. O’Kelly JC. The concentrations of lipids in the plasma, liver and bile ofgenetically different types of cattle. Comp Biochem Physiol B. 1974;49:491–500.
10. Raoofi A, Bazargani TT, Tabatabayi AH. An abattoir survey on the frequencyof fatty liver syndrome in dairy cows from the suburbs of Tehran. TropAnim Health Prod. 2001;33:15–9.
11. Mohamed T, Oikawa S, Kurosawa T, Takehana K, Hosaka Y, Okada H, Koiwa M,Sato H. Focal fatty liver in a heifer: utility of Ultrasonography in diagnosis. J VetMed Sci. 2004;66:341–4.
12. Theodossi A, Skene AM, Portmann B, Knill-Jones RP, Patrick RS, Tate RA,Kealey W, Jarvis KJ, O’Brian DJ, Williams R. Observer variation in assessmentof liver biopsies including analysis by kappa statistics. Gastroenterology.1980;79:232–41.
13. Fiorini RN, Kirtz J, Periyasamy B, Evans Z, Haines JK, Cheng G, Polito C, Rodwell D,Shafizadeh SF, Zhou X, Campbell C, Birsner J, Schmidt M, Lewin D, Chavin KD.Development of an unbiased method for the estimation of liver steatosis. ClinTranspl. 2004;18:700–6.
14. Franzén LE, Ekstedt M, Kechagias S, Bodin L. Semiquantitative evaluationoverestimates the degree of steatosis in liver biopsies: a comparison tostereological point counting. Mod Pathol. 2005;18:912–6.
15. Levene AP, Kudo H, Armstrong MJ, Thursz MR, Gedroyc WM, Anstee QM,Goldin RD. Quantifying hepatic steatosis - more than meets the eye.Histopathology. 2012;60:971–81.
16. Norris AW, Chen L, Fisher SJ, Szanto I, Ristow M, Gonzalez FJ, Jozsi AC,Hirshman MF, Goodyear LJ, Kahn CR. Muscle-specific PPARgamma deficientmice develop insulin resistance but respond normally to thiazolidinediones.J Clin Invest. 2003;112:608–18.
17. Viera AJ, Garrett JM. Understanding interobserver agreement: the kappastatistic. Fam Med. 2005;37:360–3.
18. Bates D, Mächler M, Bolker B, Walker S. Fitting Linear Mixed-Effects Modelsusing lme4. 2015:67. doi:10.18637/jss.v067.i01.
19. Reid IM, Collins RA. The pathology of post-parturient fatty liver in high-yieldingdairy cows. Invest Cell Pathol. 1980;3:237–49.
20. Sejersen H, Sørensen MT, Larsen T, Bendixen E, Ingvartsen KL. Liver proteinexpression in dairy cows with high liver triglycerides in early lactation. JDairy Sci. 2012;95:2409–21.
21. Haudum A, Starke A, Beyerbach M, Wohlsein P, Rehage J. Ultrasonographicassessment of liver dimensions in dairy cows with different hepatictriacylglycerol content. J Anim Sci. 2011;89:1392–400.
22. Gaál T, Husvéth F. Comparison of the liver biopsy sample and the “wholeliver” in respect of lipid content and fatty acid composition of lipids. ActaVet Hung. 1983;31:51–6.
23. Collins RA, Reid IM. A correlated biochemical and stereological study ofperiparturient fatty liver in the dairy cow. Res Vet Sci. 1980;28:373–6.
24. Stalker MJ, Haye MA. Liver and biliary system. In: Jubb, Kennedy & Palmer’sPathology of Domestic Animals. New York: Elsevier Saunders; 2007:297–298.
• We accept pre-submission inquiries
• Our selector tool helps you to find the most relevant journal
• We provide round the clock customer support
• Convenient online submission
• Thorough peer review
• Inclusion in PubMed and all major indexing services
• Maximum visibility for your research
Submit your manuscript atwww.biomedcentral.com/submit
Submit your next manuscript to BioMed Central and we will help you at every step:
Gerspach et al. BMC Veterinary Research (2017) 13:98 Page 11 of 11