Embed Size (px)
Citation preview
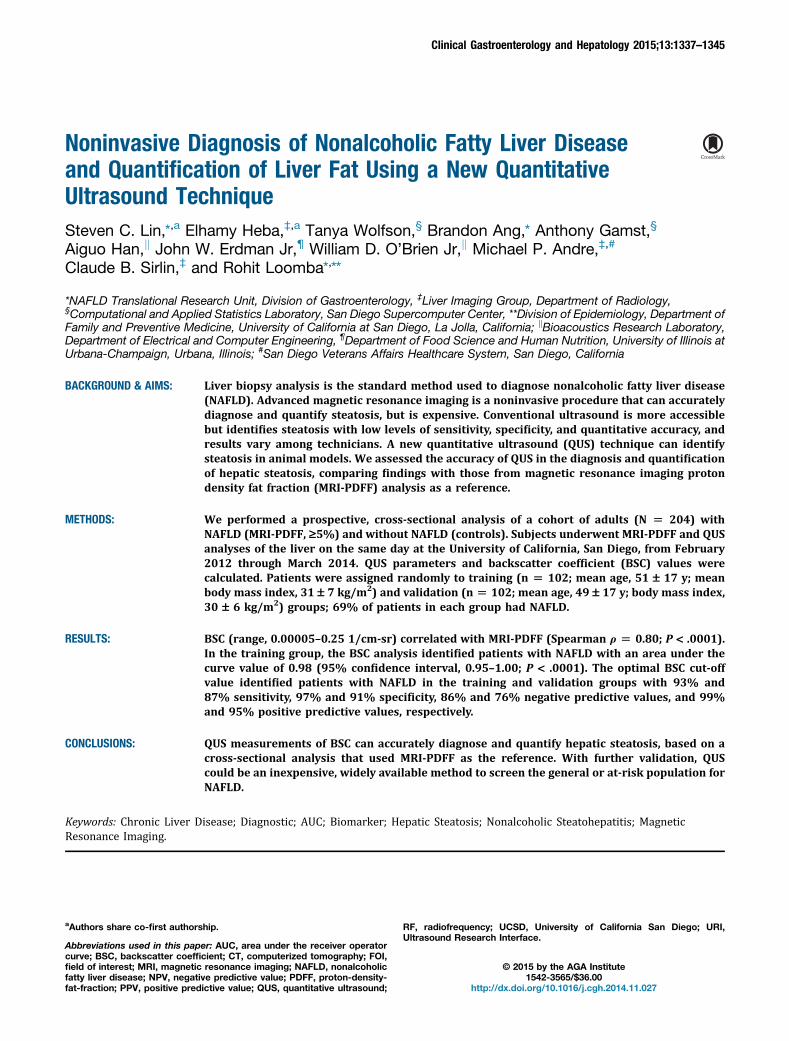
Clinical Gastroenterology and Hepatology 2015;13:1337–1345
Noninvasive Diagnosis of Nonalcoholic Fatty Liver Diseaseand Quantification of Liver Fat Using a New QuantitativeUltrasound Technique
Steven C. Lin,*,a Elhamy Heba,‡,a Tanya Wolfson,§ Brandon Ang,* Anthony Gamst,§
Aiguo Han,k John W. Erdman Jr,¶ William D. O’Brien Jr,k Michael P. Andre,‡,#
Claude B. Sirlin,‡ and Rohit Loomba*,**
*NAFLD Translational Research Unit, Division of Gastroenterology, ‡Liver Imaging Group, Department of Radiology,§Computational and Applied Statistics Laboratory, San Diego Supercomputer Center, **Division of Epidemiology, Department ofFamily and Preventive Medicine, University of California at San Diego, La Jolla, California; kBioacoustics Research Laboratory,Department of Electrical and Computer Engineering, ¶Department of Food Science and Human Nutrition, University of Illinois atUrbana-Champaign, Urbana, Illinois; #San Diego Veterans Affairs Healthcare System, San Diego, California
BACKGROUND & AIMS:
aAuthors share co-first authors
Abbreviations used in this papecurve; BSC, backscatter coeffifield of interest; MRI, magneticfatty liver disease; NPV, negativfat-fraction; PPV, positive pred
Liver biopsy analysis is the standard method used to diagnose nonalcoholic fatty liver disease(NAFLD). Advanced magnetic resonance imaging is a noninvasive procedure that can accuratelydiagnose and quantify steatosis, but is expensive. Conventional ultrasound is more accessiblebut identifies steatosis with low levels of sensitivity, specificity, and quantitative accuracy, andresults vary among technicians. A new quantitative ultrasound (QUS) technique can identifysteatosis in animal models. We assessed the accuracy of QUS in the diagnosis and quantificationof hepatic steatosis, comparing findings with those from magnetic resonance imaging protondensity fat fraction (MRI-PDFF) analysis as a reference.
METHODS:
We performed a prospective, cross-sectional analysis of a cohort of adults (N [ 204) withNAFLD (MRI-PDFF, ‡5%) and without NAFLD (controls). Subjects underwent MRI-PDFF and QUSanalyses of the liver on the same day at the University of California, San Diego, from February2012 through March 2014. QUS parameters and backscatter coefficient (BSC) values werecalculated. Patients were assigned randomly to training (n [ 102; mean age, 51 – 17 y; meanbody mass index, 31 – 7 kg/m2) and validation (n[ 102; mean age, 49 – 17 y; body mass index,30 – 6 kg/m2) groups; 69% of patients in each group had NAFLD.RESULTS:
BSC (range, 0.00005–0.25 1/cm-sr) correlated with MRI-PDFF (Spearman r [ 0.80; P < .0001).In the training group, the BSC analysis identified patients with NAFLD with an area under thecurve value of 0.98 (95% confidence interval, 0.95–1.00; P < .0001). The optimal BSC cut-offvalue identified patients with NAFLD in the training and validation groups with 93% and87% sensitivity, 97% and 91% specificity, 86% and 76% negative predictive values, and 99%and 95% positive predictive values, respectively.CONCLUSIONS:
QUS measurements of BSC can accurately diagnose and quantify hepatic steatosis, based on across-sectional analysis that used MRI-PDFF as the reference. With further validation, QUScould be an inexpensive, widely available method to screen the general or at-risk population forNAFLD.Keywords: Chronic Liver Disease; Diagnostic; AUC; Biomarker; Hepatic Steatosis; Nonalcoholic Steatohepatitis; MagneticResonance Imaging.
hip.
r: AUC, area under the receiver operatorcient; CT, computerized tomography; FOI,resonance imaging; NAFLD, nonalcoholice predictive value; PDFF, proton-density-ictive value; QUS, quantitative ultrasound;
RF, radiofrequency; UCSD, University of California San Diego; URI,Ultrasound Research Interface.
© 2015 by the AGA Institute1542-3565/$36.00
http://dx.doi.org/10.1016/j.cgh.2014.11.027
1338 Lin et al Clinical Gastroenterology and Hepatology Vol. 13, No. 7
Nonalcoholic fatty liver disease (NAFLD) hasemerged as the leading cause of chronic liver dis-
ease in the United States.1 It is defined as a spectrum ofdiseases, from hepatic steatosis that can progress tononalcoholic steatohepatitis, fibrosis, cirrhosis, and evenhepatocellular carcinoma.2 NAFLD is associated stronglywith metabolic risk factors,1 such as cardiovascular dis-ease,3 obesity, diabetes mellitus,4,5 and dyslipidemia.6
Currently, the estimated US prevalence of NAFLD rangesfrom 17% to 51%,1 and it is even more common in certainhigh-risk groups, such as individuals with severe obesity(90%), type 2 diabetes mellitus (69%), and older Hispanicmales.7–9 Liver biopsy remains the gold standard for diag-nosing NAFLD.1,10 However, this procedure is invasive,with complications such as bleeding and infection, and isunreliable for quantifying steatosis owing to samplingerror and variability among pathologist interpretation.11,12
Because of these disadvantages of liver biopsy, thereis increasing interest in developing noninvasive methodsto identify hepatic steatosis, including those measured bystate-of-the-art imaging modalities.1,13 Although mostcommonly accessible to assess NAFLD, conventional ul-trasonography is limited by operator dependency, lowsensitivity and specificity, and lacks quantitative accu-racy.14–16 Computerized tomography is limited by lowsensitivity for mild steatosis, radiation exposure, andinaccurate quantification of steatosis.17 Advanced mag-netic resonance imaging techniques that measure theproton density fat fraction (MRI-PDFF)—shown tocorrelate with histology-determined steatosis grade inadults with NAFLD18,19—and MR spectroscopy haveemerged as leading noninvasive modalities for steatosisquantification in NAFLD in terms of sensitivity, speci-ficity, and reliability.17,20,21 However, similar to liverbiopsies, magnetic resonance imaging is expensive andnot routinely accessible.
Quantitative ultrasound (QUS) is a technique that wasdeveloped to better characterize tissue microstructureby measuring fundamental acoustic parameters,including backscatter coefficient (BSC).15 BSC is analo-gous (but not equal) to the qualitative echogenicity oftissue, which is used as a component for grading liverstatus in conventional clinical ultrasonography. Asshown in several animal models but limited humanprospective studies, BSC may have the potential to detectand quantify hepatic steatosis.22–25 Furthermore, severalrecent interlaboratory studies have shown that QUSmethods in reference phantoms (see QUS protocol) andin vivo using clinical imaging scanners are highlyreproducible and independent of operator and imagingsystem factors.26,27
This study was a cross-sectional analysis of a prospec-tive cohort aimed to assess the accuracy of BSC to diagnoseand quantify hepatic steatosis using MRI-PDFF as thereference. The rationale for using MRI-PDFF as a referencestandard rather thana liver biopsy is thatMRI-PDFF ismoreaccurate than qualitative liver histologic assessment forquantifying liver fat, as previously shown.28,29
Methods
Study Design and Derivation of Cohort
This was an Institutional Review Board–approved (bythe University of California San Diego [UCSD] institu-tional review board), Health Insurance Portability andAccountability Act compliant, cross-sectional analysis ofparticipants derived consecutively from a prospectivecohort, aimed at assessing the accuracy of BSC to di-agnose and quantify hepatic steatosis using MRI-PDFF asreference in participants with NAFLD (defined as MRI-PDFF � 5%) and non-NAFLD controls (defined as MRI-PDFF < 5%). We followed Standards for Reporting ofDiagnostic Accuracy guidelines in this study of QUS forthe diagnostic accuracy in detecting hepatic steatosis(see Supplementary Table 1).
Study participants were recruited at the UCSD NAFLDTranslational Research Unit (principal investigator R. L.)between February 2012 and March 2014; 236 eligiblestudy participants were screened and deemed eligible forthe study, and 204 participants complied with the studyprotocol and received same-day QUS and MRI of the liver(see Supplementary Figure 1). A priori, half of theseparticipants (102) were assigned to a training group, andthe other half were assigned to a validation group usingstratified randomization by an experienced statisticianbefore any assessment of diagnostic test characteristics tomaintain the integrity of the data set. All participantsprovided written informed consent. Please see the“Inclusion and Exclusion Criteria” and “Clinical Evalua-tion” sections in the Supplementary Methods.
Quantitative Ultrasound BackscatterCoefficient Protocol
QUS was performed by a research physician (E. H.)using a Siemens S3000 scanner (Siemens AG, Moun-tain View, CA) with a direct Ultrasound ResearchInterface (URI) option.30 Participants were asked tofast for 4 hours before the examination. Scanning wasperformed in the dorsal decubitus position with theright arm at maximum abduction. The 4C1 curvedvector array transducer (1–4.5 MHz nominal) wasplaced 90� to the liver capsule through the rightintercostal approach.
With the participant in a complete breath hold, mul-tiple B-mode images were acquired of the right lobe ofthe liver area, avoiding major vasculature. The URI wasenabled and 10 consecutive frames of transducer signalswere recorded from the same region of the liver. Then,without changing any scanner settings, 10 consecutiveframes were recorded in a well-characterized, tissue-mimicking reference phantom with acoustic properties(sound speed, attenuation, backscatter coefficient) com-parable with average human liver tissue (Figure 1A).Only the first frame was used for QUS analysis. URI data
July 2015 Diagnosis of NAFLD With QUS 1339
files, identified only by code numbers, were saved andthen transferred to the server for analysis.
Quantitative Ultrasound Backscatter CoefficientData Analysis
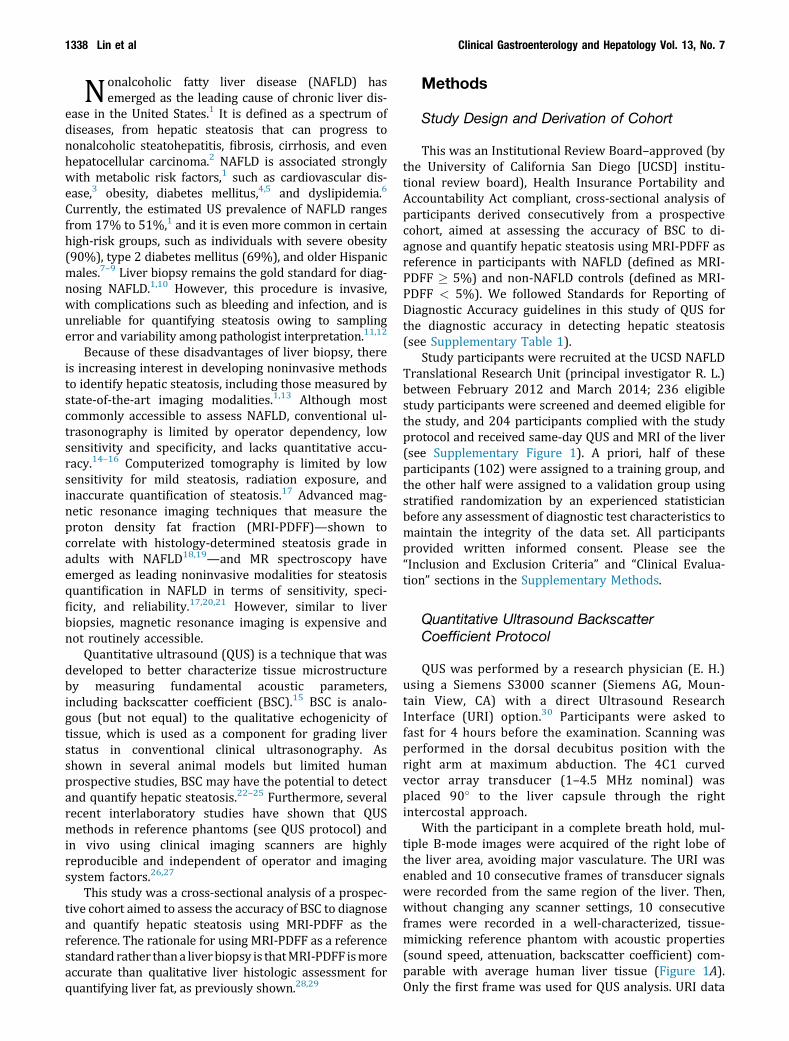
Ultrasonic pulses are transmitted by the transducerinto tissue, where the energy is absorbed and scatteredalong its path as a result of the heterogeneous natureof tissue. A portion of the energy in the pulses isscattered back to the transducer (echoes). There, it isreceived, processed, and recorded to form one scanline at a time. A 2-dimensional ultrasonogram (1frame) is formed from 128 scan lines, which is storedby the URI. Signal analysis for BSC is performed in aselected field of interest (FOI) that is drawn manuallyon the liver images (Figure 1A). One scan line forillustration is plotted as a raw radiofrequency (RF)signal as a function of depth (Figure 1B). The powerspectra from the liver and phantom are computed(Figure 1C). The reference phantom spectrum is usedto correct the liver spectrum for machine-dependentfactors (focusing, gain, transducer pattern, transmitpower, and so forth), as well as to correct for signalloss caused by attenuation with depth. The BSC then iscalculated from the corrected power spectrum (see theSupplementary Methods for a more detailed descrip-tion of this procedure).
Figure 1.Quantitative ul-trasound transducer, re-gion of interest (ROI),and the average powerspectra. (A) The QUStransducer captures im-ages and BSC data onboth a participant’s liver(left) and on a referencephantom (right). An ana-lyst draws a FOI for signalprocessing. (B) Trans-ducer signals captured bythe QUS comprise rawradiofrequency data inlines of pressure waves,one of which is plottedhere. (C) The average po-wer spectra over a sub-region of interest from aparticipant (left) and thereference phantom (right).Participants’ spectra varyfrom that of the phantomas a result of differentacoustic properties; thus,the reference phantomcan be used to calibrateparticipant data and cor-rect for total attenuationof tissue signals in theoverall FOI.
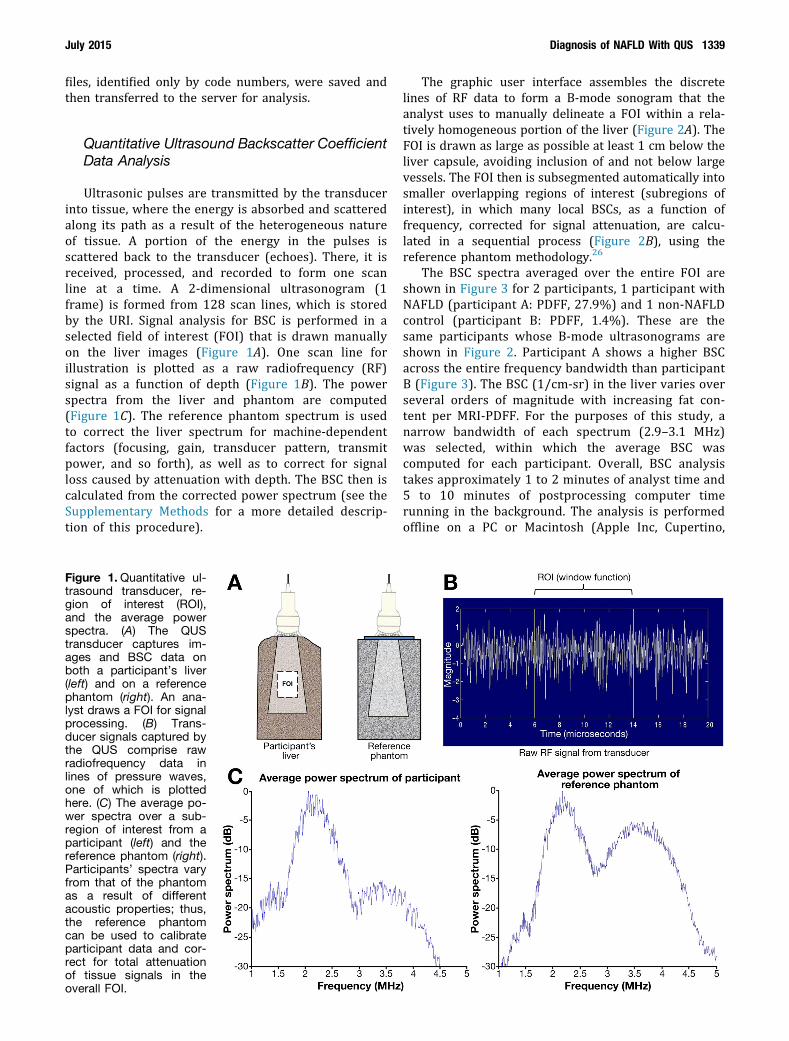
The graphic user interface assembles the discretelines of RF data to form a B-mode sonogram that theanalyst uses to manually delineate a FOI within a rela-tively homogeneous portion of the liver (Figure 2A). TheFOI is drawn as large as possible at least 1 cm below theliver capsule, avoiding inclusion of and not below largevessels. The FOI then is subsegmented automatically intosmaller overlapping regions of interest (subregions ofinterest), in which many local BSCs, as a function offrequency, corrected for signal attenuation, are calcu-lated in a sequential process (Figure 2B), using thereference phantom methodology.26
The BSC spectra averaged over the entire FOI areshown in Figure 3 for 2 participants, 1 participant withNAFLD (participant A: PDFF, 27.9%) and 1 non-NAFLDcontrol (participant B: PDFF, 1.4%). These are thesame participants whose B-mode ultrasonograms areshown in Figure 2. Participant A shows a higher BSCacross the entire frequency bandwidth than participantB (Figure 3). The BSC (1/cm-sr) in the liver varies overseveral orders of magnitude with increasing fat con-tent per MRI-PDFF. For the purposes of this study, anarrow bandwidth of each spectrum (2.9–3.1 MHz)was selected, within which the average BSC wascomputed for each participant. Overall, BSC analysistakes approximately 1 to 2 minutes of analyst time and5 to 10 minutes of postprocessing computer timerunning in the background. The analysis is performedoffline on a PC or Macintosh (Apple Inc, Cupertino,
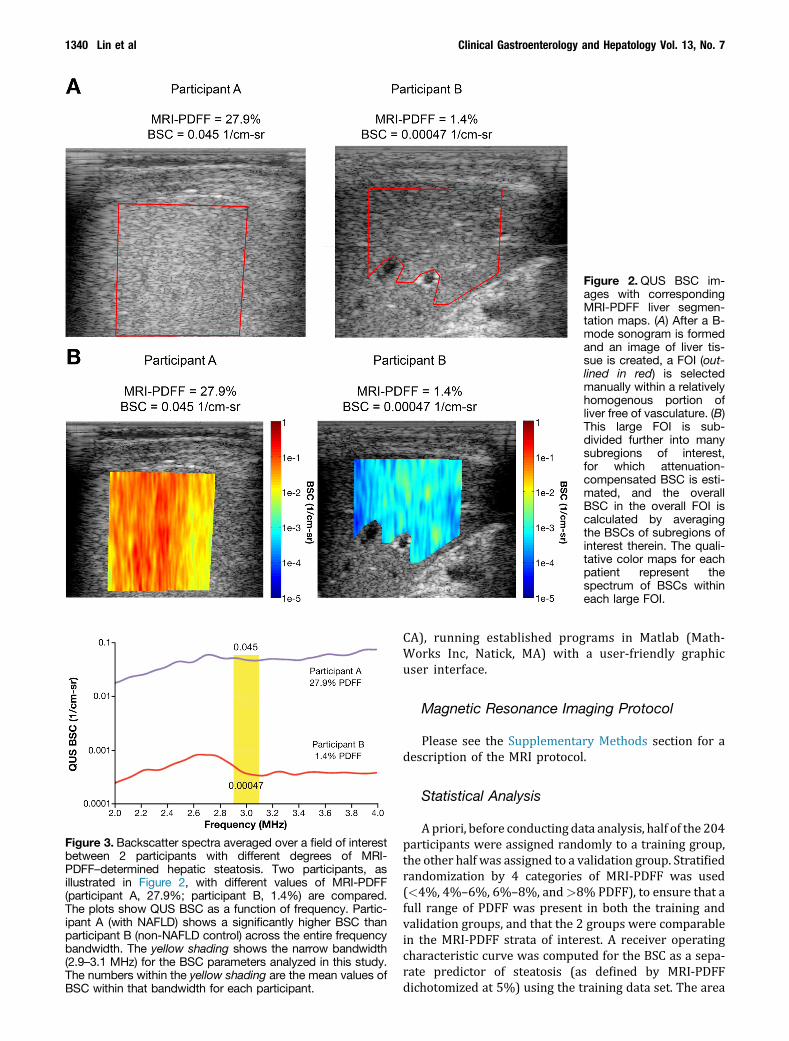
Figure 2.QUS BSC im-ages with correspondingMRI-PDFF liver segmen-tation maps. (A) After a B-mode sonogram is formedand an image of liver tis-sue is created, a FOI (out-lined in red) is selectedmanually within a relativelyhomogenous portion ofliver free of vasculature. (B)This large FOI is sub-divided further into manysubregions of interest,for which attenuation-compensated BSC is esti-mated, and the overallBSC in the overall FOI iscalculated by averagingthe BSCs of subregions ofinterest therein. The quali-tative color maps for eachpatient represent thespectrum of BSCs withineach large FOI.
Figure 3. Backscatter spectra averaged over a field of interestbetween 2 participants with different degrees of MRI-PDFF–determined hepatic steatosis. Two participants, asillustrated in Figure 2, with different values of MRI-PDFF(participant A, 27.9%; participant B, 1.4%) are compared.The plots show QUS BSC as a function of frequency. Partic-ipant A (with NAFLD) shows a significantly higher BSC thanparticipant B (non-NAFLD control) across the entire frequencybandwidth. The yellow shading shows the narrow bandwidth(2.9–3.1 MHz) for the BSC parameters analyzed in this study.The numbers within the yellow shading are the mean values ofBSC within that bandwidth for each participant.
1340 Lin et al Clinical Gastroenterology and Hepatology Vol. 13, No. 7
CA), running established programs in Matlab (Math-Works Inc, Natick, MA) with a user-friendly graphicuser interface.
Magnetic Resonance Imaging Protocol
Please see the Supplementary Methods section for adescription of the MRI protocol.
Statistical Analysis
Apriori, before conducting data analysis, half of the 204participants were assigned randomly to a training group,the other half was assigned to a validation group. Stratifiedrandomization by 4 categories of MRI-PDFF was used(<4%, 4%–6%, 6%–8%, and>8% PDFF), to ensure that afull range of PDFF was present in both the training andvalidation groups, and that the 2 groups were comparablein the MRI-PDFF strata of interest. A receiver operatingcharacteristic curve was computed for the BSC as a sepa-rate predictor of steatosis (as defined by MRI-PDFFdichotomized at 5%) using the training data set. The area
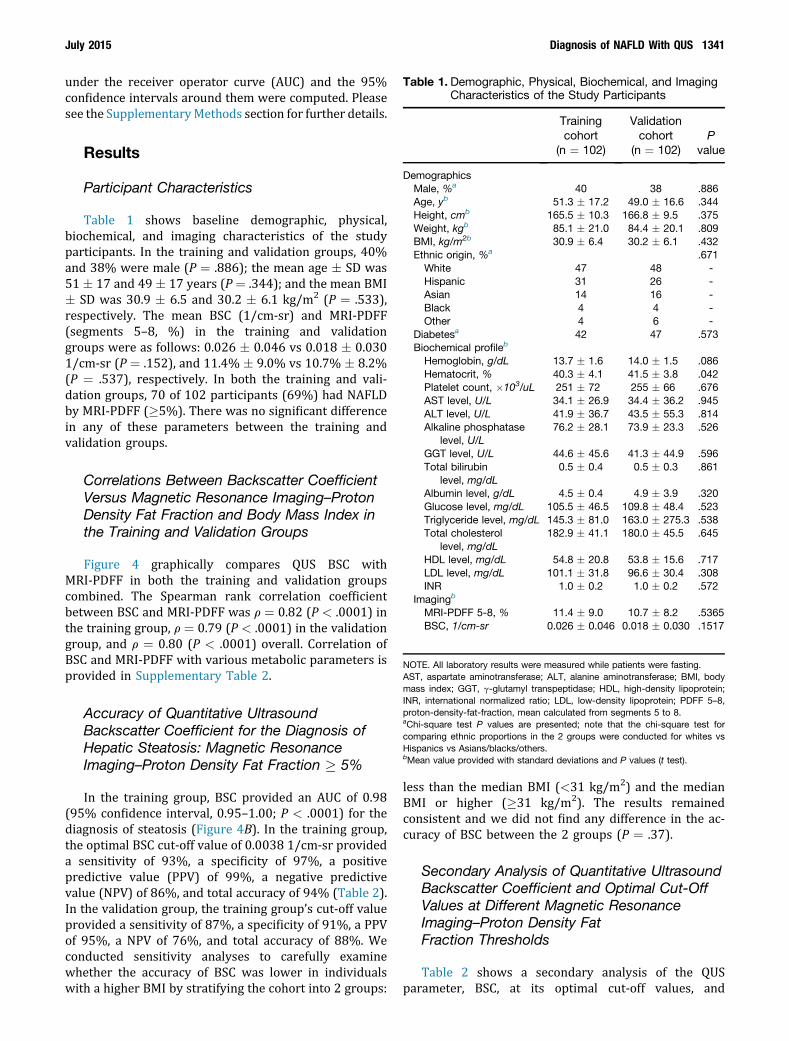
Table 1. Demographic, Physical, Biochemical, and ImagingCharacteristics of the Study Participants
Trainingcohort
(n ¼ 102)
Validationcohort
(n ¼ 102)P
value
DemographicsMale, %a 40 38 .886Age, yb 51.3 � 17.2 49.0 � 16.6 .344Height, cmb 165.5 � 10.3 166.8 � 9.5 .375Weight, kgb 85.1 � 21.0 84.4 � 20.1 .809BMI, kg/m2b 30.9 � 6.4 30.2 � 6.1 .432Ethnic origin, %a .671White 47 48 -Hispanic 31 26 -Asian 14 16 -Black 4 4 -Other 4 6 -
Diabetesa 42 47 .573Biochemical profileb
Hemoglobin, g/dL 13.7 � 1.6 14.0 � 1.5 .086Hematocrit, % 40.3 � 4.1 41.5 � 3.8 .042Platelet count, �103/uL 251 � 72 255 � 66 .676AST level, U/L 34.1 � 26.9 34.4 � 36.2 .945ALT level, U/L 41.9 � 36.7 43.5 � 55.3 .814Alkaline phosphatase
level, U/L76.2 � 28.1 73.9 � 23.3 .526
GGT level, U/L 44.6 � 45.6 41.3 � 44.9 .596Total bilirubin
level, mg/dL0.5 � 0.4 0.5 � 0.3 .861
Albumin level, g/dL 4.5 � 0.4 4.9 � 3.9 .320Glucose level, mg/dL 105.5 � 46.5 109.8 � 48.4 .523Triglyceride level, mg/dL 145.3 � 81.0 163.0 � 275.3 .538Total cholesterol
level, mg/dL182.9 � 41.1 180.0 � 45.5 .645
HDL level, mg/dL 54.8 � 20.8 53.8 � 15.6 .717LDL level, mg/dL 101.1 � 31.8 96.6 � 30.4 .308INR 1.0 � 0.2 1.0 � 0.2 .572
Imagingb
MRI-PDFF 5-8, % 11.4 � 9.0 10.7 � 8.2 .5365BSC, 1/cm-sr 0.026 � 0.046 0.018 � 0.030 .1517
NOTE. All laboratory results were measured while patients were fasting.AST, aspartate aminotransferase; ALT, alanine aminotransferase; BMI, bodymass index; GGT, g-glutamyl transpeptidase; HDL, high-density lipoprotein;INR, international normalized ratio; LDL, low-density lipoprotein; PDFF 5–8,proton-density-fat-fraction, mean calculated from segments 5 to 8.aChi-square test P values are presented; note that the chi-square test forcomparing ethnic proportions in the 2 groups were conducted for whites vsHispanics vs Asians/blacks/others.bMean value provided with standard deviations and P values (t test).
July 2015 Diagnosis of NAFLD With QUS 1341
under the receiver operator curve (AUC) and the 95%confidence intervals around them were computed. Pleasesee the SupplementaryMethods section for further details.
Results
Participant Characteristics
Table 1 shows baseline demographic, physical,biochemical, and imaging characteristics of the studyparticipants. In the training and validation groups, 40%and 38% were male (P ¼ .886); the mean age � SD was51 � 17 and 49 � 17 years (P¼ .344); and the mean BMI� SD was 30.9 � 6.5 and 30.2 � 6.1 kg/m2 (P ¼ .533),respectively. The mean BSC (1/cm-sr) and MRI-PDFF(segments 5–8, %) in the training and validationgroups were as follows: 0.026 � 0.046 vs 0.018 � 0.0301/cm-sr (P ¼ .152), and 11.4% � 9.0% vs 10.7% � 8.2%(P ¼ .537), respectively. In both the training and vali-dation groups, 70 of 102 participants (69%) had NAFLDby MRI-PDFF (�5%). There was no significant differencein any of these parameters between the training andvalidation groups.
Correlations Between Backscatter CoefficientVersus Magnetic Resonance Imaging–ProtonDensity Fat Fraction and Body Mass Index inthe Training and Validation Groups
Figure 4 graphically compares QUS BSC withMRI-PDFF in both the training and validation groupscombined. The Spearman rank correlation coefficientbetween BSC and MRI-PDFF was r ¼ 0.82 (P < .0001) inthe training group, r ¼ 0.79 (P < .0001) in the validationgroup, and r ¼ 0.80 (P < .0001) overall. Correlation ofBSC and MRI-PDFF with various metabolic parameters isprovided in Supplementary Table 2.
Accuracy of Quantitative UltrasoundBackscatter Coefficient for the Diagnosis ofHepatic Steatosis: Magnetic ResonanceImaging–Proton Density Fat Fraction � 5%
In the training group, BSC provided an AUC of 0.98(95% confidence interval, 0.95–1.00; P < .0001) for thediagnosis of steatosis (Figure 4B). In the training group,the optimal BSC cut-off value of 0.0038 1/cm-sr provideda sensitivity of 93%, a specificity of 97%, a positivepredictive value (PPV) of 99%, a negative predictivevalue (NPV) of 86%, and total accuracy of 94% (Table 2).In the validation group, the training group’s cut-off valueprovided a sensitivity of 87%, a specificity of 91%, a PPVof 95%, a NPV of 76%, and total accuracy of 88%. Weconducted sensitivity analyses to carefully examinewhether the accuracy of BSC was lower in individualswith a higher BMI by stratifying the cohort into 2 groups:
less than the median BMI (<31 kg/m2) and the medianBMI or higher (�31 kg/m2). The results remainedconsistent and we did not find any difference in the ac-curacy of BSC between the 2 groups (P ¼ .37).
Secondary Analysis of Quantitative UltrasoundBackscatter Coefficient and Optimal Cut-OffValues at Different Magnetic ResonanceImaging–Proton Density FatFraction Thresholds
Table 2 shows a secondary analysis of the QUSparameter, BSC, at its optimal cut-off values, and
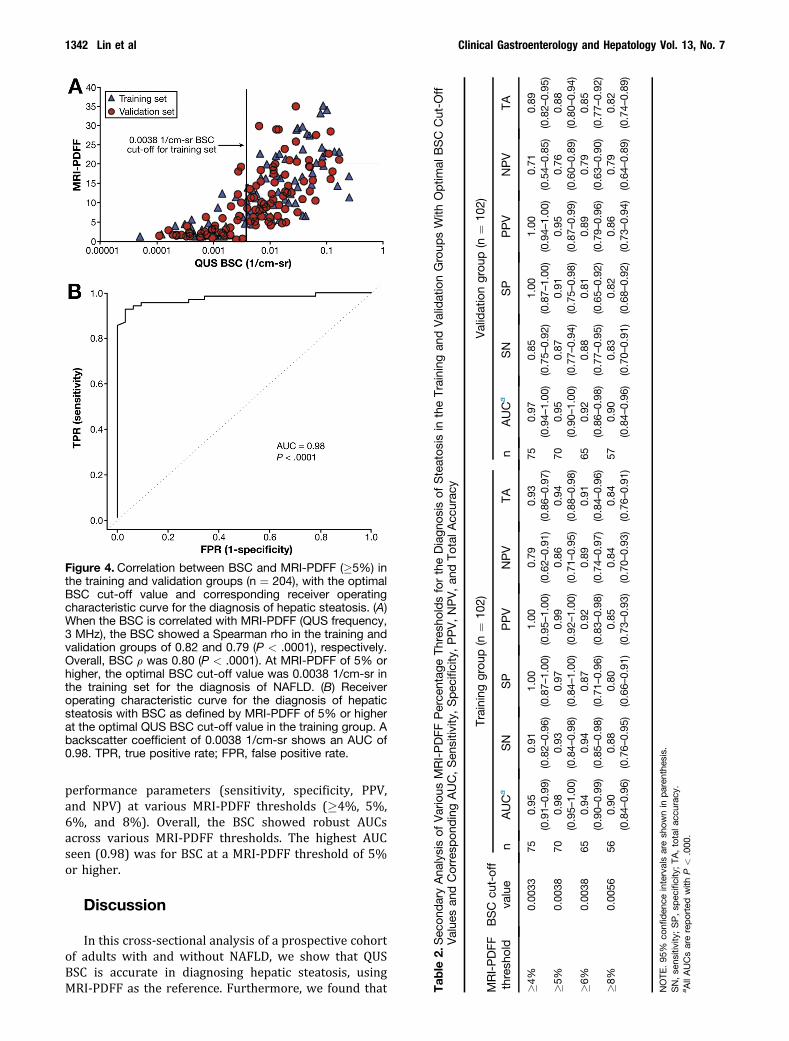
Figure 4. Correlation between BSC and MRI-PDFF (�5%) inthe training and validation groups (n ¼ 204), with the optimalBSC cut-off value and corresponding receiver operatingcharacteristic curve for the diagnosis of hepatic steatosis. (A)When the BSC is correlated with MRI-PDFF (QUS frequency,3 MHz), the BSC showed a Spearman rho in the training andvalidation groups of 0.82 and 0.79 (P < .0001), respectively.Overall, BSC r was 0.80 (P < .0001). At MRI-PDFF of 5% orhigher, the optimal BSC cut-off value was 0.0038 1/cm-sr inthe training set for the diagnosis of NAFLD. (B) Receiveroperating characteristic curve for the diagnosis of hepaticsteatosis with BSC as defined by MRI-PDFF of 5% or higherat the optimal QUS BSC cut-off value in the training group. Abackscatter coefficient of 0.0038 1/cm-sr shows an AUC of0.98. TPR, true positive rate; FPR, false positive rate.
Tab
le2.
Sec
ondaryAna
lysisof
Various
MRI-PDFF
Perce
ntag
eTh
resh
oldsfortheDiagn
osis
ofSteatos
isin
theTraining
andValidationGroup
sWith
Optim
alBSC
Cut-O
ffValue
san
dCorresp
ondingAUC,Sen
sitiv
ity,Spec
ificity,PPV,NPV,an
dTo
talA
ccurac
y
MRI-PDFF
thresh
old
BSC
cut-off
value
Training
grou
p(n
¼10
2)Validationgrou
p(n
¼10
2)
nAUCa
SN
SP
PPV
NPV
TAn
AUCa
SN
SP
PPV
NPV
TA
�4%
0.00
3375
0.95
(0.91–
0.99
)0.91
(0.82–
0.96
)1.00
(0.87–
1.00
)1.00
(0.95–
1.00
)0.79
(0.62–
0.91
)0.93
(0.86–
0.97
)75
0.97
(0.94–
1.00
)0.85
(0.75–
0.92
)1.00
(0.87–
1.00
)1.00
(0.94–
1.00
)0.71
(0.54–
0.85
)0.89
(0.82–
0.95
)�5
%0.00
3870
0.98
(0.95–
1.00
)0.93
(0.84–
0.98
)0.97
(0.84–
1.00
)0.99
(0.92–
1.00
)0.86
(0.71–
0.95
)0.94
(0.88–
0.98
)70
0.95
(0.90–
1.00
)0.87
(0.77–
0.94
)0.91
(0.75–
0.98
)0.95
(0.87–
0.99
)0.76
(0.60–
0.89
)0.88
(0.80–
0.94
)�6
%0.00
3865
0.94
(0.90–
0.99
)0.94
(0.85–
0.98
)0.87
(0.71–
0.96
)0.92
(0.83–
0.98
)0.89
(0.74–
0.97
)0.91
(0.84–
0.96
)65
0.92
(0.86–
0.98
)0.88
(0.77–
0.95
)0.81
(0.65–
0.92
)0.89
(0.79–
0.96
)0.79
(0.63–
0.90
)0.85
(0.77–
0.92
)�8
%0.00
5656
0.90
(0.84–
0.96
)0.88
(0.76–
0.95
)0.80
(0.66–
0.91
)0.85
(0.73–
0.93
)0.84
(0.70–
0.93
)0.84
(0.76–
0.91
)57
0.90
(0.84–
0.96
)0.83
(0.70–
0.91
)0.82
(0.68–
0.92
)0.86
(0.73–
0.94
)0.79
(0.64–
0.89
)0.82
(0.74–
0.89
)
NOTE
.95
%co
nfiden
ceintervalsaresh
ownin
paren
thes
is.
SN,se
nsitivity;SP,sp
ecificity;TA
,totala
ccurac
y.a A
llAUCsarereportedwith
P<
.000
.
1342 Lin et al Clinical Gastroenterology and Hepatology Vol. 13, No. 7
performance parameters (sensitivity, specificity, PPV,and NPV) at various MRI-PDFF thresholds (�4%, 5%,6%, and 8%). Overall, the BSC showed robust AUCsacross various MRI-PDFF thresholds. The highest AUCseen (0.98) was for BSC at a MRI-PDFF threshold of 5%or higher.
Discussion
In this cross-sectional analysis of a prospective cohortof adults with and without NAFLD, we show that QUSBSC is accurate in diagnosing hepatic steatosis, usingMRI-PDFF as the reference. Furthermore, we found that

July 2015 Diagnosis of NAFLD With QUS 1343
BSC correlated strongly with the degree of hepaticsteatosis (as represented by MRI-PDFF), and thusshowed potential for noninvasive quantification of liverfat content. In stringent sensitivity analyses acrossvarious MRI-PDFF thresholds (�4%, 5%, 6%, and 8%),the BSC showed robust AUCs across the entire range;moreover, the optimal BSC cut-off value depended on thethreshold.
These findings add to the current literature in thatQUS parameter outcomes have not been studied exten-sively in a large prospective human cohort to date forthe diagnosis and quantification of liver fat. Althoughliver biopsy remains the gold standard for diagnosingNAFLD, the liver biopsy examination has notablelimitations—including subjectivity, sampling variability,invasiveness, risk of severe pain, bleeding (1 in 500), anddeath (1 in 10,000)—that deem it both impractical andunreliable in population-based screening or for moni-toring treatment response.31,32 Conventional ultraso-nography has been used widely for initial screening offatty liver because it is accessible, noninvasive, andinexpensive.11 However, its utility is both machine- andoperator-dependent, with low accuracy in the morbidlyobese and poor reliability in distinguishing betweensteatosis and fibrosis.33 Previous studies on the use ofconventional ultrasonography for detecting fatty liverhave shown sensitivities and specificities between 60%and 94% and 66% and 95%, respectively,34,35 showingthat it does not provide a reproducible, continuous rangeof quantitative information for steatosis.36
Noncontrast computerized tomography (CT) imagingis noninvasive, with good diagnostic performance in thequalitative diagnosis of steatosis, with a sensitivity of82% and a specificity of 100% at a steatosis threshold ofmore than 30%.12,37 However, CT has poor sensitivity formild steatosis, is unreliable for steatosis quantification,and involves radiation exposure.17 Advanced MRI tech-niques can measure PDFF, which has emerged as a newstandardized biomarker for assessing liver fat.38 MRI-PDFF transcends the shortcomings of CT and older MRItechniques that are limited by T1 bias, T(2)* decay, andmultifrequency signal-interference effects of protonswithin fat.21,39 MRI-PDFF correlates well with histology-determined steatosis in adults with NAFLD.18,40 In alongitudinal study, MRI was more accurate and sensitive(93% sensitivity, 85% specificity) than histology inquantifying changes in steatosis over time.29 In a ran-domized clinical trial studying the effect of colesevelamon liver fat, MRI-PDFF was able to detect changes in liverfat longitudinally that histology could not.28 Despitethese advantages, advanced MRI remains costly andrelatively inaccessible.
The development of QUS followed various conven-tional ultrasonographic techniques aimed at improvingdiagnostic accuracy for steatosis. Please see theSupplementary Methods section for further details.
This methodology overcomes previous limitations ofconventional ultrasonography because QUS parameters
are estimated using a reference phantom and objectivecomputer algorithms. Thus, the phantom reference ad-dresses machine (transducer format, gain, dynamicrange, focusing, frequency, and so forth) and operatordependencies, therefore helping to reduce both sourcesof variability.
The implementation of QUS requires training of anexperienced sonographer in a short (<1 h) trainingsession. Because the QUS procedures and measures areplatform-independent, it can be performed on any con-ventional ultrasonography scanner from any manufac-turer. This accessibility, along with the advantages ofQUS as a noninvasive and relatively cost-effective imag-ing modality, improves the viability of QUS as a large-scale screening and monitoring tool for the generalpopulation and for research, including clinical trials andthe development of therapies. The strengths and limita-tions of this study are shown in the SupplementaryDiscussion section.
Conclusions
The primary findings of this study show that the QUSparameter BSC can diagnose and quantify hepatic stea-tosis accurately, using MRI-PDFF as the reference. QUSmethodologies may be a promising, relatively inexpen-sive modality to screen the general population for fattyliver disease. The availability, cost, and accuracy of BSCoutweigh the risks involved with liver biopsy. Futurestudies could examine the use of multiple QUS parame-ters on a larger cohort of participants and perform alongitudinal follow-up evaluation, include a multicenterstudy, or compare BSC vs liver biopsy for the diagnosis ofhepatic steatosis, perhaps in a 3-way comparison withMRI-PDFF.
Supplementary Material
Note: To access the supplementary material accom-panying this article, visit the online version of ClinicalGastroenterology and Hepatology at www.cghjournal.org,and at http://dx.doi.org/10.1016/j.cgh.2014.11.027.
References
1. Chalasani N, Younossi Z, Lavine JE, et al. The diagnosis andmanagement of non-alcoholic fatty liver disease: practiceGuideline by the American Association for the Study of LiverDiseases, American College of Gastroenterology, and theAmerican Gastroenterological Association. Hepatology 2012;55:2005–2023.
2. Adams LA, Lymp JF, St Sauver J, et al. The natural history ofnonalcoholic fatty liver disease: a population-based cohortstudy. Gastroenterology 2005;129:113–121.
3. Targher G, Arcaro G. Non-alcoholic fatty liver disease andincreased risk of cardiovascular disease. Atherosclerosis 2007;191:235–240.

1344 Lin et al Clinical Gastroenterology and Hepatology Vol. 13, No. 7
4. Zarrinpar A, Loomba R. Review article: the emerging interplayamong the gastrointestinal tract, bile acids and incretins in thepathogenesis of diabetes and non-alcoholic fatty liver disease.Aliment Pharmacol Ther 2012;36:909–921.
5. Anstee QM, Targher G, Day CP. Progression of NAFLD to dia-betes mellitus, cardiovascular disease or cirrhosis. Nat RevGastroenterol Hepatol 2013;10:330–344.
6. Loomba R, Abraham M, Unalp A, et al. Associationbetween diabetes, family history of diabetes, and risk ofnonalcoholic steatohepatitis and fibrosis. Hepatology 2012;56:943–951.
7. Vernon G, Baranova A, Younossi ZM. Systematic review: theepidemiology and natural history of non-alcoholic fatty liverdisease and non-alcoholic steatohepatitis in adults. AlimentPharmacol Ther 2011;34:274–285.
8. Browning JD, Szczepaniak LS, Dobbins R, et al. Prevalence ofhepatic steatosis in an urban population in the United States:impact of ethnicity. Hepatology 2004;40:1387–1395.
9. Williamson RM, Price JF, Glancy S, et al. Prevalence of and riskfactors for hepatic steatosis and nonalcoholic Fatty liver diseasein people with type 2 diabetes: the Edinburgh Type 2 DiabetesStudy. Diabetes Care 2011;34:1139–1144.
10. Stinton LM, Loomba R. Recommendations for liver biopsyevaluation in non-alcoholic fatty liver disease. Minerva Gastro-enterol Dietol 2014;60:5–13.
11. Schwenzer NF, Springer F, Schraml C, et al. Non-invasiveassessment and quantification of liver steatosis by ultrasound,computed tomography and magnetic resonance. J Hepatol2009;51:433–445.
12. Festi D, Schiumerini R, Marzi L, et al. Review article: the diag-nosis of non-alcoholic fatty liver disease–availability and accu-racy of non-invasive methods. Aliment Pharmacol Ther 2013;37:392–400.
13. Musso G, Gambino R, Cassader M, et al. Meta-analysis: naturalhistory of non-alcoholic fatty liver disease (NAFLD) and diag-nostic accuracy of non-invasive tests for liver disease severity.Ann Med 2011;43:617–649.
14. Nascimbeni F, Pais R, Bellentani S, et al. From NAFLD in clinicalpractice to answers from guidelines. J Hepatol 2013;59:859–871.
15. Ghoshal G, Lavarello RJ, Kemmerer JP, et al. Ex vivo study ofquantitative ultrasound parameters in fatty rabbit livers. Ultra-sound Med Biol 2012;38:2238–2248.
16. Sasso M, Miette V, Sandrin L, et al. The controlled attenuationparameter (CAP): a novel tool for the non-invasive evaluation ofsteatosis using Fibroscan. Clin Res Hepatol Gastroenterol 2012;36:13–20.
17. Springer F, Machann J, Claussen CD, et al. Liver fat contentdetermined by magnetic resonance imaging and spectroscopy.World J Gastroenterol 2010;16:1560–1566.
18. Permutt Z, Le TA, Peterson MR, et al. Correlation between liverhistology and novel magnetic resonance imaging in adult pa-tients with non-alcoholic fatty liver disease - MRI accuratelyquantifies hepatic steatosis in NAFLD. Aliment Pharmacol Ther2012;36:22–29.
19. Tang A, Tan J, Sun M, et al. Nonalcoholic fatty liver disease: MRimaging of liver proton density fat fraction to assess hepaticsteatosis. Radiology 2013;267:422–431.
20. Ratziu V, Bellentani S, Cortez-Pinto H, et al. A position state-ment on NAFLD/NASH based on the EASL 2009 special con-ference. J Hepatol 2010;53:372–384.
21. Reeder SB, Cruite I, Hamilton G, et al. Quantitative assessmentof liver fat with magnetic resonance imaging and spectroscopy.J Magn Reson Imaging 2011;34:729–749.
22. Weijers G, Starke A, Thijssen JM, et al. Transcutaneous vs.intraoperative quantitative ultrasound for staging bovine hepaticsteatosis. Ultrasound Med Biol 2012;38:1404–1413.
23. Gaitini D, Baruch Y, Ghersin E, et al. Feasibility study of ultra-sonic fatty liver biopsy: texture vs. attenuation and backscatter.Ultrasound Med Biol 2004;30:1321–1327.
24. O’Brien RT, Zagzebski JA, Lu ZF, et al. Measurement ofacoustic backscatter and attenuation in the liver of dogs withexperimentally induced steroid hepatopathy. Am J Vet Res1996;57:1690–1694.
25. Lu ZF, Zagzebski JA, O’Brien RT, et al. Ultrasound attenuationand backscatter in the liver during prednisone administration.Ultrasound Med Biol 1997;23:1–8.
26. Yao LX, Zagzebski JA, Madsen EL. Backscatter coefficientmeasurements using a reference phantom to extract depth-dependent instrumentation factors. Ultrason Imaging 1990;12:58–70.
27. Nam K, Rosado-Mendez IM, Wirtzfeld LA, et al. Comparison ofultrasound attenuation and backscatter estimates in layeredtissue-mimicking phantoms among three clinical scanners.Ultrason Imaging 2012;34:209–221.
28. Le TA, Chen J, Changchien C, et al. Effect of colesevelam onliver fat quantified by magnetic resonance in nonalcoholicsteatohepatitis: a randomized controlled trial. Hepatology 2012;56:922–932.
29. Noureddin M, Lam J, Peterson MR, et al. Utility of magneticresonance imaging versus histology for quantifying changes inliver fat in nonalcoholic fatty liver disease trials. Hepatology2013;58:1930–1940.
30. Brunke SS, Insana MF, Dahl JJ, et al. An ultrasound researchinterface for a clinical system. IEEE Trans Ultrason FerroelectrFreq Control 2007;54:198–210.
31. Noureddin M, Loomba R. Nonalcoholic fatty liver disease: in-dications for liver biopsy and noninvasive biomarkers. Clin LiverDis 2012;1:104–107.
32. Rockey DC, Caldwell SH, Goodman ZD, et al. Liver biopsy.Hepatology 2009;49:1017–1044.
33. Taylor KJ, Gorelick FS, Rosenfield AT, et al. Ultrasonography ofalcoholic liver disease with histological correlation. Radiology1981;141:157–161.
34. Joseph AE, Saverymuttu SH, al-Sam S, et al. Comparison ofliver histology with ultrasonography in assessing diffuseparenchymal liver disease. Clin Radiol 1991;43:26–31.
35. Saverymuttu SH, Joseph AE, Maxwell JD. Ultrasound scanningin the detection of hepatic fibrosis and steatosis. Br Med J (ClinRes Ed) 1986;292:13–15.
36. Hamaguchi M, Kojima T, Itoh Y, et al. The severity of ultraso-nographic findings in nonalcoholic fatty liver disease reflects themetabolic syndrome and visceral fat accumulation. Am J Gas-troenterol 2007;102:2708–2715.
37. Wong VW, Vergniol J, Wong GL, et al. Diagnosis of fibrosis andcirrhosis using liver stiffness measurement in nonalcoholic fattyliver disease. Hepatology 2010;51:454–462.
38. Reeder SB, Hu HH, Sirlin CB. Proton density fat-fraction: astandardized MR-based biomarker of tissue fat concentration.J Magn Reson Imaging 2012;36:1011–1014.
39. Patel NS, Peterson MR, Brenner DA, et al. Association betweennovel MRI-estimated pancreatic fat and liver histology-
July 2015 Diagnosis of NAFLD With QUS 1345
determined steatosis and fibrosis in non-alcoholic fatty liverdisease. Aliment Pharmacol Ther 2013;37:630–639.
40. Idilman IS, Aniktar H, Idilman R, et al. Hepatic steatosis: quan-tification by proton density fat fraction with MR imaging versusliver biopsy. Radiology 2013;267:767–775.
Reprint requestsAddress requests for reprints to: Rohit Loomba, MD, MHSc, Division ofGastroenterology, Division of Epidemiology, University of California at SanDiego, Biomedical Research Facility II, 4A18, 9500 Gilman Drive, La Jolla,California 92093. e-mail: [email protected]; fax: (858) 534-3338.
AcknowledgmentsThe authors acknowledge Julio Herrera Gener, Jamie Kelly, and Nick Olsen atthe University of Illinois at Urbana-Champaign for their quantitative ultrasoundprocessing skills.
Conflicts of interestThe authors disclose no conflicts.
FundingSupported in part by the American Gastroenterological Association Founda-tion—Sucampo—ASP Designated Research Award in Geriatric Gastroenter-ology and by a T. Franklin Williams Scholarship Award (R.L.). Also supported byAtlantic Philanthropies, Inc, the John A. Hartford Foundation, the Associationof Specialty Professors, the American Gastroenterological Association, and theNational Institutes of Health grant K23-DK090303. The development of thegraphic user interface at the University of Illinois at Urbana-Champaign used toprocess the quantitative ultrasound data was supported by National Institutesof Health grant R01 CA111289. The use of the Siemens S3000 scanner wasloaned to the University of California San Diego under a research agreementwith Siemens Medical Systems, Inc. This study was conducted at the Clinicaland Translational Research Institute, University of California at San Diego.The funding agencies did not have any role in the design or conduct of the
study; collection, management, analysis, or interpretation of the data; orpreparation, review, or approval of the manuscript.

1345.e1 Lin et al Clinical Gastroenterology and Hepatology Vol. 13, No. 7
Supplementary Methods
Inclusion and Exclusion Criteria
Inclusion criteria were as follows: at least 18 years ofage, willing and able to complete all procedures andobservations specified in the protocol, fully informed,and had signed the Informed Consent/Assent and HealthInsurance Portability and Accountability Act provisions.Exclusion criteria were as follows: female participantswho were pregnant or nursing, participants with con-traindications to MRI (ie, pacemakers, metallic cardiacvalves, surgical clips, implanted electronic infusionpumps), participants with a history of claustrophobia,and participants who could not fit inside the MR scanner(60-cm bore).
Individuals also were excluded from the study if therewere potential reasons for liver disease or steatosis:chronic alcohol consumption or abuse (alcohol intake>30 g/d within 10 years, >10 g/d in the previous year),medications (including amiodarone, methotrexate, tet-racyclines, valproic acid, systemic glucocorticoids,tamoxifen), infections and chronic disease (includinghuman immunodeficiency virus, hepatitis B or C, auto-immune hepatitis, Wilson’s disease, hemachromatosis,celiac, cystic fibrosis, primary sclerosing cholangitis, a-1-antitrypsin disease, hepatocellular carcinoma).
Clinical Evaluation
Participants who were included in the study under-went focused history and physical examinations at theUCSD NAFLD Translational Research Unit. The AlcoholUse Disorders Identification Test and the Skinner Life-time Drinking Questionnaire were used, both of whichare used widely for assessing alcohol intake in partici-pants with NAFLD.1,2 Vital signs and anthropometricswere taken, including weight, height, body mass index,and waist circumference. Biochemical testing was per-formed, including aspartate aminotransferase, alanineaminotransferase, alkaline phosphatase, g-glutamyltranspeptidase, albumin, total bilirubin, fasting glucose,international normalized ratio, total cholesterol, high-density lipoprotein, low-density lipoprotein, andtriglycerides.
Quantitative Ultrasound Backscatter Coefficient
The URI allows acquisition and storage of high-quality,digital, beam-formed, RF signals from the ultrasonictransducer without filtering, processing, or scan conver-sion, which normally are applied to produce a B-modeultrasound image. MATLAB software (MathWorks Inc,Natick, MA) tools for the URI are available for developingand implementing experimental processing methods.
BSC is a quantitative parameter that describes theeffectiveness with which the tissue scatters ultrasound
energy back to the transducer. BSC is analogous (but notequal) to the echogenicity seen on the B-mode sonogramand, in general, the higher the tissue echogenicity on thesonogram, the higher the BSC, all other factors beingequivalent. The numeric value of the backscatter coeffi-cient is relative to the amount of energy that would bereturned to the transducer by a perfect reflector, there-fore it is a number usually much less than 1. Theadvantage of our method to estimate BSC is that it isindependent of the operator, scanning system, and set-tings being used. BSC is frequency-dependent and is afundamental physical property of tissue, therefore itvaries with composition and structure of the tissue.
BSC analysis was performed by 4 research engineersfollowing standardized and blinding procedures thatcould not be altered by the analysts using the researchgraphic user interface developed in MATLAB softwaredeployed on the Bioacoustics Research Laboratoryserver (www.brl.uiuc.edu) at the University of Illinois atUrbana-Champaign. RF scan line data were stored usingthe URI with 16-bit resolution and a 40 MHz samplingrate in a structured data file in which time-gaincompensation values are stored in the URI file headeralong with the position and orientation of the RFvectors.
Quantitative Ultrasound Methodology
Signal attenuation is estimated from the ultrasonicbackscattered RF data using the spectral differencereference phantom method,3 a frequency-domainmethod that uses the difference in the spectral ampli-tude at increasing depths to estimate local attenuationfrom ultrasonic backscatter data. Assuming that the tis-sue within a small region of interest is homogeneous andisotropic, the attenuation (dB/cm) of the tissue can beestimated at each frequency discrete from
asðf Þ ¼ arðf Þ � gðf Þ4� 8:686
[equation 1]
where asðf Þ is the attenuation of the tissue sample, arðf Þ
is the attenuation of the reference phantom, and gðf Þis the slope of the straight line that fits the naturallog ratio of tissue sample power spectrum to thereference phantom power spectrum as a function ofdepth.To implement the algorithm computationally, an FOIin the B-mode image of the liver is segmented manuallyto avoid vessels, lesions, and organ edges. Thesegmented area is analyzed to yield attenuation esti-mates (and thereafter the backscatter coefficient), asdescribed later. The manually drawn FOI is subdividedinto many overlapping, rectangular subregions of in-terest, each of which yields an estimate of attenuation vsfrequency. Each individual subregion of interest is sub-divided into overlapping axial sections to obtain thepower spectrum at different depths through the
July 2015 Diagnosis of NAFLD With QUS 1345.e2
subregion of interest, which is a requirement of thespectral difference method.
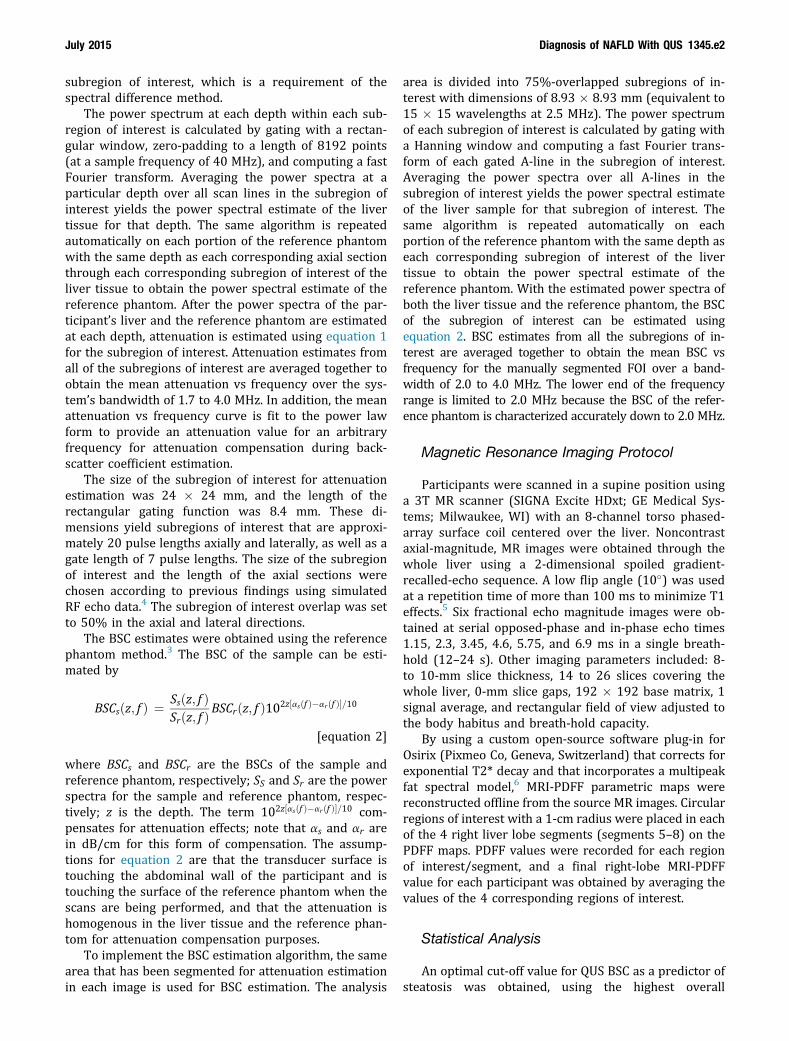
The power spectrum at each depth within each sub-region of interest is calculated by gating with a rectan-gular window, zero-padding to a length of 8192 points(at a sample frequency of 40 MHz), and computing a fastFourier transform. Averaging the power spectra at aparticular depth over all scan lines in the subregion ofinterest yields the power spectral estimate of the livertissue for that depth. The same algorithm is repeatedautomatically on each portion of the reference phantomwith the same depth as each corresponding axial sectionthrough each corresponding subregion of interest of theliver tissue to obtain the power spectral estimate of thereference phantom. After the power spectra of the par-ticipant’s liver and the reference phantom are estimatedat each depth, attenuation is estimated using equation 1for the subregion of interest. Attenuation estimates fromall of the subregions of interest are averaged together toobtain the mean attenuation vs frequency over the sys-tem’s bandwidth of 1.7 to 4.0 MHz. In addition, the meanattenuation vs frequency curve is fit to the power lawform to provide an attenuation value for an arbitraryfrequency for attenuation compensation during back-scatter coefficient estimation.
The size of the subregion of interest for attenuationestimation was 24 � 24 mm, and the length of therectangular gating function was 8.4 mm. These di-mensions yield subregions of interest that are approxi-mately 20 pulse lengths axially and laterally, as well as agate length of 7 pulse lengths. The size of the subregionof interest and the length of the axial sections werechosen according to previous findings using simulatedRF echo data.4 The subregion of interest overlap was setto 50% in the axial and lateral directions.
The BSC estimates were obtained using the referencephantom method.3 The BSC of the sample can be esti-mated by
BSCsðz; f Þ ¼ Ssðz; f ÞSrðz; f ÞBSCrðz; f Þ10
2z½asðf Þ�arðf Þ�=10
[equation 2]
where BSCs and BSCr are the BSCs of the sample andreference phantom, respectively; SS and Sr are the powerspectra for the sample and reference phantom, respec-tively; z is the depth. The term 102z½asðf Þ�arðf Þ�=10 com-pensates for attenuation effects; note that as and ar arein dB/cm for this form of compensation. The assump-tions for equation 2 are that the transducer surface istouching the abdominal wall of the participant and istouching the surface of the reference phantom when thescans are being performed, and that the attenuation ishomogenous in the liver tissue and the reference phan-tom for attenuation compensation purposes.
To implement the BSC estimation algorithm, the samearea that has been segmented for attenuation estimationin each image is used for BSC estimation. The analysis
area is divided into 75%-overlapped subregions of in-terest with dimensions of 8.93 � 8.93 mm (equivalent to15 � 15 wavelengths at 2.5 MHz). The power spectrumof each subregion of interest is calculated by gating witha Hanning window and computing a fast Fourier trans-form of each gated A-line in the subregion of interest.Averaging the power spectra over all A-lines in thesubregion of interest yields the power spectral estimateof the liver sample for that subregion of interest. Thesame algorithm is repeated automatically on eachportion of the reference phantom with the same depth aseach corresponding subregion of interest of the livertissue to obtain the power spectral estimate of thereference phantom. With the estimated power spectra ofboth the liver tissue and the reference phantom, the BSCof the subregion of interest can be estimated usingequation 2. BSC estimates from all the subregions of in-terest are averaged together to obtain the mean BSC vsfrequency for the manually segmented FOI over a band-width of 2.0 to 4.0 MHz. The lower end of the frequencyrange is limited to 2.0 MHz because the BSC of the refer-ence phantom is characterized accurately down to 2.0 MHz.
Magnetic Resonance Imaging Protocol
Participants were scanned in a supine position usinga 3T MR scanner (SIGNA Excite HDxt; GE Medical Sys-tems; Milwaukee, WI) with an 8-channel torso phased-array surface coil centered over the liver. Noncontrastaxial-magnitude, MR images were obtained through thewhole liver using a 2-dimensional spoiled gradient-recalled-echo sequence. A low flip angle (10�) was usedat a repetition time of more than 100 ms to minimize T1effects.5 Six fractional echo magnitude images were ob-tained at serial opposed-phase and in-phase echo times1.15, 2.3, 3.45, 4.6, 5.75, and 6.9 ms in a single breath-hold (12–24 s). Other imaging parameters included: 8-to 10-mm slice thickness, 14 to 26 slices covering thewhole liver, 0-mm slice gaps, 192 � 192 base matrix, 1signal average, and rectangular field of view adjusted tothe body habitus and breath-hold capacity.
By using a custom open-source software plug-in forOsirix (Pixmeo Co, Geneva, Switzerland) that corrects forexponential T2* decay and that incorporates a multipeakfat spectral model,6 MRI-PDFF parametric maps werereconstructed offline from the source MR images. Circularregions of interest with a 1-cm radius were placed in eachof the 4 right liver lobe segments (segments 5–8) on thePDFF maps. PDFF values were recorded for each regionof interest/segment, and a final right-lobe MRI-PDFFvalue for each participant was obtained by averaging thevalues of the 4 corresponding regions of interest.
Statistical Analysis
An optimal cut-off value for QUS BSC as a predictor ofsteatosis was obtained, using the highest overall

References1. Loomba R, Abraham M, Unalp A, et al. Association
between diabetes, family history of diabetes, and risk ofnonalcoholic steatohepatitis and fibrosis. Hepatology 2012;56:943–951.
2. Saunders JB, Aasland OG, Babor TF, et al. Development ofthe Alcohol Use Disorders Identification Test (AUDIT):WHO Collaborative Project on Early Detection of Personswith Harmful Alcohol Consumption–II. Addiction 1993;88:791–804.
1345.e3 Lin et al Clinical Gastroenterology and Hepatology Vol. 13, No. 7
combination of sensitivity and specificity (Youden index).The performance of BSC at the optimal cut-off value wasvalidated using the validation group. Secondary AUCanalyses were conducted at other MRI-PDFF dichotomi-zation thresholds of 4%, 6%, and 8%. The sample sizewas inadequate to complete this secondary analysis atthe 7% threshold.
Results
Correlation of Backscatter Coefficient andMagnetic Resonance Imaging–Proton DensityFat Fraction With Various Metabolic Parameters
The coefficients of correlation between QUS BSC andMRI-PDFF with various metabolic parameters were asfollows: with body mass index, r ¼ 0.48 and 0.50,respectively (P ¼ .737); with triglycerides, r ¼ 0.41 and0.42, respectively (P ¼ .691); with total cholesterol, r ¼0.02 and 0.11, respectively (P ¼ .049); with high-densitylipoprotein, r ¼ -0.25 and -0.27, respectively (P ¼ .681);and with low-density lipoprotein, r ¼ -0.02 and 0.1,respectively (P ¼ .015) (Supplementary Table 2).
Discussion
The hepatorenal sonographic index uses the ratio ofliver and right kidney brightness. One study compared thehepatorenal sonographic index with liver biopsy in aquantitative assessment of steatosis; the hepatorenalsonographic indexwas found to havebetter correlation andsensitivity, specificity, and accuracy in patients with mod-erate or severe biopsy-proven steatosis.7 However, thehepatorenal sonographic index is parameter-, operator-,and scanner-dependent; thus, hepatorenal sonographicindex cut-off values are unlikely generalizable. Controlledattenuation parameter, an algorithm of US elastography,has been used to evaluate hepatic steatosis as well.8 Onestudy compared the use of a controlled attenuationparameter vs biopsy for diagnosing steatosis, citing AUCs ofcontrolled attenuation parameters for 5% or greater,greater than 33%, and greater than 66% biopsy-provensteatosis as 0.79, 0.76, and 0.70, respectively.9
3. Yao LX, Zagzebski JA, Madsen EL. Backscatter coefficientmeasurements using a reference phantom to extract depth-dependent instrumentation factors. Ultrason Imaging 1990;12:58–70.
4. Labyed Y, Bigelow TA, McFarlin BL. Estimate of the attenuationcoefficient using a clinical array transducer for the detection ofcervical ripening in human pregnancy. Ultrasonics 2011;51:34–39.
5. Liu CY, McKenzie CA, Yu H, et al. Fat quantification with IDEALgradient echo imaging: correction of bias from T(1) and noise.Magn Reson Med 2007;58:354–364.
6. Rosset A, Spadola L, Ratib O. OsiriX: an open-source softwarefor navigating in multidimensional DICOM images. J Digit Im-aging 2004;17:205–216.
Strengths
One strength of this study was that it was a large cohortthat examined the use of QUS BSC in adult human partici-pants for the detection of hepatic steatosis. Previous studieseither used fewer human participants or were based onanimal models. The study design of having a training andvalidation group also addressed previous concerns of vali-dation issues in the study of new imaging and diagnosticmodalities for hepatic steatosis and fibrosis.10 The largesample size of this study along with the inclusion of a widerange of PDFF added to the generalizability of our findings.
Finally, because MRI-PDFF is a standardized and quantita-tive biomarker for assessing steatosis,11–13 future studiesthat use MRI-PDFF as a reference could be performed andthen compared with this present study. Thus, our resultsmay be generalizable to other studies that also use MRI-PDFF as a reference.
Limitations
The QUS BSC parameter in this study was comparedand correlated with MRI-PDFF–derived hepatic steatosisbut was not compared directly with liver biopsy. Therationale for not using a liver biopsy assessment is that itwould be unethical to perform a biopsy on individualswho have normal livers (MRI-PDFF, <5%). This is animportant concern because inclusion of participants bothbelow and above the diagnostic threshold of 5% liver fatcontent is necessary to assess the diagnostic perfor-mance of QUS BSC. Other limitations included the cross-sectional nature of the study, which limited our ability toassess whether BSC may be used to follow-up changeslongitudinally. Additional QUS-derived tissue parametersmay be computed using the reference phantom tech-nique used in this study, but our analysis was limited toBSCs. In future studies, other QUS parameters mayemerge as additional new biomarkers for NAFLD. Finally,our study was a single-center study, with applicantsrecruited from a highly specialized NAFLD research unit,leveraging from a strong hepatology-radiology collabo-ration at an academic institution. Although the samplesize was substantial and included demographic andclinical variety, generalizability to the US population isnot yet established.

7. Wang JH, Hung CH, Kuo FY, et al. Ultrasonographic quantifi-cation of hepatic-renal echogenicity difference in hepatic stea-tosis diagnosis. Dig Dis Sci 2013;58:2993–3000.
8. Sasso M, Miette V, Sandrin L, et al. The controlled attenuationparameter (CAP): a novel tool for the non-invasive evaluation ofsteatosis using Fibroscan. Clin Res Hepatol Gastroenterol 2012;36:13–20.
9. Myers RP, Pollett A, Kirsch R, et al. Controlled attenuationparameter (CAP): a noninvasive method for the detection ofhepatic steatosis based on transient elastography. Liver Int2012;32:902–910.
10. Schwenzer NF, Springer F, Schraml C, et al. Non-invasiveassessment and quantification of liver steatosis by ultrasound,
computed tomography and magnetic resonance. J Hepatol2009;51:433–445.
11. Permutt Z, Le TA, Peterson MR, et al. Correlation between liverhistology and novel magnetic resonance imaging in adult pa-tients with non-alcoholic fatty liver disease - MRI accuratelyquantifies hepatic steatosis in NAFLD. Aliment Pharmacol Ther2012;36:22–29.
12. Mennesson N, Dumortier J, Hervieu V, et al. Liver steatosisquantification using magnetic resonance imaging: a prospectivecomparative study with liver biopsy. J Comput Assist Tomogr2009;33:672–677.
13. Reeder SB, Hu HH, Sirlin CB. Proton density fat-fraction: astandardized MR-based biomarker of tissue fat concentration.J Magn Reson Imaging 2012;36:1011–1014.
July 2015 Diagnosis of NAFLD With QUS 1345.e4

Supplementary Table 1. STARD Checklist for Reporting of Studies of Diagnostic Accuracy: January 2003 Version
Section and topic Item Page
Title/abstract/keywords 1 Identify the article as a study of diagnostic accuracy (recommend Medical SubjectHeadings sensitivity and specificity)
1,2
Introduction 2 State the research questions or study aims, such as estimating diagnosticaccuracy or comparing accuracy between tests or across participant groups
1,2
MethodsParticipants 3 The study population: the inclusion and exclusion criteria, setting, and locations
where data were collected2,9e.1
4 Participant recruitment: was recruitment based on presenting symptoms, resultsfrom previous tests, or the fact that the participants had received the indextests or the reference standard?
2
5 Participant sampling: was the study population a consecutive series ofparticipants defined by the selection criteria in items 3 and 4? If not, specifyhow participants were further selected
2
6 Data collection: was data collection planned before the index test and referencestandard were performed (prospective study) or after (retrospective study)?
2,9e.1
Test methods 7 The reference standard and its rationale 28 Technical specifications of material and methods involved including how and
when measurements were taken, and/or cite references for index tests andreference standard
2-4,9e.1,9e.2
9 Definition of and rationale for the units, cut-off values, and/or categories of theresults of the index tests and the reference standard
2-4,9e.1,9e.2
10 The number, training, and expertise of the persons executing and reading theindex tests and the reference standard
2
11 Whether or not the readers of the index tests and reference standard were blind(masked) to the results of the other test and describe any other clinicalinformation available to the readers
2,3
Statistical methods 12 Methods for calculating or comparing measures of diagnostic accuracy, and thestatistical methods used to quantify uncertainty (eg, 95% confidence intervals).
4,5,9e.2,9e.3
13 Methods for calculating test reproducibility, if performed 4,5,9e.2,9e.3Results
Participants 14 When study was performed, including beginning and end dates of recruitment 215 Clinical and demographic characteristics of the study population (at least
information on age, sex, spectrum of presenting symptoms)5
16 The number of participants satisfying the criteria for inclusion who did or did notundergo the index tests and/or the reference standard; describe whyparticipants failed to undergo either test (a flow diagram is stronglyrecommended)
2,9e.6
Test results 17 Time-interval between the index tests and the reference standard, and anytreatment administered in between
2
18 Distribution of severity of disease (define criteria) in those with the target condition;other diagnoses in participants without the target condition
5
19 A cross-tabulation of the results of the index tests (including indeterminate andmissing results) by the results of the reference standard; for continuous results,the distribution of the test results by the results of the reference standard
6
20 Any adverse events from performing the index tests or the reference standard N/AEstimates 21 Estimates of diagnostic accuracy and measures of statistical uncertainty (eg, 95%
confidence intervals)6
22 How indeterminate results, missing data, and outliers of the index tests werehandled
N/A
23 Estimates of variability of diagnostic accuracy between subgroups of participants,readers, or centers, if performed
N/A
24 Estimates of test reproducibility, if performed N/ADiscussion 25 Discuss the clinical applicability of the study findings 6,7,9e.3
N/A, not applicable.
1345.e5 Lin et al Clinical Gastroenterology and Hepatology Vol. 13, No. 7

Supplementary Table 2. Correlations Between QUS BSCand MRI-PDFF, Versus VariousMetabolic Parameters (N ¼ 204)
Metabolic parameter
QUS BSC MRI-PDFF
P valuer r
BMI 0.48 0.50 .737Triglycerides 0.41 0.42 .691Total cholesterol 0.02 0.11 .049HDL �0.25 �0.27 .681LDL �0.02 0.1 .015
NOTE. The Williams test for dependent correlations was performed.BMI, body mass index; HDL, high-density lipoprotein; LDL, low-density lipo-protein; r, coefficient of correlation.
Supplementary Figure 1. Flow diagram of study participantsincluded and excluded in the study.
July 2015 Diagnosis of NAFLD With QUS 1345.e6