Embed Size (px)
Citation preview

ARTÍCULO/ ARTICLE
VARIACIÓN FENOTÍPICA DE POBLACIONES NATURALES DE Pinus oocarpa Schiede ex Schltdl. EN CHIAPAS
PHENOTYPIC VARIATION OF NATURAL Pinus oocarpa Schiede ex Schltdl. POPULATIONS IN CHIAPAS
Benito N. Gutiérrez Vázquez1, Martín Gómez Cárdenas2, Mario H. Gutiérrez Vázquez3 y Carlos Mallén Rivera4
RESUMEN
De acuerdo con la Norma Oficial Mexicana NOM-059 SEMARNAT-2010, Pinus oocarpa no es una especie en peligro de extinción, pero sus poblaciones adaptadas localmente son de considerable valor como recursos genéticos, y en la actualidad son objeto de destrucción severa debido al cambio de uso de suelo. Por ello se llevó a cabo un estudio en tres de sus áreas naturales con el objetivo de determinar la variación fenotípica entre ellas. Se evaluaron 12 variables morfológicas: cinco dasométricas, tres de conos y cuatro de acículas; y se practicaron varios tipos de análisis: de varianza multivariado, de componentes principales y de agrupamiento. Se obtuvieron diferencias significativas (P<0.01) entre las poblaciones de Motozintla, General Leyva y Corazón del Valle para las variables dasométricas, conos y acículas. La de Corazón del Valle es fenotípicamente diferente a las de Motozintla y General Leyva. La variación en las características dasométricas está ligada a factores ambientales. Las correspondientes a los conos y las acículas muestran una fuerte tendencia a que las de Motozintla y General Leyva pertenezcan a una misma unidad genética y estén estrechamente ligadas a las poblaciones de América Central. Es posible que la variación inherente observada en las correspondientes a las de Corazón del Valle se restrinja a una adaptación local hacia un clima cálido subhúmedo, debido a la gran plasticidad ecológica de la especie.
Palabras clave: Análisis multivariado, conservación de recursos genéticos, genética, Pinus oocarpa Schiede ex Schltdl., variación ambiental, variación fenotípica.
ABSTRACT
According to the NOM-059 Mexican Official Standard, Pinus oocarpa is not an endangered species; however, its locally adapted populations are considerably valuable as genetic resources and are currently object of severe destruction due to the change of land use. For this reason a study was carried out in three of its natural populations with the purpose of determining the phenotypic variations between them. Twelve morphological variables –i.e. five mensuration, three cone and four needle variables– were assessed, and multivariate variance, principal component and grouping analyses were practiced. Significant differences (P<0.01) were found among the populations of Motozintla, General Leyva and Corazón del Valle, according to the mensuration, needle and cone variables. Variation in the mensuration characteristics is linked to environmental factors. The variations in the needles and cones show that it is very likely that the populations of Motozintla and of General Leyva belong to the same genetic unit and are closely linked to the populations of Central America. The inherent variation observed in the cones and needles of Corazón del Valle may be due strictly to a local adaptation to a subhumid warm climate made possible by the great ecological plasticity of the species.
Key words: Multivariate analysis, preservation of genetic resources, genetics, Pinus oocarpa Schiede ex Schltdl., environmental variation, phenotypic variation.
Fecha de recepción/date of receipt: 12 de noviembre de 2011; Fecha de aceptación/date acceptance: 3 de julio de 2012.1 Universidad Autónoma Agraria Antonio Narro. Centro Regional Académico Chiapas. Correo-e: bn [email protected] Campo Experimental Valles Centrales. CIR - Pacifico Sur. INIFAP.3 Instituto Tecnológico Superior de San Miguel El Grande. 4 Centro Nacional de Investigación Disciplinaria en Conservación y Mejoramiento de Ecosistemas Forestales. INIFAP.

Gutiérrez et al., Variación fenotípica de poblaciones natuales...
47
INTRODUCCIÓN
Se considera que la subdivisión Oocarpae del género Pinus, definida por Little y Critchfield (1969) evolucionó en México. Un estudio molecular realizado por Krupkin et al. (1996) muestra que la subdivisión es monofilética, pero hay puntos de vista alternos (Gernandt et al., 2005). El ancestro de Oocarpae, que incluye a los de Pinus oocarpa Schiede ex Schltdl., probaablemente existieron en el Mioceno (Axelrod y Cota, 1993). Muchos de estos pinos, son importantes en las plantaciones forestales en el trópico y en el subtrópico (Barnes y Styles, 1983).
Pinus oocarpa Schiede ex Schltdl. var. oocarpa es de madera dura de la subdivisión Oocarpae, y el más común en Mesoamérica. Se distribuye desde el sur de Sonora en México, al norte de Nicaragua, en una longitud de 3 000 km. Es un árbol pequeño (10-13 m), de apariencia rústica en sitios secos de la Sierra Madre Occidental del noreste de México, pero es más alto (20–35 m) y desarrolla ejemplares mejor conformados en áreas con mayor precipitación, desde el sur de México hasta Nicaragua (Robbins, 1983).
Debido a la distribución geográfica tan extensa, Pinus oocarpa es, para algunos autores, la especie ancestral de la subdivisión Oocarpae; un análisis mediante marcadores RAPD de las relaciones evolutivas entre 10 taxas de esta lo confirmaron (Dvorak et al., 2000b). La población ubicada al noroeste de México en la Sierra referida parece representar históricamente una colonización reciente, hipótesis consistente con la información geológica sobre el vulcanismo y formación de las montañas en el área (Dvorak et al., 2000b).
A nivel nacional, P. oocarpa tiene una amplia distribución en las Sierras Madre Oriental y Occidental y al sur del Eje Neovolcánico. Está presente en todo el estado de Chiapas con mayor dominancia al este de Ocosingo, entre los 300 y 700 m de altitud en la región de Arriaga y Ocosingo, lo que sugiere una enorme plasticidad ecológica (Challenger, 1998). Desde el punto de vista económico es muy importante en México como madera aserrada y material combustible (Zamora, 1981).
En Chiapas es uno de los taxa de pino más utilizado en plantaciones forestales (Gutiérrez et al., 2010), en zonas tropicales y subtropicales de Colombia, Brasil y en varios países de África se han establecido extensas áreas de P. oocarpa con este mismo objetivo, en donde la calidad de su madera en ocasiones supera a la de otros pinos de rápido crecimiento, como P. patula Schltdl. et Cham., P. maximinoi Moore, y P. tecunumanii Eguiluz et Perry (Dvorak et al., 2000a). A pesar de su importancia en otros países, en México recibe una atención marginal, por lo que es necesario realizar estudios que permitan mejorar su uso en plantaciones comerciales, de restauración ecológica y en programas de conservación biológica (Viveros et al., 2005).
INTRODUCTION
The Oocarpae subdivision of the Pinus genus, defined by Little and Critchfield (1969) is considered to have evolved in Mexico. A molecular study carried out by Krupkin et al. (1996) shows that the subdivision is monophyletic, but there are alternative points of view (Gernandt et al., 2005). The ancestors of Oocarpae, including Pinus oocarpa Schiede ex Schltdl. probably date back to the Miocene epoch (Axelrod and Cota, 1993). Many of these pines, including those of the subdivision, are important in forest plantations in the tropic and the subtropic (Barnes and Styles, 1983).
Pinus oocarpa Schiede ex Schltdl. var. oocarpa is a hard wood pine tree of the Oocarpae subdivision and is the most common in Mesoamerica. It is distributed from southern Sonora in Mexico to northern Nicaragua along 3 000 km. It is a small tree (10-13 m), of rustic appearance in dry places of Sierra Madre Occidental of northeastern Mexico; however, it grows taller (20-35 m) and develops better formed specimens in areas with higher precipitations, from southern Mexico to Nicaragua (Robbins, 1983).
Due to its extensive geographical distribution, Pinus oocarpa is considered by certain authors to be the ancestral species of the Oocarpae subdivision, as has been confirmed by an analysis with RAPD markers of the evolutionary relationships between 10 taxa belonging to it (Dvorak et al., 2000b). The species located on the abovementioned Sierra in northeastern Mexico seem to be a historically recent colonization, a hypothesis which agrees with the geological information about volcanism and the formation of the mountains in that area (Dvorak et al., 2000b).
Nationally, Pinus oocarpa is widely distributed in the Sierra Madre Oriental and the Sierra Madre Occidental, and to the south of the Eje Neovolcánico. It is present throughout the state of Chiapas and is more predominant to the east of Ocosingo, between 300 and 700 m of altitude in the Arriaga and Ocosingo region, suggesting a huge ecological plasticity (Challenger, 1998). From the economic point of view, it is very important in Mexico, both as sawed up wood and as fuel (Zamora, 1981).
Just as in Chiapas P. oocarpa is one of the species of pine most widely used in forest plantations (Gutiérrez et al., 2010), it has been established for the same purposes in tropical and subtropical areas of Colombia, Brazil and in several countries of Africa. Its wood sometimes has a higher quality than that of other rapidly growing pine species, such as P. patula Schltdl. et Cham., P. maximinoi Moore, and P. tecunumanii Eguiluz et Perry (Dvorak et al., 2000a). Despite its importance in other countries, it receives marginal attention in Mexico; further studies are required to improve its use in commercial and ecologically restorative plantations, as well as in biological preservation programs (Viveros et al., 2005).

Rev. Mex. Cien. For. Vol. 4 Núm. 19
48
Aunque Pinus oocarpa no está catalogada en peligro de extinción en la Norma Oficial Mexicana NOM-059-2010 (Semarnat, 2010). En la actualidad las poblaciones localmente adaptadas y de considerable valor científico corren el riesgo de ser destruidas por el cambio de uso de suelo, al transformar los bosques en pastizales y a cultivos agrícolas. Antes de que sea demasiado tarde es indispensable establecer un programa de conservación de esta especie, el cual requerirá de la protección de un número de rodales representativos de los recursos genéticos. Para diseñarlo y decidir el lugar, el número y tamaño de las unidades de manejo forestal (Millar y Libby, 1991), se deben conocer los patrones de variación genética y fenotípica entre y dentro de las poblaciones.
Las variantes ambientales de una región a otra hacen posible suponer que existe una diferenciación geográfica con respecto a los caracteres morfológicos y anatómicos de los árboles que las conforman (Reyes et al., 2006). Los patrones de variación natural en especies y sus complejos han sido analizados por diversos autores mediante técnicas de análisis multivariado; de esta forma podría establecerse el patrón de asociación o variación entre las poblaciones de Pinus oocarpa.
A continuación se describe un estudio orientado a determinar la variación fenotípica entre tres poblaciones naturales de Pinus oocarpa, en el estado de Chiapas, México; los resultados únicamente son indicativos de tendencias de datos que podrían obtenerse usando tamaños de muestra más grandes. Sin embargo, al considerar la falta de información sobre la variación genética y fenotípica de poblaciones de pino en México, esta ayudará a plantear prioridades de conservación, no solo basadas en la diversidad de marcadores moleculares, ya que se puede inducir a la pérdida de poblaciones adaptadas localmente.
MATERIALES Y MÉTODOS
Se muestrearon tres poblaciones de Pinus oocarpa ubicadas en los ejidos de Motozintla, municipio Motozintla de Mendoza; General Leyva Velázquez, municipio Las Margaritas y Corazón del Valle, municipio Cintalapa de Figueroa en el estado de Chiapas (Figura 1), donde la especie se distribuye de manera natural (Cuadro 1). A partir de recorridos de campo se seleccionaron y delimitaron las áreas de estudio de manera directa, y en consideración de la madurez de los individuos que integraban cada una de las poblaciones. Se aplicó un muestreo simple aleatorio con sitios circulares de 500 m2, en los que se registraron las características dasométricas de los árboles.
Although according to the NOM-059 Mexican Official Standard, Pinus oocarpa is not an endangered species (Semarnat, 2010), locally adapted populations of considerable scientific value are today at risk of intense destruction due to the change of use of the soil, as forests are transformed into grasslands and agricultural crops. Before it is too late, it is necessary to establish a conservation program for this species which will require the protection of a number of stands that is representative of genetic resources. In order to design it and to decide the location, number and time of the forest management units (Millar and Libby, 1991), it is necessary to know the genetic and phenotypic variation patterns between and within the populations.
Environmental variants from one region to another allow to assume that there is a geographical differentiation between populations with respect to the morphological and anatomic characters of the trees that make them up (Reyes et al., 2006). Natural variation patterns in species and their complexes have been analyzed by various authors using multivariate analysis techniques; this may help establish the pattern of association or variation between Pinus oocarpa populations.
Following is a description of a study oriented toward determining the phenotypic variation between three natural Pinus oocarpa populations in the state of Chiapas, Mexico. The results must be regarded only as indicative of potential data trends that may occur with larger sample sizes. However, if it is considered that there is a lack of information regarding the genetic and phenotypic variation of pine populations in Mexico, the information provided herein may be helpful for setting conservation priorities not limited those based exclusively on the diversity of molecular markers, whereby locally adapted populations may be lost.
MATERIALS AND METHODS
Samples were taken from three Pinus oocarpa populations, located in the ejidos of Motozintla, in the municipality of Motozintla de Mendoza; General Leyva Velázquez, in the municipality of Las Margaritas, and Corazón del Valle, in the municipality of Cintalapa de Figueroa, in the state of Chiapas (Figure 1), where the species is naturally distributed in Mexico (Table 1). The natural populations were directly selected and delimited through field rounds, according to the maturity of the specimens that make up each population. A simple random sampling was applied using 500 m2 circular sites, for which the mensuration characteristics were recorded.
Vegetative and reproductive samples of 10 to 12 trees were collected in each locality. Sampling was carried out systematically, based on the gradients found within the site. The samples were taken as representative of the altitude, exposure and slope conditions..

Gutiérrez et al., Variación fenotípica de poblaciones natuales...
49
En cada localidad se obtuvieron muestras vegetativas y reproductivas de 10 a 12 árboles, la recolecta se hizo de manera sistemática con base en los gradientes altitudinales dentro del sitio. Se consideró que las muestras fueran representativas de las condiciones de altitud, exposición y pendiente del terreno.
También se llevó a cabo la recolecta de conos y acículas mediante un recorrido dentro del área que delimita cada una de las poblaciones para la selección de los individuos con las mejores características de porte; dominantes, bien conformados, libres de plagas y enfermedades, y con presencia de conos maduros al momento de su recolección (Rodríguez y Capó, 2005). La edad se obtuvo con la extracción de un cilindro de madera a 1.30 m de altura del fuste, con un taladro de Pressler. Los árboles se escogieron con un distanciamiento entre ellos de 50 a 100 m (Munive et al., 2008), para disminuir el grado de parentesco.
Needles and cones were also collected during a round within the area delimited by each of the populations with the purpose of selecting the specimens with the best aspect characteristics: dominant, well formed, free of pests and of disease, and with mature cones at the time of the collection (Rodríguez and Capó, 2005). The age was estimated by extracting a 1.30 m high wood cylinder from the stem with a Pressler drill. In each population trees distanced by 50 to 100 m were chosen (Munive et al., 2008) in order to reduce the degree of kinship.
Laboratory work
Ten cones from each tree were measured; the cones were selected by their maturity and the presence of a peduncle; those showing signs of opening were not included. A digital millimeter vernier gauge was used. The length of the cone was measured from the insertion of the peduncle to the apex; the diameter of the
Symbology: Pinus oocarpa population; Municipality: Cintalpa, Las Margaritas, Motozintla; Metros = meters; Geodesic information= Ellipsoid = Clarke 1866; Projection Universal Transverse Mercator; Grid 1 000 meter gridlines; UTM zone 15; Horizontal datum WGS 84; Elevation references mean sea level.
Figura 1. Ubicación de las poblaciones de Pinus oocarpa Schiede ex Schltdl. estudiadas en el estado de Chiapas.Figure 1. Location of the studied Pinus oocarpa Schiede ex Schltdl. populations in the state of Chiapas.
Rev. Mex. Cien. For. Vol. 4 Núm. 19
50
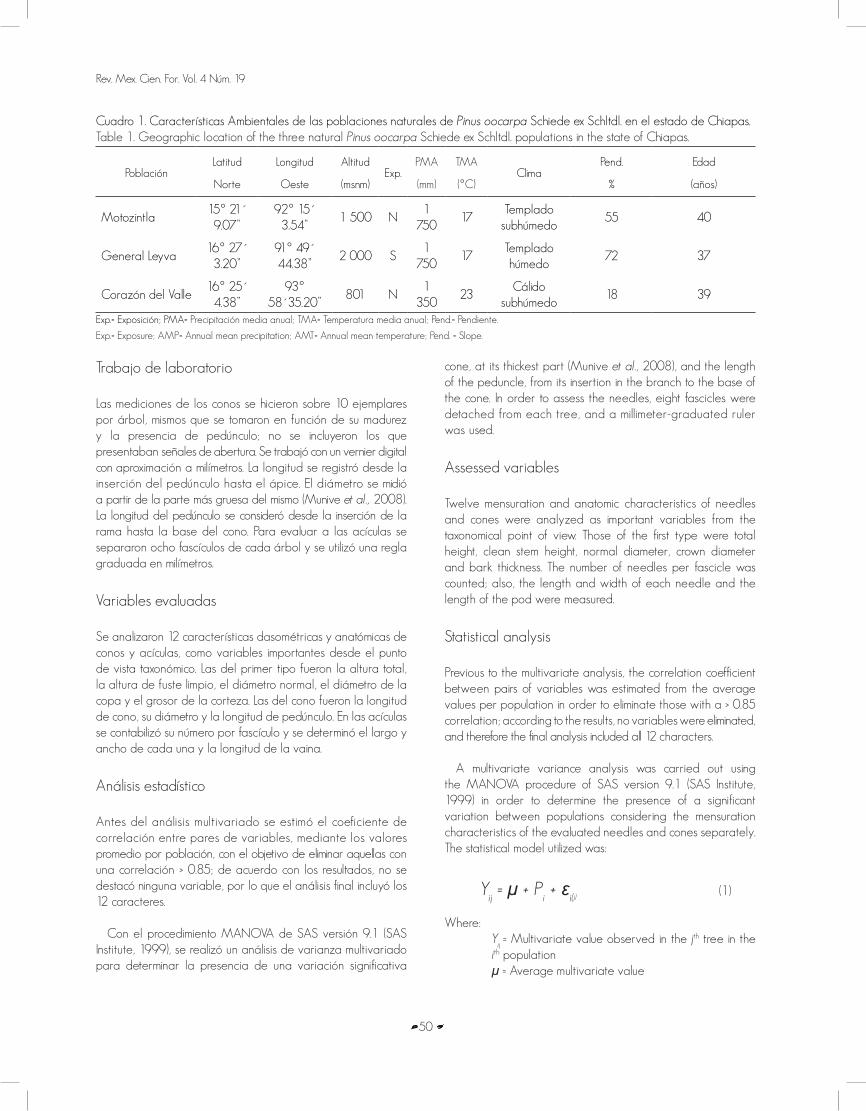
Cuadro 1. Características Ambientales de las poblaciones naturales de Pinus oocarpa Schiede ex Schltdl. en el estado de Chiapas.Table 1. Geographic location of the three natural Pinus oocarpa Schiede ex Schltdl. populations in the state of Chiapas.
PoblaciónLatitud
Norte
Longitud
Oeste
Altitud
(msnm)Exp.
PMA
(mm)
TMA
(°C)Clima
Pend.
%
Edad
(años)
Motozintla15° 21´ 9.07”
92° 15´ 3.54”
1 500 N1
75017
Templado subhúmedo
55 40
General Leyva16° 27´
3.20”91° 49´ 44.38”
2 000 S1
75017
Templado húmedo
72 37
Corazón del Valle16° 25´
4.38”93°
58´35.20”801 N
1 350
23Cálido
subhúmedo18 39
Exp.= Exposición; PMA= Precipitación media anual; TMA= Temperatura media anual; Pend.= Pendiente.
Exp.= Exposure; AMP= Annual mean precipitation; AMT= Annual mean temperature; Pend. = Slope.
cone, at its thickest part (Munive et al., 2008), and the length of the peduncle, from its insertion in the branch to the base of the cone. In order to assess the needles, eight fascicles were detached from each tree, and a millimeter-graduated ruler was used.
Assessed variables
Twelve mensuration and anatomic characteristics of needles and cones were analyzed as important variables from the taxonomical point of view. Those of the first type were total height, clean stem height, normal diameter, crown diameter and bark thickness. The number of needles per fascicle was counted; also, the length and width of each needle and the length of the pod were measured.
Statistical analysis
Previous to the multivariate analysis, the correlation coefficient between pairs of variables was estimated from the average values per population in order to eliminate those with a > 0.85 correlation; according to the results, no variables were eliminated, and therefore the final analysis included all 12 characters.
A multivariate variance analysis was carried out using the MANOVA procedure of SAS version 9.1 (SAS Institute, 1999) in order to determine the presence of a significant variation between populations considering the mensuration characteristics of the evaluated needles and cones separately. The statistical model utilized was:
Yij = μ + P
i + ε
i(j) (1)
Where: Y
ij = Multivariate value observed in the jth tree in the
ith population μ = Average multivariate value
Trabajo de laboratorio
Las mediciones de los conos se hicieron sobre 10 ejemplares por árbol, mismos que se tomaron en función de su madurez y la presencia de pedúnculo; no se incluyeron los que presentaban señales de abertura. Se trabajó con un vernier digital con aproximación a milímetros. La longitud se registró desde la inserción del pedúnculo hasta el ápice. El diámetro se midió a partir de la parte más gruesa del mismo (Munive et al., 2008). La longitud del pedúnculo se consideró desde la inserción de la rama hasta la base del cono. Para evaluar a las acículas se separaron ocho fascículos de cada árbol y se utilizó una regla graduada en milímetros.
Variables evaluadas
Se analizaron 12 características dasométricas y anatómicas de conos y acículas, como variables importantes desde el punto de vista taxonómico. Las del primer tipo fueron la altura total, la altura de fuste limpio, el diámetro normal, el diámetro de la copa y el grosor de la corteza. Las del cono fueron la longitud de cono, su diámetro y la longitud de pedúnculo. En las acículas se contabilizó su número por fascículo y se determinó el largo y ancho de cada una y la longitud de la vaina.
Análisis estadístico
Antes del análisis multivariado se estimó el coeficiente de correlación entre pares de variables, mediante los valores promedio por población, con el objetivo de eliminar aquellas con una correlación > 0.85; de acuerdo con los resultados, no se destacó ninguna variable, por lo que el análisis final incluyó los 12 caracteres.
Con el procedimiento MANOVA de SAS versión 9.1 (SAS Institute, 1999), se realizó un análisis de varianza multivariado para determinar la presencia de una variación significativa

Gutiérrez et al., Variación fenotípica de poblaciones natuales...
51
Pi = random effect of the ith population [E (Pi)=0;
Var (Pi)= σ2
P]
εi(j)
= Random error of the jth tree within the ith population [E (ε
i(j))=0
Var (εi(j))= σ2
ε].
Furthermore, a principal components (PC) analysis was applied in order to identify the most important variables in the expression of the differentiation between the populations and in order to reduce the variability dimension in the lowest possible number of PC. In this analysis the correlations matrix was utilized with the PRINCOMP procedure of SAS version 9.1 (SAS Institute, 1999). With the values obtained for the two principal components, the populations were graphically represented in order to identify the grouping pattern between them and their location in relation to the Pinus oocarpa samples included in the study. The multivariate variance and principal components analyses were carried out separately according to the mensuration variables, needles and cones, because they were performed on different numbers of trees and with different observations for each tree.
The distances between pairs of populations were determine and a grouping analysis of these was carried out utilizing the average data of the standardized original characteristics per population, based on the CLUSTER procedure of the SAS version 9.1 (SAS Institute, 1999), using the Ward Pseudo method. Based on this analysis, the corresponding dendrogram was generated incorporating the tree option of the previous procedure. A Pearson’s analysis of the correlation between the twelve variables evaluated and the mean annual precipitation, the mean annual temperature and the altitude was also performed.
RESULTS
Multivariate variance analysis
A significant variation (p≤0.001) was found between populations when the 12 variables were included in the statistical analysis (Table 2). An analysis of the populations based on the mensuration variables showed no significant differences between the populations of Motozintla and General Leyva. However, the population of Corazón del Valle was statistically different from the other two, with lower values in almost all the assessed mensuration variables, in contrast with Motozintla, which had the highest values (Table 3).
The variation pattern between the cone variables was different: the populations of Corazón del Valle and General Leyva were statistically equal but differed from that of Motozintla, which also had the highest values in cone characteristics. The needles followed the same pattern as the mensuration variables that were similar in Motozintla and General Leyva, except for needle width (Table 3).
entre poblaciones, para lo cual se consideraron por separado las características dasométricas, de las de los conos y las acículas evaluadas. El modelo estadístico utilizado fue:
Yij = μ + P
i + ε
i(j) (1)
Donde:
Yij = Valor multivariado observado en el j-ésimo árbol
en la i-esima población
μ = Valor multivariado promedio Pi = Efecto aleatorio de la i-ésima población [E (P
i)=0;
Var (Pi)= σ2
P]
εi(j)
= Error aleatorio del j-ésimo árbol dentro de la i-ésima población [E (ε
i(j))=0
Var (εi(j))= σ2
ε].
Además, se aplicó un análisis de componentes principales (CP) para identificar las variables más importantes en la expresión de la diferenciación de las poblaciones y reducir la dimensión de la variabilidad en el menor número posible de CP. En este se utilizó la matriz de correlaciones con el procedimiento PRINCOMP de SAS versión 9.1 (SAS Institute, 1999). Con los valores propios obtenidos de los dos componentes principales, se representaron gráficamente las poblaciones para identificar el patrón de agrupamiento entre ellas y su ubicación con respecto a las muestras de Pinus oocarpa incluidas en el estudio. El análisis de varianza multivariado y el de componentes principales se llevó a cabo por separado de acuerdo a las variables dasométricas, conos y acículas, porque se trabajó con diferente número de árboles y de observaciones por individuo.
Con los datos promedio por población de las características originales estandarizadas se determinaron las distancias entre pares de poblaciones y se efectuó un análisis de agrupamiento de las mismas, a partir del procedimiento CLUSTER del SAS versión 9.1 (SAS Institute, 1999) con el método del Ward Pseudo. A partir de este análisis se generó el dendrograma correspondiente, al incorporar la opción TREE del procedimiento anterior. También se practicó un análisis de correlación de Pearson entre las dos doce variables evaluadas y la precipitación media anual, la temperatura media anual y la altitud.
RESULTADOS
Análisis de varianza multivariado
Se obtuvo una variación significativa (p≤0.001) entre poblaciones al incluir las 12 variables en el análisis estadístico (Cuadro 2). En el análisis de las poblaciones, con base en las variables dasométricas, se observó una similitud entre Motozintla y General Leyva, ya que no presentaron diferencias significativas. Sin embargo, la de Corazón del Valle fue estadísticamente diferente de las otras dos, pues sus valores fueron más bajos
Rev. Mex. Cien. For. Vol. 4 Núm. 19
52
en casi todas variables dasométricas evaluadas, en contraste con las de Motozintla que registraron los valores más altos (Cuadro 3).
El patrón de variación en las variables del cono fue diferente, ya que las poblaciones de Corazón del Valle y General Leyva fueron estadísticamente iguales pero diferentes a Motozintla, en la que también los registros fueron superiores en las características de los conos. Con respecto a las acículas se determinó el mismo patrón que en las variables dasométricas en las que se observó una similitud entre Motozintla y General Leyva, excepto en el ancho de la acícula (Cuadro 3).
Principal components analysis
The first two components were considered to be sufficient, because they concentrate over 80% of the total variation of the characteristics included in the analysis (Table 4) and also because of their larger individual relative contribution. The mensuration variables with the largest relative contribution to the first PC were total height and normal diameter, and to the second, the clean stem height. As for the cone variables, cone length and diameter had the largest contribution to the first PC, and peduncle length, to the second. As for the needles, length was the one that most contributed to the first PC, and pod length, to the second (Table 5).
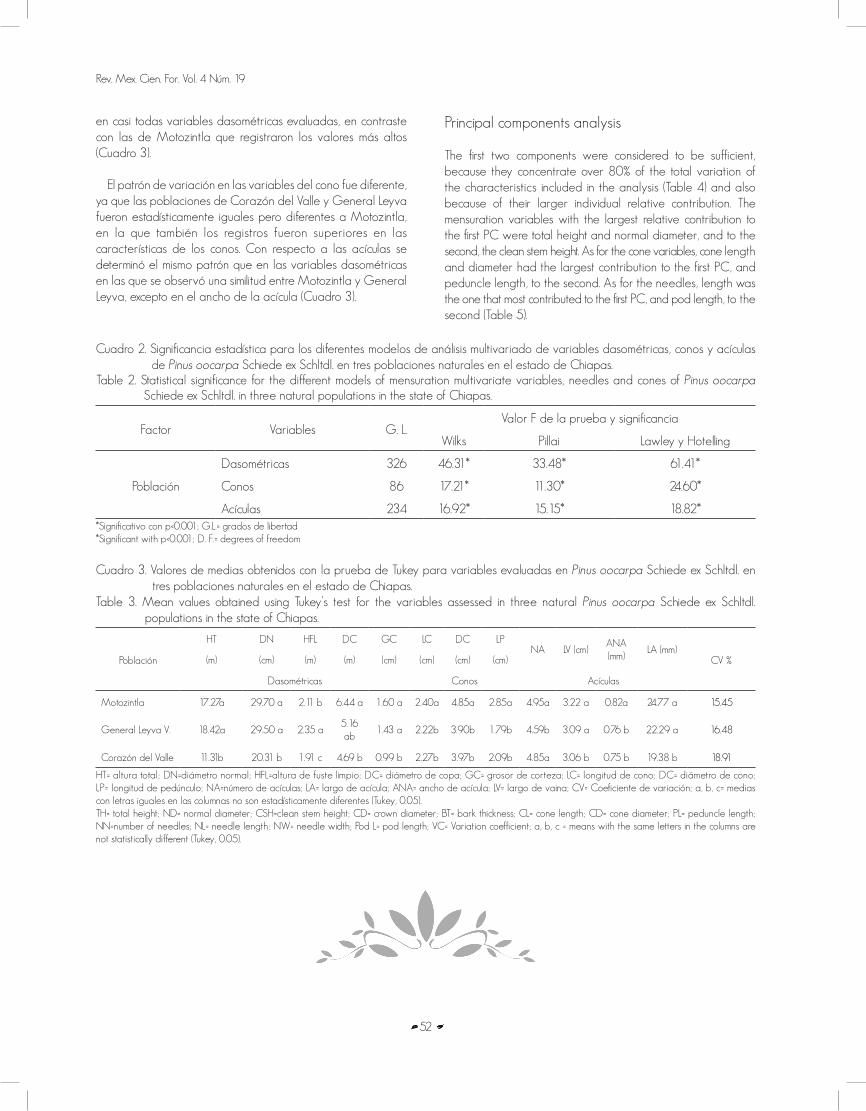
Cuadro 2. Significancia estadística para los diferentes modelos de análisis multivariado de variables dasométricas, conos y acículas de Pinus oocarpa Schiede ex Schltdl. en tres poblaciones naturales en el estado de Chiapas.
Table 2. Statistical significance for the different models of mensuration multivariate variables, needles and cones of Pinus oocarpa Schiede ex Schltdl. in three natural populations in the state of Chiapas.
Factor Variables G. L.Valor F de la prueba y significancia
Wilks Pillai Lawley y Hotelling
Población
Dasométricas 326 46.31* 33.48* 61.41*
Conos 86 17.21* 11.30* 24.60*
Acículas 234 16.92* 15.15* 18.82**Significativo con p<0.001; G.L.= grados de libertad*Significant with p<0.001; D. F.= degrees of freedom
Cuadro 3. Valores de medias obtenidos con la prueba de Tukey para variables evaluadas en Pinus oocarpa Schiede ex Schltdl. en tres poblaciones naturales en el estado de Chiapas.
Table 3. Mean values obtained using Tukey’s test for the variables assessed in three natural Pinus oocarpa Schiede ex Schltdl. populations in the state of Chiapas.
Población
HT
(m)
DN
(cm)
HFL
(m)
DC
(m)
GC
(cm)
LC
(cm)
DC
(cm)
LP
(cm)NA LV (cm)
ANA (mm)
LA (mm)CV %
Dasométricas Conos Acículas
Motozintla 17.27a 29.70 a 2.11 b 6.44 a 1.60 a 2.40a 4.85a 2.85a 4.95a 3.22 a 0.82a 24.77 a 15.45
General Leyva V. 18.42a 29.50 a 2.35 a5.16 ab
1.43 a 2.22b 3.90b 1.79b 4.59b 3.09 a 0.76 b 22.29 a 16.48
Corazón del Valle 11.31b 20.31 b 1.91 c 4.69 b 0.99 b 2.27b 3.97b 2.09b 4.85a 3.06 b 0.75 b 19.38 b 18.91
HT= altura total; DN=diámetro normal; HFL=altura de fuste limpio; DC= diámetro de copa; GC= grosor de corteza; LC= longitud de cono; DC= diámetro de cono; LP= longitud de pedúnculo; NA=número de acículas; LA= largo de acícula; ANA= ancho de acícula; LV= largo de vaina; CV= Coeficiente de variación; a, b, c= medias con letras iguales en las columnas no son estadísticamente diferentes (Tukey, 0.05).TH= total height; ND= normal diameter; CSH=clean stem height; CD= crown diameter; BT= bark thickness; CL= cone length; CD= cone diameter; PL= peduncle length; NN=number of needles; NL= needle length; NW= needle width; Pod L= pod length; VC= Variation coefficient; a, b, c = means with the same letters in the columns are not statistically different (Tukey, 0.05).

Gutiérrez et al., Variación fenotípica de poblaciones natuales...
53
Análisis de componentes principales
Los primeros dos componentes se consideraron suficientes, ya que en ellos se concentra poco más de 80% de la variación total de las características incluidas en el análisis (Cuadro 4); además de, su mayor contribución relativa individual. De acuerdo a las características dasométricas, las variables con mayor contribución relativa en el primer CP fueron la altura total y el diámetro normal; en el segundo, la altura del fuste limpio. En las variables de conos, la longitud y el diámetro hicieron el mayor aporte al primer CP y la longitud del pedúnculo en el segundo. De las correspondientes a las acículas, la longitud es la que más contribuye en el primer CP y la longitud de vaina en el segundo CP (Cuadro 5).
La dispersión de las poblaciones, con base en las variables dasométricas en los dos primeros componentes principales, permite distinguir la formación de dos grupos (Figura 2). El primero de ellos está integrado por las poblaciones Motozintla y General Leyva, mientras que el otro solo por la población de Corazón del Valle. Al observar los dos primeros CP, resulta que Motozintla y General Leyva están muy cercanas entre sí, pero separadas de Corazón del Valle. De acuerdo con los eigenvectores, la población de Corazón del Valle se diferencia de las otras dos poblaciones por tener menor altura total y diámetro normal (Figura 2).
The dispersion of the populations based on the mensuration variables in the first two principal components evinces the formation of two groups (Figure 1). The first includes the populations of Motozintla and General Leyva, while the other consists only of the population of Corazón del Valle. In regard to the first two PCs, Motozintla and General Leyva are very similar, but they both differ from Corazón del Valle. According to the eigenvectors, the population of Corazón del Valle has a lower total height and a smaller normal diameter than the other two populations (Figure 2).
As with the mensuration variables, the dispersion of the population based on the first two principal components showed two different groups when the cone variables were analyzed (Figure 3). The first includes the populations of General Leyva and Corazón del Valle, while the other consists exclusively of the population of Motozintla. Corazón del Valle and General Leyva are very close and even overlap for the first two PCs but are very distant from the Motozintla population. The proper values indicate that the Motozintla population differs from the other two populations by the larger length and diameter of its cones. Furthermore, although the General Leyva population overlaps that of Corazón del Valle, its distribution is more limited, due to the shorter length and diameter of its cones (Figure 3).
Cuadro 4. Valores propios de los primeros tres componentes principales para las variables dasométricas y dos componentes para las variables de conos y acículas de Pinus oocarpa Schiede ex Schltdl. en tres poblaciones naturales en el estado de Chiapas.
Table 4. Proper values of the first three principal components for the mensuration variables and of two components for the cone and needle variables of three natural Pinus oocarpa Schiede ex Schltdl. populations in the state of Chiapas.
Componente Valores propios Diferencia Proporción Acumulado
Variables dasométricas
1 2.914 2.336 0.728 0.728
2 0.577 0.209 0.144 0.873
3 0.367 0.228 0.092 0.965
Variables de conos
1 1.950 1.158 0.650 0.650
2 0.791 0.534 0.264 0.914
Variables de acículas
1 2.126 1.575 0.708 0.708
2 0.550 0.226 0.183 0.892

Rev. Mex. Cien. For. Vol. 4 Núm. 19
54
Al igual que las variables dasométricas, al realizar el análisis de las variables de conos, la dispersión de las poblaciones con base en los dos primeros componentes principales mostró dos grupos diferentes (Figura 3). El primero está formado por las poblaciones General Leyva y Corazón del Valle, y uno más por la de Motozintla. Se observa que Corazón del Valle y General Leyva, a partir de los dos primeros CP, están muy cercanas y se traslapan entre sí, pero muy apartadas de la población de Motozintla. Los valores indican que la población de Motozintla se diferencia de las otras dos poblaciones por tener una mayor longitud y diámetro del cono. Asimismo se reconoce que la de General Leyva a pesar que se traslapa con Corazón del Valle, presenta una distribución más restringida, lo que obedece a valores de longitud y diámetro de conos de tamaño más reducido (Figura 3).
Figura 2. Dispersión de las poblaciones de Pinus oocarpa Schiede ex Schltdl. con base en los CP 1 y 2, obtenidos de las características dasométricas.
Figure 2. Dispersion of the Pinus oocarpa Schiede ex Schltdl. populations based on PCs 1 and 2, obtained from the mensuration characteristics.
The dispersion of data for the needle variables in relation to principal components one and two represents the General Leyva population, which is intermediate, overlapping those of Corazón del Valle and Motozintla, which are very distant from each other. Although General Leyva overlaps both populations, it is slightly closer to the population of Motozintla. The proper values show that Corazón del Valle has low values for pod length in PC 1, whereas Motozintla has higher values, and therefore these populations are better differentiated (Figure 4).Cuadro 5. Valores propios de las características dasométricas, conos y acículas de Pinus oocarpa Schiede ex Schltdl. en tres poblaciones naturales en el estado de Chiapas.

Gutiérrez et al., Variación fenotípica de poblaciones natuales...
55
Figura 3. Dispersión de las poblaciones de Pinus oocarpa Schiede ex Schltdl. con base en los CP 1 y 2, obtenidos de las características de conos.
Figure 3. Dispersion of the Pinus oocarpa Schiede ex Schltdl. populations based on PCs 1 and 2, obtained from the characteristics of the cones.
Figura 4. Dispersión de las poblaciones de Pinus oocarpa Schiede ex Schltdl. con base en los CP 1 y 2, obtenidos de las características de acículas.
Figure 4. Dispersion of the Pinus oocarpa Schiede ex Schltdl. populations based on PCs 1 and 2, obtained from the characteristics of the needles.

Rev. Mex. Cien. For. Vol. 4 Núm. 19
56
La dispersión de datos en las variables de acículas con relación a los componentes principales uno y dos, representa a la población de General Leyva que se comporta como intermedia; se traslapa con las de Corazón del Valle y Motozintla, las cuales están muy separadas entre sí. Aunque General Leyva se sobrepone con ambas poblaciones, se advierte ligeramente más cercana a la de Motozintla. Los valores propios muestran que en el CP1 Corazón del Valle son bajos en longitud de vaina y Motozintla, más altos, lo que permite distinguirlas mejor (Figura 4).
Análisis de agrupamiento
A través del dendrograma se corroboran los resultados del análisis de componentes principales (Figura 5). La agrupación sugiere la separación perfecta de dos grupos. Uno de ellos compuesto por las poblaciones de Motozintla y General Leyva y el otro únicamente por Corazón del Valle. Lo anterior evidencia que las 12 variables evaluadas son satisfactorias para clasificar fenotípicamente a las poblaciones estudiadas.
Cuadro 5. Valores propios de las características dasométricas, conos y acículas de Pinus oocarpa Schiede ex Schltdl. en tres poblaciones naturales en el estado de Chiapas.
Table 5. Proper values of the mensuration characteristics and of those of the needles and cones of three natural Pinus oocarpa Schiede ex Schltdl. populations in the state of Chiapas.
CaracterísticasComponente principal
1 2
Altura total 0.548 0.151
Diámetro normal 0.518 -0.239
Altura de fuste limpio
0.464 0.720
Grosor de corteza 0.463 -0.632
Longitud de cono 0.608 -0.464
Diámetro de cono 0.655 -0.161
Longitud de pedúnculo
0.446 0.870
Longitud de vaina 0.541 0.808
Ancho de acícula 0.579 -0.558
Longitud de acícula 0.609 -0.187
R cuadrada semiparcial = Semi-partial R-squared
Figura 5. Dendrograma de agrupamiento para las poblaciones de Pinus oocarpa Schiede ex Schltdl., con base en 12 variables dasométricas, de conos y de acículas.
Figure 5. Grouping dendrogram for Pinus oocarpa Schiede ex Schltdl. populations, based on 12 mensuration, needle and cone variables.

Gutiérrez et al., Variación fenotípica de poblaciones natuales...
57
Análisis de correlación de Pearson
Los valores de correlación indican que solo el diámetro normal presenta correlación significativa (P<0.01), con la temperatura una correlación negativa y con la precipitación, positiva. Sin embargo, se detectó un patrón bien definido, en el cual las variables dasométricas y la temperatura, la precipitación y la altitud produjeron coeficientes de correlación altos, aunque no fueron significativos (P>0.05). Las variables de conos y acículas arrojaron coeficientes de correlación bajos, excepto para la longitud de acícula que reveló valores altos de correlación negativa con la temperatura y positiva con la precipitación, aunque no fueron significativos (Cuadro 6).
Cuadro 6. Valores de la matriz de correlación de Pearson de variables morfológicas de Pinus oocarpa Schiede ex Schltdl. y ambientales en tres poblaciones naturales del estado de Chiapas.
Table 6. Values of Pearson’s correlation matrix for the morphological and environmental variables of three natural Pinus oocarpa Schiede ex Schltdl. populations in the state of Chiapas.
HT
(m)
DN
(cm)
HFL
(m)
DC
(m)
GC
(cm)
LC
(cm)
DC
(cm)
LP
(cm)NA
LV
(cm)
ANA
(mm)
LA
(mm)
Dasométricas Conos Acículas
Altitud 0.96 0.90 0.98 0.3 0.76 -0.17 0.02 -0.18 -0.62 0.26 0.22 0.61
>0.05 >0.05 >0.05 >0.05 >0.05 >0.05 >0.05 >0.05 >0.05 >0.05 >0.05 >0.05
Temperatura -0.98 -1.00 -0.83 -0.70 -0.96 -0.24 -0.44 -0.24 0.24 -0.64 -0.61 -0.88
>0.05 <0.01 >0.05 0.50 >0.05 >0.05 >0.05 >0.05 >0.05 >0.05 >0.05 >0.05
Precipitación 0.98 1.00 0.83 0.708 0.96 0.24 0.44 0.24 -0.24 0.64 0.61 0.88
>0.05 <0.01 >0.05 >0.05 >0.05 >0.05 >0.05 >0.05 >0.05 >0.05 >0.05 >0.05HT= altura total; DN=diámetro normal; HFL=altura de fuste limpio; DC= diámetro de copa; GC= grosor de corteza; LC= longitud de cono; DC= diámetro de cono; LP= longitud de pedúnculo; NA=número de acículas; LA= largo de acícula; ANA= ancho de acícula; LV= largo de vaina.TH= total height; ND= normal diameter; CSH=clean stem height; CD= crown diameter; BT= bark thickness; CL= cone length; CD= cone diameter; PL= peduncle length; NN=number of needles; NL= needle length; NW= needle width; Pod L= pod length.
Grouping analysis
The results of the principal components analysis are corroborated by means of a dendrogram (Figure 5). The grouping suggests a perfect separation between two groups, one of which comprises the populations of Motozintla and General Leyva, and the other, the population of Corazón del Valle only. From this it may be inferred that the 12 assessed variables allow a satisfactory phenotypic classification of the studied populations.
DISCUSIÓN
Las diferencias significativas y el patrón de variación en las tres poblaciones estudiadas coinciden con los resultados de Gutiérrez et al. (2010) al evaluar la densidad básica de la madera en las mismas localidades, donde Corazón del Valle fue estadísticamente mejor que Motozintla y General Leyva.
La disociación aparente de Corazón del Valle con respecto a las otros grupos analizados en las variables dasométricas está directamente influenciada por la altura total, el diámetro normal y la altura de fuste limpio. El análisis de correlación indica que estas características guardan un estrecho vínculo con el medio ambiente en el que se desarrollan. Viveros et al. (2005) obtuvieron valores de control genético elevados en diámetro y altura. A pesar de ello, se considera que la variación fenotípica en las variables dasométricas depende, en gran medida, de la variación en los factores ambientales como la altitud, la precipitación y la temperatura.
Pearson’s correlation analysis
The obtained correlation values indicate that only the normal diameter exhibits a significant correlation (P<0.01); it shows a negative correlation with the temperature and a positive correlation with the precipitation. However, a very definite pattern was detected in which the mensuration variables and the temperature, the precipitation and the altitude produced high, but not significant (P>0.05) correlation coefficients. The correlation coefficients for the assessed cone and needle variables were low, except for needle length, which showed a high negative correlation with the temperature and a high positive correlation with precipitation; however, neither of these was significant (Table 6).

Rev. Mex. Cien. For. Vol. 4 Núm. 19
58
La altura también tiene una relación con la densidad de la vegetación que crece en el sitio, ya que es superior cuando la densidad es abundante, por la competencia entre los individuos (Sanz et al., 2003). Sin embargo, se observó un patrón diferente en la población de Corazón del Valle, ya que es la población con mayor densidad de individuos y registró los valores más bajos en altura.
La variación fenotípica que separa a Corazón del Valle de las otras dos poblaciones, al reunir los valores más bajos en crecimiento y desarrollo en altura y diámetro podría atribuirse a la altitud, la precipitación y la temperatura, pues esta localidad está ubicada a 800 msnm, y la diferencia con respecto a Motozintla es de alrededor de 700 m y de 1 200 m con General Leyva; además, sus valores de correlación positiva fueron destacados en relación a la altura total, el diámetro normal y la altura del fuste limpio, variables que hicieron una mejor contribución a la separación de las poblaciones. Aunado a lo anterior es importante destacar que Pinus oocarpa experimenta mejor crecimiento y desarrollo de los 1 500 a los 2 500 msnm (Perry, 1991). No obstante, Alba et al. (2003) consignaron que la probabilidad de que P. oocarpa esté presente en la altiplanicie central de Chiapas se entiende, en buena medida, por el efecto inverso de la altitud. Al igual que en el presente estudio, al ajustar modelos de regresión logística para la especie de interés, dichos autores sugieren que la temperatura y la precipitación explican su distribución de manera directa.
Al evaluar la variación isoenzimática en un gradiente altitudinal en poblaciones de Pinus oocarpa en Michoacán. Sáenz et al. (2003) determinaron que las poblaciones no se agruparon en función de la altitud; tampoco detectaron diferencias genéticas a lo largo del gradiente, y la mayor variación genética está dentro de las poblaciones. Sin embargo, las características observadas en Corazón del Valle podrían responder a una adaptación local a la altitud, que no es detectada por los marcadores moleculares debido a que estos parecen ser indicadores pobres de la variación heredable en caracteres cuantitativos (McKay y Latta, 2002). Si fuese un evento local sería muy significativo, ya que se ha reconocido que la variación genética adaptativa de especies no solo es el resultado de fuerzas bióticas selectivas o estrés climático, sino también del estrés biótico o abiótico local, como los herbívoros o los parásitos, entre otros factores (Mitton, 1997). Lo anterior resulta relevante en materia de conservación, el tener genes localmente adaptados y de importancia económica, si se trata de una población que reúne características valiosas como alta densidad de la madera (Gutiérrez et al., 2010) y que pueden ser utilizadas en programas de mejoramiento genético. Ecológicamente, la heterogeneidad del hábitat mantiene la variación genética entre las poblaciones. Plantear prioridades de conservación basadas solo en la diversidad de marcadores moleculares puede inducir a la pérdida de poblaciones adaptadas a condiciones locales (McKay et al., 2001).
DISCUSSION
The significant differences and the variation pattern found in the three studied populations agree with the results obtained by Gutiérrez et al. (2010) when the basic density of the wood was assessed in the same localities; that of Corazón del Valle was statistically better than those of the Motozintla and General Leyva populations.
The apparent dissociation between Corazón del Valle and the other groups analyzed for the mensuration variables is directly influenced by the total height, the normal diameter and the clean stem height. The correlation analysis indicates that these characteristics are closely related to the environment where these populations develop. Viveros et al. (2005) obtained high genetic control values for diameter and height. Yet, the phenotypic variation in the mensuration variables depends to a large extent on the variation in environmental factors such as altitude, precipitation and temperature.
There is also a relationship between height and the density of the vegetation that grows in the site; the former increases with abundant density due to competition between individuals (Sanz et al., 2003). However, a different pattern was found in the Corazón del Valle population, which has the highest density and nevertheless consists of the shortest individuals.
The phenotypic variation that separates the population of Corazón del Valle –which has the lowest growth, height and diameter values– from the other two can be attributed to the altitude, precipitation and temperature, for it is located at 800 masl, with a difference of 700 m with respect to Motozintla and 1,200 m with respect to General Leyva. Furthermore, its positive correlation values were highlighted with respect to total height, normal diameter and clean stem height –variables that contributed to the separation between the populations. Also, it is worth noting that Pinus oocarpa experiences better growth and development from 1,500 to 2,500 masl (Perry, 1991). However, Alba et al. (2003) note the probability that P. oocarpa may be present in the central high plateau of Chiapas, largely due to the inverse effect of the altitude. Like the present study, with the adjustment of logistic regression models for the species of interest, these authors suggest that the temperature and precipitation may directly account for its distribution.
When assessing the isoenzymatic variation along an altitude gradient in Pinus oocarpa populations in Michoacán, Mexico, Sáenz et al. (2003) found that the populations were not grouped in terms of altitude, nor did they detect genetic differences along the gradient but found the greatest genetic variation within the populations. Nevertheless, the characteristics observed in Corazón del Valle may be accounted for by a local adaptation to the altitude which is undetected by the molecular markers because these appear to be poor indicators of the heritable variation of quantitative characters (McKay and Latta, 2002).

Gutiérrez et al., Variación fenotípica de poblaciones natuales...
59
En cuanto a las variables de conos se infiere que la similitud entre Corazón del Valle y General Leyva y la separación con respecto a Motozintla podría ser de tipo genético, ya que las características de dichas estructuras reciben mayor influencia de los factores ambientales (Iglesias y Tivo, 2006). La distancia que guarda la población de la segunda localidad, con respecto a las otras dos quizás se deba a que se ubica hacia el sur del estado de Chiapas; lo que significa, que tal vez Pinus oocarpa desarrolla conos grandes mientras se aleja hacia el sur, pues las poblaciones de de esta especie en la entidad son muy parecidas a las de América Central que al resto de las que se desarrollan en México (Dvorak et al., 2009). Así, las de Guatemala tienen conos más grandes (Lamprecht, 1990), lo que pudiera ser una causa de separación de las otras poblaciones, ya que la de Motozintla es cercana a Guatemala.
Con respecto a la variación fenotípica en las variables de las acículas, se fortalece la posibilidad de que las poblaciones del sur, Motozintla y General Leyva, correspondan al centro de diversidad de Pinus oocarpa de América Central propuesto por Dvorak et al. (2009), y la población de Corazón del Valle estaría ligada a las poblaciones ubicadas al norte (centro de diversidad del Eje Neovolcánico de México). Es posible que las de Motozintla y General Leyva, con mayores similitudes, pertenezcan a una misma unidad genética, ya que al encontrase a una distancia más corta (130 km) que Corazón del Valle (221 km) podrían estar intercambiando información mediante flujo genético.
El análisis referente a la variación fenotípica entre las poblaciones estudiadas no permite determinar si es genética o ambiental, o en qué proporción participan cada una de ellas. Por lo tanto, al igual que Gutiérrez et al. (2010), se considera necesario realizar ensayos de procedencias-progenie en varios sitios, con un mayor número de poblaciones, para precisar el potencial de las evaluadas aquí y otras en el establecimiento de futuras plantaciones y definir si la variación es de tipo genética o ambiental.
CONCLUSIONES
Existen diferencias significativas entre las poblaciones de Pinus oocarpa de Motozintla, General Leyva y Corazón del Valle de acuerdo con sus características dasométricas, de conos y de acículas; la de la última localidad es fenotípicamente diferente a las primeras dos. La variación en las variables dasométricas puede estar más relacionada a factores ambientales. La variación identificada en las variables de los conos y las acículas muestra una fuerte tendencia a que las poblaciones de Motozintla y General Leyva pertenezcan a una misma unidad genética y estén muy ligadas a las poblaciones de América Central. Es posible que la variación que presenta la población de Corazón del Valle sea un caso de adaptación local a un clima cálido subhúmedo, debido a la gran plasticidad ecológica de la especie.
If it were a local event, it would be highly significant, since it has been recognized that the adaptive genetic variation of species is not only the result of selective biotic forces or climatic stress but also of the biotic or abiotic local stress, including such factors as herbivores or parasites, among others (Mitton, 1997). Having locally adapted genes is relevant in terms of conservation as well as of the economy if the population has valuable characteristics such as high density wood (Gutiérrez et al., 2010) that may be utilized in genetic improvement programs. Setting conservation priorities based only on the diversity of molecular markers may induce the loss of locally adapted populations (McKay et al., 2001).
As for the cone variables, it may be inferred that the similarity between Corazón del Valle and General Leyva and the separation between these two populations and that of Motozintla may be genetic, since the characteristics of the cones receive a greater influence from environmental factors (Iglesias and Tivo, 2006). The distance between the population of this third locality and the first two is due perhaps to the fact that it is located further south in the state of Chiapas; this means that Pinus oocarpa may develop larger cones in the more southern locations, for the populations of the south of the state bear a closer resemblance to those of Central America than to other populations of Mexico (Dvorak et al., 2009). Thus, the populations of Guatemala have larger cones (Lamprecht, 1990) This may be a cause for the separation between Motozintla –which is near Guatemala– and the other two studied populations.
As for the phenotypic variation found in the needle variables, it is very likely that southern populations such as Motozintla and General Leyva are at the center of diversity of Pinus oocarpa in Central America proposed by Dvorak et al. (2009), whereas the population of Corazón del Valle may be more related to the populations located further north (center of diversity of the Eje Neovolcánico of Mexico). The populations of Motozintla and General Leyva, which show a greater resemblance, may belong to the same genetic unit, for, as the distance between (130 km) is shorter than the distance that separates them from Corazón del Valle (221 km), they may be exchanging information through genetic flow.
The analysis of the phenotypic variations between the studied populations does not allow to determine whether the phenotypic variations are genetic or environmental, or in what proportion they participate of each of the two. Therefore, like Gutiérrez et al. (2010), it is considered necessary to carry out origin and progeny assays in various sites using a larger number of populations in order to accurately assess the potential of those evaluated here, as well as of other populations for the establishment of future plantations, and to determine whether the variation found is genetic or environmental.

Rev. Mex. Cien. For. Vol. 4 Núm. 19
60
REFERENCIAS
Alba L., M. P., M. González E., N. Ramírez M. y M. A. Castillo S. 2003. Determinantes de la distribución de Pinus spp. en la altiplanicie central de Chiapas, México. Boletín de la Sociedad Botánica de México 73: 7-15.
Axelrod, D. I. and J. Cota. 1993. A further contribution to closed-cone pine history. Am. J. Bot. 80: 743-751.
Barnes, R. D. and B. T. Styles. 1983. The closed-cone pines of Mexico and Central America. Commonw For. Rev. 62:81-84.
Challenger, A. 1998. Utilización y conservación de los ecosistemas terrestres de México, pasado presente y futuro. Comisión Nacional para el Conocimiento y Uso de la Biodiversidad. Instituto de Biología. Universidad Nacional Autónoma de México. Agrupación Sierra Madre, S.C. México, D.F. México. 847 p.
Dvorak, W. S., K. M. Potter, V. D. Hipkins and G. R. Hodge. 2009. Genetic diversity and gene exchange in Pinus oocarpa, a Mesoamerican pine with resistance to the pitch canker fungus (Fusarium circinatum). Int. J. Plant Sci. 170 (5):609-626.
Dvorak, W. S., E. A. Gutiérrez, L. F. Osorio, G. R. Hodge and J. T. Brawner. 2000a. Pinus oocarpa. In: CAMCORE Cooperative (ed.). Conservation and testing of tropical and subtropical forest tree species by the CAMCORE Cooperative College of Natural Resources, North Carolina State University. Raleigh, NC. USA. pp. 129-147.
Dvorak, W. S., A. P. Jordan, G. R. Hodge and J. L. Romero. 2000b. Assessing evolutionary relationships of pines in the Oocarpae and Australes subsections using RAPD markers. New For. 20:163-192.
Gernandt, D., G. Geada L., S. Ortiz G. and A. Liston. 2005. Phylogeny and classification of Pinus. Taxon 54:29-42.
Gutiérrez V., B., M. Gómez C., S. Valencia M., E. H. Cornejo O., J. A. Ruiz P. y M. H. Gutiérrez V. 2010. Variación de la densidad de la madera en poblaciones naturales Pinus oocarpa Schiede ex Schltdl. en el estado de Chiapas, México. Rev. Fitotec. Mex. 33 (4):75-78.
Iglesias A., L. G. y F. Tivo 2006. Caracterización morfométrica de la población de Pinus hartwegii Lindl. del Cofre de Perote Veracruz. Ra Ximhai 2:449-468.
Krupkin, A. B., A. Liston and S. H. Strauss. 1996. Phylogenetic analysis of the hard pines (Pinus subgenus Pinus, Pinaceae) from chloroplast DNA restriction site analysis. Am. J. Bot. 83:489-498.
Lamprecht, H. 1990. Silvicultura en los trópicos. Deustche Gesellschaft fúr Technische Zusammenarbeit. Eschborn Hesse, Deustcheland.. pp. 36-50.
Little, E. L., Jr. and W. B. Critchfield. 1969. Subdivisions of the genus Pinus (Pines). USDA Forest Service Miscellaneous Publication 1144. Washington, DC USA.18 p.
McKay, J. K., J. G. Bishop, J. Z. Lin, J. H. Richards, A. Sala and O. T. Mitchell. 2001. Local adaptation across a climatic gradient despite small effective population size in the rare sapphire rockcress. Proc. Royal Society- Biological Sciences. 268 (1477):1715-1721.
McKay, J. K. and R. G. Latta. 2002. Adaptive population divergence: markers, Qtl and traits. Trends in Ecology and Evolution 17:285-291.
Millar, C. I. and W. J. Libby. 1991. Strategies for conserving clinal, ecotypic and disjunct population diversity in widespread species. In: Falk, D. A. and K. E. Holsinger. (eds.). Genetics and conservation of rare plants. Oxford University Press, New York, NY. USA. pp. 149-170.
Mitton, J. B. 1997. Selection in natural populations. Oxford University Press. New York, NY. USA. 240 p.
Munive M., E., O. Vázquez C., E. M. Zamora C., E. Fernández P. y E. García G. 2008. Variación de conos y semillas de Pinus ayacahuite var. veitchii Shaw de dos procedencias del estado de Tlaxcala. Foresta Veracruzana 10(1):39-46.
Perry, J. P. Jr. 1991. The pines of Mexico and Central America. Timber, Portland, OR. USA. 231 p.
Reyes H., V. J., J. J. Vargas H., J. López U. y H. Vaquera H. 2006. Similitud fenotípica de poblaciones mexicanas de Pseudotsuga Carr. Agrociencia 40:545-556.
CONCLUSIONS
There are significant differences between the mensuration characteristics and the characteristics of the needles and cones of the Pinus oocarpa populations of Motozintla, General Leyva and Corazón del Valle; the population of the third locality is phenotypically different from those of the first two. The variation found between the mensuration variables may be more related to environmental factors. The variation identified in the cone and needle variables shows that the populations of Motozintla and General Leyva are very likely to belong to the same genetic unit and are closely related to the populations of Central America. On the other hand, the variation in the population of Corazón del Valle may be a local adaptation to a warm subhumid climate due to the great ecological plasticity of the species.
End of the English version
Robbins, A. M. J. 1983. Pinus oocarpa Schiede. Seed leaflet No. 3. DANIDA Forest Seed Centre, Humlebaek, Denmark. 17 p.
Rodríguez L., R. y M. Capó A. 2005. Morfología de acículas y conos en poblaciones naturales de Pinus arizonica Engelm. Ra Ximhai 1:131-152.
Sanz de la F., M. del Río G. y R. Sierra de G. 2003. Efectos de la densidad de regeneración tras incendios sobre la características dasométricas del regenerado de Pinus pinaster Aiton, en la región de procedencia de Oña. Madrid, España. Ciencia Forestal 15:177-182.
Statistic Analysis System Institute (SAS). 1999. SAS/STAT Guide for Personal Computers. 9.1 Version. Cary, NC. USA. 518 p.
Secretaría del Medio Ambiente y Recursos Naturales (Semarnat). 2010. Norma Oficial Mexicana NOM–059–SEMARNAT–2010, Protección ambiental – Especies nativas de México de Flora y Fauna Silvestres – Categorías de Riesgo y especificaciones para su inclusión, exclusión o cambio – Lista de Especies en Riesgo. Diario Oficial de la Federación 2a. Sección, 30 de diciembre del 2010. http://dof.gob.mx/nota_detalle_popup.php?codigc.(10 de septiembre de 2011).
Viveros V., H., C. Sáenz R. y R. R. Guzmán R. 2005. Control genético de las características de crecimiento en vivero de plántulas de Pinus oocarpa. Rev. Fitotec. Mex. 28: 333-338.
Zamora S., C.1981. Algunos aspectos sobre Pinus oocarpa Schiede en el estado de Chiapas. Ciencia Forestal Vol. 6 (32): 25-53.

Gutiérrez et al., Variación fenotípica de poblaciones natuales...
61