Embed Size (px)
Citation preview

Vampir 2.0
User’s Manual
Pallas GmbHHermülheimer Straße 10D-50321 Brühl, Germanyhttp://www.pallas.de
Vampir was originally developed by the Zentralinstitut für Mathematik at the ForschungszentrumJülich.
We wish to thank Prof. Hoßfeld, Dr. Wolfgang Nagel and Dr. Alfred Arnold for the excellent work andthe good cooperation.
Vampir is a trademark of the Forschungszentrum Jülich.
This is document VA20-UG-12, date 99-06-30

Contents
i
ContentsContents ............................................................................................................................................ i1 Introduction............................................................................................................................... 1
1.1 What is Vampir 2.0............................................................................................................... 11.2 Brief History of Vampir ......................................................................................................... 11.3 What Do You Need to Run Vampir ? .................................................................................... 2
1.3.1 Supported Platforms...................................................................................................... 21.3.2 Trace Generation Software............................................................................................ 21.3.3 Downloading Vampir ..................................................................................................... 21.3.4 More Information about Vampir ..................................................................................... 2
2 Getting started with Vampir...................................................................................................... 32.1 Setup Procedure .................................................................................................................. 3
2.1.1 License File................................................................................................................... 32.1.2 Configuration File .......................................................................................................... 32.1.3 Support Tools................................................................................................................ 42.1.4 Tracefiles ...................................................................................................................... 4
2.2 Vampir Basics ...................................................................................................................... 42.2.1 Vampir Activities and Symbols....................................................................................... 42.2.2 The History List ............................................................................................................. 52.2.3 Vampir GUI Common Features...................................................................................... 5
2.3 Using Vampir ....................................................................................................................... 82.3.1 Opening a File............................................................................................................... 82.3.2 Timeline Displays .......................................................................................................... 92.3.3 Statistic Views ............................................................................................................. 112.3.4 Filtering ....................................................................................................................... 14
3 Vampir 2.0 Transition Guide ................................................................................................... 173.1 The Vampir 2.0 User Interface............................................................................................ 183.2 New Displays in Vampir 2.0................................................................................................ 21
3.2.1 Summaric Chart Display.............................................................................................. 213.2.2 Call Tree Displays ....................................................................................................... 223.2.3 Source Code Display................................................................................................... 233.2.4 Length Statistics Display ............................................................................................. 23
3.3 New Functionality............................................................................................................... 253.3.1 Save Tracefile Dialog .................................................................................................. 253.3.2 Tracefile Info Dialog .................................................................................................... 253.3.3 Displaying Symbol Statistics ........................................................................................ 263.3.4 Inclusive and Exclusive Profiling.................................................................................. 263.3.5 Comparing Traces....................................................................................................... 273.3.6 Printing Displays.......................................................................................................... 273.3.7 Preferences................................................................................................................. 28
4 Vampir 2.0 Reference.............................................................................................................. 294.1 Main Menu Bar................................................................................................................... 32
4.1.1 Controlling the Tracefile Input ...................................................................................... 334.2 File Menu ........................................................................................................................... 34
4.2.1 Open Tracefile Dialog.................................................................................................. 344.2.2 Recent Tracefiles Dialog.............................................................................................. 354.2.3 Tracefile Info Dialog .................................................................................................... 354.2.4 Save Tracefile Dialog .................................................................................................. 354.2.5 Config Menu................................................................................................................ 364.2.6 Exit.............................................................................................................................. 37
4.3 Global Displays Menu......................................................................................................... 384.3.1 Global Timeline Display............................................................................................... 394.3.2 Summaric Chart Display.............................................................................................. 494.3.3 Activity Chart Display................................................................................................... 554.3.4 Global Call Tree Display.............................................................................................. 604.3.5 Communication Statistics ............................................................................................ 634.3.6 Parallelism .................................................................................................................. 69
Contents
ii
4.3.7 Process View .............................................................................................................. 734.3.8 Filter Processes........................................................................................................... 81
4.4 Process Displays................................................................................................................ 824.4.1 Process Timeline......................................................................................................... 824.4.2 Process Activity Chart ................................................................................................. 864.4.3 Process Call Tree........................................................................................................ 91
4.5 Preferences........................................................................................................................ 934.5.1 Usage Level ................................................................................................................ 934.5.2 Colors ......................................................................................................................... 944.5.3 Fonts........................................................................................................................... 974.5.4 Activities...................................................................................................................... 984.5.5 Displays ...................................................................................................................... 994.5.6 Messages.................................................................................................................. 1024.5.7 Tracefile .................................................................................................................... 104
4.6 Extras .............................................................................................................................. 1064.6.1 Snapshot................................................................................................................... 1064.6.2 PostScript Print Function ........................................................................................... 1074.6.3 Error Log................................................................................................................... 1094.6.4 Pending Messages.................................................................................................... 110
4.7 Help ................................................................................................................................. 1114.7.1 About ........................................................................................................................ 111
A Vampir Trace Format and Related Issues ............................................................................ 112A.1 The Vampir ASCII Trace Format ...................................................................................... 112
A.1.1 ASCII Versus Binary Formats .................................................................................... 112A.1.2 ASCII Line Format..................................................................................................... 113A.1.3 Trace Commands Used by Vampir ............................................................................ 113A.1.4 Trace Events Used by Vampir ................................................................................... 115
A.2 Conventions for Trace Converters .................................................................................... 116A.3 Integration of a new converter into Vampir........................................................................ 117
Introduction
1
1 Introduction
A.1 What is Vampir 2.0
Experience shows that it is much harder to debug and tune parallel programs than sequential oneswith only one instruction stream. The much larger state space and the necessary communicationbetween processes greatly complicate the task of analysing the behaviour of a parallel application.The reasons for performance problems, in particular, are notoriously hard to find.
Take, for instance, an MIMD program running on a massively parallel computer with possiblyhundreds of processors. Assume that the performance of this program is disappointing. Initially, theprogrammer has no idea where and for what to look to identify the performance bottleneck. Usually, atracefile is generated that uses up much of the available disk space, and contains the answer to theperformance problem somewhere. The crucial and at the same time tricky task is to find thatinformation in the whole mess.
A tool that assists the programmer in getting an overview about an execution trace quickly, thatenables him/her to focus on important parts of the program execution easily and conveniently, andthat assists in distilling the relevant performance information out of the deluge of irrelevant data wouldbe a great help indeed.
Vampir is such a tool. It converts the trace information into a variety of graphical views, e.g. timelinedisplays showing state changes and communication, profiling statistics displaying the execution timesof routines, communication statistics indicating data volumes and transmission rates, and more. Thedisplays can be related to the source code, and Vampir's advanced navigation functions allow to easilyzoom into arbitrary time intervals. Thus, one can proceed from a bird's eye view of the whole trace intofiner and finer detail. The profiling and communication statistics help in identifying performancebottlenecks, while the detailed timeline view gives clues as to their cause.
These sophisticated display, zooming and filtering functions set Vampir apart from other well–knownperformance analysis and visualisation tools like ParaGraph, AIMS, nupshot and xMPI.
A.2 Brief History of Vampir
Vampir has been originally developed by the Forschungszentrum Jülich GmbH under the name ofPARvis as a visualisation add–on for a scheduler simulator called PARsim. During the implementationphase it became apparent that Vampir would be of general use to display and analyse state changesof parallel processes. It has been widely used within the Forschungszentrum and other sites, andfinally productized under its current name and marketed by Pallas GmbH in cooperation with theForschungszentrum Jülich.
The market success of Vampir has been remarkable; it is now employed world wide by a large usercommunity with universities, research labs and commercial code vendors. Apart from analysing tracesof MPI applications, Vampir has proven to be capable to help in the performance analysis of Cray–style shmem–type and HPF applications, as well as for the low–level analysis of parallel programmingmodels.
Vampir 2.0 is the first major update of Vampir, incorporating many internal optimisations, a muchimproved user interface, source code links, some new displays and more.
Introduction
2
A.3 What Do You Need to Run Vampir ?
A.3.1 Supported Platforms
Vampir is currently available on all major workstation platforms:
• DEC Alpha workstations running DIGITAL Unix• HP PA–RISC workstations running HPUX 10• IBM RS/6000 workstations running AIX 4 (including SP–2 nodes!)• Intel i86 machines (PC–clones) running Solaris 2.5 or 2.6• Intel i86 machines (PC–clones) running Linux 2.0• Sun Sparc workstations running Solaris 2.5 or 2.6• Cray/SGI workstations and Origin 2000 systems running Irix 6
A graphical display running a X server (X11R5 or later) is, of course, required.
A.3.2 Trace Generation Software
The recommended way to generate Vampir tracefiles from MPI applications is to use theVAMPIRtrace instrumentation library available from Pallas. It works with MPI programs written inFortran 77, Fortran 90, C and C++, and is supported on all major parallel platforms, including theparallel systems from Cray/SGI, DIGITAL, Fujitsu, Hitachi, HP, IBM, NEC and others, as well as fornetworks of workstations.
Some parallel platforms have other means of generating tracefiles for Vampir that work with non–MPIapplications; please contact Pallas for details. Also, the instrumentation functionality does vary acrossplatforms with respect to automatic instrumentation and source code reference.
A.3.3 Downloading Vampir
As with all Pallas tools, the latest version of Vampir is available for download on the Pallas WWW andftp servers. If you use the web for downloading, you can request an evaluation key to be generatedon–the–fly. If you use ftp, you'll have to request a license key by email, as detailed in the VampirInstallation Guide. The Vampir distribution includes both the User's Guide (this document) and theInstallation Guide.
The Pallas WWW server can be contacted at www.pallas.de; follow the products and vampir links to getto the Vampir pages.
The Pallas ftp server is accessible as ftp.pallas.de; login as anonymous and follow the instructions inthe banners.
A.3.4 More Information about Vampir
To get additional and up–to–date information about Vampir functionality, supported platforms,generating tracefiles etc., please look at the Pallas WWW pages (http://www.pallas.de). You're alwayswelcome to ask any questions about the Pallas tools by sending email to [email protected].
Getting started with Vampir
3
2 Getting started with VampirA.1 Setup Procedure
We assume that Vampir has been installed on the system you're using. If that is not the case, pleaserefer to the Vampir Installation Guide for help. Let $VAMPIR_ROOT be the root directory of your Vampirinstallation, e.g. /usr/local/vampir.The Vampir executable image resides in the directory $VAMPIR_ROOT/bin.
A.1.1 License File
In order to run Vampir on a system, you must have a license key from Pallas. The license keys arestored in a plain ASCII file, the pathname of which must be made known to Vampir by setting one oftwo environment variables:
• PAL_LICENSEFILE specifies the complete pathname of the license key file.• PAL_ROOT points to the root of the Vampir installation. The pathname of the license file is
assumed to be $PAL_ROOT/etc/license.dat.
If called without a valid license, or with invalid settings of the above environment variables, Vampiraborts with an error message, e.g.:
VAMPIR: could not access license file.VAMPIR: need license for product VA20, arch SPRC-OS5, hostid 2155491417, uid E0.VAMPIR: network address 192.168.3.4VAMPIR: environment var PAL_ROOT not set.VAMPIR: environment var PAL_LICENSEFILE not set.
In this case, make sure that the correct license key file is specified with the above mentionedenvironment variables, or contact Pallas to acquire a license (URL http://www.pallas.de, email [email protected]).
A.1.2 Configuration File
Vampir will create a configuration file called VAMPIR2.cnf in the directory $HOME/.VAMPIR_defaults, with$HOME referencing your home directory. This file contains all configuration settings for Vampir andenables Vampir to preserve settings from one session to another. If you don't already have aconfiguration file, you should create the directory $HOME/.VAMPIR_defaults and copy the system–defaultfile in $VAMPIR_ROOT/etc/VAMPIR2.cnf into it.
For Vampir 1.0 users the existing configuration file ~/VAMPIR_defaults/VAMPIR.cnf will be migrated to thenew VAMPIR2.cnf file. So all Vampir 1.0 settings are immediately available.
If there's no configuration file at all, Vampir will create one with default values that allow to start thevisualisation.
Getting started with Vampir
4
A.1.3 Support Tools
Vampir accesses several external tools to perform some of its tasks. These tools must be located in adirectory included in your shell's executable search path (path shell variable or PATH environmentvariable):
• a print command for lists and window snapshots (like lp or lpr). Lists are printed as plain ASCIIfiles, window snapshots as PostScript.
• import, a screen snapshot utility from the ImageMagick package to export or print windowcontents. It is installed in the same directory as the Vampir executable. ImageMagick can bedownloaded from several ftp servers, including ftp.x.org, directory /contrib/applications/ImageMagick,or from ftp.zam.kfa-juelich.de, directory pub/graphics/ImageMagick.
• If you have trace files compressed with gzip or compress, Vampir can extract them automaticallyif their counterparts gunzip or uncompress, respectively, are available. The GNU gzip packagecan be downloaded from prep.ai.mit.edu, directory pub/gnu, file gzip-1.2.4.tar, amongst other GNUsoftware ftp servers.
• If you want to view PARMACS tracefiles, the necessary converters need to be installed in theVampir executable directory. If in doubt, contact Pallas.
However, these tools are not essential to use Vampir if you do not plan to use the features mentionedabove.
A.1.4 Tracefiles
A sample tracefiles is available in the directory $VAMPIR_ROOT/etc. Please refer to the README file therefor further information.A number of tools for Vampir tracefile generation are available (see A.3.2). Please refer to thepackage–specific documentation for details.Appendix A describes the Vampir trace data format if you want to convert foreign tracefiles.
A.2 Vampir Basics
A.2.1 Vampir Activities and Symbols
Visualisation in Vampir is based on Activities and associated Symbols. For MPI programs the majoractivity is named MPI and all MPI functions are defined as symbols inside this activity. With the help ofthese elements it is possible to show the different states in a parallel program. In general activities arethe generic terms for Symbols. Symbols are detailed descriptions of Activities. In detail, the Activity MPIhas all MPI functions like MPI_Bcast() defined as associated Symbols. With this hierarchicallydependence it is possible to reduce the amount of information initially presented by the statisticaldisplays, because at first every statistic display shows only the different Activities of the tracedprogram.
To distinguish one Activity from another it is useful to assign an individual color to each Activity (seeSection A.5.2). Symbols inherits the Activity color in Timeline Displays and are automatically colored inStatistic Displays. It is also possible to rearrange the assignment of Activities and Symbols with thedialog reachable from the main menu item Preferences/Activities/Symbol Grouping. For a detaileddescription of this dialog please refer Section A.5.4.
Getting started with Vampir
5
A.2.2 The History List
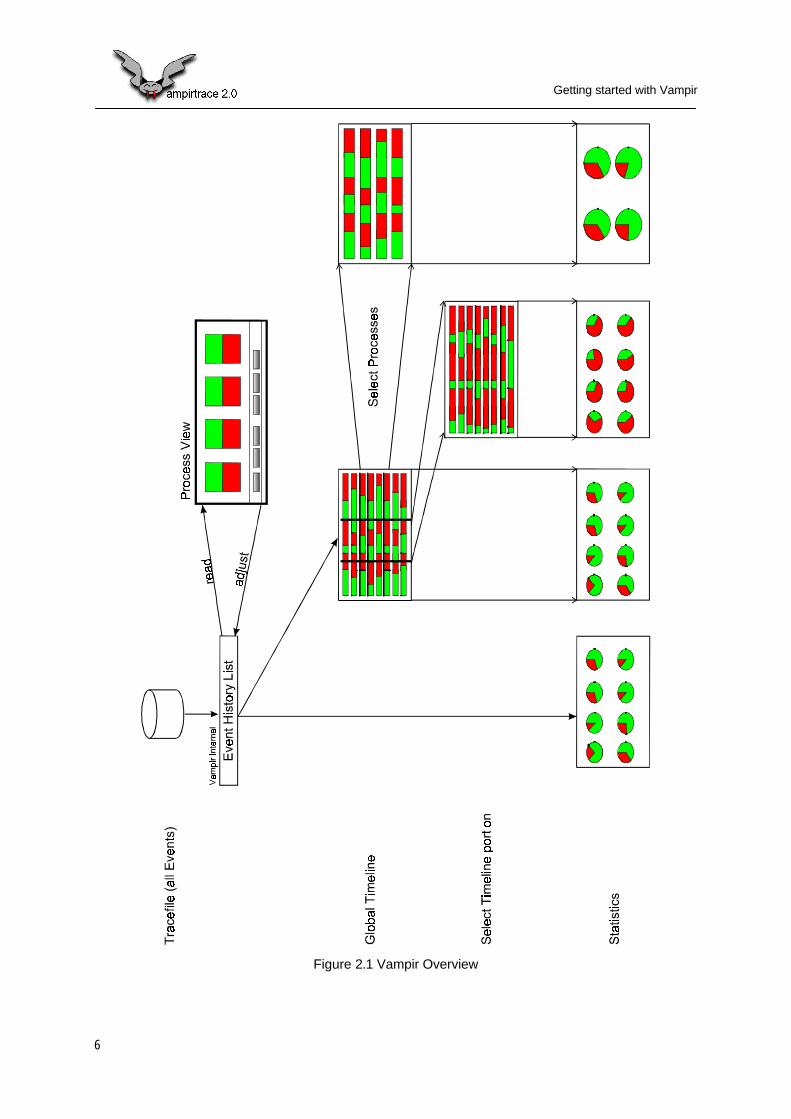
All state changes where saved in the Vampir global history list. This list forms the information base foralmost all functions and displays and will be filled with all analysed events while Vampir is reading thefile. With exception of the Global Displays/Process View all views access these list in a read onlystyle. Only the time movement functions of the Process View influences the history list, so that theinformation base is changed for all other displays (see Figure 2.1). The history list will be restoredeither by closing the Process View or by selecting the Restore History item from Process Viewcontext menu.
A.2.3 Vampir GUI Common Features
There are four basic window styles in Vampir:
• List windows like call tree views.• Graphic windows like timeline or statistic views.• Source listing windows like source code display.• Configuration dialogs.
In all Vampir views, except list windows, context menus are available, which pop up on a single clickwith the right mouse button inside the view. All view specific functions and settings are available overthese context menu.
If a function from a context menu is activated which needs further input like an additional mouse clickor selection of an area, the mouse cursor shape inside the corresponding window is changed to aspecial pixmap, to indicate that Vampir is still waiting for additional input to complete the formerselected function.
In most Vampir graphic windows zooming is applicable. The only exception is the pie chart mode ofthe statistic views. To magnify a part of a display press the left mouse button at the start of the regionto be magnified. While holding the left mouse button, drag the mouse to the end of the desired region,then release the mouse button. The zoomed window will be redrawn to show the magnified portionwith scales adjusted accordingly.
To make changed configuration settings active please use the Apply button before closing the dialog.If configuration settings are changed and the dialog is closed without activation of the Apply button allchanges are discarded.
All Vampir menus can be torn off to provide the user with a more comfortable interface. This, "tear-off"enabled menus make it easy to make repeated menu selections. Normally, when the user posts amenu, it is only displayed until he makes a selection, and then it is removed. If the menu has been tornoff however, it is displayed in a separate window, and the user can make as many selections as hewants without having to select the menu each time. When tear off functionality is enabled in a Vampirmenu, the first item in the menu is a dashed line. By selecting this item the menu is placed in aseparate window with limited window manager decorations. The menu remains torn off until the usercancels the menu by pressing the ESCAPE key within the window or selecting Close from the windowmanager menu.
Getting started with Vampir
6
Figure 2.1 Vampir Overview

Getting started with Vampir
7
Inside Vampir displays all three mouse buttons have functions assigned to them. Generally a singleclick with the left mouse button is used to select a single process. A single click with the middle mousebutton is used to deselect all prior selected processes, if process selection applicable, or to close theview. A single click with the right mouse button is used to pop up a context menu with view specificoptions and functions. Moving the mouse with the left button pressed is used to zoom into a view, or ifzooming is not applicable, to mark an area which is used for multiple process selection. Selecting afunction from the view context menu may change the meaning of a mouse click. To indicate this themouse cursor shape inside the corresponding view will be changed to a special pixmap like cross-hairs or a target symbol.

Getting started with Vampir
8
A.3 Using Vampir Vampir has many features, and their interaction can be quite complex, so that a complete descriptionof them in the style of a "reference book" would be of little use to a novice user. In this section, we willintroduce step by step a subset of essential functions and views that represent a good summary ofVampir’s basic features and help a person unfamiliar with Vampir to get started. This introductionshows the important elements of Vampir by using the tracefile lu.S.4.bpv from the Vampir distribution.The tracefile, generated on a NEC–SX4, resides in $VAMPIR_ROOT/etc. The according source coderesides in $VAMPIR_ROOT/etc/NPB2.2-LU and is distributed with permission of the NASA Ames ResearchCenter. The complete source and documentation of NAS Parallel Benchmark 2 can be found athttp://www.nas.nasa.gov/NAS/NPB/. A.3.1 Opening a File There are two basic ways to open a trace file: If you already know which file to analyse, you canspecify its name directly in the command line:
vampir lu.S.4.bpv
The suffix .bpv stands for a binary Vampir tracefile, .pv for an ASCII Vampir tracefile. It is recommendedto use these extensions to help identifying file types. The other way to open a trace file is to call vampir without any parameters and to select the file fromwithin Vampir. After Vampir has completed startup, and the main window shown in Figure 2.2 isdisplayed, press ALT-O or select the menu option File/Open Tracefile and a Motif–style file selectorwill pop up. Select the file $VAMPIR_ROOT/etc/lu.S.4.bpv and press OK.
Figure 2.2 Vampir Main Window
If you would like to re–visualize the tracefile from an earlier session, it often is easier to open theRecent Tracefile dialog (reachable via File/Recent Tracefiles} or shortcut ALT-R). There you find alltracefiles examined by Vampir in one of the previous sessions. Selecting the file lu.S.4.bpv from the listand pressing the OK button will immediately open that file for visualization. Compressed tracefiles are identified by their suffix and would be uncompressed on the fly. Thenecessary external uncompress programs have to be registered as external converter with the dialogreachable via Preferences/Tracefile/External Converters. The suffixes .Z, .gz and .bz2 are registeredby default. For a detailed description how to add an additional converter or to modify an existingconverter please refer to Section A.5.7 and A.3. Before Vampir can display the contents of the selected tracefile, a certain amount of pre–analysismust be done. The progress of this analysis is visualized in the status line below the menu bar of themain window. While analyzing the tracefile a progress bar shows the percentage value of analyzedevents as well as the absolute number of scanned events.
Getting started with Vampir
9
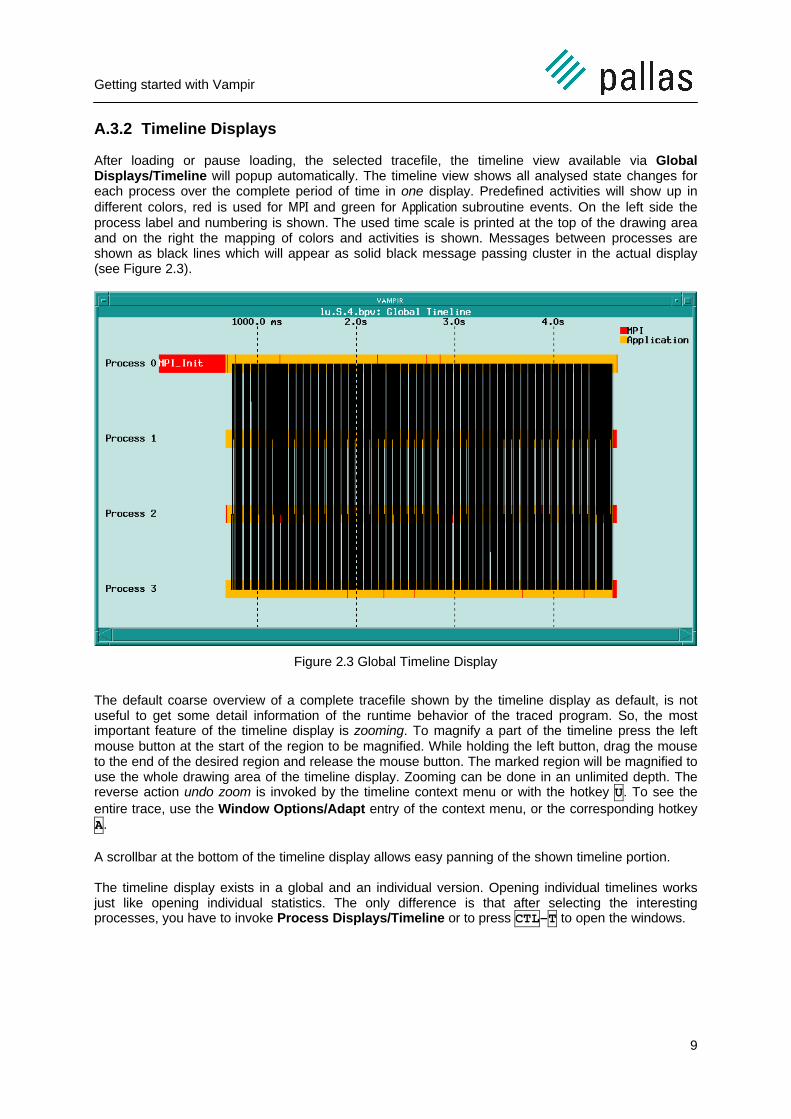
A.3.2 Timeline Displays After loading or pause loading, the selected tracefile, the timeline view available via GlobalDisplays/Timeline will popup automatically. The timeline view shows all analysed state changes foreach process over the complete period of time in one display. Predefined activities will show up indifferent colors, red is used for MPI and green for Application subroutine events. On the left side theprocess label and numbering is shown. The used time scale is printed at the top of the drawing areaand on the right the mapping of colors and activities is shown. Messages between processes areshown as black lines which will appear as solid black message passing cluster in the actual display(see Figure 2.3).
Figure 2.3 Global Timeline Display
The default coarse overview of a complete tracefile shown by the timeline display as default, is notuseful to get some detail information of the runtime behavior of the traced program. So, the mostimportant feature of the timeline display is zooming. To magnify a part of the timeline press the leftmouse button at the start of the region to be magnified. While holding the left button, drag the mouseto the end of the desired region and release the mouse button. The marked region will be magnified touse the whole drawing area of the timeline display. Zooming can be done in an unlimited depth. Thereverse action undo zoom is invoked by the timeline context menu or with the hotkey U. To see theentire trace, use the Window Options/Adapt entry of the context menu, or the corresponding hotkeyA. A scrollbar at the bottom of the timeline display allows easy panning of the shown timeline portion. The timeline display exists in a global and an individual version. Opening individual timelines worksjust like opening individual statistics. The only difference is that after selecting the interestingprocesses, you have to invoke Process Displays/Timeline or to press CTL-T to open the windows.
Getting started with Vampir
10
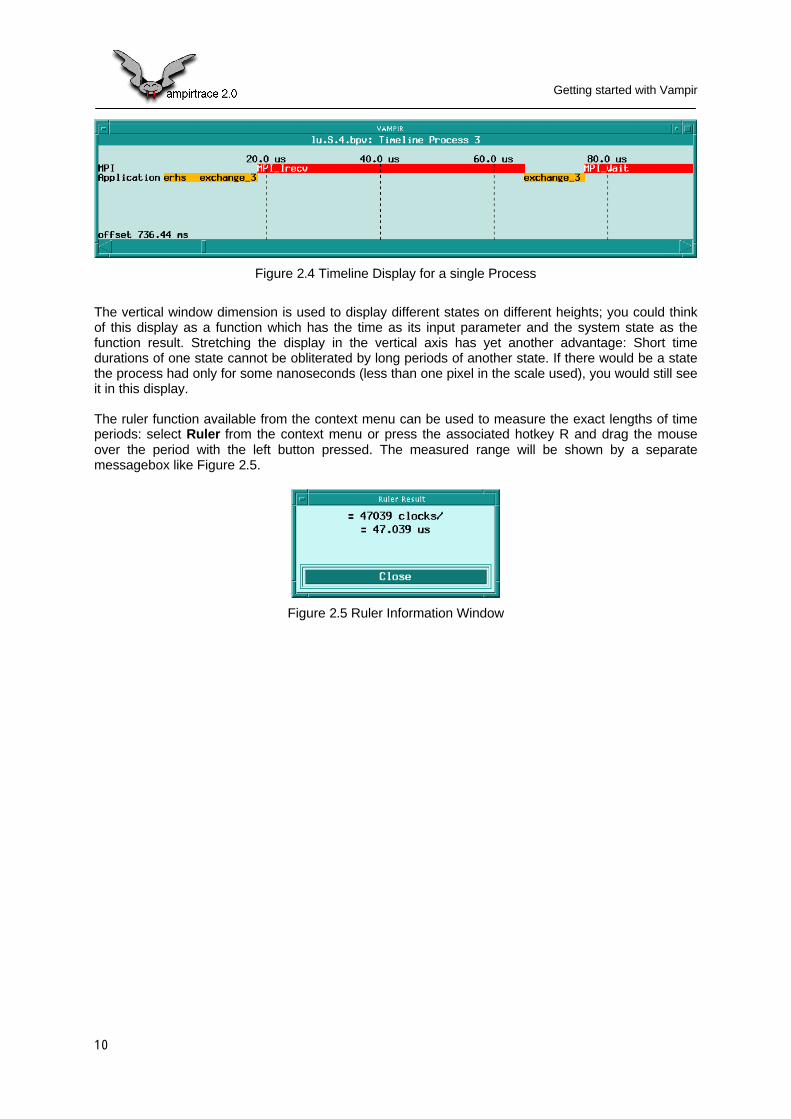
Figure 2.4 Timeline Display for a single Process
The vertical window dimension is used to display different states on different heights; you could thinkof this display as a function which has the time as its input parameter and the system state as thefunction result. Stretching the display in the vertical axis has yet another advantage: Short timedurations of one state cannot be obliterated by long periods of another state. If there would be a statethe process had only for some nanoseconds (less than one pixel in the scale used), you would still seeit in this display. The ruler function available from the context menu can be used to measure the exact lengths of timeperiods: select Ruler from the context menu or press the associated hotkey R and drag the mouseover the period with the left button pressed. The measured range will be shown by a separatemessagebox like Figure 2.5.
Figure 2.5 Ruler Information Window
Getting started with Vampir
11
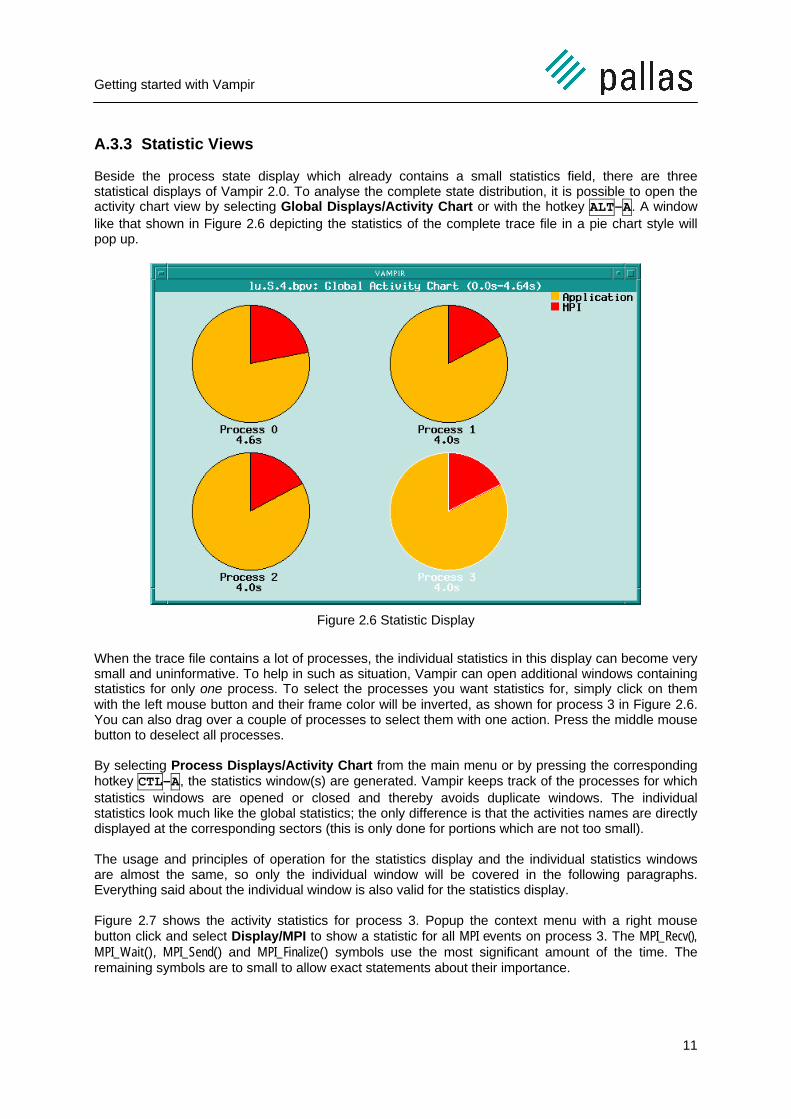
A.3.3 Statistic Views Beside the process state display which already contains a small statistics field, there are threestatistical displays of Vampir 2.0. To analyse the complete state distribution, it is possible to open theactivity chart view by selecting Global Displays/Activity Chart or with the hotkey ALT-A. A windowlike that shown in Figure 2.6 depicting the statistics of the complete trace file in a pie chart style willpop up.
Figure 2.6 Statistic Display
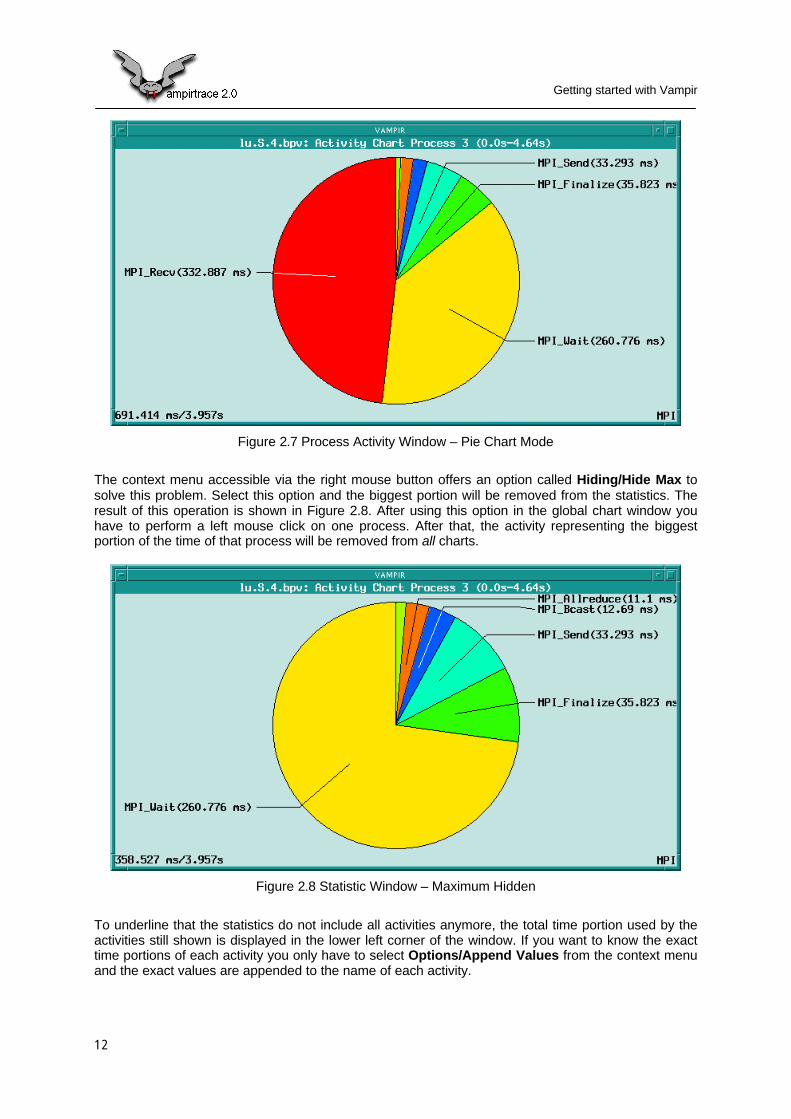
When the trace file contains a lot of processes, the individual statistics in this display can become verysmall and uninformative. To help in such as situation, Vampir can open additional windows containingstatistics for only one process. To select the processes you want statistics for, simply click on themwith the left mouse button and their frame color will be inverted, as shown for process 3 in Figure 2.6.You can also drag over a couple of processes to select them with one action. Press the middle mousebutton to deselect all processes. By selecting Process Displays/Activity Chart from the main menu or by pressing the correspondinghotkey CTL-A, the statistics window(s) are generated. Vampir keeps track of the processes for whichstatistics windows are opened or closed and thereby avoids duplicate windows. The individualstatistics look much like the global statistics; the only difference is that the activities names are directlydisplayed at the corresponding sectors (this is only done for portions which are not too small). The usage and principles of operation for the statistics display and the individual statistics windowsare almost the same, so only the individual window will be covered in the following paragraphs.Everything said about the individual window is also valid for the statistics display. Figure 2.7 shows the activity statistics for process 3. Popup the context menu with a right mousebutton click and select Display/MPI to show a statistic for all MPI events on process 3. The MPI_Recv(),MPI_Wait(), MPI_Send() and MPI_Finalize() symbols use the most significant amount of the time. Theremaining symbols are to small to allow exact statements about their importance.
Getting started with Vampir
12
Figure 2.7 Process Activity Window – Pie Chart Mode
The context menu accessible via the right mouse button offers an option called Hiding/Hide Max tosolve this problem. Select this option and the biggest portion will be removed from the statistics. Theresult of this operation is shown in Figure 2.8. After using this option in the global chart window youhave to perform a left mouse click on one process. After that, the activity representing the biggestportion of the time of that process will be removed from all charts.
Figure 2.8 Statistic Window – Maximum Hidden
To underline that the statistics do not include all activities anymore, the total time portion used by theactivities still shown is displayed in the lower left corner of the window. If you want to know the exacttime portions of each activity you only have to select Options/Append Values from the context menuand the exact values are appended to the name of each activity.
Getting started with Vampir
13
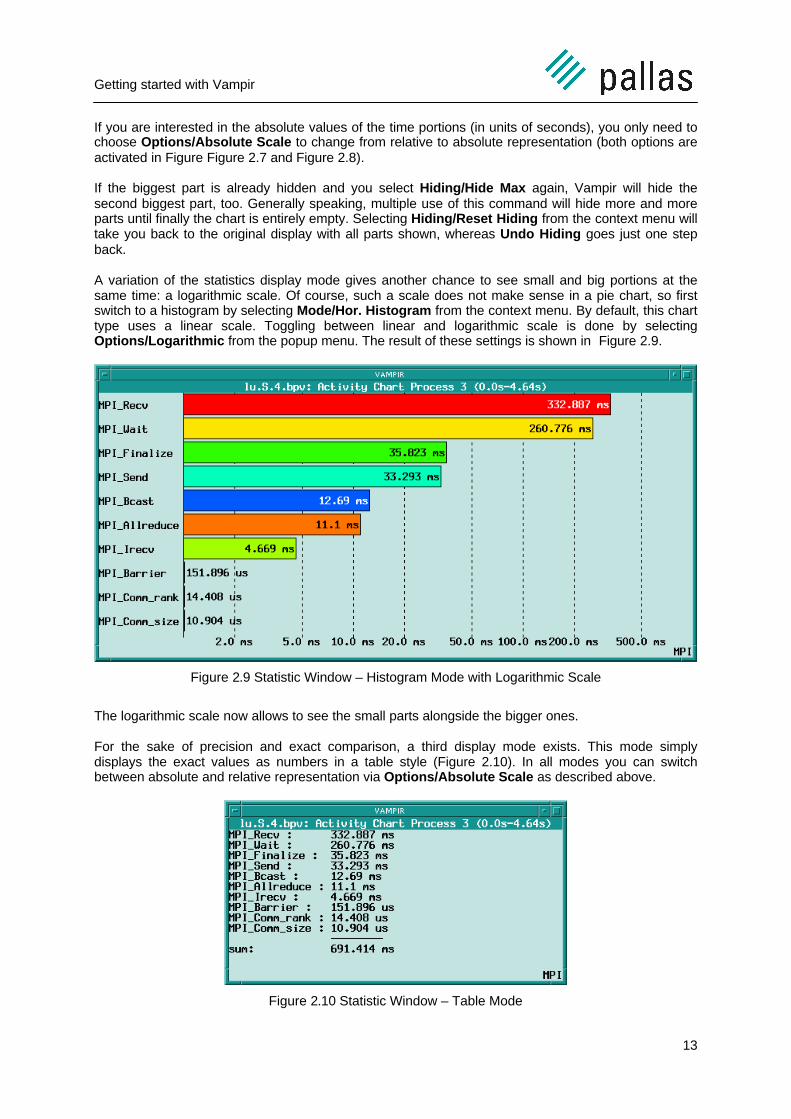
If you are interested in the absolute values of the time portions (in units of seconds), you only need tochoose Options/Absolute Scale to change from relative to absolute representation (both options areactivated in Figure Figure 2.7 and Figure 2.8). If the biggest part is already hidden and you select Hiding/Hide Max again, Vampir will hide thesecond biggest part, too. Generally speaking, multiple use of this command will hide more and moreparts until finally the chart is entirely empty. Selecting Hiding/Reset Hiding from the context menu willtake you back to the original display with all parts shown, whereas Undo Hiding goes just one stepback. A variation of the statistics display mode gives another chance to see small and big portions at thesame time: a logarithmic scale. Of course, such a scale does not make sense in a pie chart, so firstswitch to a histogram by selecting Mode/Hor. Histogram from the context menu. By default, this charttype uses a linear scale. Toggling between linear and logarithmic scale is done by selectingOptions/Logarithmic from the popup menu. The result of these settings is shown in Figure 2.9.
Figure 2.9 Statistic Window – Histogram Mode with Logarithmic Scale
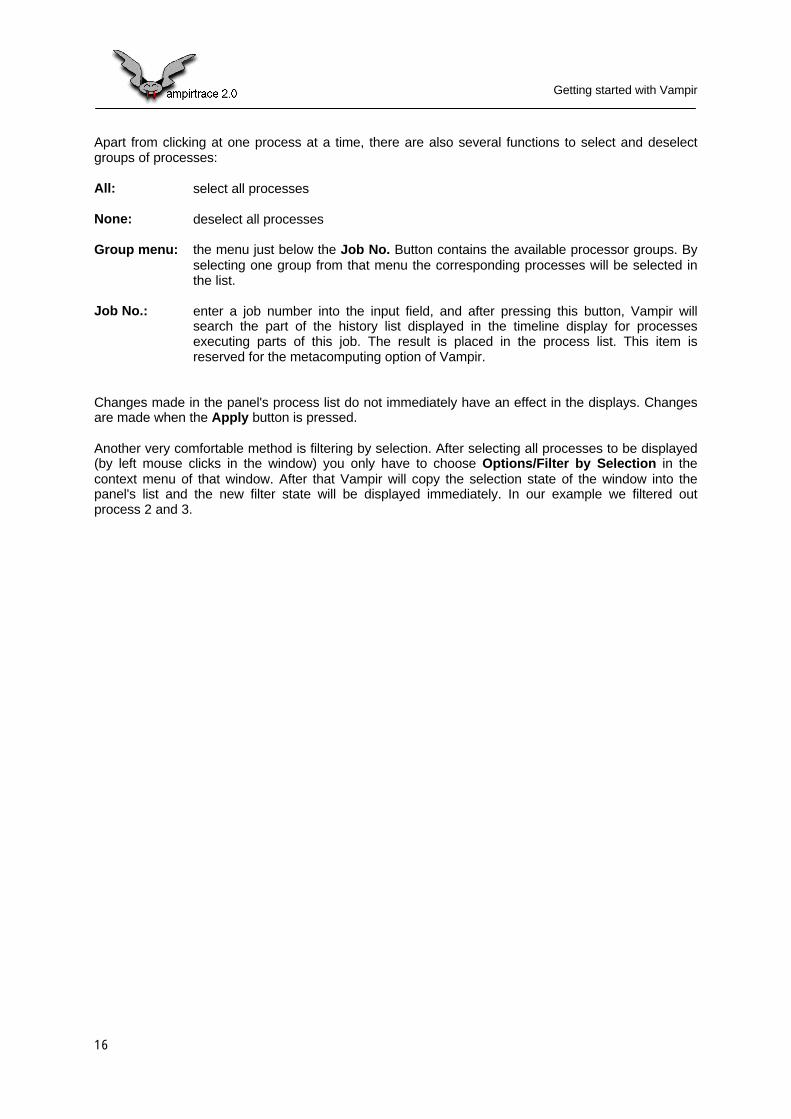
The logarithmic scale now allows to see the small parts alongside the bigger ones. For the sake of precision and exact comparison, a third display mode exists. This mode simplydisplays the exact values as numbers in a table style (Figure 2.10). In all modes you can switchbetween absolute and relative representation via Options/Absolute Scale as described above.
Figure 2.10 Statistic Window – Table Mode
Getting started with Vampir
14
A.3.4 Filtering
Vampir allows the simultaneous display of up to 4096 processes and a time range of up to 252 clocks.Assuming that no machine has a smaller clock cycle than 2 nanoseconds, this corresponds to a timerange of three months. Of course, displaying such an enormous amount of data on one screen wouldbe absolutely useless. Vampir has several filtering functions which enable you to extract the subsetyou are interested in.
Titel:FilterTechErstellt von:Tgif-2.12 by William Chia-Wei Cheng ([email protected])Vorschau:Diese EPS-Grafik wurde nicht gespeichertmit einer enthaltenen Vorschau.Kommentar:Diese EPS-Grafik wird an einenPostScript-Drucker gedruckt, aber nichtan andere Druckertypen.
Figure 2.11 Principle of Filtering
Figure 2.11 shows the base principle of filtering in Vampir. The process can be divided in three stages.In the first stage, you mark the subset of objects you want to see afterwards (in the picture, they are
Getting started with Vampir
15
marked with crosses). As the second step, you instruct Vampir to remove the unmarked objects fromthe display. This step represents the central point of filtering, the reduction of data to give a clearerdisplay. In the third stage (which is done automatically by Vampir), the space which has become freeis used to expand the remaining objects so that they fully use the screen again. This may require torearrange the remaining objects and is thus not always sensible (e.g. in timeline displays), in whichcases the third step is omitted.
The way in which the selection of interesting objects is done depends on the objects' nature, but it cangenerally be divided into two types:
• manually by the user
• automatically by Vampir
In the first case, the user selects the objects from a display or list, whereas in the second case, theuser gives only a criteria an object must fulfill to be still displayed.
Vampir supports filtering in several ways:
in time: filtering in time is provided by the zooming facility of timeline displays. Asstated earlier, the options to influence the time period visible in a timelinedisplay are extremely versatile and would go beyond the scope of thisoverview. A complete description of zooming can be found in the followingchapter.
by processes: the filtering of processes influences all display modes and it is a good examplefor manual and automatic filtering. We will therefore describe this feature in thisintroduction.
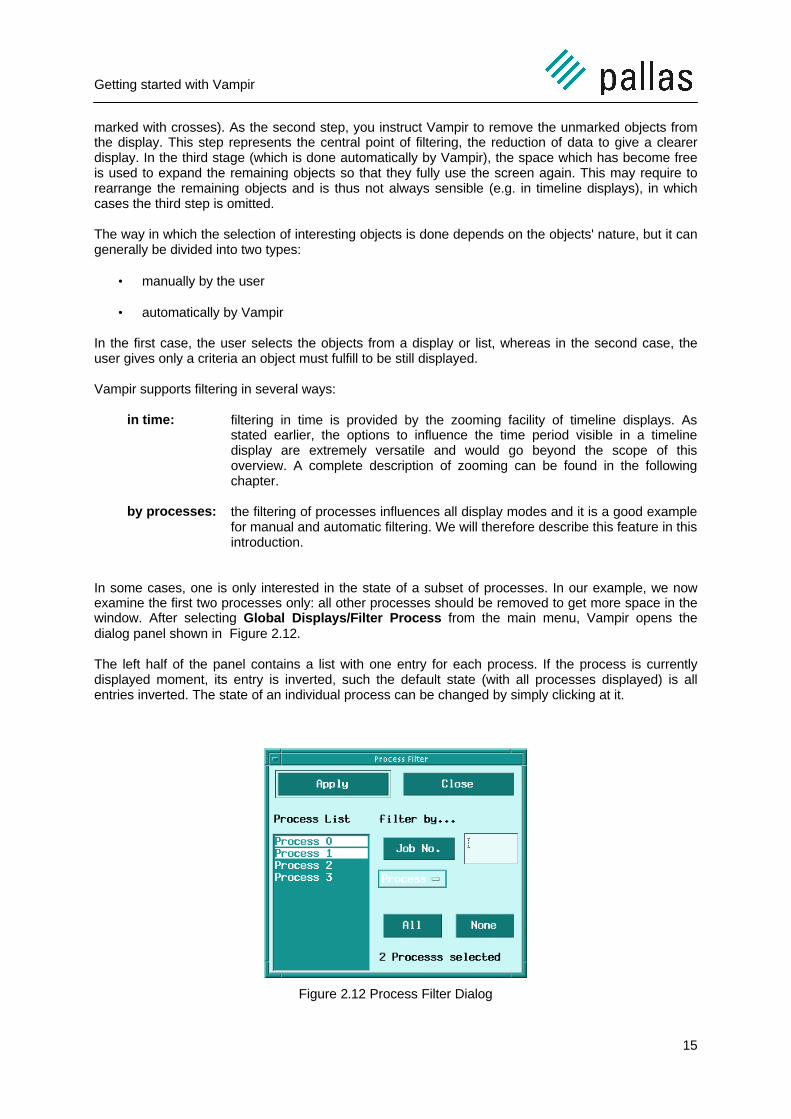
In some cases, one is only interested in the state of a subset of processes. In our example, we nowexamine the first two processes only: all other processes should be removed to get more space in thewindow. After selecting Global Displays/Filter Process from the main menu, Vampir opens thedialog panel shown in Figure 2.12.
The left half of the panel contains a list with one entry for each process. If the process is currentlydisplayed moment, its entry is inverted, such the default state (with all processes displayed) is allentries inverted. The state of an individual process can be changed by simply clicking at it.
Figure 2.12 Process Filter Dialog
Getting started with Vampir
16
Apart from clicking at one process at a time, there are also several functions to select and deselectgroups of processes:
All: select all processes
None: deselect all processes
Group menu: the menu just below the Job No. Button contains the available processor groups. Byselecting one group from that menu the corresponding processes will be selected inthe list.
Job No.: enter a job number into the input field, and after pressing this button, Vampir willsearch the part of the history list displayed in the timeline display for processesexecuting parts of this job. The result is placed in the process list. This item isreserved for the metacomputing option of Vampir.
Changes made in the panel's process list do not immediately have an effect in the displays. Changesare made when the Apply button is pressed.
Another very comfortable method is filtering by selection. After selecting all processes to be displayed(by left mouse clicks in the window) you only have to choose Options/Filter by Selection in thecontext menu of that window. After that Vampir will copy the selection state of the window into thepanel's list and the new filter state will be displayed immediately. In our example we filtered outprocess 2 and 3.
Vampir 2.0 Transition Guide
17
3 Vampir 2.0 Transition GuideWhile the previous chapter has given a first overview of the Vampir 2.0 features and instructions onhow to start using Vampir, this chapter addresses users of Vampir 1.0. It focuses on the differencesbetween the versions both regarding user interface and the tool functionality.
Compared to Vampir 1.0, Vampir 2.0 introduces various internal improvements and optimizations, andmore importantly, a significantly improved user interface, several new kinds of graphical displaysuseful to get a better understanding of the behaviour of a parallel application, and some functionaladditions to existing displays.
This section will address the new GUI and menu structure first, and then detail the functional additionsto existing displays and the altogether new displays. Finally, compatibility issues will be discussed.
Vampir 2.0 Transition Guide
18
A.1 The Vampir 2.0 User Interface
Experience with Vampir 1.0 has shown that the menu structure and the arrangement of the variousconfiguration options easily confuses new and inexperienced Vampir users. In addition, new functionsand displays had to be integrated in Vampir 2.0. Thus, it was decided to rearrange the Vampir menustructure, and to improve the general handling of the tool.
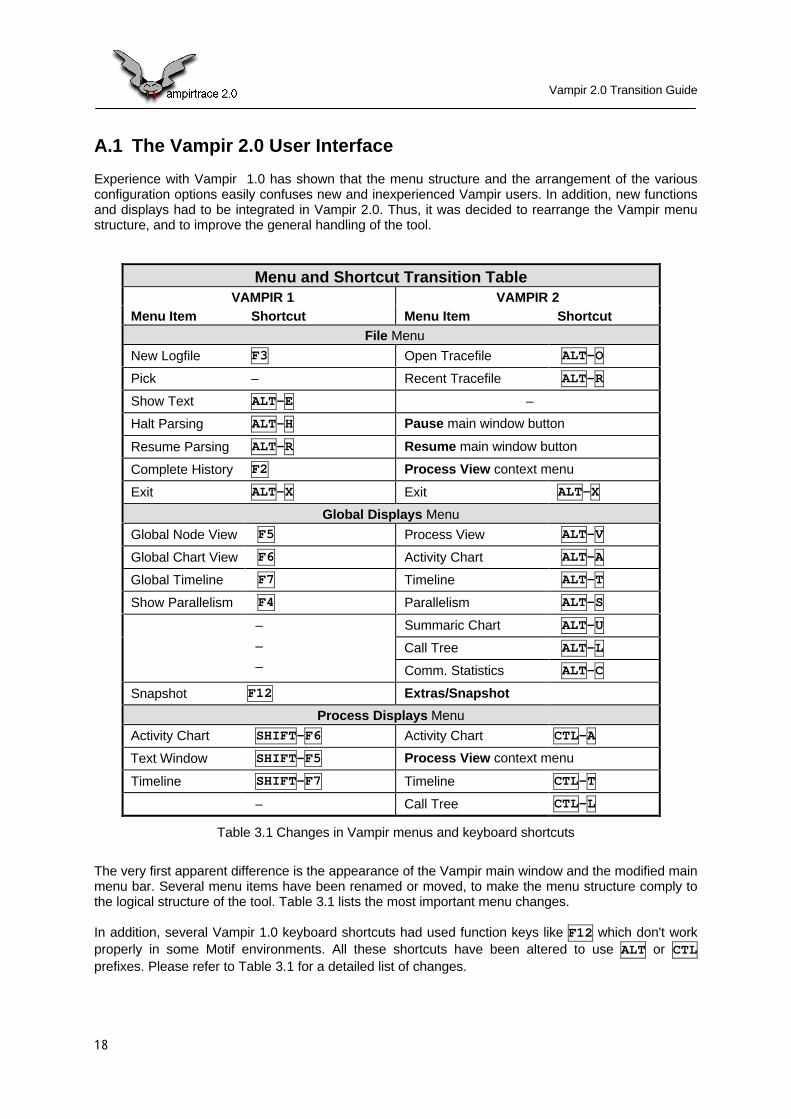
Menu and Shortcut Transition Table VAMPIR 1 VAMPIR 2
Menu Item Shortcut Menu Item Shortcut File Menu
New Logfile F3 Open Tracefile ALT-O
Pick – Recent Tracefile ALT-R
Show Text ALT-E –
Halt Parsing ALT-H Pause main window button
Resume Parsing ALT-R Resume main window button
Complete History F2 Process View context menu
Exit ALT-X Exit ALT-X
Global Displays Menu
Global Node View F5 Process View ALT-V
Global Chart View F6 Activity Chart ALT-A
Global Timeline F7 Timeline ALT-T
Show Parallelism F4 Parallelism ALT-S
Summaric Chart ALT-U
Call Tree ALT-L
–
–
– Comm. Statistics ALT-C
Snapshot F12 Extras/Snapshot
Process Displays Menu
Activity Chart SHIFT-F6 Activity Chart CTL-A
Text Window SHIFT-F5 Process View context menu
Timeline SHIFT-F7 Timeline CTL-T
– Call Tree CTL-L
Table 3.1 Changes in Vampir menus and keyboard shortcuts
The very first apparent difference is the appearance of the Vampir main window and the modified mainmenu bar. Several menu items have been renamed or moved, to make the menu structure comply tothe logical structure of the tool. Table 3.1 lists the most important menu changes.
In addition, several Vampir 1.0 keyboard shortcuts had used function keys like F12 which don't workproperly in some Motif environments. All these shortcuts have been altered to use ALT or CTLprefixes. Please refer to Table 3.1 for a detailed list of changes.

Vampir 2.0 Transition Guide
19
All entries of the Vamipr 1.0 menu Settings have been rearranged into several submenus and dialogsaccessible with the new Preferences menu, or into the context menu of the displays affected by thesettings. Please refer to Table 3.2 for a detailed list of changes.
Vampir 1.0 Menu Entry Corresponding Vampir 2.0 Menu EntrySettings/Stepping Process View Context/Animation ParamsSettings/Node Main Display Process View Context/StatisticsSettings/Node Layout Process View Context/LayoutSettings/Color Translation Process View Context/Color Translation
Settings/ColorsPreferences/Activities/ColorsPreferences/Colors/Activities
Settings/Color Mode Preferences/Colors/ModeSettings/Desktop Colors Preferences/Colors/DesktopSettings/Edit File Links Preferences/Tracefile/External Converters
Table 3.2 Changes in the Vampir configuration menu
The dialogs invoked by the old menu items Settings/Properties and Settings/Timeline Default havebeen completely redesigned and are now available from the Preferences/Display submenu. Pleaserefer to sections A.5.5 and A.3.7 for a detailed description of these options.
Because the old menus Moves and Marker had been intended to be used in conjunction with theGlobal Displays/Process View only, they have been moved to be accessible from the Process Viewdisplay. In particular, the time–movement functions from the Moves menu are now available asbuttons in the Process View display, and the main window scrollbar has been moved into that display,too. The marker functions can now be found in the Process View context menu. The „quick” markershave been removed altogether.
The menu items Nodes and Jobs of the old Filter main menu are now accessible from the GlobalDisplays menu as entries Filter Processes and Filter Jobs. This change was necessary becausethese filter functions affect all global displays. Generally, the menu entries of filter functions are onlyvisible if job or process definitions are actually present in the currently loaded tracefile. If, for instance,a VAMPIRtrace tracefile has been loaded, the Filter Jobs entry will not be visible, becauseVAMPIRtrace does not define jobs in the tracefile.
The former Filter/Messages entry has been relocated into the Preferences/Messages submenu andrenamed Display Style to indicate its function.
The Vampir 1.0 menu Misc has been renamed to Extras. Table 3.3 shows the new locations andnames of the former Misc menu entries.
Vampir 1.0 Misc Menu Entry Corresponding Vampir 2.0 Menu EntryMisc/Symbol List Preferences/Activities/Symbol GroupingMisc/Font List Preferences/FontsMisc/Message Window Extras/Error LogMisc/Message Passing List Extras/Pending Messages
Table 3.3 Changes in Vampir Misc menu
The default configuration of Vampir 2.0 includes a number of changes that streamline the Vampirusage:
Vampir 2.0 Transition Guide
20
• The Complete History function of Vampir 1.0 (F2 shortcut) is invoked automatically when theloading of a tracefile has been completed or interrupted; with Vampir 2.0, the function is onlyuseful in conjunction with the Process View display, and has therefore been moved to itscontext menu.
• The Timeline display is popped–up automatically when a tracefile has been read or theloading has been interrupted; you can change this with the Timeline Preferences dialogdescribed in section A.5.5.
• For all statistic displays, the Use Timeline Portion option is enabled, limiting the statistics tothe time interval shown in the Timeline display. This can be controlled with the GeneralPreferences dialog detailed in section A.5.5.
• The MPI activity is by default shown in the parallelism part of the Timeline display. This can bechanged with the Timeline Preferences dialog described in section A.5.5.
Vampir 2.0 Transition Guide
21
A.2 New Displays in Vampir 2.0
Vampir 2.0 features a number of altogether new visualization displays: the Summaric Chart displayshows global profiling information, the local and global Call Tree displays present the dynamic callingtree, the Source Code display shows the program source associated with states or messages, andthe Length Statistic finally shows the distribution of message lengths or tags.
This section gives a a brief explanation of each new display. For a complete discussion, please referto the appropriate sections in chapter 4.
A.2.1 Summaric Chart Display
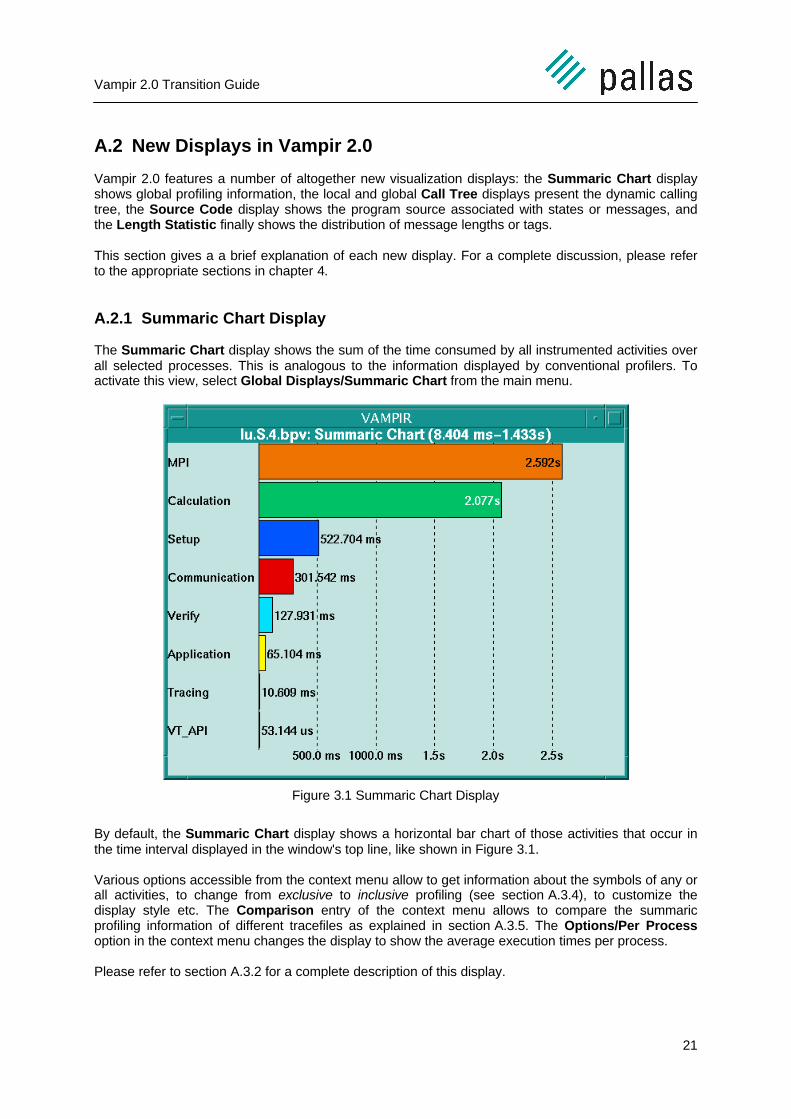
The Summaric Chart display shows the sum of the time consumed by all instrumented activities overall selected processes. This is analogous to the information displayed by conventional profilers. Toactivate this view, select Global Displays/Summaric Chart from the main menu.
Figure 3.1 Summaric Chart Display
By default, the Summaric Chart display shows a horizontal bar chart of those activities that occur inthe time interval displayed in the window's top line, like shown in Figure 3.1.
Various options accessible from the context menu allow to get information about the symbols of any orall activities, to change from exclusive to inclusive profiling (see section A.3.4), to customize thedisplay style etc. The Comparison entry of the context menu allows to compare the summaricprofiling information of different tracefiles as explained in section A.3.5. The Options/Per Processoption in the context menu changes the display to show the average execution times per process.
Please refer to section A.3.2 for a complete description of this display.
Vampir 2.0 Transition Guide
22
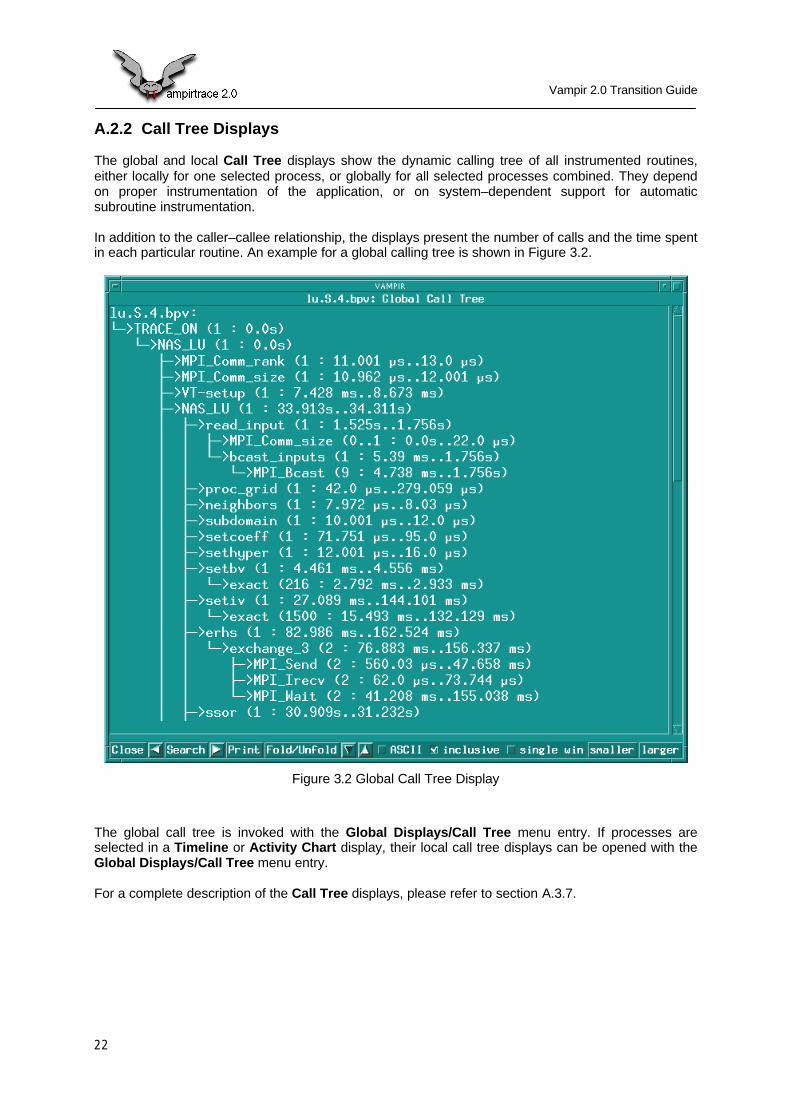
A.2.2 Call Tree Displays
The global and local Call Tree displays show the dynamic calling tree of all instrumented routines,either locally for one selected process, or globally for all selected processes combined. They dependon proper instrumentation of the application, or on system–dependent support for automaticsubroutine instrumentation.
In addition to the caller–callee relationship, the displays present the number of calls and the time spentin each particular routine. An example for a global calling tree is shown in Figure 3.2.
Figure 3.2 Global Call Tree Display
The global call tree is invoked with the Global Displays/Call Tree menu entry. If processes areselected in a Timeline or Activity Chart display, their local call tree displays can be opened with theGlobal Displays/Call Tree menu entry.
For a complete description of the Call Tree displays, please refer to section A.3.7.
Vampir 2.0 Transition Guide
23
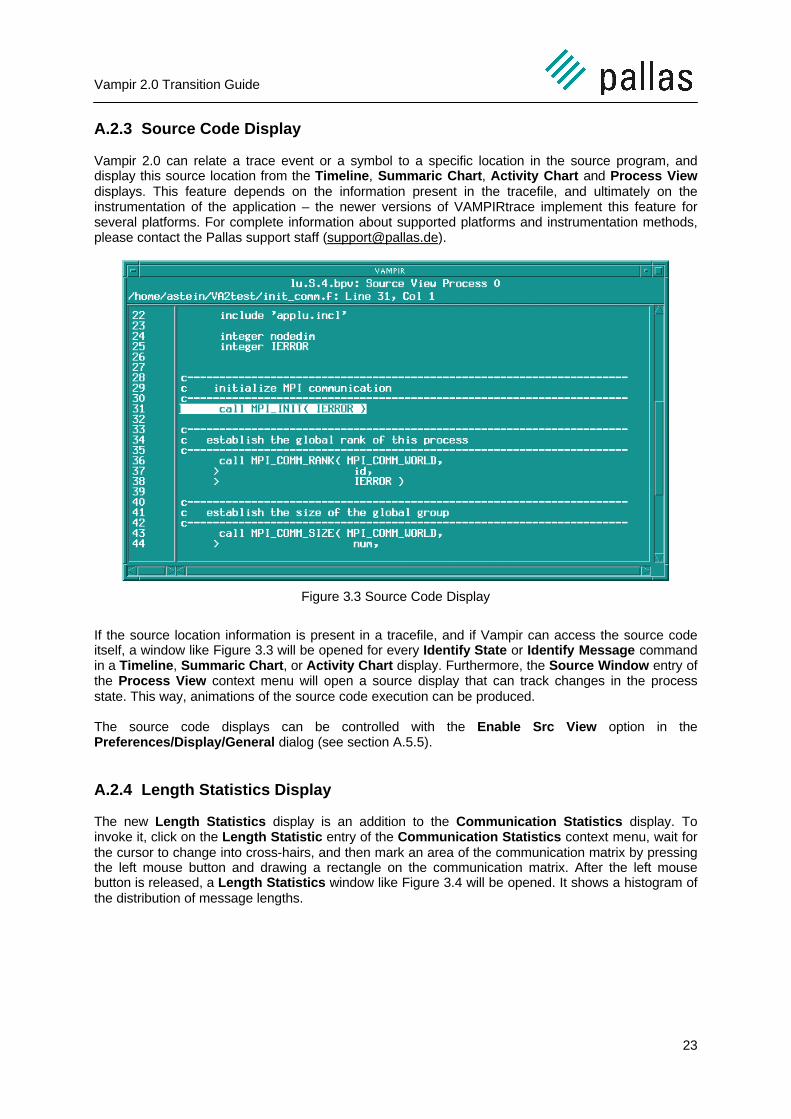
A.2.3 Source Code Display
Vampir 2.0 can relate a trace event or a symbol to a specific location in the source program, anddisplay this source location from the Timeline, Summaric Chart, Activity Chart and Process Viewdisplays. This feature depends on the information present in the tracefile, and ultimately on theinstrumentation of the application – the newer versions of VAMPIRtrace implement this feature forseveral platforms. For complete information about supported platforms and instrumentation methods,please contact the Pallas support staff ([email protected]).
Figure 3.3 Source Code Display
If the source location information is present in a tracefile, and if Vampir can access the source codeitself, a window like Figure 3.3 will be opened for every Identify State or Identify Message commandin a Timeline, Summaric Chart, or Activity Chart display. Furthermore, the Source Window entry ofthe Process View context menu will open a source display that can track changes in the processstate. This way, animations of the source code execution can be produced.
The source code displays can be controlled with the Enable Src View option in thePreferences/Display/General dialog (see section A.5.5).
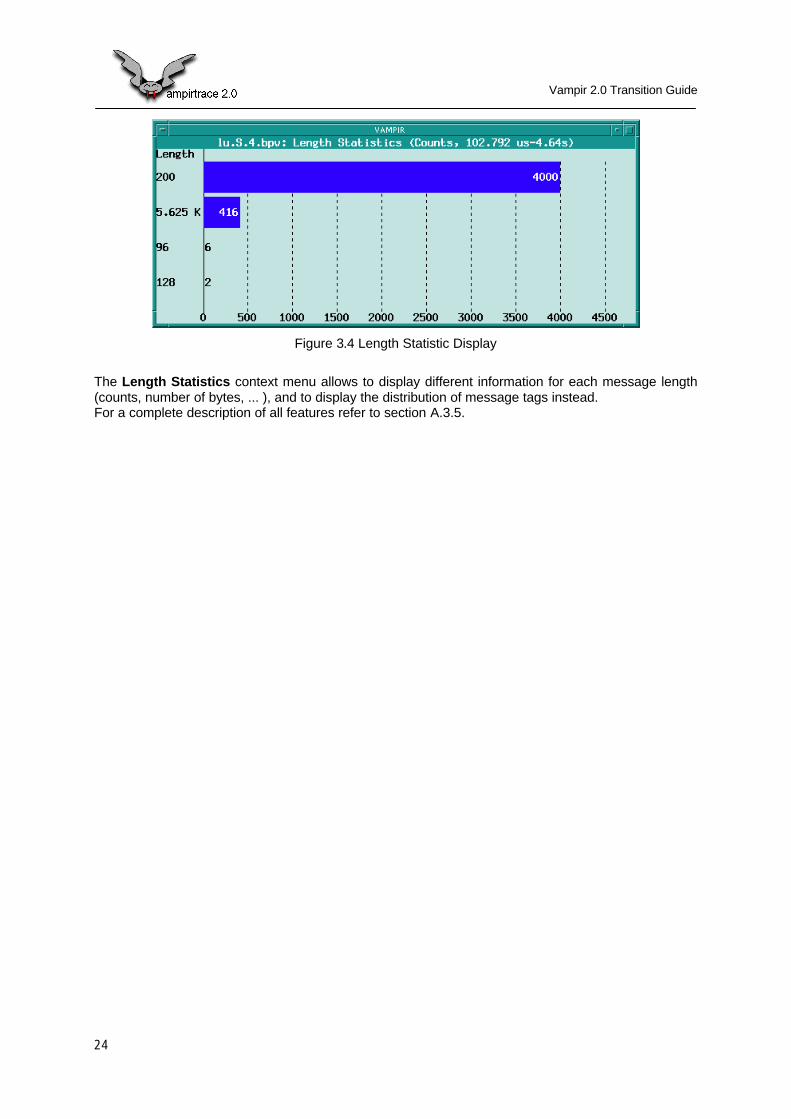
A.2.4 Length Statistics Display
The new Length Statistics display is an addition to the Communication Statistics display. Toinvoke it, click on the Length Statistic entry of the Communication Statistics context menu, wait forthe cursor to change into cross-hairs, and then mark an area of the communication matrix by pressingthe left mouse button and drawing a rectangle on the communication matrix. After the left mousebutton is released, a Length Statistics window like Figure 3.4 will be opened. It shows a histogram ofthe distribution of message lengths.
Vampir 2.0 Transition Guide
24
Figure 3.4 Length Statistic Display
The Length Statistics context menu allows to display different information for each message length(counts, number of bytes, ... ), and to display the distribution of message tags instead.For a complete description of all features refer to section A.3.5.
Vampir 2.0 Transition Guide
25
A.3 New Functionality
Apart from the new displays described above, Vampir 2.0 features a number of new functions thathave been added to existing displays or menus. This section will explain the most important of thosenew functions.
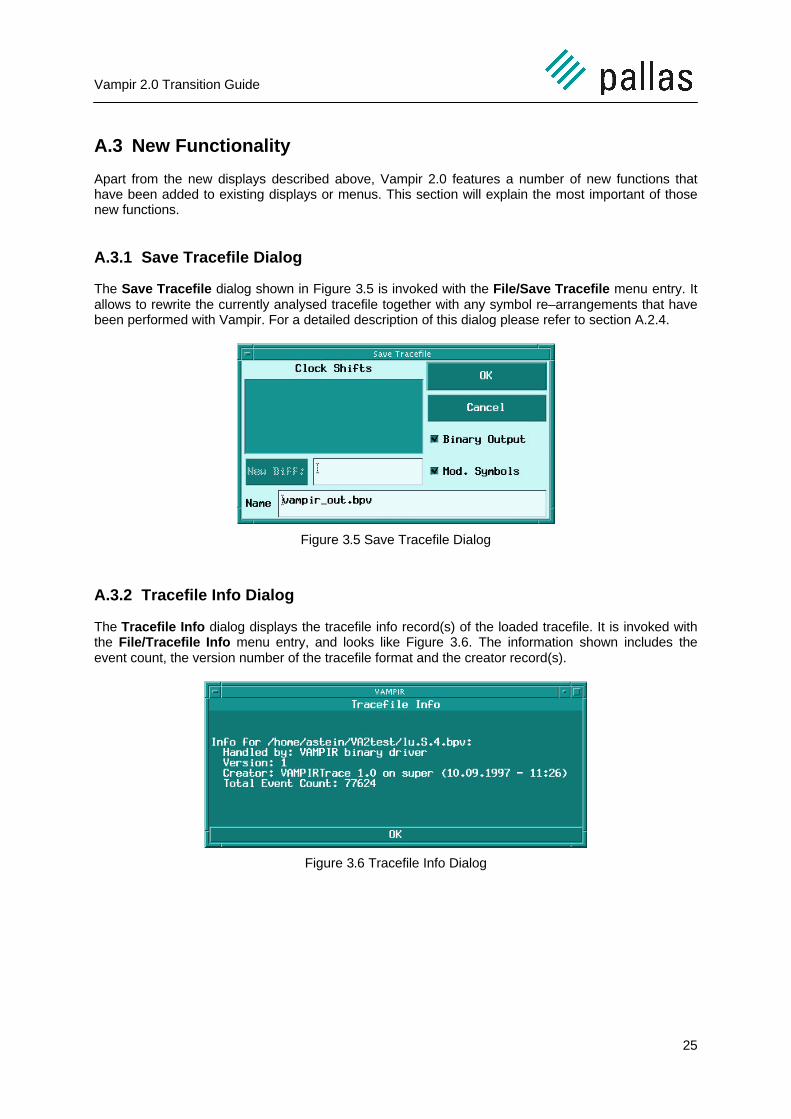
A.3.1 Save Tracefile Dialog
The Save Tracefile dialog shown in Figure 3.5 is invoked with the File/Save Tracefile menu entry. Itallows to rewrite the currently analysed tracefile together with any symbol re–arrangements that havebeen performed with Vampir. For a detailed description of this dialog please refer to section A.2.4.
Figure 3.5 Save Tracefile Dialog
A.3.2 Tracefile Info Dialog
The Tracefile Info dialog displays the tracefile info record(s) of the loaded tracefile. It is invoked withthe File/Tracefile Info menu entry, and looks like Figure 3.6. The information shown includes theevent count, the version number of the tracefile format and the creator record(s).
Figure 3.6 Tracefile Info Dialog
Vampir 2.0 Transition Guide
26
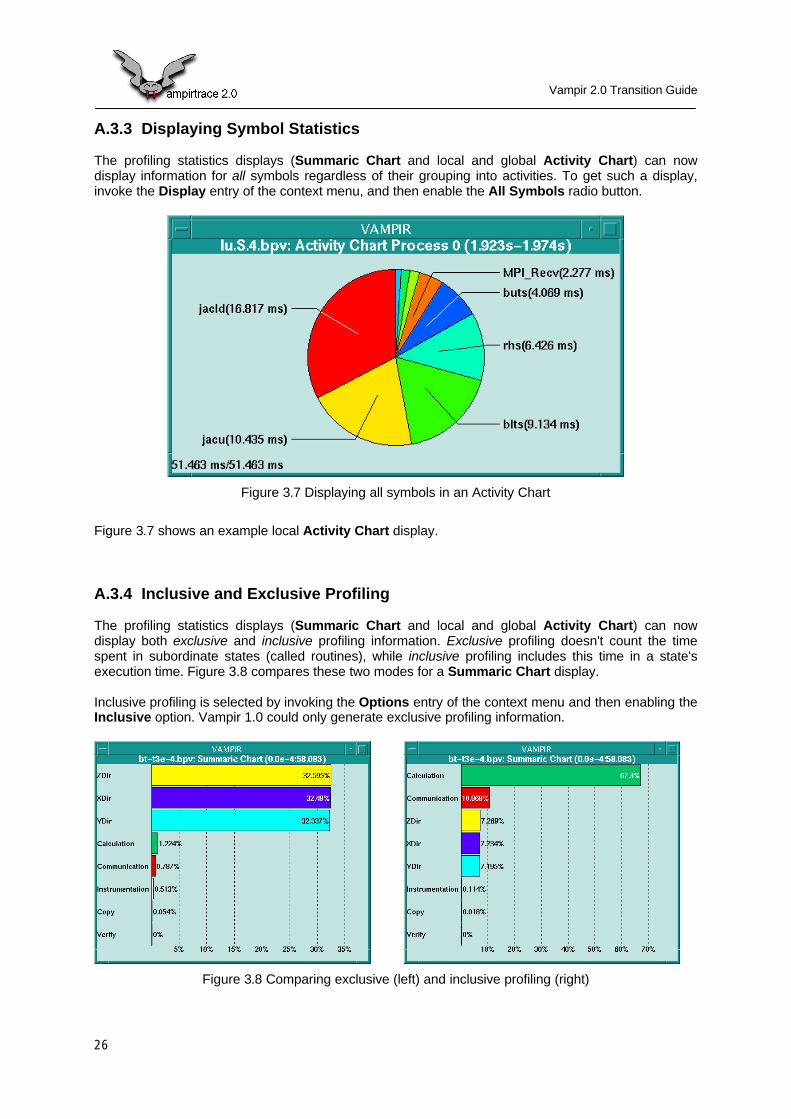
A.3.3 Displaying Symbol Statistics
The profiling statistics displays (Summaric Chart and local and global Activity Chart) can nowdisplay information for all symbols regardless of their grouping into activities. To get such a display,invoke the Display entry of the context menu, and then enable the All Symbols radio button.
Figure 3.7 Displaying all symbols in an Activity Chart
Figure 3.7 shows an example local Activity Chart display.
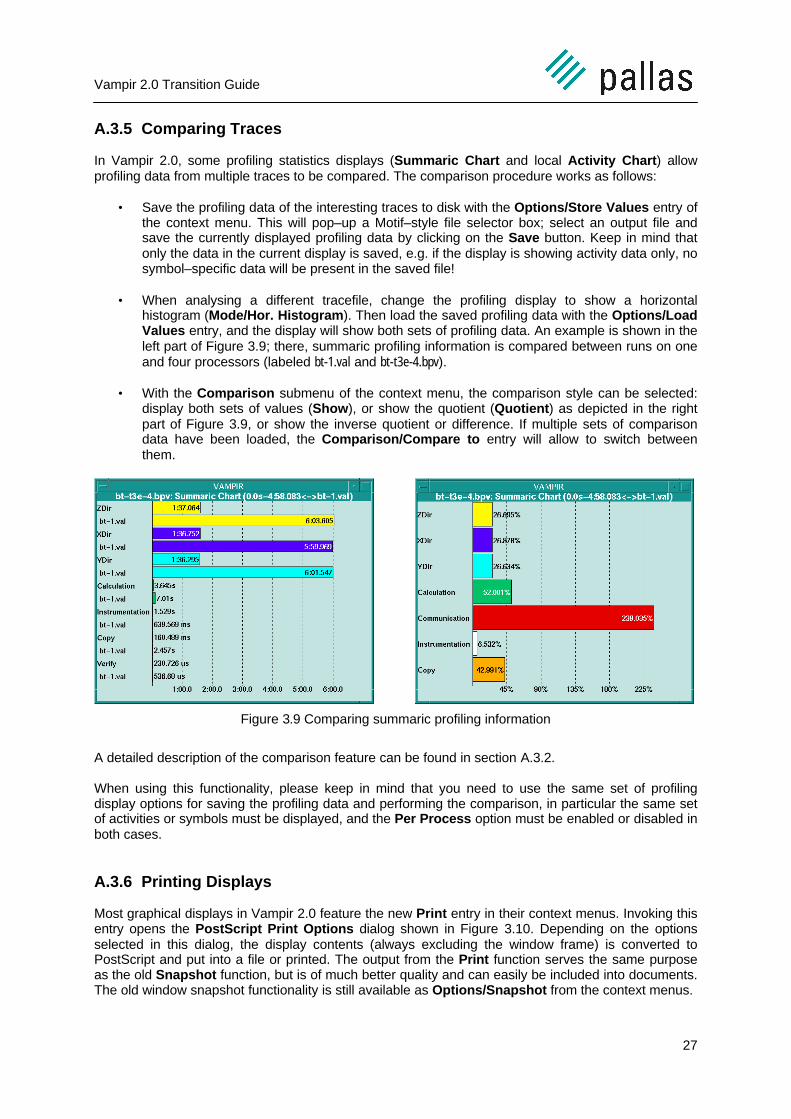
A.3.4 Inclusive and Exclusive Profiling
The profiling statistics displays (Summaric Chart and local and global Activity Chart) can nowdisplay both exclusive and inclusive profiling information. Exclusive profiling doesn't count the timespent in subordinate states (called routines), while inclusive profiling includes this time in a state'sexecution time. Figure 3.8 compares these two modes for a Summaric Chart display.
Inclusive profiling is selected by invoking the Options entry of the context menu and then enabling theInclusive option. Vampir 1.0 could only generate exclusive profiling information.
Figure 3.8 Comparing exclusive (left) and inclusive profiling (right)
Vampir 2.0 Transition Guide
27
A.3.5 Comparing Traces
In Vampir 2.0, some profiling statistics displays (Summaric Chart and local Activity Chart) allowprofiling data from multiple traces to be compared. The comparison procedure works as follows:
• Save the profiling data of the interesting traces to disk with the Options/Store Values entry ofthe context menu. This will pop–up a Motif–style file selector box; select an output file andsave the currently displayed profiling data by clicking on the Save button. Keep in mind thatonly the data in the current display is saved, e.g. if the display is showing activity data only, nosymbol–specific data will be present in the saved file!
• When analysing a different tracefile, change the profiling display to show a horizontalhistogram (Mode/Hor. Histogram). Then load the saved profiling data with the Options/LoadValues entry, and the display will show both sets of profiling data. An example is shown in theleft part of Figure 3.9; there, summaric profiling information is compared between runs on oneand four processors (labeled bt-1.val and bt-t3e-4.bpv).
• With the Comparison submenu of the context menu, the comparison style can be selected:display both sets of values (Show), or show the quotient (Quotient) as depicted in the rightpart of Figure 3.9, or show the inverse quotient or difference. If multiple sets of comparisondata have been loaded, the Comparison/Compare to entry will allow to switch betweenthem.
Figure 3.9 Comparing summaric profiling information
A detailed description of the comparison feature can be found in section A.3.2.
When using this functionality, please keep in mind that you need to use the same set of profilingdisplay options for saving the profiling data and performing the comparison, in particular the same setof activities or symbols must be displayed, and the Per Process option must be enabled or disabled inboth cases.
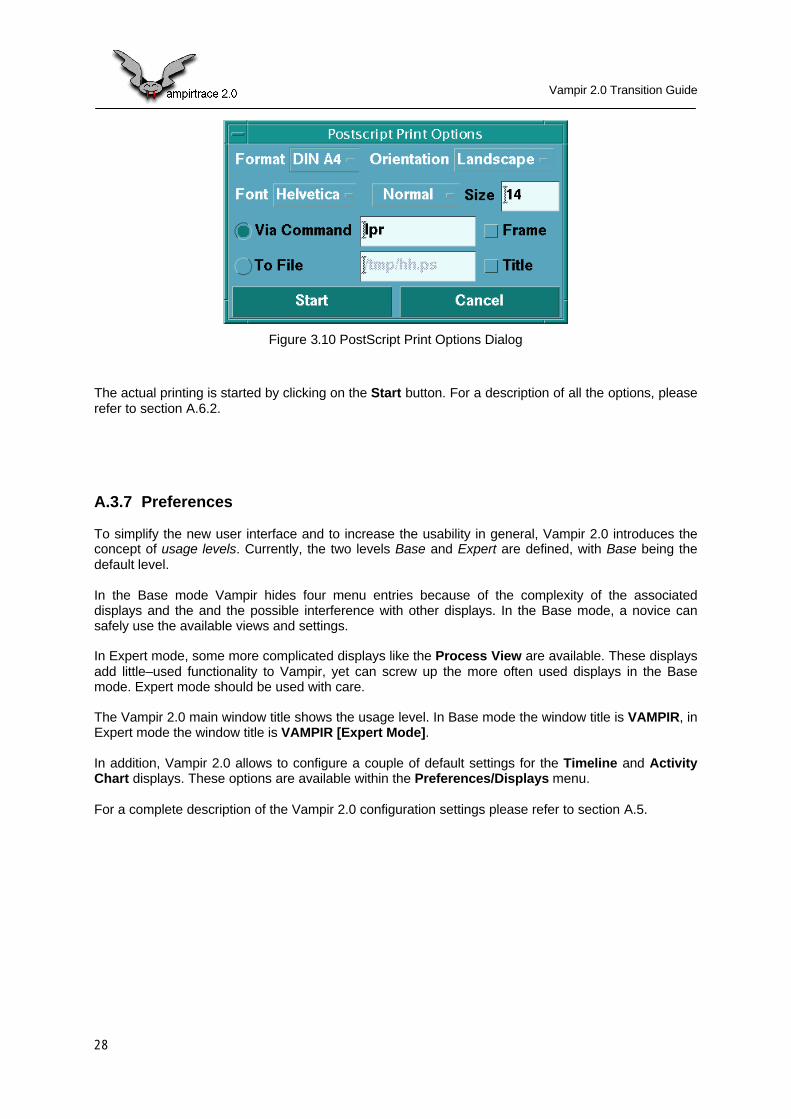
A.3.6 Printing Displays
Most graphical displays in Vampir 2.0 feature the new Print entry in their context menus. Invoking thisentry opens the PostScript Print Options dialog shown in Figure 3.10. Depending on the optionsselected in this dialog, the display contents (always excluding the window frame) is converted toPostScript and put into a file or printed. The output from the Print function serves the same purposeas the old Snapshot function, but is of much better quality and can easily be included into documents.The old window snapshot functionality is still available as Options/Snapshot from the context menus.
Vampir 2.0 Transition Guide
28
Figure 3.10 PostScript Print Options Dialog
The actual printing is started by clicking on the Start button. For a description of all the options, pleaserefer to section A.6.2.
A.3.7 Preferences
To simplify the new user interface and to increase the usability in general, Vampir 2.0 introduces theconcept of usage levels. Currently, the two levels Base and Expert are defined, with Base being thedefault level.
In the Base mode Vampir hides four menu entries because of the complexity of the associateddisplays and the and the possible interference with other displays. In the Base mode, a novice cansafely use the available views and settings.
In Expert mode, some more complicated displays like the Process View are available. These displaysadd little–used functionality to Vampir, yet can screw up the more often used displays in the Basemode. Expert mode should be used with care.
The Vampir 2.0 main window title shows the usage level. In Base mode the window title is VAMPIR, inExpert mode the window title is VAMPIR [Expert Mode].
In addition, Vampir 2.0 allows to configure a couple of default settings for the Timeline and ActivityChart displays. These options are available within the Preferences/Displays menu.
For a complete description of the Vampir 2.0 configuration settings please refer to section A.5.

Vampir 2.0 Reference
29
4 Vampir 2.0 Reference
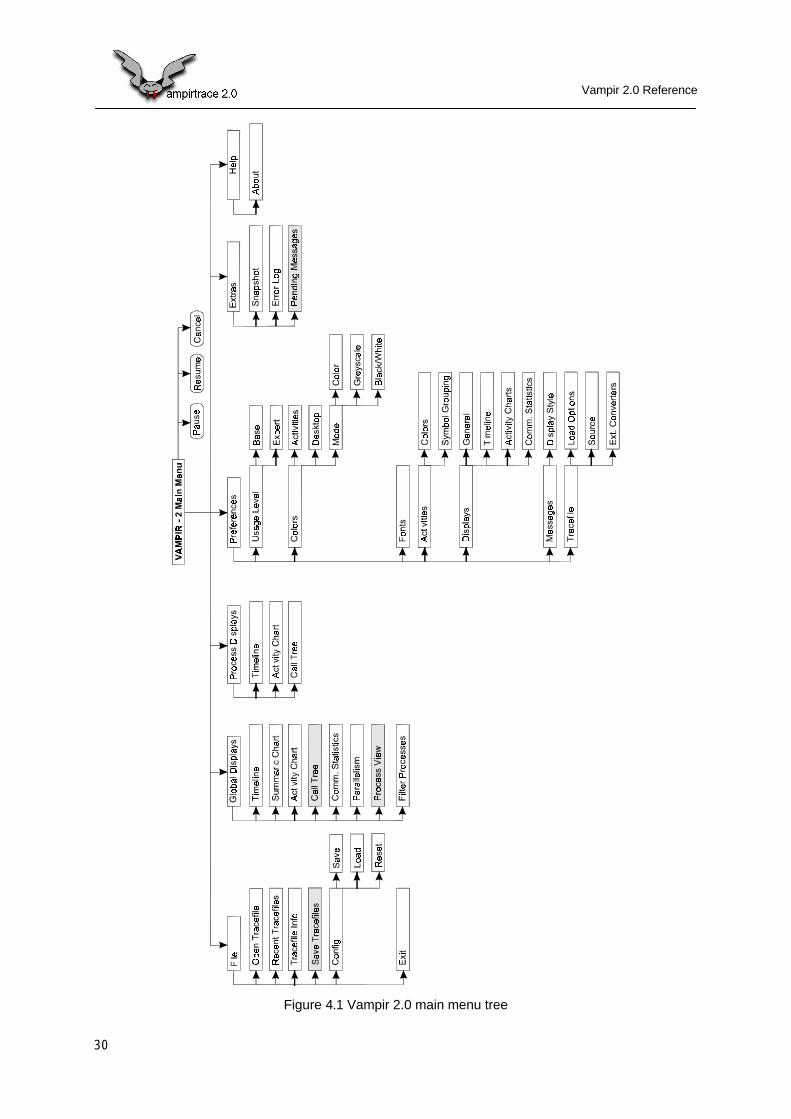
This chapter describes all the menus, dialogs and graphical displays of Vampir 2.0. Figure 4.1 showsthe Vampir main menu tree, with entries that are only available in the expert mode indicated by a greybackground. The various menu entries are discussed in a left–to–right, top–to–bottom fashion startingfrom the main menu bar, with each dialog and graphical display being explained together with themenu entry that invokes it. Descriptions of the various context menus are associated to thediscussions of the graphical displays they're attached to.
The descriptions adhere to a common format: first, a line like
a menu entry ALT-? Expert mode only
specifies the name of the menu entry, the associated keyboard shortcut, if any, and the modes inwhich the corresponding entry is available. Then, the function associated to the menu entry isexplained in one or several paragraphs of normal text and figures. If the menu entry invokes a sub–menu or a dialog box, a table like this
Menu Entry Hotkey Function
Entry 1 ALT-? This is the first entry of the sub-menu
Entry 2 ALT-? This is the second entry of the sub-menu
will specify the entries of the sub–menu, or the fields and buttons of the dialog box. This table is thenfollowed by more text and/or figures giving more detail about the submenu entries. The keyboardshortcuts are always specified using uppercase characters; Vampir treats upper– and lowercasekeyboard shortcuts identically.
For the graphical displays, the associated context menus are described in the same way.
Vampir 2.0 Reference
30
Figure 4.1 Vampir 2.0 main menu tree

Vampir 2.0 Reference
31

Vampir 2.0 Reference
32
A.1 Main Menu Bar
The Vampir 2.0 menu bar (shown in Figure 4.2) gives access to six pull–down menus:
Menu Entry Hotkey Function
File F File manipulation menu: read or write tracefiles and configurationfiles.
Global Displays G Global display menu: open a global display or define the processfilter.
Process Displays R Local display menu: open a display for the marked processes.
Preferences M Preferences menu: change the Vampir 2.0 configuration.
Extras D Extras menu: snapshot, error log and pending messages list.
Help H About dialog.
In addition, the status line at the bottom shows which tracefile has been loaded, if any. Initially, if notracefile has been loaded, the value 0 is displayed as shown in the top of Figure 4.2. While a tracefileis being converted (e.g. uncompressed), the string (conv.) appears instead. During the process ofloading the tracefile, a status bar like in the middle of Figure 4.2 is displayed, and three buttons allowto interrupt the loading process (see section A.1.1 below). The number indicates the current number oftrace records read. As soon as the tracefile has been completely loaded, the status line changes tothe state shown in the bottom of Figure 4.2.
Figure 4.2 Vampir 2.0 main menu bar
Vampir 2.0 Reference
33
A.1.1 Controlling the Tracefile Input
By pressing the Pause button, the reading of a tracefile can be interrupted at any time. Depending onthe setting of the Automatically Show Timeline option in the Timeline Preferences dialog (seesection A.5.5), a timeline display showing the part of the trace already loaded will automatically popup.All Vampir functionality is available for the analysis of this part of the tracefile.
Clicking on the Resume button will resume the tracefile reading; all open displays will be updatedwhen the tracefile has been completely loaded, or when the Pause function button is pressed again.
The Cancel button is active when the tracefile reading has been interrupted; clicking on it will stop thetracefile input process, while keeping the part of the trace already read. The status line will change intothe state shown in the bottom of Figure 4.2.
While a tracefile is being loaded, the mouse should not be moved. Vampir listens for mouse events,and it will interrupt the tracefile reading when it detects that the mouse has been moved. This will slowdown the tracefile input considerably.
Vampir 2.0 Reference
34
A.2 File Menu
The File menu contains all file–related actions of Vampir 2.0:
Menu Entry Hotkey Function
Open Tracefile ALT-O Invoke the Open Tracefiledialog to load an arbitary tracefile.
Recent Tracefiles ALT-R Invoke the Recent Tracefiles dialog to load a previously openedtracefile.
Tracefile Info Display information about the current tracefile.
Save Tracefile Invoke the Save Tracefile dialog to save the current tracefile.
Config Config submenu: load/save/reset the Vampir configuration.
Exit ALT-X Exit from Vampir.
A.2.1 Open Tracefile Dialog
Open Tracefile Dialog ALT-O Base and Expert modes
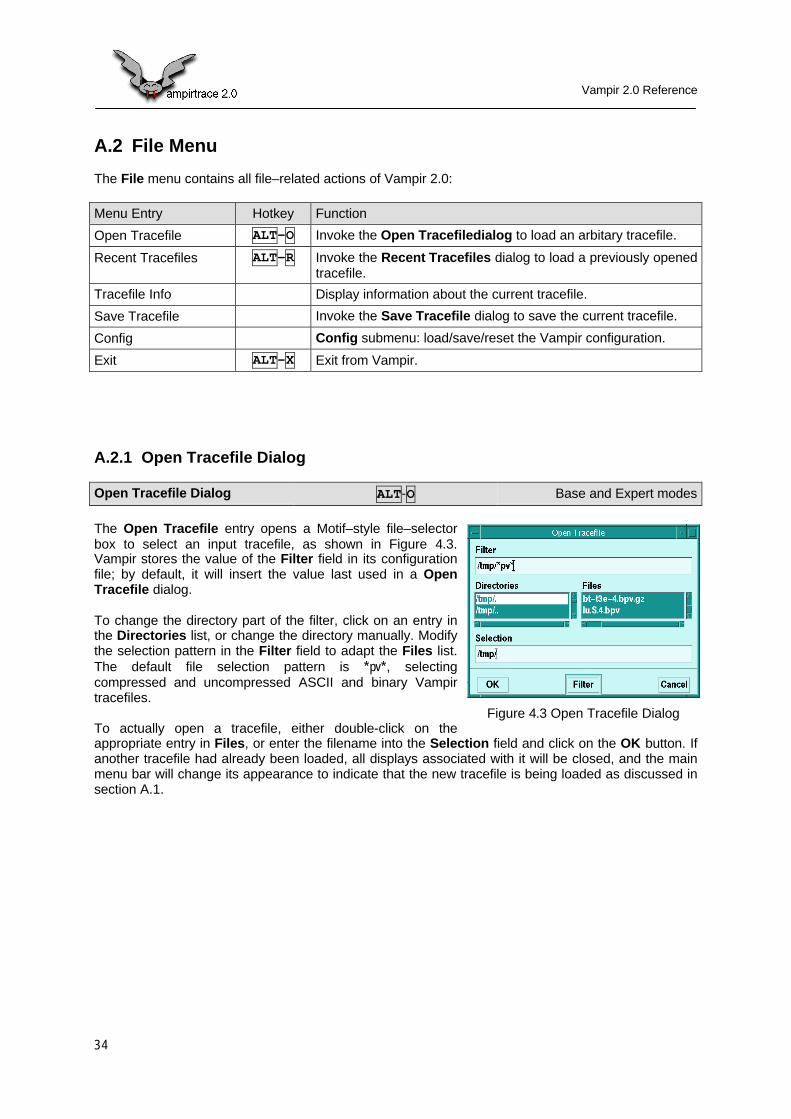
The Open Tracefile entry opens a Motif–style file–selectorbox to select an input tracefile, as shown in Figure 4.3.Vampir stores the value of the Filter field in its configurationfile; by default, it will insert the value last used in a OpenTracefile dialog.
To change the directory part of the filter, click on an entry inthe Directories list, or change the directory manually. Modifythe selection pattern in the Filter field to adapt the Files list.The default file selection pattern is *pv*, selectingcompressed and uncompressed ASCII and binary Vampirtracefiles.
To actually open a tracefile, either double-click on theappropriate entry in Files, or enter the filename into the Selection field and click on the OK button. Ifanother tracefile had already been loaded, all displays associated with it will be closed, and the mainmenu bar will change its appearance to indicate that the new tracefile is being loaded as discussed insection A.1.
Figure 4.3 Open Tracefile Dialog
Vampir 2.0 Reference
35
A.2.2 Recent Tracefiles Dialog
Recent Tracefiles ALT-R Base and Expert modes
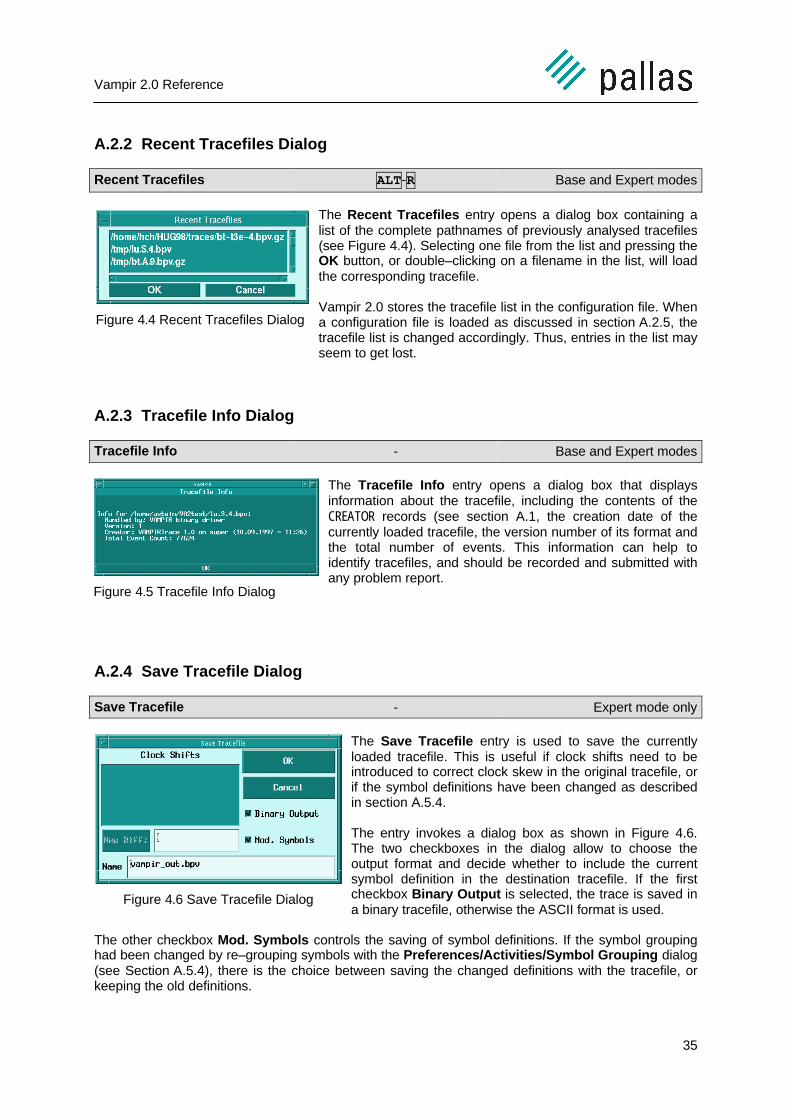
The Recent Tracefiles entry opens a dialog box containing alist of the complete pathnames of previously analysed tracefiles(see Figure 4.4). Selecting one file from the list and pressing theOK button, or double–clicking on a filename in the list, will loadthe corresponding tracefile.
Vampir 2.0 stores the tracefile list in the configuration file. Whena configuration file is loaded as discussed in section A.2.5, thetracefile list is changed accordingly. Thus, entries in the list mayseem to get lost.
A.2.3 Tracefile Info Dialog
Tracefile Info - Base and Expert modes
The Tracefile Info entry opens a dialog box that displaysinformation about the tracefile, including the contents of theCREATOR records (see section A.1, the creation date of thecurrently loaded tracefile, the version number of its format andthe total number of events. This information can help toidentify tracefiles, and should be recorded and submitted withany problem report.
A.2.4 Save Tracefile Dialog
Save Tracefile - Expert mode only
The Save Tracefile entry is used to save the currentlyloaded tracefile. This is useful if clock shifts need to beintroduced to correct clock skew in the original tracefile, orif the symbol definitions have been changed as describedin section A.5.4.
The entry invokes a dialog box as shown in Figure 4.6.The two checkboxes in the dialog allow to choose theoutput format and decide whether to include the currentsymbol definition in the destination tracefile. If the firstcheckbox Binary Output is selected, the trace is saved ina binary tracefile, otherwise the ASCII format is used.
The other checkbox Mod. Symbols controls the saving of symbol definitions. If the symbol groupinghad been changed by re–grouping symbols with the Preferences/Activities/Symbol Grouping dialog(see Section A.5.4), there is the choice between saving the changed definitions with the tracefile, orkeeping the old definitions.
Figure 4.4 Recent Tracefiles Dialog
Figure 4.5 Tracefile Info Dialog
Figure 4.6 Save Tracefile Dialog

Vampir 2.0 Reference
36
The New Diff field and the Clock Shifts list–box are reserved for the metacomputing option of Vampirand are disabled by default.
The name of the new tracefile must be entered into the Name field. Both absolute and relativepathnames are accepted, the latter being interpreted relative to the current working directory.
A.2.5 Config Menu
Config - Base and Expert modes
The Config entry opens a submenu that allows to access Vampir configuration files or reset theconfiguration to factory default settings.
The File/Config submenu contains the following entries:
Menu Entry Hotkey Function
Save S Invoke the Save Config dialog to save the current configuration.
Load L Invoke the Load Config dialog to load a saved Vampirconfiguration from a file.
Reset R Reset the Vampir configuration to factory defaults.
The Config/Save entry invokes a Motif–style file selectorbox like that shown in Figure 4.7. Vampir 2.0 remembers thedirectory last used for accessing a configuration file andautomatically enters it into the Filter field. By selecting anoutput file and clicking OK, or double–clicking on an entry inthe Files box, the current configuration of Vampir is savedinto that file.
The Config/Load entry pops up a similar Motif–style fileselector box; selecting a file and loading it replaces thecurrent configuration with the stored one.
The Config/Reset function restores the factory defaultconfiguration, with the exception of the desktop colors andfonts.
Figure 4.7 Save Config Dialog
Vampir 2.0 Reference
37
A.2.6 Exit
Exit ALT-X Base and Expert modes
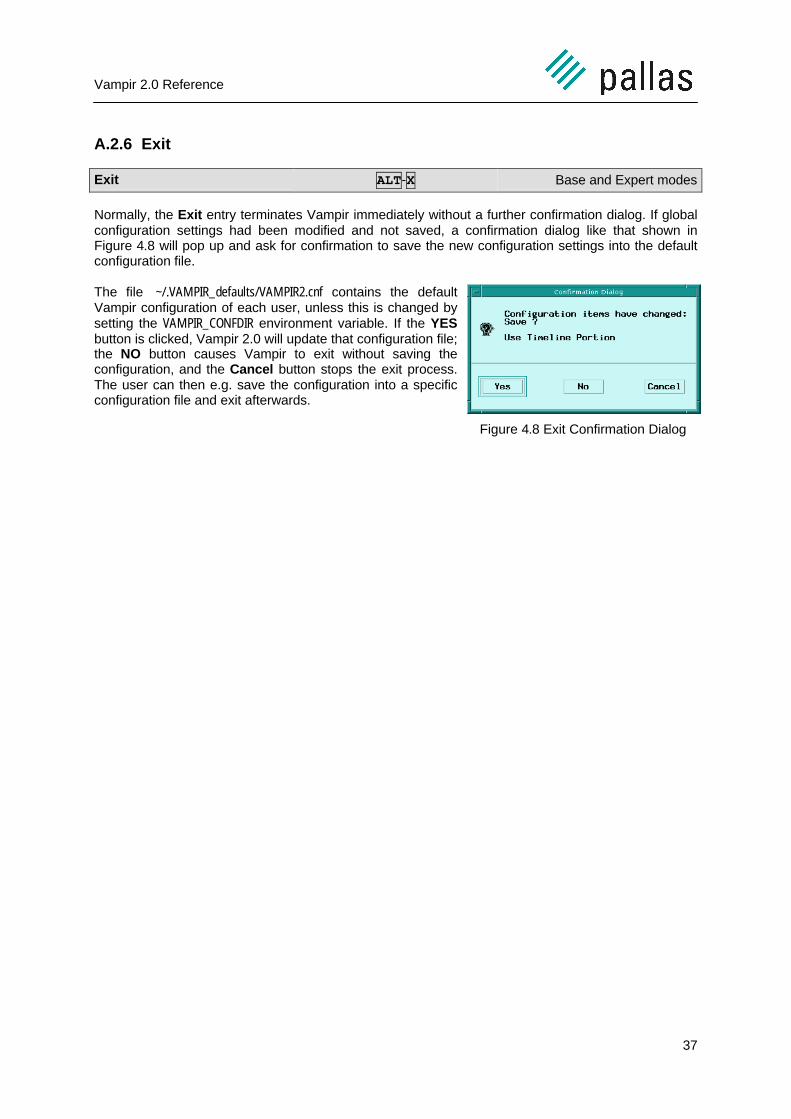
Normally, the Exit entry terminates Vampir immediately without a further confirmation dialog. If globalconfiguration settings had been modified and not saved, a confirmation dialog like that shown inFigure 4.8 will pop up and ask for confirmation to save the new configuration settings into the defaultconfiguration file.
The file ~/.VAMPIR_defaults/VAMPIR2.cnf contains the defaultVampir configuration of each user, unless this is changed bysetting the VAMPIR_CONFDIR environment variable. If the YESbutton is clicked, Vampir 2.0 will update that configuration file;the NO button causes Vampir to exit without saving theconfiguration, and the Cancel button stops the exit process.The user can then e.g. save the configuration into a specificconfiguration file and exit afterwards.
Figure 4.8 Exit Confirmation Dialog
Vampir 2.0 Reference
38
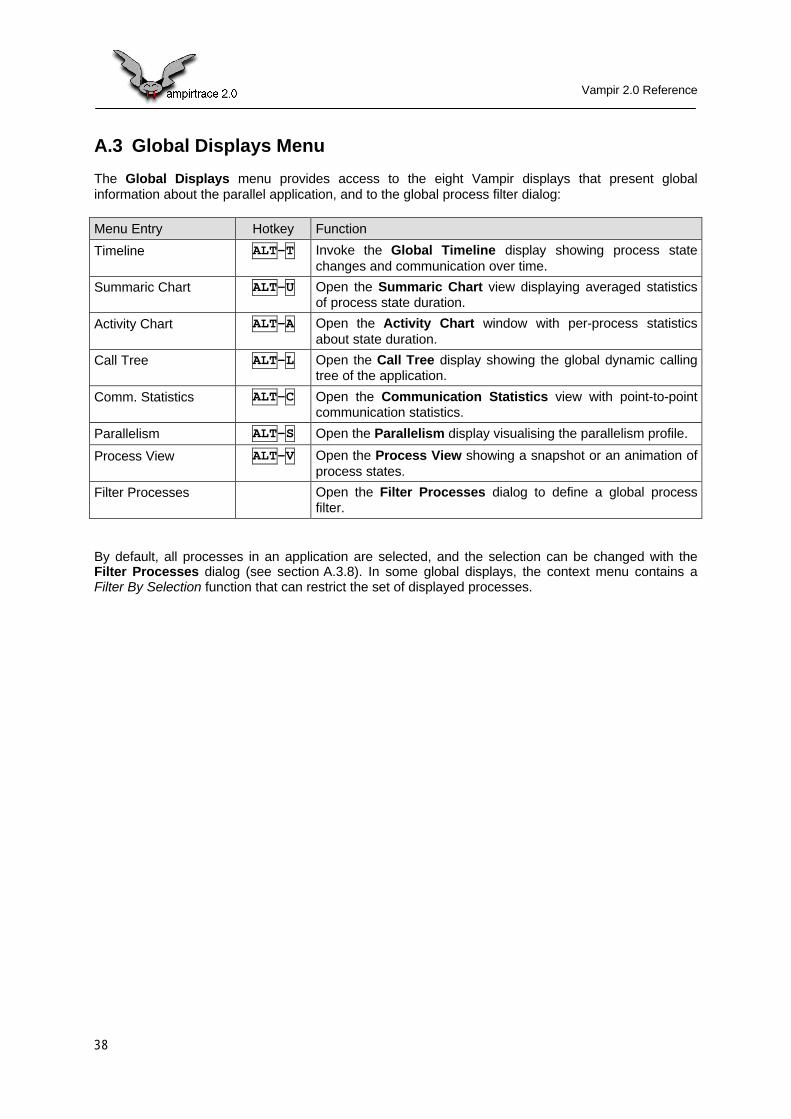
A.3 Global Displays Menu
The Global Displays menu provides access to the eight Vampir displays that present globalinformation about the parallel application, and to the global process filter dialog:
Menu Entry Hotkey Function
Timeline ALT-T Invoke the Global Timeline display showing process statechanges and communication over time.
Summaric Chart ALT-U Open the Summaric Chart view displaying averaged statisticsof process state duration.
Activity Chart ALT-A Open the Activity Chart window with per-process statisticsabout state duration.
Call Tree ALT-L Open the Call Tree display showing the global dynamic callingtree of the application.
Comm. Statistics ALT-C Open the Communication Statistics view with point-to-pointcommunication statistics.
Parallelism ALT-S Open the Parallelism display visualising the parallelism profile.
Process View ALT-V Open the Process View showing a snapshot or an animation ofprocess states.
Filter Processes Open the Filter Processes dialog to define a global processfilter.
By default, all processes in an application are selected, and the selection can be changed with theFilter Processes dialog (see section A.3.8). In some global displays, the context menu contains aFilter By Selection function that can restrict the set of displayed processes.
Vampir 2.0 Reference
39
A.3.1 Global Timeline Display
Global Timeline ALT-T Base and Expert modes
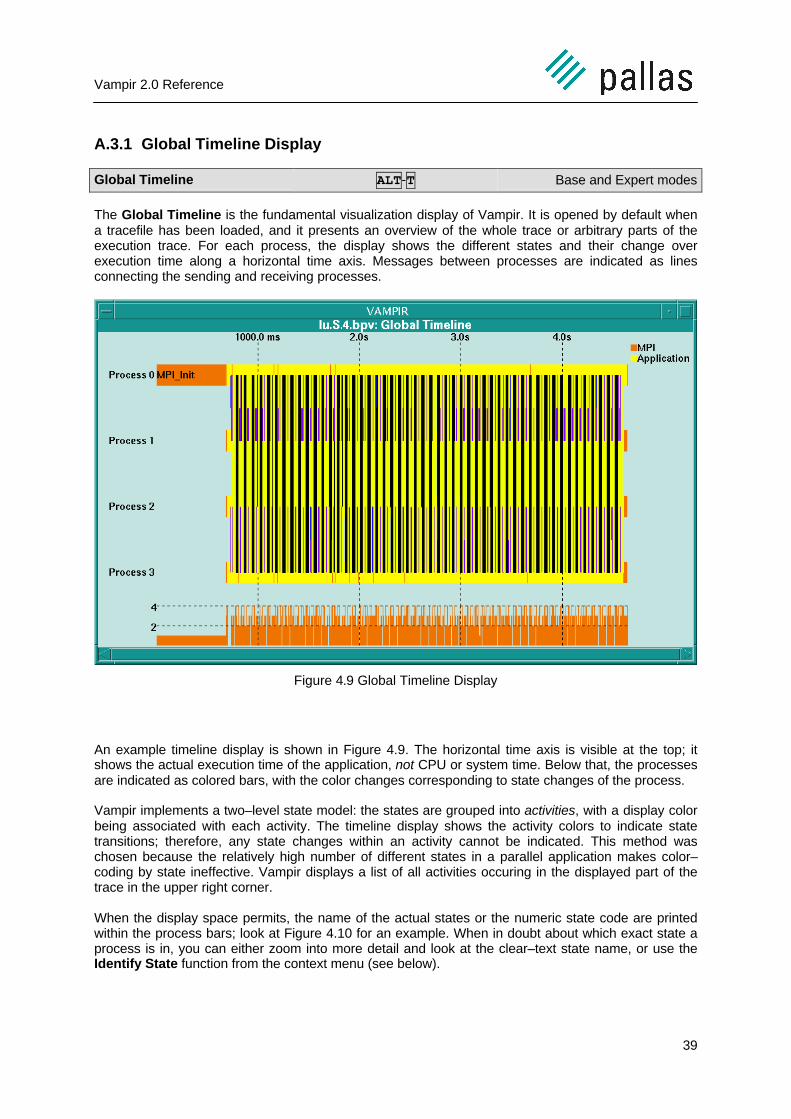
The Global Timeline is the fundamental visualization display of Vampir. It is opened by default whena tracefile has been loaded, and it presents an overview of the whole trace or arbitrary parts of theexecution trace. For each process, the display shows the different states and their change overexecution time along a horizontal time axis. Messages between processes are indicated as linesconnecting the sending and receiving processes.
Figure 4.9 Global Timeline Display
An example timeline display is shown in Figure 4.9. The horizontal time axis is visible at the top; itshows the actual execution time of the application, not CPU or system time. Below that, the processesare indicated as colored bars, with the color changes corresponding to state changes of the process.
Vampir implements a two–level state model: the states are grouped into activities, with a display colorbeing associated with each activity. The timeline display shows the activity colors to indicate statetransitions; therefore, any state changes within an activity cannot be indicated. This method waschosen because the relatively high number of different states in a parallel application makes color–coding by state ineffective. Vampir displays a list of all activities occuring in the displayed part of thetrace in the upper right corner.
When the display space permits, the name of the actual states or the numeric state code are printedwithin the process bars; look at Figure 4.10 for an example. When in doubt about which exact state aprocess is in, you can either zoom into more detail and look at the clear–text state name, or use theIdentify State function from the context menu (see below).
Vampir 2.0 Reference
40
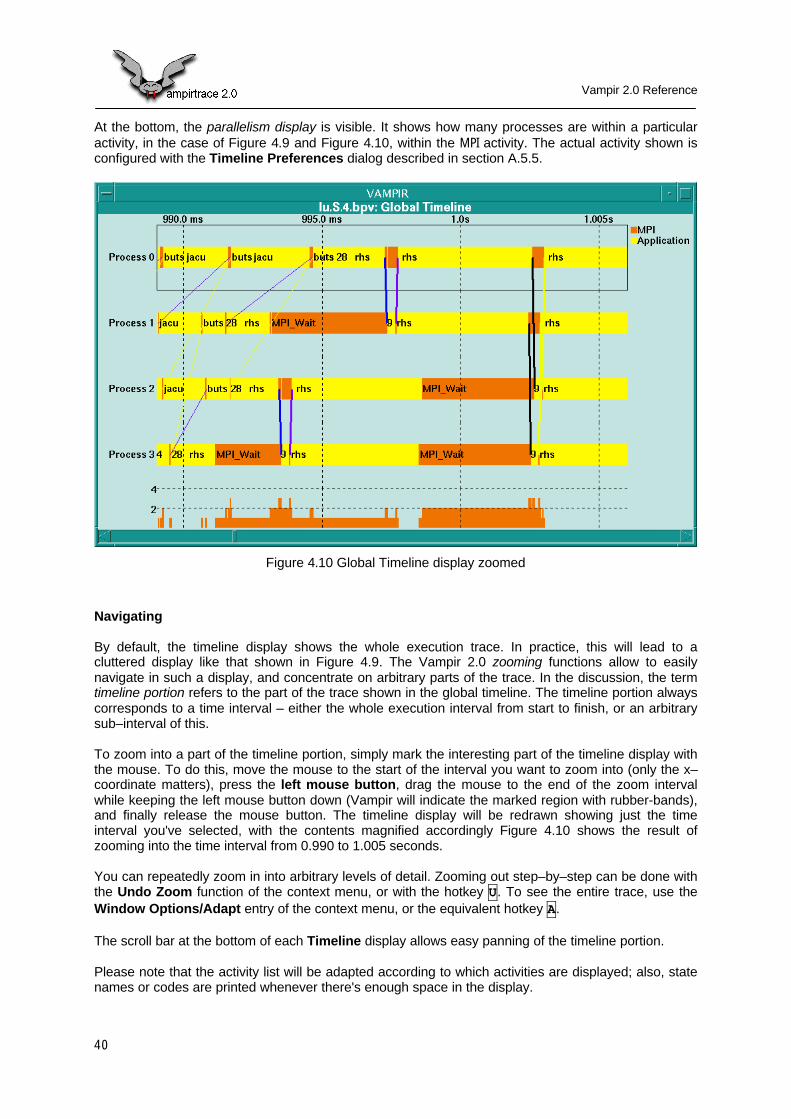
At the bottom, the parallelism display is visible. It shows how many processes are within a particularactivity, in the case of Figure 4.9 and Figure 4.10, within the MPI activity. The actual activity shown isconfigured with the Timeline Preferences dialog described in section A.5.5.
Figure 4.10 Global Timeline display zoomed
Navigating
By default, the timeline display shows the whole execution trace. In practice, this will lead to acluttered display like that shown in Figure 4.9. The Vampir 2.0 zooming functions allow to easilynavigate in such a display, and concentrate on arbitrary parts of the trace. In the discussion, the termtimeline portion refers to the part of the trace shown in the global timeline. The timeline portion alwayscorresponds to a time interval – either the whole execution interval from start to finish, or an arbitrarysub–interval of this.
To zoom into a part of the timeline portion, simply mark the interesting part of the timeline display withthe mouse. To do this, move the mouse to the start of the interval you want to zoom into (only the x–coordinate matters), press the left mouse button, drag the mouse to the end of the zoom intervalwhile keeping the left mouse button down (Vampir will indicate the marked region with rubber-bands),and finally release the mouse button. The timeline display will be redrawn showing just the timeinterval you've selected, with the contents magnified accordingly Figure 4.10 shows the result ofzooming into the time interval from 0.990 to 1.005 seconds.
You can repeatedly zoom in into arbitrary levels of detail. Zooming out step–by–step can be done withthe Undo Zoom function of the context menu, or with the hotkey U. To see the entire trace, use theWindow Options/Adapt entry of the context menu, or the equivalent hotkey A.
The scroll bar at the bottom of each Timeline display allows easy panning of the timeline portion.
Please note that the activity list will be adapted according to which activities are displayed; also, statenames or codes are printed whenever there's enough space in the display.

Vampir 2.0 Reference
41
Message Lines
Point–to–point messages between two processes are shown as lines connecting the sender andreceiver processes; the line starts at the beginning of the send operation at the sender, and ends atthe completion of the receive operation at the receiver. When a message appears to have traveled„backwards”, that is the sending timestamp is later than the receiving timestamp, the message lineblinks by default.
By default, black lines are used as message lines; with the Message Display Style dialog describedin section A.5.6, the display style can be changed depending on the message tag and communicator.
The Filter Messages entry of the context menu specifies a message filter: only a subset of messageswith certain tags and communicators will be displayed.
Selecting Processes
From within the timeline display, processes can be selected or deselected. This is done by clicking theleft mouse button on a process bar to toggle the selection status of this process. A process isselected if a border is drawn around its process bar (as shown for process 0 in Figure 4.10). Click themiddle mouse button to deselect all processes.
For all the selected processes, local displays can be opened at once by invoking the appropriate entryfrom the Process Displays menu. Furthermore, the global process filter can be changed to just showthe selected processes with the Options/Filter by Selection function of the context menu.
The Context Menu
Like all context menus, the Global Timeline context menu is opened by pressing the right mousebutton. Figure 4.11 shows the context menu.
Figure 4.11 Global Timeline context menu
Menu Entry Hotkey Function
Close Q Close the timeline display and all associated subwindows.
Undo Zoom U Undo a single zoom operation.
Ruler R To time a part of the timeline view, select this item and mark theinteresting part by holding the left mouse button down anddragging a rectangle to the desired size. A message boxdisplaying the time represented by the marked region will appear(see Figure 4.12). The cursor changes into „crosshairs” toindicate that the Ruler function is active.

Vampir 2.0 Reference
42
Menu Entry Hotkey Function
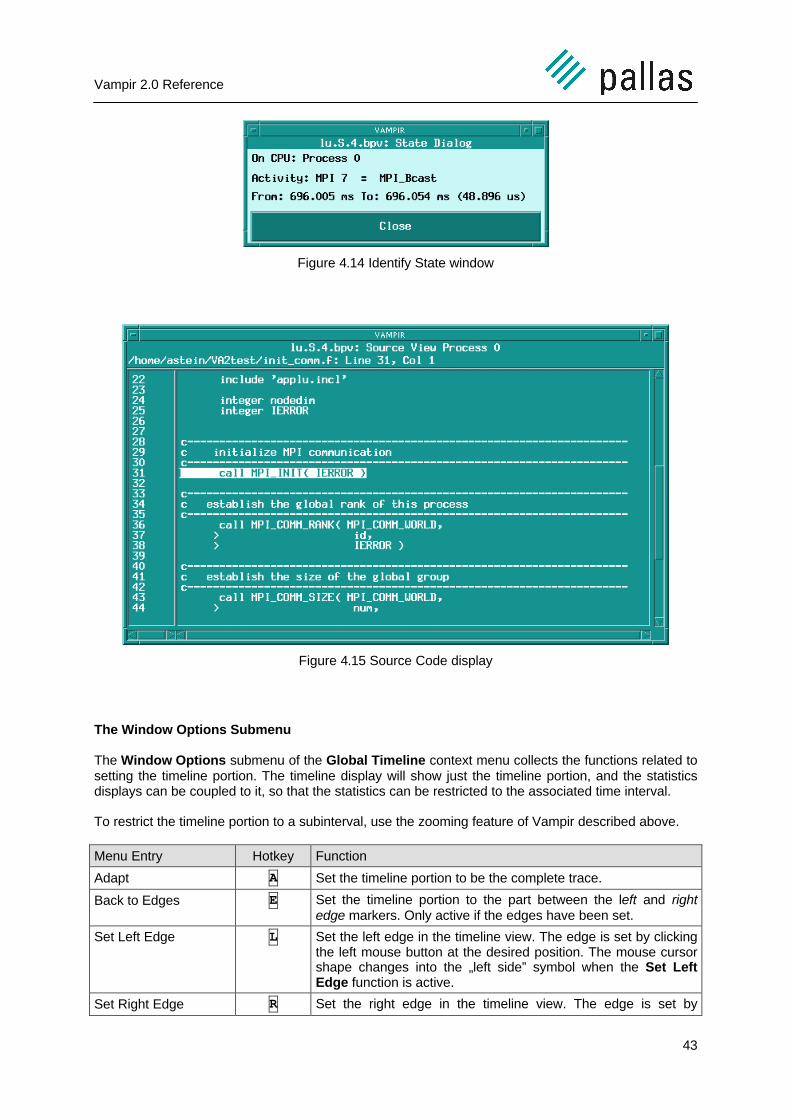
Identify Message M To get detailed information about a specific message, select thisfunction and click with the left mouse button on the messageline. A message box with further information about the selectedmessage will appear (see Figure 4.13). If source codeinformation is available, two source code windows for the sendand receive operations will be opened, with the lines containingthe send and receive being highlighted. See Figure 4.15 for anexample. The cursor changes into „crosshairs” to indicate thatthe Identify Message function is active.
Identify State S To get detailed information about a particular process state,select this function and click with the left mouse button on theprocess bar. A message box with further information about theselected state will appear (see Figure 4.14). If source codeinformation is available, a source code window will be openedwith the corresponding line of code highlighted (see Figure4.15). The cursor changes into „crosshairs” to indicate that theIdentify State function is active.
Window Options Open the Window Options submenu.
Components Open the Components submenu.
Pointer Functions Open the Pointer Function submenu.
Options Open the Options submenu.
Print Invoke the Postscript Print dialog to print the display contents.See section A.6.2 for details.
Figure 4.12 Ruler Information window
Figure 4.13 Identify Message window
Vampir 2.0 Reference
43
Figure 4.14 Identify State window
Figure 4.15 Source Code display
The Window Options Submenu
The Window Options submenu of the Global Timeline context menu collects the functions related tosetting the timeline portion. The timeline display will show just the timeline portion, and the statisticsdisplays can be coupled to it, so that the statistics can be restricted to the associated time interval.
To restrict the timeline portion to a subinterval, use the zooming feature of Vampir described above.
Menu Entry Hotkey Function
Adapt A Set the timeline portion to be the complete trace.
Back to Edges E Set the timeline portion to the part between the left and rightedge markers. Only active if the edges have been set.
Set Left Edge L Set the left edge in the timeline view. The edge is set by clickingthe left mouse button at the desired position. The mouse cursorshape changes into the „left side” symbol when the Set LeftEdge function is active.
Set Right Edge R Set the right edge in the timeline view. The edge is set by
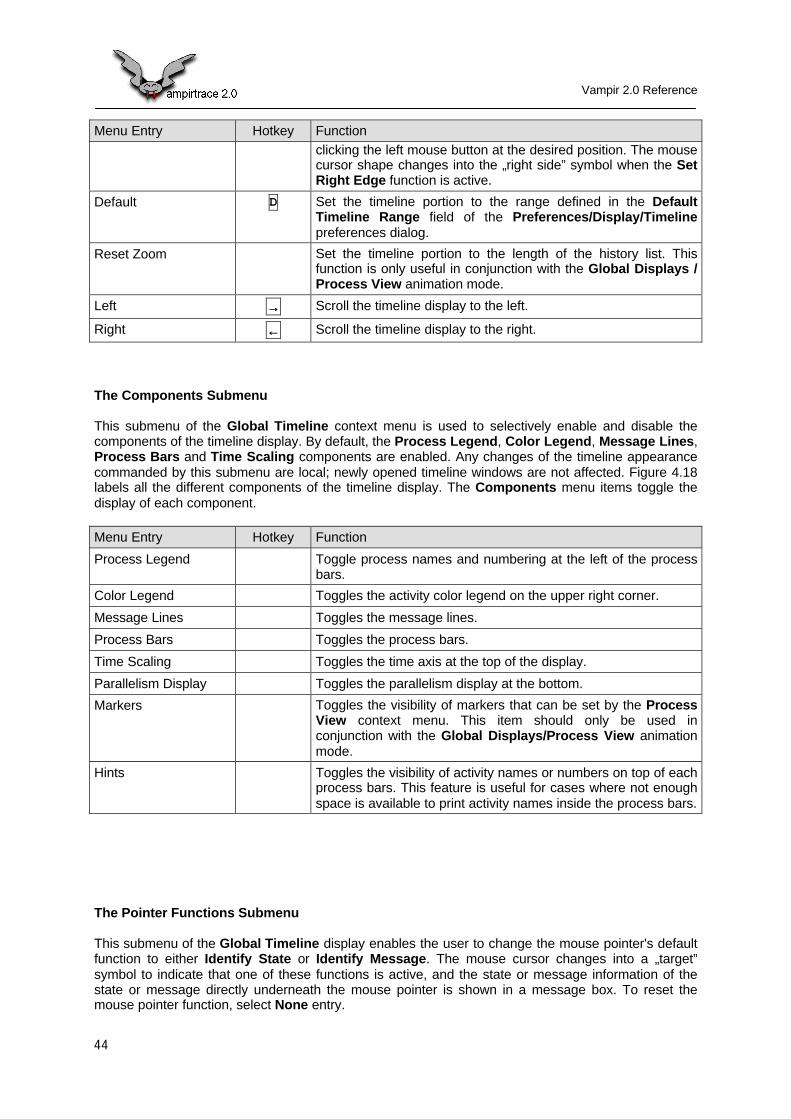
Vampir 2.0 Reference
44
Menu Entry Hotkey Functionclicking the left mouse button at the desired position. The mousecursor shape changes into the „right side” symbol when the SetRight Edge function is active.
Default D Set the timeline portion to the range defined in the DefaultTimeline Range field of the Preferences/Display/Timelinepreferences dialog.
Reset Zoom Set the timeline portion to the length of the history list. Thisfunction is only useful in conjunction with the Global Displays /Process View animation mode.
Left →→ Scroll the timeline display to the left.
Right ←← Scroll the timeline display to the right.
The Components Submenu
This submenu of the Global Timeline context menu is used to selectively enable and disable thecomponents of the timeline display. By default, the Process Legend, Color Legend, Message Lines,Process Bars and Time Scaling components are enabled. Any changes of the timeline appearancecommanded by this submenu are local; newly opened timeline windows are not affected. Figure 4.18labels all the different components of the timeline display. The Components menu items toggle thedisplay of each component.
Menu Entry Hotkey Function
Process Legend Toggle process names and numbering at the left of the processbars.
Color Legend Toggles the activity color legend on the upper right corner.
Message Lines Toggles the message lines.
Process Bars Toggles the process bars.
Time Scaling Toggles the time axis at the top of the display.
Parallelism Display Toggles the parallelism display at the bottom.
Markers Toggles the visibility of markers that can be set by the ProcessView context menu. This item should only be used inconjunction with the Global Displays/Process View animationmode.
Hints Toggles the visibility of activity names or numbers on top of eachprocess bars. This feature is useful for cases where not enoughspace is available to print activity names inside the process bars.
The Pointer Functions Submenu
This submenu of the Global Timeline display enables the user to change the mouse pointer's defaultfunction to either Identify State or Identify Message. The mouse cursor changes into a „target”symbol to indicate that one of these functions is active, and the state or message information of thestate or message directly underneath the mouse pointer is shown in a message box. To reset themouse pointer function, select None entry.
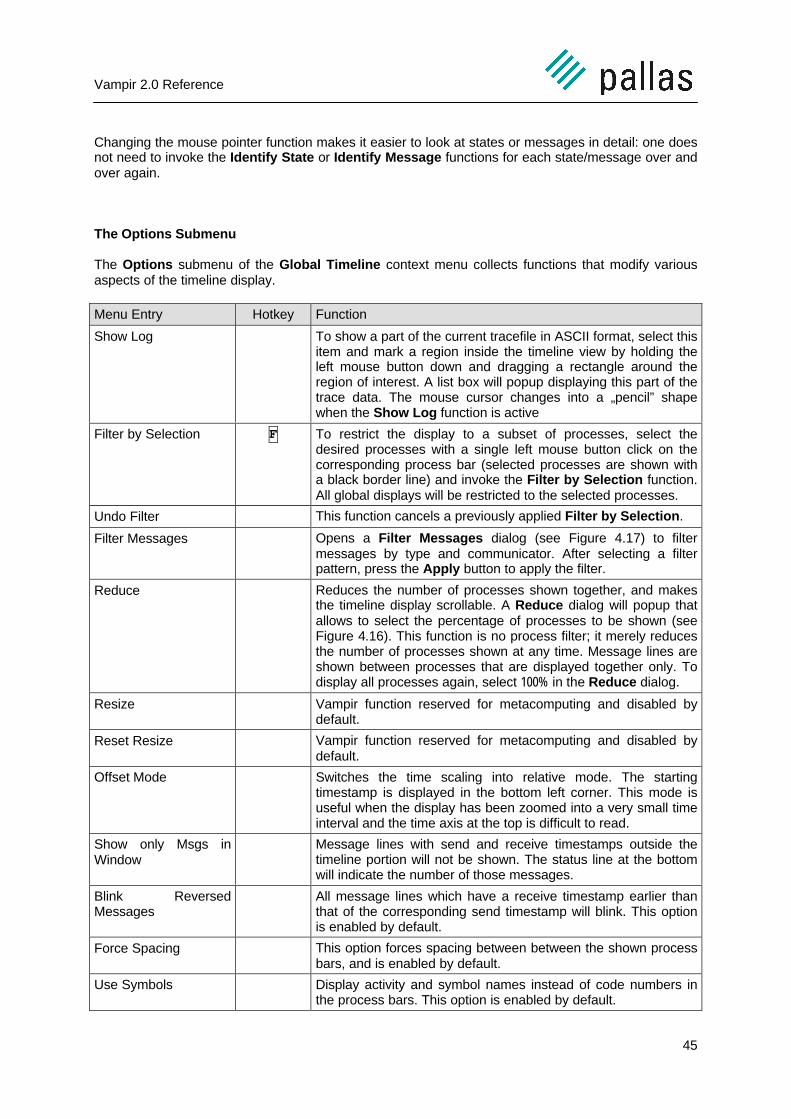
Vampir 2.0 Reference
45
Changing the mouse pointer function makes it easier to look at states or messages in detail: one doesnot need to invoke the Identify State or Identify Message functions for each state/message over andover again.
The Options Submenu
The Options submenu of the Global Timeline context menu collects functions that modify variousaspects of the timeline display.
Menu Entry Hotkey Function
Show Log To show a part of the current tracefile in ASCII format, select thisitem and mark a region inside the timeline view by holding theleft mouse button down and dragging a rectangle around theregion of interest. A list box will popup displaying this part of thetrace data. The mouse cursor changes into a „pencil” shapewhen the Show Log function is active
Filter by Selection F To restrict the display to a subset of processes, select thedesired processes with a single left mouse button click on thecorresponding process bar (selected processes are shown witha black border line) and invoke the Filter by Selection function.All global displays will be restricted to the selected processes.
Undo Filter This function cancels a previously applied Filter by Selection.
Filter Messages Opens a Filter Messages dialog (see Figure 4.17) to filtermessages by type and communicator. After selecting a filterpattern, press the Apply button to apply the filter.
Reduce Reduces the number of processes shown together, and makesthe timeline display scrollable. A Reduce dialog will popup thatallows to select the percentage of processes to be shown (seeFigure 4.16). This function is no process filter; it merely reducesthe number of processes shown at any time. Message lines areshown between processes that are displayed together only. Todisplay all processes again, select 100% in the Reduce dialog.
Resize Vampir function reserved for metacomputing and disabled bydefault.
Reset Resize Vampir function reserved for metacomputing and disabled bydefault.
Offset Mode Switches the time scaling into relative mode. The startingtimestamp is displayed in the bottom left corner. This mode isuseful when the display has been zoomed into a very small timeinterval and the time axis at the top is difficult to read.
Show only Msgs inWindow
Message lines with send and receive timestamps outside thetimeline portion will not be shown. The status line at the bottomwill indicate the number of those messages.
Blink ReversedMessages
All message lines which have a receive timestamp earlier thanthat of the corresponding send timestamp will blink. This optionis enabled by default.
Force Spacing This option forces spacing between between the shown processbars, and is enabled by default.
Use Symbols Display activity and symbol names instead of code numbers inthe process bars. This option is enabled by default.
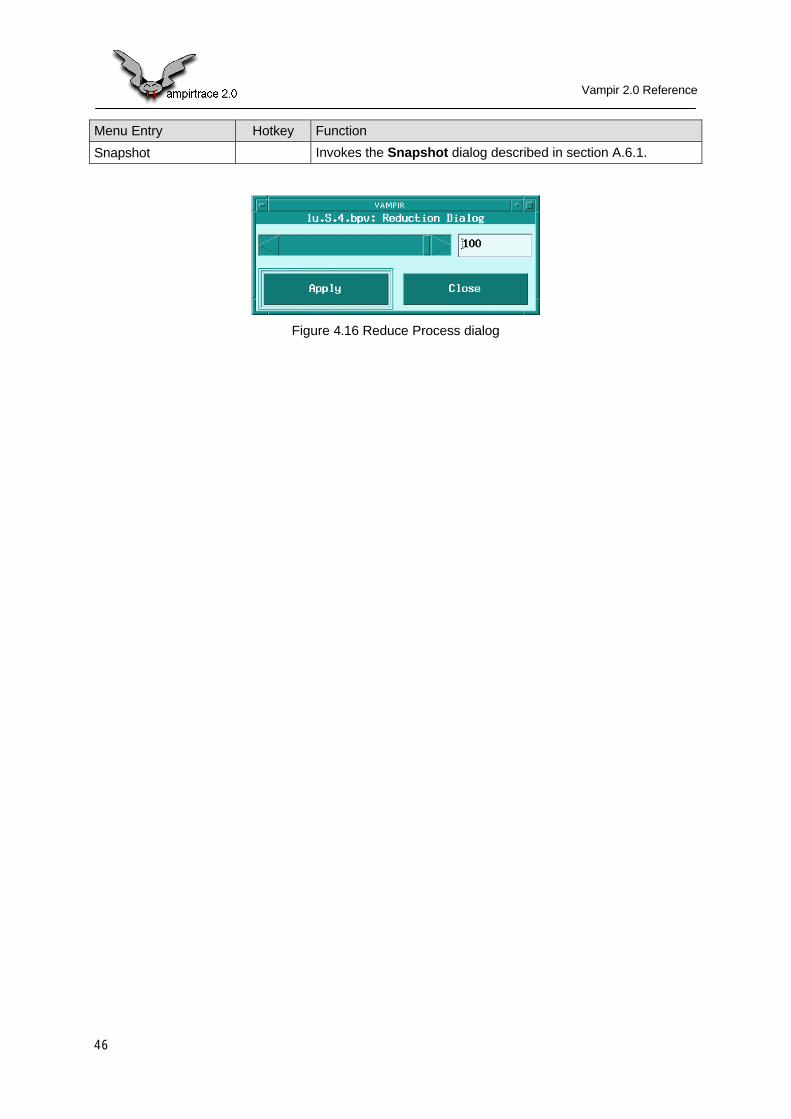
Vampir 2.0 Reference
46
Menu Entry Hotkey Function
Snapshot Invokes the Snapshot dialog described in section A.6.1.
Figure 4.16 Reduce Process dialog
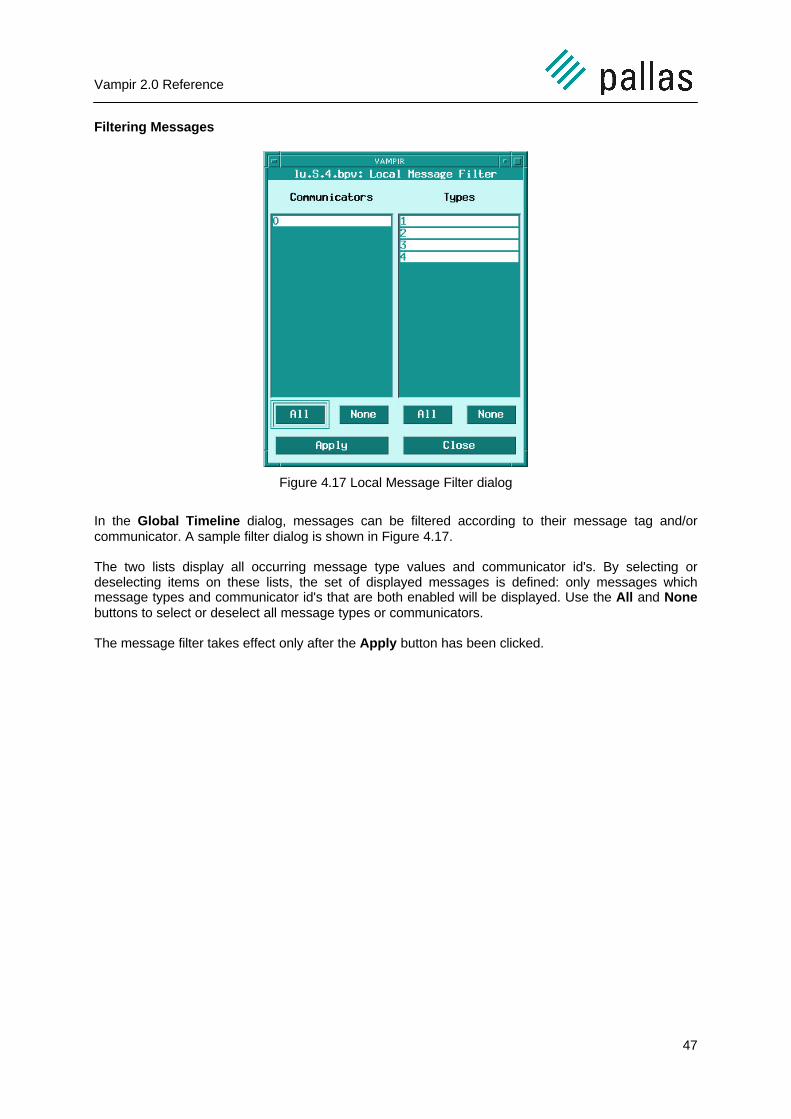
Vampir 2.0 Reference
47
Filtering Messages
Figure 4.17 Local Message Filter dialog
In the Global Timeline dialog, messages can be filtered according to their message tag and/orcommunicator. A sample filter dialog is shown in Figure 4.17.
The two lists display all occurring message type values and communicator id's. By selecting ordeselecting items on these lists, the set of displayed messages is defined: only messages whichmessage types and communicator id's that are both enabled will be displayed. Use the All and Nonebuttons to select or deselect all message types or communicators.
The message filter takes effect only after the Apply button has been clicked.
Vampir 2.0 Reference
48
Titel:REFTML.EPS from CorelDRAW!Erstellt von:CorelDRAW!Vorschau:Diese EPS-Grafik wurde nicht gespeichertmit einer enthaltenen Vorschau.Kommentar:Diese EPS-Grafik wird an einenPostScript-Drucker gedruckt, aber nichtan andere Druckertypen.
Figure 4.18 Global Timeline display components
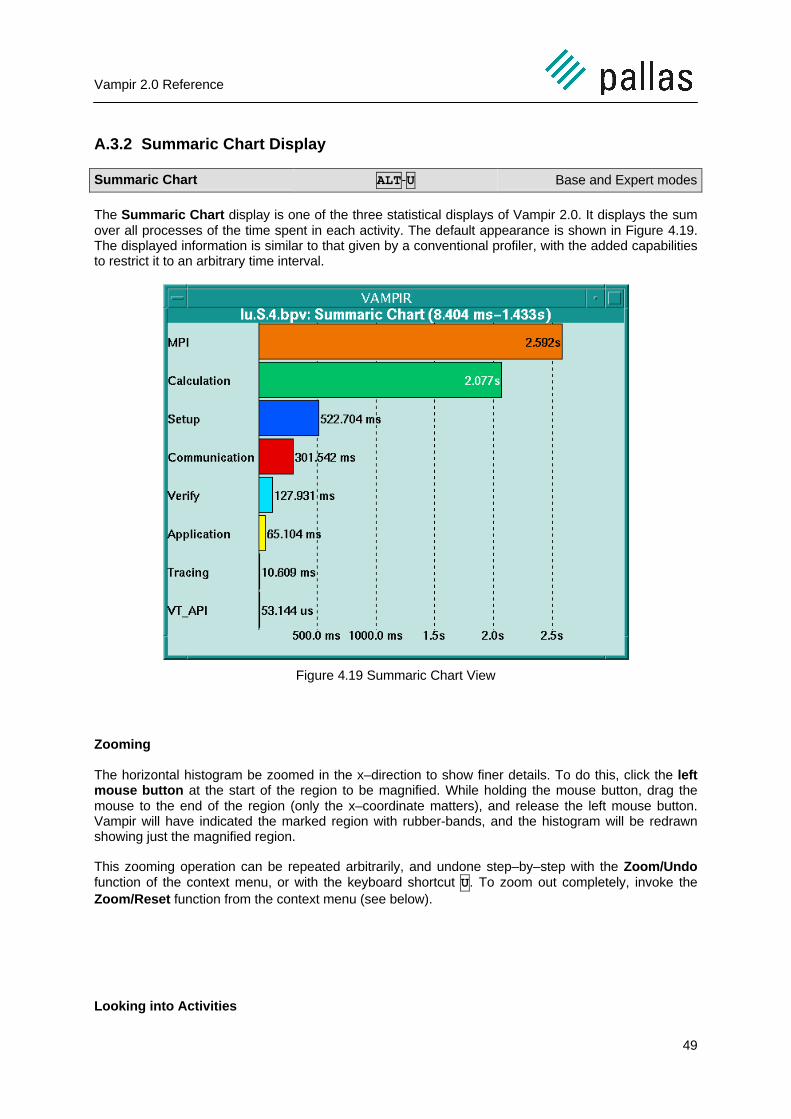
Vampir 2.0 Reference
49
A.3.2 Summaric Chart Display
Summaric Chart ALT-U Base and Expert modes
The Summaric Chart display is one of the three statistical displays of Vampir 2.0. It displays the sumover all processes of the time spent in each activity. The default appearance is shown in Figure 4.19.The displayed information is similar to that given by a conventional profiler, with the added capabilitiesto restrict it to an arbitrary time interval.
Figure 4.19 Summaric Chart View
Zooming
The horizontal histogram be zoomed in the x–direction to show finer details. To do this, click the leftmouse button at the start of the region to be magnified. While holding the mouse button, drag themouse to the end of the region (only the x–coordinate matters), and release the left mouse button.Vampir will have indicated the marked region with rubber-bands, and the histogram will be redrawnshowing just the magnified region.
This zooming operation can be repeated arbitrarily, and undone step–by–step with the Zoom/Undofunction of the context menu, or with the keyboard shortcut U. To zoom out completely, invoke theZoom/Reset function from the context menu (see below).
Looking into Activities
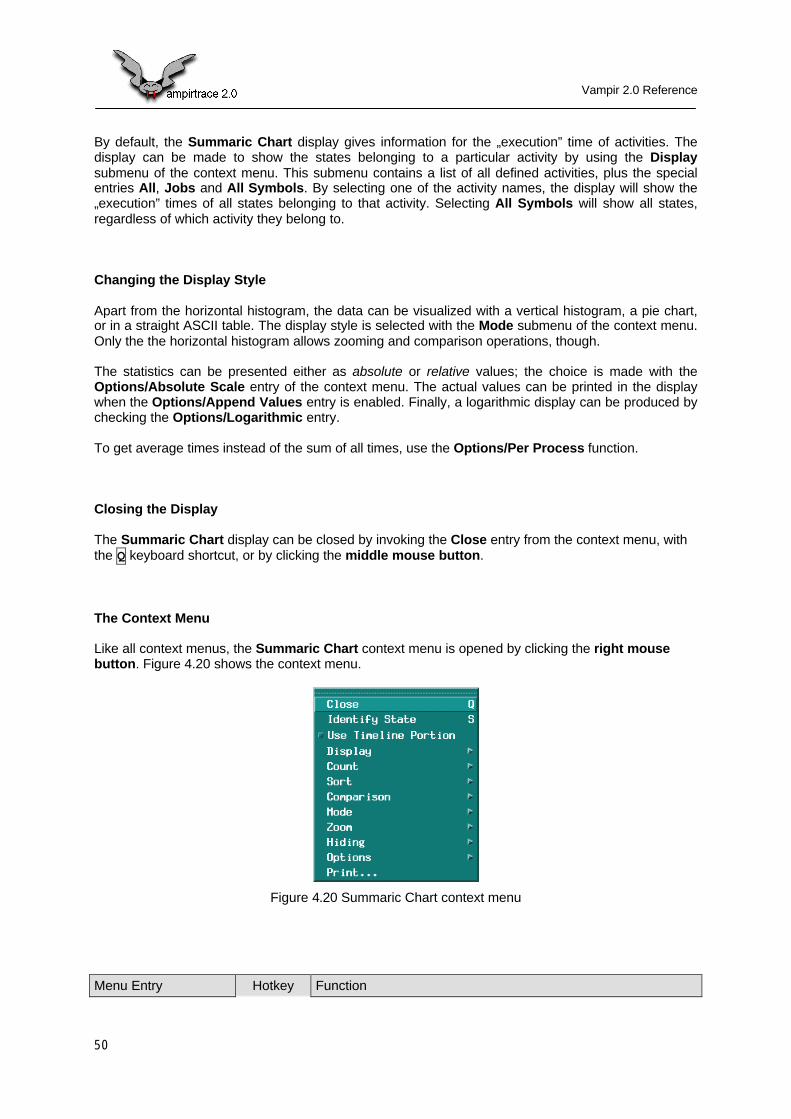
Vampir 2.0 Reference
50
By default, the Summaric Chart display gives information for the „execution” time of activities. Thedisplay can be made to show the states belonging to a particular activity by using the Displaysubmenu of the context menu. This submenu contains a list of all defined activities, plus the specialentries All, Jobs and All Symbols. By selecting one of the activity names, the display will show the„execution” times of all states belonging to that activity. Selecting All Symbols will show all states,regardless of which activity they belong to.
Changing the Display Style
Apart from the horizontal histogram, the data can be visualized with a vertical histogram, a pie chart,or in a straight ASCII table. The display style is selected with the Mode submenu of the context menu.Only the the horizontal histogram allows zooming and comparison operations, though.
The statistics can be presented either as absolute or relative values; the choice is made with theOptions/Absolute Scale entry of the context menu. The actual values can be printed in the displaywhen the Options/Append Values entry is enabled. Finally, a logarithmic display can be produced bychecking the Options/Logarithmic entry.
To get average times instead of the sum of all times, use the Options/Per Process function.
Closing the Display
The Summaric Chart display can be closed by invoking the Close entry from the context menu, withthe Q keyboard shortcut, or by clicking the middle mouse button.
The Context Menu
Like all context menus, the Summaric Chart context menu is opened by clicking the right mousebutton. Figure 4.20 shows the context menu.
Figure 4.20 Summaric Chart context menu
Menu Entry Hotkey Function
Vampir 2.0 Reference
51
Menu Entry Hotkey Function
Close Q Close the Summaric Chart display and all associatedsubwindows.
Identify State S To get detailed information about a specific state, select this itemand click with the left mouse button on the interesting symbol. Amessage box with further information about the selected symbolwill appear. The mouse cursor changes into the „target” symbolto indicate that this function is active.
Use Timeline Portion Activate this option to restrict the statistics to the timeline portion.This option is only meaningful when a Global Timeline displayis open. The default value can be configured in the GeneralPreferences dialog as described in section A.5.5.
Display Opens the Display submenu.
Count Opens the Count submenu.
Sort Opens the Sort submenu.
Comparison Opens the Comparison submenu.
Mode Opens the Mode submenu.
Zoom Opens the Zoom submenu.
Hiding Opens the Hiding submenu.
Options Opens the Options submenu.
Print Invoke the Postscript Print dialog to print the display contents.See section A.6.2 for details.
The Display Submenu
The Display submenu of the context menu controls which activities and/or starts are displayed in thesummaric chart. An example menu is shown in Figure 4.21.
The first three entries All, Jobs, All Symbols have special meanings: All displays statistics for allactivities, Jobs is reserved for the metacomputing option, and All Symbols presents statistics for allstates of all activities.
The rest of the menu displays the names of all defined activities; selecting one of them will cause allsymbols of that activity to be displayed.
The list of activity names is read from the Vampir configuration file and may include activities that arenot present in the trace. Selecting such an activity will blank out the display; if that happens, select anactivity actually present in the trace or one of the special entries, and the display will revert to normal.
Traces generated with VAMPIRtrace will have at least the following activities define: MPI for all MPIroutines, VT_API for all routines in the VAMPIRtrace API, and Application as default activity for theapplication routines.
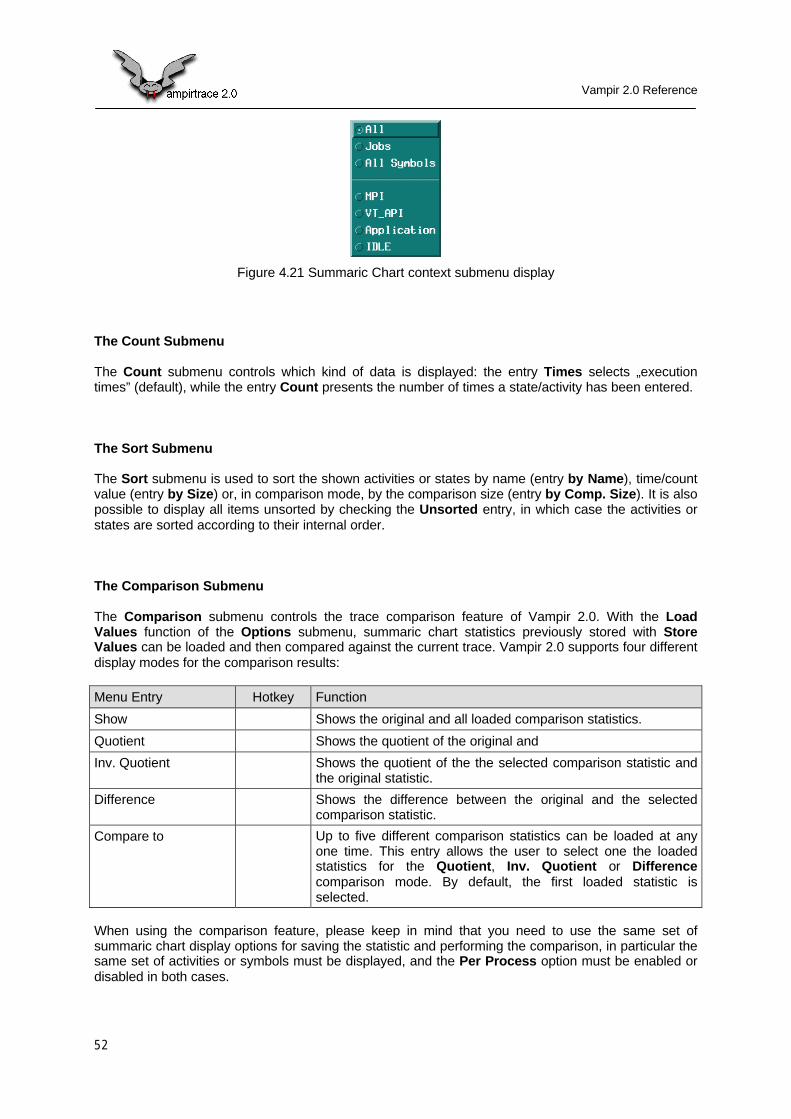
Vampir 2.0 Reference
52
Figure 4.21 Summaric Chart context submenu display
The Count Submenu
The Count submenu controls which kind of data is displayed: the entry Times selects „executiontimes” (default), while the entry Count presents the number of times a state/activity has been entered.
The Sort Submenu
The Sort submenu is used to sort the shown activities or states by name (entry by Name), time/countvalue (entry by Size) or, in comparison mode, by the comparison size (entry by Comp. Size). It is alsopossible to display all items unsorted by checking the Unsorted entry, in which case the activities orstates are sorted according to their internal order.
The Comparison Submenu
The Comparison submenu controls the trace comparison feature of Vampir 2.0. With the LoadValues function of the Options submenu, summaric chart statistics previously stored with StoreValues can be loaded and then compared against the current trace. Vampir 2.0 supports four differentdisplay modes for the comparison results:
Menu Entry Hotkey Function
Show Shows the original and all loaded comparison statistics.
Quotient Shows the quotient of the original and
Inv. Quotient Shows the quotient of the the selected comparison statistic andthe original statistic.
Difference Shows the difference between the original and the selectedcomparison statistic.
Compare to Up to five different comparison statistics can be loaded at anyone time. This entry allows the user to select one the loadedstatistics for the Quotient, Inv. Quotient or Differencecomparison mode. By default, the first loaded statistic isselected.
When using the comparison feature, please keep in mind that you need to use the same set ofsummaric chart display options for saving the statistic and performing the comparison, in particular thesame set of activities or symbols must be displayed, and the Per Process option must be enabled ordisabled in both cases.

Vampir 2.0 Reference
53
The Mode Submenu
The Mode submenu is used to select the general chart representation.
Menu Entry Hotkey Function
Pie Show values as a pie chart. This display cannot showcomparisons.
Hor. Histogram Show values as horizontal bars. Besides the original values, upto five loaded statistics can be displayed in the four comparisonmodes accessible from the Comparison submenu.
Vert. Histogram Display values as vertical bars. Besides the original values, oneloaded statistic can be displayed in the four comparison modesaccessible from the Comparison submenu.
Table Display values in a numerical spreadsheet–like format. Besidesthe original values, one loaded comparison statistic can bedisplayed.
The Zoom Submenu
The Zoom submenu is used to undo a previous zoom action or to reset the display to the unzoomedstate.
Menu Entry Hotkey Function
Undo U Undo a preceding zoom action.
Reset Undo all preceding zoom actions.
The Hiding Submenu
The Hiding submenu controls which entries of a summaric chart statistic are hidden. The Hide Maxfunction hides the entry with the maximum value, and rescales the display accordingly. This makesentries with small values easier to discern. The hiding can be done repeatedly, and undone eitherstep–by–step or in one go.
Menu Entry Hotkey Function
Hide Max Hides the entry with the maximum value from the currentdisplay. Affects all loaded comparison statistics, too.
Undo Hiding Undo a preceding Hide Max action.
Reset Hiding Undo all preceding Hide Max actions.
The Options Submenu
The Options submenu bundles functions that affect the appearance of the summaric charts, as wellas functions to store and load summary statistics.
Menu Entry Hotkey Function
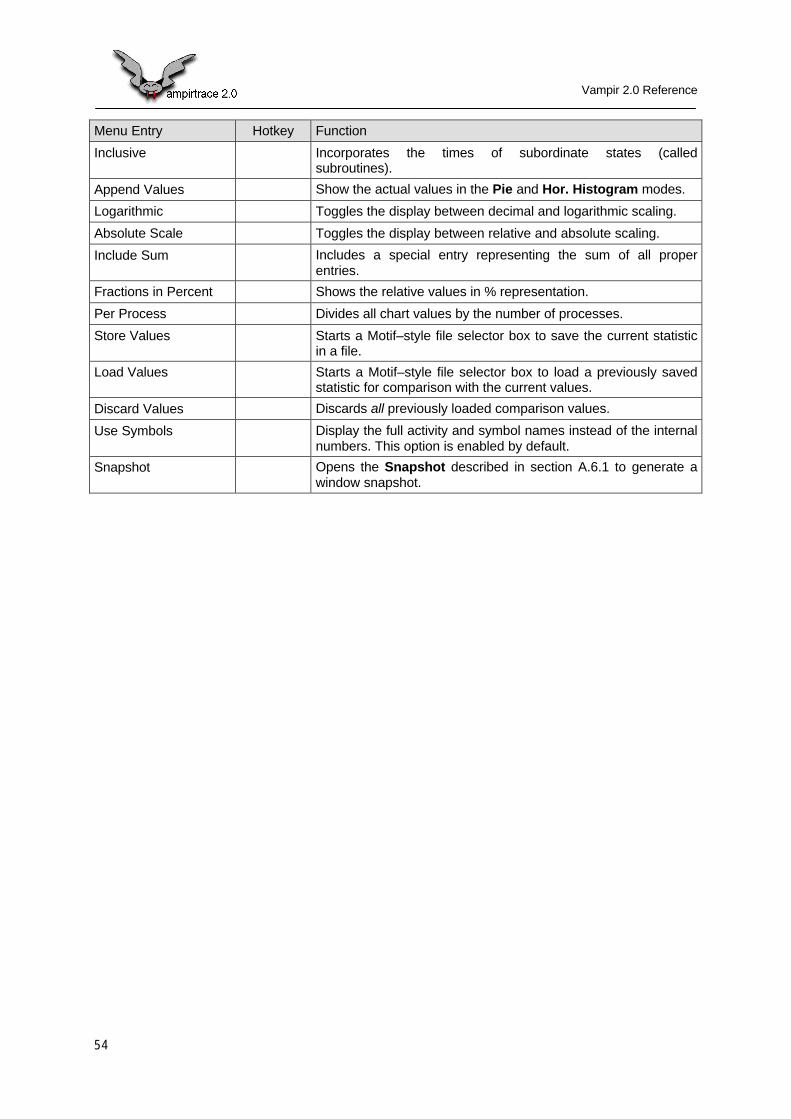
Vampir 2.0 Reference
54
Menu Entry Hotkey Function
Inclusive Incorporates the times of subordinate states (calledsubroutines).
Append Values Show the actual values in the Pie and Hor. Histogram modes.
Logarithmic Toggles the display between decimal and logarithmic scaling.
Absolute Scale Toggles the display between relative and absolute scaling.
Include Sum Includes a special entry representing the sum of all properentries.
Fractions in Percent Shows the relative values in % representation.
Per Process Divides all chart values by the number of processes.
Store Values Starts a Motif–style file selector box to save the current statisticin a file.
Load Values Starts a Motif–style file selector box to load a previously savedstatistic for comparison with the current values.
Discard Values Discards all previously loaded comparison values.
Use Symbols Display the full activity and symbol names instead of the internalnumbers. This option is enabled by default.
Snapshot Opens the Snapshot described in section A.6.1 to generate awindow snapshot.

Vampir 2.0 Reference
55
A.3.3 Activity Chart Display
Activity Chart ALT-A Base and Expert modes
The Global Activity Chart display shows a statistic about time spent in each activity for each process.Its default appearance is shown in Figure 4.22.
Figure 4.22 Global Activity Chart display
Zooming
In the Histogram display mode, the vertical bars can be zoomed by marking a rectangle with themouse: click the left mouse button at the starting location, keep it pressed while moving the mouse tothe end location. Vampir will draw rubber-bands to indicate the marked area. After releasing the leftmouse button, Vampir will rescale the y–axis to show only the marked part. his zoom operation can berepeated to look into arbitrary parts of the y–axis.
The Undo Zoom entry of the context menu will undo the last zoom operation.
Selecting Processes
Within the Global Activity Chart, processes can be selected by clicking on the representation of itsprofiling data. The process label changes the color from black to white to indicate that it has beenselected.
Depending on the display mode it is possible to select a couple of processes in one go by dragging arectangular rubber-band around them. This selection method works only in Pie and Table displaymode.
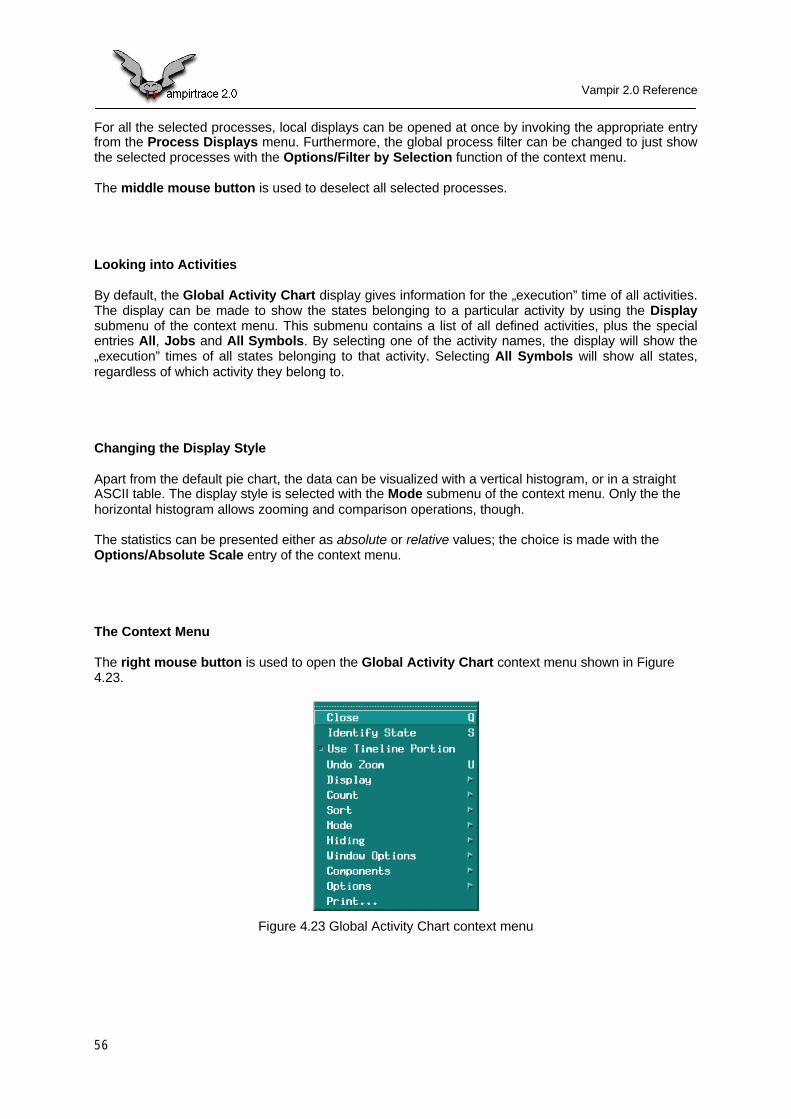
Vampir 2.0 Reference
56
For all the selected processes, local displays can be opened at once by invoking the appropriate entryfrom the Process Displays menu. Furthermore, the global process filter can be changed to just showthe selected processes with the Options/Filter by Selection function of the context menu.
The middle mouse button is used to deselect all selected processes.
Looking into Activities
By default, the Global Activity Chart display gives information for the „execution” time of all activities.The display can be made to show the states belonging to a particular activity by using the Displaysubmenu of the context menu. This submenu contains a list of all defined activities, plus the specialentries All, Jobs and All Symbols. By selecting one of the activity names, the display will show the„execution” times of all states belonging to that activity. Selecting All Symbols will show all states,regardless of which activity they belong to.
Changing the Display Style
Apart from the default pie chart, the data can be visualized with a vertical histogram, or in a straightASCII table. The display style is selected with the Mode submenu of the context menu. Only the thehorizontal histogram allows zooming and comparison operations, though.
The statistics can be presented either as absolute or relative values; the choice is made with theOptions/Absolute Scale entry of the context menu.
The Context Menu
The right mouse button is used to open the Global Activity Chart context menu shown in Figure4.23.
Figure 4.23 Global Activity Chart context menu
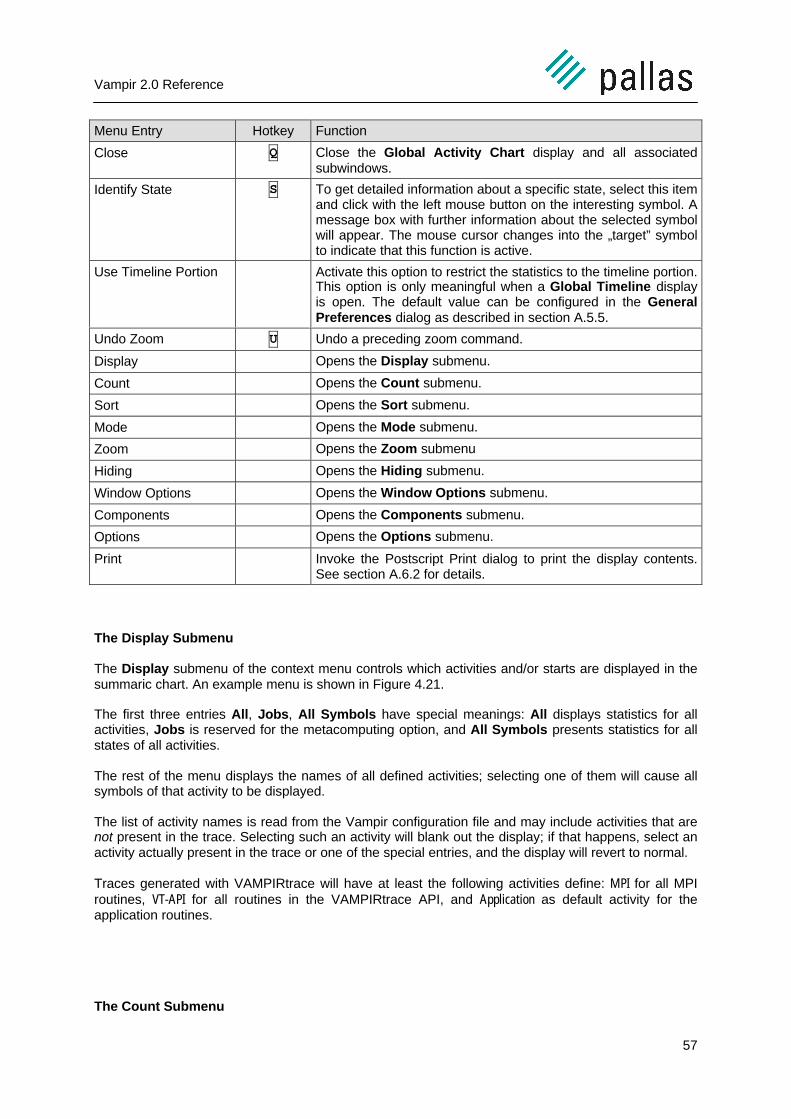
Vampir 2.0 Reference
57
Menu Entry Hotkey Function
Close Q Close the Global Activity Chart display and all associatedsubwindows.
Identify State S To get detailed information about a specific state, select this itemand click with the left mouse button on the interesting symbol. Amessage box with further information about the selected symbolwill appear. The mouse cursor changes into the „target” symbolto indicate that this function is active.
Use Timeline Portion Activate this option to restrict the statistics to the timeline portion.This option is only meaningful when a Global Timeline displayis open. The default value can be configured in the GeneralPreferences dialog as described in section A.5.5.
Undo Zoom U Undo a preceding zoom command.
Display Opens the Display submenu.
Count Opens the Count submenu.
Sort Opens the Sort submenu.
Mode Opens the Mode submenu.
Zoom Opens the Zoom submenu
Hiding Opens the Hiding submenu.
Window Options Opens the Window Options submenu.
Components Opens the Components submenu.
Options Opens the Options submenu.
Print Invoke the Postscript Print dialog to print the display contents.See section A.6.2 for details.
The Display Submenu
The Display submenu of the context menu controls which activities and/or starts are displayed in thesummaric chart. An example menu is shown in Figure 4.21.
The first three entries All, Jobs, All Symbols have special meanings: All displays statistics for allactivities, Jobs is reserved for the metacomputing option, and All Symbols presents statistics for allstates of all activities.
The rest of the menu displays the names of all defined activities; selecting one of them will cause allsymbols of that activity to be displayed.
The list of activity names is read from the Vampir configuration file and may include activities that arenot present in the trace. Selecting such an activity will blank out the display; if that happens, select anactivity actually present in the trace or one of the special entries, and the display will revert to normal.
Traces generated with VAMPIRtrace will have at least the following activities define: MPI for all MPIroutines, VT-API for all routines in the VAMPIRtrace API, and Application as default activity for theapplication routines.
The Count Submenu
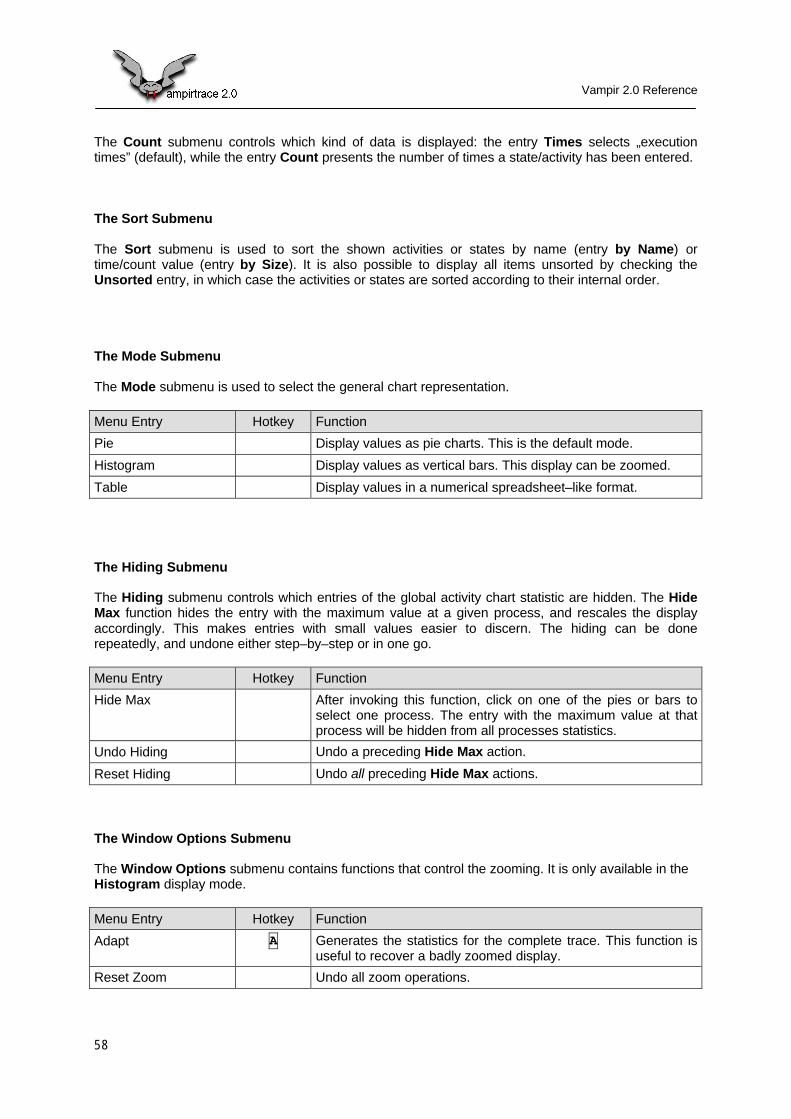
Vampir 2.0 Reference
58
The Count submenu controls which kind of data is displayed: the entry Times selects „executiontimes” (default), while the entry Count presents the number of times a state/activity has been entered.
The Sort Submenu
The Sort submenu is used to sort the shown activities or states by name (entry by Name) ortime/count value (entry by Size). It is also possible to display all items unsorted by checking theUnsorted entry, in which case the activities or states are sorted according to their internal order.
The Mode Submenu
The Mode submenu is used to select the general chart representation.
Menu Entry Hotkey Function
Pie Display values as pie charts. This is the default mode.
Histogram Display values as vertical bars. This display can be zoomed.
Table Display values in a numerical spreadsheet–like format.
The Hiding Submenu
The Hiding submenu controls which entries of the global activity chart statistic are hidden. The HideMax function hides the entry with the maximum value at a given process, and rescales the displayaccordingly. This makes entries with small values easier to discern. The hiding can be donerepeatedly, and undone either step–by–step or in one go.
Menu Entry Hotkey Function
Hide Max After invoking this function, click on one of the pies or bars toselect one process. The entry with the maximum value at thatprocess will be hidden from all processes statistics.
Undo Hiding Undo a preceding Hide Max action.
Reset Hiding Undo all preceding Hide Max actions.
The Window Options Submenu
The Window Options submenu contains functions that control the zooming. It is only available in theHistogram display mode.
Menu Entry Hotkey Function
Adapt A Generates the statistics for the complete trace. This function isuseful to recover a badly zoomed display.
Reset Zoom Undo all zoom operations.
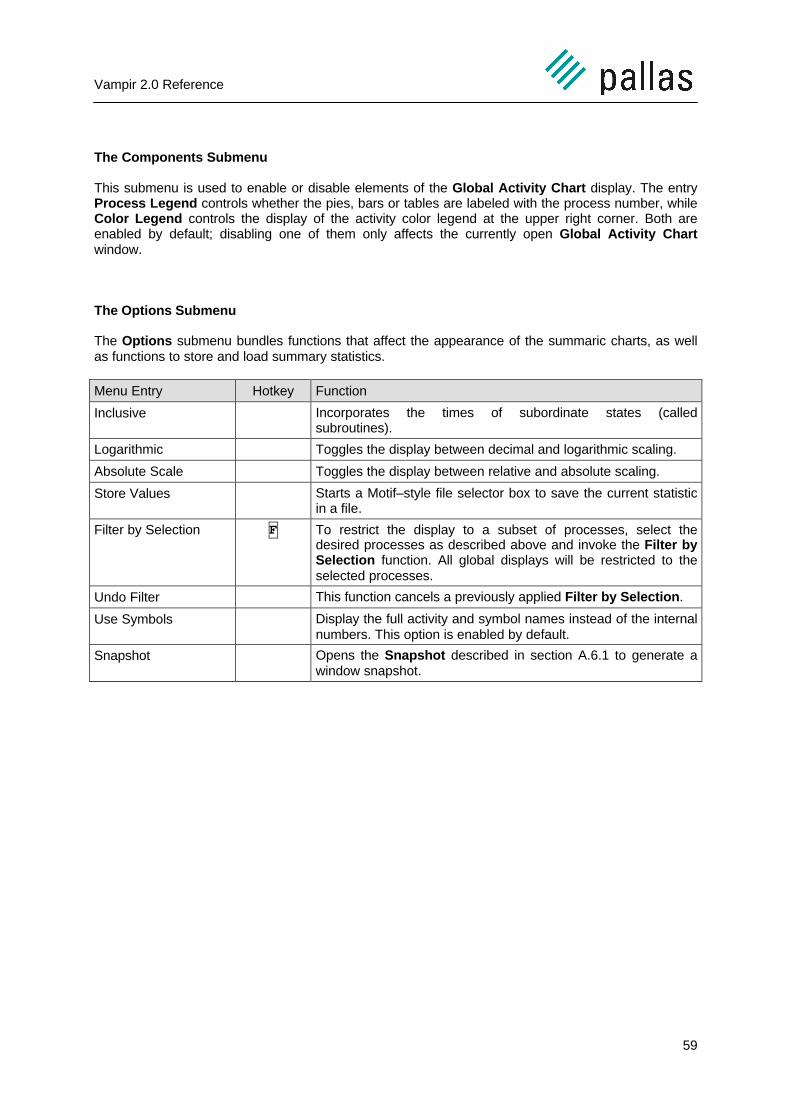
Vampir 2.0 Reference
59
The Components Submenu
This submenu is used to enable or disable elements of the Global Activity Chart display. The entryProcess Legend controls whether the pies, bars or tables are labeled with the process number, whileColor Legend controls the display of the activity color legend at the upper right corner. Both areenabled by default; disabling one of them only affects the currently open Global Activity Chartwindow.
The Options Submenu
The Options submenu bundles functions that affect the appearance of the summaric charts, as wellas functions to store and load summary statistics.
Menu Entry Hotkey Function
Inclusive Incorporates the times of subordinate states (calledsubroutines).
Logarithmic Toggles the display between decimal and logarithmic scaling.
Absolute Scale Toggles the display between relative and absolute scaling.
Store Values Starts a Motif–style file selector box to save the current statisticin a file.
Filter by Selection F To restrict the display to a subset of processes, select thedesired processes as described above and invoke the Filter bySelection function. All global displays will be restricted to theselected processes.
Undo Filter This function cancels a previously applied Filter by Selection.
Use Symbols Display the full activity and symbol names instead of the internalnumbers. This option is enabled by default.
Snapshot Opens the Snapshot described in section A.6.1 to generate awindow snapshot.
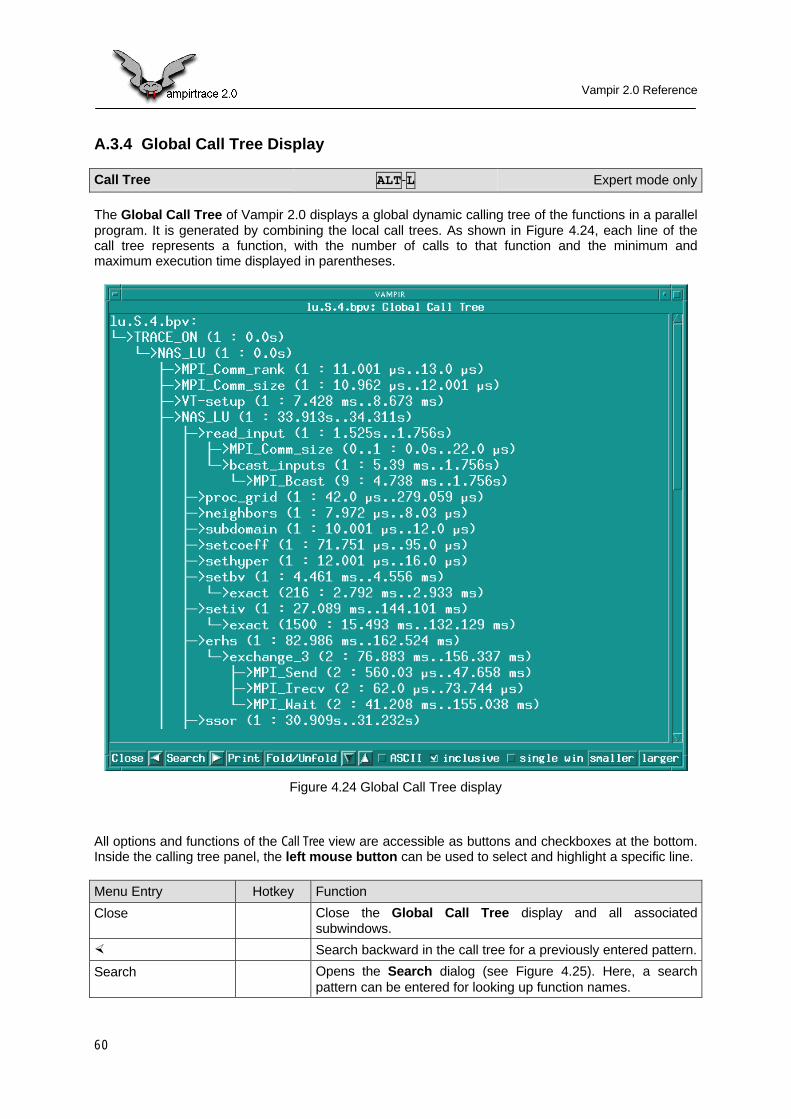
Vampir 2.0 Reference
60
A.3.4 Global Call Tree Display
Call Tree ALT-L Expert mode only
The Global Call Tree of Vampir 2.0 displays a global dynamic calling tree of the functions in a parallelprogram. It is generated by combining the local call trees. As shown in Figure 4.24, each line of thecall tree represents a function, with the number of calls to that function and the minimum andmaximum execution time displayed in parentheses.
Figure 4.24 Global Call Tree display
All options and functions of the Call Tree view are accessible as buttons and checkboxes at the bottom.Inside the calling tree panel, the left mouse button can be used to select and highlight a specific line.
Menu Entry Hotkey Function
Close Close the Global Call Tree display and all associatedsubwindows.
× Search backward in the call tree for a previously entered pattern.
Search Opens the Search dialog (see Figure 4.25). Here, a searchpattern can be entered for looking up function names.
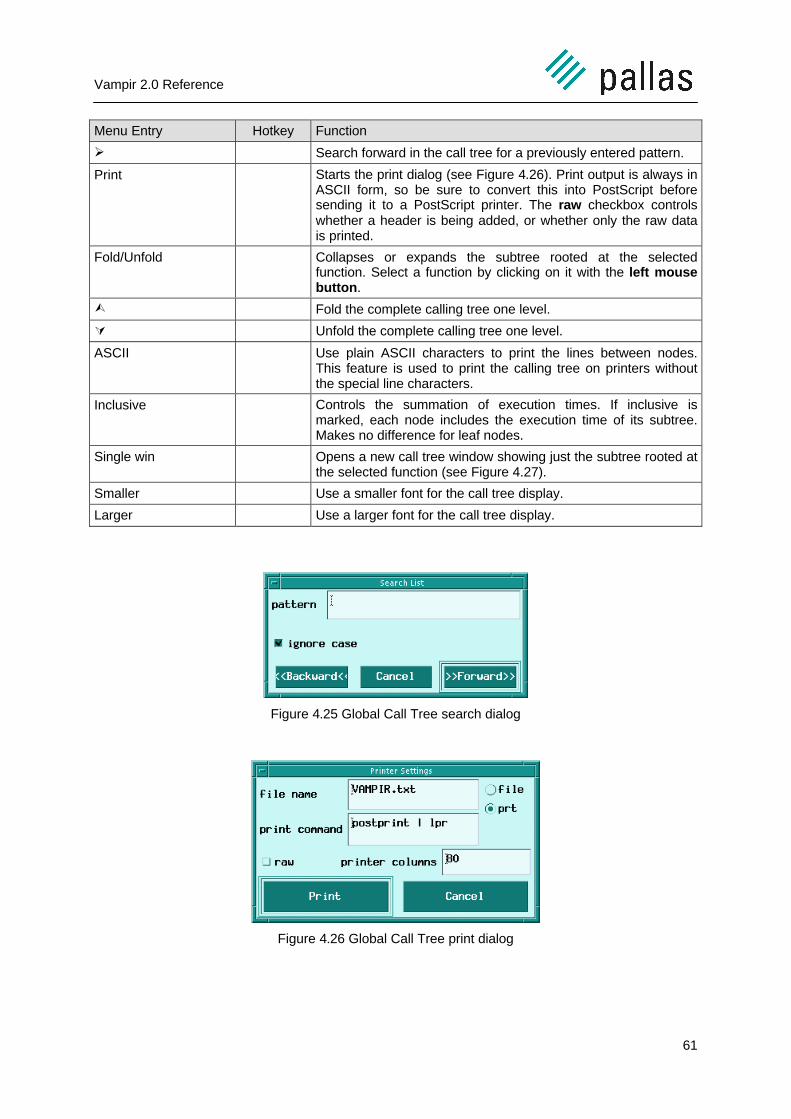
Vampir 2.0 Reference
61
Menu Entry Hotkey Function
Ø Search forward in the call tree for a previously entered pattern.
Print Starts the print dialog (see Figure 4.26). Print output is always inASCII form, so be sure to convert this into PostScript beforesending it to a PostScript printer. The raw checkbox controlswhether a header is being added, or whether only the raw datais printed.
Fold/Unfold Collapses or expands the subtree rooted at the selectedfunction. Select a function by clicking on it with the left mousebutton.
Ù Fold the complete calling tree one level.
Ú Unfold the complete calling tree one level.
ASCII Use plain ASCII characters to print the lines between nodes.This feature is used to print the calling tree on printers withoutthe special line characters.
Inclusive Controls the summation of execution times. If inclusive ismarked, each node includes the execution time of its subtree.Makes no difference for leaf nodes.
Single win Opens a new call tree window showing just the subtree rooted atthe selected function (see Figure 4.27).
Smaller Use a smaller font for the call tree display.
Larger Use a larger font for the call tree display.
Figure 4.25 Global Call Tree search dialog
Figure 4.26 Global Call Tree print dialog
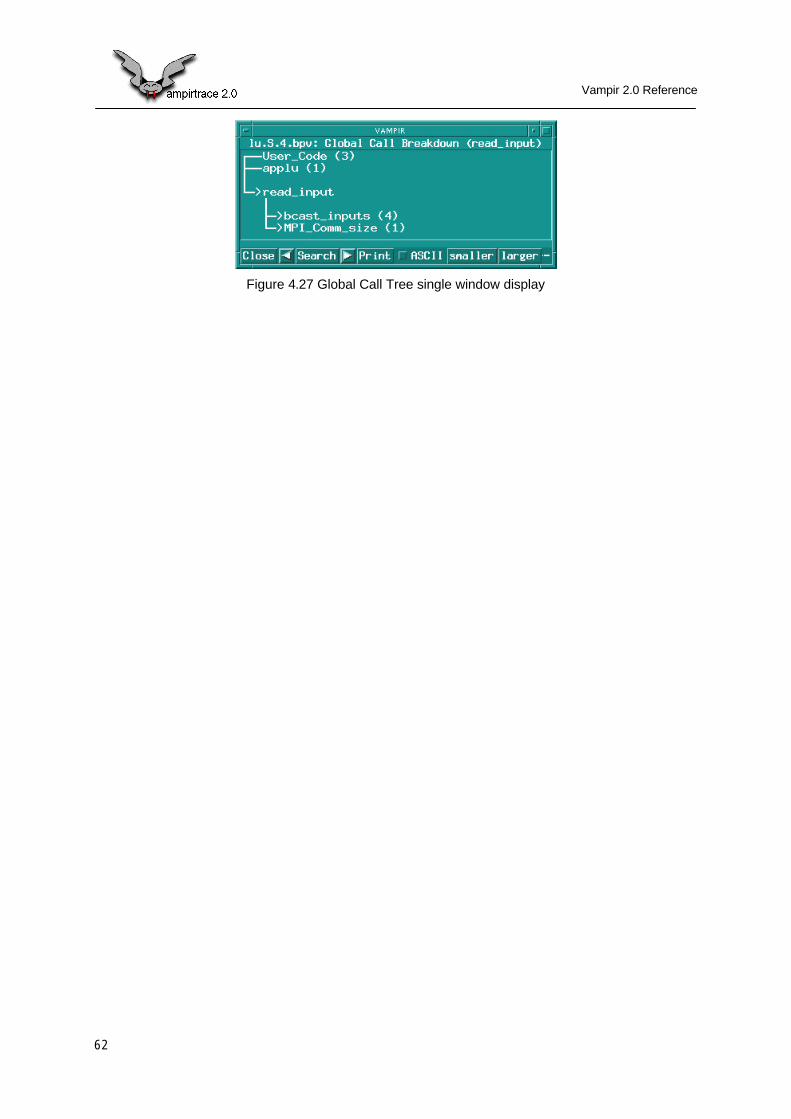
Vampir 2.0 Reference
62
Figure 4.27 Global Call Tree single window display
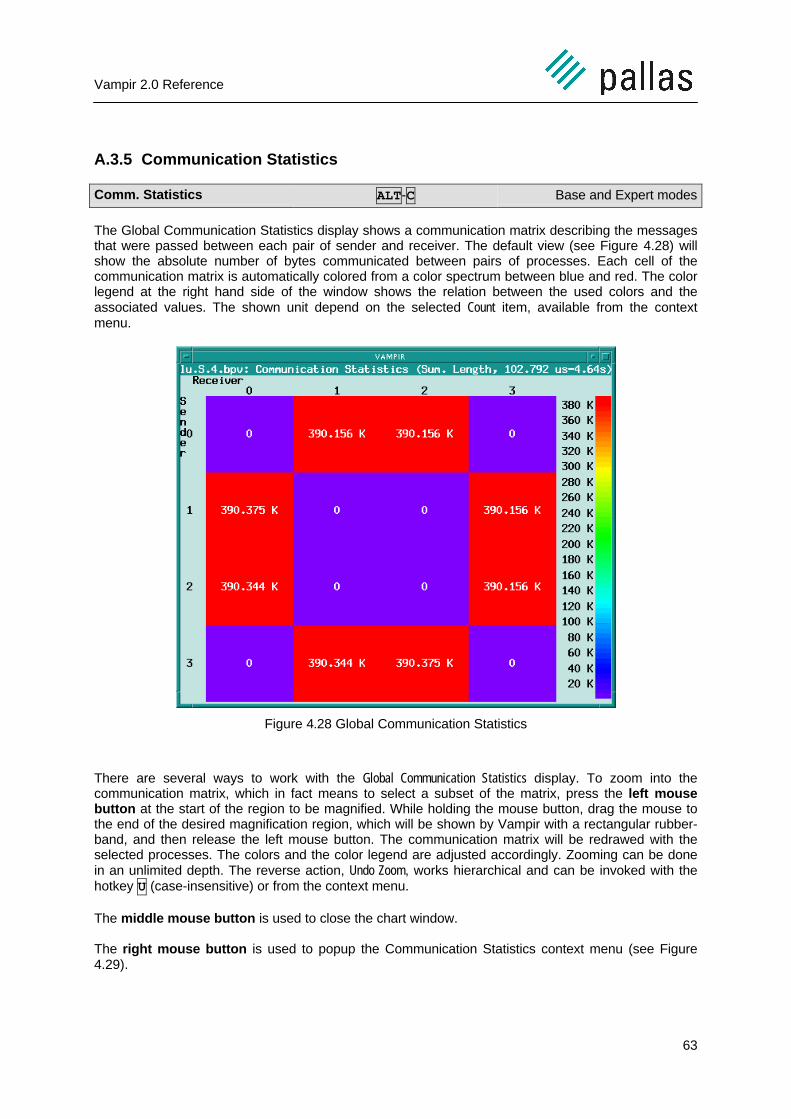
Vampir 2.0 Reference
63
A.3.5 Communication Statistics
Comm. Statistics ALT-C Base and Expert modes
The Global Communication Statistics display shows a communication matrix describing the messagesthat were passed between each pair of sender and receiver. The default view (see Figure 4.28) willshow the absolute number of bytes communicated between pairs of processes. Each cell of thecommunication matrix is automatically colored from a color spectrum between blue and red. The colorlegend at the right hand side of the window shows the relation between the used colors and theassociated values. The shown unit depend on the selected Count item, available from the contextmenu.
Figure 4.28 Global Communication Statistics
There are several ways to work with the Global Communication Statistics display. To zoom into thecommunication matrix, which in fact means to select a subset of the matrix, press the left mousebutton at the start of the region to be magnified. While holding the mouse button, drag the mouse tothe end of the desired magnification region, which will be shown by Vampir with a rectangular rubber-band, and then release the left mouse button. The communication matrix will be redrawed with theselected processes. The colors and the color legend are adjusted accordingly. Zooming can be donein an unlimited depth. The reverse action, Undo Zoom, works hierarchical and can be invoked with thehotkey U (case-insensitive) or from the context menu.
The middle mouse button is used to close the chart window.
The right mouse button is used to popup the Communication Statistics context menu (see Figure4.29).

Vampir 2.0 Reference
64
Figure 4.29 Global Communication Statistics context menu
Menu Entry Hotkey Function
Close Q Close the Communication Statistics display and all associatedsubwindows, except Length Statistic windows
Undo Zoom U Undo a preceding zoom command.
Reset Zoom Discards all preceding zoom commands.
Use Timeline Portion Activate this option to link the Communication Statistics displayto the portion of time, displayed by the global timeline view. Thedefault value can be configured by the Preferences / Display /General dialog (see section A.5.5 for details).
Freeze If linked to the actual timeline portion, activate this option tofreeze the actual content of the Communication Statisticsdisplay. A second Communication Statistics display can beopened to display another communication matrix for comparisonpurposes. The Freeze option has only an effect in conjunctionwith Use Timeline Portion.
Filter Messages Starts a local Filter Messages dialog (see Figure 4.31) to filtermessages by type and communicator. After selection press theApply button to actually filter messages.
Length Statistics L To show a length statistic of any part of the communicationmatrix select this item and mark a region inside the matrix byholding the left mouse button down and drag a rectangle abovethe region of interest. This will result in a new window that showsa horizontal bar chart like Figure 4.32. To remark the user thatthe Length Statistics function is selected the mouse cursorshape inside communication statistics is changed to the "cross-hair" symbol.
Snapshot The Snapshot dialog will pop up as an interface to theImageMagick screen capture tool. See Section A.6.1 furtherdetails.
Print Starts the build-in postscript print function of Vampir.
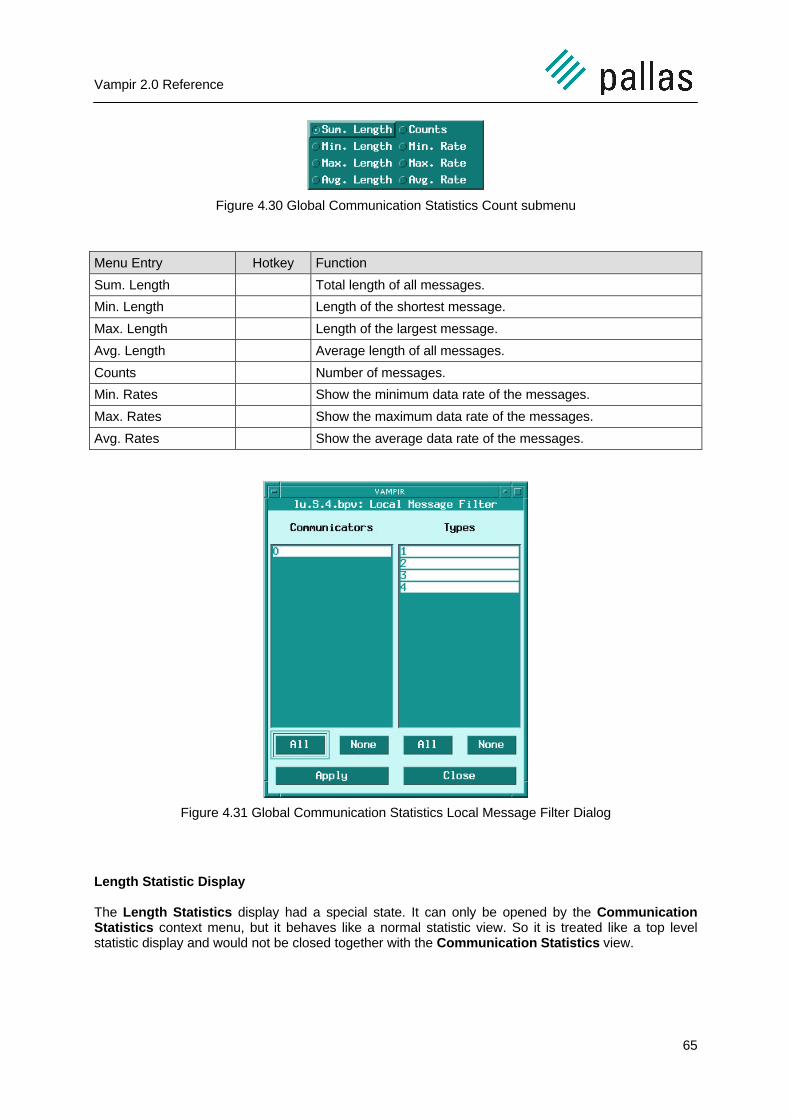
Vampir 2.0 Reference
65
Figure 4.30 Global Communication Statistics Count submenu
Menu Entry Hotkey Function
Sum. Length Total length of all messages.
Min. Length Length of the shortest message.
Max. Length Length of the largest message.
Avg. Length Average length of all messages.
Counts Number of messages.
Min. Rates Show the minimum data rate of the messages.
Max. Rates Show the maximum data rate of the messages.
Avg. Rates Show the average data rate of the messages.
Figure 4.31 Global Communication Statistics Local Message Filter Dialog
Length Statistic Display
The Length Statistics display had a special state. It can only be opened by the CommunicationStatistics context menu, but it behaves like a normal statistic view. So it is treated like a top levelstatistic display and would not be closed together with the Communication Statistics view.

Vampir 2.0 Reference
66
Figure 4.32 Global Communication Length Statistic Display
All three mouse buttons have different functions inside this view. To zoom a portion of the LengthStatistics display press the left mouse button at the start of the region to be magnified. Whileholding the mouse button, drag the mouse to the end of the desired magnification region, which will beshown by Vampir with a rectangular rubber-band, and then release the left mouse button. The statisticbars will be redrawn to show the magnified portion with scales adjusted accordingly. Zooming can bedone in an unlimited depth. The reverse action, Undo Zoom, works hierarchical and can be invokedwith the hotkey U (case-insensitive) or from the context menu.
The middle mouse button is used to close the chart window.
The right mouse button is used to popup the Length Statistics context menu (see Figure 4.33).
Figure 4.33 Length Statistics Context Menu
Menu Entry Hotkey Function
Close Q Close the Length Statistics display and all associated sub-windows.
Undo U Undo a preceding zoom command.
Use Timeline Portion Activate this option to link the Length Statistics view to theportion of time displayed by the global timeline view.
Freeze Activate this option to freeze the actual content of the LengthStatistics display if linked to the actual timeline portion. TheFreeze option has only an effect in conjunction with UseTimeline Portion.
Print Starts the build-in postscript print function of Vampir.

Vampir 2.0 Reference
67
The Group by submenu is used to arrange the bars according to one out of three available criteria,Length, Type and Communicator. The grouping criteria is displayed at the left hand side of thewindow in Histogram mode.
The Mode submenu is used to choose a chart representation for the view. Histogram is a horizontalbar chart with Group by criteria at y-axis. Graph mode is a vertical bar chart with Group by criteria atx-axis.
The Display submenu is used to choose a criteria which is visualised in the chart. One out of thefollowing criteria can be chosen:
Menu Entry Hotkey Function
Counts Number of messages.
Sum. Lengths Total length of messages
Min. Rates Minimum transfer rate.
Max. Rates Maximum transfer rate.
Avg. Rates Average transfer rate.
The Sort by submenu is used to determine the sort order of the bars inside the current chart. The firstitem of the submenu Values is the default sort criteria and the bars are sorted according to their size.The second menu item depends on the actual Group by selection. If the chart is grouped bymessages types, the second menu item is named Types and, if chosen , the chart is sortedaccordingly. Length and Communicator are the other two available sort criteria.
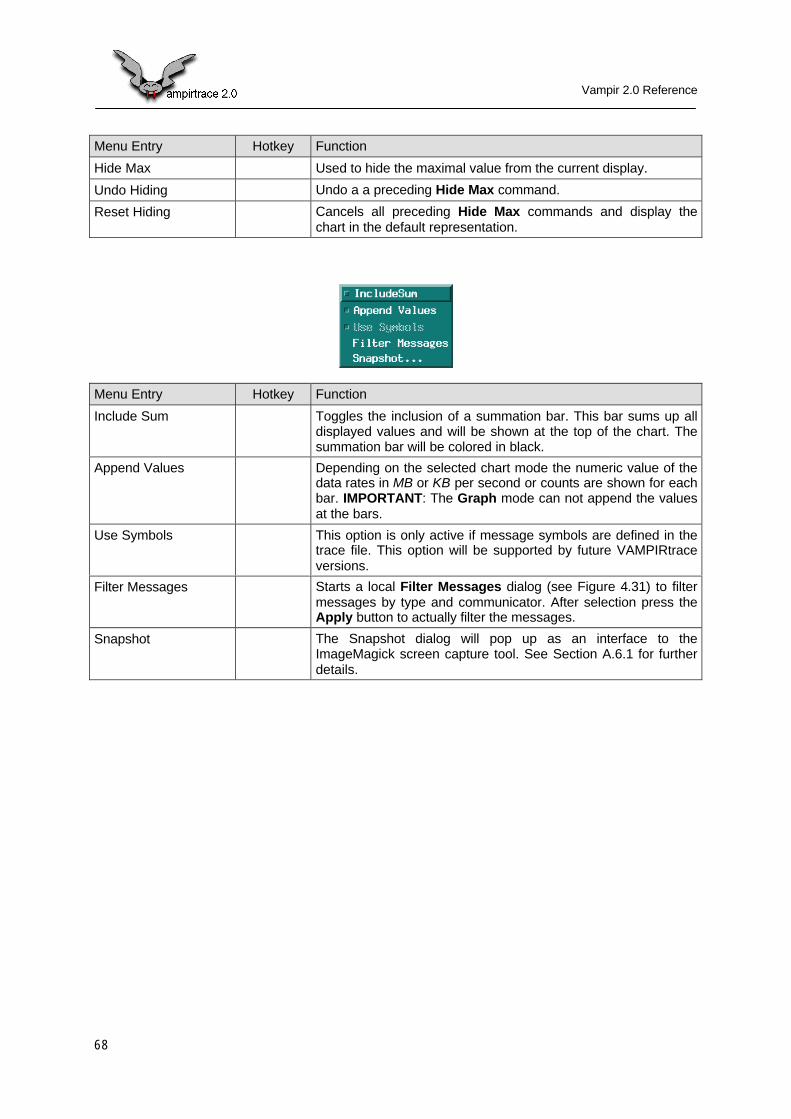
Vampir 2.0 Reference
68
Menu Entry Hotkey Function
Hide Max Used to hide the maximal value from the current display.
Undo Hiding Undo a a preceding Hide Max command.
Reset Hiding Cancels all preceding Hide Max commands and display thechart in the default representation.
Menu Entry Hotkey Function
Include Sum Toggles the inclusion of a summation bar. This bar sums up alldisplayed values and will be shown at the top of the chart. Thesummation bar will be colored in black.
Append Values Depending on the selected chart mode the numeric value of thedata rates in MB or KB per second or counts are shown for eachbar. IMPORTANT: The Graph mode can not append the valuesat the bars.
Use Symbols This option is only active if message symbols are defined in thetrace file. This option will be supported by future VAMPIRtraceversions.
Filter Messages Starts a local Filter Messages dialog (see Figure 4.31) to filtermessages by type and communicator. After selection press theApply button to actually filter the messages.
Snapshot The Snapshot dialog will pop up as an interface to theImageMagick screen capture tool. See Section A.6.1 for furtherdetails.
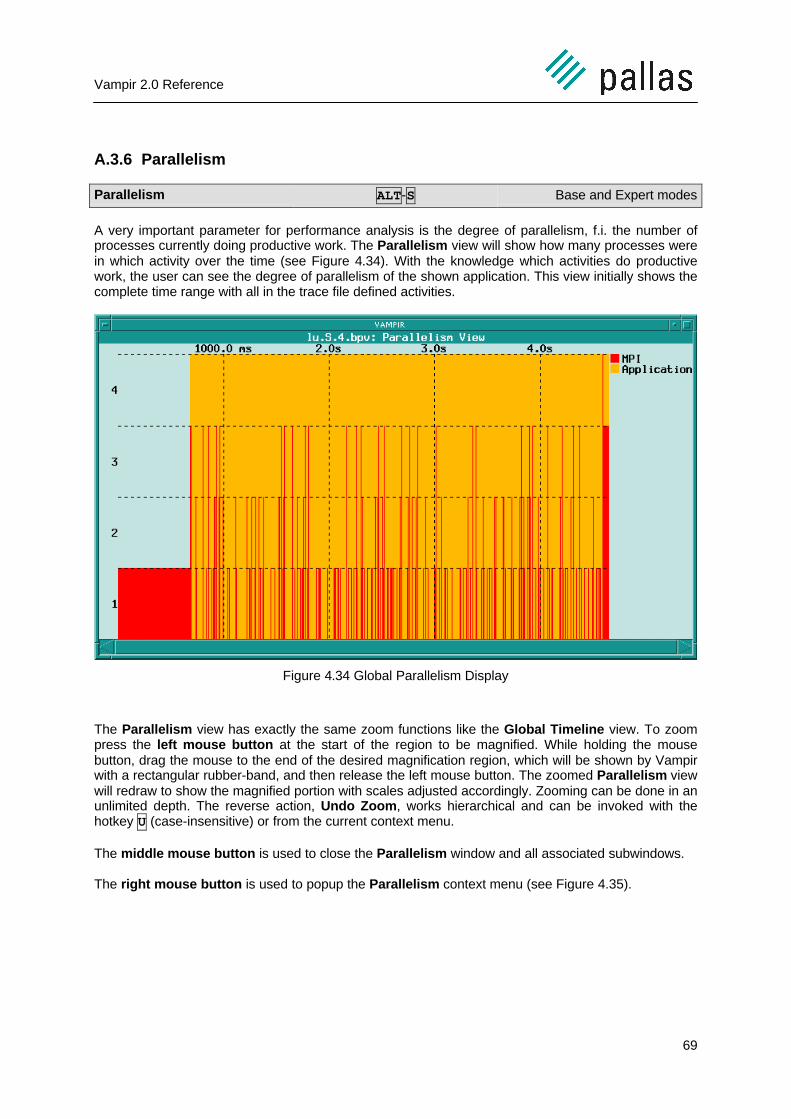
Vampir 2.0 Reference
69
A.3.6 Parallelism
Parallelism ALT-S Base and Expert modes
A very important parameter for performance analysis is the degree of parallelism, f.i. the number ofprocesses currently doing productive work. The Parallelism view will show how many processes werein which activity over the time (see Figure 4.34). With the knowledge which activities do productivework, the user can see the degree of parallelism of the shown application. This view initially shows thecomplete time range with all in the trace file defined activities.
Figure 4.34 Global Parallelism Display
The Parallelism view has exactly the same zoom functions like the Global Timeline view. To zoompress the left mouse button at the start of the region to be magnified. While holding the mousebutton, drag the mouse to the end of the desired magnification region, which will be shown by Vampirwith a rectangular rubber-band, and then release the left mouse button. The zoomed Parallelism viewwill redraw to show the magnified portion with scales adjusted accordingly. Zooming can be done in anunlimited depth. The reverse action, Undo Zoom, works hierarchical and can be invoked with thehotkey U (case-insensitive) or from the current context menu.
The middle mouse button is used to close the Parallelism window and all associated subwindows.
The right mouse button is used to popup the Parallelism context menu (see Figure 4.35).
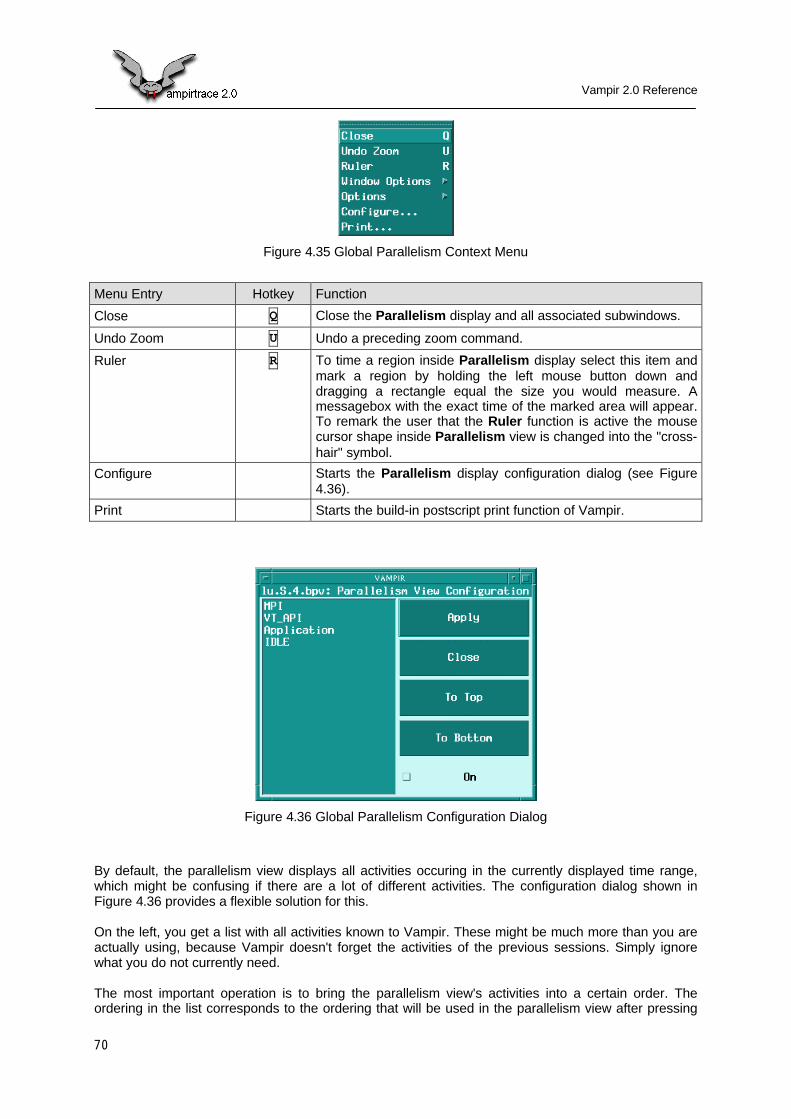
Vampir 2.0 Reference
70
Figure 4.35 Global Parallelism Context Menu
Menu Entry Hotkey Function
Close Q Close the Parallelism display and all associated subwindows.
Undo Zoom U Undo a preceding zoom command.
Ruler R To time a region inside Parallelism display select this item andmark a region by holding the left mouse button down anddragging a rectangle equal the size you would measure. Amessagebox with the exact time of the marked area will appear.To remark the user that the Ruler function is active the mousecursor shape inside Parallelism view is changed into the "cross-hair" symbol.
Configure Starts the Parallelism display configuration dialog (see Figure4.36).
Print Starts the build-in postscript print function of Vampir.
Figure 4.36 Global Parallelism Configuration Dialog
By default, the parallelism view displays all activities occuring in the currently displayed time range,which might be confusing if there are a lot of different activities. The configuration dialog shown inFigure 4.36 provides a flexible solution for this.
On the left, you get a list with all activities known to Vampir. These might be much more than you areactually using, because Vampir doesn't forget the activities of the previous sessions. Simply ignorewhat you do not currently need.
The most important operation is to bring the parallelism view's activities into a certain order. Theordering in the list corresponds to the ordering that will be used in the parallelism view after pressing
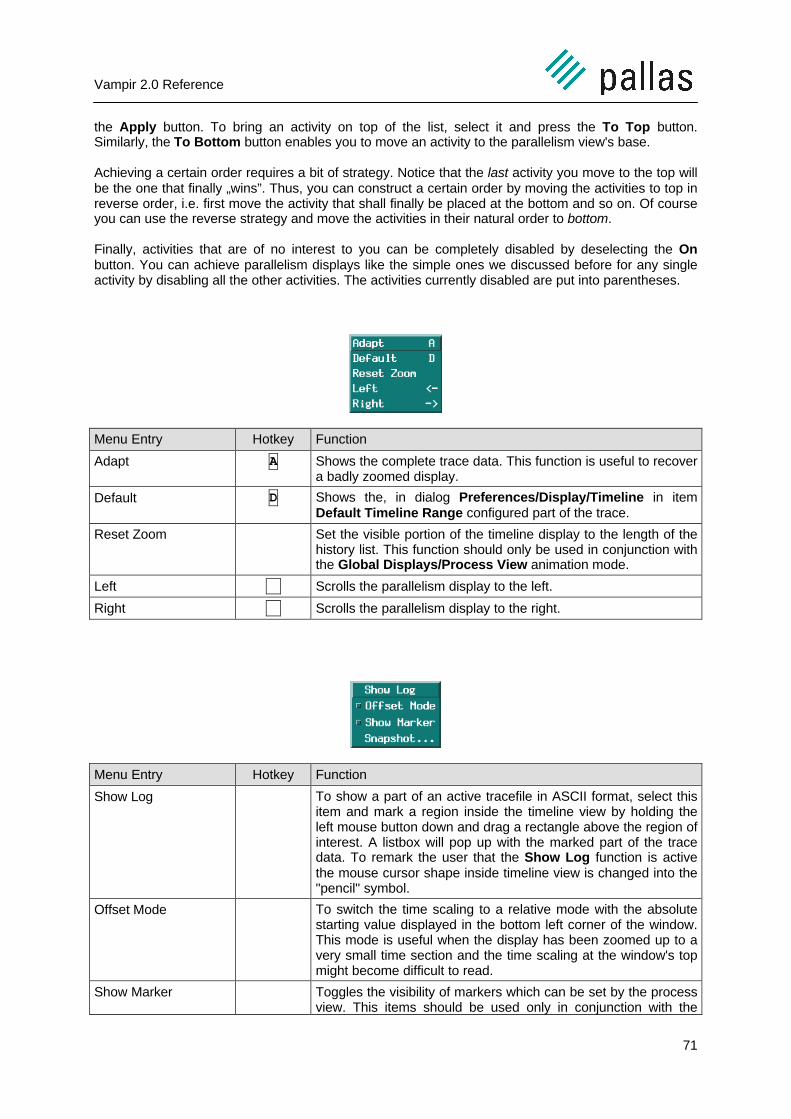
Vampir 2.0 Reference
71
the Apply button. To bring an activity on top of the list, select it and press the To Top button.Similarly, the To Bottom button enables you to move an activity to the parallelism view's base.
Achieving a certain order requires a bit of strategy. Notice that the last activity you move to the top willbe the one that finally „wins”. Thus, you can construct a certain order by moving the activities to top inreverse order, i.e. first move the activity that shall finally be placed at the bottom and so on. Of courseyou can use the reverse strategy and move the activities in their natural order to bottom.
Finally, activities that are of no interest to you can be completely disabled by deselecting the Onbutton. You can achieve parallelism displays like the simple ones we discussed before for any singleactivity by disabling all the other activities. The activities currently disabled are put into parentheses.
Menu Entry Hotkey Function
Adapt A Shows the complete trace data. This function is useful to recovera badly zoomed display.
Default D Shows the, in dialog Preferences/Display/Timeline in itemDefault Timeline Range configured part of the trace.
Reset Zoom Set the visible portion of the timeline display to the length of thehistory list. This function should only be used in conjunction withthe Global Displays/Process View animation mode.
Left àà Scrolls the parallelism display to the left.
Right ßß Scrolls the parallelism display to the right.
Menu Entry Hotkey Function
Show Log To show a part of an active tracefile in ASCII format, select thisitem and mark a region inside the timeline view by holding theleft mouse button down and drag a rectangle above the region ofinterest. A listbox will pop up with the marked part of the tracedata. To remark the user that the Show Log function is activethe mouse cursor shape inside timeline view is changed into the"pencil" symbol.
Offset Mode To switch the time scaling to a relative mode with the absolutestarting value displayed in the bottom left corner of the window.This mode is useful when the display has been zoomed up to avery small time section and the time scaling at the window's topmight become difficult to read.
Show Marker Toggles the visibility of markers which can be set by the processview. This items should be used only in conjunction with the

Vampir 2.0 Reference
72
Menu Entry Hotkey FunctionGlobal Displays/Process View animation mode.
Snapshot The Snapshot dialog will pop up as an interface to theImageMagick screen capture tool. See Section A.6.1 furtherdetails.

Vampir 2.0 Reference
73
A.3.7 Process View
Process View ALT-V Expert mode only
The traced activities can also be visualized in the Global Process view. Here, every process isdisplayed as a box. The size and arrangement of the boxes depend on the number of processes andthe geometry of the window and are automatically calculated by Vampir. Each box is partitioned into alower and an upper part. The lower part describes the current activity on the process whereas theupper part (called statistic field) shows the time portion in percent spent on a particular activity for theperiod under investigation. For monitoring reasons, the background color reflects the current valueprinted out, and the corresponding percentual values are listed on the right hand side of the window.
Figure 4.37 Global Process View
Figure 4.37 show the default appearance of the Process View. The window is divided in an upper partwhich shows the process boxes and a lower part with the control buttons and the time scrollbar.Nevertheless a context menu exist with several configuration dialogs and options.
All three mouse buttons have different functions inside this view. To select a single process perform asingle click with the left mouse button on the desired process. To select a couple of processes atonce press the left mouse button and drag a rectangular rubber-band above all desired processes,and then release the left mouse button. All selected processes are now shown with an inverse coloredborderline and label.
The middle mouse button is used to deselect all prior selected processes.
The right mouse button is used to popup the Global Process View context menu (see Figure 4.38).

Vampir 2.0 Reference
74
Figure 4.38 Global Process View Context menu
Menu Entry Hotkey Function
Close Q Close the Process display and all associated subwindows, andrestores the internal history list.
Restore History Whenever a movement in time occurs, whether event-by-eventor by a number of clock ticks, Vampir will store the recent statechanges in a list called history list. This list forms theinformation base for nearly all displays. By default, after loadinga trace file, the history list contains all state changes of theactual trace file. The maximum length of the history list in clockticks can be configured by the Preferences/Displays/Generaldialog.
Layout Start the Layout Configuration Dialog shown Figure 4.39.
Animation Params Start the Animation Configuration Dialog shown in Figure4.40.
Color Translation Start the Color Translation dialog shown in Figure 4.41.
Statistic Start the Statistic configuration dialog shown in Figure 4.42.
Marker Start the Marker dialog shown in Figure 4.43.
Text Window Start the Text view shown in Figure 4.44.
Source Window Start the Source view shown in Figure 4.45.
Print Starts the build-in postscript print function of Vampir.
Menu Entry Hotkey Function
Use Symbols Display the full activity and symbol names instead of thenumbers inside the process bars. This option is enabled bydefault.
Use Timeline Portion Activate this option to link the timeline view to the portion of timedisplayed by the global process view.
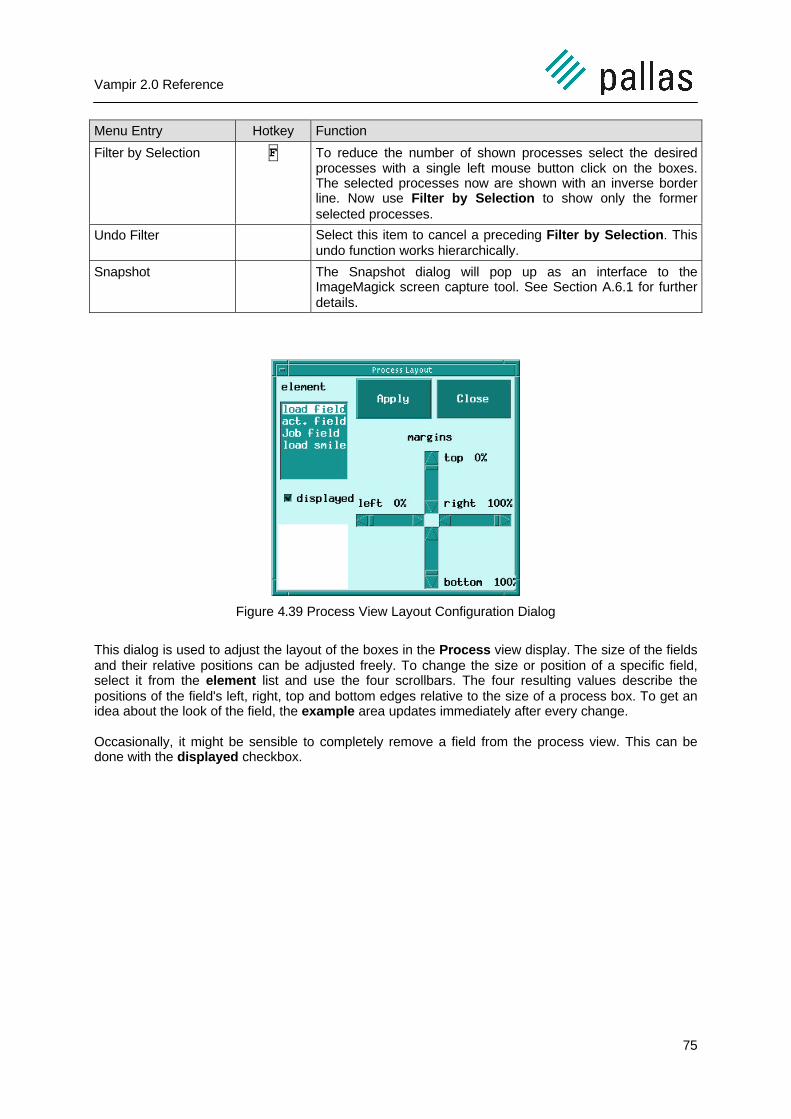
Vampir 2.0 Reference
75
Menu Entry Hotkey Function
Filter by Selection F To reduce the number of shown processes select the desiredprocesses with a single left mouse button click on the boxes.The selected processes now are shown with an inverse borderline. Now use Filter by Selection to show only the formerselected processes.
Undo Filter Select this item to cancel a preceding Filter by Selection. Thisundo function works hierarchically.
Snapshot The Snapshot dialog will pop up as an interface to theImageMagick screen capture tool. See Section A.6.1 for furtherdetails.
Figure 4.39 Process View Layout Configuration Dialog
This dialog is used to adjust the layout of the boxes in the Process view display. The size of the fieldsand their relative positions can be adjusted freely. To change the size or position of a specific field,select it from the element list and use the four scrollbars. The four resulting values describe thepositions of the field's left, right, top and bottom edges relative to the size of a process box. To get anidea about the look of the field, the example area updates immediately after every change.
Occasionally, it might be sensible to completely remove a field from the process view. This can bedone with the displayed checkbox.
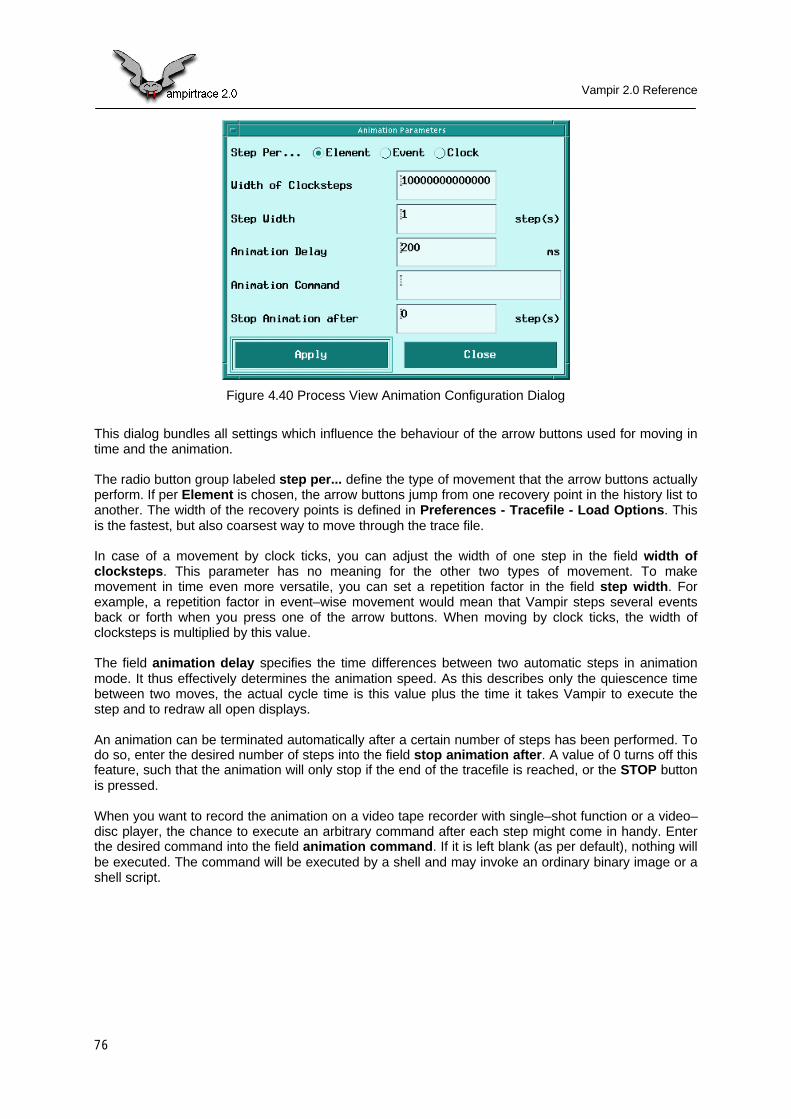
Vampir 2.0 Reference
76
Figure 4.40 Process View Animation Configuration Dialog
This dialog bundles all settings which influence the behaviour of the arrow buttons used for moving intime and the animation.
The radio button group labeled step per... define the type of movement that the arrow buttons actuallyperform. If per Element is chosen, the arrow buttons jump from one recovery point in the history list toanother. The width of the recovery points is defined in Preferences - Tracefile - Load Options. Thisis the fastest, but also coarsest way to move through the trace file.
In case of a movement by clock ticks, you can adjust the width of one step in the field width ofclocksteps. This parameter has no meaning for the other two types of movement. To makemovement in time even more versatile, you can set a repetition factor in the field step width. Forexample, a repetition factor in event–wise movement would mean that Vampir steps several eventsback or forth when you press one of the arrow buttons. When moving by clock ticks, the width ofclocksteps is multiplied by this value.
The field animation delay specifies the time differences between two automatic steps in animationmode. It thus effectively determines the animation speed. As this describes only the quiescence timebetween two moves, the actual cycle time is this value plus the time it takes Vampir to execute thestep and to redraw all open displays.
An animation can be terminated automatically after a certain number of steps has been performed. Todo so, enter the desired number of steps into the field stop animation after. A value of 0 turns off thisfeature, such that the animation will only stop if the end of the tracefile is reached, or the STOP buttonis pressed.
When you want to record the animation on a video tape recorder with single–shot function or a video–disc player, the chance to execute an arbitrary command after each step might come in handy. Enterthe desired command into the field animation command. If it is left blank (as per default), nothing willbe executed. The command will be executed by a shell and may invoke an ordinary binary image or ashell script.

Vampir 2.0 Reference
77
Figure 4.41 Process View Color Translation Dialog
The translation from percentual values to color shades done in the process state statistics field is notfixed. It can be modified with the shown dialog. The translation is based on a linear interpolationscheme. Vampir stores a list of fixed points between which the interpolation is done. The defaultsetting emphasizes big loads, as can be seen from the graph drawn in the bottom right corner of thedialog. This graph will always display the setting currently made in the dialog. This allows you to judgethe current setting before you accept it with the Apply button. The list of currently defined points isplaced in the lower left corner of the dialog. To delete a point, select it from the list and press Delete.Vampir will not accept deletions when there are only two points left, which of course is the minimumnumber for a linear interpolation.
To add a new point to the list, enter its coordinates into the two input fields load value and colorvalue and press Add. The load value can range from 0 to 100%, whereas the color value must bewithin 0 and 59. You can also use the two scrollbars next to the input fields to adjust the values.Vampir will reject points which would lead to a graph that is not monotonously growing, to keep thetranslation unique. If a point with the same load value already exists in the list, it will be replaced withthe new one.
The Default button resets the list to the default consisting of two points. The resulting graph is linear.
Figure 4.42 Process View Statistic Configuration Dialog
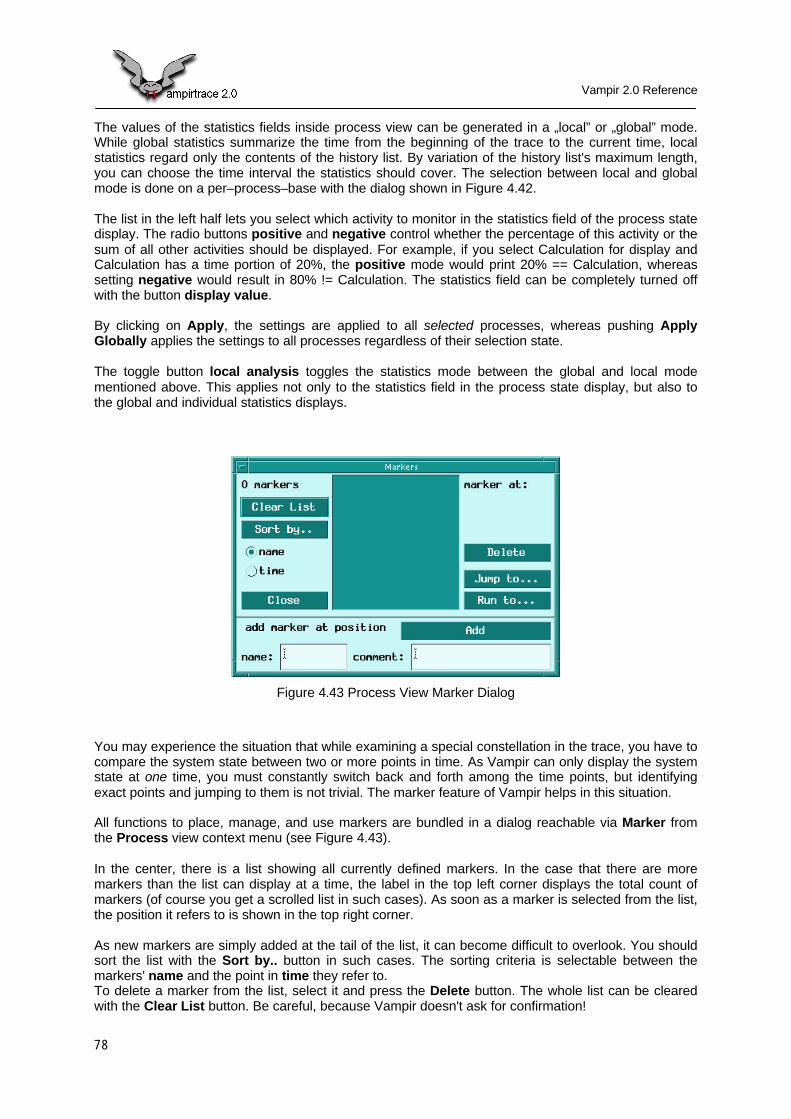
Vampir 2.0 Reference
78
The values of the statistics fields inside process view can be generated in a „local” or „global” mode.While global statistics summarize the time from the beginning of the trace to the current time, localstatistics regard only the contents of the history list. By variation of the history list's maximum length,you can choose the time interval the statistics should cover. The selection between local and globalmode is done on a per–process–base with the dialog shown in Figure 4.42.
The list in the left half lets you select which activity to monitor in the statistics field of the process statedisplay. The radio buttons positive and negative control whether the percentage of this activity or thesum of all other activities should be displayed. For example, if you select Calculation for display andCalculation has a time portion of 20%, the positive mode would print 20% == Calculation, whereassetting negative would result in 80% != Calculation. The statistics field can be completely turned offwith the button display value.
By clicking on Apply, the settings are applied to all selected processes, whereas pushing ApplyGlobally applies the settings to all processes regardless of their selection state.
The toggle button local analysis toggles the statistics mode between the global and local modementioned above. This applies not only to the statistics field in the process state display, but also tothe global and individual statistics displays.
Figure 4.43 Process View Marker Dialog
You may experience the situation that while examining a special constellation in the trace, you have tocompare the system state between two or more points in time. As Vampir can only display the systemstate at one time, you must constantly switch back and forth among the time points, but identifyingexact points and jumping to them is not trivial. The marker feature of Vampir helps in this situation.
All functions to place, manage, and use markers are bundled in a dialog reachable via Marker fromthe Process view context menu (see Figure 4.43).
In the center, there is a list showing all currently defined markers. In the case that there are moremarkers than the list can display at a time, the label in the top left corner displays the total count ofmarkers (of course you get a scrolled list in such cases). As soon as a marker is selected from the list,the position it refers to is shown in the top right corner.
As new markers are simply added at the tail of the list, it can become difficult to overlook. You shouldsort the list with the Sort by.. button in such cases. The sorting criteria is selectable between themarkers' name and the point in time they refer to.To delete a marker from the list, select it and press the Delete button. The whole list can be clearedwith the Clear List button. Be careful, because Vampir doesn't ask for confirmation!
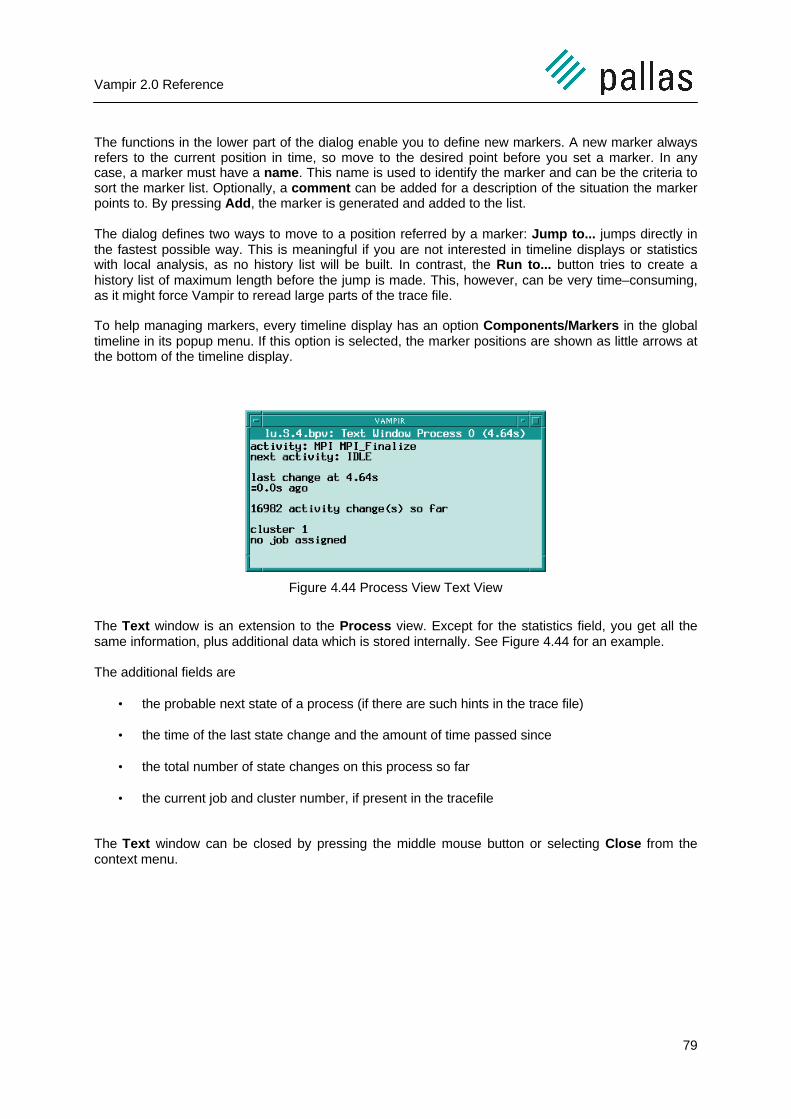
Vampir 2.0 Reference
79
The functions in the lower part of the dialog enable you to define new markers. A new marker alwaysrefers to the current position in time, so move to the desired point before you set a marker. In anycase, a marker must have a name. This name is used to identify the marker and can be the criteria tosort the marker list. Optionally, a comment can be added for a description of the situation the markerpoints to. By pressing Add, the marker is generated and added to the list.
The dialog defines two ways to move to a position referred by a marker: Jump to... jumps directly inthe fastest possible way. This is meaningful if you are not interested in timeline displays or statisticswith local analysis, as no history list will be built. In contrast, the Run to... button tries to create ahistory list of maximum length before the jump is made. This, however, can be very time–consuming,as it might force Vampir to reread large parts of the trace file.
To help managing markers, every timeline display has an option Components/Markers in the globaltimeline in its popup menu. If this option is selected, the marker positions are shown as little arrows atthe bottom of the timeline display.
Figure 4.44 Process View Text View
The Text window is an extension to the Process view. Except for the statistics field, you get all thesame information, plus additional data which is stored internally. See Figure 4.44 for an example.
The additional fields are
• the probable next state of a process (if there are such hints in the trace file)
• the time of the last state change and the amount of time passed since
• the total number of state changes on this process so far
• the current job and cluster number, if present in the tracefile
The Text window can be closed by pressing the middle mouse button or selecting Close from thecontext menu.
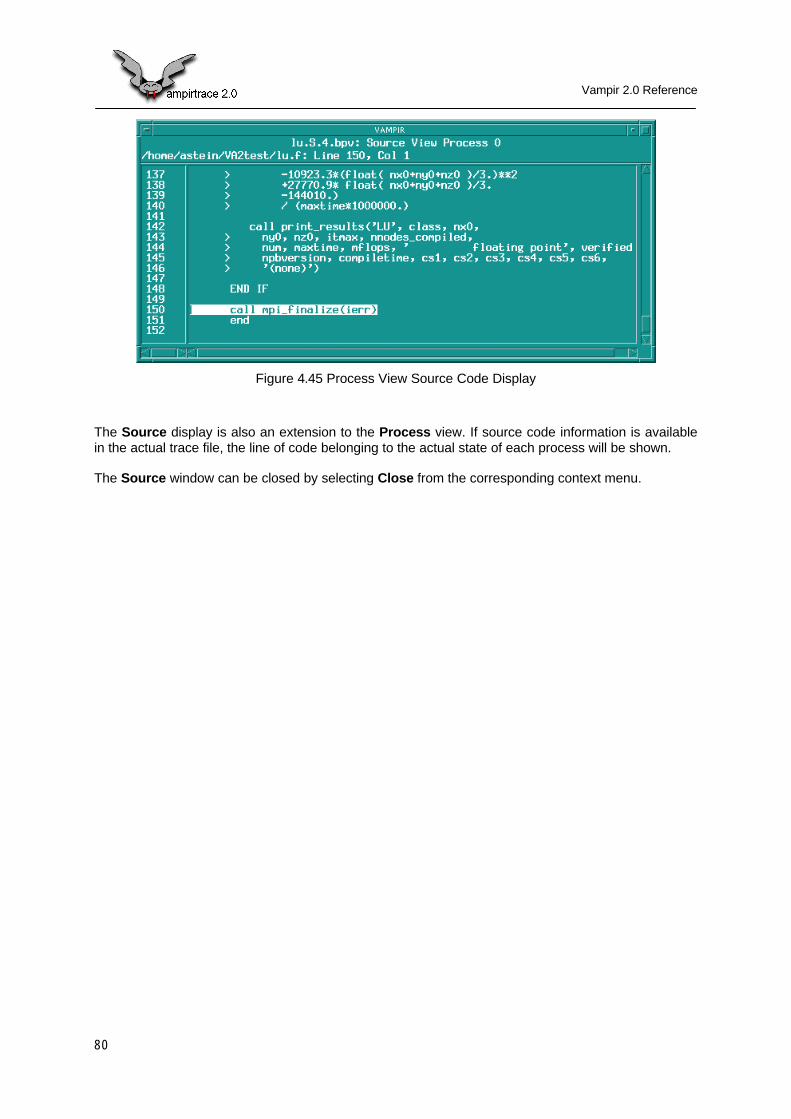
Vampir 2.0 Reference
80
Figure 4.45 Process View Source Code Display
The Source display is also an extension to the Process view. If source code information is availablein the actual trace file, the line of code belonging to the actual state of each process will be shown.
The Source window can be closed by selecting Close from the corresponding context menu.
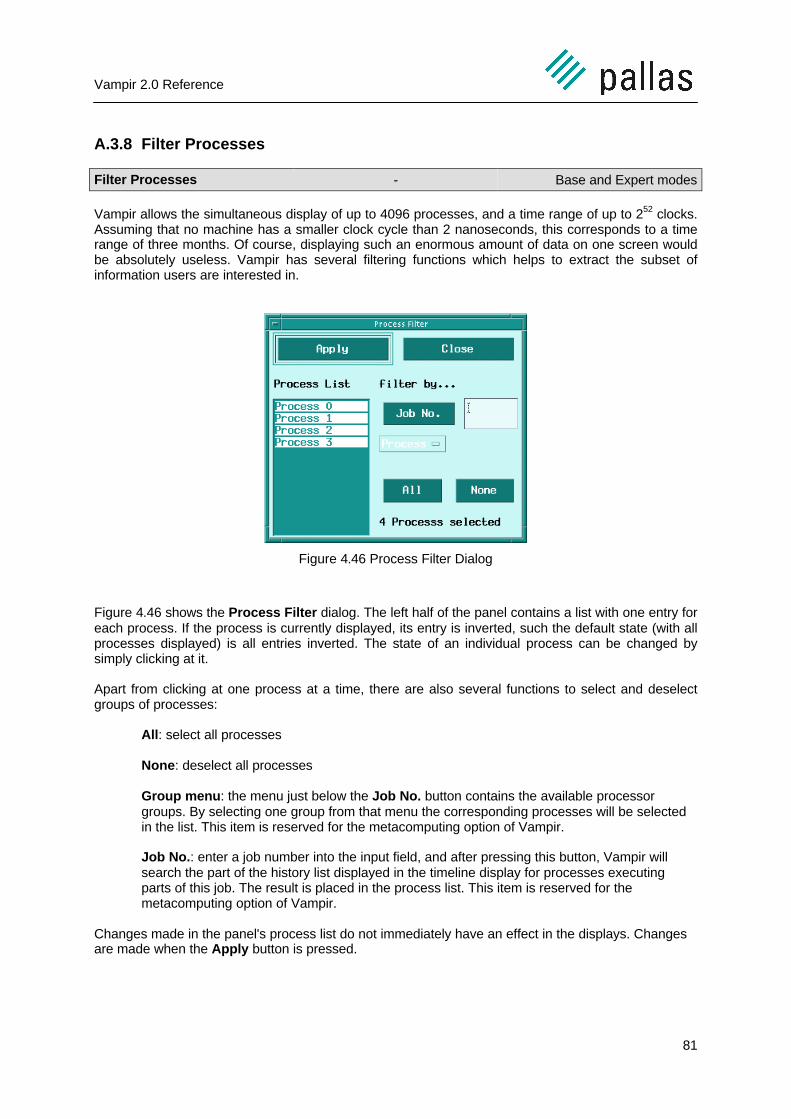
Vampir 2.0 Reference
81
A.3.8 Filter Processes
Filter Processes - Base and Expert modes
Vampir allows the simultaneous display of up to 4096 processes, and a time range of up to 252 clocks.Assuming that no machine has a smaller clock cycle than 2 nanoseconds, this corresponds to a timerange of three months. Of course, displaying such an enormous amount of data on one screen wouldbe absolutely useless. Vampir has several filtering functions which helps to extract the subset ofinformation users are interested in.
Figure 4.46 Process Filter Dialog
Figure 4.46 shows the Process Filter dialog. The left half of the panel contains a list with one entry foreach process. If the process is currently displayed, its entry is inverted, such the default state (with allprocesses displayed) is all entries inverted. The state of an individual process can be changed bysimply clicking at it.
Apart from clicking at one process at a time, there are also several functions to select and deselectgroups of processes:
All: select all processes
None: deselect all processes
Group menu: the menu just below the Job No. button contains the available processorgroups. By selecting one group from that menu the corresponding processes will be selectedin the list. This item is reserved for the metacomputing option of Vampir.
Job No.: enter a job number into the input field, and after pressing this button, Vampir willsearch the part of the history list displayed in the timeline display for processes executingparts of this job. The result is placed in the process list. This item is reserved for themetacomputing option of Vampir.
Changes made in the panel's process list do not immediately have an effect in the displays. Changesare made when the Apply button is pressed.
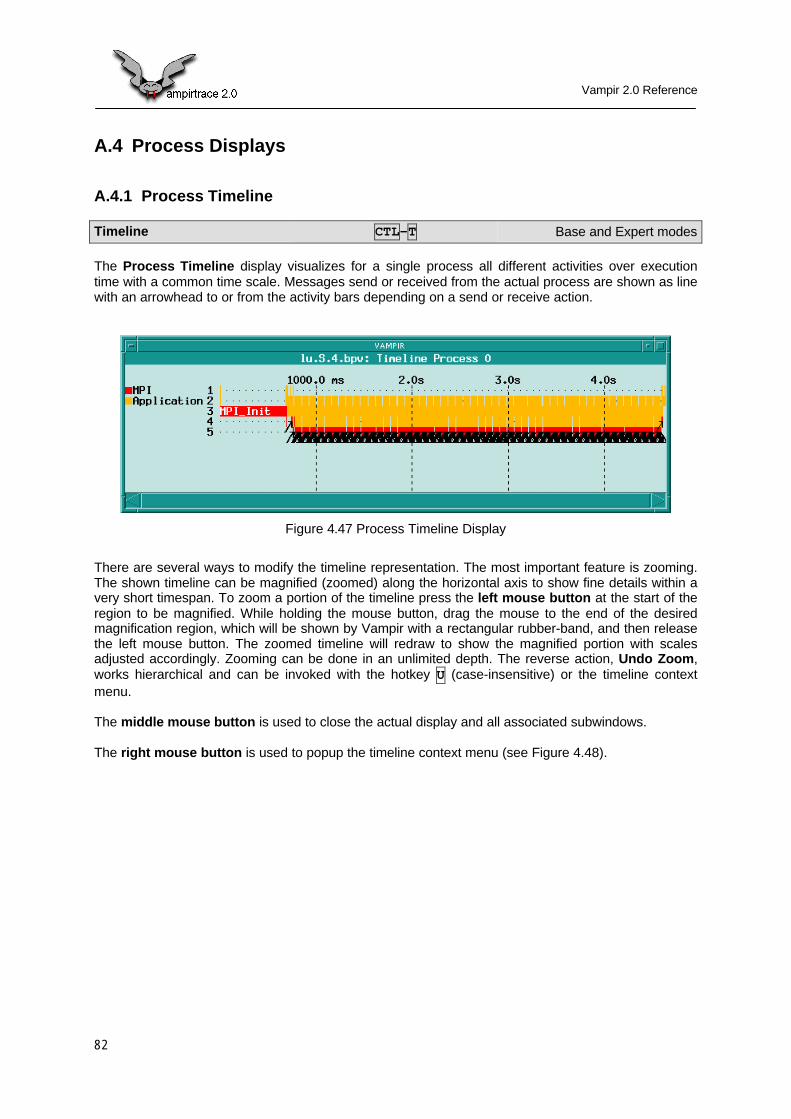
Vampir 2.0 Reference
82
A.4 Process Displays
A.4.1 Process Timeline
Timeline CTL-T Base and Expert modes
The Process Timeline display visualizes for a single process all different activities over executiontime with a common time scale. Messages send or received from the actual process are shown as linewith an arrowhead to or from the activity bars depending on a send or receive action.
Figure 4.47 Process Timeline Display
There are several ways to modify the timeline representation. The most important feature is zooming.The shown timeline can be magnified (zoomed) along the horizontal axis to show fine details within avery short timespan. To zoom a portion of the timeline press the left mouse button at the start of theregion to be magnified. While holding the mouse button, drag the mouse to the end of the desiredmagnification region, which will be shown by Vampir with a rectangular rubber-band, and then releasethe left mouse button. The zoomed timeline will redraw to show the magnified portion with scalesadjusted accordingly. Zooming can be done in an unlimited depth. The reverse action, Undo Zoom,works hierarchical and can be invoked with the hotkey U (case-insensitive) or the timeline contextmenu.
The middle mouse button is used to close the actual display and all associated subwindows.
The right mouse button is used to popup the timeline context menu (see Figure 4.48).
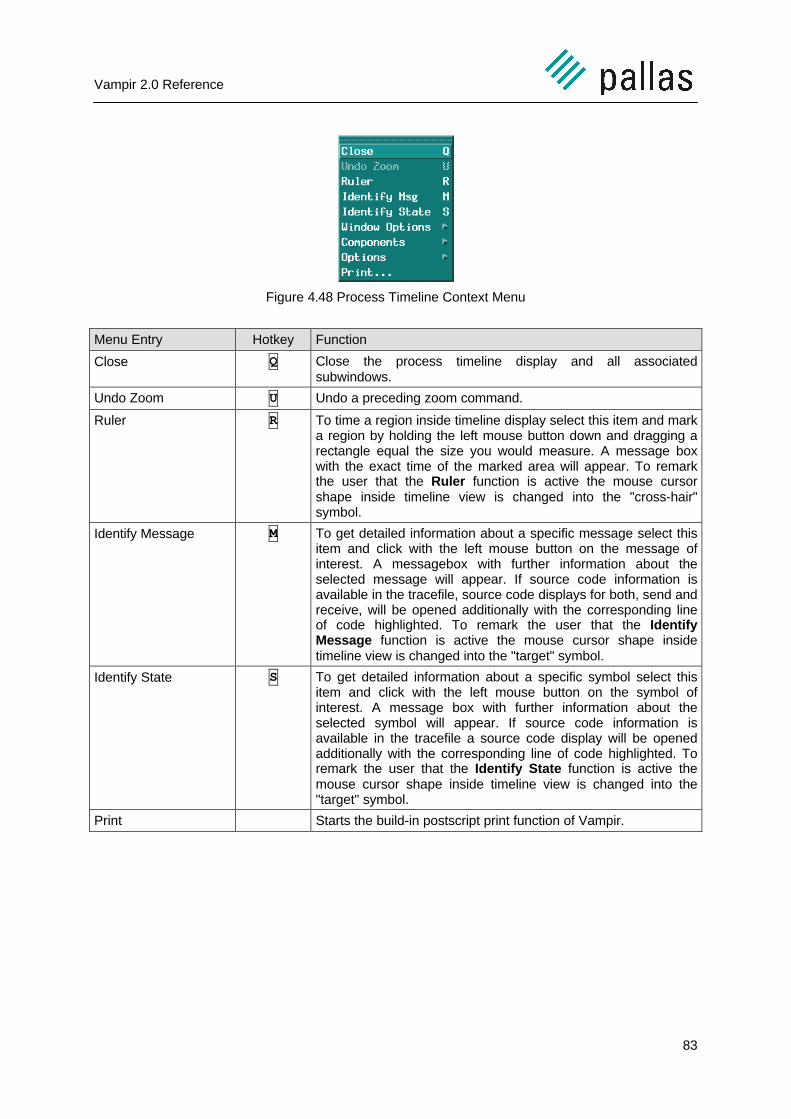
Vampir 2.0 Reference
83
Figure 4.48 Process Timeline Context Menu
Menu Entry Hotkey Function
Close Q Close the process timeline display and all associatedsubwindows.
Undo Zoom U Undo a preceding zoom command.
Ruler R To time a region inside timeline display select this item and marka region by holding the left mouse button down and dragging arectangle equal the size you would measure. A message boxwith the exact time of the marked area will appear. To remarkthe user that the Ruler function is active the mouse cursorshape inside timeline view is changed into the "cross-hair"symbol.
Identify Message M To get detailed information about a specific message select thisitem and click with the left mouse button on the message ofinterest. A messagebox with further information about theselected message will appear. If source code information isavailable in the tracefile, source code displays for both, send andreceive, will be opened additionally with the corresponding lineof code highlighted. To remark the user that the IdentifyMessage function is active the mouse cursor shape insidetimeline view is changed into the "target" symbol.
Identify State S To get detailed information about a specific symbol select thisitem and click with the left mouse button on the symbol ofinterest. A message box with further information about theselected symbol will appear. If source code information isavailable in the tracefile a source code display will be openedadditionally with the corresponding line of code highlighted. Toremark the user that the Identify State function is active themouse cursor shape inside timeline view is changed into the"target" symbol.
Print Starts the build-in postscript print function of Vampir.
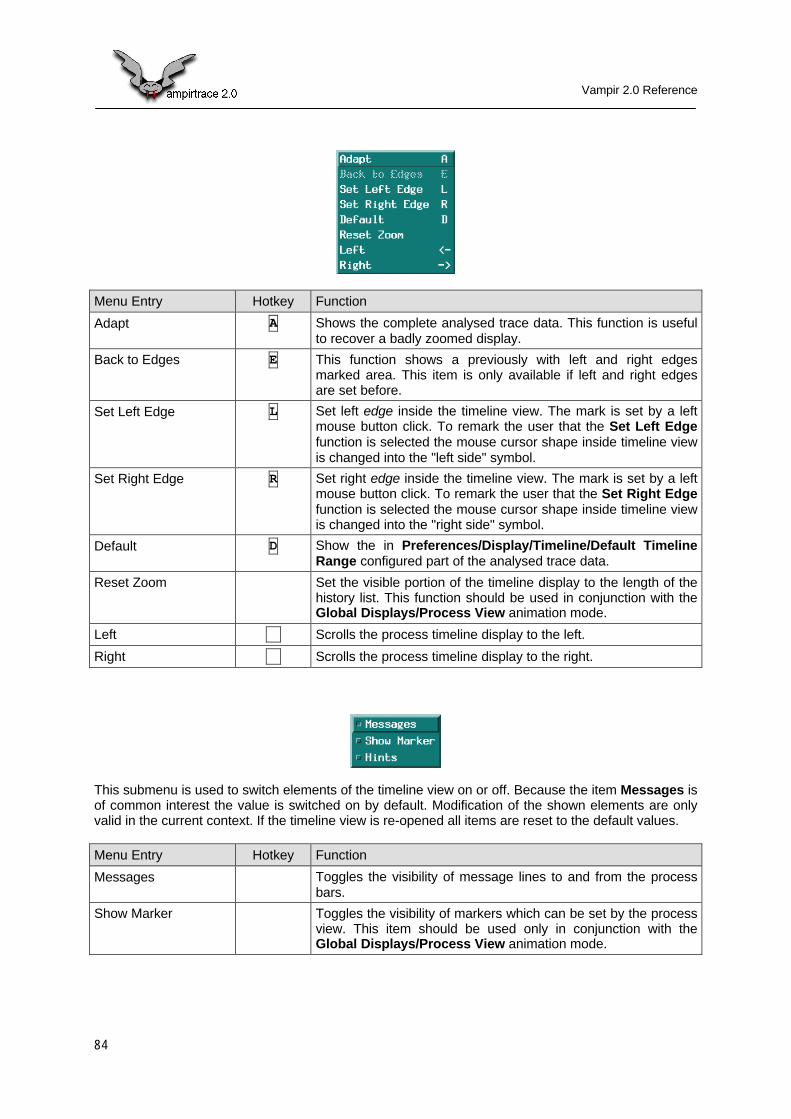
Vampir 2.0 Reference
84
Menu Entry Hotkey Function
Adapt A Shows the complete analysed trace data. This function is usefulto recover a badly zoomed display.
Back to Edges E This function shows a previously with left and right edgesmarked area. This item is only available if left and right edgesare set before.
Set Left Edge L Set left edge inside the timeline view. The mark is set by a leftmouse button click. To remark the user that the Set Left Edgefunction is selected the mouse cursor shape inside timeline viewis changed into the "left side" symbol.
Set Right Edge R Set right edge inside the timeline view. The mark is set by a leftmouse button click. To remark the user that the Set Right Edgefunction is selected the mouse cursor shape inside timeline viewis changed into the "right side" symbol.
Default D Show the in Preferences/Display/Timeline/Default TimelineRange configured part of the analysed trace data.
Reset Zoom Set the visible portion of the timeline display to the length of thehistory list. This function should be used in conjunction with theGlobal Displays/Process View animation mode.
Left àà Scrolls the process timeline display to the left.
Right ßß Scrolls the process timeline display to the right.
This submenu is used to switch elements of the timeline view on or off. Because the item Messages isof common interest the value is switched on by default. Modification of the shown elements are onlyvalid in the current context. If the timeline view is re-opened all items are reset to the default values.
Menu Entry Hotkey Function
Messages Toggles the visibility of message lines to and from the processbars.
Show Marker Toggles the visibility of markers which can be set by the processview. This item should be used only in conjunction with theGlobal Displays/Process View animation mode.

Vampir 2.0 Reference
85
Menu Entry Hotkey Function
Hints Toggles the visibility of activity changes on top of the processbars. This feature is useful for cases where not enough space isavailable to print activity changes inside the process bars. So allchanges are still directly visible.
Menu Entry Hotkey Function
Show Log To show a part of the active tracefile in ASCII format select thisitem and mark a region inside the timeline view by holding theleft mouse button down and drag a rectangle above the region ofinterest. A listbox will pop up with the marked part of the tracedata. To remark the user that the Show Log function is activethe mouse cursor shape inside timeline view is changed into the"pencil" symbol.
Guess Calls This option changes the y-axis unit from activities to a call level.
Offset Mode To switch the time scaling to a relative mode with the absolutestarting value displayed in the bottom left corner of the window.This mode is useful when the display has been zoomed up to avery small time section and the time scaling at the window's topmight become difficult to read.
Use Symbols Display the full activity and symbol names instead of thenumbers inside the process bars. This option is enabled bydefault.
Snapshot The Snapshot dialog will pop up as an interface to theImageMagick screen capture tool. See Section A.6.1 for furtherdetails.
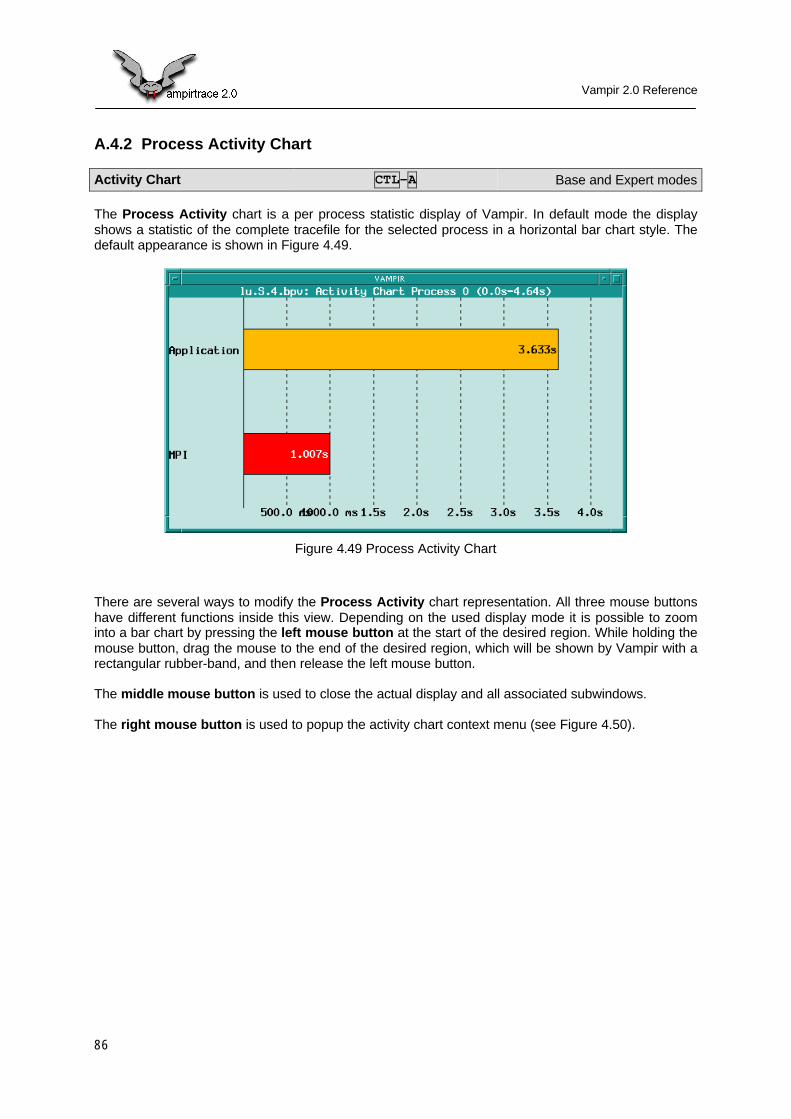
Vampir 2.0 Reference
86
A.4.2 Process Activity Chart
Activity Chart CTL-A Base and Expert modes
The Process Activity chart is a per process statistic display of Vampir. In default mode the displayshows a statistic of the complete tracefile for the selected process in a horizontal bar chart style. Thedefault appearance is shown in Figure 4.49.
Figure 4.49 Process Activity Chart
There are several ways to modify the Process Activity chart representation. All three mouse buttonshave different functions inside this view. Depending on the used display mode it is possible to zoominto a bar chart by pressing the left mouse button at the start of the desired region. While holding themouse button, drag the mouse to the end of the desired region, which will be shown by Vampir with arectangular rubber-band, and then release the left mouse button.
The middle mouse button is used to close the actual display and all associated subwindows.
The right mouse button is used to popup the activity chart context menu (see Figure 4.50).
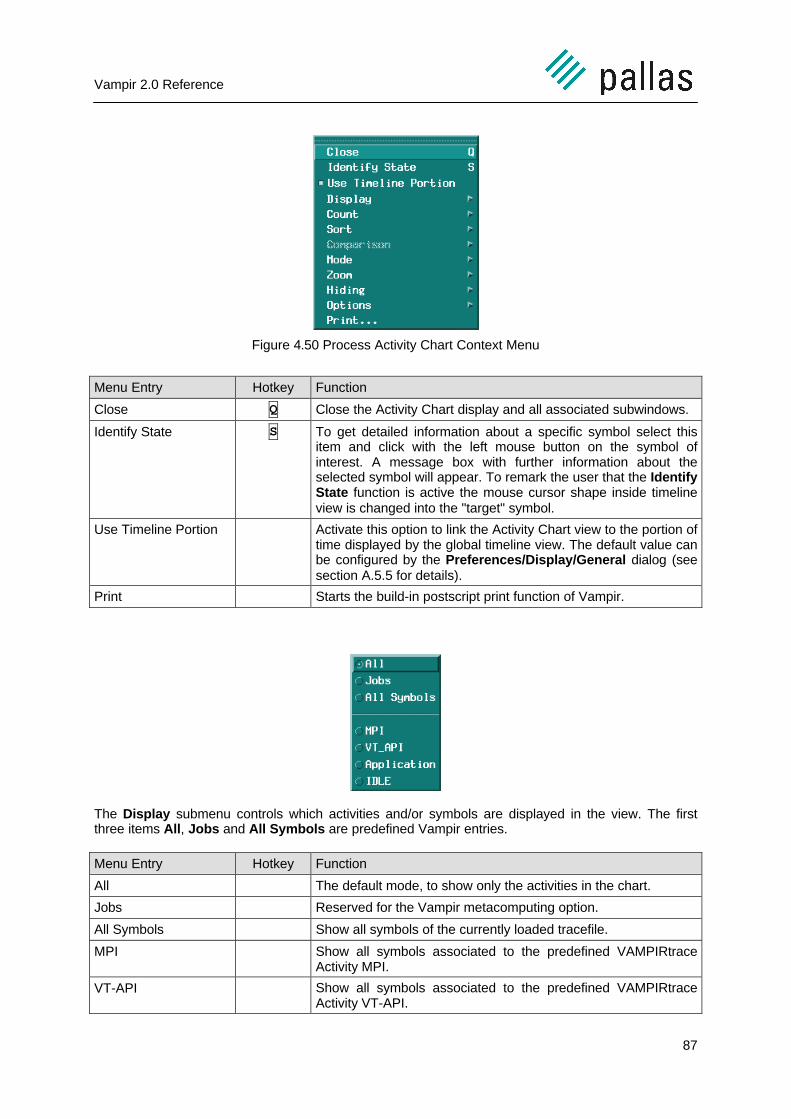
Vampir 2.0 Reference
87
Figure 4.50 Process Activity Chart Context Menu
Menu Entry Hotkey Function
Close Q Close the Activity Chart display and all associated subwindows.
Identify State S To get detailed information about a specific symbol select thisitem and click with the left mouse button on the symbol ofinterest. A message box with further information about theselected symbol will appear. To remark the user that the IdentifyState function is active the mouse cursor shape inside timelineview is changed into the "target" symbol.
Use Timeline Portion Activate this option to link the Activity Chart view to the portion oftime displayed by the global timeline view. The default value canbe configured by the Preferences/Display/General dialog (seesection A.5.5 for details).
Print Starts the build-in postscript print function of Vampir.
The Display submenu controls which activities and/or symbols are displayed in the view. The firstthree items All, Jobs and All Symbols are predefined Vampir entries.
Menu Entry Hotkey Function
All The default mode, to show only the activities in the chart.
Jobs Reserved for the Vampir metacomputing option.
All Symbols Show all symbols of the currently loaded tracefile.
MPI Show all symbols associated to the predefined VAMPIRtraceActivity MPI.
VT-API Show all symbols associated to the predefined VAMPIRtraceActivity VT-API.
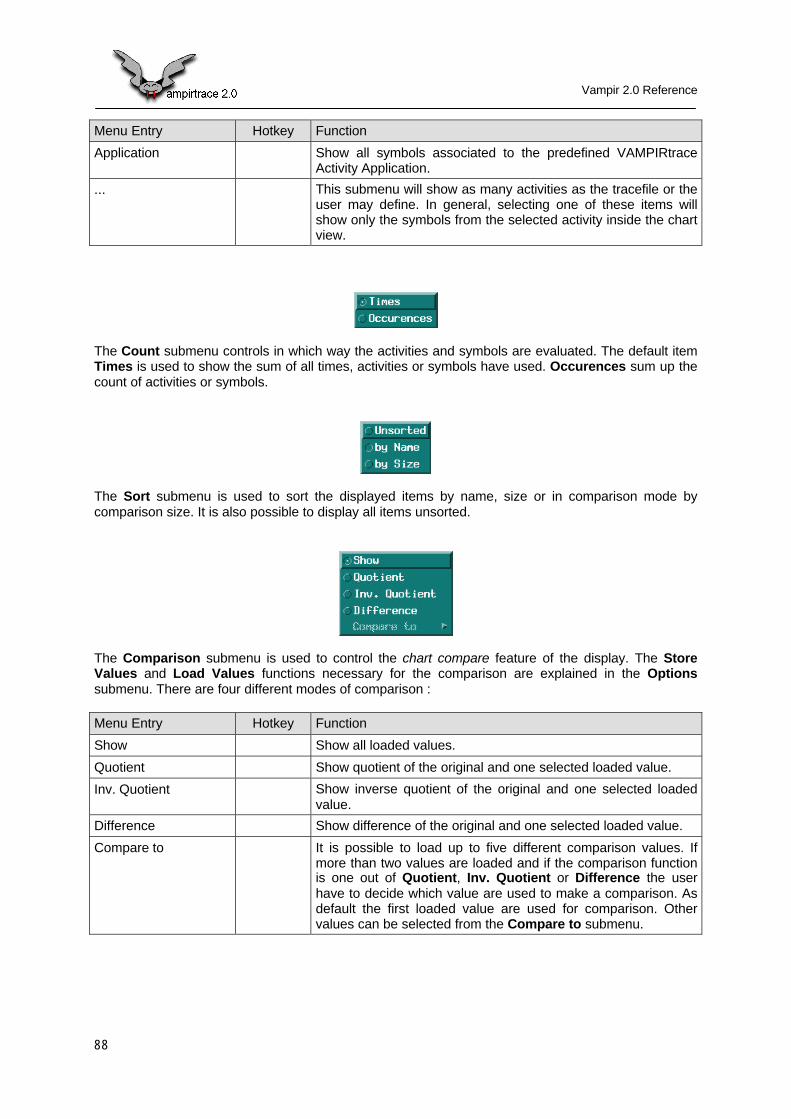
Vampir 2.0 Reference
88
Menu Entry Hotkey Function
Application Show all symbols associated to the predefined VAMPIRtraceActivity Application.
... This submenu will show as many activities as the tracefile or theuser may define. In general, selecting one of these items willshow only the symbols from the selected activity inside the chartview.
The Count submenu controls in which way the activities and symbols are evaluated. The default itemTimes is used to show the sum of all times, activities or symbols have used. Occurences sum up thecount of activities or symbols.
The Sort submenu is used to sort the displayed items by name, size or in comparison mode bycomparison size. It is also possible to display all items unsorted.
The Comparison submenu is used to control the chart compare feature of the display. The StoreValues and Load Values functions necessary for the comparison are explained in the Optionssubmenu. There are four different modes of comparison :
Menu Entry Hotkey Function
Show Show all loaded values.
Quotient Show quotient of the original and one selected loaded value.
Inv. Quotient Show inverse quotient of the original and one selected loadedvalue.
Difference Show difference of the original and one selected loaded value.
Compare to It is possible to load up to five different comparison values. Ifmore than two values are loaded and if the comparison functionis one out of Quotient, Inv. Quotient or Difference the userhave to decide which value are used to make a comparison. Asdefault the first loaded value are used for comparison. Othervalues can be selected from the Compare to submenu.
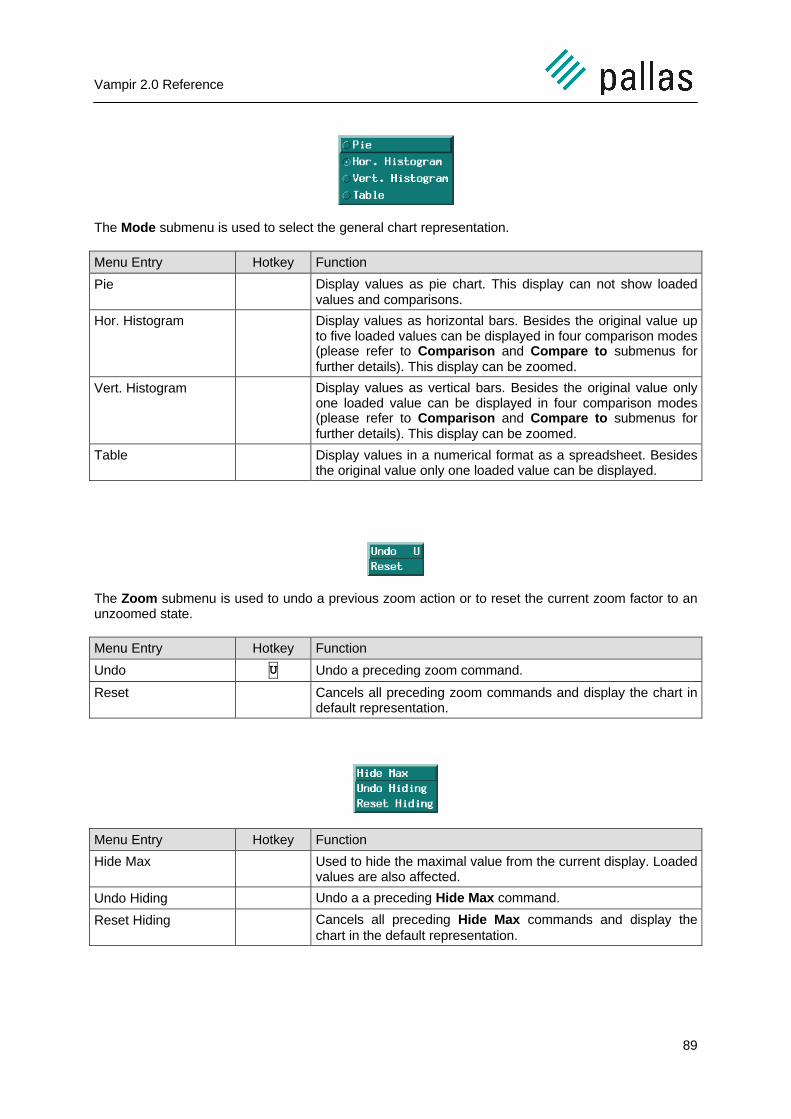
Vampir 2.0 Reference
89
The Mode submenu is used to select the general chart representation.
Menu Entry Hotkey Function
Pie Display values as pie chart. This display can not show loadedvalues and comparisons.
Hor. Histogram Display values as horizontal bars. Besides the original value upto five loaded values can be displayed in four comparison modes(please refer to Comparison and Compare to submenus forfurther details). This display can be zoomed.
Vert. Histogram Display values as vertical bars. Besides the original value onlyone loaded value can be displayed in four comparison modes(please refer to Comparison and Compare to submenus forfurther details). This display can be zoomed.
Table Display values in a numerical format as a spreadsheet. Besidesthe original value only one loaded value can be displayed.
The Zoom submenu is used to undo a previous zoom action or to reset the current zoom factor to anunzoomed state.
Menu Entry Hotkey Function
Undo U Undo a preceding zoom command.
Reset Cancels all preceding zoom commands and display the chart indefault representation.
Menu Entry Hotkey Function
Hide Max Used to hide the maximal value from the current display. Loadedvalues are also affected.
Undo Hiding Undo a a preceding Hide Max command.
Reset Hiding Cancels all preceding Hide Max commands and display thechart in the default representation.
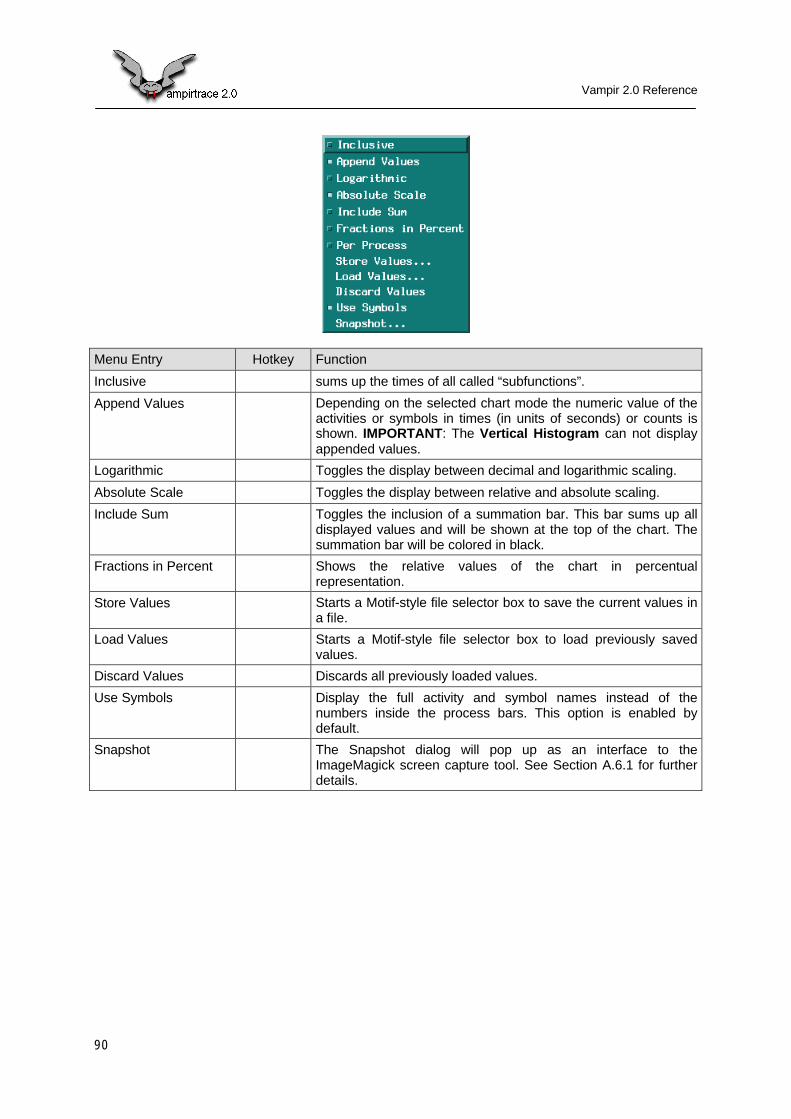
Vampir 2.0 Reference
90
Menu Entry Hotkey Function
Inclusive sums up the times of all called “subfunctions”.
Append Values Depending on the selected chart mode the numeric value of theactivities or symbols in times (in units of seconds) or counts isshown. IMPORTANT: The Vertical Histogram can not displayappended values.
Logarithmic Toggles the display between decimal and logarithmic scaling.
Absolute Scale Toggles the display between relative and absolute scaling.
Include Sum Toggles the inclusion of a summation bar. This bar sums up alldisplayed values and will be shown at the top of the chart. Thesummation bar will be colored in black.
Fractions in Percent Shows the relative values of the chart in percentualrepresentation.
Store Values Starts a Motif-style file selector box to save the current values ina file.
Load Values Starts a Motif-style file selector box to load previously savedvalues.
Discard Values Discards all previously loaded values.
Use Symbols Display the full activity and symbol names instead of thenumbers inside the process bars. This option is enabled bydefault.
Snapshot The Snapshot dialog will pop up as an interface to theImageMagick screen capture tool. See Section A.6.1 for furtherdetails.
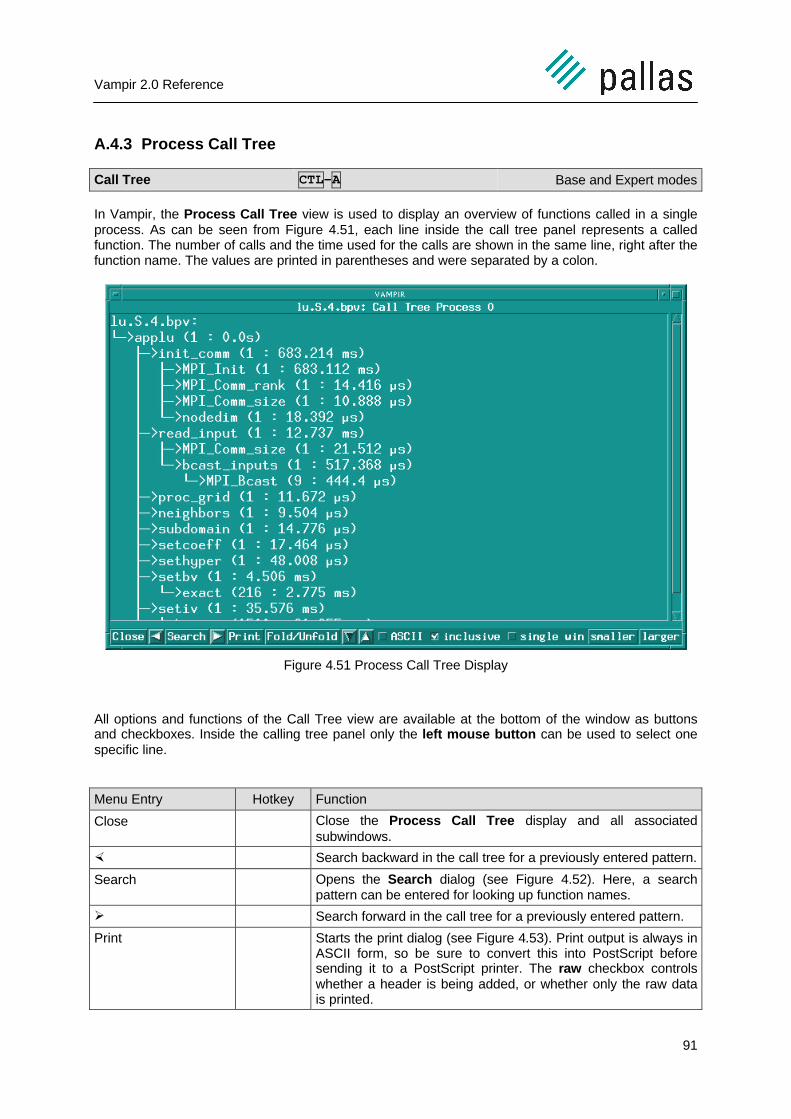
Vampir 2.0 Reference
91
A.4.3 Process Call Tree
Call Tree CTL-A Base and Expert modes
In Vampir, the Process Call Tree view is used to display an overview of functions called in a singleprocess. As can be seen from Figure 4.51, each line inside the call tree panel represents a calledfunction. The number of calls and the time used for the calls are shown in the same line, right after thefunction name. The values are printed in parentheses and were separated by a colon.
Figure 4.51 Process Call Tree Display
All options and functions of the Call Tree view are available at the bottom of the window as buttonsand checkboxes. Inside the calling tree panel only the left mouse button can be used to select onespecific line.
Menu Entry Hotkey Function
Close Close the Process Call Tree display and all associatedsubwindows.
× Search backward in the call tree for a previously entered pattern.
Search Opens the Search dialog (see Figure 4.52). Here, a searchpattern can be entered for looking up function names.
Ø Search forward in the call tree for a previously entered pattern.
Print Starts the print dialog (see Figure 4.53). Print output is always inASCII form, so be sure to convert this into PostScript beforesending it to a PostScript printer. The raw checkbox controlswhether a header is being added, or whether only the raw datais printed.
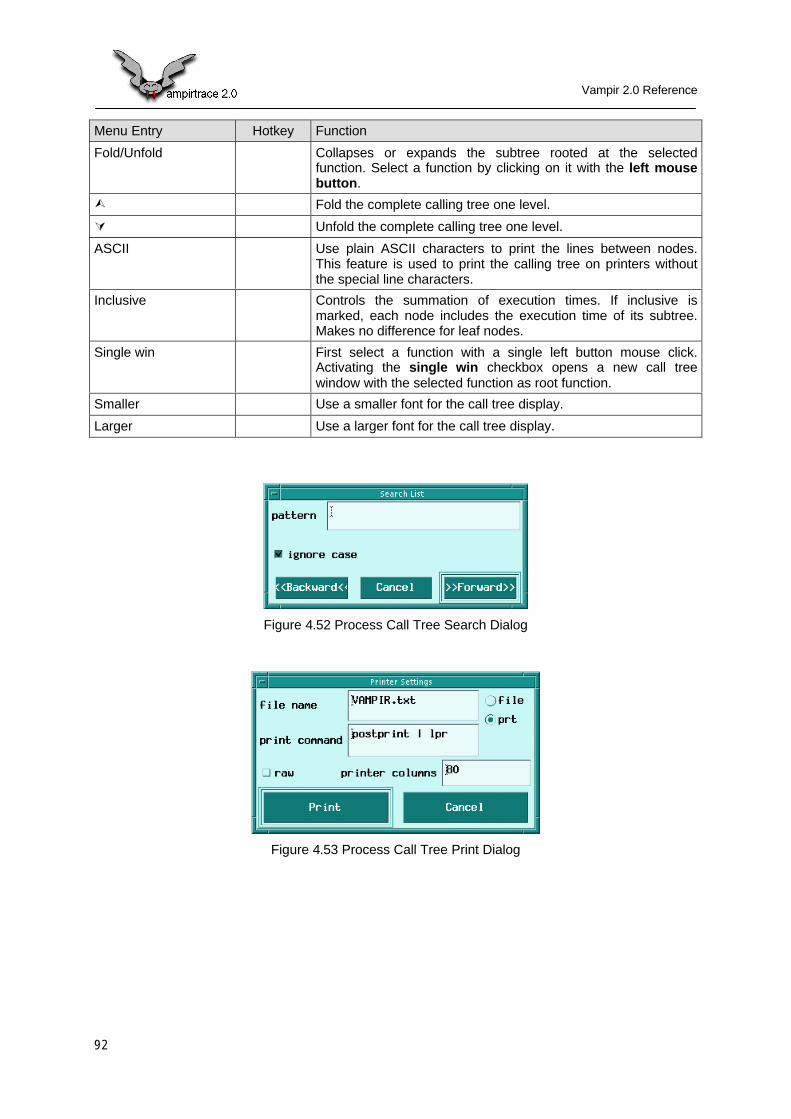
Vampir 2.0 Reference
92
Menu Entry Hotkey Function
Fold/Unfold Collapses or expands the subtree rooted at the selectedfunction. Select a function by clicking on it with the left mousebutton.
Ù Fold the complete calling tree one level.
Ú Unfold the complete calling tree one level.
ASCII Use plain ASCII characters to print the lines between nodes.This feature is used to print the calling tree on printers withoutthe special line characters.
Inclusive Controls the summation of execution times. If inclusive ismarked, each node includes the execution time of its subtree.Makes no difference for leaf nodes.
Single win First select a function with a single left button mouse click.Activating the single win checkbox opens a new call treewindow with the selected function as root function.
Smaller Use a smaller font for the call tree display.
Larger Use a larger font for the call tree display.
Figure 4.52 Process Call Tree Search Dialog
Figure 4.53 Process Call Tree Print Dialog
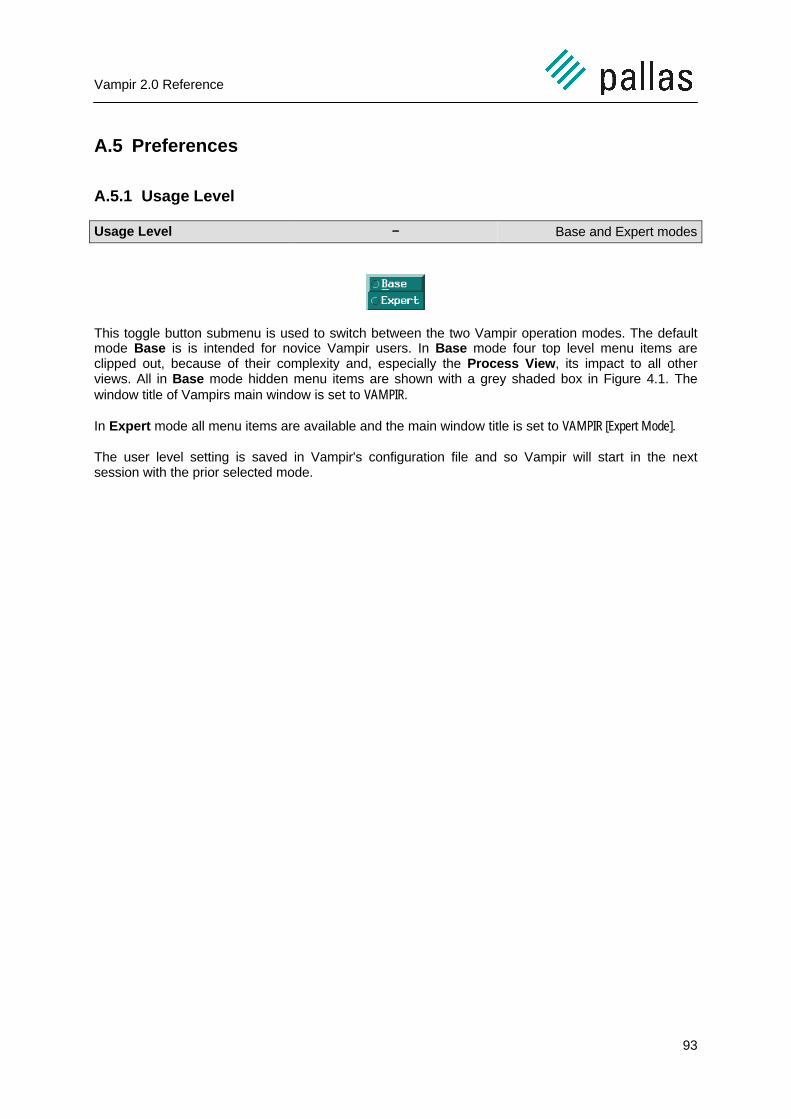
Vampir 2.0 Reference
93
A.5 Preferences
A.5.1 Usage Level
Usage Level - Base and Expert modes
This toggle button submenu is used to switch between the two Vampir operation modes. The defaultmode Base is is intended for novice Vampir users. In Base mode four top level menu items areclipped out, because of their complexity and, especially the Process View, its impact to all otherviews. All in Base mode hidden menu items are shown with a grey shaded box in Figure 4.1. Thewindow title of Vampirs main window is set to VAMPIR.
In Expert mode all menu items are available and the main window title is set to VAMPIR [Expert Mode].
The user level setting is saved in Vampir's configuration file and so Vampir will start in the nextsession with the prior selected mode.
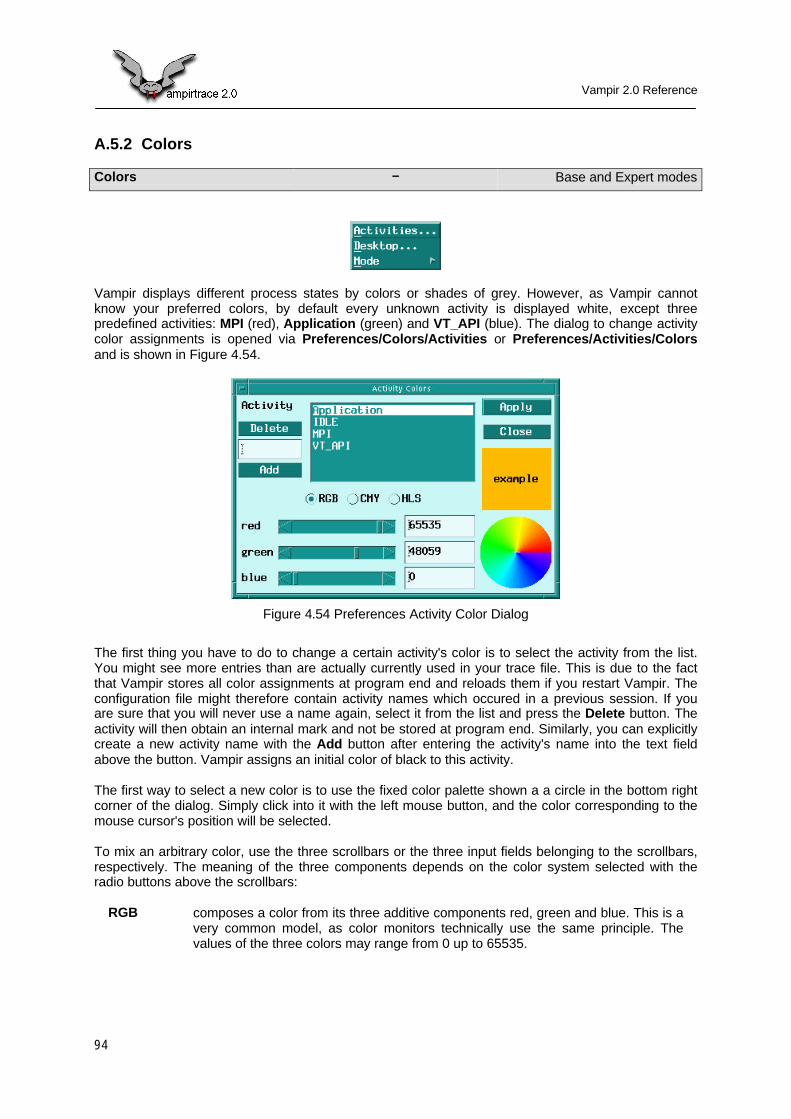
Vampir 2.0 Reference
94
A.5.2 Colors
Colors - Base and Expert modes
Vampir displays different process states by colors or shades of grey. However, as Vampir cannotknow your preferred colors, by default every unknown activity is displayed white, except threepredefined activities: MPI (red), Application (green) and VT_API (blue). The dialog to change activitycolor assignments is opened via Preferences/Colors/Activities or Preferences/Activities/Colorsand is shown in Figure 4.54.
Figure 4.54 Preferences Activity Color Dialog
The first thing you have to do to change a certain activity's color is to select the activity from the list.You might see more entries than are actually currently used in your trace file. This is due to the factthat Vampir stores all color assignments at program end and reloads them if you restart Vampir. Theconfiguration file might therefore contain activity names which occured in a previous session. If youare sure that you will never use a name again, select it from the list and press the Delete button. Theactivity will then obtain an internal mark and not be stored at program end. Similarly, you can explicitlycreate a new activity name with the Add button after entering the activity's name into the text fieldabove the button. Vampir assigns an initial color of black to this activity.
The first way to select a new color is to use the fixed color palette shown a a circle in the bottom rightcorner of the dialog. Simply click into it with the left mouse button, and the color corresponding to themouse cursor's position will be selected.
To mix an arbitrary color, use the three scrollbars or the three input fields belonging to the scrollbars,respectively. The meaning of the three components depends on the color system selected with theradio buttons above the scrollbars:
RGB composes a color from its three additive components red, green and blue. This is avery common model, as color monitors technically use the same principle. Thevalues of the three colors may range from 0 up to 65535.
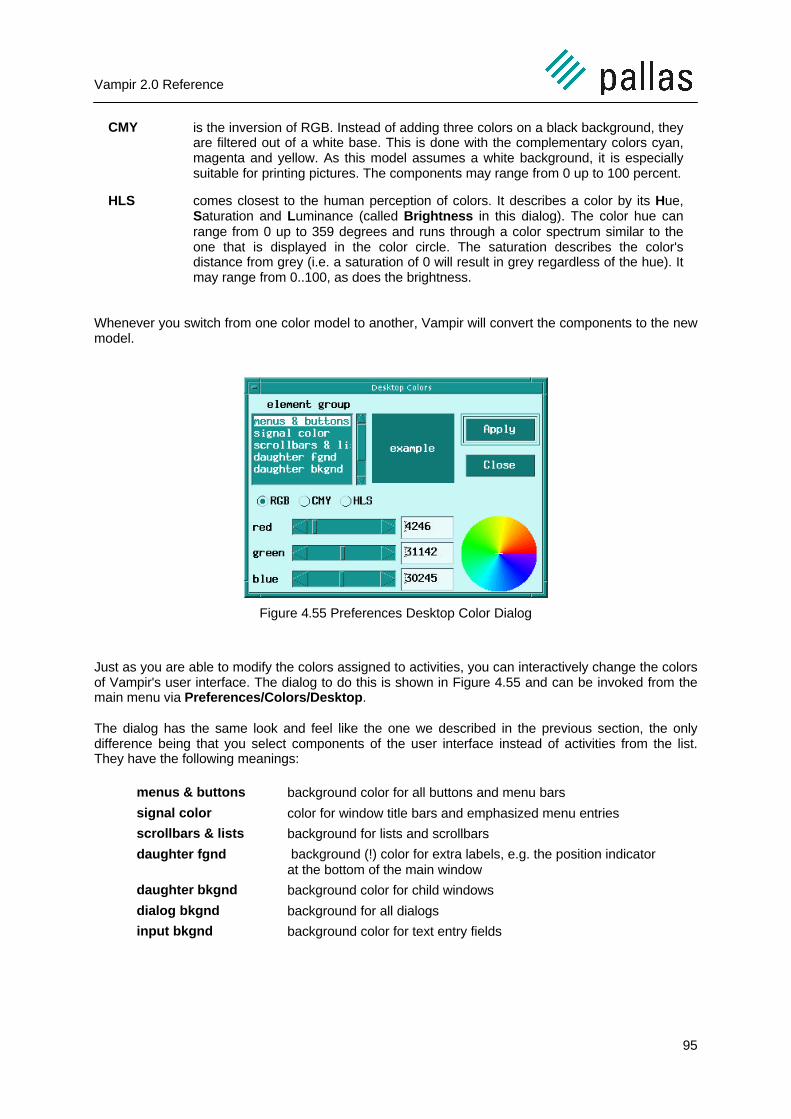
Vampir 2.0 Reference
95
CMY is the inversion of RGB. Instead of adding three colors on a black background, theyare filtered out of a white base. This is done with the complementary colors cyan,magenta and yellow. As this model assumes a white background, it is especiallysuitable for printing pictures. The components may range from 0 up to 100 percent.
HLS comes closest to the human perception of colors. It describes a color by its Hue,Saturation and Luminance (called Brightness in this dialog). The color hue canrange from 0 up to 359 degrees and runs through a color spectrum similar to theone that is displayed in the color circle. The saturation describes the color'sdistance from grey (i.e. a saturation of 0 will result in grey regardless of the hue). Itmay range from 0..100, as does the brightness.
Whenever you switch from one color model to another, Vampir will convert the components to the newmodel.
Figure 4.55 Preferences Desktop Color Dialog
Just as you are able to modify the colors assigned to activities, you can interactively change the colorsof Vampir's user interface. The dialog to do this is shown in Figure 4.55 and can be invoked from themain menu via Preferences/Colors/Desktop.
The dialog has the same look and feel like the one we described in the previous section, the onlydifference being that you select components of the user interface instead of activities from the list.They have the following meanings:
menus & buttons background color for all buttons and menu bars
signal color color for window title bars and emphasized menu entries
scrollbars & lists background for lists and scrollbars
daughter fgnd background (!) color for extra labels, e.g. the position indicatorat the bottom of the main window
daughter bkgnd background color for child windows
dialog bkgnd background for all dialogs
input bkgnd background color for text entry fields

Vampir 2.0 Reference
96
Generally, Vampir will automatically determine the present display type and will automatically convertthe colors to something your monitor can display. However, there may be some cases where it isnecessary to override this default. One of these cases is the printing of color pictures on amonochrome printer. The printer converts the colors into shades of grey, and it may happen that twodifferent colors are mapped to the same greyscale. In such a situation, switch Vampir itself to agreyscale display. You can thereby obtain a preview of the printout. As another example, the pureblack–and–white mode is meaningful if you are short of color palette entries.
Three color modes are supported:
Color colors are presented directly. If there are no more free entries in yourdisplay's color palette, Vampir will use white.
Grey Scale according to the NTSC TV standard using the formula
greyscale = 0.59 * g + 0.3 * r + 0.11 * b,
Vampir will calculate the color's brightness and display acorresponding shade of grey. If the color palette cannot hold anotherentry (should not happen for real grey scale displays), Vampir willagain use white.
Black/White Similarly to the grey scale mode, Vampir first calculates the colors'brightness. It then uses an ordered dithering method to fill the areawith a pattern of black and white pixels. Use this mode only whenabsolutely necessary, as the patterns are only a coarse approximationof grey shades and this mode is considerably slower than the first two.
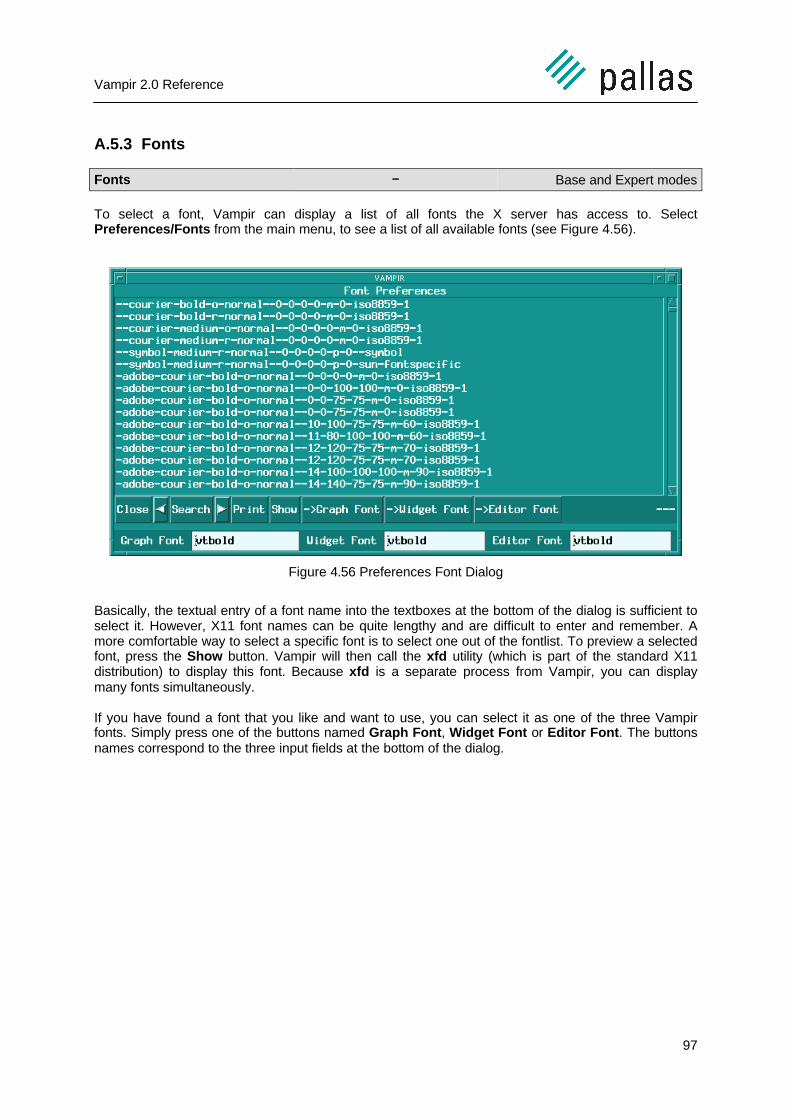
Vampir 2.0 Reference
97
A.5.3 Fonts
Fonts - Base and Expert modes
To select a font, Vampir can display a list of all fonts the X server has access to. SelectPreferences/Fonts from the main menu, to see a list of all available fonts (see Figure 4.56).
Figure 4.56 Preferences Font Dialog
Basically, the textual entry of a font name into the textboxes at the bottom of the dialog is sufficient toselect it. However, X11 font names can be quite lengthy and are difficult to enter and remember. Amore comfortable way to select a specific font is to select one out of the fontlist. To preview a selectedfont, press the Show button. Vampir will then call the xfd utility (which is part of the standard X11distribution) to display this font. Because xfd is a separate process from Vampir, you can displaymany fonts simultaneously.
If you have found a font that you like and want to use, you can select it as one of the three Vampirfonts. Simply press one of the buttons named Graph Font, Widget Font or Editor Font. The buttonsnames correspond to the three input fields at the bottom of the dialog.
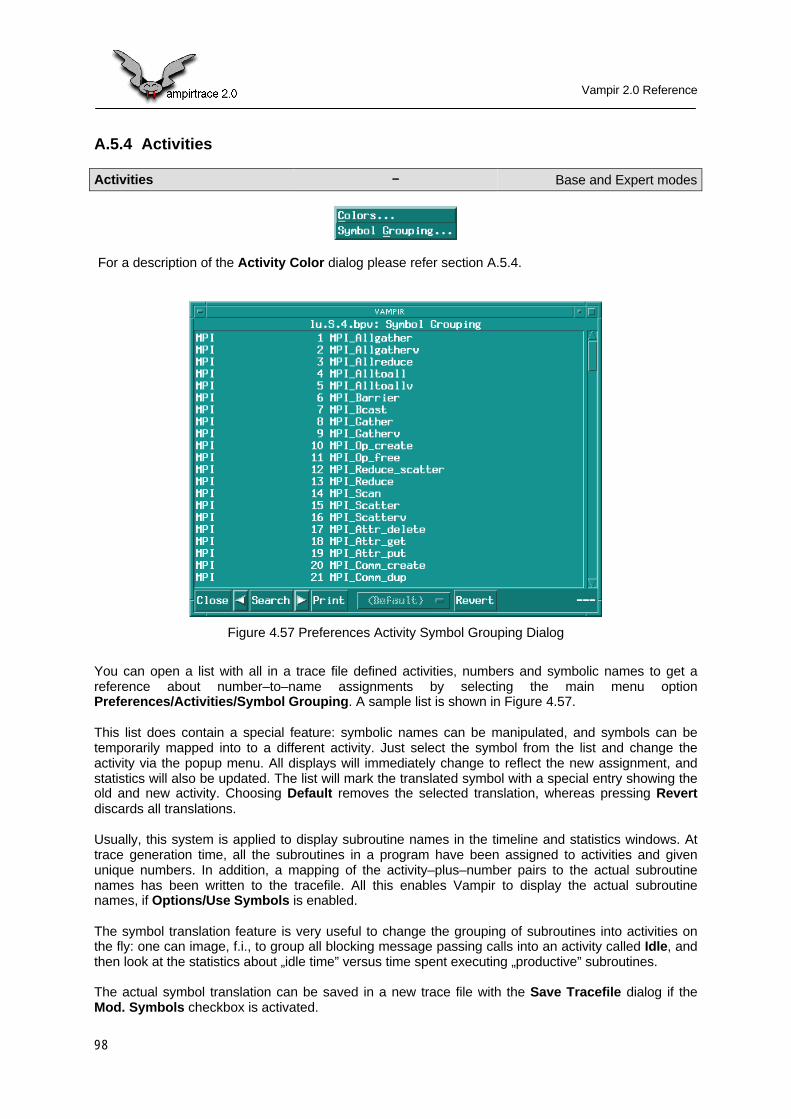
Vampir 2.0 Reference
98
A.5.4 Activities
Activities - Base and Expert modes
For a description of the Activity Color dialog please refer section A.5.4.
Figure 4.57 Preferences Activity Symbol Grouping Dialog
You can open a list with all in a trace file defined activities, numbers and symbolic names to get areference about number–to–name assignments by selecting the main menu optionPreferences/Activities/Symbol Grouping. A sample list is shown in Figure 4.57.
This list does contain a special feature: symbolic names can be manipulated, and symbols can betemporarily mapped into to a different activity. Just select the symbol from the list and change theactivity via the popup menu. All displays will immediately change to reflect the new assignment, andstatistics will also be updated. The list will mark the translated symbol with a special entry showing theold and new activity. Choosing Default removes the selected translation, whereas pressing Revertdiscards all translations.
Usually, this system is applied to display subroutine names in the timeline and statistics windows. Attrace generation time, all the subroutines in a program have been assigned to activities and givenunique numbers. In addition, a mapping of the activity–plus–number pairs to the actual subroutinenames has been written to the tracefile. All this enables Vampir to display the actual subroutinenames, if Options/Use Symbols is enabled.
The symbol translation feature is very useful to change the grouping of subroutines into activities onthe fly: one can image, f.i., to group all blocking message passing calls into an activity called Idle, andthen look at the statistics about „idle time” versus time spent executing „productive” subroutines.
The actual symbol translation can be saved in a new trace file with the Save Tracefile dialog if theMod. Symbols checkbox is activated.

Vampir 2.0 Reference
99
A.5.5 Displays
Displays - Base and Expert modes
The dialogs reachable by selecting Preferences/Displays from the main menu are intended to modifyconfiguration settings of Vampir views. The submenu is grouped into a General section and a sectionfor particular views. All settings available through these dialogs will be saved in the globalconfiguration file at the end of a Vampir session.
Figure 4.58 Preferences Display General Dialog
The dialog Preferences/Displays/General shown in Figure 4.58 is divided in five groups, delineatedby separator lines. The first section titled Show Times as... is used to select the time unit shown in allviews. Vampir can display times either in units of machine clock ticks or seconds. The selection ismade with the Show Times as... radio buttons. Which mode yields better results depends on thedisplayed time range. If clock number become large, a display in seconds is more compact and iseasier to interpret; on the other hand, Vampir will not print more than three digits behind a commasign, so the clock display is more accurate.
The second group deals with default mode-settings applicable to all Vampir displays. The firstcheckbox Use Timel. Portion associates the period of time shown by a view with the portion of time,displayed by the global timeline view. In case the global timeline view is not open when an associatedview is selected Vampir disables this option on the fly.
If the second checkbox Use Symbols is marked, Vampir will use symbol names instead if symbolnumbers in all views.
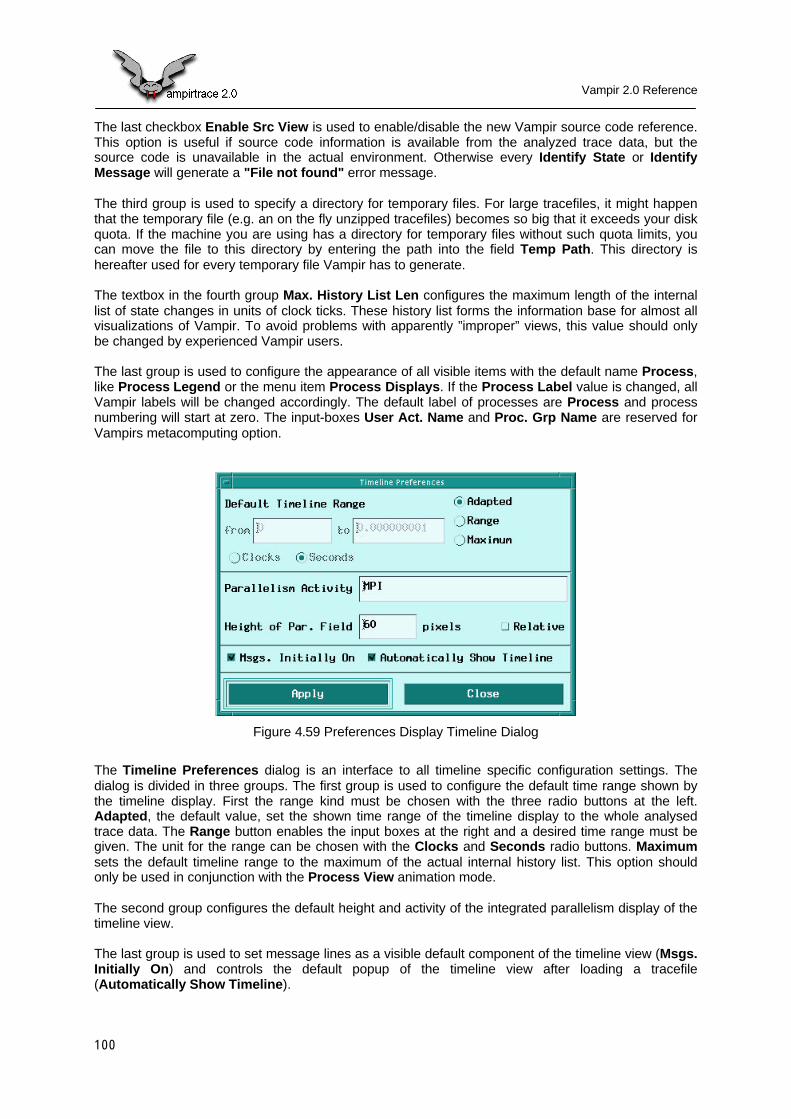
Vampir 2.0 Reference
100
The last checkbox Enable Src View is used to enable/disable the new Vampir source code reference.This option is useful if source code information is available from the analyzed trace data, but thesource code is unavailable in the actual environment. Otherwise every Identify State or IdentifyMessage will generate a "File not found" error message.
The third group is used to specify a directory for temporary files. For large tracefiles, it might happenthat the temporary file (e.g. an on the fly unzipped tracefiles) becomes so big that it exceeds your diskquota. If the machine you are using has a directory for temporary files without such quota limits, youcan move the file to this directory by entering the path into the field Temp Path. This directory ishereafter used for every temporary file Vampir has to generate.
The textbox in the fourth group Max. History List Len configures the maximum length of the internallist of state changes in units of clock ticks. These history list forms the information base for almost allvisualizations of Vampir. To avoid problems with apparently ”improper” views, this value should onlybe changed by experienced Vampir users.
The last group is used to configure the appearance of all visible items with the default name Process,like Process Legend or the menu item Process Displays. If the Process Label value is changed, allVampir labels will be changed accordingly. The default label of processes are Process and processnumbering will start at zero. The input-boxes User Act. Name and Proc. Grp Name are reserved forVampirs metacomputing option.
Figure 4.59 Preferences Display Timeline Dialog
The Timeline Preferences dialog is an interface to all timeline specific configuration settings. Thedialog is divided in three groups. The first group is used to configure the default time range shown bythe timeline display. First the range kind must be chosen with the three radio buttons at the left.Adapted, the default value, set the shown time range of the timeline display to the whole analysedtrace data. The Range button enables the input boxes at the right and a desired time range must begiven. The unit for the range can be chosen with the Clocks and Seconds radio buttons. Maximumsets the default timeline range to the maximum of the actual internal history list. This option shouldonly be used in conjunction with the Process View animation mode.
The second group configures the default height and activity of the integrated parallelism display of thetimeline view.
The last group is used to set message lines as a visible default component of the timeline view (Msgs.Initially On) and controls the default popup of the timeline view after loading a tracefile(Automatically Show Timeline).
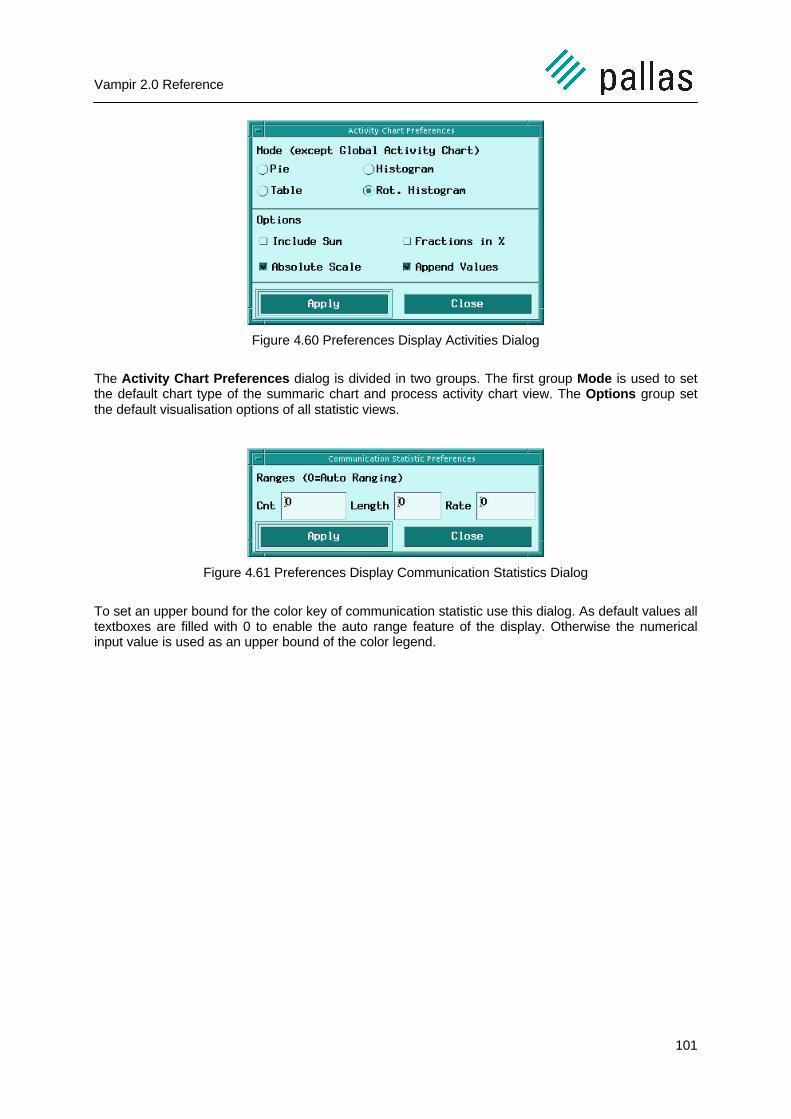
Vampir 2.0 Reference
101
Figure 4.60 Preferences Display Activities Dialog
The Activity Chart Preferences dialog is divided in two groups. The first group Mode is used to setthe default chart type of the summaric chart and process activity chart view. The Options group setthe default visualisation options of all statistic views.
Figure 4.61 Preferences Display Communication Statistics Dialog
To set an upper bound for the color key of communication statistic use this dialog. As default values alltextboxes are filled with 0 to enable the auto range feature of the display. Otherwise the numericalinput value is used as an upper bound of the color legend.

Vampir 2.0 Reference
102
A.5.6 Messages
Messages - Base and Expert modes
Vampir displays a message by default as a solid black line. When lots of messages of different typesare displayed at the same time, it is helpful to colorize some of the lines to help identify the messagesyou are interested in. However, because message types are internally stored, it is impossible to assigna distinct color to every single message type. The dialog reachable viaPreferences/Messages/Display Style from the main menu enables you to assign line patterns andcolors to groups of messages that have continuous message types (see Figure 4.62).
Figure 4.62 Preferences Messages Display Style Dialog
In the upper left corner, all currently defined message styles with their type ranges (andcommunicators if specified) are shown (if there are more entries than the list can show at once, ascrollbar is automatically activated). Click at one of them and the settings associated with this style arecopied into the dialog elements:
• The from and to fields define the message type range for which the color and line patternsettings are valid. Both values might be equal if only a single message type should beinfluenced. If the minimum is larger than the maximum, the values will automatically beswapped when the style is added to the list.
• If a communicator id is specified in the Communicator field, only messages with thiscommunicator attribute are affected.
• The buttons solid, dotted, dashed, dashed-dotted and broken set the line style, defaultbeing solid lines. Enabling off removes messages of the selected range from the timelinedisplay.
Vampir 2.0 Reference
103
• The bottom part controls the color setting. The function of the color model buttons, scrollbarsetc. is identical to the ones of the color setting dialog (see section A.5.2).
When you have finished all the settings you want, press Add to add the style to the list. Vampir trieshard to keep the list free of contradictions; this means that the addition of a style to the list can eraseother styles or reduce their range. In the extreme, the new style's range can be a subset of anotherstyle's range. In such a case, the old style is split into new styles that contain the same settings as theold one but which do not interfere with the new one.
To delete an entry from the list, select it and press Delete.
The color and pattern of a message line only reflects its type (and possibly its communicator id),whereas the line width can give an idea about the message size. Too fat lines, however, would disturbthe display, so Vampir distinguishes between small and big messages which are drawn with lines oneand three pixels wide, only. The limit between them, i.e. the minimum size a message has to have tobe displayed as a fat line, can be specified with the field big msg limit. If you set this value to zero(which is the default), all messages will be displayed with thin lines, regardless of their size.
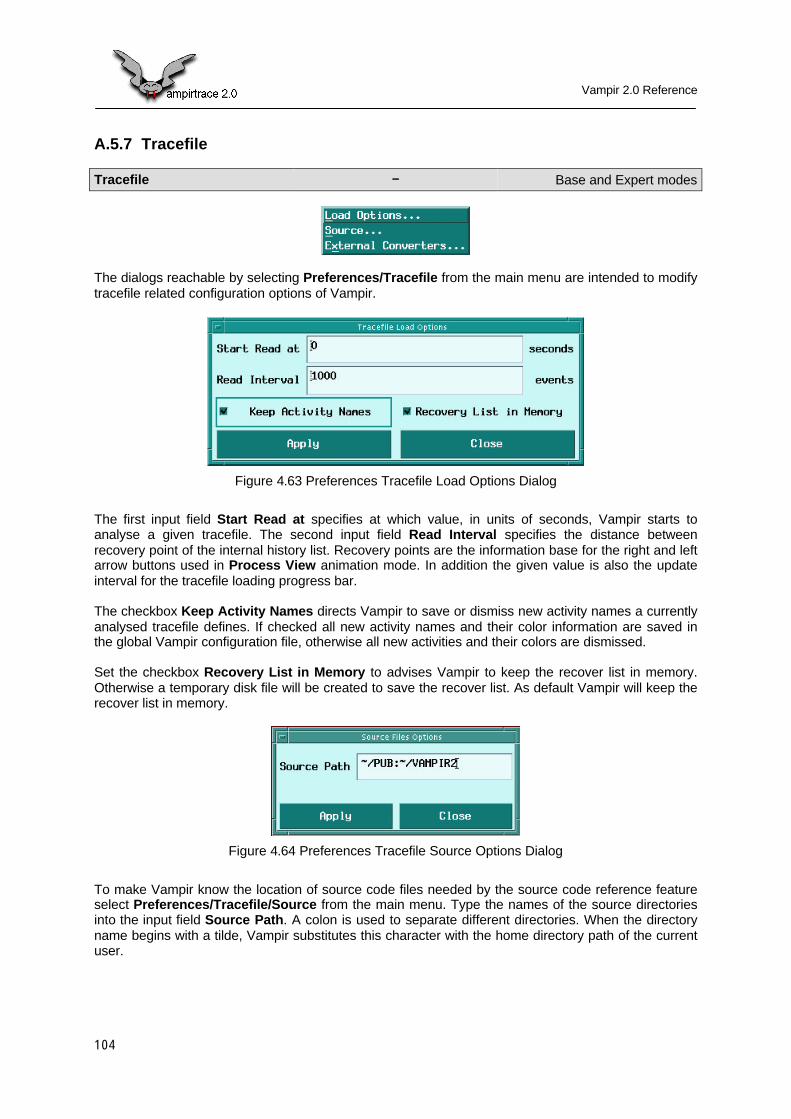
Vampir 2.0 Reference
104
A.5.7 Tracefile
Tracefile - Base and Expert modes
The dialogs reachable by selecting Preferences/Tracefile from the main menu are intended to modifytracefile related configuration options of Vampir.
Figure 4.63 Preferences Tracefile Load Options Dialog
The first input field Start Read at specifies at which value, in units of seconds, Vampir starts toanalyse a given tracefile. The second input field Read Interval specifies the distance betweenrecovery point of the internal history list. Recovery points are the information base for the right and leftarrow buttons used in Process View animation mode. In addition the given value is also the updateinterval for the tracefile loading progress bar.
The checkbox Keep Activity Names directs Vampir to save or dismiss new activity names a currentlyanalysed tracefile defines. If checked all new activity names and their color information are saved inthe global Vampir configuration file, otherwise all new activities and their colors are dismissed.
Set the checkbox Recovery List in Memory to advises Vampir to keep the recover list in memory.Otherwise a temporary disk file will be created to save the recover list. As default Vampir will keep therecover list in memory.
Figure 4.64 Preferences Tracefile Source Options Dialog
To make Vampir know the location of source code files needed by the source code reference featureselect Preferences/Tracefile/Source from the main menu. Type the names of the source directoriesinto the input field Source Path. A colon is used to separate different directories. When the directoryname begins with a tilde, Vampir substitutes this character with the home directory path of the currentuser.
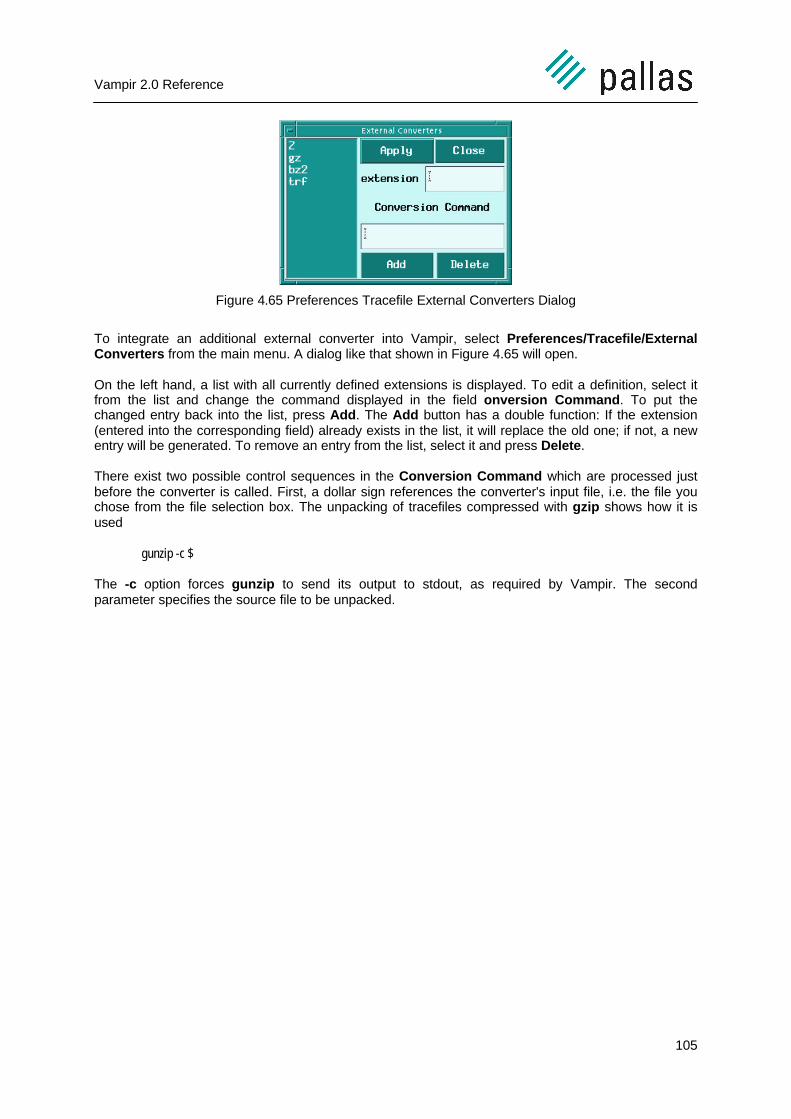
Vampir 2.0 Reference
105
Figure 4.65 Preferences Tracefile External Converters Dialog
To integrate an additional external converter into Vampir, select Preferences/Tracefile/ExternalConverters from the main menu. A dialog like that shown in Figure 4.65 will open.
On the left hand, a list with all currently defined extensions is displayed. To edit a definition, select itfrom the list and change the command displayed in the field onversion Command. To put thechanged entry back into the list, press Add. The Add button has a double function: If the extension(entered into the corresponding field) already exists in the list, it will replace the old one; if not, a newentry will be generated. To remove an entry from the list, select it and press Delete.
There exist two possible control sequences in the Conversion Command which are processed justbefore the converter is called. First, a dollar sign references the converter's input file, i.e. the file youchose from the file selection box. The unpacking of tracefiles compressed with gzip shows how it isused
gunzip -c $
The -c option forces gunzip to send its output to stdout, as required by Vampir. The secondparameter specifies the source file to be unpacked.
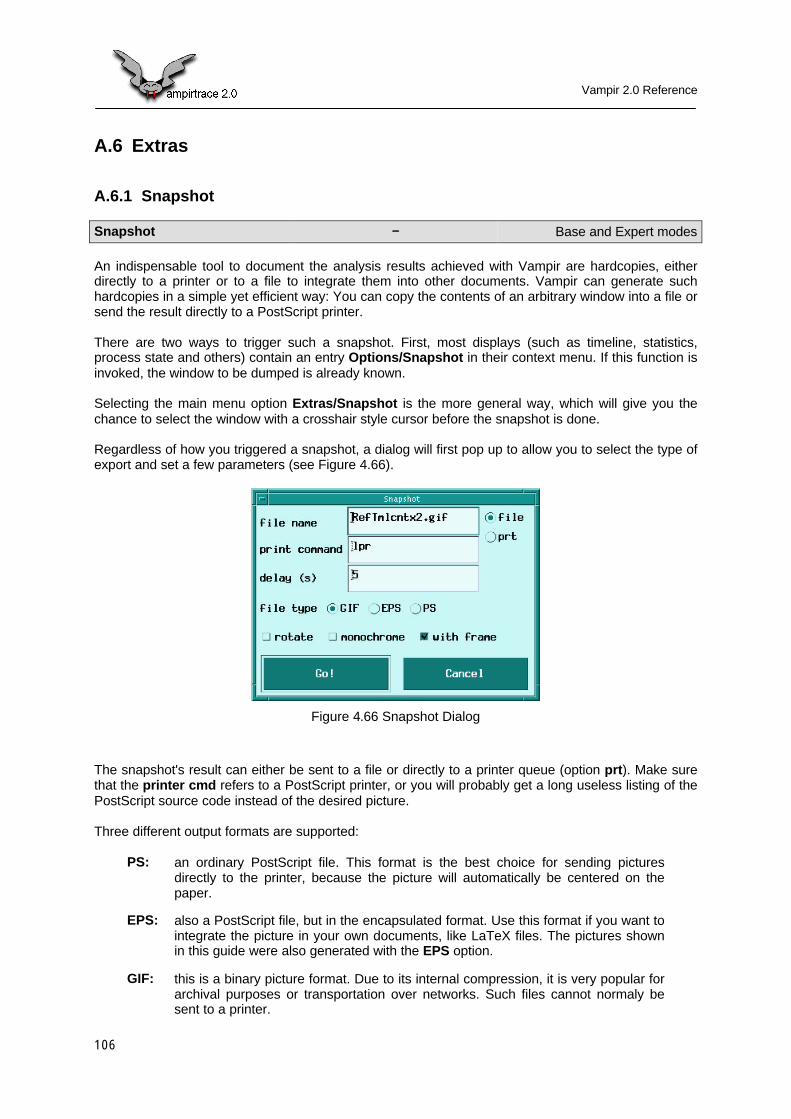
Vampir 2.0 Reference
106
A.6 Extras
A.6.1 Snapshot
Snapshot - Base and Expert modes
An indispensable tool to document the analysis results achieved with Vampir are hardcopies, eitherdirectly to a printer or to a file to integrate them into other documents. Vampir can generate suchhardcopies in a simple yet efficient way: You can copy the contents of an arbitrary window into a file orsend the result directly to a PostScript printer.
There are two ways to trigger such a snapshot. First, most displays (such as timeline, statistics,process state and others) contain an entry Options/Snapshot in their context menu. If this function isinvoked, the window to be dumped is already known.
Selecting the main menu option Extras/Snapshot is the more general way, which will give you thechance to select the window with a crosshair style cursor before the snapshot is done.
Regardless of how you triggered a snapshot, a dialog will first pop up to allow you to select the type ofexport and set a few parameters (see Figure 4.66).
Figure 4.66 Snapshot Dialog
The snapshot's result can either be sent to a file or directly to a printer queue (option prt). Make surethat the printer cmd refers to a PostScript printer, or you will probably get a long useless listing of thePostScript source code instead of the desired picture.
Three different output formats are supported:
PS: an ordinary PostScript file. This format is the best choice for sending picturesdirectly to the printer, because the picture will automatically be centered on thepaper.
EPS: also a PostScript file, but in the encapsulated format. Use this format if you want tointegrate the picture in your own documents, like LaTeX files. The pictures shownin this guide were also generated with the EPS option.
GIF: this is a binary picture format. Due to its internal compression, it is very popular forarchival purposes or transportation over networks. Such files cannot normaly besent to a printer.
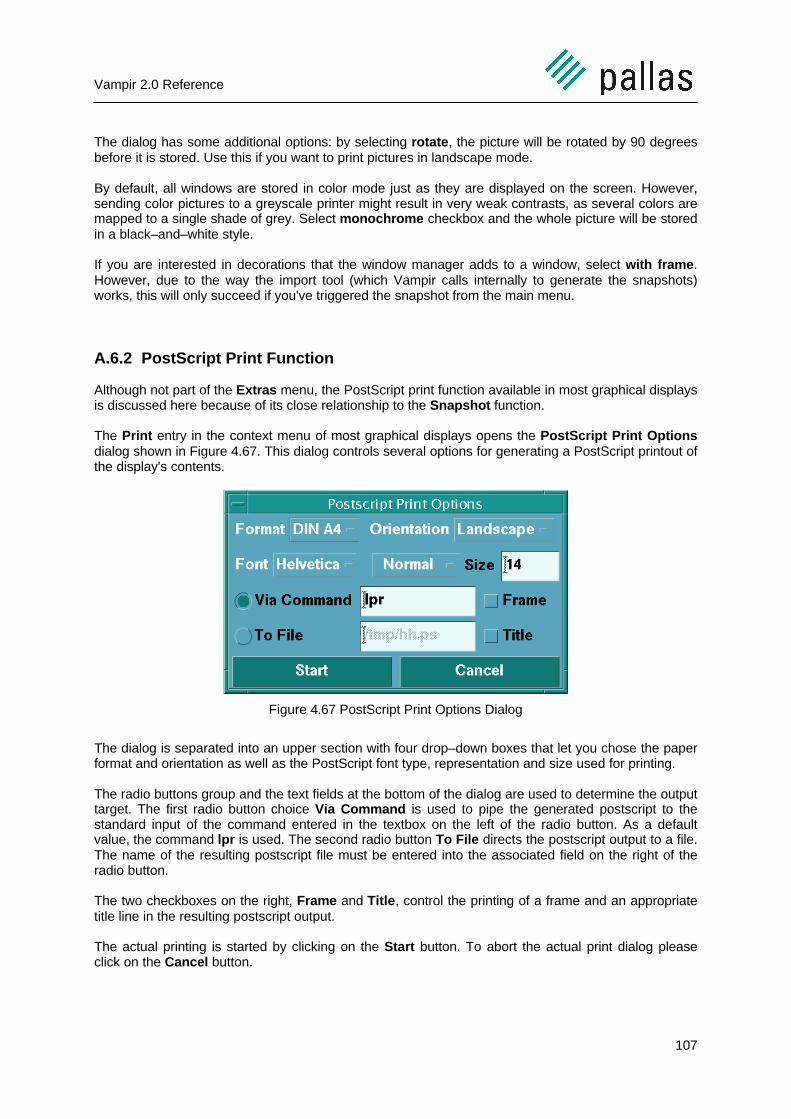
Vampir 2.0 Reference
107
The dialog has some additional options: by selecting rotate, the picture will be rotated by 90 degreesbefore it is stored. Use this if you want to print pictures in landscape mode.
By default, all windows are stored in color mode just as they are displayed on the screen. However,sending color pictures to a greyscale printer might result in very weak contrasts, as several colors aremapped to a single shade of grey. Select monochrome checkbox and the whole picture will be storedin a black–and–white style.
If you are interested in decorations that the window manager adds to a window, select with frame.However, due to the way the import tool (which Vampir calls internally to generate the snapshots)works, this will only succeed if you've triggered the snapshot from the main menu.
A.6.2 PostScript Print Function
Although not part of the Extras menu, the PostScript print function available in most graphical displaysis discussed here because of its close relationship to the Snapshot function.
The Print entry in the context menu of most graphical displays opens the PostScript Print Optionsdialog shown in Figure 4.67. This dialog controls several options for generating a PostScript printout ofthe display's contents.
Figure 4.67 PostScript Print Options Dialog
The dialog is separated into an upper section with four drop–down boxes that let you chose the paperformat and orientation as well as the PostScript font type, representation and size used for printing.
The radio buttons group and the text fields at the bottom of the dialog are used to determine the outputtarget. The first radio button choice Via Command is used to pipe the generated postscript to thestandard input of the command entered in the textbox on the left of the radio button. As a defaultvalue, the command lpr is used. The second radio button To File directs the postscript output to a file.The name of the resulting postscript file must be entered into the associated field on the right of theradio button.
The two checkboxes on the right, Frame and Title, control the printing of a frame and an appropriatetitle line in the resulting postscript output.
The actual printing is started by clicking on the Start button. To abort the actual print dialog pleaseclick on the Cancel button.
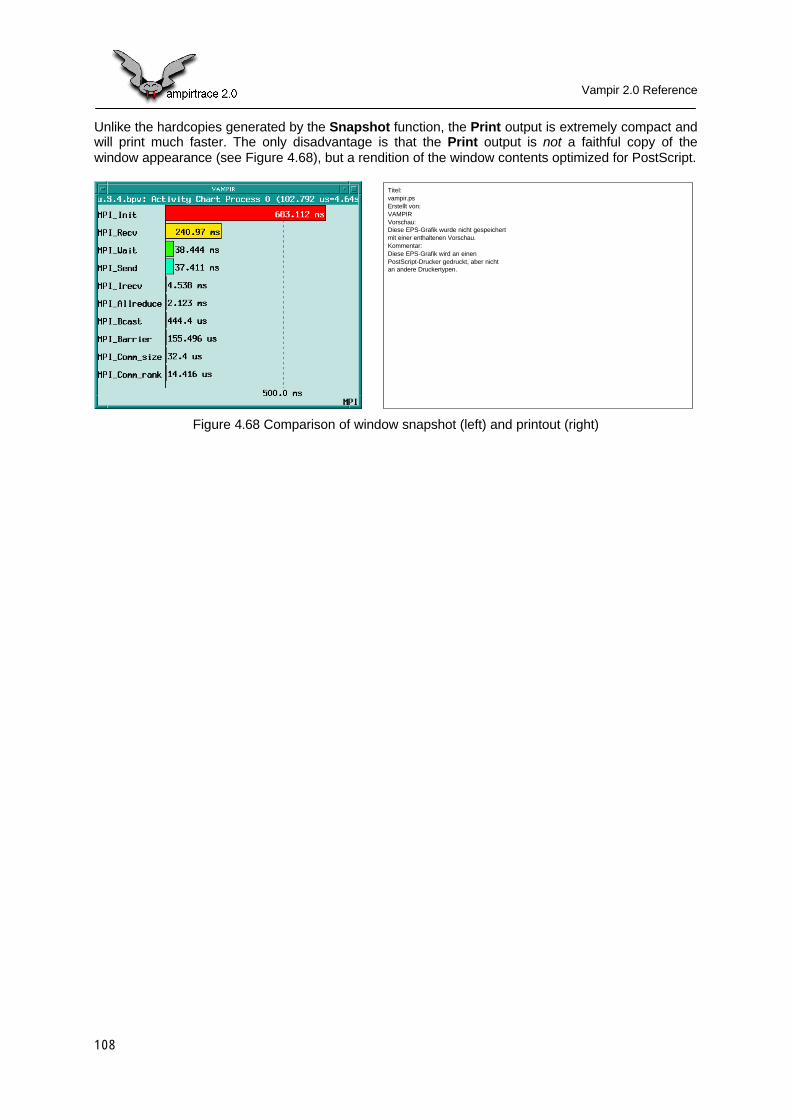
Vampir 2.0 Reference
108
Unlike the hardcopies generated by the Snapshot function, the Print output is extremely compact andwill print much faster. The only disadvantage is that the Print output is not a faithful copy of thewindow appearance (see Figure 4.68), but a rendition of the window contents optimized for PostScript.
Titel:vampir.psErstellt von:VAMPIRVorschau:Diese EPS-Grafik wurde nicht gespeichertmit einer enthaltenen Vorschau.Kommentar:Diese EPS-Grafik wird an einenPostScript-Drucker gedruckt, aber nichtan andere Druckertypen.
Figure 4.68 Comparison of window snapshot (left) and printout (right)
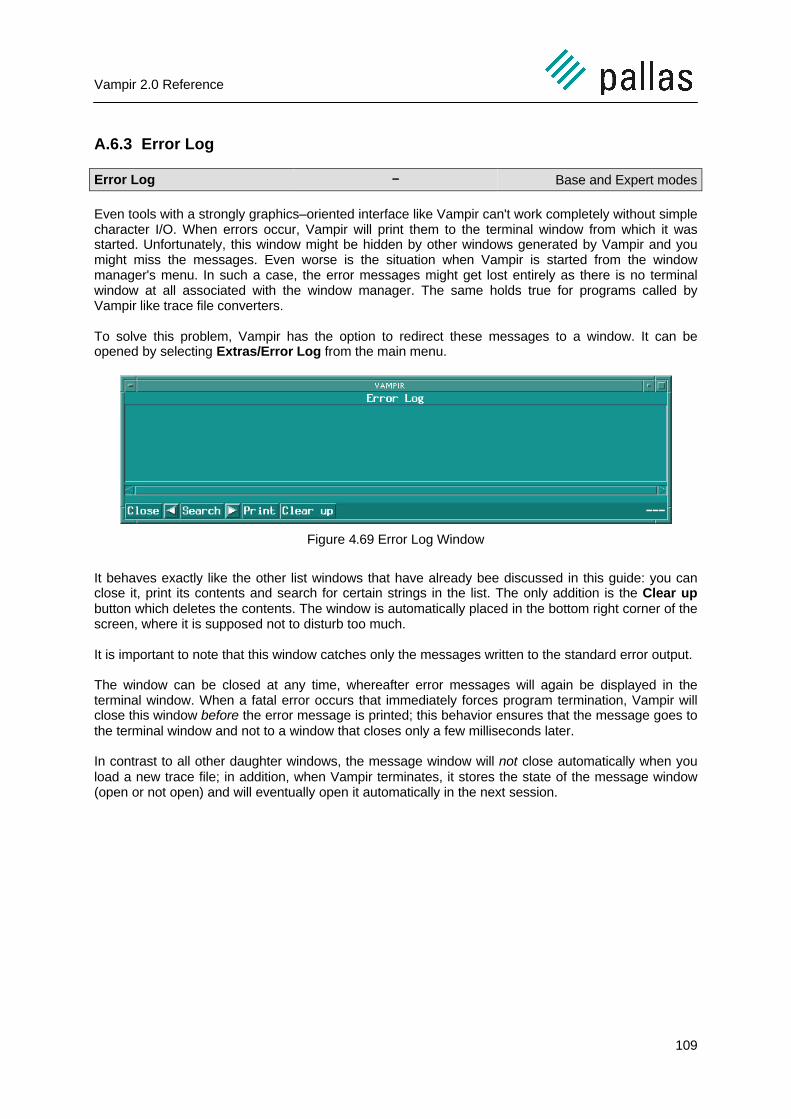
Vampir 2.0 Reference
109
A.6.3 Error Log
Error Log - Base and Expert modes
Even tools with a strongly graphics–oriented interface like Vampir can't work completely without simplecharacter I/O. When errors occur, Vampir will print them to the terminal window from which it wasstarted. Unfortunately, this window might be hidden by other windows generated by Vampir and youmight miss the messages. Even worse is the situation when Vampir is started from the windowmanager's menu. In such a case, the error messages might get lost entirely as there is no terminalwindow at all associated with the window manager. The same holds true for programs called byVampir like trace file converters.
To solve this problem, Vampir has the option to redirect these messages to a window. It can beopened by selecting Extras/Error Log from the main menu.
Figure 4.69 Error Log Window
It behaves exactly like the other list windows that have already bee discussed in this guide: you canclose it, print its contents and search for certain strings in the list. The only addition is the Clear upbutton which deletes the contents. The window is automatically placed in the bottom right corner of thescreen, where it is supposed not to disturb too much.
It is important to note that this window catches only the messages written to the standard error output.
The window can be closed at any time, whereafter error messages will again be displayed in theterminal window. When a fatal error occurs that immediately forces program termination, Vampir willclose this window before the error message is printed; this behavior ensures that the message goes tothe terminal window and not to a window that closes only a few milliseconds later.
In contrast to all other daughter windows, the message window will not close automatically when youload a new trace file; in addition, when Vampir terminates, it stores the state of the message window(open or not open) and will eventually open it automatically in the next session.
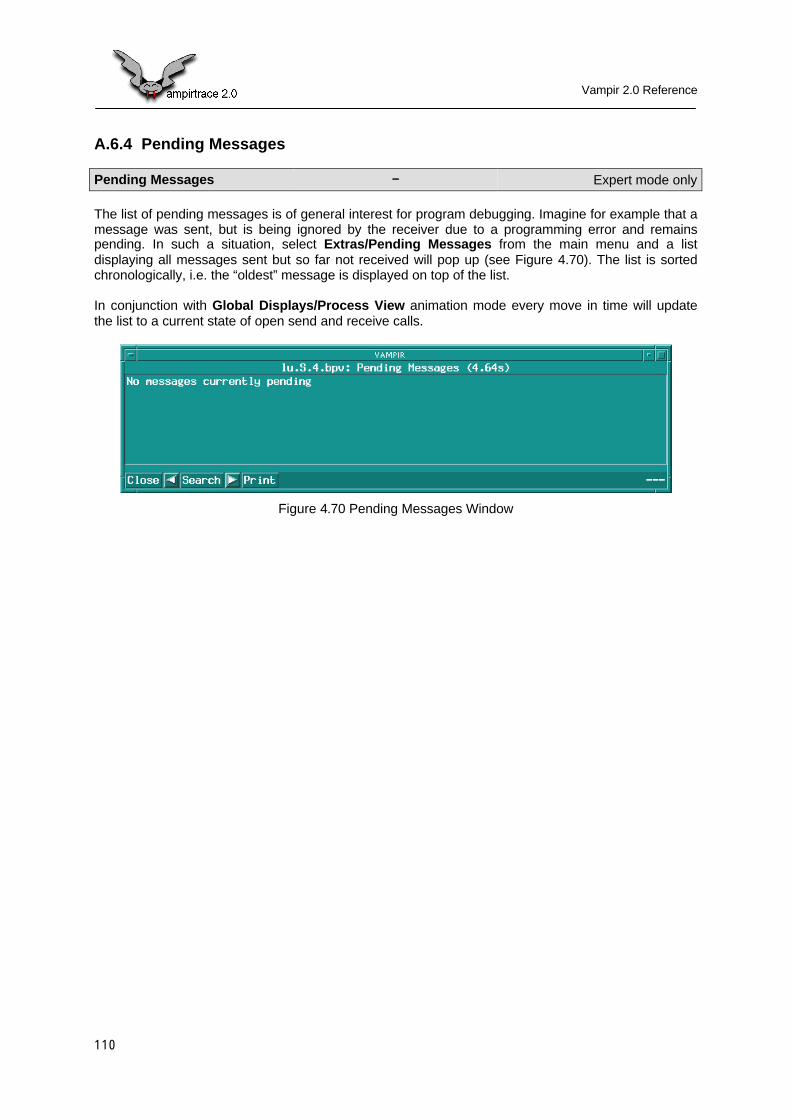
Vampir 2.0 Reference
110
A.6.4 Pending Messages
Pending Messages - Expert mode only
The list of pending messages is of general interest for program debugging. Imagine for example that amessage was sent, but is being ignored by the receiver due to a programming error and remainspending. In such a situation, select Extras/Pending Messages from the main menu and a listdisplaying all messages sent but so far not received will pop up (see Figure 4.70). The list is sortedchronologically, i.e. the “oldest” message is displayed on top of the list.
In conjunction with Global Displays/Process View animation mode every move in time will updatethe list to a current state of open send and receive calls.
Figure 4.70 Pending Messages Window
Vampir 2.0 Reference
111
A.7 Help
A.7.1 About
About - Base and Expert modes
Figure 4.71 About Dialog
Vampir Trace Format and Related Issues
112
Titel:(vamplogo-2.eps)Erstellt von:(ImageMagick)Vorschau:Diese EPS-Grafik wurde nicht gespeichertmit einer enthaltenen Vorschau.Kommentar:Diese EPS-Grafik wird an einenPostScript-Drucker gedruckt, aber nichtan andere Druckertypen.
A Vampir Trace Format and Related IssuesThroughout this guide, we have assumed that you can generate tracefiles in the format appropriate forVampir. However, there are as many tracefile formats as parallel systems and tools on the market. Fora number of systems, converters to the Vampir format are available. Should you wish to write yourown converter, or should you just be curious about the tracefile format, this appendix will be valuable.
It starts with a description of the Vampir tracefile format. After this, some design guidelines for aconverter program are given. Finally, the integration of external converters into Vampir is described;this powerful mechanism frees you from the task of having to explicitly convert your tracefiles.
A.1 The Vampir ASCII Trace Format
A.1.1 ASCII Versus Binary Formats
There are two different trace formats that Vampir can read without a converter: an ASCII and a binaryformat. In the following, only the ASCII format is described. If you're interested in the binary format,you can get a specification from Pallas. A converter from ASCII to binary format called pv2bpv issupplied together with Vampir. The pvmerge tool can be used to convert from binary to ASCII format.Please refer to the man pages for these tools.
The ASCII format has some advantages compared to a binary format:
• Text files can be transferred between different machines without problems. The same is nottrue for binary formats as there are differences e.g. in word length or byte ordering. TheVampir binary format, though, is portable.
• Text files can be easily read or written by every programming language.
• Text files are „human–readable” without the need of special tools. Vampir e.g. uses this factfor the display of trace data in listboxes.
• The generation of printouts for archiving or documentation purposes could not be simpler.
• An ordinary text editor is sufficient for manual modifications.
An obvious drawback of text files is their relatively large size compared to binary files. Thisdisadvantage can be reduced by file compression; today's compression tools (especially gzip) willreduce the tracefiles size to an amount comparable to binary tracefiles. However, binary formats canusually be parsed much quicker.
Vampir Trace Format and Related Issues
113
A.1.2 ASCII Line Format
Each line in a tracefile contains a single event or command. The lines have the following format:
[time] <command> [parameter [further parameters]]
Usually, a line starts with a number designating the time when the event took place. The time is givenin clock ticks relative to program start. Events in the tracefile must be sorted by time. If a time field ismissing, Vampir assumes the time of the previous event. A clock number need not begin in the firstcolumn; Vampir will distinguish a command from a time specification by checking for a proper numericformat.
The command may be composed of numbers or letters. Notice that at least one letter must be present.If not, Vampir might misinterpret the command as a clock value. It must not contain any blanks, asblanks are used to separate the command from the parameters. Commands unknown to Vampir willquietly be ignored. Especially, it is guaranteed that the command C will have no effect. It is thereforepossible to insert Fortran–style comments into the tracefile.
The parameter list depends on the actual command.
A.1.3 Trace Commands Used by Vampir
The commands recognized by Vampir can generally be divided into two categories:
• configuration commands, which describe trace parameters important for the visualisation
• event commands, which reflect events having occured during the program run
Only the second group represents the „real” tracefile contents.
The most important configuration command is
NCPUS <number of processors> [<further numbers>]
This command defines how many processing elements have participated in executing the program. Ifseveral numbers are specified, each number represents the processor count of a machine that hasbeen involved in the execution. As this command influences the size of several data structures whosesize must be kept constant during a session, it must appear before any event command. If thisconvention is not followed, the command is ignored and a default processor count of 8 will be used.The sum of all specified numbers must not exceed 256.
Depending on the actual situation, the „processing elements” referred to above might actually beprocesses. This is the general case for a message–passing program. Only on machines that mapexactly one process onto one processing element, the two concepts do coincide. One can actuallyimagine applications of Vampir to objects that are neither processes nor processing elements – tracingstate information for different modules in a real–time process–control program, for instance.
The command
CPUNAMES <group name> [<more group names>]
must also appear at the beginning of the tracefile. The parameters represent the names of allprocessor groups (i.e. machines) that take part in the execution of the program. The number ofprocesses in each group is taken from the NCPUS statement by a one–to–one assignment of theNCPUS parameters to the CPUNAMES parameters. Different parameter counts will not lead to anerror. If more group names than numbers are specified, the remaining names will be discarded. On
Vampir Trace Format and Related Issues
114
Titel:(vamplogo-2.eps)Erstellt von:(ImageMagick)Vorschau:Diese EPS-Grafik wurde nicht gespeichertmit einer enthaltenen Vorschau.Kommentar:Diese EPS-Grafik wird an einenPostScript-Drucker gedruckt, aber nichtan andere Druckertypen.
the other hand, if more numbers than names are specified, nameless groups will be assigned to eachof the redundant numbers. This statement is not obligatory. If it is missing, the groups represented byeach number will have no name.
The new version information record
VERSION <version number>
is used to define the version of the trace file format definition. <version number> is a positive numberstarting from 1. Format definitions are upward compatible, i.e. a Vampir version 1 trace file can beread by Vampir versions 2 and higher. The behavior of an older version of Vampir trying to read anewer file is undefined. Vampir might reject loading the file at all or be unable to read certain recordsor parts of records that were added in later versions of the trace format definition.
The second information record
CREATOR <"creator string">
allows to inform Vampir of the trace file's originator. This record has only a documenting function. Thedialog invoked by File/Tracefile Info will show both, VERSION and CREATOR, records.
Another command that must appear at the very beginning of the tracefile is
CLKPERIOD <clock period of machine in seconds>
Vampir can display times either in clock ticks or seconds. As times in the tracefile are always given inclock ticks, Vampir must know how long a clock period lasts. If this command is missing, a default of 6µs will be used.
In version 2 Vampir has source code references. For these function Vampir needs to know about allsource files of the traced application. With the
FILETOKEN <FileToken> <"FileName">
record all used filenames are tokenized and were furthermore only referenced by its token number.Referring to files with a number instead of a full name in every event significantly reduces trace filesize. The number FileToken must be positive and unique, i.e. there must not be more than one eventin the trace file having the same FileToken field. This record must appear before the token it definesis used the first time.
To understand the following command, an understanding of the description of a processor state isneeded. A state description consists of an arbitrary string plus an optional integer number. Forexample, valid state descriptions are
"IDLE""Calculation 20"
To minimize memory usage, Vampir tokenizes the strings internally.
Sometimes, a number is not descriptive enough for an attribute of an activity. Imagine that everyCalculation number describes a subroutine of a program, and you do not want to fiddle around with anexternal table that describes the number assignments. The command
SYMBOL <state name> <state number> <"name"> [SRC<FileToken>:<LineNumber>]
can be used to let Vampir do the mapping. It assigns a certain name to a state/number combination.Whenever this combination occurs and the Use Symbols option is enabled, Vampir will display thename, instead of the number. As this command makes only sense when a state name appears
Vampir Trace Format and Related Issues
115
together with a number, the number is not optional. As Vampir must have seen this configurationcommand once to add it to an internal list, it is sensible to define the symbol before its first usage.
A.1.4 Trace Events Used by Vampir
All commands discussed so far are configuration commands, and a timestamp was not necessary forthem (though a time stamp will not generate errors). This is in contrast to the following eventcommands, which do not make sense without time stamps. The most important event that can occur isa state change of a processor:
EXCHANGE ON CPUID <processor number> [FROM <old state>]TO|DOWNTO|UPTO <new state> CLUSTER <number> [JOB <number>] [SRC<FileToken>:<LineNumber>]
Due to its length, we split up the description into several lines. This was only done for clarificationpurposes, never split lines in a tracefile!
The processor number identifies the processor whose state has changed. The number must lie within1..n, where n is the sum of the arguments of the NCPUS command. Both state descriptions (the firstone is optional and can be used for consistency checks) must be pairs of state names and numbers,as described previously. Do not use symbolic names! The cluster and job assignments always belongto the new state.
Sending and receipt of messages is announced to Vampir by two separate commands, as the sendingand receiving of a message usually happens at different points of time:
SENDMSG [<communicator>] <type> FROM <sender> TO <receiver> LEN<length> [SRC <FileToken>:<LineNumber>] RECVMSG [<communicator>]<type> BY <receiver> FROM <sender> LEN <length> [SRC<FileToken>:<LineNumber>]
The type is an arbitrary integer value whose meaning depends on the program or simulation thatproduced the trace, i.e. Vampir doesn't impose any special meaning on this value. However, this value(together with the communicator value) allows the user to show messages in different colors. Thelength parameter designates the message length in bytes; it is used by Vampir in bandwidthcalculations. The communicator field has to be specified only for MPI traces.
To allow a correct matching of a sending event to the corresponding receive event, the type,communicator, length, sender and receiver fields should be kept consistent; however this is not alwayspossible, and therefore only the type, communicator and receiver fields are essential. Contradictions inthe other fields will create warnings.

Vampir Trace Format and Related Issues
116
Titel:(vamplogo-2.eps)Erstellt von:(ImageMagick)Vorschau:Diese EPS-Grafik wurde nicht gespeichertmit einer enthaltenen Vorschau.Kommentar:Diese EPS-Grafik wird an einenPostScript-Drucker gedruckt, aber nichtan andere Druckertypen.
A.2 Conventions for Trace Converters
Generally, you are free in the way you implement your converter as long as it generates a trace thatcan be read by Vampir. However, if you obey some design considerations you can integrate yourconverter into Vampir in a way that make it look like an integral part of Vampir.
First, the converter must be completely command–line driven. Any options that your converter canprocess must be command–line options, neither interactive dialogs nor extra configuration files areallowed. After all, if Vampir is started from the window manager's menu, there is no associatedconsole which would allow keyboard input.
Second, the converter must be able to write its result onto the standard output. If any additionalmessages or error outputs are required, send them to the standard error stream. Feel free to add acommand–line parameter to switch between a file and standard output, but the standard outputmethod must be available.
It should be unnecessary to mention that the input file (the source file for the conversion) must bespecifiable in the command line. Be prepared for long file names; Vampir will supply the full absolutefile pathname.
Of course, we cannot anticipate which problems you might have in the implementation of yourconverter, but we can point out some of the pitfalls we noticed when implementing our converters:
• When reading binary files, do not forget that different machines have a different byte ordering.The machine that runs your converter might not be the same that generated the trace data.
• If the traced events are not in chronological order, you will have to sort them. Think of theestimated tracefile sizes; the bigger they become, the less probable it is that they fit intomemory for sorting.
• Some tracefiles generated by stack monitoring do not mention to which function a returnoccurs. You will have to build your own stack in the converter to generate correct EXCHANGErecords.
• If the exit code of your converter is different from 0, Vampir assumes that an error occurredand discards the converter's output. However, some systems do not default to an exit code ofzero upon normal program termination. If Vampir reports strange error numbers, place anexplicit exit(0); statement at the end of your converters' main() function.
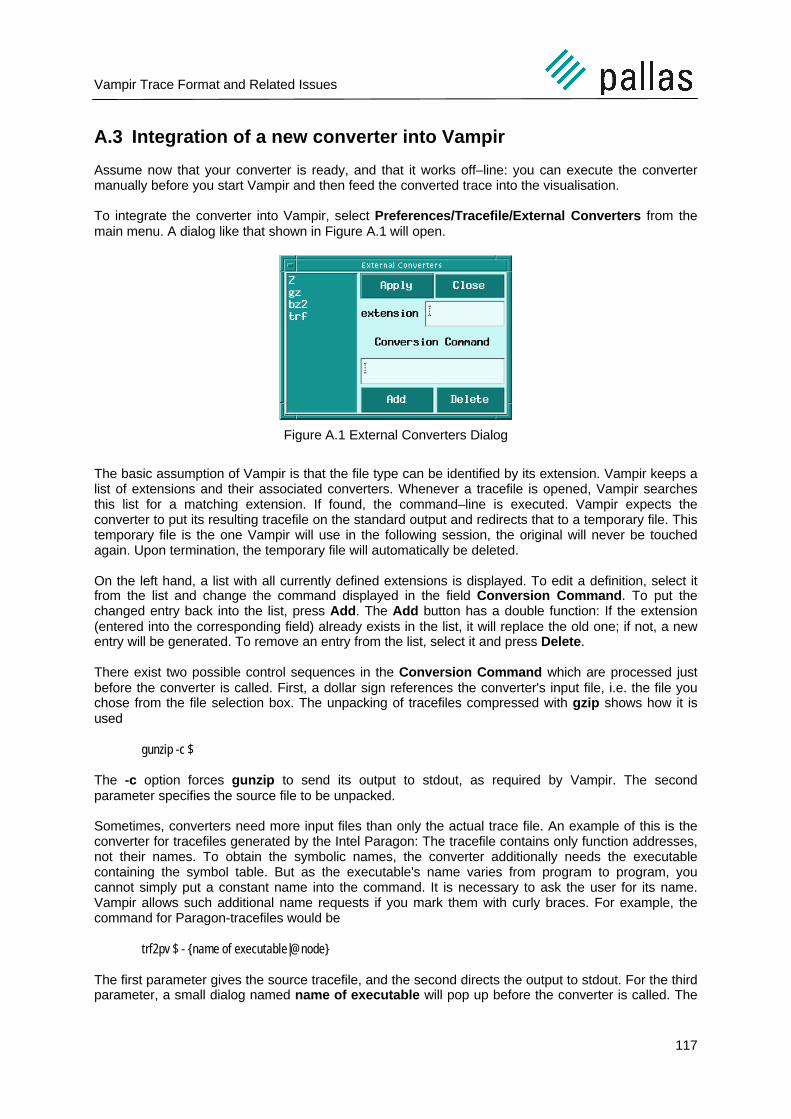
Vampir Trace Format and Related Issues
117
A.3 Integration of a new converter into Vampir
Assume now that your converter is ready, and that it works off–line: you can execute the convertermanually before you start Vampir and then feed the converted trace into the visualisation.
To integrate the converter into Vampir, select Preferences/Tracefile/External Converters from themain menu. A dialog like that shown in Figure A.1 will open.
Figure A.1 External Converters Dialog
The basic assumption of Vampir is that the file type can be identified by its extension. Vampir keeps alist of extensions and their associated converters. Whenever a tracefile is opened, Vampir searchesthis list for a matching extension. If found, the command–line is executed. Vampir expects theconverter to put its resulting tracefile on the standard output and redirects that to a temporary file. Thistemporary file is the one Vampir will use in the following session, the original will never be touchedagain. Upon termination, the temporary file will automatically be deleted.
On the left hand, a list with all currently defined extensions is displayed. To edit a definition, select itfrom the list and change the command displayed in the field Conversion Command. To put thechanged entry back into the list, press Add. The Add button has a double function: If the extension(entered into the corresponding field) already exists in the list, it will replace the old one; if not, a newentry will be generated. To remove an entry from the list, select it and press Delete.
There exist two possible control sequences in the Conversion Command which are processed justbefore the converter is called. First, a dollar sign references the converter's input file, i.e. the file youchose from the file selection box. The unpacking of tracefiles compressed with gzip shows how it isused
gunzip -c $
The -c option forces gunzip to send its output to stdout, as required by Vampir. The secondparameter specifies the source file to be unpacked.
Sometimes, converters need more input files than only the actual trace file. An example of this is theconverter for tracefiles generated by the Intel Paragon: The tracefile contains only function addresses,not their names. To obtain the symbolic names, the converter additionally needs the executablecontaining the symbol table. But as the executable's name varies from program to program, youcannot simply put a constant name into the command. It is necessary to ask the user for its name.Vampir allows such additional name requests if you mark them with curly braces. For example, thecommand for Paragon-tracefiles would be
trf2pv $ - {name of executable|@node}
The first parameter gives the source tracefile, and the second directs the output to stdout. For the thirdparameter, a small dialog named name of executable will pop up before the converter is called. The

Vampir Trace Format and Related Issues
118
Titel:(vamplogo-2.eps)Erstellt von:(ImageMagick)Vorschau:Diese EPS-Grafik wurde nicht gespeichertmit einer enthaltenen Vorschau.Kommentar:Diese EPS-Grafik wird an einenPostScript-Drucker gedruckt, aber nichtan andere Druckertypen.
entries that are made into the dialog's text field then replace the part enclosed in braces. Optionally, adefault can be placed into the text field; it is separated from the dialog's title with a vertical line.
By default, Vampir will insert the input you made as–is into the command line. However, if your inputstarts with a @ character, Vampir will add the source tracefile's directory to it. For example, trf2PCshall by default use a file named node located in the tracefile's directory.