Embed Size (px)
Citation preview

UNIVERSITY OF LJUBLJANA
FACULTY OF ECONOMICS
VALENTINA BOŽIČ
DETERMINANTS OF FIRM’S PERFORMANCE: EMPIRICAL EVIDENCE FROM SLOVENIAN AND CROATIAN HOTEL INDUSTRY
DOCTORAL DISSERTATION
LJUBLJANA, 2019


AUTHORSHIP STATEMENT
The undersigned Valentina Božič, a student at the University of Ljubljana, Faculty of Economics, (hereafter: FELU), author of this written final work of studies with the title Determinants of Firm’s Performance: Empirical Evidence from Slovenian and Croatian Hotel Industry prepared under supervision of Assistant Professor Ljubica Knežević Cvelbar, PhD.
D E C L A R E
1. this doctoral dissertation to be based on the results of my own research;
2. the printed form of this written final work of studies to be identical to its electronic form;
3. the text of this doctoral dissertation to be language-edited and technically in adherence with the FELU’s Technical Guidelines for Written Works, which means that I cited and / or quoted works and opinions of other authors in this doctoral dissertation in accordance with the FELU’s Technical Guidelines for Written Works;
4. to be aware of the fact that plagiarism (in written or graphical form) is a criminal offence and can be prosecuted in accordance with the Criminal Code of the Republic of Slovenia;
5. to be aware of the consequences a proven plagiarism charge based on this doctoral dissertation could have for my status at the FELU in accordance with the relevant FELU Rules;
6. to have obtained all the necessary permits to use the data and works of other authors which are (in written or graphical form) referred to in this doctoral dissertation and to have clearly marked them;
7. to have acted in accordance with ethical principles during the preparation of this doctoral dissertation and to have, where necessary, obtained permission of the Ethics Committee;
8. my consent to use the electronic form of this doctoral dissertation for the detection of content similarity with other written works, using similarity detection software that is connected with the FELU Study Information System;
9. to transfer to the University of Ljubljana free of charge, non-exclusively, geographically and time-wise unlimited the right of saving this doctoral dissertation in the electronic form, the right of its reproduction, as well as the right of making this doctoral dissertation available to the public on the World Wide Web via the Repository of the University of Ljubljana;
10. [please include only if your doctoral dissertation consists of several articles] to have acquired from publishers, to whom I have previously exclusively transferred material copyrights for articles, all the necessary permissions for the inclusion of articles in the printed and electronic forms of this dissertation. These permissions enable the University of Ljubljana to save this doctoral dissertation in the electronic form, to reproduce it, as well as to make it publicly available on the World Wide Web via the Repository of the University of Ljubljana free of charge, non-exclusively, geographically and time-wise unlimited;
11. my consent to publication of my personal data that are included in this doctoral dissertation and in this declaration, when this doctoral dissertation is published.
Ljubljana, ________________________ Author’s signature: _________________________ (Month in words / Day / Year,

Determinants of Firm’s Performance: Empirical evidence from Slovenian and Croatian Hotel Industry
Summary
The aim of this doctoral dissertation is to study the main drivers of performance in general and specifically in the case of hotel companies in two countries: Slovenia and Croatia. Current theory is suggesting that it is valuable to understand the whole framework of different types of drivers and to identify their impact on the long-term financial success of the companies. For hotel companies and practitioners, it is important to understand which drivers are the most important in hospitality industry and how they impact the performance. Countries Slovenia and Croatia are currently experiencing years of rapid tourism growth and development. Under the impact of favorable tourism trends, hotel companies strive for their inner financial success. With different pace of ownership changes, service and process improvements as well as adaptation to the fast-changing environment, they experience substantially different performance results (presented in their balance sheets). The purpose of this research is to adapt the knowledge from the Resource based theory (that set the framework for studying different kind of resources) to the hotel industry in order to research the most important drivers of hotel performance and to measure their importance on the sample of hotel companies from Slovenia and Croatia. Additionally, this study evaluates the importance of key performance drivers for various segments of hotel companies in these two countries and in context of their financial success. Chapter 1 focuses on the Resource-based theory as a main framework for researching the various kinds of resources that can be transformed into sources of competitive advantages in general and also within the hotel industry. The chapter starts with the general overview of the theory and explains the origins of the Resource-based theory and its developments during the last fifty years. It continues with the in-depth research of the Resource-based theory (RBT) and explanation of the main concepts and developments of the theory into three major streams: knowledge-based view that perceives knowledge as the main source of company’s competitive advantage, nature-based view that understands natural resources as the main source of company’s competitive advantage and dynamic capabilities-based view that stresses the importance of the ability of a company to adjust to the every day’s dynamics of the fast changing environment. The research is performed in two steps and is based on the content analysis. In the first step 40 most cited papers from the top three most prominent management journals that focused heavily on the Resource-based theory conceptualization and implementation, are researched through the content analysis. Papers are classified according to the four major streams of research with their major findings presented. In the second step resources and capabilities as drivers of performance in the hotel industry are researched using approximately 40 papers published in international hospitality journals from 1996 to 2015. Papers were selected according to the number of paper citations within the field. The content analysis is used and papers are classified into main

categories. The purpose of this part of the research is to identify which concepts were mostly researched (tangible assets, intangible assets or capabilities) and which dependent variables measuring financial data were used in hospitality literature. In final part of the chapter, limitations and critical view of the two-step research process and its findings are brought to light for possible future research in this area. Content analysis shows relatively narrow approach of most of the hospitality performance studies that tested mainly one or a few indicators and their impact on the hotel performance. This is a call to action into a more holistic approach that would consider different assets and capabilities within a company and their inter-related impact on the performance in hotel industry. Chapter 2 focuses on researching and identifying the main drivers of performance within the hotel industry, using the Delphi method. The chapter starts with the overview and an explanation of the main goal of the research, which is selecting and understanding main drivers of hotel performance according to the opinions of the hospitality experts from Slovenia and Croatia. In the introduction part of this chapter the link to Resource-based theory is re-established and the major challenges of the empirical studies so far (measurement issues, wide scope of concepts and weak boundaries between them) are discussed. Hospitality studies accepted general concepts of assets and capabilities and focused mainly on empirical part when testing a single or a few drivers of hotel performance. Also, various types of intangible assets that attracted most of the research attention are presented. The chapter continues with the results of the in-depth literature review of 40 papers published in the last twenty years that tested various drivers of performance in hospitality industry. The final result of the research is the list and the description of 30 drivers that attracted most of the research attention within the area of hospitality. The literature offers many drivers but fails to explain their relative importance for establishing the long-term competitive advantage of a hospitality company. For this reason, the Delphi method on the panel of 10 hospitality experts from Slovenia and Croatia is employed in the methodological part. Delphi method is conducted in three rounds. The study presents the results of each of the three rounds as well as the final list of nine the most important drivers of performance in hospitality industry: location, market orientation, customer satisfaction, product development, service quality, flexibility, business processes, employee competencies and cooperation between tourism stakeholders. The final list of the drivers is compared with the literature analysis to understand how much of the attention the Academia gave to each of the driver in comparison to the importance of the same recognized by the panel of experts. At the end of this chapter general conclusions are discussed and limitations of the research explained. The research results are clearly pointing out the need for further operationalization of the main drivers, development of their measurement scales and their empirical testing using the quantitative research. Chapter 3 tries to contribute to the body of knowledge with the testing of the key drivers of hotel performance on the sample of hospitality companies from Slovenia and Croatia. This chapter further applies the knowledge and the structure of the performance drivers as tangible assets, intangible assets and capabilities based on Resource-based Theory and combines this structure

with the findings from the Delphi study from Chapter 2. The nine key drivers of hotel performance according to the expert’s opinions represent the input into the quantitative research performed in 60 companies that manage 228 hotels in two countries – Slovenia and Croatia. Both countries went through transition from socialist to market economy and are recently facing double-digit tourism growth rates. The importance and the impact of nine key drivers are tested through 64 statements among hotel managers. Self-reported data on importance of the drivers of hotel performance is connected with financial performance indicators received from the national agencies that are collecting companies’ financial statements (AJPES) in Slovenia and FINA in Croatia) for the period 2013 – 2016. The results of the research suggest that according to the tourism managers from Slovenia and Croatia, the customer-oriented drivers (quality of services, guest’s segmentation, guest’s satisfaction), are believed to have the main impact on the performance of hotel companies. Subsequently, the managers suggest, that hotel companies have to focus on process development, databases and new technologies; followed by market orientation and flexibility. Much to our surprise, employee management, location and cooperation received lower importance scores. Data from quantitative research was then related to companies’ financial performance data and cluster analysis was performed. Results of the cluster analysis show that there are five groups of companies (small private companies, unfinished transition, diversified portfolio, privatized companies with poor market orientation and successfully privatized companies with a clear vision) that according to the evaluation of importance of specific performance drivers differ significantly in the ownership models and development phases that they are in. Within the research process, we have also performed the regression analysis, but because of the nature of the data and the size of the sample, the method was not proper for analysis this specific data set. In the case of extremely diverse sample of companies, cluster analysis is much more appropriate method because it classifies the companies into similar groups taking into account evaluation of performance drivers under study. The results of this chapter reveal two major contributions. One is a different approach when observing the performance drivers in hotel industry. The research shows us, that these drivers significantly differ between different types of companies and therefore clustering the companies can offer more explanatory results than suggesting and researching the impact of the drivers on the whole sample of companies. Second, this study also indicates the results that are context-specific and are applicable for transitional countries experiencing growth of the industry and important transitional changes at the same time. This dissertation approaches the research challenge from holistic approach. It analyses the theoretical and empirical body of knowledge and establishes the wide framework of possible drivers that can become sources of competitive advantage in hotel industry. It appoints relevant research methodology to systematically decrease the number of drivers and evaluates their importance on performance of hotels in Slovenia and Croatia. The dissertation offers a clear understanding on what key drivers of hotel performance are, how important are they and how they impact the performance of companies in the markets of tourism growth, development and under transitional changes. Keywords: Resources, Capabilities, Competitive Advantage, Performance, Hospitality, Hotel industry, Delphi Method, Drivers of performance

Dejavniki uspešnosti podjetij: empirična raziskava na primeru slovenske in hrvaške hotelske dejavnosti
Povzetek
Namen te doktorske disertacije je proučiti glavne dejavnike uspešnosti na splošno in še posebej na primeru hotelskih podjetij v dveh državah: v Sloveniji in na Hrvaškem. Teorija danes poudarja, da je pomembno razumeti celoten okvir različnih vrst dejavnikov in prepoznati njihov vpliv na dolgoročni finančni uspeh podjetij. Za hotelska podjetja in izvajalce je ključno razumevanje, kateri dejavniki v hotelirstvu so najpomembnejši in kakšen je njihov vpliv na uspešnost. Slovenija in Hrvaška se trenutno nahajata v letih hitre rasti turizma in vsesplošnega razvoja. Hotelska podjetja, pod vplivom ugodnih turističnih trendov, stremijo k svojemu notranjemu finančnemu uspehu. Z različnim tempom sprememb v lastništvu, z izboljšavami storitev in procesov, kot tudi s prilagajanjem hitro spreminjajočem se okolju, dosegajo občutno različne rezultate uspešnosti (predstavljenimi v njihovih bilancah stanja). Namen raziskovanja v disertaciji, je prilagoditi znanje iz teorije, ki temelji na virih in ki določa okvir za preučevanje različnih vrst virov sredstev v hotelski industriji za raziskavo najpomembnejših dejavnikov uspešnosti hotelov in merjenje njihove pomembnosti na vzorcu hotelskih podjetjih iz Slovenije in Hrvaške. Raziskava ocenjuje tudi pomembnost ključnih dejavnikov uspešnosti za različne segmente hotelskih podjetij v imenovanih državah in v kontekstu njihovega finančnega uspeha. Prvo poglavje se osredotoča na teorijo, ki temelji na virih (angl. Resource based theory; v nadaljevanju se uporablja kratica RBT) in predstavlja okvir za raziskovanje različnih vrst virov sredstev, ki predstavljajo vire konkurenčnih prednosti na splošno in v dejavnosti hotelirstva. Poglavje se začne s splošnim pregledom teorije, razloži izvor teorije in njen razvoj v zadnjih petdesetih letih. Nadaljuje se s poglobljeno raziskavo teorije, razlago glavnih konceptov in predstavitvijo razvoja teorije v tri glavne smeri: na znanju temelječ pogled, ki zaznava znanje kot glavni vir konkurenčne prednosti podjetja; na naravi temelječ pogled, ki dojema naravne vire kot glavne vire konkurenčne prednosti podjetja in na dinamičnih zmogljivostih temelječ pogled, ki poudarja pomembnost sposobnosti podjetja prilagajanju vsakodnevni dinamiki hitro spreminjajočega se okolja. Raziskava je izvedena v dveh korakih in temelji na analizi vsebine (angl. Content analysis). V prvem koraku je s pomočjo analize vsebine raziskanih 40 najbolj pogosto citiranih člankov iz treh najuglednejših revij s področja managementa, ki se osredotočajo predvsem na konceptualizacijo in implemetacijo spoznanj na virih temelječe teorije (RBT). Članki, s predstavljenimi glavnimi ugotovitvami, so razvrščeni glede na štiri glavne raziskovalne smeri. V drugem koraku so viri in zmogljivosti kot dejavniki uspešnosti v hotelirstvu raziskani z uporabo približno 40 člankov, objavljenih med leti 1996 do leta 2015 v mednarodnih revijah s področja hotelirstva in turizma. Članki so bili izbrani glede na število citatov znotraj raziskovalnega področja. Uporabljena je analiza vsebine, članki pa so razporejeni v glavne kategorije. Namen

tega dela raziskave je prepoznava najbolj raziskanih konceptov (opredmetena sredstva, neopredmetena sredstva ali zmogljivosti) in v literaturi uporabljenih odvisnih spremenljivk, ki merijo finančne podatke. Zaključni del prvega poglavja razkriva omejitve in kritičen pogled na raziskovalni proces ter ponuja ugotovitve in izhodišča za nadaljnje raziskave na tem področju. Analiza vsebine kaže na relativno ozek pristop večine študij na področju ugotavljanja dejavnikov uspešnosti v hotelirstvu, ki so raziskovale predvsem enega ali nekaj indikatorjev in njihov vpliv na uspešnost poslovanja hotelov. To je poziv k prehodu v bolj celostni pristop, ki bi upošteval različna sredstva in zmogljivosti podjetja in njihov vpliv na uspešnost v hotelirstvu. Drugo poglavje se osredotoča na raziskovanje in prepoznavo glavnih dejavnikov uspešnosti v hotelirstvu z uporabo metode Delphi. Poglavje se začne s pregledom in razlago glavnega namena raziskave, ki je izbor in razumevanje glavnih dejavnikov uspešnosti hotelskih podjetij po mnenju strokovnjakov s področja hotelirstva in turizma v Sloveniji in na Hrvaškem. V uvodnem delu tega poglavja je ponovno vzpostavljena povezava s teorijo, obravnavani pa so tudi glavni izzivi dosedanjih empiričnih raziskav (težave z merjenjem, široko opredeljeni koncepti in šibke meje med njimi). Raziskave s področja hotelirstva so v splošnem sprejele koncepte sredstev in zmogljivosti, osredotočajo pa se predvsem na empirični del preverjanja enega ali več dejavnikov na uspešnost poslovanja hotelov. Predstavljene so tudi različne vrste neopredmetenih sredstev, ki so v okviru raziskav pritegnile največ pozornosti. Poglavje se nadaljuje z rezultati poglobljenega pregleda literature 40-ih člankov objavljenih v zadnjih dvajsetih letih, ki so preverjali različne dejavnike uspešnosti v hotelirstvu. Končni rezultat raziskave je seznam in opis 30-ih dejavnikov, ki so pritegnili največ pozornosti na področju raziskovanja v hotelirstvu. Literatura sicer ponuja veliko dejavnikov, vendar ne pojasnjuje njihovega relativnega pomena za vzpostavitev dolgoročne konkurenčne prednosti podjetja v dejavnosti hotelirstva. V ta namen je v metodološkem delu uporabljena metoda Delphi na skupini 10-ih strokovnjakov s področja hotelirstva in turizma iz Slovenije in Hrvaške. V raziskavi so prikazani rezultati vsakega izmed treh krogov raziskave kot tudi končni seznam devetih najpomembnejših dejavnikov uspešnosti v hotelirstvu: lokacija, tržna usmerjenost, zadovoljstvo gostov, razvoj proizvodov, kakovost storitve, fleksibilnost, poslovni procesi, kompetence zaposlenih in sodelovanje med turističnimi deležniki. Končni seznam dejavnikov smo nato primerjali z analizo teoretičnega dela v literaturi, da bi razumeli, koliko pozornosti je akademski krog namenil vsakemu dejavniku v primerjavi s pomembnostjo dano tem istim dejavnikom s strani skupine strokovnjakov. Na koncu tega poglavja so obravnavani splošni zaključki in pojasnjene omejitve raziskave. Rezultati raziskave jasno kažejo na potrebo po nadaljnji operacionalizaciji glavnih dejavnikov, razvoju merilnih lestvic in njihovem empiričnem preverjanju z uporabo kvantitativnih raziskav. Tretje poglavje poskuša prispevati k zbirki znanja s preverjanjem ključnih dejavnikov uspešnosti hotelov na primeru hotelskih podjetij iz Slovenije in Hrvaške. V poglavju so uporabljeni teoretično znanje in struktura dejavnikov uspešnosti (opredmetena sredstva, neopredmetena sredstva in zmogljivosti). Struktura je nato združena z izsledki študije Delphi iz drugega poglavja. Devet ključnih dejavnikov uspešnosti glede na mnenja strokovnjakov predstavlja vložek v kvantitativno raziskavo izvedeno v 60-ih podjetjih, ki upravljajo 228 hotelov v dveh

državah – v Sloveniji in na Hrvaškem. Obe državi sta izkusili prehod iz socialističnega v tržno gospodarstvo in se soočata z dvomestno rastjo turizma v zadnjem obdobju. Pri vodstvenem osebju v hotelskih podjetjih se je s 64 izjavami preverilo pomembnost in vpliv devetih ključnih dejavnikov na uspešnost poslovanja hotelskih podjetij v katerih delujejo. Podatki o pomembnosti dejavnikov na uspešnost so na podlagi samoocene povezani z indikatorji finančne uspešnosti prejetih s strani državnih agencij, ki zbirajo računovodske izkaze podjetij (AJPES v Sloveniji in FINA na Hrvaškem) za obdobje 2013 – 2016. Po mnenju turističnih strokovnjakov iz Slovenije in Hrvaške rezultati raziskave kažejo na to, da imajo h kupcem usmerjeni dejavniki (kvaliteta storitev, segmentacija gostov, zadovoljstvo gostov) največji vpliv na uspešnost poslovanja hotelskih podjetij. Strokovnjaki menijo, da se morajo hotelska podjetja v drugem koraku osredotočiti na razvoj procesov, podatkovne baze in nove tehnologije, katerim naj nato sledita še tržna usmerjenost in fleksibilnost. Na naše presenečenje so upravljanje zaposlenih, lokacija in sodelovanje prejeli nižje ocene pomembnosti glede vpliva na uspešnost poslovanja hotelskih podjetij. Podatke iz kvantitativne raziskave smo povezali s podatki o finančni uspešnosti in izvedli analizo razvrščanja v skupine oziroma grupiranje. Rezultati grupiranja kažejo na to, da obstaja pet skupin podjetij (majhna zasebna podjetja, podjetja z nedokončano tranzicijo, podjetja z raznolikim portfeljem, privatizirana podjetja s slabo tržno usmerjenostjo in uspešno privatizirana podjetja z jasno vizijo), ki se glede na oceno pomembnosti dejavnikov uspešnosti bistveno razlikujejo tako v modelih lastništva kot v razvojnih fazah v katerih se trenutno nahajajo. V okviru raziskovalnega procesa smo izvedli tudi regresijsko analizo, ki pa zaradi narave podatkov in velikosti vzorca ni bila primerna metoda za analizo tako specifičnega podatkovnega niza. Grupiranje je v primerih izredno raznolikega vzorca podjetij veliko primernejša metoda, ker podjetja razvršča v podobne skupine ob upoštevanju njihovega vrednotenja proučevanih dejavnikov uspešnosti poslovanja v hotelirstvu. Rezultati razkrivajo dva pomembna doprinosa. Prvi je drugačnost pristopa pri opazovanju dejavnikov uspešnosti v hotelirstvu. Raziskava kaže na to, da se ti dejavniki med različnimi vrstami podjetij bistveno razlikujejo, zatorej lahko grupiranje ponudi bolj pojasnjevalne rezultate, kot pa raziskovanje relativnega vpliva dejavnikov na celotnem vzorcu podjetij. Drugi doprinos pa so rezultati raziskave, ki so specifični v kontekstu držav v tranziciji, ki se istočasno soočajo z rastjo v hotelski industriji in pomembnimi tranzicijskimi spremembami. Pristop k raziskovanju te doktorske disertacije je celosten. Skozi preučevanje teoretičnega in empiričnega znanja, se v disertaciji oblikuje širok okvir možnih dejavnikov, ki lahko postanejo viri konkurenčnih prednosti v dejavnosti hotelirstva. Z vključevanjem ustreznih raziskovalnih pristopov, se število dejavnikov skozi raziskovanje zmanjšuje, ustrezno pa se vrednoti njihov pomen na uspešnost poslovanja hotelov v Sloveniji in na Hrvaškem. Disertacija ponuja razumevanje kaj dejavniki uspešnosti poslovanja v hotelirstvu so, kakšen je njihov pomen in kako vplivajo na uspešnost podjetij na trgih s turistično rastjo, razvojem in v času tranzicijskih sprememb. Ključne besede: viri, zmogljivosti, konkurenčna prednost, uspešnost, gostoljubnost, hotelirstvo, metoda Delphi, dejavniki uspešnosti

I
TABLE OF CONTENTS
INTRODUCTION ....................................................................................................................................... 1
BACKGROUND OF THIS STUDY .................................................................................................................................. 1 RESEARCH QUESTIONS ADDRESSED IN THIS STUDY .................................................................................................. 3 STRUCTURE AND CONTENTS OF THIS STUDY ............................................................................................................. 5
1 RESOURCES AND CAPABILITIES DRIVING PERFORMANCE IN THE HOTEL INDUSTRY .................................................................................................................................................. 9
1.1 OVERVIEW ....................................................................................................................................................... 9 1.2 INTRODUCTION ................................................................................................................................................ 9 1.3 RESOURCE-BASED THEORY: UNDERSTANDING ITS MAIN CONCEPTS AND DEVELOPMENT ............................... 10 1.4 RESOURCES AND CAPABILITIES IN THE HOTEL INDUSTRY: EMPIRICAL EVIDENCE FROM PAST STUDIES ............ 15 1.5 DISCUSSION AND CONCLUSION ...................................................................................................................... 22
2 WHAT DEFINES THE PERFORMANCE IN HOTEL INDUSTRY IN SLOVENIA AND CROATIA? MANAGERS’ PERSPECTIVE USING DELPHI METHOD ......................................... 25
2.1 OVERVIEW ..................................................................................................................................................... 25 2.2 INTRODUCTION .............................................................................................................................................. 25 2.3 OVERVIEW OF PREVIOUS STUDIES AND RECOGNITION OF EXISTING DRIVERS OF PERFORMANCE .................... 26 2.4 METHODOLOGY ............................................................................................................................................. 31 2.5 DELPHI ANALYSIS RESULTS ............................................................................................................................ 32 2.6 DISCUSSION AND CONCLUSION ...................................................................................................................... 37 2.7 FUTURE RESEARCH POTENTIAL ...................................................................................................................... 38
3. TOURISM AND HOTEL SECTOR IN SLOVENIA AND CROATIA – COMPARISONS AND COMMENTS ............................................................................................................................................. 40
3.1 NATIONAL LEVEL ........................................................................................................................................... 40 3.2 TOURISM NUMBERS ....................................................................................................................................... 41 3.3 CAPACITIES AND MARKET STRUCTURE ........................................................................................................... 43 3.4 HOTEL INDUSTRY ........................................................................................................................................... 45
4 PERFORMANCE DRIVERS IN HOSPITALITY INDUSTRY: EVIDENCE FROM SLOVENIA AND CROATIA ......................................................................................................................................... 49
4.1 OVERVIEW ..................................................................................................................................................... 49 4.2 INTRODUCTION .............................................................................................................................................. 49 4.3 DRIVERS OF PERFORMANCE IN THE HOSPITALITY INDUSTRY .......................................................................... 50 4.4 MEASURING THE PERFORMANCE IN HOSPITALITY RESEARCH ......................................................................... 53 4.5 THE SLOVENIAN AND CROATIAN TOURISM MARKETS .................................................................................... 54 4.6 METHODOLOGY ............................................................................................................................................. 55
4.6.1 Method ................................................................................................................................................... 55 4.6.2 Data description ..................................................................................................................................... 57
4.7. RESULTS ........................................................................................................................................................ 59 4.7.1 Drivers of performance: Descriptive statistical analysis ....................................................................... 59 4.7.2 Drivers of performance: Cluster analysis .............................................................................................. 65
4.8 DISCUSSION ................................................................................................................................................... 67 4.9 CONCLUSION ................................................................................................................................................. 69
GENERAL DISCUSSION ........................................................................................................................ 72
II
CONCLUSION .......................................................................................................................................... 75
THE MAIN FINDINGS OF THE DISSERTATION ............................................................................................................... 75
REFERENCE LIST .................................................................................................................................. 78
APPENDICES............................................................................................................................................ 92
LIST OF TABLES Table 1: Content analysis of RBV evolution and development ................................................................................. 13 Table 2: Resources and capabilities in the hospitality industry and their link to performance .................................. 16 Table 3: Drivers of performance in hospitality literature ........................................................................................... 28 Table 4: Respondents' characteristics ......................................................................................................................... 31 Table 5: Delphi round 1 results .................................................................................................................................. 32 Table 6: Delphi round 2 results .................................................................................................................................. 33 Table 7: Final Delphi results – round 3 ...................................................................................................................... 34 Table 8: Key drivers and academia coverage ............................................................................................................. 35 Table 9 and Table 10: Tourism development on a national level .............................................................................. 40 Table 11: Domestic and International brands in Croatia in 2017 ............................................................................... 46 Table 12: Performance drivers in hospitality: A literature review summary .............................................................. 53 Table 13: Indicators of tourism development ............................................................................................................. 55 Table 14: Statements used in quantitative study to evaluate nine drivers of performance ......................................... 57 Table 15: Number of hotels and star-rating in responded companies in Slovenia and Croatia .................................. 58 Table 16: Driver of hotel performance: Quality of services ....................................................................................... 61 Table 17: Driver of hotel performance: Segmentation ............................................................................................... 61 Table 18: Driver of hotel performance: Guests’ satisfaction ...................................................................................... 62 Table 19: Driver of hotel performance: IT Development ........................................................................................... 62 Table 20: Driver of hotel performance: Market orientation ....................................................................................... 63 Table 21: Driver of hotel performance: Flexibility .................................................................................................... 63 Table 22: Driver of hotel performance: Employee management ............................................................................... 64 Table 23: Driver of hotel performance: Location ....................................................................................................... 64 Table 24: Driver of hotel performance: Cooperation ................................................................................................. 65 Table 25: Results of the cluster analysis using Ward method and K-means clustering .............................................. 66

III
LIST OF FIGURES Figure 1: Levels and areas of research within RBV development ............................................................................. 12 Figure 2: Drivers of hotel performance through literature and the Delphi study ....................................................... 36 Figure 3: Tourists and overnights in Slovenia (2013 – 2018) ..................................................................................... 41 Figure 4: Tourists and overnights in Croatia (2013 – 2018) ....................................................................................... 42 Figure 5: Structure of tourists in Slovenia and Croatia (2013-2018) ......................................................................... 42 Figure 6: Growth rates in the number of tourists in Slovenia ..................................................................................... 43 Figure 7: Growth rates in the number of tourists in Croata ........................................................................................ 43 Figure 8 and Figure 9: Tourism capacities in Slovenia and Croatia (2013 – 2017) .................................................. 44 Figure 10: Foreign market structure in Slovenia and Croatia (2017) ......................................................................... 44 Figure 11: Foreign market structure in Slovenia and Croatia (2017) ......................................................................... 45 Figure 12, Figure 13, Figure 14 and Figure 15: Overnights and bed capacities in Slovenia and Croatia in 2017 (označiti prva dva sta Hrvaška, druga dva Slovenija) ................................................................................................. 45 Figure 16 and Figure 17: Hotels by category in Slovenia and Croatia in 2017 ........................................................ 46 Figure 18, Figure 19 and Figure 20: Hotel occupancy, ADR and RevPAR comparison (2017) .............................. 47 Figure 21: Three steps in the research process ........................................................................................................... 55 Figure 22: Key performance drivers .......................................................................................................................... 56 Figure 23: Comparison of average ROA, ROE and GOP for Slovenia and Croatia (2013-2016) .............................. 59 Figure 24: Comparison of average sales growth and asset growth for Slovenia and Croatia (2013-2016) ................ 59 Figure 25: Drivers of performance according to importance (Comparison of Quantitative research and Delphi study) .................................................................................................................................................................................... 60
LIST OF APPENDICES
Appendix 1: Longer summary in Slovene language ..................................................................................................... 1 Appendix 2: Quastionnaire for the quantitative analysis ............................................................................................ 11 Appendix 3: Ranking table for all statements in descriptive analysis..........................................................................18 Appendix 4: Results of the cluster analysis .................................................................................................................20 Appendix 5: Results of descriptive statistics and correlations ………………………………………………………27
1
INTRODUCTION
BACKGROUND OF THIS STUDY
Drivers of performance are described as those important factors that drive the inner success of a company. Companies focus on various drivers differently; they combine and employ them through inner processes and develop their competitive advantages. Throughout the years, researchers succeeded in describing various types of resources with the ability to become sources of competitive advantage. 60 years ago, prominent researchers Penrose, Wernerfelt, and Andrews exposed the importance of the company’s resources and the ability to adapt these resources to the constantly changing environment. In 1991, Barney set the milestone of the Resource-based theory with description of resources that have the ability to become sources of competitive advantage for every company. He claimed that these resources have to be rare, valuable, inimitable, and non-substitutable (Barney, 1991). Resource-based theory evolved around various streams exposing the importance of various types of resources, such as knowledge, natural resources, and dynamic capabilities. Resource-based view offers appropriate framework to study drivers of the company’s success on a wider scale. For this reason, it is used as a theoretical foundation in this doctoral dissertation. Researchers split resources into various types of assets and capabilities and offered a new understanding of these concepts. For majority of them, they were able to develop measurement scales which enabled the researchers to test the impact of these drivers on performance for different industries. In the field of hospitality, early studies tested the impact of service quality, quality policies, and HRM practices on hotel performance, many of them showing a positive impact on company’s performance. Later studies tested one or a few drivers on performance and focused mainly on quality, market, and customer-oriented drivers, as well as various types of intellectual, relational, and social capital. Recently also environmental management and practices, CRS practices, and ICT became important and deeply researched in the performance studies. Nevertheless, until today a clear answer to a question about which drivers are the ones that contribute the most to the success of a hotel company, was not put forward. For hotel practitioners, it is vital to understand which drivers are the ones that have a confirmed and important impact on hotel performance in order focus and develop further these resources and capabilities within their companies. For researchers in hospitality industry, it is valuable to understand the wider framework of all-important drivers within the industry, their interlinkage, recent research, and the impact that is recognized to the specific drivers from the aspect of the industry management. This is a predominant reason why further research is needed within the topic of a hotel company’s performance and why this dissertation topic explores it through the various steps of methodological process.

2
Hotel industry is a service based, capital intensive and market-oriented industry where competition is fierce and managers strive every day to improve their performance measures combining different resources and capabilities, recognizing them different importance. Situation is even more complex in case of transitional economies like Slovenia and Croatia where processes of ownership, investments, and management took various turns during the last 20 years. In this doctoral dissertation we take into account all these issues when researching key drivers in hotel industry. Firstly, we research the foundation of Resource-based theory to understand its concepts, types of resources and the development of the theory until today. Secondly, we research the already recognized most important drivers in the hotel industry to understand which drivers were already researched and have been proved to have an important impact on the hotel company’s performance. Thirdly, we put the knowledge from the first two steps into the research process to discover which drivers are the most important in the case of Slovenia and Croatia. This dissertation studies the drivers of hotel performance through an alternative - more holistic approach that researches the impact of many drivers on performance with the aim of providing the ranking of drivers according to importance through the eyes of Academia and practitioners with ambition to explore the link to performance on the sample of hotel companies from Slovenia and Croatia.
THE PURPOSE OF THE STUDY
The main purpose of this research is to offer a list of the most important drivers of performance in hospitality industry and to test their impact on performance on the case of Slovenia and Croatia. To reach this purpose, it is important to structure different performance drivers in order to better understand their origin, nature and development, to analyze and find the most important drivers according to the experts’ point of view and then to test their impact on the representative sample of companies in two transitional markets, Slovenia and Croatia. The primary objective is to set a shortlist of the key drivers according to their importance and to offer researchers and hotel managers guidelines on which drivers to focus in order to be more competitive and successful. The dissertation approaches to the research problem through three levels of the research process: • First level: Content analysis of the 40 papers covering major issues and developments of the
Resource based theory and content analysis of 40 papers that empirically tested specific drivers within hospitality industry. The goal of the study on the first level is to create the list of the most recognized and tested drivers within the hospitality industry.
• Second level: Qualitative Delphi study based on the list of drivers from the content analysis from the research on the first level. The list represents the input to the study organized with the group of 10 hospitality experts in Slovenia and Croatia. The goal of the study on the second level is evaluation of the importance of the drivers according to their subjective

3
perception on how these drivers impact the hotel performance in three rounds of Delphi study. Besides evaluation of the specific drivers, the experts contributed their own recommendations of additional drivers that in their opinion significantly impact the performance of hotels.
• Third level: Quantitative study among hotel managers in Slovenia and Croatia performed on
the sample of all hotel companies registered in Slovenia and Croatia using the national classification system. The statements for the questionnaire were developed and a total of 64 statements were used in the quantitative study measuring the relative importance of 9 key drivers through the 7-point Likert scale. 60 completed questionnaires were analyzed and the relative importance of each driver was established. Additionally, self-reported data on the importance of drivers of hotel performance was connected with financial performance indicators from the company’s financial statements for the period 2013 – 2016. Descriptive statistical analysis and cluster analysis are performed to better understand the differences in importance-performance ratings and the financial results.
RESEARCH QUESTIONS ADDRESSED IN THIS STUDY
Doctoral dissertation is structured into three chapters: Chapter 1 examines the theoretical and empirical studies to establish a framework to define the list of possible performance drivers for hotel industry. The main research question addressed in this chapter is: What are the main drivers of hotels performance identified in the literature?
Performance is one of the most researched topics in business and economic field. What really drives the performance has always been a trigger for researchers as well as practitioners. Authors Penrose (1959), Andrews (1971), Wernerfelt (1984), Barney (1991), Peteraf (1993) and Schoemaker (1993) set the framework of the Resource-based theory that provided the environment for development of the concepts such as resources and capabilities and their impact on long-term competitive advantage.
Academia studied the concepts and characteristics of various types of resources and researched their link to firm’s competitive advantages. When researchers developed measurement scales, they started to test the impact of different drivers on performance within industries. To answer on the research question, the knowledge from the theory rooted in the Resource-based view has to be combined with the findings from empirical studies relevant for hotel industry. The most researched drivers during the last decades can be classified into three basic groups of resources based on guidelines from Resource-based theory (tangible assets, intangible assets and capabilities) and evolvement of these drivers throughout different development streams of the theory can be explained (main-stream, knowledge-based view, natural-based view and capabilities-based view). From the in-depth study of empirical papers within hotel industry, a list of potential drivers in hotel industry, that can become a source for competitive advantage, can be developed.

4
Chapter 2 develops a list of 30 drivers as potential drivers of hotel performance and tests them to establish a short-list of the most important drivers of hotel performance from the expert’s point of view. The main research question in this chapter is: What are the main drivers of performance in hotels industry from perspective of hotel experts in Slovenia and Croatia?
Hospitality industry started to empirically test various drivers 20 years ago. Most of the papers until today tested the impact of intangible assets and capabilities on hotel performance while the relation between tangible assets and hotel performance was often neglected from the researcher’s point of view. Theory grouped intangible assets into company’s organizational, human, marketing and environmental assets and capabilities into operational and dynamic. Tangible assets are grouped into physical and financial assets. According to the extensive research of the hospitality industry, the list of 30 drivers that received most of the research attention can be developed. The list represents the input into Delphi study where experts from Slovenia and Croatia evaluated their importance and suggested new drivers in three rounds of the research process. The final list of the most important drivers with the greatest impact on hotel company’s performance is created based on the opinions of experts. These drivers have the greatest potential to become sources of long-term competitive advantage for the companies in hotel industry.
Chapter 3 shows differences in tourism and hotel industry data between the countries in detail.
Chapter 4 focuses on two countries (Slovenia and Croatia) and tests the importance of nine key drivers on hotel performance. The two research questions in this chapter are: Which drivers are the most important according to opinions of hotel managers in Slovenia and Croatia? Does the importance of key performance drivers differ between hotels and how does this affect their performance?
Slovenia and Croatia currently face double-digit tourism growth rates. Both countries went through transition from socialist to market economy and during this development phase where going through privatization, investing substantially in infrastructure, as well as in quality of services, process development, employees and marketing. For practitioners comparing their hotels’ performance indicators and international benchmarks, it is not easy to understand on which drivers to focus in order to improve the hotel performance. For Academia, the understanding of the wider picture of different interrelated drivers of performance in transitional markets, their measurement issues and relative importance to performance is valuable for further research in this area. This is addressed in Chapter 4 examining the relative importance of each of the nine key drivers on the sample of hotel managers from Slovenia and Croatia and linking their self-reported data on importance of drivers with financial performance indicators of their hotel companies in the period 2013 – 2016. The cluster analysis is used to classify data into five different clusters based on their evaluation of performance drivers.
5
STRUCTURE AND CONTENTS OF THIS STUDY
Dissertation is organized into introduction, three main chapters and conclusion, followed by the reference list and appendices. This dissertation is not written as a monography. It is paper based PhD thesis and three main chapters represent three separate but connected papers. Paper 1 or Chapter 1 is published in Tourism and Hospitality Management, Paper 2 or Chapter 2 is accepted for publication in Economic and Business Review and Paper 3 of Chapter 4 is currently under review in international hospitality journal. Chapter 1 is entitled: Resources and capabilities driving performance in the hotel industry. The chapter starts with the overview of the studies explaining the evolution of the Resource-based view, its main concepts and developments. The papers are structured according to the theory mainstream research and three other streams (knowledge-based view, nature-based view and dynamic capabilities-based view) with their main contributions presented. The chapter continues with the research of papers studying the resources and capabilities within the international hotel industry. The research structures the papers according to the type of resources (tangible, intangible, capabilities) and the performance measure used in testing the link to hotel performance. Two-step content analysis improves the current body of knowledge on the first level by structuring the development of the theory into three streams. On the second level, the content analysis investigates the drivers of performance in the hotel context and contributes to the body of knowledge with the structured and overall view of papers in most prominent hospitality and tourism journals that attempted to connect hotel’s competitive advantages with their performance. Research offers also chronological view on the evolvement of the empirical testing’s from 1997 onwards with explanations about the impact these studies were giving to the specific characteristics of the resources and capabilities under study. Chapter 2 is named: What defines the performance in hotel industry in Slovenia and Croatia? Managers’ perspective using Delphi method. The chapter further examines which resources and capabilities can become a source of competitive advantage in the hotel industry. It starts with results of a literature review presenting a short list of 30 most researched drivers of performance in hospitality literature with the tested impact of these drivers on performance. Most of the studies tested the impact of intangible assets and capabilities on performance while research on tangible assets is scarce. These drivers are structured according to the type of resources (tangible, intangible assets and capabilities). The list of 30 drivers with the ability to become sources of competitive advantage for the hotel companies were included as input into the Delphi study to identify which drivers are crucial in order to achieve a performance success. The results of the three-round study suggest 9 highly ranked drivers of performance with such ability. The comparison of these drivers with the literature analysis shows that HRM practices, brand equity, hotel facilities, environmental practices, organizational culture and business processes received considerable interest in the literature while the panel of experts did not recognize the same drivers as the most crucial ones. Quite opposite, experts believe that location, flexibility, segmentation and product development are crucial drivers of hotel companies’ success while literature failed to give these drivers much interest. Market orientation, customer satisfaction,

6
service quality and business processes were recognized by both, the literature and the panel of experts, as important drivers of hotel success. Chapter 3 presents the tourism and hotel sector in Slovenia and Croatia in detail. It is called: Tourism and hotel sector in Slovenia and Croatia – comparisons and comments. Chapter 4 is called: Performance drivers in hospitality industry: evidence from Slovenia and Croatia. The chapter focuses on identifying the major drivers of hotel performance in two emerging countries, Slovenia and Croatia. Furthermore, different approaches measuring the performance of hotels are analyzed. Most empirical papers use combinations of traditional financial performance indicators based on financial statements with majority of them using ROA, ROE, Revenue growth and different profitability measures (ROI, GOP, GOPAR). The chapter offers also quick overview of the Slovenian and Croatian tourism markets with their main tourism indicators. In methodological part, the development of the scales for measuring the importance of the drivers on performance is presented. In addition, the results of the quantitative research on the sample of hotel companies in Slovenia and Croatia are showed. The results reveal the importance rankings of all nine key drivers of performance in hotel industry according to the perceived self-evaluation of the hotel managers. Managers ranked quality of services as first, segmentation as second and guest’s satisfaction as third most important driver of hotel performance, followed by IT development, market development, flexibility, employee management, location and cooperation. Results also imply that clustering the companies into groups and then presenting the relationships between importance of the drives given by the hotel managers and the financial performance of their companies, offers more in-depth understanding why these companies substantially differ in the financial performance results. Cluster analysis resulted into five very different groups of companies based on their similarities in managers’ evaluations of performance drivers using Hierarchical-clustering method. Chapter 4 explains these groups and ranks their performance results based on ROE. Final results confirm, that the most successful group of hotels focuses on market orientation, employee management and quality of services as the main recipe of their performance success. The doctoral dissertation concludes with the general discussion and conclusion.

7
DICTIONARY OF KEY TERMS USED IN THE DISSERTATION Resource-based view (BRV) Theory that explains sustained differences in firm performance by identifying differences in firm resources. A firm with resources that are valuable and rare may generate a competitive advantage over its rivals, thereby resulting in superior financial performance (Barney, 1991; Wernerfelt, 1984; Peteraf, 1993). The most important critics questioned RBV’s basic concepts as are resources and their value as well as narrow conceptualization of firm’s competitive advantage. The authors of RBV acknowledged the critics’ view that resources can only be a source of competitive advantage if they are exploited through business processes (Porter, 1991; Stalk, 1992). The other less important critiques were that RBV has limited managerial implications and that it is not adapted to the constant changing environment. Resources Valuable tangible, intangible assets, and capabilities that a firm possesses (Barney, 1991). Tangible assets Financial and physical assets (measured in a firm’s balance sheet) such as land, buildings, cash etc. (Barney, 1991; 2001; Andersen and Kheam, 1998). Intangible assets Non-physical assets (policies, brands, practices, culture, IT platforms) that are rarely included in a firm’s balance sheet (Barney, 1991; Grant, 1996; Teece et. al., 1997). Capabilities (skills) Bundles of skills and accumulated knowledge (Barney, 1991). Operational capabilities Routines that enable firms to perform activities on an on-going basis (Helfat and Winter, 2011). Dynamic capabilities Skills that enable firms to adjust to the constant changes from the environment. These are skills that enable to identify the opportunities (to sense), to exploit them (to seize), and to continuously renew (transform) (Zahra, Sapienza, Davidsson, 2006). Dynamic capabilities are organizational and strategic routines by which firms achieve new resource configurations as markets change. Examples of dynamic capabilities are strategic decision-making, product development routines, knowledge-creation routines etc. Sustainable competitive advantage Sustaining and possessing resources that are inimitable and non-substitutable, preventing the rivals to replicate and taking away their value by rivals. (Barney, 2001). Sources of competitive advantage (SCA) Resources that are valuable, rare, inimitable, and non-substitutable by competitors (for example: firm’s specific human capital or tacit knowledge) (Barney, 1991). The term has been challenged by many authors in terms of investing in and measuring the value obtained from investments into sources of competitive advantage.

8
Drivers of performance Organizational resources that create value. In the literature, they are also described as organizational value drivers. Authors as are Penrose (1959), Dietricx and Cool (1989), Lippman and Rumelt (1982) state that these resources appear in bundles and impact performance with causal ambiguity. For this reason, it is difficult to identify how individual resources contribute to the success without taking into account also the interdependencies with other assets Delphi study Invented in 1950s and applied in a wide range of industries. It is a quantitative technique which structures communication of a group of individuals and enables an effective process of problem solving. The method seeks a group decision-making by seeking opinions without face-face interaction through a set of carefully designed sequential questionnaires with summarized information and feedback of opinions from earlier responses (Delbecq et al., 1975). The process ends when either consensus or stability of responses has been achieved.

9
1 RESOURCES AND CAPABILITIES DRIVING PERFORMANCE IN THE HOTEL INDUSTRY
1.1 OVERVIEW
The first chapter provides an overview of the resources and capabilities framing sustainable competitive advantage in the hotel industry. The chapter summarizes the findings from conceptual and empirical research and presents empirical testing’s of sustainable competitive advantages driving the performance in the hotel industry during the last three decades. Results of the content analysis show that most of the studies in the hotel industry focus on investigating the impact of intangible resources and capabilities on hotel performance while tangible resources are rarely considered and included in the research.
1.2 INTRODUCTION
In the last fifty years the performance of firms has been one of the most important research concepts in management, business and economic literature. During that period academics and practitioners were trying to understand the sources of sustained competitive advantages that are driving potential above-normal performance of firms. The first attempt at conceptualising the theory of firms' growth was made by Penrose in 1959. She acknowledged that firms' resources as well as effective and innovative management are important drivers of their economic value and growth. Following Penrose's work, Andrews (1971) emphasised that firms' competitive advantages are driven by their ability to mitigate and adjust to dynamic changes coming from the environment. Wernerfelt in 1984 coined and formally established the resource-based view (RBV) underlining that firms must focus on developing resources rather than products. This was the foundation for the development of a resource-based view that became the main theoretical framework for understanding the competitive advantage of firms for more than three decades. The main milestone for the resource-based view development was in 1991 when Barney defined the main characteristics of resources, explained the link between resources and sustainable competitive advantage, and distinguished between different types of resources as important potential drivers of the performance of firms. His work was followed by Peteraf (1993), who further defined the conditions under which competitive advantages of the firm lead towards above-normal returns, and Amit and Schoemaker (1993), who clearly distinguished between the firm's resources and capabilities. Further development of the theory resulted in acknowledging three prominent areas of resources that are highly relevant for establishing competitive advantages of the firm:
10
knowledge-based view (KBW) (Grant, 1996), nature-based view (NBW) (Hart, 1995) and dynamic capabilities-based view (DKW) (Teece, Pisano and Shuen, 1997). Major criticism of RBV revolves around its lack of practical solutions and their testing at the empirical level. Among serious drawbacks for empirical testing was the complexity of RBV concepts. Most of them are elusive, hard to measure and highly dependent on formal and informal agreements between the firm's major stakeholders: owners, management and employees. Negotiating power and agreements between the stakeholders have a strong impact on the firm's performance, but are often ignored and not measured in empirical studies. As a result, many empirical studies focused on specific aspects of resources or capabilities and empirically tested their separate impact on the performance. Most studies focus on examining intangible resources alone within a single industry context (Foss, 1997). Other studies focus on physical or tangible resources. However, the ability to understand the relationship between resources, capabilities and firms' performance helps to more precisely define the true sources of competitive advantages (Foss, 1997). The purpose of this paper is to provide an overview of theoretical concepts used to define resources and capabilities that are translated into sustainable competitive advantages in the hotel industry. Those resources and capabilities that represent firms' sustainable competitive advantages are the main drivers of performance. The study is conceptual and provides a synthesis of previous studies. The paper provides a two-step content analysis – the first one on RBV development and the second one on studies connecting hotels' resources and capabilities with their performance. Unfortunately, due to the extensive body of research in these areas, we could not possibly include all the studies in our analysis. This is why we have focused on most cited studies (with the major impact) in the areas. This is a novel approach; available literature has so far failed to provide a review paper summarising empirical results of many studies that explored a single or a few resources and capabilities driving performance. As such, this paper brings a theoretical contribution summarising and reflecting on the current body of knowledge. It also offers a holistic approach to understanding resources and capabilities driving performance in the hotel industry and provides useful insights for subsequent research.
1.3 RESOURCE-BASED THEORY: UNDERSTANDING ITS MAIN CONCEPTS AND DEVELOPMENT
Major theoretical framework used to study the growth and performance of firms is RBV. This theory has a basis in economics and strategic management literature. Therefore, most of the concepts used to explain firms’ performance have their roots in economics and management science. It is somehow acknowledged that RBV started with Barney (1991), but this is not entirely true. The roots of RBV go back to the 1960s and they are connected to the work of Penrose (1959) and Andrews (1971). They recognised that resources influence firms' growth and performance. Barney's

11
(1991) undoubtable contribution was in the clarification of the link between resources and sustainable competitive advantages. He proposed that only resources that are valuable, rare, inimitable and non-substitutable are a potential source of sustainable competitive advantages (Barney, 1991). Those competitive advantages can lead firms towards abnormal returns. Amit and Schoemaker (1993) recognised that not only resources, but also capabilities defined as "firm's capacity to deploy resources" (p. 35) are potential sources of firm's competitive advantages. Literature at its early stage distinguished between resources and capabilities as potential sources of firms' competitive advantage. In its further division, resources are classified as tangible and intangible (Collins, 1994) and capabilities as operational and dynamic (Winter, 2003). Tangible resources denote financial or physical assets of a firm and are measured by its balance sheet (Andersen and Kheam, 1998). The definition of intangible resources is much more complex because intangible resources are non-physical by nature and are rarely included in the firm's balance sheet and therefore hard to measure. So far literature recognised HRM practices, firm's policies, employees and managers skills, firm's intellectual, social and relational capital as well as organisational culture as its intangible resources (Grant 1996; Castanias and Helfat, 1991; Barney, 1991; Teece et al., 1997). On the other hand, capabilities are bundles of skills and accumulated knowledge (Winter and Nelson, 1982; Teece et al., 1997) that can be operational or dynamic. Operational capabilities are routines that enable firms to perform activities on an on-going basis using more or less the same techniques over time to produce goods and services that have solid demand on the marker (Helfat and Winter, 2011). Dynamic capabilities are directed towards firms' ability to adjust to the changes coming from the boarder environment (Zahra, Sapienza and Davidsson, 2006). Resource-based theory evolved and developed into three streams: knowledge-based view, nature-based view and dynamic capabilities-based view. At the very beginning, Grant (1996) recognised the importance of knowledge as generator of sustainable competitive advantages of firms. Because knowledge is hard to imitate and is embodied in everyday practices of firms, it was seen as the most important source of their sustainable competitive advantage (Foss, 2011). Studies in this area gravitated towards psychology in order to better understand mechanisms that motivate and retain human capital within the firm (Coff and Kryscynski, 2011). Another stream of research dealt with the natural environment as a major driver of sustainable competitive advantage (Hart, 1995). Natural environment can be seen as a part of firms' physical resources. It can also be seen as intangible assets and capabilities embodied in firms' policies and practices reflecting their relations with the natural environment. This was the foundation for the development of corporate social responsibility as an important theoretical framework in strategic management literature (Siegel, 2011). The third stream of research emphasised firms' ability to adapt to the changes from the dynamic environment (Teece et al., 1997). Due to the technological revolution, globalisation and rapid changes taking place in the market, firms' abilities to adjust and adapt their resources and capabilities to global changes became an important source of sustainable competitive advantage.

12
In the 2000s the focus redirected from conceptual work towards empirical testing. Attention was devoted to operationalisation and measurement as well as empirical testing of the relation between firms' sustainable competitive advantages and performance. This produced a body of research investigating the impact of a single or multiple resources or capabilities on firms' performance. This stream of empirical research is still developing and empirical evidence is flowing from different countries and sectors. The main criticism of such empirical studies is related to their narrow approach and focus on a single sustainable competitive advantage. This limits their ability to provide a holistic overview and contribute to the understanding of relations between resources and capabilities that are driving firms' performance. Another limitation is related to their measurement scales. Sustainable competitive advantages are simply hard to measure. An attempt to synthesise the current body of knowledge related to RBV is provided in Figure 1. Figure 1: Levels and areas of research within RBV development
Source: Authors
A synthesis provided in Figure 1 is based on an extensive content analysis of RVB literature presented in Table 1. Since RBV research evoked considerable attention in academic literature, we conducted a content analysis based on 40 papers that have left a strong mark on RBV development and were published in top three management journals: Strategic Management Journal, Journal of Management and Academy of Management Review. These journals have been focused on RBV and its development in the last four decades. The papers were selected based on their citations level – top 40 most influential papers in the area were considered. Citations are an objective measure of paper impact on the area. However, they were very different. Some papers were cited as many as 11.000 times, while others were cited 600 times. That is why we partially also used subjective criteria, which are based on extensive knowledge in the area, to make the cut-off point and include

13
40 papers in our analysis. Keywords used in the search process were resources, capabilities, resource based theory and competitive advantage. Paper contents were analysed using content analysis, as appropriate qualitative research technique for objective and systematic analysis of textual data (Berelson, 1952; Bauer, 2000). The papers used in the content analysis were carefully studied and categorized accordingly. The main categories or themes were identified (Byrman and Bell, 2011) and used for evaluation of the literature. A detailed analysis of the resource-based theory evolution and its development, which includes three prominent streams, i.e. knowledge-based, nature-based and dynamic capabilities view, is presented in Table 1. Papers were sorted chronologically based on their date of publication. The authors and the year of publishing are indicated first, followed by the main focus and paper contribution. Results of the content analysis have shown that in the early stage of RBV development focused on the clarification of the basic concepts: tangible, intangible resources and capabilities and how can they be translated into firms' competitive advantage. With further development of the theory, the authors focused on better understanding of knowledge as source of firms’ competitive advantage. Those studies researched HRM practices, firm policies, employees skills, managers' skills, firms' intellectual and social capital, relational capital and organisational culture as sources of firms' competitive advantages. Simultaneously with the knowledge-based view, studies focusing on the nature-based view were exploring firms' environmental policies, corporate social responsibility practices, managers' and employees' attitudes and knowledge about natural environment protection and their connection with firms' performance. In the early 2000s studies shifted their attention to emphasising the importance of dynamic capabilities, such as market orientation, innovation capacity, managerial ability to avoid strategic drift and managerial network capital as important drivers of firms' success. Dynamic capabilities are still at the core of researchers' interest. Based on our findings we classified the papers analysed in Table 1 into one or more categories: 1) resource-based view mainstream research (RBV-M) that includes research – defining and
clarifying the main concepts of RBV – resources and capabilities; 2) nature-based view (NBV); 3) knowledge-based view (KBV) and 4) dynamic capabilities view (DCV). Table 1: Content analysis of RBV evolution and development
AUTHOR(S ) AND YEAR RBV- M NBV KBV DCV MAIN CONTRIBUTIONS
Penrose (1959) + Resources influence firms' growth and economic performance.
Lippman and Rumelt (1982) + Concepts of RBV: Inimitability and causal ambiguity.
Wernerfelt (1984) +
Coined RBV: Firms must focus on their resources rather than products.
Barney (1986) + Organisational culture is a potential source of SCA.
Dietricx and Cool (1989) +
Resources as potential SCA are non-tradable assets like skills, values, firm reputation, customer loyalty, etc.

14
AUTHOR(S ) AND YEAR RBV- M NBV KBV DCV MAIN CONTRIBUTIONS
Barney (1991) +
Articulated the characteristics of resources to become SCA: valuable, rare, inimitable and non-substitutable.
Castanias and Helfat (1991) + CEO's skills are a very important resource of the firm.
Fiol (1991) + Organisational identity is an important source of SCA.
Conner (1991) + RBV is developing as a new theory of firms.
Kogut and Zander (1992) +
Combinative capabilities and especially knowledge are very important resources.
Peteraf (1993) + Defined four conditions under which SCA exists.
Amit and Schoemaker (1993) + A clear distinction between resources and capabilities.
Grant (1996) + Intangible know-how is a source of firms' SCA.
Hart (1995) +
Negative impacts of a firm's development can destroy the environmental resources on which it depends.
Miller and Shamsie (1996) +
Divided resources to property-based and knowledge-based, and the first test of the resource–performance link.
Oliver (1997) +
Firm's SCA depends on the internal culture; inter-firm relations and influences from the society and state.
Teece, Pisano and Shuen (1997) + Introduced the concept of dynamic capabilities.
Coff (1999) +
SCA does not always lead to high-level performance (rent appropriation problem).
Eisenhardt and Martin (2000) + Explained when SCA can be achieved in dynamic environment.
Wright, Dunford and Snell (2001)
+ Explained the link of RBV with human resource management.
Barney (2001) + RBV positioning according to other theories.
Makadok (2001) + Explained the link between RBV and DCV.
Winter (2003) + Introduced the concept of high-order capabilities.
Ray, Gautam and Muhanna (2004)
+ Resources can become SCA only if they are translated into business processes, routines and activities.
Teece (2007) +
Set the dynamic capabilities framework to sustain superior performance in an open economy with rapid innovation.
Armstrong and Shimizu (2007) + Researched and critiqued the methods used in RBV.
Sirmon, Hitt and Ireland (2007) +
Explained how to manage firms' resources in a dynamic environment.
Crook, Ketchen, Combs and Todd (2008)
+ Measured the link between firms' strategic resources and performance through meta-analysis.
Zahra, Filatotchev and Wright (2009)
+ Corporate governance (ownership, board composition, executive compensation) has an important impact on CA.
Kraaijenbrink, Spender and Groen (2010)
+ Reviewed all the important critics of RBV.
Garbuio, King and Lovallo (2011)
+ The differences in managerial decisions which impact firms' performance explained with psychology.
Foss (2011) + Knowledge-based value creation is a key research topic.
Coff and Kryscyinski, 2011) + +
Unique capabilities develop through attracting, retaining and motivating human capital.
McWilliams and Siegel (2011) +
Corporate social responsibility can lead to SCA and firms' performance.
Hart and Dowell (2010) + + NRBV has a strong link to dynamic capabilities.
Maritan and Peteraf (2011) +
Firms develop their resource positions through resource acquisition on factor markets and internal resource accumulation.
Molloy, Chadwick, Ployhart and Golden (2011)
+ Presented a multidisciplinary assessment process to explain how intangibles create value and impact performance.

15
AUTHOR(S ) AND YEAR RBV- M NBV KBV DCV MAIN CONTRIBUTIONS
Wilden, Gudengan, Nielsen and Lings (2013)
+ Dynamic capabilities are not positively and directly related to performance.
Lin and Lei-Yu (2014) +
Dynamic learning capabilities are the most effective in mediating the influence of resources on performance.
Helfat (2014) +
Explained how to properly structure and measure the link between dynamic managerial capabilities and performance.
Source: Authors As we can see from the analysis presented in Table 1, research in early phase of theory introduction and later in the phase of theory development was mainly focused on trying to explain the main theoretical concepts. Because most of these concepts were “fuzzy”, the process of translating them into measurable items was demanding, since most of them were hard to measure. Furthermore, the original theoretical propositions were criticized as being static and not incorporating the dynamic nature of the changes coming from the fast changing environment. Those were the two major critiques of RBV. Based on our analysis another critique would be studies’ inability to capture the whole picture, as most of the papers are focused only on one dimension of firms’ success. However, this success factor is in interaction with others and if not reported we have only partial explanation. For instance, a successful company has good corporate governance and good relation between management and owners. This good relation is part of the social capital that impacts firm’s knowledge generation. If we measure knowledge generation we will probably have positive relation with performance. However, we will not be able to identify the cause – and that is good relation between owners and managers. Here criticism goes towards the methodology used in most of the studies. In the majority of cases quantitative data using a large sample of different companies were used. Not many papers have focused on case studies. This could be a new potential area of research – focusing on a single company but going into the details and understanding the interactions between firm’s competitive advantages. This would lead to more diagnostics and finding the “causes” of firms’ success.
1.4 RESOURCES AND CAPABILITIES IN THE HOTEL INDUSTRY: EMPIRICAL EVIDENCE FROM PAST STUDIES
Having grasped the evolution and development of the resource-based view as an important theoretical framework in management literature, we further analysed its empirical testing in the hospitality industry. Tourism and hospitality as new disciplines often draw theoretical concepts and models from management literature (Assaf and Knežević Cvelbar, 2011). The definition of the drivers of hotel performance was one of the most researched topics in the last few decades in the field of hospitality. Empirical studies were streaming from different international contexts including the USA, Spain, Portugal, Hong Kong, Taiwan, Thailand, Italy, Australia, Slovenia, China, Korea, the UK, etc. Those empirical studies were conducted in different environments and used different conceptual approaches to shed light on potential competitive advantages leading to above-normal returns in the hotel industry. However, to date none of the studies managed to provide an overview

16
of the existing findings. The only review paper in this area was Assaf's paper (under review) focusing on the analysis of the methods used to estimate hotel performance. However, this paper did not deal with drivers of performance, which is the main objective of the present paper: to better understand the main drivers of performance in the hotel industry and provide a holistic overview of existing concepts that were empirically tested in the context of hotels. In order to investigate the divers of performance in the context of hotels, the first step was to list the papers in the field of hospitality that attempted to connect hotels' competitive advantages with their performance. A total of 40 papers published in international journals from 1996 to 2015 were listed. Those papers are coming from the following hospitality and tourism journals: International Journal of Hospitality Management, International Journal of Contemporary Hospitality Management, Tourism Management, The Cornell Hotel and Restaurant Administration Quarterly, Journal of Travel Research, and International Journal of Tourism Research. Again objective and subjective measures were used in order to cut off the number of papers of interest to us. An objective criterion was a number of paper citations – reflecting paper impact on the field. Papers’ citations rates were from 300 citations to 40 citations. A subjective criterion was also applied based on the extensive knowledge in the area –it was used for balancing and inclusion of the most recent studies that have citation numbers at the bottom end. Our literature search was based on the following key words: resources, capabilities, performance and hospitality or hotel industry. However, a large body of papers was not included in this analysis due to the scope. This is a major limitation of our study. Using content analyses we defined the main categories and classified the papers accordingly. As the main categories we first defined dependent and independent variables that those papers relied upon. Dependent variable(s) is (are) a performance measurement proxy used to estimate firms' performance. Independent variables are proxies of firm's resources and capabilities translated into sustainable competitive advantages. We first defined independent concepts used in the paper and classified them in three categories: tangible resources, intangible resources, and capabilities. For each paper we also provided its key findings. The results of our content analysis are shown in Table 2. Table 2: Resources and capabilities in the hospitality industry and their link to performance
AUTHORS AND YEAR
INDEPENDENT VARIABLE
TR IR C PERFORMANCE MEASURE KEY FINDINGS
Harrington and Akehurst (1996)
Quality policy
x
Financial (ROE, ROA) and competitive (sales growth, market share growth)
Quality policy does not lead to above-normal performance.
Hoque (1999) HRM x
Financial (ROE, ROA) HRM (human resource management) practices and focus on quality together lead to positive and high performance.
Grey, Matear and Matheson (2000)
Market orientation
x
Business and marketing performance, domestic sales growth, % of sales from new products, etc.
Market orientation positively impacts performance and domestic sales growth.

17
AUTHORS AND YEAR
INDEPENDENT VARIABLE
TR IR C PERFORMANCE MEASURE KEY FINDINGS
Kandampully and Suhartanto (2000)
Image, room satisfaction, housekeeping, reception, FandB, price
x x
Customer loyalty Image, customer satisfaction, housekeeping, room, reception, FandB are positively correlated to customer loyalty.
Chu and Choi (2000)
Service quality, business facilities, price/value, room and front desk, food and recreation, security
x x
Perceived performance scores of business travellers' experience with hotel's services and facilities
Value per price, service quality and location have the most important impact on performance.
Prasad and Dev (2000)
Brand equity x
Occupancy rates, REVPAR
Brand equity has a positive impact on performance.
Kay and Russette (2000)
Management competencies (skills)
x
Firm's success Leadership, interpersonal, conceptual-creative, administrative and technical competencies are rated according to their positive impact on performance.
Chung-Herrera, Enz and Lankau (2003)
Skills of hospitality leaders
x
Firm's success Self-management, strategic positioning, implementation, critical thinking, communication, interpersonal skills and industry knowledge are the most important factors that positively impact a firm's success.
Brady and Conlin (2004)
Ownership model x
Revenue, REVPAR, occupancy and price growth
Ownership as governance model is not outperforming other governance models and is not leading to above normal returns.
Kim and Kim (2005)
Brand equity x
REVPAR Strong brand equity significantly and positively impacts REVPAR.
Cho, Woods and Jang (2006)
HRM practices
x x
Annual average turnover rates, labour productivity, ROA
HRM practices positively impact non-managerial employees. Employee skills and organisational structure are positively correlated with performance.
Claver, Jose and Pereira (2006)
Certified quality systems x
Perceived performance: quality, sales, competitive position
Quality systems have positive effects on performance, the impact on financial performance is low.
Wilkins, Merrilees and Herington (2007)
Service quality
x x
Perceived hotel performance
Physical product, service experience and quality of food and beverages matter the most to the perceived performance of the customer.
Rudež and Mihalič (2007)
Intellectual capital x
Revenue, sales growth, ROA, ROA growth, profit, profit growth, etc.
Intellectual capital positively and significantly impacts hotel performance.
Budhwar, Chand and Katou (2007)
HRM practices, hotel characteristics (category, type)
x
Sales growth, productivity, profitability, perceived goal achievement
HRM practices, hotel type and category positively impact hotel performance.
Claver-Cortes, Molina-Azorin and Pereira-Molier (2007)
Size, type of hotel management, category x x
Average room occupancy rate, GOP, GOPAR per day, etc.
Variables impact performance in various ways. Larger hotels and hotels that belong to a chain and build their competitive advantage on constant improvement are the most successful in terms of performance.
Claver-Cortes, Pereira-Moliner, Tari and Molina-Azorin (2008)
Total quality management (TQM) x
Occupancy rate per room, GOP, GOPAR, subjective quality satisfaction
TQM practices positively impact hotel performance.

18
AUTHORS AND YEAR
INDEPENDENT VARIABLE
TR IR C PERFORMANCE MEASURE KEY FINDINGS
Barros and Dieke (2008)
Group membership, market share, international strategy
x x
Hotel efficiency (multiple input and output variables)
Membership in a group, market share and international strategy increase hotel efficiency.
Molina-Azorin, Claver-Cortes, Pereira-Moliner and Tari (2009)
Environmental commitment
x
Occupancy rate per room, GOP, GOPAR per day, market share gain, average sales growth
Hotels with a stronger commitment to environmental practices reached higher performance levels.
Chi and Gursoy (2009)
Customer satisfaction, employee satisfaction
x x
Financial performance relative to three main competitors
Customer satisfaction has a significantly positive impact on financial performance; employee satisfaction is mediated by customer satisfaction.
Hu, Horng and Sun (2009)
Knowledge sharing, team culture
x Service innovation The relationships among knowledge sharing,
team culture and innovation performance are significant and positive.
Kang, Lee and Huh (2010)
Corporate social responsibility (CRS)
x ROA, ROE, price-earnings ratio
CRS activities have a positive effect on a firm's value but none (neither positive nor negative) on profitability.
Tari, Claver-Cortes, Pereira-Moliner and Molina-Azorin (2010)
Quality management, environmental management
x
Room occupancy, market share gain, average sales growth, GOP, GOPAR per day
Quality management and environmentally proactive hotels reach higher performance levels.
Assaf and Knežević-Cvelbar (2010)
Privatisation, market competition, management tenure, international attractiveness
x
Hotel efficiency (multiple input and output measures)
International attractiveness and privatisation are positively related, longer management tenure is negatively related to hotel efficiency and there is no significant link between market competition and hotel efficiency.
Assaf, Josiassen and Knezevic Cveblar (2011)
Financial reporting, environmental reporting, social reporting
x x
Hotel efficiency (multiple input and output measures)
More extensive reporting on environmental, social and financial issues leads to better hotel performance.
Sirirak, Islam and Khang (2011)
Information and communication technology (ICT)
x Hotel efficiency (multiple input and output measures)
ICT adoption is positively correlated to hotel performance.
Assaf, Barros and Dieke (2011)
Firm size, group ownership, mergers and acquisitions
x x
Efficiency of tour operators
Firms' size, group ownership and mergers and acquisitions all positively impact tour operator's efficiency.
Molina-Azorin, Tari, Claver-Cortes and Lopez-Gamera (2012)
Quality management + environmental management
x
Financial performance, market success, stakeholder satisfaction
Quality management together with environmental management positively affect several dimensions of firm's performance.
Garay and Font (2012)
CRS practices x
Financial health, situation and managers satisfaction with financial performance
Sustainability measures have a positive impact on financial performance and vice versa.
Assaf and Magnini (2012)
Customer satisfaction x x
Hotel efficiency (multiple input and output measures)
Customer satisfaction has a significant influence on efficiency.

19
AUTHORS AND YEAR
INDEPENDENT VARIABLE
TR IR C PERFORMANCE MEASURE KEY FINDINGS
Assaf, Barros and Josiassen (2012)
Size, type of ownership, classification
x x
Hotel efficiency (multiple input and output measures)
Chain hotels perform better than independent hotels, large hotels perform better than small ones. Quality standards (classification) positively impact performance.
Xiao, O’Neill and Mattila (2012)
Owners corporate strategies (location, type, brand affiliation, operator/management)
x x
REVPAR, net income, hotel age, size, room price level, NOIPAR
Owner's strategies regarding segment, brand affiliation, operation and location are vital to a hotel's financial performance.
Kim, Kim, Park and Lee (2012)
Intellectual capital
x
GOP percentage, REVPAR, sales growth, profit growth
Organisational and customer capital positively impact business performance. Human capital impacts business performance indirectly and significantly via organisational and customer capital.
Wang, Chen and Chen (2012)
TQM and market orientation
x x Financial and customer hotel performance
TQM and market orientation positively impact hotel performance.
Taegoo, Gyehee, Soyon and Seunggil (2013)
Social capital (structural, relational, cognitive)
x
Hotel operational performance relative to competitors
Active knowledge sharing among employees is directly linked to hotel business performance.
Lenidou, Lenidou, Fotiadis and Zeriti (2013)
Physical, financial resources and operational knowledge
x x
Financial performance Resources impact firms' environmental strategy, which enhances competitive advantage and financial performance.
Josiassen, Assaf and Knežević-Cvelbar (2014)
Customer relationship management (CRM) (information generation, dissemination, responsive-ness)
x x
Hotel efficiency (multiple input and output measures)
CRM capabilities positively affect firms' performance, while tangible investments in CRM do not.
Dai, Mao, Zhao and Mattila (2015)
Social capital
x
Perceived financial (GOP, ADR) and competitive market share, revenue growth
External and internal social capital have complementary and positive effects on financial performance.
Molina-Azorin, Tari, Pereira-Moliner, Gamero and Ortega (2015)
Quality management, environmental management
x
Competitive advantage Quality management and environmental management improve competitive advantage in terms of cost and differentiation.
Kim, Vogt and Knutson (2015)
Customer satisfaction, delight
x x Customer loyalty Customer satisfaction is more strongly related
to loyalty than delight and has a more important impact on performance.
TR – Tangible Resources, IR – Intangible Resources, C – Capabilities Source: Authors Results of the content analysis presented in Table 2 show that most of the papers, i.e. 26 out of 40, tested the relation between intangible assets (single or in combination with another category) and hotel performance. The relation between capabilities (single or in combination) and hotel performance was tested in 20 papers, while only 10 papers (single or in combination) investigated the relation between tangible assets and hotel performance.

20
Interestingly, most of the papers focused on testing a single category: tangible resources, intangible resources or capabilities and its impact on hotel performance. Of the papers testing the impact of one single category on hotel performance, 14 explored the impact of intangible assets, while 12 were testing the impact of the capabilities on hotel performance. None of the papers tested the impact of tangible resources on hotel performance. Out of 40 analysed papers, 14 were dealing with the impact of two categories on hotel performance. A total of 7 papers investigated the impact of tangible resources in combination with intangible resources or capabilities on hotel performance, while 7 papers combined intangible resources and capabilities. None of the papers tested the impact of all three categories, i.e. tangible, intangible resources and capabilities, on hotel performance. Having reviewed the papers and their content chronologically, we can conclude that research in its early phase from 1997 to 2000 mainly investigated the impact of intangibles and capabilities on hotel performance. More specifically, this body of research looked into the impact of HRM practices including managerial skills, the quality of hotel services, brand equity and hotel image, price level, market orientation and hotel appearance and services (room, front desk, restaurants, business facilities and fitness appearance, housekeeping and reception service) on hotel performance. From 2001 to 2010, however, research expanded, but the focus was still on intangible resources and capabilities. The main independent variables were: service quality and total quality management system, HRM practices and brand equity. Additionally, knowledge-based independent variables of interest were: skills of hospitality leaders, management tenure, knowledge sharing within the firm, team culture, intellectual property rights, ownership model and ownership structure. Research also scrutinised customer and employee satisfaction. Studies founded on the nature-based view also tested the impact of hotels' environmental commitments and environmental management on their performance. Very few papers explored the relation between performance and dynamic capabilities including hotel's international attractiveness and international strategy as well as its relative position in comparison to competitors. Many studies also added hotel's characteristics (category, type, size, independent vs. part of the chain, etc.) as control variables. The latest empirical evidence from 2010 and up to today is limited, due to our selection criteria based on citations. Studies focusing on the relation between hotel performance and quality and environmental management including CRS practices and tourist satisfaction remain predominant. The number of studies investigating firms' internal relations, such are ownership types, classifications and owners' corporate strategies, has also been rising. Among the new concepts are: intellectual capital (human, organisational, customer), social capital (relations with hotel stakeholders), customer relationship management (information generation, dissemination and responsiveness) and information and communication technology (ICT). They are all related to hotel performance.
21
Most of the studied found a positive correlation between tangible resources, intangible resources, capabilities and firms' performance. Only a few variables, including marker competition and quality management in hotels, were negatively correlated with hotel performance. In terms of methodology, most of the observed studies were using both primary and secondary data. Secondary data were used to measure the performance and were usually derived from hotel balance sheets. Primary data were used to evaluate sustainable competitive advantages in hotels. Some of the studies used qualitative methods to pre-test the concepts. In all studies quantitative data collection took place. To estimate sustainable competitive advantages in hotels, studies mostly used five-point or seven-point Likert scale. The majority of papers in our research performed exploratory factor analysis to search and define the relevant constructs from a set of variables under study. To understand the final impact on the hotel performance, the relationships between variables had to be measured. Because most of the studies analysed the relationship between one dependent and one or a few independent variables, traditionally regression analysis was used in majority of studies. Early studies were using a single financial measure of performance, including return on assets, return of equity, gross operating profit, occupancy rate, revenue per available room, etc. Some of the studies also used perceived measures of performance by asking hotel managers to evaluate their performance with the Likert scale. Recent literature on hotel performance measurement has been using multiple inputs and outputs in order to measure hotel efficiency. This approach to measuring performance is more comprehensive because it measures the efficiency of a particular firm by assessing its distance using frontier or best practices (frontier represents fully efficient firms). Those studies usually employ data envelopment analysis (DEA) or stochastic frontiers (SF) as methods. The main advantage of these methods over traditional productivity measures is that they allow for the inclusion of multiple inputs and outputs in the estimation of productivity and thus provide a more comprehensive evaluation of the performance of hotels (Assaf and Agbola, 2011). Data envelopment analysis (DEA) has substantially improved the accuracy in productivity measurements in the hotel industry during the last fifteen years. Its main advantage is that it requires no assumption on the functional form of the model underpinning the relationship between the input and output variables (Hwang and Chang, 2003). The main advantage of the second method for measuring hotel efficiency (SF) is a possibility to isolate the influence of factors other than inefficiency, and thus offering the possibility of even more precise results. Structural equation modelling (SEM) was scarcely used in the hotel performance studies. It is a method highly appropriate when modelling and investigating the relationships between many variables that are interrelated. The method is capable of estimating a series of inter-relationships among latent constructs simultaneously in a model while dealing with measurement errors in the model (Awang, 2011). Conceptual models have to be created in this case with the causal relationships between variables.

22
1.5 DISCUSSION AND CONCLUSION
Investigating drivers of hotel performance is not a fad. It is a developing research field that brings together interests of many authors around the globe trying to contribute to overall knowledge of what is driving firms' growth in fast-changing global markets. The purpose of this paper was to synthesise and reflect on the current body of knowledge researching the drivers of performance in the hospitality industry. Most of the studies in this area in the last 20 years were using the resources-based view as a theoretical framework. According to Barney (1990), those empirical studies in the context of hotels were trying to determine which resources and capabilities can be translated into sustainable competitive advantages of firms and ultimately drive the performance of hotels. This paper is conceptual and based on a two-step content analysis. In the first step the content analysis aimed at understanding the development and evolution of RBV. We analysed 40 of the most cited papers dedicated to the development of RBV. Results of our analysis showed that besides developing a mainstream of RBV research dedicated to improving the general understanding of resources and capabilities and their classification, research in this area went into three different directions: the knowledge-based view that perceives knowledge as the main source of firms' sustainable competitive advantage, the nature-based view that perceives nature and natural values as the main sources of firms' competitive advantage, and the dynamic-based view pointing out firms' ability to adjust to changes from the environment as a major source of competitive advantage. Critical assessment of those studies indicates that theoretical discussion led towards the definition of concepts, although they were fuzzy and hard to measure in practice. Another important criticism of RBV is its static nature and inability to capture the changes coming from the environment. In empirical testing studies used a large sample of firms and focused on a single competitive advantage. This prevented them to understand the interactions between different sources of competitive advantages. Therefore case studies focusing on single company and providing detailed diagnostics of causes of success would be welcomed in the future. In the second step of the content analysis we investigated 40 of the most cited papers in the area of hospitality and analysed the drivers of hotel performance. The main purpose of our analysis was to identify the concepts used within the hospitality research and provide guidelines for the future studies. We took a closer look at independent and dependent variables that were used in empirical testing. In most of the cases dependent variables were measured using the secondary financial data. Independent variables used in those studies were divided into three broader categories as suggested in management literature: tangible resources, intangible resources and capabilities. Similar as in management literature, hospitality research took a relatively narrow approach analysing a single sustainable competitive advantage. Most of the studies tested intangible assets and capabilities impact on firm performance. Tangible resources were usually ignored in the hospitality studies. As for intangible resources, studies tested the impact of: organisational, relational, reputational, ICT and social capital as well as environmental policies and commitment to performance. Among the

23
capabilities, hospitality research investigated: know-how of employees and managers, market orientation and firms' internal relations. Generally, the studies found a positive correlation between intangibles and capabilities and hotel performance. If we compare hospitality research with general management literature, hospitality literature fails to test the impact of managerial effectiveness and managerial productivity on hotels’ performance. Entrepreneurial orientation, organizational culture, perceived organizational reputation, relations between employees and specific knowledge about markets and technology were also covered in other studies outside hospitality. Analyses of those concepts and their impact on performance represent potential for future studies in the hospitality industry. This research enabled us to raise several important questions relevant to future research in this area. The first questions the sustainability of current approaches to determining the drivers of hotel performance. The focus on one indicator or a few indicators under the same umbrella or category raises the question of validity. As indicated in the previous conceptual studies, the relation between resources and capabilities needs to be considered in order to examine the relation between competitive advantages and performance (Foss, 2011). This calls for more holistic approaches in future research, taking into account the wide range of firms' resources and capabilities and possibly investigating inter-relations between them. Therefore future research should focus on developing more holistic measurement instruments. We believe that in the future we should sacrifice benefits of a narrow and detailed approach on behalf of a more holistic and wider approach that will enable us to measure tangible, intangible assets and capabilities and their impact on performance simultaneously. Secondly, results showed that authors rarely use tangible resources as proxies for hotel performance. This is surprising since investments in tangible resources in the hospitality industry are high. We highly believe that future studies should include tangible assets and their interactions with intangible assets and capabilities in order to get a better understanding of hotels performance. Thirdly, studies in the hospitality industry continue to explore intangible resources. Dynamic capabilities were only considered in a few cases. Since management literature has grown significantly in this area, it would be useful to acquire more empirical evidence from the hospitality sector. Tourism industry is highly dynamic and the ability to adapt to changes is the key to success (Dwyer, Knezevic Cvelbar, Edwards, Mihalič, 2012). To this end, understanding how hotel companies can quickly adopt to changes from the environment is extremely important. Hospitality research so far was not focusing on dynamic capabilities. Conceptual and empirical research in this area would be welcomed in the future. Finally, our research points to the need for more research on emerging and fast-growing destinations. Divers of hotel performance in those destinations could be significantly different compared to developed destinations. A recent study in the destination context suggested that drivers of destination performance in developed and developing destinations are very different (Knezevic

24
Cvelbar, Dwyer, Koman, Mihalič, 2015). Providing a comparison and elaborating on different drivers of hotel performance in different countries or destinations, would have an important theoretical and practical contribution for the future hospitality research. The present study is limited in a number of ways. First of all, it was based only on most cited papers in management and hospitality research literature dealing with RBV. Many recent studies are possibly not included in our analysis, due to low citation rate. Also, papers with lower citation rates were omitted. The decision to focus on most cited papers was made due to the extensive and fragmented literature in this field. To conclude, this paper contributes to a better understating of the resources and capabilities driving the performance in the hotel industry. It also provides meaningful insights for subsequent studies in this area.

25
2 WHAT DEFINES THE PERFORMANCE IN HOTEL INDUSTRY IN SLOVENIA AND CROATIA? MANAGERS’ PERSPECTIVE USING DELPHI
METHOD
2.1 OVERVIEW
The aim of this chapter is to understand the most important drivers of hotel performance based on existing empirical studies from the hospitality literature and experts opinions from two countries (Slovenia and Croatia). The introduction into the study starts with presenting more than 60 papers from hospitality literature that is focusing on hotel performance. Based on the in-depth literature review, Delphi study gathers opinions of 10 hospitality experts from Slovenia and Croatia about the most important drivers of hotel performance. The study also offers additional drivers that according to expert’s opinions represent crucial factors of hotel performance and aren’t sufficiently covered in academia so far. According to the literature and the opinions of experts, market orientation, customer satisfaction, service quality and business processes represent the most important drivers of hotel performance that require additional and further research attention.
2.2 INTRODUCTION
The hospitality industry has for decades been striving to understand the major drivers of hotel performance. So far literature offered many fragmented studies examining specific resources or capabilities that drive hotel performance. Theoretical background behind this body of literature is the Resource Based Theory (RBT) proposed by Barney in 1990. This theory postulates the basis for defining sustainable competitive advantages of any firm. Resources become a competitive advantage if they are valuable, rare, inimitable and non-substitutable (Barney, 1991). Further development of RBT made a distinction between firms' resources. Collis (1994) classified recourses as tangible and intangible. Tangible resources are physical and financial assets of the firm and represent the value of the financial capital. Intangible resources are non-physical and they are rarely part of firms financial statements. Amit and Schoemaker (1993) recognized that capabilities are also a source of a firm's competitive advantage and defined them as routines based on skills and knowledge that can drive the firm's success. Overall, general management literature on RBT focused on defining and clarifying tangible and intangible resources and capabilities that drive firms' performance. Theoretical papers in management literature worked on clarifying the general theoretical concepts that highlighted the nature of firms' resources and capabilities. As for empirical papers, they were operationalizing and testing those concepts in practice. The major challenges in empirical studies were: 1) measurement issues (how can abstract concepts be measured?); 2) the scope of concepts that can be included in one study (the concepts are broad and a single study could not focus on all of them); and 3) weak boundaries between different concepts (how can we distinguish between intangible assets and

26
capabilities and where is the line between them in practice?). Those challenges caused a gap between theoretical and empirical papers since the concepts defined in the theory were hard to test and measure empirically. In hospitality industry there are no theoretical papers dealing with drivers of hotel performance. Most of the literature is based on empirical studies using general management RBT literature and empirical research in line with generally accepted management concepts of assets and capabilities. In general, intangible assets and their relation to performance attracted the most attention in experts in the field. Those papers tested the impact of HRM practices, brand equity, information communication technologies (ICT), social capital, environmental policies, employees and managers' know-how, and their impact on hotel performance (Božič and Knežević Cvelbar, 2016). Most of the studies in hospitality literature were focusing on one single or a few drivers of hotel performance, which were chosen based on the subject of the researcher's interest or general theoretical approval of the concept's relevance. The majority of those studies showed that there is a positive correlation between the driver(s) and hotel performance. Yet they failed to determine which drivers are the most important and relevant. This is an ultimate question for practitioners and hotel manages. Knowing what is positively impacting hotel performance is good, but knowing the major drivers of hotel performance is crucial. This paper is focusing on identifying the major drivers of hotel performance. It first presents an in-depth overview of the hospitality literature in order to indicate which drivers have been researched so far. Based on literature review, we identified the list of 30 drivers of performance that were used in academic research so far. A total of three rounds of testing were performed using the Delphi methodology. In each round experts were asked to evaluate certain drivers of hotel performance that had been recognized in hospitality literature in the basis of their perception of their impact on hotel performance. The list was consequently reduced in line with the previous round of results. The participants were also invited to suggest additional drivers of hotel performance. The research concluded after the third round since it yielded no new information. The final results provided a list of nine major drivers of hotel performance. Furthermore, the major drivers of performance were investigated in the literature and compared with the results of the Delphi study. The results are presented and discussed in this paper.
2.3 OVERVIEW OF PREVIOUS STUDIES AND RECOGNITION OF EXISTING DRIVERS OF PERFORMANCE
Studies in the hospitality industry were following general trends in management literature, which means they revolved around testing the impact of tangible and intangible assets and capabilities on hotel performance. An extensive search for relevant literature for the purpose of this paper found 60 papers published in the last twenty years – testing the drivers of performance in the hospitality industry. The majority of those papers were published in the International Journal of Hospitality

27
Management that was and is still supporting research on hotel performance. Those papers helped identify 30 major drives of hotel performance that managed to attract the attention of academics. The papers are listed and presented in Table 3. In line with the selected literature, firms' sustainable competitive advantages were classified as tangible assets, intangible assets, and capabilities. As defined above tangible assets denote a firm's capital translated into its assets (land, buildings, equipment etc.) and financial funds (cash and other financial assets). Interestingly, hospitality studies were not particularly interested in studying the impact of tangible assets on firms' performance. The reason for this could be the fact that tangible assets are necessary and obvious drivers of hotel success. Studies in this area were unified in finding that tangible assets, including hotel facilities, location and financial assets, are positively related to hotel performance. The line between intangible assets and capabilities is rather thin. There is no general consensus in literature as to which competitive advantages are intangible assets and which are, in fact, capabilities. Therefore classifying a specific sustainable competitive advantage as an intangible asset or a capability is arbitrary. This paper follows the simple logic proposed by Hall (1992), which says: "intangible assets are something that a firm has, while capabilities are something that a firm does" (pg. 136). In line with Hall (1992), the definition and the existing empirical studies in hospitality industry means that intangible assets can be grouped into four general categories as a firm's organizational, human, marketing and environmental assets.
• Organizational assets are understood as the firm's culture, organizational structure, management philosophy, available informational technology, service quality, social capital, and the corporate social responsibility policy. Overall organizational assets are the most researched drivers of success in the hospitality industry. Studies are generally conclusive – organizational assets can be translated into firms' sustain competitive advantages leading to their success.
• Another frequently researched area relates to human assets including management and employee competences, HRM practices, employees’ attitudes, and employee satisfaction, innovativeness and loyalty. As expected, human assets positively correlate with hotel performance. Research in hospitality is very focused on employees, but it neglects management-related sustainable competitive advantages as performance drivers. This is a research field worth of exploring in the future.
• Marketing capital includes brand equity, customer satisfaction, customer loyalty and direct distribution channels. As in the case of organizational and human capital, marketing capital is also positively related to firms' performance. Relevant literature has put the most effort on exploring customer satisfaction and its relation to performance. Distribution channels as part of the marketing capital are relatively underexplored, which is surprising due to the digital transformation of the industry that has been happening in the last decade. In addition, the value of contractual relations with business customers as a part of the sales policy has so far not been explored in hospitality studies.

28
• Environmental capital is still not considered as a very important research area in the hospitality industry. Although sustainable development is one of the research mainstreams in tourism, the relation between environmental capital and hotel performance failed to attract significant academic interest. Very few studies connected basic and advanced environmental policies with hotel performance, but they generally found a positive relation between the two. More research in this area is expected to emerge in the future.
Capabilities are prominent sources of firms' success and, according to RBT, they should represent the leading source of sustainable competitive advantages. The major obstacle in the research is operationalization and measurement of firms' capabilities. Hospitality research in general neglected such capabilities as important sustainable competitive advantages of firms. Research in this area is still scarce. In general, capabilities can be divided into operational and dynamic. Operational capabilities are firms' routines and processes that enable them to perform activities in the long-term and ongoing basis, while dynamic capabilities relate to firms' ability to adapt to changes coming from the environment. Research in operational capabilities in the hospitality industry includes firms' relations with partners and business processes, while research in dynamic capabilities includes marketing orientation, knowledge sharing and entrepreneurship orientation. Summary of the literature review on drivers of hotel performance is presented in table 3. Table 3: Drivers of performance in hospitality literature
DRIVERS OF PERFORMANCE
SHORT DESCRIPTION AUTHORS AND YEAR RELATION WITH PERFORMANCE
Drivers based on tangible assets
Hotel facilities Buildings, equipment Chu & Choi, 2000 Lenidou, Leonidou, Fotiadis & Zeriti, 2013 Kim, Cho & Brymer, 2013 Lado-Sestayo, Otero-González, Vivel-Búa & Martorell-Cunill, 2016
(+) (+) (+) (+)
Location Physical location – land Lado-Sestayo et. al., 2016 (+)
Financial assets Cash and other financial funds Lenidou et. al., 2013 (+)
Drivers based on intangible assets
Brand equity Brand loyalty, awareness, perceived quality, brand image
Prasad & Dev, 2000 Kim & Kim, 2005 Rudež & Mihalič, 2007 O’Neill & Carlbäck, 2011
(+) (+) (+) (/)
Employee loyalty Employee’s sense of belonging and commitment
Kim & Brymer, 2011 Al-Rafaie, 2015
(+) (+)
Employee satisfaction
Working conditions, teamwork and cooperation, relationship with supervisors, recognition and awards
Chi & Gursoy, 2009 Naseem, Sheikh & Malik, 2011 Al-Rafaie, 2015
(/) (+) (+)
Employee competencies
Qualifications, experience, knowledge development, knowledge sharing between employees
Rudež & Mihalič, 2007 Kim, Kim, Park, Lee & Jee, 2012 Nieves, Quintana & Osorio, 2014
(+) (+) (+)
Employees' attitudes towards work
Overall satisfaction, pride, consistency and devotion
Sharpley & Forster, 2003 Rudež & Mihalič, 2007
(+) (+)
Employee innovativeness
Creativity, innovative ideas of employees
Rudež & Mihalič, 2007 Nieves, Quintana & Osorio, 2014
(+) (+)
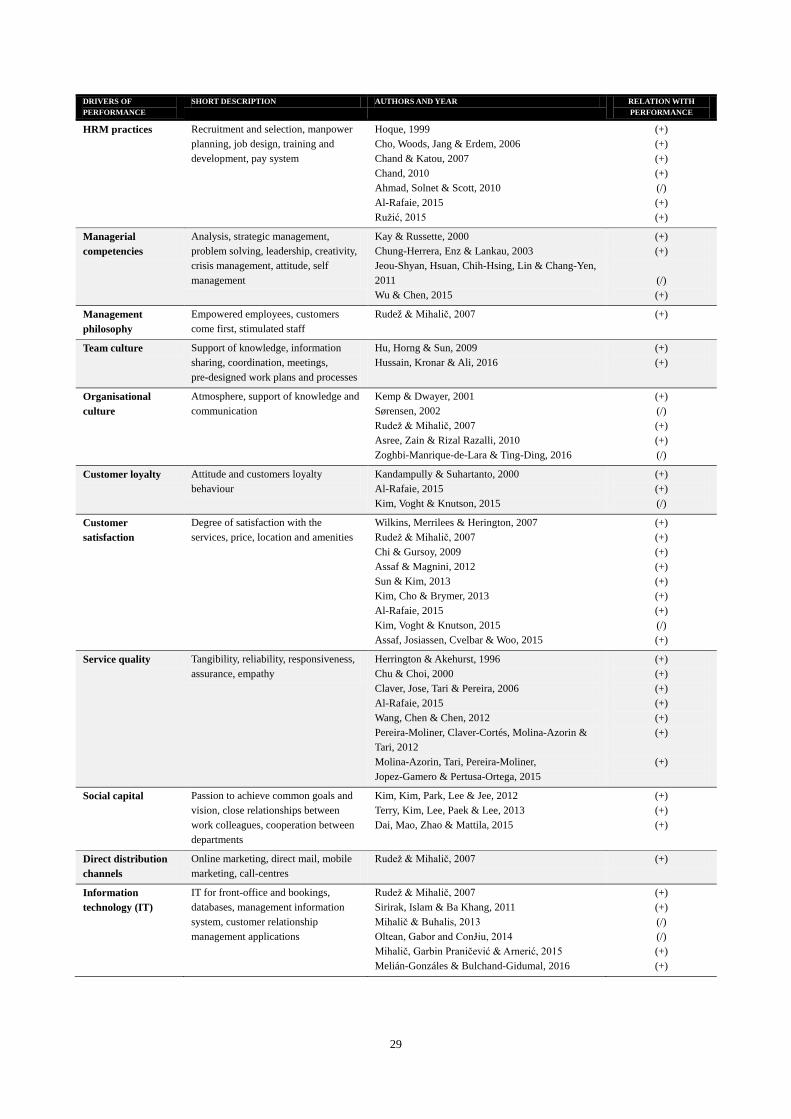
29
DRIVERS OF PERFORMANCE
SHORT DESCRIPTION AUTHORS AND YEAR RELATION WITH PERFORMANCE
HRM practices Recruitment and selection, manpower planning, job design, training and development, pay system
Hoque, 1999 Cho, Woods, Jang & Erdem, 2006 Chand & Katou, 2007 Chand, 2010 Ahmad, Solnet & Scott, 2010 Al-Rafaie, 2015 Ružić, 2015
(+) (+) (+) (+) (/) (+) (+)
Managerial competencies
Analysis, strategic management, problem solving, leadership, creativity, crisis management, attitude, self management
Kay & Russette, 2000 Chung-Herrera, Enz & Lankau, 2003 Jeou-Shyan, Hsuan, Chih-Hsing, Lin & Chang-Yen, 2011 Wu & Chen, 2015
(+) (+)
(/) (+)
Management philosophy
Empowered employees, customers come first, stimulated staff
Rudež & Mihalič, 2007 (+)
Team culture Support of knowledge, information sharing, coordination, meetings, pre-designed work plans and processes
Hu, Horng & Sun, 2009 Hussain, Kronar & Ali, 2016
(+) (+)
Organisational culture
Atmosphere, support of knowledge and communication
Kemp & Dwayer, 2001 Sørensen, 2002 Rudež & Mihalič, 2007 Asree, Zain & Rizal Razalli, 2010 Zoghbi-Manrique-de-Lara & Ting-Ding, 2016
(+) (/) (+) (+) (/)
Customer loyalty Attitude and customers loyalty behaviour
Kandampully & Suhartanto, 2000 Al-Rafaie, 2015 Kim, Voght & Knutson, 2015
(+) (+) (/)
Customer satisfaction
Degree of satisfaction with the services, price, location and amenities
Wilkins, Merrilees & Herington, 2007 Rudež & Mihalič, 2007 Chi & Gursoy, 2009 Assaf & Magnini, 2012 Sun & Kim, 2013 Kim, Cho & Brymer, 2013 Al-Rafaie, 2015 Kim, Voght & Knutson, 2015 Assaf, Josiassen, Cvelbar & Woo, 2015
(+) (+) (+) (+) (+) (+) (+) (/) (+)
Service quality Tangibility, reliability, responsiveness, assurance, empathy
Herrington & Akehurst, 1996 Chu & Choi, 2000 Claver, Jose, Tari & Pereira, 2006 Al-Rafaie, 2015 Wang, Chen & Chen, 2012 Pereira-Moliner, Claver-Cortés, Molina-Azorin & Tari, 2012 Molina-Azorin, Tari, Pereira-Moliner, Jopez-Gamero & Pertusa-Ortega, 2015
(+) (+) (+) (+) (+) (+)
(+)
Social capital Passion to achieve common goals and vision, close relationships between work colleagues, cooperation between departments
Kim, Kim, Park, Lee & Jee, 2012 Terry, Kim, Lee, Paek & Lee, 2013 Dai, Mao, Zhao & Mattila, 2015
(+) (+) (+)
Direct distribution channels
Online marketing, direct mail, mobile marketing, call-centres
Rudež & Mihalič, 2007 (+)
Information technology (IT)
IT for front-office and bookings, databases, management information system, customer relationship management applications
Rudež & Mihalič, 2007 Sirirak, Islam & Ba Khang, 2011 Mihalič & Buhalis, 2013 Oltean, Gabor and ConɈiu, 2014 Mihalič, Garbin Praničević & Arnerić, 2015 Melián-Gonzáles & Bulchand-Gidumal, 2016
(+) (+) (/) (/) (+) (+)

30
DRIVERS OF PERFORMANCE
SHORT DESCRIPTION AUTHORS AND YEAR RELATION WITH PERFORMANCE
Organisational structure
Type of structure: mechanistic, organic Jogaratnam & Ching-Yick Tse, 2006 Øgaard, Marnburg & Larsen, 2008 Tavitiyaman, Qiu Zhang & Qu, 2012
(/) (/) (/)
Corporate governance
Ownership structure, board, CEO or general manager's characteristics
Knežević Cvelbar & Mihalič, 2007 Assaf & Cvelbar, 2011 Xiao, O’Neill & Mattila, 2012 Jarboui, Guetat & Boujelbéne, 2015
(+) (+) (+) (+)
Basic environmental practices
Ecological product usage, reduction in the use of dangerous products, energy and water saving practices, selective waste collection
Molina-Azorin, Claver-Cortés, Pereira-Moliner & Tari, 2009 Tari, Claver-Cortés, Pereira-Moliner & Molina-Azorin, 2010 Pereira-Moliner, Claver-Cortés, Molina-Azorin & Tari, 2012
(+)
(+)
(+)
Advanced environmental practices
Employee environmental trainings and initiatives, ecological marketing campaigns and events, long-term environmental policies and goals
Molina-Azorin, Claver-Cortés, Pereira-Moliner & Tari, 2009 Tari, Claver-Cortés, Pereira-Moliner & Molina-Azorin, 2010 Pereira-Moliner, Claver-Cortés, Molina-Azorin & Tari, 2012 Leonidou, Leonidou, Fotiadis & Zeriti, 2013
(+)
(+)
(+)
(+)
Corporate social responsibility (CSR) practices
CRS values, hiring locals, ethnical and overseas employees, environmental savings (recycling, reducing energy costs, reusing towels, linen etc.)
Kang, Lee & Huh, 2010 De Grosbois, 2012 Garay & Font, 2012 Assaf & Josiassen & Cvelbar, 2012 Benavides-Velasco, Quintana-Garcia & Marchante-Lara, 2014 Fu, Ye & Law, 2014
(/) (/) (+) (+) (+)
(+)
Drivers based on capabilities
Relationships with commercial and other partners
Relations with customers, suppliers and other partners
Rudež & Mihalič, 2007 Kim, Kim, Park, Lee & Jee, 2012
(+) (+)
Business processes Hotel standards and procedures, service performance, customer complaint solving procedures, innovative ideas, continuous process improvement
Rudež & Mihalič, 2007 Claver-Cortes, Pereira-Moliner, Tari & Molina-Azorin, 2008 Wang, Chen & Chen, 2012 Benavides-Velasco, Quintana-Garcia & Merchante-Lara, 2014
(+) (+)
(+) (+)
Knowledge sharing Knowledge sharing between teams, willingness to learn and help others
Sristava, Bartol & Locke, 2006 Hu, Horng & Sun, 2009 Terry, Kim, Lee, Paek & Lee, 2013 Hussain, Konar & Ali, 2016
(+) (+) (+) (+)
Market orientation Orientation to customers, competitors, seeking profitable customers and products, responsiveness to market changes
Gray, Matear & Matheson, 2000 Matear, Osborne, Garrett & Gray, 2002 Barros & Dieke, 2008 Assaf & Cvelbar, 2011 Wang, Chen & Chen, 2012 Josiassen & Assaf & Knežević Cvelbar, 2014 Vega-Vázquez, Cossio-Silva & Revilla-Camacho, 2016
(+) (+) (+) (+) (/) (+) (+)
Entrepreneurial orientation
Innovativeness, risk-taking, pro-activeness, autonomy
Jogaratnam & Ching-Yick Tse, 2006 Vega-Vázquez, Cossio-Silva and Revilla-Camacho, 2016 Hernández-Perlines, 2016
(+) (+)
(+)
(+) – positive impact on performance; (/) – positive impact on performance is not confirmed.

31
2.4 METHODOLOGY
So far, literature identified many drivers of hotel success. However, very few of them attempted to determine the relevant competitive advantages in the hospitality industry. This paper is therefore addressing this important question. Qualitative research, i.e. the Delphi survey, was used to that end. The Delphi survey is a group research technique that collects opinions of anonymous experts from a certain area and transforms them through a series of rounds into a common group consensus (McKenna, 1994). Anonymous group experts receive a questionnaire in each round, complete it and send it back to the group facilitator. The facilitator collects all questionnaires, summarizes the answers and sends them back to the members of the group. The members again reconsider their answers based on the summarized group answers from the previous round and complete the questionnaire once again. The rounds finish when there is no further progress in the opinions of experts that would change the group's common result. The main limitation of the Delphi method is the subjective evaluation of the respondents and impact of the panel on respondent opinion (respondent could evaluate a specific item higher or lower in the second or third round based on the results from the previous round of research). Delphi is also narrowly applicable to few specific settings, usually in the case when policy recommendation has to be set. This was our case, where we needed guidance on defining relevant drivers of performance in hospitality industry. This method is also very lengthy and complex to conduct. In our case, the panel included 10 hospitality experts from Slovenia and Croatia. The group of experts was carefully selected to include three hotel managers, three hotel general managers and four representatives of academia, all with profound knowledge and great interest in hotel performance. The panel experts' general characteristics are presented in Table 4 below. Table 4: Respondents' characteristics
RESPONDENT POSITION EXPERIENCE IN THE INDUSTRY
AGE GENDER COUNTRY OF ORIGIN
No. 1 Hospitality & Tourism Professor 25 55 female Slovenia
No. 2 CEO 11 36 male Slovenia
No. 3 Hospitality & Tourism Professor 22 46 female Croatia
No. 4 CEO 12 39 male Slovenia
No. 5 Hospitality & Tourism Professor 19 45 female Slovenia
No. 6 Hotel Manager 27 53 male Slovenia
No. 7 Hotel Manager 15 35 female Slovenia
No. 8 CEO 20 42 male Croatia
No. 9 Hospitality & Tourism Professor 7 35 female Croatia
No. 10 Hotel Manager 12 39 male Croatia
Source: Own research
The questionnaire was devised in-line with relevant literature. It included 30 recognized and significant drivers of hotel performance thus far investigated in hospitality research. The panel members' role was to evaluate the importance of each driver of hotel performance on the scale of 1

32
to 7 (1 = not at all important impact, 7 = extremely important impact on hotel performance). They were also invited to contribute by providing their recommendations and proposing additional drivers of performance that were in their opinion neglected in hospitality research. Three rounds of evaluations were performed. In the third and final round the experts confirmed the results from the second round and did not offer new insights. The research took place from October 2016 to February 2017.
2.5 DELPHI ANALYSIS RESULTS
The analysis of the Delphi results requires a basic statistical analysis including mean averages, frequencies and ranking. The evaluations of the experts from round 1 are summarized in Table 5. The average scores are distributed between 6.3 (the highest average score) and 4.3 (the lowest average score). The drivers that were found to have the strongest impact on hotel performance were: location, market orientation, service quality (average score of 6.3) as well as customer satisfaction and business processes (average score of 6.1). The drivers with the lowest level of importance on hotel performance appeared to be advanced and basic environmental practices, organizational structure and organizational culture (all received an average score of 4.8 or less). The experts suggested that product development, cooperation, investment management and flexibility should also be considered as important drivers of hotel performance. All four additional drivers were included in round 2 of panel evaluation. The results of round 1 of the Delphi study are presented in Table 5. Table 5: Delphi round 1 results
INDICATOR MEAN VALUES
% OF RESPONDENTS THAT RATED THE
IMPORTANCE AS HIGH (SCORES 6 OR 7)
% OF RESPONDENTS THAT RATED THE IMPORTANCE AS MODERATE OR
NEUTRAL (SCORES 5, 4 OR 3)
% OF RESPONDENTS THAT RATED THE
IMPORTANCE AS LOW OR INSIGNIFICANT (SCORES 2, 1 OR 0)
Location 6.3 80% 20% 0%
Market orientation 6.3 80% 20% 0%
Service quality 6.3 80% 20% 0%
Customer satisfaction 6.1 80% 20% 0%
Business processes 6.1 70% 30% 0%
Management philosophy 6.0 70% 30% 0%
Managerial competencies 5.9 70% 30% 0%
Employee competencies 5.9 70% 30% 0%
Hotel facilities 5.7 50% 50% 0%
Information Technology (IT) 5.7 50% 50% 0%
Human resource management practices (HRM) 5.6 60% 40% 0%
Knowledge sharing 5.6 50% 50% 0%
Social capital 5.6 50% 50% 0%
Employee attitudes towards work 5.6 50% 50% 0%
Relationship with commercial parties and other partners
5.5 50% 50% 0%
Team culture 5.5 50% 50% 0%

33
INDICATOR MEAN VALUES
% OF RESPONDENTS THAT RATED THE
IMPORTANCE AS HIGH (SCORES 6 OR 7)
% OF RESPONDENTS THAT RATED THE IMPORTANCE AS MODERATE OR
NEUTRAL (SCORES 5, 4 OR 3)
% OF RESPONDENTS THAT RATED THE
IMPORTANCE AS LOW OR INSIGNIFICANT (SCORES 2, 1 OR 0)
Corporate governance 5.3 70% 30% 0%
Employee satisfaction 5.3 40% 60% 0%
Employee innovativeness 5.2 50% 50% 0%
Entrepreneurial orientation 5.2 40% 60% 0%
Customer loyalty 5.2 40% 60% 0%
Employee loyalty 5.1 30% 70% 0%
Direct distribution channels 5.0 50% 40% 10%
Financial assets 5.0 40% 60% 0%
Brand equity 4.9 30% 70% 0%
Corporate social responsibility practices (CSR) 4.9 20% 80% 0%
Organisational culture 4.8 40% 50% 10%
Basic environmental practices 4.5 30% 70% 0%
Organisational structure 4.5 30% 70% 0%
Advanced environmental practices 4.3 10% 80% 10%
Source: Own research
The results from round 1 presented the inputs for round 2. A total of 16 drivers of performance with the highest average score from round 1 and additional 4 drivers that were suggested from the panel of experts were included in the questionnaire. The results from the round 2 showed that the drivers with higher average scores were almost the same as in round 1. They included: location (6.4), market orientation (6.4) and customer satisfaction (6.3). Moreover, 80% of the panel experts also rated service quality (6.2), business processes (6.0) and employee competencies (6.0) as important or highly important performance drivers. Employee competencies were in round 2 evaluated higher than in round 1; they also outweighed the importance of management philosophy and competencies. Additional proposed drivers in the phase 1 of this research: product development, cooperation and flexibility were all rated with an average score of 6.0 or higher (those are marked bold in tables 6 and 7). Round 2 of Delphi yielded 20 performance drivers presented in Table 6. Table 6: Delphi round 2 results
INDICATOR MEAN VALUES
% OF RESPONDENTS THAT RATED THE
IMPORTANCE AS HIGH (SCORES 6 OR 7)
% OF RESPONDENTS THAT RATED THE IMPORTANCE AS MODERATE OR
NEUTRAL (SCORES 5, 4 OR 3)
% OF RESPONDENTS THAT RATED THE
IMPORTANCE AS LOW OR INSIGNIFICANT (SCORES 2, 1 OR 0)
Location 6.4 90% 10% 0%
Market orientation 6.4 90% 10% 0%
Product development 6.3 90% 10% 0%
Customer satisfaction 6.3 80% 20% 0%
Service quality 6.2 80% 20% 0%
Flexibility 6.1 80% 20% 0%
Business processes 6.0 80% 20% 0%
Employee competencies 6.0 70% 30% 0%

34
INDICATOR MEAN VALUES
% OF RESPONDENTS THAT RATED THE
IMPORTANCE AS HIGH (SCORES 6 OR 7)
% OF RESPONDENTS THAT RATED THE IMPORTANCE AS MODERATE OR
NEUTRAL (SCORES 5, 4 OR 3)
% OF RESPONDENTS THAT RATED THE
IMPORTANCE AS LOW OR INSIGNIFICANT (SCORES 2, 1 OR 0)
Cooperation between tourism providers on and between destinations
6.0 70% 30% 0%
Management philosophy 5.9 80% 20% 0%
Managerial competencies 5.9 70% 30% 0%
HRM practices 5.8 70% 30% 0%
Hotel facilities 5.8 60% 40% 0%
Employee attitudes toward work 5.8 60% 40% 0%
Information technology (IT) 5.7 60% 40% 0%
Investment management 5.6 70% 30% 0%
Knowledge sharing 5.6 60% 40% 0%
Relationship with commercial and other partners 5.5 60% 40% 0%
Social capital 5.5 50% 50% 0%
Team culture 5.4 50% 50% 0%
Source: Own research
The process was repeated in round 3. The questionnaire was sent to the panel of experts for another round of evaluation. They were once again asked to evaluate the importance of each driver of hotel performance. In round 3, only location received higher scores (average score of 6.5) and became the most important driver of hotel performance according to the panel of experts. The evaluation showed that the final list was reduced to feature only nine major drivers of hotel performance. Those drivers consistently received the highest scores from the expert panel. They include: location, market orientation, customer satisfaction, product development, service quality, flexibility, business processes, employee competencies, and cooperation. The results from round 3 of expert evaluation are presented in Table 7. Table 7: Final Delphi results – round 3
INDICATOR MEAN VALUES
% OF RESPONDENTS THAT RATED THE
IMPORTANCE AS HIGH (SCORES 6 OR 7)
% OF RESPONDENTS THAT RATED THE IMPORTANCE AS MODERATE OR
NEUTRAL (SCORES 5, 4 OR 3)
% OF RESPONDENTS THAT RATED THE
IMPORTANCE AS LOW OR INSIGNIFICANT (SCORES 2, 1 OR 0)
Location 6.5 90% 10% 0%
Market orientation 6.4 90% 10% 0%
Customer satisfaction 6.3 80% 20% 0%
Product development 6.3 90% 10% 0%
Service quality 6.2 80% 20% 0%
Flexibility 6.1 80% 20% 0%
Business processes 6.0 80% 20% 0%
Employee competencies 6.0 70% 30% 0%
Cooperation between tourism providers on and between destinations
6.0 70% 30% 0%
Source: Own research

35
The results were compared with the literature analysis and the Delphi group results shown in Figure 1. The aim was to understand the following: which drivers are examined in relevant literature, but experts do not believe that they are important; which drivers are recognized as important by experts, but are not getting sufficient attention in relevant literature; and which drivers are recognized by experts and literature as crucial for hotel success. The results are presented in Figure 2. As visible in section III, the following drives received considerable interest in the literature: HRM practices, brand equity, hotel facilities, environmental practices, organizational culture, and ICT. However, the panel of experts did not recognize those as crucial drivers of hotel success. On the contrary – the panel of experts defined location, firm flexibility, product development and cooperation between tourism providers as additional drivers of success – as seen in section I. Literature just recently recognized the importance of these drivers, until now it failed to show much interest in those drivers of hotel success. Finally, market orientation, customer satisfaction, service quality and business processes were recognized by both literature and experts as important drivers of hotel success (section II). Table that shows the academia coverage of all 9 drivers from Delphi study, is presented below: Table 8: Key drivers and academia coverage
DRIVERS OF PERFORMANCE
SHORT DESCRIPTION AUTHORS AND YEAR
Location Physical location Lado-Sestayo et. al., 2016 Peiro-Signes, Segarra-Ona, Verma & Miret-Pastor, 2018
Employee competencies
Qualifications, experience, knowledge development, knowledge sharing between employees
Rudež & Mihalič, 2007 Kim, Kim, Park, Lee & Jee, 2012 Nieves, Quintana & Osorio, 2014 Ružić, 2015
Customer satisfaction
Degree of satisfaction with the services, price, location, and amenities
Wilkins, Merrilees & Herington, 2007 Rudež & Mihalič, 2007 Chi & Gursoy, 2009 Assaf & Magnini, 2012 Sun & Kim, 2013 Kim, Cho & Brymer, 2013 Al-Rafaie, 2015 Kim, Voght & Knutson, 2015 Assaf, Josiassen, Cvelbar & Woo, 2015
Service quality Tangibility, reliability, responsiveness, assurance, empathy
Herrington & Akehurst, 1996 Chu & Choi, 2000 Claver, Jose, Tari & Pereira, 2006 Al-Rafaie, 2015 Wang, Chen & Chen, 2012 Pereira-Moliner, Claver-Cortés, Molina-Azorin & Tari, 2012 Molina-Azorin, Tari, Pereira-Moliner, Jopez-Gamero & Pertusa-Ortega, 2015
Business processes IT for front-office and bookings, databases, management information system, customer relationship management applications Hotel standards and procedures, service performance, customer complaint solving procedures, innovative ideas, continuous process improvement
Rudež & Mihalič, 2007 Claver-Cortes, Pereira-Moliner, Tari & Molina-Azorin, 2008 Sirirak, Islam & Ba Khang, 2011 Mihalič & Buhalis, 2013 Wang, Chen & Chen, 2012 Benavides-Velasco, Quintana-Garcia & Merchante-Lara, 2014 Oltean, Gabor and ConɈiu, 2014 Mihalič, Garbin Praničević & Arnerić, 2015 Melián-Gonzáles & Bulchand-Gidumal, 2016

36
DRIVERS OF PERFORMANCE
SHORT DESCRIPTION AUTHORS AND YEAR
Market orientation Orientation to customers, competitors, seeking profitable customers and products, responsiveness to market changes
Gray, Matear & Matheson, 2000 Matear, Osborne, Garrett & Gray, 2002 Barros & Dieke, 2008 Assaf & Cvelbar, 2011 Wang, Chen & Chen, 2012 Josiassen & Assaf & Knežević Cvelbar, 2014 Vega-Vázquez, Cossio-Silva & Revilla-Camacho, 2016
Product development
Segmentation and product development Bolfing & Cadotte 2015 Peiro-Signes & Segarra-Ona, Miret-Pastor & Vilma, 2015 Mody, Suess & Lehto, 2018
Flexibility Strategic flexibility, service responsiveness, organizational flexibility
Knox and Walsh, 2005 Ku & Wu and Chen, 2016 Ubeda-Garcia, Claver-Cortes, Marco-Layara & Zaragoza-Sales, 2017 Xie, So & Wang, 2017 Yu, Luo, Feng & Liu, 2018
Cooperation Internal cooperation, tourism clusters Peiro-Signes, Segarra-Ona, Miret-Pastor & Verma, 2015 Marcoz, Mauri, Maggioni & Cantu 2016 Aboelmaged, 2018 Yin, Chu, Wu, Ding, Yang & Wang, 2019
Figure 2: Drivers of hotel performance through literature and the Delphi study
Source: Authors

37
2.6 DISCUSSION AND CONCLUSION
Hotel performance attracted substantial research attention in the past three decades. Most of the academic work focused on empirical investigation connecting sustainable competitive advantages with financial performance of hotels. Studies so far mainly focused on researching intangible assets (mostly organizational and human capital) and their relation with performance. In general, studies somehow neglected tangible assets and capabilities and their relation with performance. Tangible assets were considered as a prerequisite and necessary input for operations and its connection with performance was treated as obvious. In turn, capabilities were neglected because they are difficult to measure and operationalize in empirical studies. Empirical research in many cases focused on specific drivers of hotel performance and investigated their impact on performance. Most of the studies did yield unexpected results. Tested drivers – sustainable competitive advantages – were translated into financial success of a firm. Most of the studies did not ask the question: which are the most relevant drivers of hotel performance? To this end, this paper is dealing with this question. Qualitative research based on the Delphi method was performed on a panel of 10 experts in the hospitality industry. They evaluated 30 drivers of hotel performance that had been recognized in hospitality research. Three rounds of evaluation reduced the list to nine most important drivers of performance in the hospitality industry by the opinion of the expert panel. The main drivers are: location, customer satisfaction, service quality, employee competencies, business processes, product development, cooperation, flexibility, and market orientation. Of those nine drivers, one is considered as tangible, three are intangible assets and five are capabilities. This is a quite different structure than the structure of the inputs for this research. Among 30 drivers of performance, only three were tangible assets, 22 were intangible assets and five of them were capabilities. Theoretical implication of this paper is in indicating the importance of capabilities and tangible assets as performance drivers in hotel industry. Literature was not critically assessing those performance drivers so far. Our guidelines for future research in this area are proposed in section fife of this paper. Managerial implication of this paper is focused, structured and clear communication of relevant performance drivers in hospitality industry. Drivers indicated in this research are areas in which future investments in financial and human capital are needed for sustainable growth and prosperity of the industry. Limitations of this paper are that we have possibly missed some of the research papers in the field. We have studied available paper in the WoS database but body of knowledge is growing and we may overlook some of the work. In terms of Delphi method used in this study, the main limitations are the subjective evaluation of the respondents and possible impacts of the panel on respondent opinion. Delphi method was first introduced by researchers Norman Dalkey and Olaf Helmer

38
during the 1950s. It is a method suited to study areas with little research history that are related to the fast-changing environment and are of a great complexity (Linstone & Turoff, 1975). During the research, researchers collect judgments of experts on a particular topic to (1) assess these judgements, (2) to capture the areas of collective knowledge held by professionals which are not usually discussed or researched and (3) to force new ideas that emerge about the topic during the study (Stewart, 2001). The method offers timely information from the experts in a form of agreement made from intuitive opinions on a specific topic that is found to be more reliable than single opinions by individuals (Lang, 1994). The main advantages of the method are (1) adequate time for thinking and reflection, (2) respondents are focused to the problem because of the way the study is run, (3) questionnaires enable fair and equal contribution of all respondents without influence of more dominant individuals, and (4) less group think (Uhl, 1983). Use of the Delphi method also brings forward important limitations as already two of them mentioned above (subjectivity and influence of respondent’s opinions). Two main limitations of the method stated in the theory are (1) the importance of the question asked in the first questionnaire which is based on the research theory and pre-defines the key elements in the research, and (2) lack of outcome data other than perceptions of the panel and the description of the profile of the participants in the panel (Franklin and Hart, 2007). Other possible sources of limitations could be the structure of the respondents in the sample and the size of the sample. The sample in our research constituted from four representatives of academia and six representatives from the hotel management. Different sample structure and the size of the sample could impact the research results. Also, repeatability of the research process can represent a source of the limitation. Delphi is also narrowly applicable to few specific settings; it is very lengthy and complex to conduct and results of the method cannot be generalized.
2.7 FUTURE RESEARCH POTENTIAL
This paper sets the goals for future empirical research in understanding hotel performance. Crossing the literature with hospitality experts’ opinions enabled to define potential gaps, which represent a future field of research and operationalization. Further quantitative research using those concepts is needed in order to generalize the results and further contribute to the field of knowledge in this area. In addition, it would lead to a better understanding of hotel performance in emerging and developed hospitality markets. General management theory is emphasizing the importance of capabilities as prominent performance drivers. The lack of empirical studies investigating the relation between capabilities and performance is evident. However, the results of this research show that hospitality experts believe that capabilities are potential sources of sustainable competitive advantages. Specifically, the panel of experts recognized dynamic capabilities as quite important. Those include a firm's ability to adjust to ongoing changes in the external environment. Adaptability of organizations as systems, their employees and managers is highly relevant in today's ever-changing world. As a

39
result, dynamic capabilities constitute an important research area that should encourage a plethora of research in the future. These research results and general overview of relevant literature underline the need for a shift in research efforts. Research literature improved the understanding of intangible assets and their role in driving the performance in hospitality industry. However, there is still limited information available about capabilities and their potential role as sustainable competitive advantages of a hotel. The development of measurement instruments enabling the evaluation of capabilities and the magnitude of their impact on performance is a potential future avenue in hospitality research. This paper indicated five potential areas of future research including business processes, product development, cooperation, flexibility and market orientation. This paper also compares research efforts delivered in empirical papers measuring drivers of hotel performance with expert opinion on the importance of those drivers. This research identified a gap between the focus in literature and expert evaluations. Experts clearly emphasized the role of tangible assets in hotel performance. The hotel industry is capital intensive and investments in tourism infrastructure are seen as extremely important. The results may be driven by the current situation in the hotel sector in Slovenia and Croatia. The hospitality industry in both countries requires a significant investment cycle to improve its competitiveness on the global market. Furthermore, the experts argued that clear product development is a very important driver of hotel performance. So far, empirical research was not focusing on the product development and its impact on hotel performance. This is also one of potential lines of research indicating the operationalization of the product development as a driver of success. Business processes related to the revolution in information communication are also recognized as highly important. Qualitative research indicated that it is necessary to address them as a business processes in relation to the customer – all digital communication, internal business processes between hotel employees, and possibly technological solutions that can improve the available tourism products. The panel of experts strongly emphasized market orientation and flexibility as important drivers of performance. Further operationalization of those drivers is necessary in order to test them empirically.

40
3. TOURISM AND HOTEL SECTOR IN SLOVENIA AND CROATIA – COMPARISONS AND COMMENTS
Slovenia and Croatia are countries that were both part of ex-Yugoslavia. The countries separated in 1991, when they became independent. Today, the tourism industry is not equally important for both countries. In this chapter, we compare the two countries according to the development of the tourism at national level and according to the structure of their tourism and hotel market development.
3.1 NATIONAL LEVEL
During the last 6 years, growth of GDP in Slovenia went from negative (−1.1%) growth in 2013 towards close to 5% positive rate of growth in 2018. In Croatia, yearly growth of GDP went from −0.01% in 2013 towards 3% of yearly growth in 2017. Slovenian GDP per capita overreached EUR 22,000 in 2018 and almost doubled GDP per capita of Croatia for the same year. On the contrary, Croatia overreached Slovenia at the level of total and direct travel and tourism contribution to GDP. Croatian travel and tourism total GDP contribution was growing steadily during the period 2013 to 2018 and reached almost 25% in 2018 with its direct contribution of 10.4%. Slovenian direct contribution of travel and tourism to GDP remained stable during the last six years at the level around 12%, while direct contribution stayed around 3.4% during the same period. Table 9 and Table 10: Tourism development on a national level
SLOVENIA 2013 2014 2015 2016 2017 2018
GDP (yearly growth) in % −1.1 3 2.9 3.1 5 4.5
GDP per capita (in EUR) 17.596 18,244 18,823 19,576 20,815 22,182
Direct GDP Travel and Tourism contribution (in %) 3.4 3.3 3.3 3.3 3.4 3.4
Total GDP Travel and Tourism contribution (in %) 12.6 12.2 12.1 12 12.2 12.3
Capital investments (% of exports) 9.6 9.1 8.9 8.7 8.7 8.9
Source: WTTC, Country reports
CROATIA 2013 2014 2015 2016 2017 2018
GDP (yearly growth) in % −0.01 0.00 2.4 3.5 2.9 na
GDP per capita (in EUR) 10,298 10,162 10,606 10,965 11,882 na
Direct GDP Travel and Tourism contribution (in %) 9.5 9.8 10.1 10.4 10.8 10.4
Total GDP Travel and Tourism contribution (in %) 22.1 22.7 23.4 24 24.7 24.9
Capital investments (% of exports) 10.3 10.2 10.8 11 10.9 10.9
Source: WTTC, Country reports

41
3.2 TOURISM NUMBERS
Slovenia and Croatia both reached almost double-digit growth rates in the number of tourists during the last years, however the structure of tourists and the growing trends are not the same when comparing the two countries. The number of tourists in Slovenia grew from 3.4 mio in 2013 to almost 6 mio in 2018 with the number of overnights reaching from 9.6 mio to 15.7 mio. On average, tourists stayed in Slovenia for 2.5 days. Foreign tourists increased their share from 62% to 75% in the period from 2013 to 2018 with the peak of growth starting in 2015 (12.3%) followed by recording years 2016 (12.1%), 2017 (18.3%) and 2018 (11%). On the other hand, Slovenia decreased its share of domestic tourists during the same period from 38% to 27%. The data show that Slovenia follows its strategic orientation towards foreign markets with the support of general positive European tourism inflows. The tourism inflows in 2018 reached a record with EUR 2.7 mrd with 12% growth in comparison to 2017, contributing a total 12.3% share of GDP in 2018. Croatia increased its number of tourists from 12.4 mio in 2013 to 18.7 mio in 2018 with the number of overnights growing from 64.8 mio to 89.7 mio during the same period. On average, tourists spent 5 days in Croatia. The share of foreign tourists remained more or less stable between 89 to 90% with domestic guests contributed the rest. The figures 3 and 4 show the differences in country growth rates in the number of tourists. The number of domestic guests in Croatia heavily grew in the period from 2014 to 2018, while foreign guests grew in 2015 for 9.1%, after then the growth fell to 2.9% in 2017 reaching again optimistic jump of 6.7% in 2018. Croatian tourism inflows also reached a record with EUR 6 mrd in 2018 and the total share of 19.8% in GDP. Figure 3: Tourists and overnights in Slovenia (2013–2018)
Source: National statistics reports
3.384 3.524 3.928 4.318 4.948
5.933
9.579 9.591 10.342
11.180
12.592
15.695
0
2.000
4.000
6.000
8.000
10.000
12.000
14.000
16.000
18.000
2013 2014 2015 2016 2017 2018
Number of tourists Number of overnights

42
Figure 4: Tourists and overnights in Croatia (2013–2018)
Source: National statistics reports
Figure 5: Structure of tourists in Slovenia and Croatia (2013−2018)
Sources: Croatian ministry of tourism, yearly reports; Slovenian tourism organization, yearly reports
12.434 13.128 14.343 15.594 17.431 18.700
64.818 66.484 71.605
78.050
86.200 89.700
0
10.000
20.000
30.000
40.000
50.000
60.000
70.000
80.000
90.000
100.000
2013 2014 2015 2016 2017 2018
Number of tourists Number of overnights
62% 64% 69% 70%
73% 75%
38% 36% 31% 30%
27% 25%
89% 89% 88% 89% 90% 89%
11% 11% 12% 11% 10% 11%
2013 2014 2015 2016 2017 2018
Slovenija Foreign Slovenija Domestic Croatia Foreign Croatia Domestic

43
Figure 6: Growth rates in the number of tourists in Slovenia
Sources: Slovenian tourism organization, yearly reports
Figure 7: Growth rates in the number of tourists in Croatia
Source: Croatian ministry of tourism, yearly reports
3.3 CAPACITIES AND MARKET STRUCTURE
Tourism capacities in Slovenia have been growing slowly during the last two years (from 127,000 beds in 2015 to 135,000 beds in total in 2017 with only 6% increase, which is surprisingly low taking into account very positive inflows of tourists from abroad. In the period of the last five years, the number of beds in camps and other forms of accommodation in Slovenia increased, while the number of hotel beds during the last two years even decreased (from 36% of all beds in 2015 to 32% in 2017).
2,6 4,1
11,5 9,9
14,6
8
4,8
6,7
12,3 12,1
18,3
11
-1,4 -1,1
9,7
5,2 6
0 2013 2014 2015 2016 2017 2018
Total tourists growth Foreign tourists growth Domestic tourists growth
5,1 5,6
9,3 8,7
11,8
7,1
5,6 6,2
9,1 8,9
2,9
6,7
1,3 1,3
10,3
7,6
12,9
10
2013 2014 2015 2016 2017 2018
Total tourists growth Foreign tourists growth Domestic tourists growth

44
Similarly, Croatia increased its bed capacities from 0.9 mio beds in 2013 to 1.2 mio beds in 2017. The same as in Slovenia, the bed capacities during this period increased in other forms then hotels, whereas the capacities in hotel sector are falling already for the second year. Figure 8 and Figure 9: Tourism capacities in Slovenia and Croatia (2013–2017)
Sources: Croatian ministry of tourism, yearly reports; Slovenian tourism organization, yearly reports
Slovenia and Croatia are very similar according to the market structure. The majority of tourists from abroad came to Slovenia in 2017 from Italy (16%), Germany (11%), Austria (10%), Croatia (5%), Netherlands (4%), Hungary (3%), Czech Republic (3%), and France (3%), followed by overseas countries UK, US, and Republic of Korea. Croatia had a similar structure of markets in 2017, starting with Germany (16%), Slovenia (8%), Austria (7%), Italy (7%), Poland (6%), UK (5%), Czech Republic (5%), Hungary (3%), France (3%), followed by overseas US and Korea. Both countries still face the challenge of strong seasonality of the business with its peaks in July and August. Figure 10: Foreign market structure in Slovenia (2017)
Source: Slovenian tourism organization, yearly reports
30%
31%
32%
33%
34%
35%
36%
37%
0
20.000
40.000
60.000
80.000
100.000
120.000
140.000
160.000
2013 2014 2015 2016 2017
Slovenia
All beds Hotel beds % of hotel beds
0%
2%
4%
6%
8%
10%
12%
14%
16%
0
200.000
400.000
600.000
800.000
1.000.000
1.200.000
1.400.000
2013 2014 2015 2016 2017
Croatia
All beds Hotel beds % of hotel beds
Italy 16%
Germany 11%
Austria 10%
Croatia 5%
Netherlands 4%
Hungary 3%
UK 3%
Chech 3%
France 3%
Corea 4%
USA 4%
Other 34%
Slovenia

45
Figure 11: Foreign market structure in Croatia (2017)
Source: Croatian ministry of tourism, yearly reports
3.4 HOTEL INDUSTRY
In Slovenia in 2017 hotel beds represented 32% of all bed capacities, while hotel overnights contributed to 61% of all overnights for the same year. Slovenia increased hotel bed capacities mainly in the cities and in the capital city of Ljubljana, while other tourist municipalities mainly decreased the numbers of hotel beds available for tourism. Figure 12, Figure 13, Figure 14 and Figure 15: Overnights and bed capacities in Slovenia and Croatia in 2017
Sources: Croatian ministry of tourism, yearly reports; Slovenian tourism organization, yearly reports
According to the hotel category, in 2017 Croatia had 11,456 hotels altogether, from which 603 hotels were 5-star and 6,496 hotels were categorized as 4-star hotels, meaning 61% of all hotels in Croatia is of the highest quality, In 2017, Slovenia had 41% of all hotels at the level of 4 and 5 stars.
Germany 16% Austria
7%
Slovenia 8%
Italy 7% Poland
6% UK 5%
Chech 5%
Hungary 3%
France 3%
Other 40%
Croatia
Hotels
24%
Other 76%
Croatia overnights
Hotel beds 11%
Other 89%
Croatia bed capacities
Hotels
61%
Other 39%
Slovenia overnights
Hotel beds 32%
Other 68%
Slovenia bed capacities

46
Figure 16 and Figure 17: Hotels by category in Slovenia and Croatia in 2017
Sources: Croatian ministry of tourism, yearly reports; Slovenian tourism organization, yearly reports
The hotel industry in Slovenia is currently facing a restructuring period where the biggest hotel companies focus on efficiency and performance success with slowly investing again in the accommodation and service quality. The models of operation known in the competitive European hotel market are being introduced slowly with only a few international hotel chains being present in the market (Kempinski, Best western, Sheraton, Intercontinental, Austria Trend, Ramada and Accor’s Mercure and Ibis). The main hotel companies in Slovenia still lack a clear ownership model and development strategy. In 2017, 5% of the biggest hotel companies in Slovenia contributed to 56% of all revenues of the hotel sector, and 65% to the number of all employees in the hotel industry. The public share of ownership in these companies in 2017 amounted directly and indirectly to 35.7% (Hosting, 2018). In Croatia, the share of hotel beds within all available beds is even lower, representing only 11%. These hotel capacities contributed to 24% of all overnights in Croatia in 2017. In 2017, Croatia had 131,152 hotels altogether, among which 12,722 hotels were 5-star and 61,415 hotels were 4-star. In comparison to Slovenia, Croatia had 167 hotels in hotel chains in 2017 which were included in 20 brands. 15 the most important brands with the number of hotels are presented below. Table 11: Domestic and International brands in Croatia in 2017
DOMESTIC HOTEL BRANDS NUMBER OF HOTELS
Valamar Riviera 31
Remisens 15
Bluesun Hotels & Resorts 12
Adriatic Luxury hotels 8
Ilirija Hotels&Resorts 5
1 and 2-star 10%
3-star 28%
4-star 57%
5-star 5%
Croatia
1 and 2-star 8%
3-star 51%
4-star 37%
5-star 4%
Slovenia

47
INTERNATIONAL HOTEL BRANDS NUMBER OF HOTELS
Melia 9
Park Plaza 6
Falkensteiner 5
Sheraton 2
Radisson Blu 2
Le Meridien 1
Karisma 2
Hilton 2
Westin 1
Arcotel 1
Source: Horwath HTL, 2018 The main challenge of tourism industry in both countries is to reach a performance success measured through key performance indicators for tourism industry where hotel occupancy, ADR (Average daily rate) and RevPAR (Revenue per available room) are the most frequently used. The hotel occupancy rate in Slovenia in 2017 was 58% while in Croatia it was 64%. The average room rate in Slovenia was EUR 70 with RevPAR 37 EUR. Hotels in Croatia had much higher ADR (EUR 136) and RevPAR (EUR 87). Although the numbers of tourists and overnights had risen substantially during the last years, as seen in the report above, the effects of positive tourist and overnights numbers are still not sufficiently transformed into the final revenues and prices. In this case, Slovenia is already far behind the Croatian numbers.
Figure 18, Figure 19 and Figure 20: Hotel occupancy, ADR and RevPAR comparison (2017)
Sources: Croatian ministry of tourism, yearly reports; Slovenian tourism organization, yearly reports
Data above show substantial differences between the countries. Slovenia has chosen a sustainable strategy of tourism growth with its orientation to green and experience-oriented tourism. Within this
55%
56%
57%
58%
59%
60%
61%
62%
63%
64%
65%
Slovenia Croatia
Hotel occupancy (%)
0
20
40
60
80
100
120
140
160
Slovenia Croatia
ADR (EUR)
0
10
20
30
40
50
60
70
80
90
100
Slovenia Croatia
RevPAR (EUR)

48
strategy, hotel industry still waits for a clear ownership structure. Public sector, directly and indirectly controls a very important share of the hotel market and with it also holds the responsibility for development of the whole hotel industry. In the near future, the concentration of capital and consolidation of ownership in Slovenian hotel industry is expected. Together with this concentration and consolidation also larger investments should follow. As seen in the case of Croatia, the country went into consolidation of ownership much decidedly and oriented the hotel industry into branded high quality and luxury experience, which already contributes to the performance success of the hotel industry at national level.

49
4 PERFORMANCE DRIVERS IN HOSPITALITY INDUSTRY: EVIDENCE FROM SLOVENIA AND CROATIA
4.1 OVERVIEW
In this third chapter research goes deeper and further into the area of performance drivers in hospitality industry. The most important drivers from Delphi study represent the input into the quantitative research that is performed in 60 companies that manage 228 hotels in two countries (Slovenia and Croatia). We test the impact of 9 key performance drivers through 64 statements presented to managers in hospitality companies. The results show that drivers that are oriented towards customers (service quality, segmentation and customer satisfaction) are more important than company’s intangible resources hidden in IT development and management of employees or drivers that exploit the market opportunities (market orientation and flexibility). We also explain the impact of the drivers on performance for different groups (clusters) of hospitality companies that differ significantly according to size, ownership and development phase.
4.2 INTRODUCTION
Performance is one of the most researched topics in hospitality literature. It is also one of the major challenges for hotels owners, managers, and employees. For decades literature has tried to understand the key drivers of firm success, and whether they have the same impact on performance regardless the company size, market specifics, or governance model. Research so far has shown that there is no single driver that will make a specific firm successful. On the contrary, success is a complex phenomenon driven by numerous factors that are interrelated. This combination of different success factors is ultimately specific for each organization. The main motivation in our paper is to identify the major drivers of hotel performance in Slovenia and Croatia. Both countries are emerging tourism destinations, growing with the double-digit rates over the last few years. Current trends have shown that growth is going to continue in the future, and will position both destinations as an important part of the European tourism market. Both countries were part of ex-Yugoslavia and are now part of the European Union. This makes the case even more specific, since both economies transitioned from a socialist to market economy. Current hospitality and tourism literature focuses on analyzing the impact of intangible assets on hotel performance (Bozic & Cvelbar, 2016). Specifically, human capital has so far been the most researched topic in hospitality performance literature including: human resource management practices, knowledge sharing, skills of hospitality leaders, employee satisfaction, management tenure, team culture, intellectual property rights, and social capital (Rudež & Mihalič, 2007; Chi & Gursoy, 2009; Chand, 2010; Kim & Brymer, 2011; Al-Rafaie, 2015, Hussain, Kronar & Ali, 2016). Marketing aspects were also comprehensively analyzed in the literature including service quality,

50
customer satisfaction brand equity, and market orientation (Kim & Kim, 2005; Barros & Dieke, 2008; Assaf & Magnini, 2012; Pereira-Moliner et. al., 2012; Kim, Cho & Brymer, 2013; Wang, Chen & Chen, 2012; Josiassen, Assaf & Knežević Cvelbar, 2014). Governance models were also attracting the attention of academic researchers, including ownership models, ownership types, organizational structure, and corporate strategies (Knežević Cvelbar & Mihalič, 2007; Assaf & Knežević Cvelbar, 2011; Tavitiyaman, Qui Zhang & Qu, 2012; Xiao, OʼNeill & Mattila, 2012; Jarboui, Guetat & Boujelbéne, 2015). In the last decade environmental practices were included in hospitality performance research, including environmental management, advance environmental management, and corporate social responsibility (CRS) practices (Pereira-Moliner et. al, 2012; Garay & Font, 2012; Assaf, Josiassen & Knežević Cvelbar, 2012; Leonidou et. al., 2013; Benavides-Velasco, Quintana-Garcia & Marchante-Lara, 2014). Lately, research has focused on informational communicational technology (ICT) and its impact on performance (Sirirak, Islam & Ba Khang, 2011; Mihalič & Buhalis, 2013; Oltean, Gabor & ConɈiu, 2014; Mihalič et. al., 2015; Melian-Gonazáles & Bulchand-Gidumal, 2016). Our literature review proposed that the current body of knowledge in hospitality was researching the impact of 30 performance drivers on hotel financial performance. The key question was, “what are the main performance drivers in post-transition economies, such as Slovenia and Croatia?” In order to answer this question, we had to shortlist the most important drivers of performance using qualitative research techniques. The list of 30 drivers of performance identified in literature was evaluated by the hospitality experts within three rounds of assessment based on the Delphi method. The nine key drivers of hotel success were indicated as: location, market orientation, customer satisfaction, segmentation, quality of services, flexibility, employee management, IT development, and cooperation. The measurement scales for those drivers were developed using and upgrading the existing measurement instruments proposed by various authors. Quantitative research among management in hotel companies was conducted. Data from quantitative research were related to companiesʼ financial performance data. Using this data set we have conducted the cluster analysis to better understand the drivers of performance among different groups of hotels.
In this paper we offer two major contributions. The first is a different approach to observing the performance drivers in the hotel industry. We propose that drivers in the hotel industry differ significantly between different types of companies. Therefore, clustering the companies into similar groups can lead to more meaningful results than searching for universal performance drivers that are common for all companies. This study is also context-specific. Slovenia and Croatia were both experiencing the transition from socialist to market economy. Consequently, this paper reveals how that kind of transition leaves marks on performance in the hospitality industry.
4.3 DRIVERS OF PERFORMANCE IN THE HOSPITALITY INDUSTRY
There is a large body of research investigating drivers of performance in hospitality. A brief Google Scholar search shows that from 1990 to 2018 there were 155,000 documents on hotel performance
51
measurement, and 1,300,000 documents on hotel performance topics. Web of Science lists 167 papers on hotel performance measurement, and 2,992 papers on hotel performance in period from 1990 to 2018. In order to analyze this large body of literature we had to apply content analysis techniques. The key benefit of this analysis is the structuring the data based on content-related topics. In order to structure the drivers of performance on content-related topics, we applied a theoretical frame of Resource-based Theory and structured drivers of performance as tangible assets, intangible assets, and capabilities. Tangible assets are financial and physical resources of the company (Winter, 2003). Generally, it is difficult to distinguish between intangible assets and capabilities. The intuitive and logical difference between the two was proposed by Hall (1992), who explained that intangible assets are those things a firm HAS, while capabilities are those things a firm DOES. Intangible assets are non-physical assets like: HRM practices; skills of employees and managers; firmʼs intellectual, social, and relational capital; organizational culture; and usually are not presented in a firmʼs financial reports (Barney, 1991; Grant, 1996; Teece et al., 1997). Capabilities are skills and knowledge that enable firms to perform their daily processes and activities, as well as the ability to react and adjust to the dynamics and fast changing environment (Teece, 2007). Studies that have researched the impact of tangible assets on performance have focused on relating hotel facilities (Chu & Choi, 2000; Kim, Cho & Brymer; 2013; Lado-Sestayo, Otero- González, Vivel-Búa & Martorell-Cunill, 2016), location (Lado-Sestayo et.al., 2016), and financial assets (Lenidou et.al., 2013) with performance. All of those studies have found a positive relationship between the tangible assets drivers of performance and the financial performance of hotels. The relationship between intangible assets and performance attracted significant interest in academic literature. The research interest in this area can be divided in four general areas: marketing-related studies, human resources-related studies, environmental management studies, and IT-related studies. Marketing-related studies focused on investigation of the relationship between: brand equity (Presad & Dev, 2000; Kim & Kim, 2005; Rudež & Mihalič; 2007; OʼNeil & Carlbäck, 2011), customer loyalty (Kandampully & Suhartanto, 2000; Al-Rafaie, 2015; Kim, Voght & Knutson, 2015), customer satisfaction (Wilkins, Merrilees & Haringon, 2007; Rudež & Mihalič, 2007; Chi & Gursoy, 2009; Sun & Kim, 2013; Kim, Cho & Brymer, 2013), service quality (Herrington & Akehurst, 1996; Chu & Choi, 2000; Wang, Chen & Chen, 2012; Molina-Azorin et. al., 2015), and direct distribution channels (Rudež & Mihalič, 2007; Kim et. al., 2012) on hotel performance. Most of those studies have found a positive relationship between marketing-related drivers of performance and actual financial performance in the hotel industry. The most extensive body of research in hotel performance literature are studies relating performance and human resource management. Employees loyalty (Kim & Brymer, 2011; Al-Rafaie, 2015), employee satisfaction (Chi & Gursoy, 2009; Naseem, Sheikh & Malik, 2011), employeesʼ attitudes towards work
52
(Sharpley & Foster, 2003; Rudež & Mihačič, 2007), employee innovativeness (Nieves, Quintana & Osorio, 2014), HRM practices (Hoque, 1999; Chand & Katou, 2007; Chand, 2010; Ahmad, Solnet & Scott, 2010; Ružić, 2010), managerial competencies (Kay & Russette, 2000; Chung-Herrera, Enz & Lankau, 2003; Jeou-Shyan et.al., 2011; Wu & Chen, 2015), management philosophy (Rudež & Mihalič, 2007), team culture (Hu, Horng & Sun, 2009; Hussain, Kronar & Ali, 2016), organizational culture (Kemp & Dwayer, 2001; Asree, Zain & Rizal Razalli, 2010, Zoghbi-Manrique-de-Lara & Ting-Ding, 2016), social capital (Kim et.al., 2012; Terry et. al., 2013; Dai et. al., 2015) and organizational structure (Jogaratnam & Ching-Yick Tse, 2006; Øgaard, Marnburg & Larsen, 2008; Tavitiyaman, Qiu Zhang & Qu, 2012) were performance drivers that were researched in hospitality literature. Evidence shows that those drivers, in most of the cases, have a positive relationship to firm performance. In the last two decades (from 2000 on) hospitality researchers, in line with the increasing knowledge in sustainable tourism, have been investigating the relationship between environmental management and hotel performance. Research related basic environmental practices (Molina Azorin et. al., 2009; Tari et. al., 2010; Pereira-Moliner et. al., 2012), advanced environmental practices (Molina-Azorin et. al., 2009; Tari et. al., 2010; Pereira-Moliner et. al., 2012; Lenidou et. al., 2013), and corporate social responsibility (CSR) practices (Kang, Lee & Huh, 2010; De Grosbois, 2012; Garay & Font, 2012; Assaf, Josiassen & Knežević Cvelbar, 2012; Benevides-Velasco et. al., 2014; Fu, Ye & Law, 2014) with hotel performance. The results of those studies were inconclusive, with some of them not finding a significant relationship between environmental performance drivers and financial performance, while others have found a positive relationship between variables. Recently, literature has related informational technology and performance in hospitality. This area of research is growing, and studies have shown a positive relationship between digital transformation and performance. Hospitality performance research provides few studies relating capabilities and hotel performance. Those studies are from the recent period, and we expect that the number of publications in this area will grow in the future. So far researchers have studied relationships with commercial and other partners (Rudež & Mihalič, 2007; Kim et. al., 2012), business processes (Claver-Cortes et. al., 2008; Wang, Chen & Chen, 2012; Benevides-Velasco et. al., 2014), knowledge sharing (Sristava, Bartol & Locke, 2006; Hu, Horng & Sun, 2009; Terry et. al., 2013; Hussain, Kronar & Ali, 2016), market orientation (Gray, Matear & Matheson, 2000; Barros & Dieke, 2008; Assaf & Knežević Cvelbar, 2011; Wang, Chen & Chen, 2012; Vega-Vázquez et. al., 2016), and entrepreneurial orientation (Jogaratnam & Ching-Yick Tse, 2006; Hernández-Perlines, 2016) with financial performance in hospitality. The results have shown a positive relationship between capabilities drivers and financial performance in hotels. A summary of our literature review on performance drivers in hospitality is presented in Table 12.

53
Table 12: Performance drivers in hospitality: A literature review summary
NUMBER OF STUDIES
DRIVERS OF PERFORMANCE IMPACT ON PERFORMANCE
Tangible assets 7 Hotel facilities Location Financial assets
Confirmed positive impact in all studies
Intangible assets 66 Brand equity Employee loyalty Employee satisfaction Employee competencies Employeesʼ attitudes towards work Employee innovativeness HRM practices Managerial competencies Management philosophy Team culture Organizational culture Customer loyalty Customer satisfaction Service quality Social capital Direct distribution channels Information technology (IT) Organizational structure Corporate governance Basic environmental practices Advanced environmental practices Corporate social responsibility (CSR) practices
Confirmed positive impact for employee loyalty, employee competencies, employeesʼ attitudes toward work, employee innovativeness, management philosophy, service quality, social capital, direct distribution channels, corporate governance, basic environmental practices, and advanced environmental practices Confirmed/not confirmed positive impact for brand equity, employee satisfaction, HRM practices, managerial competencies, organizational culture, customer loyalty, customer satisfaction, organizational culture, information technology, CSR Not confirmed positive impact for organizational structure
Capabilities 19 Relationships with commercial and other partners Business processes Knowledge sharing Market orientation Entrepreneurial orientation
confirmed positive impact for relationships with commercial partners, business processes, knowledge sharing and entrepreneurial orientation confirmed/not confirmed positive impact for market orientation
Source: Authors
4.4 MEASURING THE PERFORMANCE IN HOSPITALITY RESEARCH
Most of the hospitality performance literature relates performance drivers with hotel financial performance. Hospitality literature measures financial performance of hotels using three different approaches: (1) evaluating the performance using the management self-assessment data; (2) evaluating performance using financial indicators from financial statements data; and (3) evaluating the performance using multiple inputs and outputs available from financial statements and other available statistics. Studies using self-assessment are based on managersʼ evaluation of hotel performance. Self-assessments are usually done in comparison to competitorsʼ performance, or in comparison to planned values of performance usually stated in the companyʼs strategic documents (Claver, Jose and Pereira, 2006; Wilkins, Merrilees and Harington 2007; Chi and Gursoy, 2009; Taegoo, Gyehee, Soyon and Seungill, 2013; Dai, Mao, Zhao and Matilla, 2015).

54
Most of the empirical papers in hospitality literature use traditional financial performance indicators based on financial statements, where a combination of more than one financial indicator is used. Most of the ROA, ROE, revenue growth, and other profitability measures ROI, GOPAR, or GOP (Cho et. al., 2006; Chand & Katou, 2007; Chi & Gursoy, 2009; Chand, 2010; Kim et. al., 2012; Terry et. al., 2013; Oltean & Gabour, 2014; Al-Rafaie, 2015; Ružić, 2015;). There is a growing number of studies using a multiple input and output variables as performance measurements. Those studies are based on more complex methodology mainly using Data Envelopment Analysis (DEA) or Stochastic Frontier (SF) Analysis. Those studies are using multiple input and output variables to estimate the performance. Major input variables used in those studies are: number of hotel rooms, number of food and beverage seats, number of congress seats, wellness space in m2, costs of materials, costs of employees, and costs of amortization. Major output variables used are: revenues from accommodation and revenues from food and beverage. Authors using those methods in hospitality performance studies are: Barros & Dieke (2008); Assaf & Knežević-Cvelbar, 2011; Sirirak, Islam & Khang, 2011; Assaf & Magnini, 2012, Josiassen, Assaf & Knežević-Cvelbar, 2014).
4.5 THE SLOVENIAN AND CROATIAN TOURISM MARKETS
Slovenia and Croatia are countries that were part of ex-Yugoslavia. The countries separated in 1991, when both became independent. Today, the tourism industry is not equally important for both countries. In Slovenia, the total contribution of travel and tourism is 11.9% of the GDP, while in Croatia it is 25% of the GDP. Slovenia is one of the greenest counties in the world, as acknowledged by its sustainable tourism development. Its mountain region, spas and health resorts, Ljubljana, the coastal region, and famous caves are the most important Slovenian tourism products. Slovenia has recorded double-digit tourism growth rates in recent years, and in 2017 the number of tourists grew by 13% in comparison to 2016. The average length of stay in Slovenia is 2.6 days and is rather low. The Slovenian main tourism markets are: Italy, Germany, Austria, the Netherlands, Croatia, and the UK. Croatia is a well-known seaside destination, with the major attractions being the cities of Dubrovnik, Zagreb, and Split; Plitvice lakes; and islands Mljet, Korčula, Hvar, and Lošinj. The most visited regions are Istria and Dalmatia. Tourism in Croatia has also grown by double-digit numbers. In 2017 the number of tourists grew by 11% in comparison to 2016. The average tourists stay in Croatia is 5 days, which is considerably longer than in Slovenia. The main tourism markets for Croatia are: Germany, Slovenia, Austria, Poland, the Czech Republic, Italy, and the UK. In Table 13 we have summarized the main indicators of tourism development for both countries.

55
Table 13: Indicators of tourism development
INDICATOR SLOVENIA CROATIA
Travel & Tourism total contribution to GDP 11.9% 25.0%
Travel & Tourism total contribution to employment 12.3% 23.5%
Number of tourism arrivals in 2017 4.9 mio 17.4 mio
Number of overnight stays in 2017 12.6 mio 86.2 mio
Number of hotel rooms in 2017 19,519 63,300
Number of all rooms available in 2017 46,271 402,927
Travel and Tourism investments in total investments in 2017 8.8% 10.9%
Population number in 2016 (in mio) 2 4.8
GPD per capita in 2017 in EUR 20,815 11,882
Source: SORS, 2018; SORC, 2018; WTTC, 2017
4.6 METHODOLOGY
4.6.1 Method The methodology used in this paper was based on four steeps, presented in Figure 21. Figure 21: Three steps in the research process
Source: Authors

56
As presented in Figure 21, we have firstly made a detailed literature review in order to define the drivers of hospitality performance (table 2). Altogether, 30 drivers of hotel performance were identified (Table 3). In the second step we performed qualitative research based on three rounds of the Delphi method with 10 hospitality experts from Slovenia and Croatia. The experts were asked to identify the most important performance drivers. This step was taken in order to shortlist the number of potential performance drivers. The results indicated nine key performance drivers that were input for further quantitative research. The third step was conducting a quantitative study among hotel managers in Slovenia and Croatia. Based on the Delphi study results, we created a questionnaire with 64 statements (measured on a Likert scale between 1- strongly disagree to 7-strongly agree), covering nine drivers of performance: location, market orientation, customer satisfaction, segmentation, quality of services, flexibility, employee management, IT development and cooperation. (Figure 22). Figure 22: Key performance drivers
Source: Authors
Additionally, in the research process, the statements were developed and upgraded based on the literature review (scales used in the previous research). The scales and the final questionnaire are presented in the appendix 1 of this dissertation, while 64 statements used in quantitative research are presented in Table 14.

57
Table 14: Statements used in quantitative study to evaluate nine drivers of performance
LOCATION MARKET ORIENTATION SEGMENTATION
- Airline transport accessibility - Public transport accessibility - Railway transport accessibility - Parking capacities - Closeness to city center - Closeness to natural attraction - Business convenience - Destination with substantial demand
- Adaptation to guest’s preferences - Adaptation to industry changes - Customers’ information dissemination - Competitors’ information dissemination - Market information uniform understanding - Uniform understanding of market activities
effects - Responsiveness to competitors’
price-oriented actions - Responsiveness to competitors’ market
attacks
- Target market segmentation - Sales channel segmentation - Product segmentation
COOPERATION GUESTS’ SATISFACTION EMPLOYEE MANAGEMENT
- Information sharing - Joint business activities - Common design of destination
development strategy - Common implementation of destination
development strategy
- Constant growth of guests’ satisfaction - Guests’ service expectations and
compliance with the performance - Constant decline in the number of guests
complains - Average value of online ratings compared
to main competitors - Regular guests’ share compared to main
competitors - Regular guests’ share constant growth
- Employee qualifications to perform well - Companies’ appeal for quality staff - Resistance to employee dismissal - Work experience in the industry - Share of seasonal employees compared to
main competitors - Continuous knowledge development - Learning from guests - Regular workplace education - Constant sharing of ideas
QUALITY OF SERVICES FLEXIBILITY IT DEVELOPMENT
- Constant investment in hotel maintenance - Hotel/s attractiveness compared to
competitors - Visual corporate identity of employees
compered to main competitors - Feedback precision towards guests - Willingness to meet the guests’
expectations - Responsiveness to guests’ requirements - Trust towards employees - Employee qualifications to meet guests
needs - Support towards employees - Knowing the guests’ needs - Focus on the guests’ needs and well-being - Quality of food and service
- Introduction of industry technological solutions
- Implementation of safety recommendations - Adaptation to demographic trends - Implementation of environmental
protection activities - Enabling E-mobility services - Introduction of new business models
(Sharing economy, etc.) - Collaboration with the local environment
and responsiveness to its needs
- Effective processes with key daily information for decision making
- Implementation of processes in accordance with service standards and procedures
- Continuous improvement of internal processes
- Quality databases for decision making - Quality of data analytics for decision
making - Technology optimization of processes - Smart technology (Smart reception, etc.)
Source: Authors
Self-reported data on importance of drivers of hotel performance was connected with financial performance indicators available from AIPES in Slovenia and FINA in Croatia – agencies collecting firm financial statements. Data on performance were collected for the period 2013 – 2016.
4.6.2 Data description All companies from Slovenia and Croatia that have registered their main activity, Hotels and Restaurants according to the national classifications of both countries, were included in the research. The survey was conducted from May to November 2017. The database was double-checked and the companies that were operating in hospitality were removed from the database. In total, we included 650 hotel companies in the sample (250 Slovenian and 400 Croatian hotel companies). A
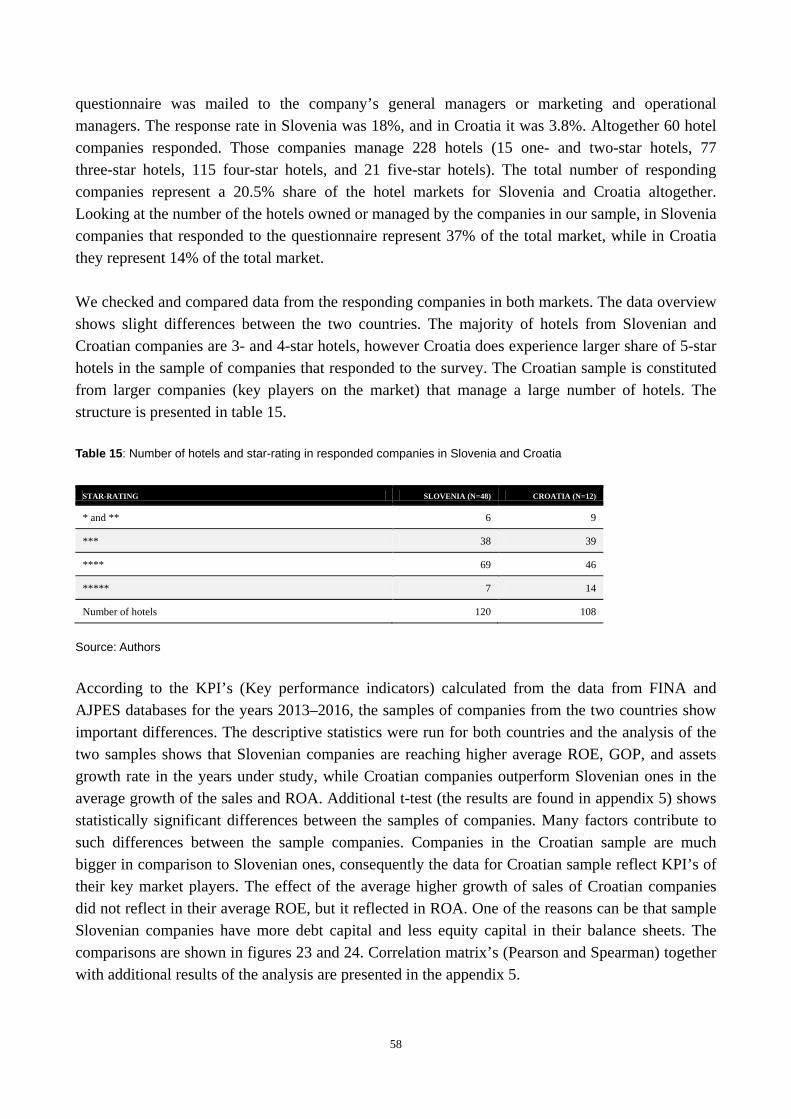
58
questionnaire was mailed to the company’s general managers or marketing and operational managers. The response rate in Slovenia was 18%, and in Croatia it was 3.8%. Altogether 60 hotel companies responded. Those companies manage 228 hotels (15 one- and two-star hotels, 77 three-star hotels, 115 four-star hotels, and 21 five-star hotels). The total number of responding companies represent a 20.5% share of the hotel markets for Slovenia and Croatia altogether. Looking at the number of the hotels owned or managed by the companies in our sample, in Slovenia companies that responded to the questionnaire represent 37% of the total market, while in Croatia they represent 14% of the total market. We checked and compared data from the responding companies in both markets. The data overview shows slight differences between the two countries. The majority of hotels from Slovenian and Croatian companies are 3- and 4-star hotels, however Croatia does experience larger share of 5-star hotels in the sample of companies that responded to the survey. The Croatian sample is constituted from larger companies (key players on the market) that manage a large number of hotels. The structure is presented in table 15. Table 15: Number of hotels and star-rating in responded companies in Slovenia and Croatia
STAR-RATING SLOVENIA (N=48) CROATIA (N=12)
* and ** 6 9
*** 38 39
**** 69 46
***** 7 14
Number of hotels 120 108
Source: Authors
According to the KPI’s (Key performance indicators) calculated from the data from FINA and AJPES databases for the years 2013–2016, the samples of companies from the two countries show important differences. The descriptive statistics were run for both countries and the analysis of the two samples shows that Slovenian companies are reaching higher average ROE, GOP, and assets growth rate in the years under study, while Croatian companies outperform Slovenian ones in the average growth of the sales and ROA. Additional t-test (the results are found in appendix 5) shows statistically significant differences between the samples of companies. Many factors contribute to such differences between the sample companies. Companies in the Croatian sample are much bigger in comparison to Slovenian ones, consequently the data for Croatian sample reflect KPI’s of their key market players. The effect of the average higher growth of sales of Croatian companies did not reflect in their average ROE, but it reflected in ROA. One of the reasons can be that sample Slovenian companies have more debt capital and less equity capital in their balance sheets. The comparisons are shown in figures 23 and 24. Correlation matrix’s (Pearson and Spearman) together with additional results of the analysis are presented in the appendix 5.

59
Figure 23: Comparison of average ROA, ROE and GOP for Slovenia and Croatia (2013−2016)
Figure 24: Comparison of average sales growth and asset growth for Slovenia and Croatia (2013−2016)
4.7. RESULTS
4.7.1 Drivers of performance: Descriptive statistical analysis In order to understand the major drivers of performance in the hospitality industry for those two markets, we firstly conducted a descriptive statistical analysis. The average values for nine drivers of performance based on managers’ self-assessments are presented in figure 25. The figure also shows the comparison with the results from the Delphi study.
-10
0
10
20
30
40
50
ROA (mean) ROE (mean) GOP (mean)
SLO CRO
0
5
10
15
20
25
SLO CRO
Sales growth (mean) Assets growth (mean)

60
Figure 25: Drivers of performance according to importance (Comparison of Quantitative research and Delphi study)
Out of the nine drivers of performance, the most important are service quality, segmentation, guestsʼ satisfaction and IT development, followed by market orientation and flexibility. Cooperation with other tourism providers at the destination is ranked as the least important. In comparison to the results of the Delphi study, hotel managers highlight the importance of customer-oriented drivers (service quality, segmentation, customer satisfaction), while the two most important drivers in Delphi study were location and market orientation followed by drivers that focus on customers. Tables 16-24 present the results of descriptive statistics for each of 64 statements within these nine drivers of performance, including the ranking of the statements according to their importance score. The table with the ranking of all statements forms the appendix 2 of this dissertation. Survey respondents ranked the driver Quality of services as the most important of all nine drivers of hotel performance. All of the first six statements in the overall rank are within this driver. The key for achieving this is the orientation towards the guests’ needs, and willingness to quickly meet their expectations and requirements. To achieve a high quality of services, hotels have to not only offer a high quality of infrastructure, but also support, trust, and teach their staff, possess the knowledge of guest’s needs, and offer them precise feedback on their demands. Investments and overall attractiveness of hotels are also important, but they stay far behind the importance of the quality of hotel services toward the guests (Table 16).
6,5 6,4 6,3 6,3 6,2 6,1 6,0 6,0 6,0
5,08 5,26
5,48 5,54
5,88
5,26 5,27 5,21
4,15
0
1
2
3
4
5
6
7
Location Market orientation Customersatisfaction
Segmentation/PD Service quality Flexibility Businessprocesses
Employeecompetencies
Cooperation
Delphi study Quantitative research

61
Table 16: Driver of hotel performance: Quality of services
DESCRIPTION OF THE STATMENT MEAN MEDIAN STD.
DEVIATION OVERALL
RANK
RANK WITHIN
THE DRIVER
Focus on the guestsʼ needs and well-being 6.66 7.00 0.545 1 1
Willingness to meet the guestsʼ expectations 6.20 6.00 0.898 2 2
Responsiveness to guestsʼ requirements 6.17 6.00 0.894 3 3
Quality of food and service 6.14 6.00 1.042 4 4
Support towards employees 6.13 6.00 0.892 5 5
Trust towards employees 6.07 6.00 0.907 6 6
Employee qualifications to meet guests needs 5.98 6.00 0.799 8 7
Knowing the guestsʼ needs 5.80 6.00 0.898 15 8
Feedback precision towards guests 5.77 6.00 0.909 16 9
Constant investment in hotel maintenance 5.55 6.00 1.443 26 10
Hotel/s attractiveness compared to competitors 5.12 5.00 1.342 45 11
Visual corporate identity of employees compared to main competitors 4.92 5.00 1.183 50 12
Managers evaluated that the second most important driver of performance is clear segmentation. Clear segmentation includes: the product, sales channel, and target market segmentation. Respondents perceive that product segmentation impacts performance more than segmentation, according to sales channels and target markets. Product segmentation was ranked at the 16th position in the overall rank, while segmentation according to sales channels and target markets were given the middle position within all ranked statements (Table 17). Table 17: Driver of hotel performance: Segmentation
DESCRIPTION OF THE STATMENT MEAN MEDIAN STD.
DEVIATION OVERALL
RANK
RANK WITHIN
THE DRIVER
Product segmentation 5.77 6.00 1.125 16 1
Sales channel segmentation 5.47 6.00 1.282 31 2
Target market segmentation 5.37 6.00 1.365 33 3
The third most important driver of performance according to the manager’s self-evaluation is Guestsʼ satisfaction. Within this performance driver managers evaluated that the most important are ‘constant growth of guestsʼ satisfaction’; ‘compliance with guestsʼ service expectations’, ‘constant decline of guest complaints’ (11 in total rank), and ‘constant growth in the number of regular guests’ (16th in total rank). Lower importance was given to the share of the regular guests and the average value of the online ratings that the hotel companies have in comparison to their most important competitors. Perhaps the lower ranking of these two statements is connected to the idea that knowing and focusing on hotels existing customers is more crucial for performance than trying to compete and compare with competitors’ (Table 18).

62
Table 18: Driver of hotel performance: Guests’ satisfaction
DESCRIPTION OF THE STATEMENT MEAN MEDIAN STD.
DEVIATION OVERALL
RANK
RANK WITHIN
THE DRIVER
Constant growth of guestsʼ satisfaction 5.95 6.00 0.946 11 1
Guestsʼ service expectations and compliance with the performance 5.77 6.00 0.621 16 2
Constant decline in the number of guests complaints 5.67 6.00 1.068 23 3
Regular guestsʼ share constant growth 5.62 6.00 1.180 24 4
Regular guestsʼ share compared to main competitors 5.03 5.00 1.248 49 5
Average value of online ratings compared to main competitors 4.83 5.00 1.542 51 6
The fourth out of the nine performance drivers in term of management self-assessment is ‘Development of information technology.’ Within this driver the most important is continuous improvement of internal processes improvement (ranked 7th in overall rank), which have to be in line with service standards and procedures, and effective in order to provide management with key daily information for decision making (ranked 20th and 21st). Respondents evaluated a bit lower, but still as important, the ‘quality of databases and data analytics for decision making.’ The statements that received a lower evaluation (63rd in overall rank) was implementation of smart technology in hospitality. This might be worrying for the future, due to fast digitalization and robotisation trends of the economy (Table 19). Table 19: Driver of hotel performance: IT Development
DESCRIPTION OF THE STATEMENT MEAN MEDIAN STD. DEVIATION
OVERALL RANK
RANK WITHIN
THE DRIVER
Continuous improvement of internal processes 6.00 6.00 0.766 7 1
Implementation of processes in accordance with service standards and procedures 5.71 6.00 1.001 20 2
Effective processes with key daily information for decision making 5.68 6.00 0.860 21 3
Quality databases for decision making 5.29 5.00 1.190 38 4
Quality of data analytics for decision making 5.28 5.50 1.316 39 5
Technology optimization of processes 5.07 5.00 1.219 48 6
Smart technology (Smart reception, etc.) 3.88 4.00 1.905 63 7
The next most important driver of performance according to the managersʼ evaluation is ‘Market orientation.’ Mangers believe that market-oriented hotel companies have to be in alert and quickly adapt and respond to guestsʼ preferences and attacks of the competitors. These two statements were ranked on 14th and 21st position in total rank. Surprisingly, managers evaluated lower the importance of adaptation to industry changes, and information sharing and understanding activities. This indicates that more effort in understanding and responding to external trends and information would have to take place in the future (Table 20).

63
Table 20: Driver of hotel performance: Market orientation
DESCRIPTION OF THE STATEMENT MEAN MEDIAN STD.
DEVIATION OVERALL
RANK
RANK WITHIN
THE DRIVER
Adaptation to guests’ preferences 5.88 6.00 0.865 14 1
Responsiveness to competitors’ market attacks 5.68 6.00 1.081 21 2
Competitors’ information dissemination 5.33 6.00 1.271 35 3
Responsiveness to competitors’ price-oriented actions 5.30 5.00 1.357 37 4
Adaptation to industry changes 5.21 5.00 1.136 41 5
Customers’ information dissemination 5.13 6.00 1.523 44 6
Uniform understanding of market information 4.81 5.00 1.332 53 7
Uniform understanding of market activities effects 4.73 5.00 1.388 54 8
The next driver is ‘Flexibility’ (had the same rating as Market orientation). There are three statements that were evaluated as highly important within this driver: Implementation of safety recommendations (ranked 9th in total rank), collaborating with local environment (19th) and implementing the activities that protect the environment (28th). Flexibility statements that evaluated the lowest are companies’ introduction of industry technological solutions into everyday business, and new industry business models (e.g. sharing economy). This is again confirmation of low industry acceptance and implementation of digitalization of the economy and the society (Table 21). Table 21: Driver of hotel performance: Flexibility
DESCRIPTION OF THE STATMENT MEAN MEDIAN STD.
DEVIATION OVERALL
RANK
RANK WITHIN
THE DRIVER
Implementation of safety recommendations 5.97 6.00 0.758 9 1
Collaboration with the local environment and responsiveness to its needs 5.74 6.00 0.943 19 2
Implementation of environmental protection activities 5.52 6.00 1.295 28 3
Adaptation to demographic trends 5.27 5.00 1.006 40 4
Enabling E-mobility services 5.10 5.00 1.362 46 5
Introduction of industry technological solutions 4.83 5.00 1.452 51 6
Introduction of new business models (Sharing economy, etc.) 4.38 5.00 1.508 57 7
The sixth most important driver of performance, evaluated by the managers was ‘Employee management.’ This ranking was a surprise, because in media releases managers from this region constantly emphasize the importance of employees for hotel performance. To be able to perform well, respondents believe, that employees must have all necessary qualifications, and they ranked this statement 13th place in total rank. Learning from guests and sharing the ideas within a company is also considered as very important, as well as the ability of the company to attract high quality employees. Middle importance is given to continuous trainings, education, and other ways of knowledge development within a company. Statements that were related to share of seasonal

64
employees, work experience in the industry, and resistance to employee dismissal were evaluated as less important (Table 22). Table 22: Driver of hotel performance: Employee management
DESCRIPTION OF THE STATEMENT MEAN MEDIAN STD.
DEVIATION OVERALL
RANK
RANK WITHIN
THE DRIVER
Employee qualifications to perform well 5.92 6.00 0.671 13 1
Learning from guests 5.57 6.00 1.226 25 2
Constant sharing of ideas 5.52 6.00 1.049 28 3
Companyʼs appeal for quality staff 5.32 5.00 1.200 36 4
Continuous knowledge development 5.17 5.00 1.196 42 5
Regular workplace education 5.15 5.00 1.412 43 6
Share of seasonal employees compared to main competitors 5.08 6.00 1.889 47 7
Work experience in the industry 4.65 5.00 1.560 55 8
Resistance to employee dismissal 4.53 5.00 1.396 56 9
Location is ranked in the 8th position of the nine key performance drivers in the hotel industry, according to the managers’ evaluations. This indicates that managers evaluated that physical location is not the prime driver of success in hospitality. They evaluated that having enough parking spaces is the quite important, as well as being part of the destination that generates substantial demand, along with accessibility of public transport and good access to natural attractions. Interestingly, managers did not highly evaluate airline transport accessibility (mean 4.02 out of 7) and railroad transport accessibility (mean 3.52 out of 7). The reason for this is that most of the hotel guests in this area still use their own cars as a transportation mode to the destination (Table 23). Table 23: Driver of hotel performance: Location
DESCRIPTION OF THE STATEMENT MEAN MEDIAN STD. DEVIATION
OVERALL RANK
RANK WITHIN
THE DRIVER
Parking capacities 5.95 6.00 1.320 11 1
Destination with substantial demand 5.53 6.00 1.775 27 2
Public transport accessibility 5.52 6.00 1.546 28 3
Closeness to natural attraction 5.46 6.00 1.381 32 4
Business convenience 5.34 6.00 1.636 34 5
Closeness to city center 5.27 6.00 1.803 40 6
Airline transport accessibility 4.02 4.50 1.827 61 7
Railway transport accessibility 3.52 3.00 1.662 64 8
Establishing strong cooperation with other tourism providers at the destination was the least important driver of hotel performance. All statements were given considerably low rankings
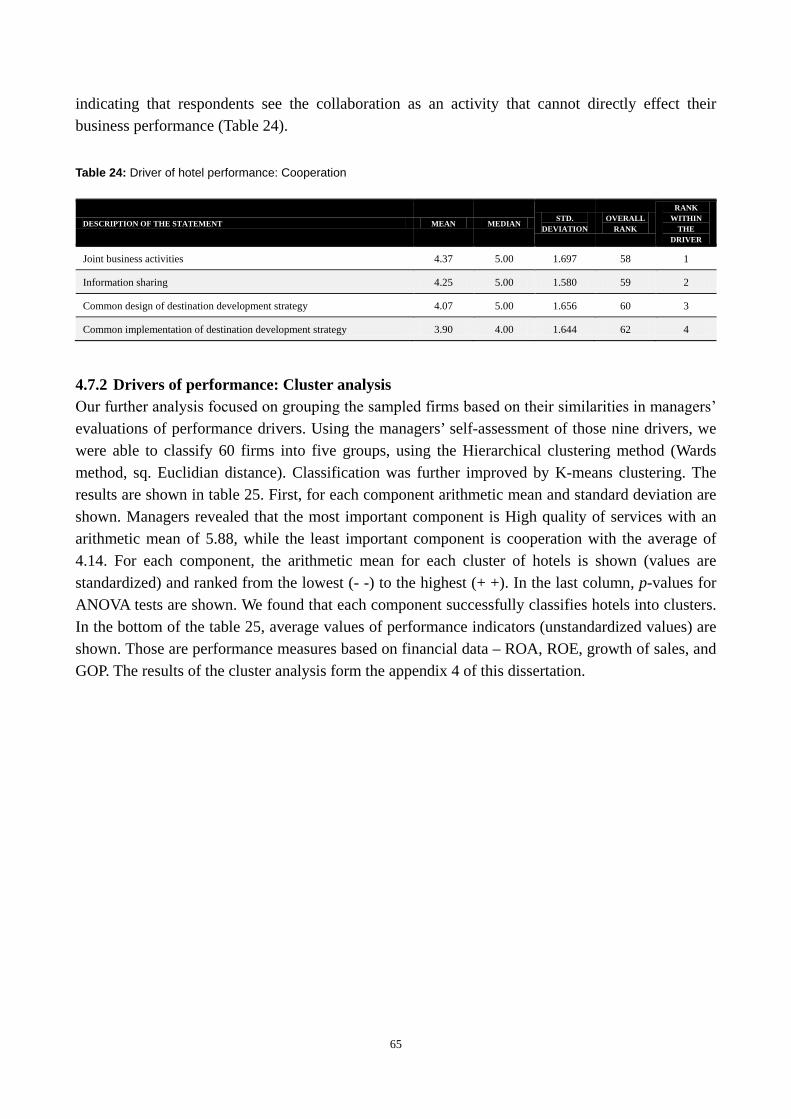
65
indicating that respondents see the collaboration as an activity that cannot directly effect their business performance (Table 24). Table 24: Driver of hotel performance: Cooperation
DESCRIPTION OF THE STATEMENT MEAN MEDIAN STD.
DEVIATION OVERALL
RANK
RANK WITHIN
THE DRIVER
Joint business activities 4.37 5.00 1.697 58 1
Information sharing 4.25 5.00 1.580 59 2
Common design of destination development strategy 4.07 5.00 1.656 60 3
Common implementation of destination development strategy 3.90 4.00 1.644 62 4
4.7.2 Drivers of performance: Cluster analysis Our further analysis focused on grouping the sampled firms based on their similarities in managersʼ evaluations of performance drivers. Using the managers’ self-assessment of those nine drivers, we were able to classify 60 firms into five groups, using the Hierarchical clustering method (Wards method, sq. Euclidian distance). Classification was further improved by K-means clustering. The results are shown in table 25. First, for each component arithmetic mean and standard deviation are shown. Managers revealed that the most important component is High quality of services with an arithmetic mean of 5.88, while the least important component is cooperation with the average of 4.14. For each component, the arithmetic mean for each cluster of hotels is shown (values are standardized) and ranked from the lowest (- -) to the highest (+ +). In the last column, p-values for ANOVA tests are shown. We found that each component successfully classifies hotels into clusters. In the bottom of the table 25, average values of performance indicators (unstandardized values) are shown. Those are performance measures based on financial data – ROA, ROE, growth of sales, and GOP. The results of the cluster analysis form the appendix 4 of this dissertation.

66
Table 25: Results of the cluster analysis using Ward method and K-means clustering
GROUP 1 GROUP 2 GROUP 3 GROUP 4 GROUP 5
Arithmetic mean (std. deviation) Mean n = 7 Mean n = 16 Mean n = 6 Mean n = 15 Mean n = 16 p-values for
ANOVA
C1: Location 5.07 (1.62) -0.41 - 0.38 + + -1.20 - - 0.31 + -0.03 0 0.006
C2: Cooperation 4.14 (1.64) 0.39 + -0.27 - -1.46 - - -0.06 0 0.70 + + 0.000
C3: Market orientation 5.26 (1.24) -0.25 - -0.56 - - 0.34 + -0.23 0 0.75 + + 0.001
C4: Guestsʼ satisfaction 5.48 (1.10) 0.65 + -1.11 - - 0.10 0 0.00 - 0.80 + + 0.000
C5: Quality of services 5.88 (0.98) 0.01 0 -0.97 - - -0.56 - 0.31 + 0.88 + + 0.000
C6: Segmentation 5.54 (1.26) -0.52 - -0.06 0 -1.63 - - 0.11 + 0.79 + + 0.000
C7: Employee management 5.21 (1.29) -0.37 - -0.97 - - 0.40 + -0.01 0 0.99 + + 0.000
C8: Flexibility 5.20 (1.23) -1.27 - - -0.34 0 -0.42 - 0.05 + 1.01 + + 0.000
C9: IT development 5.19 (1.23) -1.52 - - -0.63 - -0.02 0 0.24 + 1.08 + + 0.000
ROA (%) 1.36 (48,06) -5.34 0 -6.15 - 25.41 + + -9.01 - - 12.88 + 0.518
ROE (%) 7.78 (22.13) -7.68 - - 1.61 - 28.93 + + 6.91 0 14.41 + 0.045
GOP* (%) 39.09 (25.68) 49.09 + + 36.70 0 35.28 - 46.79 + 31.42 - - 0.418
Revenue growth (%) 14.81 (32.18) 25.25 + + 4.85 - - 5.33 - 12.17 0 24.85 + 0.407
*Gross operating profit Note: Arithmetic mean and standard deviation shows the average value and the standard deviation for each defined component, measured between 1 (strongly disagree) and 7 (strongly agree). The means for clustering part show the average value for each component. Values are standardized, except in the bottom part of the table with performance indicators.

67
The smallest groups (group 3 and group 1) contain 6 and 7 companies from the group of total 60 companies that responded to the quantitative study. Because the minor subsamples represent only 10% and 11.7% of the total sample, we checked the groups and concluded that the smallest groups of companies are clearly distinctive, form important segments of tourism companies in the market and should therefore be explained separately. Companies from Group 1, consisting of seven firms, believe that the most important performance components are cooperation and guests’ satisfaction, while the least important components are Flexibility and IT development. Group 2, consisting of 16 firms, believes that location is the only important factor of hotel performance. Group 3 is the smallest group, consisting of only six firms. This group believes that market orientation and employee management are the two key components for success, while location, cooperation with tourist stakeholders, and guest’s segmentation are not very important. Group 4, consisting of 15 firms, does not really emphasizes any specific factor as being the most or the least important. For Group 5 (consisting of also 16 firms) the majority of components is very important, with the exception of Location. Since we are interested which of these groups of hotels operated most successfully, we compared four performance indicators between groups. The results reveal that only ROE exhibits statistically significant differences between groups (p=0.045). Based on ROE, we can rank clusters of hotels from the least to the most successful: Group 1, Group 2, Group 4, Group 5, and Group 3. Based on the results, we can conclude that hotels, which give attention only to location, cooperation and guestsʼ segmentation underperformed compared to the group of hotels that focus on market orientation, employee management, and quality of services. It needs to be said, however, that Group 1 had the highest GOP, but the average GOPs between five groups are very similar, so we cannot prove any statistical significance.
4.8 DISCUSSION
The results of descriptive analysis give us important insight into the evaluation of specific drivers of performance in hospitality from a manager’s perspective. The research offers the roadmap for practitioners discussing the drivers of performance in the hospitality industry. Our results indicate that tourism managers from Slovenia and Croatia believe that the main focus, in order to achieve financial success, is an overall focus on the guest. They ranked quality of services as first, clear segmentation of the guests as second, and guest’s satisfaction as the third most important driver of hotel performance. After that, managers suggest that hotel companies should focus on process development, databases, and new technologies to evoke the inner untouchable potential for further growth and success. Following those, orientation on the market and flexibility are necessary to enable companies to adapt to fast changing global environment, as well as to local market specifics, demographic, technological trends and new business models. Among the nine most important drivers, the last three are: employee management, physical location, and cooperation. The relatively low evaluation of employee management was a surprise, since most of hospitality professionals on both markets stress the need and importance of
68
employee management to foster the industry growth. Physical location is ranked in the 8th position of all nine drivers, possibly because management is aware that location is a predominate factor of success that cannot be changed. Skepticism of direct effect of cooperation on financial performance is shown through substantially lower evaluation of this driver in the eyes of hotel managers from Slovenia and Croatia. This indicates that hotel managers still strongly focus on their own resources as drivers of success. The results of the cluster analysis have shown that there are five groups of the companies in the sample. We have closely looked at the structure of each cluster and indicated five different development stories. Group 1 – Small private firms: This cluster is gathering small businesses that are in most of the cases privately-owned. Those are companies in their introduction or development phase of life cycle. In general those companies are still not well connected within the existing tourism networks, they are still focusing on its internal development and have limited resources to foster collaboration between the stakeholders. They have indicated that collaboration is a key to success and have evaluated it as highly important. This is interesting since the collaboration was overall evaluated as the least important. However, for this group of companies that are still new on the market, collaboration with other stakeholders is the key to success. This group of companies also rated guest satisfaction as an important driver of performance. This is logical, since those companies are still penetrating, and positioning on the market and high guest satisfaction are an important performance driver for them. In terms of performance, those companies have low ROA and ROE, but high growth of revenues and GOP. This is quite typical for small private companies. Group 2 – Unfinished transition: In this group are large companies or groups of companies that were left behind still having “a status quo” after several privatization processes during the transition. Even today, companies within this group do not have clear ownership structure and in most of the cases they have passive owners without any long-term development strategy. Most of the energy in this group of companies is oriented in solving the privatization and ownership issues. Management in those companies is focused to operational efficiency and has limited mandate to operate, manage, and develop those companies. In general, this group of companies is not market-oriented or flexible. Interestingly, managers in this group believe that location is the main driver of hotel performance, yet looking at the overall rating location was evaluated as 8th most important out of the nine performance drivers. The explanation for this might be the fact that those companies believe that the reason for their underperformance lies in not possessing the countryʼs prime locations. This is why they point out that location is the most valuable source of competitive advantage. Those companies have lower ROA and ROE, low revenue growth rate, and a relatively high GOP. Group 3 – Diversified portfolio: For companies in this group hotels are not the core business activity. Those are mainly small companies that get the majority of income from food and

69
beverage sales and lower share from accommodation sales. Their focus is on employees’ management and market orientation, that are considered as main drivers of success. Those companies are present longer on the market and consequently have a clear market position. Their financial performance is good with high ROA and ROE values. Group 4 – Privatized with poor market orientation. Companies in this group were privatized during the transition. Unfortunately, new owners lack the hospitality knowledge and show an inability to strategically position those companies on the market. The owners are more or less tactical investors with short-term investment, high-return logic. In most of the cases after privatization was finished, they did not invest further in hotel business development. This resulted (similarly as in the case of the second group of companies) in management inability to take full control and strategically manage those businesses. In general, those companies lack hospitality knowledge, do not have clear development strategies, and are not well-positioned on the market. The main drivers of success for those companies are location, service quality, and IT development. Companies in this group are overlooking the importance of knowledge, active role on the market, satisfaction of their guests, and the focus on their employees as a crucial role in success. Looking at the performance indicators, consequently this group of companies has low ROA and stable ROE, revenue growth, and GOP. Group 5 – Successfully privatized with clear vision: This is the most prosperous group of companies – true hoteliers in the region. Those are successfully privatized large system with active and strategic owners. They have invested in development of the product. They have clear market orientation and hospitality knowledge. For this group of companies besides location, all drivers of performance were evaluated as very important. In terms of financial performance, they have solid ROA and ROE, high growth, and lower GOP. The results are indicating that companies are investing heavily in market and employee development.
4.9 CONCLUSION
For decades, Academia has been trying to find sources of sustainable competitive advantages that would for a longer-term bring companies to the success. Hospitality research has extensively focused on this matter during the last 30 years, trying to explain drivers of performance from various research aspects. An extensive body of research has to be analyzed in order to offer short-list of potential drivers of longer-term performance. Practitioners on the contrary, expect clear and quick answers on what are the most important drivers of performance to focus on them almost immediately. Trying to answer this challenging question is not an easy task. Slovenia and Croatia have gone through significant development changes in the last 30 years. Hospitality companies in those two countries are still in various phases of development, and they are very different in their

70
ownership and organizational structures and performance results. This gives the research an additional and very important dimension. We have used three level of research in the overall research process. From the theory overview we have found 30 main drivers that could be the potential drivers of performance for hotel industry. Through the Delphi study, experts pointed out nine drivers that according to them are the ones that matter the most. In this paper, we have researched those nine drivers carefully and enriched the body of knowledge about their impact on performance. The final nine drivers of performance that were the input to the quantitative study in Slovenia and Croatia are: location, market orientation, quality of services, guests satisfaction, flexibility, cooperation, segmentation, IT development, and employee management. According to the theory acknowledgments and the experts’ opinions, we have established the proper measurement scales. We have tested the impact of these drives on performance through 64 statements on the sample of companies in two countries. The managers pointed out that according to them the drivers that focus on the customer (service quality, segmentation and customer satisfaction) overvalue the drivers that exploit the inner resources of the company (IT development and employee management) and the opportunities of the market (market orientation and flexibility). Location and cooperation were given lower scores, possibly because these are the drivers that cannot be controlled by a company’s management. The Cluster analysis showed five groups of companies that are considerably different in their perception of the importance of specific performance drivers: small private firms, unfinished transition, diversified portfolio, privatized with poor market orientation, and successfully privatized firms with a clear vision. Those groups of companies significantly differ in their evaluation of performance drivers and in their ownership and development specifics. Results in this paper are not completely aligned with the results from the Delphi study. The reason behind can lie in the difference of the sample structure. In Delphi study, representatives of academia and management participated in the research, while quantitative research included only representatives of management. The comparison of the results from both studies shows that respondents in Delphi study prioritized the impact of location and market orientation in front of service quality, guest’s satisfaction and segmentation. Managers in the quantitative study in this article evaluated customer-oriented drivers with the highest scores. Results indicate that hotel management looks at hotel performance from a shorter-term perspective and puts the customer into the core of the performance success. Academia follows different perspective and adds valuable to the research by emphasizing also drivers that are crucial on a longer run (location, market orientation etc). This paper addresses the performance as a complex phenomenon. It is offering future researchers a valuable agenda on how to evaluate performance drivers on different markets. It is also providing a valuable frame for transition economies and provides better understanding of how the market-specific characteristics impact hospitality performance.

71
This paper meets several limitations. Our results are limited to the case of only two markets. Although all companies under the same sector classification were included in the research, the respondent’s results indicate the problem of self-selection bias which is related to the problem of low response rate (especially in the case of Croatia). After many reminders, mainly the largest hotel companies in Croatia that manage the majority of hotels, responded. The final structure of the companies that responded, differs between the countries and therefore, the results cannot be generalized. The in-depth analysis of the key performance indicators within the sample of companies in the two countries shows the presence of outliers within the samples. The performance results of these companies could significantly affect the final results showing the relationship between the performance drivers and performance indicators. Very important limitation of this survey is also the size of the sample. To be able to confirm the differences in performance between the clusters and to confirm that the obtained drivers have an impact on actual performance, the size of the sample has to be substantially increased. Another very important limitation is the fact that data on the importance of the drivers is based on the self-evaluation by hotel managers. The structure of the hotel companies in two countries can very much differ according to the ownership and management structure, average size, star-rating, and the general development cycle that they are in. We can also conclude that the drivers are market-specific and conducting the research on the different markets could lead to different results.

72
GENERAL DISCUSSION
Extensive theoretical and empirical body of literature is researching the most important resources that can become sources of competitive advantage in general management literature and specifically in hospitality industry. In this dissertation, I question the same on the case of hospitality industry in two countries: Slovenia and Croatia. Theoretical papers in the field of hospitality approached this question from various aspects in the last 20 years. Most of the papers empirically tested the impact of one or a few specific resources on hotels performance and in most of the cases found a positive relation between the specific driver and the relevant performance measure. This dissertation approaches this challenge using a more holistic approach and aims to identify and rank many important performance drivers and to empirically test their impact on performance for hotel companies in Slovenia and Croatia. From an ambitious student’s point of view, it is a challenging task that promises, if challenge is resolved, an answer on a simple question that appears to anyone going through the wide theoretical body of research of all tested drivers on performance: “Which of these drivers are the most important and how do they impact performance in the hotel industry?" On a pathway of this research process, many dilemmas and limitations came forward that need to be clearly addressed and discussed. I have grouped these dilemmas and limitations around theoretical background and empirical challenges. RBT appeared as the best possible theoretical background supporting the base for definition of resources that can become a source of competitive advantage, and therefore have a potential to bring companies above normal performance results. During the research process, I have returned many times to RBT’s limitations criticized by various prominent authors that the theory is too static and does not absorb and fully explain the complexity of today’s market and environmental dynamics. When developing a list of the most researched resources in general and in hospitality industry, I have faced this challenge when the resources had to be grouped and explained. RBT in its later development phase deeply researched especially intangible assets and capabilities, but the firm explanatory ground for both groups and the clear line between them, was not easy to be drawn. Most of the studies tested intangible assets, while the deeper understanding and measurement of capabilities still present a challenge for researchers and practitioners. Through my research process, I had a wish to be able to more deeply address dynamic capabilities in hotel industry to better translate and include them into my research process. I strongly believe that definitions, conceptualization, and measurement scales for dynamic capabilities (such as learning, specialization, asset transformation) are a challenge for further research in the field. To obtain a list of the most important drivers according to the expert’s opinions, Delphi method was used. Delphi is an appropriate method to use in such case when the goal is to reduce the list of many drivers to the list of most important ones with the possibility to add and rebuilt the list
73
during the process. However, Delphi has many important limitations, the most important ones in this case are subjectivity and influence of the panel on the respondent’s opinions. Although a direct data observation does not reflect these limitations, the results obtained from Delphi do not align with the ranking results based on the descriptive statistics in chapter 4. The reason for this can lie in different aspects that practitioners and academia follow when they rank the importance of the specific drivers. Academia always takes into account a long-term time frame, taking into account also broader aspects and consequently suggests drivers that are different from business-oriented managerial members of the panel. On the third level of the research, we obtained the ranking only from managerial point of view and from this reason results did not match completely. When researching the studies that already tested specific drivers within hotel industry, I realized that the method most frequently used was exploratory factor analysis to explain and define the independent variables under study. To test one or a few independent variables on performance, the majority of studies used regression analysis. Although the latest studies also frequently used DEA and SF as methods that measured the efficiency using multiple inputs and outputs, the logical conclusion was, to employ similar methodology process also in my research process. I have used the most developed and tested scales and upgraded them with recent acknowledgments from the studies. Data generation assumed the self-evaluation that happens in one-point of time, while the performance results from balance sheets are average values of actual performance. This represents a clear limitation as well as the fact that self-reporting data poses limited value and can impact insignificant results of the study. In similar studies for the future, as much as possible objective data, where possible, should be used instead of self-reporting data. Up to today, not many studies used objective data that would provide performance drivers of higher validity. This represents an important guideline for the future research in the area. For the complex research process as in this case, special attention should be paid to the size and structure of the sample. In my case, the samples of hotel companies were not only of limited size, but the country samples very much differed also according to the structure of the companies that responded in each country. For the complex research process that tests many independent variables, the sample size should be increased and pre-checked for possible greater inherent differences. The structure of both sub-samples also differs, partly because the companies in Slovenia and Croatia are already very much different according to the restructuring and ownership process that they already went through. Additionally, the Croatian sub-sample consists mainly from all the biggest Croatian companies that almost all responded to my survey. These are branded companies that show much higher sales performance success and better ROA performance than Slovenian companies in the sub-sample. Slovenian companies on the contrary focus on business efficiency and consequently show better operational performance results. The differences in size and structure of the sample greatly impacted the final results of the research process.

74
In my case regression analysis did not provide valuable results because it was not a proper method to use on the obtained data set. Descriptive statistics and cluster analysis were used instead to provide the ranking of the drivers and explanations of the clusters (groups) of companies. Insignificant results and the fact that the study has been done only once and on the limited sample of Slovenian and Croatian companies imply that the final results from the study cannot be generalized. The final and the greatest of all dilemmas is whether complexity of the research process in this case pays off the efforts done when trying to answer on the research questions in this study. Would I use the same complex path with so many drivers and so many limitations, or would it be better to use fewer drivers in the research process? With fewer drivers, the in-depth analysis of the relationships between specific drivers is possible. This allows the possibility of modeling their relationships and easies the process of setting the clear hypothesis and tests. In fact, all the steps during the research process promise easiness and possibility for greater reliability of the final results. The insignificant results in the final stage of the research process of this study do bring a feeling of dissatisfaction with the work being done. However, this path is about learning and the advantages the learning process offers and the greatest benefits available only when the mistakes are being taught and learned. My main motivation and drive throughout all the stages of the research process was to holistically understand the performance drivers in the hospitality from the managerial perspective. This goal is achieved. My research provides ranking of the main performance drivers in hospitality industry in Slovenia and Croatia from managerial perspective. From this point of view, this research is a stepping-stone for further research in the area going into detail analysis of the specific drivers, their interrelations and measurement methods.

75
CONCLUSION
This chapter summarizes the most important findings of the dissertation and offers an overview of the main theoretical and practical contributions.
THE MAIN FINDINGS OF THE DISSERTATION
With the grounds in the Resource-based theory, Chapter 1 focuses on the challenge of describing the various types of resources within a company that have a possibility to become sources of a long term competitive advantage. It analyses past studies and explains that in the early stage, the Resource-based theory focused mainly on the clarification of the concepts of resources while in later studies it researches specific types of resources from three specific points of view: mainstream research (that focuses on clarifying the conceptual and measurement issues), knowledge-based view (that analyses HRM practices, company policies, employee and management skills, intellectual and social capital, etc.); natural-based view (that explores environmental policies, social responsibility practices, attitudes towards protection of the environment, etc.) and dynamic capabilities-based view (as are market orientation, innovation capacity, abilities to avoid strategic drift, flexibility). This chapter in the second part focuses on the assets and capabilities within the hospitality industry and studies their impact on the performance. It studies the extensive body of research from the field of hospitality and classifies the independent concepts used into three groups: tangible assets, intangible assets and capabilities and at the same time presents dependent variable(s) as key performance measures used in these studies. The study explains the evolvement of empirical testings chronologically and points out that most of the studies tested the impact of a single or a few specific resources on performance. The studies mainly researched the impact of intangible assets (organisational, relational, reputational, ICT, social capital, environmental policies, etc.) and capabilities (market orientation, flexibility, responsiveness, etc.) on hotel performance, while tangible assets were usually neglected. The final result of the research presented in Chapter 1 is a well-structured list of various tangible assets, intangible assets and capabilities in hospitality industry tested in empirical research with explained impact on the performance. Results present framework of resources that have a potential to become sources of competitive advantage in hospitality industry. As such they represent the valuable input for the future research in hospitality performance literature. Building on the extensive overview and reflection of theory, Chapter 2 focuses on empirical testing of various performance drivers and tries to answer the question: which of them are the most relevant in hospitality industry? An extensive literature overview in chapter 1 led us to identification of 30 major drivers of hotel performance that attracted most of the academia

76
research attention. Those drivers are classified as tangible assets, intangible assets and capabilities. To determine which of the drivers have the strongest impact on the performance, qualitative research based on Delphi method was employed. The hospitality experts evaluated drivers of performance in hospitality within three round Delphi study. Results show that most important drivers of performance, regarding experts’ opinions are (ranked according to the importance): location, market orientation, customer satisfaction, product development, service quality, flexibility, business processes, employee competencies and cooperation. The main contribution of the chapter is the classification of relevant performance drivers in line with their importance for practitioners in hospitality industry. From the theoretical point of view, the contribution of this chapter is identifying and ranking of performance drivers according to their importance. Some of the drivers recognised by experts were not tested in literature before. Therefore, this paper is also pointing on possible gaps and directing the potential fields of future research. Chapter 4 aims to analyse what the main performance drivers in post-transitional economies on the case of Slovenia and Croatia are. This chapter develops the scale measurement for all nine key drives identified in chapter 2. The scales are developed using and up-grading the existing instruments proposed and previously used in hospitality literature. All in total nine drivers of performance are described with 64 statements. Quantitative research is performed on the sample of hotel companies’ top management in Slovenia and Croatia. Data on hotel performance for the period 2013 – 2016 are collected from publicly available sources – balance sheets data – in both countries. Altogether 60 hotel companies that manage 228 hotels in two countries responded. Data received within the quantitative data analysis is analysed using descriptive statistical analysis and cluster analysis. Results of the descriptive statistical analysis show that managers evaluated service quality as the most important performance driver in hospitality. The second most important driver is clear segmentation of the hotel’s guests, while the third driver according to the importance on performance in the opinions of hotel managers in Slovenia and Croatia is guest’s satisfaction. The results indicate that managers believe that strong focus on costumers is the key to success in hospitality industry in Slovenia and Croatia. Further, managers suggest that hotel companies should focus on IT development that combines process development, databases management and new technologies implementation in order to improve the company’s inner organization and knowledge and subsequently performance. Market orientation and flexibilities are the two drivers that received the fifth and the sixth position according to managers’ evaluation of importance on performance. Among the nine drivers, the last three drivers are employee management, location and cooperation with other stakeholders. Results of cluster analysis classify companies in five clusters according to managers’ evaluation of drivers’ impact on performance. Those five groups are quite different in terms of the development stage, ownership and transition status. Those five groups of clusters are: small private firms, unfinished transition, diversified portfolio, privatized with poor market orientation,

77
and successfully privatized firms with a clear vision. Those groups of companies significantly differ in their evaluation of performance drivers and in their ownership and development specifics. Results of this chapter indicate that performance is a complex phenomenon. Drivers of performance significantly differ in company type, size, management or ownerships structure. For small companies the most important performance drivers are collaboration with other stakeholders and guests’ satisfactions. For companies that are still in privatization process location is rated as the most important performance driver, while managers in the companies that were successfully privatized evaluate all (nine) performance drivers as important. This is offering future researchers a valuable agenda on how to evaluate performance drivers on different markets. It is also providing a valuable frame for transition economies and provides better understanding of how the market-specific characteristics impact hospitality performance.

78
REFERENCE LIST
Aboelmaged, M. (2018). Direct and indirect effects of eco-innovation, environmental orientation and supplier collaboration on hotel performance: An empirical study. Journal of cleaner production, 184, 537−549.
Ahmad, R., Solnet, D., & Scott, N. (2010). Human Resource Practices System Differentiation: A
Hotel Industry Study. Journal of Hospitality and Tourism Management, 17(1), 72–82. Al-Refaie, A. (2015). Effects of Human Resource Management on Hotel Performance using
Structural Equation Modeling. Computers in Human Behavior, 43, 293–303. Amit, R., & Schoemaker, P. J. (1993). Strategic assets and organizational rent. Strategic
management journal, 14(1), 33–46. Andersen, O., & Kheam, L.S. (1998). Resource-based Theory and International Growth
Strategies: An Explanatory Study. International Business Review, 7(2), 163–184. Andrews, K. R. (1997). The Concept of Corporate Strategy: Resources, Firms and Strategies: A
reader in the Resource-based Perspective. Oxford University Press, UK. Armstrong, C.E. & Shimizu, K. (2007). A Review of Approaches to Empirical Research on the
Resource-Based View of the Firm, Journal of management, 33(6), pp. 959-986. Asree, S., Zain, M., & Rizal Razalli, M. (2010). Influence of Leadership Competency and
Organizational Culture on Responsiveness and Performance of Firms. International Journal of Contemporary Hospitality Management, 22(4), 500–516.
Assaf, A. G., & Agbola, F. W. (2011). Modelling the performance of Australian hotels: a DEA
double bootstrap approach. Tourism Economics, 17(1), 73−89. Assaf, A. G., Barros, C. P., & Dieke, P. U. (2011). Portuguese Tour Operators: A Fight for
Survival. Journal of Air Transport Management, 17(3), 155–157. Assaf, A., Barros, C. P., & Josiassen, A. (2012). Hotel Efficiency: A Bootstrapped Metafrontier
Approach. International Journal of Hospitality Management, 31(2), 621–629. Assaf, A., & Cvelbar, K. L. (2011). Privatization, Market Competition, International
Attractiveness, Management Tenure and Hotel Performance: Evidence from Slovenia. International Journal of Hospitality Management, 30(2), 391–397.

79
Assaf, A. G., Josiassen, A., & Cvelbar, L. K. (2012). Does Triple Bottom Line Reporting Improve Hotel Performance? International Journal of Hospitality Management, 31(2), 596–600.
Assaf, A. G., Josiassen, A., Cvelbar, L. K., & Woo, L. (2015). The Effects of Customer Voice on
Hotel Performance. International Journal of Hospitality Management, 44, 77–83. Assaf, A. G., & Magnini, V. (2012). Accounting for Customer Satisfaction in Measuring Hotel
Efficiency: Evidence from the US Hotel Industry. International Journal of Hospitality Management, 31(3), 642–647.
Awang, Z. (2011). A handbook on SEM: Structural equation modelling. Kelantan: Universiti
Teknologi MARA. Barney, J.B. (1986). Organizational Culture: Can it be a Source of Sustained Competitive
Advantage? Academy of Management Review, 11(3), pp. 656-665. Barney, J. (1991). Firm Resources and Sustained Competitive Advantage. Journal of
management, 17(1), 99–120. Barney, J.B. (2001). Resource-based Theories of Competitive Advantage: A ten-year
Retrospective on the Resource-based View. Journal of Management, 27(6), pp. 643-650. Barney, J.B., & Ketchen, D.J. & Wright, M. (2011). The Future of Resource-based Theory
Revitalization or Decline? Journal of Management, 37(5), pp. 1299-1315. Barros, C. P., & Dieke, P. U. (2008). Technical Efficiency of African Hotels. International Journal
of Hospitality Management, 27(3), 438–447. Bauer, M.W. (2000). Classical Content Analysis: A review. Qualitative researching with text,
image and sound, pp. 131-151. Benavides–Velasco, C. A., Quintana-García, C., & Marchante-Lara, M. (2014). Total Quality
Management, Corporate Social Responsibility and Performance in the Hotel Industry. International Journal of Hospitality Management, 41, 77–87.
Berelson, B. (1952). Content Analysis in Communication Research. The Free Press, pp. 220. Bolfing, C. P., & Cadotte, E. R. (2015). How Useful are Customer Satisfaction Processes for
Hotel Industry Positioning Strategies?. In Proceedings of the 1988 Academy of Marketing Science (AMS) Annual Conference (pp. 82−86). Springer, Cham.
Božič, V., & Knežević Cvelbar, L. (2016). Resources and Capabilities Driving Performance in the
Hotel Industry. Tourism and Hospitality Management, 22(2), 225–246.

80
Božič, V., & Knežević Cvelbar, L. (2018). What Really Defines Performance in the Hotel Industry? Managersʼ Perspective Using the Delphi Method. European Business Review – In press.
Brady, P. J., & Conlin, M. E. (2004). The Performance of REIT-owned Properties and the Impact
of REIT Market Power. The Journal of Real Estate Finance and Economics, 28(1), 81–95.
Castanias, R.P., & Helfat, C. E. (1991). Managerial Resources and Rents. Journal of Management,
17(1), 155–171. Chand, M. (2010). The Impact of HRM Practices on Service Quality, Customer Satisfaction and
Performance in the Indian Hotel Industry. The International Journal of Human Resource Management, 21(4), 551–566.
Chand, M., & Katou, A. A. (2007). The Impact of HRM Practices on Organisational
Performance in the Indian Hotel Industry. Employee Relations, 29(6), 576–594. Chen, J. H., & Wu, S. I. (2016). The impact of customer relationship management and internal
marketing on business performance: a comparison of lodging industries. Total Quality Management & Business Excellence, 27(1−2), 17−33.
Chi, C. G., & Gursoy, D. (2009). Employee Satisfaction, Customer Satisfaction, and Financial
Performance: An Empirical Examination. International Journal of Hospitality Management, 28(2), 245–253.
Cho, S., Woods, R. H., Jang, S. S., & Erdem, M. (2006). Measuring the Impact of Human
Resource Management Practices on Hospitality Firmsʼ Performances. International Journal of Hospitality Management, 25(2), 262–277.
Chu, R. K., & Choi, T. (2000). An Importance–Performance Analysis of Hotel Selection Factors
in the Hong Kong Hotel Industry: A Comparison of Business and Leisure Travellers. Tourism management, 21(4), 363–377.
Chung-Herrera, B. G., Enz, C. A., & Lankau, M. J. (2003). Grooming Future Hospitality Leaders:
A Competencies Model. The Cornell Hotel and Restaurant Administration Quarterly, 44(3), 17–25.
Claver, E., José Tarí, J., & Pereira, J. (2006). Does Quality Impact on Hotel Performance?
International Journal of Contemporary Hospitality Management, 18(4), 350–358.

81
Claver-Cortés, E., Molina-Azorín, J. F., & Pereira-Moliner, J. (2007). The Impact of Strategic Behaviours on Hotel Performance. International Journal of Contemporary Hospitality Management, 19(1), 6-20.
Claver-Cortés, E., Pereira-Moliner, J., José Tarí, J., & Molina-Azorín, J. F. (2008). TQM,
Managerial Factors and Performance in the Spanish Hotel Industry. Industrial Management & Data Systems, 108(2), 228–244.
Coff, R.W. (1999). When Competitive Advantage Doesn't Lead to Performance: The
Resource-based View and Stakeholder Bargaining Power. Organization Science, 10(2), pp. 119-133.
Coff, R. & Kryscynski, D. (2011). Drilling for Micro-foundations of Human Capital–based
Competitive Advantages. Journal of Management, 73, pp. 1429-1443. Cohen, J. F., & Olsen, K. (2013). The Impacts of Complementary Information Technology
Resources on the Service-profit Chain and Competitive Performance of South African hospitality firms. International journal of hospitality management, 34, 245–254.
Collins, D. J. (1994). Research Note: How Valuable are Organizational Capabilities? Strategic
Management Journal, 15(S1), 143–152. Conner, K.R. (1991). A Historical Comparison of Resource-based Theory and Five Schools of
Thought Within Industrial Organization Economics: Do we have a New Theory of the Firm? Journal of Management, 17(1), pp. 121-154.
Crook, T.R., Ketchen, D.J., Combs, J.G. & Todd, S.Y. (2008). Strategic Resources and
Performance: a Meta-analysis. Strategic Management Journal, 29(11), pp. 1141-1154. Cvelbar, L.K., Dwyer, L., Koman, M. & Mihalič, T. (2015). Drivers of Destination
Competitiveness in Tourism A Global Investigation. Journal of Travel Research, pp. 1-10
Dai, W. D., Mao, Z. E., Zhao, X. R., & Mattila, A. S. (2015). How does Social Capital Influence
the Hospitality Firmʼs Financial Performance? The moderating role of entrepreneurial activities. International Journal of Hospitality Management, 51, 42–55.
De Grosbois, D. (2012). Corporate Social Responsibility Reporting by the Global Hotel Industry:
Commitment, Initiatives and Performance. International Journal of Hospitality Management, 31(3), 896–905.
Delbecq, A., Van de Ven, A., Gustafson, D., & Foresman, S. (1975). The delphi technique.
Group Techniques for Program Planning: A Guide to Nominal Group and Delphi Processes. Madison, Wis: Scott Foresman, 83−107.

82
Dierickx, I. & Cool, K. (1989). Asset Stock Accumulation and Sustainability of Competitive Advantage. Management Science, 35(12), pp.1504-1511.
Dolnicar, S., & Otter, T. (2003). Which Hotel Attributes Matter? A Review of Previous and a
Framework for Future Research. Dyer, J.H. & Singh, H. (1998). The Relational View: Cooperative Strategy and Sources of
Interorganizational Competitive Advantage. Academy of Management Review, 23(4), pp. 660-679.
Dwyer, L., Cvelbar, L. K., Edwards, D., & Mihalic, T. (2012). Fashioning a Destination Tourism
Future: The Case of Slovenia. Tourism Management, 33(2), 305–316. Eisenhardt, K.M. & Martin, J.A. (2000). Dynamic capabilities: what are they?. Strategic
Management Journal, 21(10-11), pp. 1105-1121. Field, A. (2009). Discovering Statistics using SPSS. Sage publications. Fiol, C.M. (1991). Managing Culture as a Competitive Resource: An Identity-based View of
Sustainable Competitive Advantage. Journal of Management, 17(1), pp. 191-211. Fu, H., Ye, B. H., & Law, R. (2014). You Do Well and I Do Well? The Behavioral Consequences of
Corporate Social Responsibility. International Journal of Hospitality Management, 40, 62–70.
Foss, N.J. (1997). Resources, firms, and strategies: a reader in the resource-based perspective,
Oxford University Press on Demand. Foss, N.J. (2011). Invited editorial: Why micro-foundations for resource-based theory are needed
and what they may look like. Journal of Management, 37(5), pp. 1413-1428. Franklin, K. K., & Hart, J. K. (2007). Idea generation and exploration: Benefits and limitations
of the policy Delphi research method. Innovative Higher Education, 31(4), 237−246. Garay, L., & Font, X. (2012). Doing Good to Do Well? Corporate Social Responsibility Reasons,
Practices and Impacts in Small and Medium Accommodation Enterprises. International Journal of Hospitality Management, 31(2), 329–337.
Garbuio, M., King, A.W. & Lovallo, D. (2011). Looking Inside Psychological Influences on
Structuring a Firm’s Portfolio of Resources. Journal of Management, 37(5), pp. 1444-1463.
Grant, R.M. (1996). Toward a Knowledge-based Theory of the Firm. Strategic Management
Journal, 17(S2), 109–122.

83
Gray, B. J., Matear, S. M., & Matheson, P. K. (2000). Improving the Performance of Hospitality Firms. International Journal of Contemporary Hospitality Management, 12(3), 149–155.
Hall, R. (1992). The Strategic Analysis of Intangible Resources. Strategic management journal,
13(2), 135–144. Harrington, D., & Akehurst, G. (1996). Service Quality and Business Performance in the UK
Hotel Industry. International Journal of Hospitality Management, 15(3), 283–298. Hart, S.L. (1995). A Natural-resource-based View of the Firm. Academy of Management Review,
20(4), pp. 986-1014. Hart, S.L. & Dowell, G. (2010). A Natural-resource-based View of the Firm: Fifteen years after.
Journal of Management, 37, pp. 1464-1479. Helfat, C.E. & Martin, J.A. (2014). Dynamic Managerial Capabilities Review and Assessment of
Managerial Impact on Strategic Change. Journal of Management, 41(5), pp. 1281-312. Helfat, C. E., & Winter, S. G. (2011). Untangling Dynamic and Operational Capabilities:
Strategy for the (N) Ever‐Changing World. Strategic Management Journal, 32(11), 1243–1250.
Hernández-Perlines, F. (2016). Entrepreneurial Orientation in the Hotel Industry: Multi-Group
Analysis of Quality Certification. Journal of Business Research, 69(10), 4714–4724. Hoque, K. (1999). Human Resource Management and Performance in the UK Hotel Industry.
British Journal of Industrial Relations, 37(3), 419–443. Hu, M. L. M., Horng, J. S., & Sun, Y. H. C. (2009). Hospitality Teams: Knowledge Sharing and
Service Innovation Performance. Tourism management, 30(1), 41–50. Hussain, K., Konar, R., & Ali, F. (2016). Measuring Service Innovation Performance through
Team Culture and Knowledge Sharing Behaviour in Hotel Services: A PLS Approach. Procedia–Social and Behavioral Sciences, 224, 35–43.
Hwang, S. N., & Chang, T. Y. (2003). Using data envelopment analysis to measure hotel
managerial efficiency change in Taiwan. Tourism management, 24(4), 357−369. Jarboui, S., Guetat, H., & Boujelbène, Y. (2015). Evaluation of Hotels Performance and
Corporate Governance Mechanisms: Empirical Evidence from the Tunisian Context. Journal of Hospitality and Tourism Management, 25, 30–37.

84
Jeou–Shyan, H., Hsuan, H., Chih-Hsing, L., Lin, L., & Chang-Yen, T. (2011). Competency Analysis of Top Managers in the Taiwanese Hotel Industry. International Journal of Hospitality Management, 30(4), 1044–1054.
Jogaratnam, G., & Ching-Yick Tse, E. (2006). Entrepreneurial Orientation and the Structuring of
Organizations: Performance Evidence from the Asian Hotel Industry. International Journal of Contemporary Hospitality Management, 18(6), 454–468.
Josiassen, A., Assaf, A. G., & Cvelbar, L. K. (2014). CRM and the bottom line: Do All CRM
Dimensions Affect Firm Performance?. International Journal of Hospitality Management, 36, 130–136.
Kandampully, J., & Suhartanto, D. (2000). Customer Loyalty in the Hotel Industry: The Role of
Customer Satisfaction and Image. International Journal of Contemporary Hospitality Management, 12(6), 346–351.
Kang, K. H., Lee, S., & Huh, C. (2010). Impacts of Positive and Negative Corporate Social
Responsibility Activities on Company Performance in the Hospitality Industry. International Journal of Hospitality Management, 29(1), 72–82.
Kay, C., & Russette, J. (2000). Hospitality Management Competencies: Identifying Managersʼ
Essential Skills. The Cornell Hotel and Restaurant Administration Quarterly, 41(2), 52–63.
Kemp, S., & Dwyer, L. (2001). An Examination of Organisational Culture—The Regent Hotel,
Sydney. International Journal of Hospitality Management, 20(1), 77–93. Kim, H. B., & Kim, W. G. (2005). The Relationship between Brand Equity and Firmsʼ
Performance in Luxury Hotels and Chain Restaurants. Tourism Management, 26(4), 549–560.
Kim, W. G., & Brymer, R. A. (2011). The Effects of Ethical Leadership on Manager Job
Satisfaction, Commitment, Behavioural Outcomes, and Firm Performance. International Journal of Hospitality Management, 30(4), 1020–1026.
Kim, T. T., Kim, W. G., Park, S. S. S., Lee, G., & Jee, B. (2012). Intellectual Capital and
Business Performance: What Structural Relationships Do They Have in Upper-Upscale Hotels? International Journal of Tourism Research, 14(4), 391–408.
Kim, M., Vogt, C. A., & Knutson, B. J. (2015). Relationships among Customer Satisfaction,
Delight, and Loyalty in the Hospitality Industry. Journal of Hospitality & Tourism Research, 39(2), 170–197.

85
Kim, W. G., Cho, M., & Brymer, R. A. (2013). Determinants Affecting Comprehensive Property–Level Hotel Performance: The Moderating Role of Hotel Type. International Journal of Hospitality Management, 34, 404–412.
Kim, W. G., & Brymer, R. A. (2011). The Effects of Ethical Leadership on Manager Job
Satisfaction, Commitment, Behavioral Outcomes, and Firm Performance. International Journal of Hospitality Management, 30(4), 1020–1026.
Knežević Cvelbar, L., & Mihalič, T. (2007). Ownership Structure as a Corporate Governance
Mechanism in Slovenian Hotels. Privredna kretanja i ekonomska politika, 17(112), 26–51.
Knox, A., & Walsh, J. (2005). Organisational flexibility and HRM in the hotel industry: evidence from Australia. Human Resource Management Journal, 15(1), 57−75.
Kogut, B. & Zander, U. (1992). Knowledge of the firm, Combinative Capabilities, and the
Replication of Technology. Organization Science, 3(3), pp. 383-397. Kohli, A. K., Jaworski, B. J., & Kumar, A. (1993). MARKOR: A Measure of Market Orientation.
Journal of Marketing research, 467–477. Kraaijenbrink, J., Spender, J.C. & Groen, A.J. (2010). The Resource-based view: A Review and
Assessment of its Critiques. Journal of Management, 36(1), pp. 349-372. Kucukusta, D., Mak, A., & Chan, X. (2013). Corporate Social responsibility Practices in Four
and Five–star Hotels: Perspectives from Hong Kong Visitors. International Journal of Hospitality Management, 34, 19–30.
Lado, A.A., Boyd, N.G. & Wright, P. (1992). A Competency-based Model of Sustainable
Competitive Advantage: Toward a conceptual integration. Journal of Management, 18(1), pp. 77-91.
Lado-Sestayo, R., Otero-González, L., Vivel-Búa, M., & Martorell-Cunill, O. (2016). Impact of
Location on Profitability in the Spanish Hotel Sector. Tourism Management, 52, 405–415.
Lang, G. (1994). Quartäre vegetationsgeschichte Europas: methoden und ergebnisse. Leonidou, L. C., Leonidou, C. N., Fotiadis, T. A., & Zeriti, A. (2013). Resources and Capabilities
as Drivers of Hotel Environmental Marketing Strategy: Implications for Competitive Advantage and Performance. Tourism Management, 35, 94–110.
Lin, Y. & Wu, L.Y. (2014). Exploring the role of Dynamic Capabilities in Firm Performance
Under the Resource-based View Framework. Journal of Business Research, 67(3), pp. 407-413.

86
Linstone, H. A., & Turoff, M. (Eds.). (1975). The delphi method (pp. 3−12). Reading, MA: Addison-Wesley.
Lippman, S.A. & Rumelt, R.P. (1982). Uncertain Imitability: An analysis of Interfirm
Differences in Efficiency under Competition. The Bell Journal of Economics, pp. 418-438.
Makadok, R. (2001). Toward a Synthesis of the Resource-based and Dynamic Capability Views
of Rent Creation. Strategic Management Journal, 22(5), pp. 387-401. Marcoz, E. M., Mauri, C., Maggioni, I., & Cantù, C. (2016). Benefits from service bundling in
destination branding: The role of trust in enhancing cooperation among operators in the hospitality industry. International Journal of Tourism Research, 18(3), 260−268.
Maritan, C.A. & Peteraf, M.A. (2010). Building a Bridge Between Resource Acquisition and
Resource Accumulation. Journal of Management, 37(5), pp. 1374-89. Matear, S., Osborne, P., Garrett, T., & Gray, B. J. (2002). How does Market Orientation
Contribute to Service Firm Performance? An examination of alternative mechanisms. European Journal of Marketing, 36(9/10), 1058–1075.
McKenna, H. P. (1994). The Delphi technique: A Worthwhile Research Approach for Nursing?.
Journal of advanced nursing, 19(6), 1221–1225.
McWilliams, A. & Siegel, D.S. (2010). Creating and Capturing Value: Strategic Corporate Social Responsibility, Resource-based theory, and Sustainable Competitive Advantage. Journal of Management, 37, pp. 1480-1495.
Melián–González, S., & Bulchand-Gidumal, J. (2016). A Model that Connects Information
Technology and Hotel Performance. Tourism Management, 53, 30–37. Mihalic, T., & Buhalis, D. (2013). ICT as a New Competitive Advantage Factor-Case of Small
Transitional Hotel Sector. Economic and Business Review for Central and South-Eastern Europe, 15(1), 33.
Mihalič, T., Garbin Praničević, D., & Arnerić, J. (2015). The Changing Role of ICT
Competitiveness: The Case of the Slovenian Hotel Sector. Ekonomska istraživanja, 28(1), 367–383.
Miller, D. & Shamsie, J. (1996). The Resource-based view of the Firm in two Environments: The
Hollywood film studios from 1936 to 1965. Academy of Management Journal, 39(3), pp. 519-543.
Mody, M. A., Suess, C., & Lehto, X. (2017). The accommodation experiencescape: a
comparative assessment of hotels and Airbnb. International Journal of Contemporary Hospitality Management, 29(9), 2377−2404.
87
Molina-Azorín, J. F., Claver-Cortés, E., Pereira-Moliner, J., & Tarí, J. J. (2009). Environmental Practices and Firm Performance: An Empirical Analysis in the Spanish Hotel Industry. Journal of Cleaner Production, 17(5), 516–524.
Molina-Azorín, J. F., Tarí, J. J., Pereira-Moliner, J., López-Gamero, M. D., & Pertusa-Ortega, E.
M. (2015). The Effects of Quality and Environmental Management on Competitive Advantage: A Mixed Methods Study in the Hotel Industry. Tourism Management, 50, 41–54.
Molloy, J.C., Chadwick, C., Ployhart, R.E. & Golden, S.J. (2011). Making Intangibles “Tangible”
in Tests of Resource-Based Theory A Multidisciplinary Construct Validation Approach. Journal of Management, 37(5), pp. 1496-1518.
Naseem, A., Sheikh, S. E., & Malik, K. P. (2011). Impact of Employee Satisfaction on Success of
Organization: Relation between Customer Experience and Employee Satisfaction. International journal of multidisciplinary sciences and engineering, 2(5), 41–46
Nieves, J., Quintana, A., & Osorio, J. (2014). Knowledge-based Resources and Innovation in the
Hotel Industry. International Journal of Hospitality Management, 38, 65–73. Oliver, C. (1997). Sustainable Competitive Advantage: Combining Institutional and
Resource-based Views. Strategic Management Journal, 18(9), pp. 697-713. Oltean, F. D., Gabor, M. R., & Conţiu, L. C. (2014). Relation between Information Technology
and Performance: An Empirical Study Concerning the Hotel Industry in Mures County. Procedia Economics and Finance, 15, 1535–1542.
OʼNeill, J. W., & Carlbäck, M. (2011). Do Brands Matter? A Comparison of Branded and
Independent Hotelsʼ Performance during a Full Economic Cycle. International Journal of Hospitality Management, 30(3), 515–521.
Øgaard, T., Marnburg, E., & Larsen, S. (2008). Perceptions of Organizational Structure in the
Hospitality Industry: Consequences for Commitment, Job Satisfaction and Perceived Performance. Tourism Management, 29(4), 661–671.
Peiró-Signes, A., Segarra-Oña, M., Verma, R., & Miret-Pastor, L. (2018). Where Should I
Locate My Hotel? An In-Depth Analysis of the Cluster Effect on Hotel Performance. In Agglomeration and Firm Performance (pp. 95−122). Springer, Cham.
Peiró-Signes, A., Segarra-Oña, M. D. V., Miret-Pastor, L., & Verma, R. (2015). The effect of
tourism clusters on US hotel performance. Cornell Hospitality Quarterly, 56(2), 155−167.
Penrose, E.T. (1959). The Theory of the Growth of the Firm. Basil Blackwell and Mott Ltd.,
Great Britain.

88
Pereira-Moliner, J., Claver-Cortés, E., Molina-Azorín, J. F., & Tarí, J. J. (2012). Quality
Management, Environmental Management and Firm Performance: Direct and Mediating Effects in the Hotel Industry. Journal of Cleaner Production, 37, 82–92.
Peteraf, M.A. (1993). The Cornerstones of Competitive Advantage: A Resource-based view.
Strategic Management Journal, 14(3), pp. 179-191. Porter, M. E. (1991). Towards a dynamic theory of strategy. Strategic management journal,
12(S2), 95−117. Prasad, K., & Dev, C. S. (2000). Managing Hotel Brand Equity: A Customer-Centric Framework
for Assessing Performance. The Cornell Hotel and Restaurant Administration Quarterly, 41(3), 224–31.
Ray, G., Barney, J.B. & Muhanna, W.A. (2004). Capabilities, Business Processes, and
Competitive Advantage: Choosing the Dependent Variable in Empirical Tests of the Resource-based view. Strategic Management Journal, 25(1), pp. 23-37.
Rudež, H. N., & Mihalič, T. (2007). Intellectual Capital in the Hotel Industry: A Case Study from
Slovenia. International Journal of Hospitality Management, 26(1), 188–199. Ružić, M. D. (2015). Direct and Indirect Contribution of HRM Practice to Hotel Company
Performance. International Journal of Hospitality Management, 49, 56–65. Sharpley, R., & Forster, G. (2003). The Implications of Hotel Employee Attitudes for the
Development of Quality Tourism: The Case of Cyprus. Tourism Management, 24(6), 687–697.
Sirirak, S., Islam, N., & Ba Khang, D. (2011). Does ICT Adoption Enhance Hotel Performance?
Journal of Hospitality and Tourism Technology, 2(1), 34–49. Sirmon, D.G., Hitt, M.A. & Ireland, R.D. (2007). Managing firm Resources in Dynamic
Environments to Create Value: Looking inside the Black Box. Academy of Management Review, 32(1), pp. 273-292.
Slater, S.F. (1997). Developing a Customer Value-based Theory of the Firm. Journal of the
Academy of Marketing Science, 25(2), pp. 162-167. Sørensen, J. B. (2002). The Strength of Corporate Culture and the Reliability of Firm
Performance. Administrative science quarterly, 47(1), 70–91. Srivastava, A., Bartol, K. M., & Locke, E. A. (2006). Empowering Leadership in Management
Teams: Effects on Knowledge Sharing, Efficacy, and Performance. Academy of Management Journal, 49(6), 1239–1251.
89
Stalk, G., Evans, P., & Shulman, L. E. (1992). Competing on capabilities: The new rules of
corporate strategy. Harvard business review, 70(2), 57−69. Statistical Office of Republic of Slovenia [SORS]. (2017). Annual Report 2016, 2017. Statistical Office of Republic of Croatia [SORC]. (2017). Tourism Statistics, 2016, 2017. Stewart, J. (2001). Is the Delphi technique a qualitative method?. Medical education, 35(10),
922. Sun, K. A., & Kim, D. Y. (2013). Does Customer Satisfaction Increase Firm Performance? An
Application of the American Customer Satisfaction Index (ACSI). International Journal of Hospitality Management, 35, 68–77.
Taegoo, T. K., Gyehee, L., Soyon, P., & Seunggil, L. (2013). Social Capital, Knowledge Sharing
and Organizational Performance. International Journal of Contemporary Hospitality Management, 25(5), 683–704.
Tarí, J. J., Claver-Cortés, E., Pereira-Moliner, J., & Molina-Azorín, J. F. (2010). Levels of
Quality and Environmental Management in the Hotel Industry: Their Joint Influence on Firm Performance. International Journal of Hospitality Management, 29(3), 500–510.
Tavitiyaman, P., Qiu Zhang, H., & Qu, H. (2012). The Effect of Competitive Strategies and
Organizational Structure on Hotel Performance. International Journal of Contemporary Hospitality Management, 24(1), 140–159.
Terry Kim, T., Lee, G., Paek, S., & Lee, S. (2013). Social Capital, Knowledge Sharing and
Organizational Performance: What Structural Relationship Do They Have in Hotels? International Journal of Contemporary Hospitality Management, 25(5), 683–704.
Teece, D. J. (2007). Explicating Dynamic Capabilities: The Nature and Microfoundations of
(Sustainable) Enterprise Performance. Strategic Management Journal, 28(13), 1319–1350.
Teece, D. J., Pisano, G., & Shuen, A. (1997). Dynamic Capabilities and Strategic Management.
Strategic Management Journal, 18(7), 509–533. Terry Kim, T., Lee, G., Paek, S., & Lee, S. (2013). Social Capital, Knowledge Sharing and
Organizational Performance: What Structural Relationship Do They Have in Hotels? International Journal of Contemporary Hospitality Management, 25(5), 683–704.

90
Úbeda-García, M., Claver-Cortés, E., Marco-Lajara, B., & Zaragoza-Sáez, P. (2017). Human resource flexibility and performance in the hotel industry: The role of organizational ambidexterity. Personnel Review, 46(4), 824−846.
Uhl, N. P. (1983). Using the Delphi technique in institutional planning. New directions for
institutional research, 1983(37), 81−94. Vega-Vázquez, M., Cossío-Silva, F. J., & Revilla-Camacho, M. Á. (2016). Entrepreneurial
Orientation–Hotel Performance: Has Market Orientation Anything to Say? Journal of Business Research, 69(11), 5089–5094.
Wang, C. H., Chen, K. Y., & Chen, S. C. (2012). Total Quality Management, Market Orientation
and Hotel Performance: The Moderating Effects of External Environmental Factors. International Journal of Hospitality Management, 31(1), 119–129.
Wang, Y., & Krakover, S. (2008). Destination Marketing: Competition, Cooperation or
Coopetition?. International Journal of Contemporary Hospitality Management, 20(2), 126–141.
Wernerfelt, B. (1984). A Resource-based View of the Firm. Strategic Management Journal, 5(2),
pp. 171-180. Wilden, R., Gudergan, S.P., Nielsen, B.B. & Lings, I. (2013). Dynamic Capabilities and Performance: Strategy, Structure and Environment. Long Range Planning, 46(1), pp. 72-96 Wilkins, H., Merrilees, B., & Herington, C. (2007). Towards an Understanding of Total Service
Quality in Hotels. International Journal of Hospitality Management, 26(4), 840–853. Winter, S. G. (2003). Understanding Dynamic Capabilities. Strategic Management Journal,
24(10), 991–995. Winter, S. G., & Nielson, R.R. (1982). An Evolutionary Theory of Economic Change, University
of Illinois at Urbana-Champaignʼs Academy for Entrepreneurial Leadership Historical Research Reference in Entrepreneurship.
World Travel and Tourism Council. (2018). Travel & Tourism Economic impact 2018, Croatia.
Available from: http://www.wttc.org/countries-2018/croatia; Accessed, June, 2018. World Travel and Tourism Council. (2018). Travel & Tourism Economic impact 2018, Slovenia.
Available from: http://www.wttc.org/countries-2018/slovenia; Accessed, June, 2018. Wright, P.M., Dunford, B.B. & Snell, S.A. (2001). Human Resources and the Resource Based
View of the Firm. Journal of Management, 27(6), pp. 701-721.

91
Wu, C. M., & Chen, T. J. (2015). Psychological Contract Fulfilment in the Hotel Workplace: Empowering Leadership, Knowledge Exchange, and Service Performance. International Journal of Hospitality Management, 48, 27–38.
Xiao, Q., OʼNeill, J. W., & Mattila, A. S. (2012). The Role of Hotel Owners: The Influence of
Corporate Strategies on Hotel Performance. International Journal of Contemporary Hospitality Management, 24(1), 122–139.
Xie, K. L., So, K. K. F., & Wang, W. (2017). Joint effects of management responses and online
reviews on hotel financial performance: A data-analytics approach. International Journal of Hospitality Management, 62, 101−110.
Yin, P., Chu, J., Wu, J., Ding, J., Yang, M., & Wang, Y. (2019). A DEA-based two-stage
network approach for hotel performance analysis: An internal cooperation perspective. Omega.
Yu, K., Luo, B. N., Feng, X., & Liu, J. (2018). Supply chain information integration, flexibility,
and operational performance: An archival search and content analysis. The International Journal of Logistics Management, 29(1), 340−364.
Zahra, S.A., Filatotchev, I. & Wright, M. (2009). How do Threshold Firms Sustain Corporate
Entrepreneurship? The role of boards and absorptive capacity. Journal of Business Venturing, 24(3), pp. 248-260.
Zahra, S. A., Sapienza, H. J., & Davidsson, P. (2006). Entrepreneurship and Dynamic
Capabilities: A Review, Model and Research Agenda. Journal of Management studies, 43(4), 917–955.
Zoghbi-Manrique-de-Lara, P., & Ting-Ding, J. M. (2016). The Influence of Corporate Culture
and Workplace Relationship Quality on the Outsourcing Success in Hotel Firms. International Journal of Hospitality Management, 56, 66–77.
Zollo, M. & Winter, S.G. (1999). From organizational routines to dynamic capabilities (p. 38). INSEAD.

APPENDICES

1
Appendix 1: Longer summary of dissertation in Slovene language Dejavniki uspešnosti podjetja: empirični dokazi iz slovenske in hrvaške hotelske industrije
Daljši povzetek v slovenskem jeziku
Namen te doktorske disertacije je preučiti glavne dejavnike uspešnosti na splošno in še posebej v primeru hotelskih podjetij v dveh državah: Sloveniji in na Hrvaškem. Izsledki teorije nakazujejo, da je koristno razumeti celoten okvir različnih vrst dejavnikov in prepoznati njihov vpliv na dolgoročen finančni uspeh podjetja. Za managerje v hotelskih podjetjih je zelo pomembno razumevanje, kateri dejavniki v hotelirstvu so najpomembnejši in kako vplivajo na uspešnost. Državi Slovenija in Hrvaška se v zadnjih letih soočata s hitro rastjo in razvojem turizma. Pod vplivom ugodnih turističnih trendov si hotelska podjetja prizadevajo za čim višji finančni uspeh. Z različnimi tempi lastniških sprememb, prenove storitev in izboljšav v procesih ter prilagajanjem na hitro spreminjajoče se okolje, ta podjetja dosegajo znatno različne rezultate uspešnosti poslovanja, ki so predstavljeni v njihovih finančnih izkazih. Namen te raziskave je prilagoditi znanje iz teorije, ki temelji na virih (angl. Resource-based theory) in ki določa okvir za proučevanje različnih vrst virov, hotelski industriji z namenom raziskave najpomembnejših dejavnikov uspešnosti in za merjenje njihovega pomena na vzorcu hotelskih podjetij iz Slovenije in Hrvaške. Poleg tega ta raziskava ocenjuje pomen ključnih dejavnikov uspešnosti za različne skupine hotelskih podjetij v teh dveh državah in v kontekstu njihovega finančnega uspeha. Že prvi raziskovalci, ki so postavili okvir teorije, ki temelji na virih, so razumeli in pojasnjevali, da posebne značilnosti in vrste virov omogočajo podjetjem doseganje dolgoročnih konkurenčnih prednosti. Viri so bili razvrščeni v tri večje skupine: opredmetena sredstva, neopredmetena sredstva in zmogljivosti. Kasnejši empirični preizkusi posameznih vrst virov in njihovega vpliva na uspešnost poslovanja podjetij so povečali razumevanje vpliva posameznega dejavnika na uspešnost poslovanja toda širši kontekst vseh vrst različnih virov, ki jih imajo v lasti podjetja in njihovih specifičnih lastnosti, je bil na ta način izgubljen. Slika, o tem kaj resnično najbolj vpliva na uspešnost poslovanja podjetij znotraj specifične dejavnosti, je tako postala nejasna. Hotelska dejavnost je storitvena, kapitalsko intenzivna, tržno orientirana dejavnost v kateri prevladuje ostra konkurenca in kjer managerji strmijo k dnevnim izboljšavam njihovih rezultatov poslovanja tako, da skozi procese kombinirajo in uporabljajo različne vire in zmogljivosti in jim pri tem priznavajo različen pomen. Situacija postane še kompleksnejša na primeru tranzicijskih gospodarstev kot sta Slovenija in Hrvaška. Ta doktorska disertacija jemlje v obzir vse omenjene izzive s tem, ko raziskuje ključne dejavnike uspešnosti v dejavnosti hotelirstva. Ponuja celosten pristop s katerim raziskuje vpliv velikega števila dejavnikov na uspešnost poslovanja v tej dejavnosti.

2
V tej disertaciji k raziskovalnemu problemu pristopamo skozi tri ravni raziskovalnega procesa: • Prva raven: Vsebinska analiza 40 raziskovalnih študij, ki obravnavajo tako glavne izzive kot
časovni razvoj teorije, ki temelji na virih, in vsebinska analiza 40 raziskovalnih študij, v katerih so bili empirično preizkušeni posamezni dejavniki znotraj hotelske industrije in njihov vpliv na uspešnost. Na osnovi slednje analize, je bil oblikovan seznam 30 glavnih dejavnikov, ki bi jih potencialno bilo mogoče preoblikovati v vire konkurenčnih prednosti za hotelska podjetja.
• Druga raven: Kvalitativna študija Delphi temelji na 30 dejavnikih pridobljenih na osnovi vsebinske analize na prvi ravni in v proces raziskovanja vključuje 10 strokovnjakov s področja hotelirstva in turizma v Sloveniji in na Hrvaškem. Strokovnjaki so v treh krogih študije Delphi ovrednotili pomen dejavnikov glede na njihovo subjektivno dojemanje o tem, kako posamezni dejavniki vplivajo na uspešnost hotelskih podjetij. Poleg vrednotenja določenih dejavnikov, so strokovnjaki prispevali tudi lastna priporočila glede dodatnih dejavnikov, ki po njihovem mnenju pomembno vplivajo na uspešnost hotelov. Rezultat raziskave je seznam devetih ključnih dejavnikov uspešnosti, ki so bili vključeni v kvantitativno raziskavo na tretji ravni raziskovalnega procesa. Glavni dejavniki so naslednji: lokacija, zadovoljstvo strank, kakovost storitve, kompetence zaposlenih, poslovni procesi, razvoj proizvodov, sodelovanje, prilagodljivost oz. fleksibilnost in tržna usmerjenost.
• Tretja raven: Kvantitativna študija med vodstvi hotelskih podjetij v Sloveniji in na
Hrvaškem je bila izvedena na vzorcu vseh hotelskih podjetij, registriranih v Sloveniji in na Hrvaškem in na osnovi nacionalnega sistema klasifikacije. Posebej so bile oblikovane vsebinske izjave za vprašalnik, kvantitativna raziskava, s katero smo merili relativno pomembnost devetih ključnih dejavnikov skozi 7-točkovno Likertovo lestvico, pa je skupno obsegala 64 izjav. Analizirali smo 60 izpolnjenih vprašalnikov in ugotovili pomen vsakega dejavnika. Podatki samoocene vodstev hotelskih podjetij o pomenu dejavnikov uspešnosti, so bili povezani z indikatorji finančne uspešnosti iz računovodskih izkazov podjetij za obdobje 2013–2016. Opisna statistična analiza in analiza skupin sta bili izvedeni z namenom boljšega razumevanja razlik med ocenami pomembnosti in rezultati finančne uspešnosti teh podjetij. Opisna statistična analiza je pokazala, da so h kupcem usmerjeni dejavniki (kakovost storitev, segmentacija gostov, zadovoljstvo gostov) ocenjeni s strani anketirancev kot najpomembnejši in prednjačijo pred dejavniki povezanimi s poslovnimi procesi, tržno orientiranostjo, fleksibilnostjo, upravljanjem z zaposlenimi, lokacijo in sodelovanjem. Analiza skupin je podjetja razvrstila v pet različnih koherentnih skupin na osnovi njihovih ocen pomembnosti glede posameznih dejavnikov uspešnosti v hotelirstvu.

3
Doktorska disertacija je razdeljena na štiri poglavja:
Prvo poglavje proučuje teoretične in empirične študije za vzpostavitev okvirja in z namenom opredelitve potencialnih dejavnikov uspešnosti za hotelsko industrijo. Glavno raziskovalno vprašanje tega poglavja je naslednje: Kateri so potencialni glavni dejavniki uspešnosti hotelov, ki so opredeljeni v literaturi?
To poglavje se osredotoča na teorijo, ki temelji na virih kot glavnem okviru za raziskovanje različnih vrst virov, ki jih je mogoče pretvoriti v vire konkurenčnih prednosti na splošno in znotraj hotelske industrije. Uspešnost je ena izmed najbolj raziskanih tem na poslovnem in ekonomskem področju. Kaj zares poganja uspešnost je vedno predstavljalo sprožilec za raziskovalce in izvajalce. Avtorji Penrose (1959), Andrews (1971), Wernerfelt (1984), Barney (1991), Peteraf (1993) in Schoemaker (1993) so ustvarili okvir teorije, ki temelji na virih, ki je zagotavljala okolje za razvoj konceptov, kot so viri in zmogljivosti, ter njihov vpliv na dolgoročno konkurenčno prednost. Akademija je proučevala koncepte in značilnosti virov ter njihov vpliv na konkurenčne prednosti, medtem ko so raziskovalci začeli z obsežnimi preizkusi vpliva različnih dejavnikov na uspešnost znotraj posameznih panog. Znanje iz teoretične osnove v pogledu, ki temelji na virih, smo kombinirali z empiričnimi študijami, ki so že raziskale vpliv dejavnikov v hotelski industriji. Naš cilj je bil razvrstitev preizkušenih dejavnikov v tri osnovne skupine virov (opredmetena sredstva, neopredmetena sredstva in zmogljivosti) ter pojasnitev razvoja dejavnikov v različne razvojne poti: pogled, ki temelji na znanju in ki dojema znanje kot glavni vir konkurenčne prednosti podjetja, pogled, ki temelji na naravi, in dojema naravne vire kot glavni vir konkurenčne prednosti podjetja ter pogled, ki temelji na dinamičnih zmogljivostih in poudarja pomen sposobnosti podjetja, da se prilagaja vsakodnevni dinamiki hitro spreminjajočega se okolja.
Raziskava je izvedena v dveh korakih in temelji na vsebinski analizi. V prvem koraku smo s pomočjo vsebinske analize raziskali 40 najbolj citiranih člankov iz treh najbolj uglednih managerskih revij, ki se v veliki meri osredotočajo na konceptualizacijo in implementacijo teorije, ki temelji na virih. Članki so razvrščeni v skladu s štirimi glavnimi raziskovalnimi tokovi, predstavljene pa so tudi njihove glavne ugotovitve. V drugem poglavju so viri in zmogljivosti v hotelski industriji raziskani s pomočjo približno 40 člankov, objavljenih v mednarodnih revijah s področja hotelirstva, ki so izšle med letoma 1996 in 2015. Članki so bili izbrani na osnovi števila citiranj člankov na posameznem področju. Uporabljena je vsebinska analiza, članki pa so razvrščeni v glavne kategorije. Namen tega dela raziskave je prepoznati, kateri koncepti so bili najbolj raziskani (opredmetena sredstva, neopredmetena sredstva ali zmogljivosti) in katere odvisne spremenljivke, ki se uporabljajo za merjenje finančnih podatkov, so bile uporabljene v literaturi. V zaključnem delu poglavja smo v ospredje postavili omejitve in kritičen pogled na dvostopenjski raziskovalni proces ter njegove ugotovitve za morebitne prihodnje raziskave na tem področju.
4
Končni rezultat raziskave, predstavljene v prvem poglavju, je dobro strukturiran seznam različnih opredmetenih sredstev, neopredmetenih sredstev in zmogljivosti v hotelirstvu, ki je bil preizkušen v empirični raziskavi s pojasnjenim vplivom na uspešnost. Rezultati predstavljajo okvir virov, ki imajo potencial, da postanejo viri konkurenčnih prednosti v hotelski industriji. Kot takšni predstavljajo dragocen doprinos za prihodnje raziskave. Študija prav tako pojasnjuje kronološki razvoj empiričnih preizkusov in poudarja, da je večina študij preizkusila vpliv enega ali le nekaj posameznih virov na uspešnost. Študije so večinoma raziskale vpliv neopredmetenih sredstev (organizacijskih, relacijskih, uglednih, socialnega kapitala, okolijskih politik itd.) in zmogljivosti (tržne usmerjenosti, prilagodljivosti, odzivnosti itd.) na uspešnost podjetja, medtem ko so bila opredmetena sredstva v študijah običajno zanemarjena. Vsebinska analiza, uporabljena kot raziskovalna metodologija, prikazuje relativno ozek pristop večine študij o uspešnosti hotelskih podjetij, ki so v večini preizkusile enega ali le nekaj vrst virov in njihov vpliv na uspešnost podjetja. To je poziv za ukrepanje z uporabo bolj celostnega pristopa, ki bi upošteval različna sredstva in zmogljivosti znotraj podjetja ter njihov medsebojni vpliv na uspešnost v hotelski industriji. Drugo poglavje razvija seznam 30 dejavnikov kot potencialnih dejavnikov uspešnosti hotelskih podjetij ter jih preizkuša z namenov oblikovanja kratkega seznama najpomembnejših dejavnikov uspešnosti z vidika strokovnjakov. Glavno raziskovalno vprašanje tega poglavja je naslednje: Kateri so glavni dejavniki uspešnosti v hotelski industriji z vidika hotelskih strokovnjakov v Sloveniji in na Hrvaškem? To poglavje se osredotoča na raziskovanje in prepoznavanje glavnih dejavnikov uspešnosti znotraj hotelske industrije s pomočjo metode Delphi. Začne se s pregledom in pojasnilom glavnega cilja raziskave, ki je izbor in razumevanje glavnih dejavnikov uspešnosti hotela glede na mnenja strokovnjakov iz Slovenije in Hrvaške. V uvodnem delu tega poglavja je zopet vzpostavljena povezava s teorijo, ki temelji na virih, obravnavani pa so tudi glavni izzivi dosedanjih empiričnih študij (težave z merjenjem, širok obseg konceptov in šibke meje med njimi). Študije s področja hotelske industrije so sprejele splošne koncepte sredstev in zmogljivosti ter se pri preizkušanju enega ali le nekaj dejavnikov uspešnosti osredotočile predvsem na empirični del. Predstavljene so tudi različne vrste neopredmetenih sredstev, ki so pritegnile največ pozornosti raziskovalcev. Poglavje se nadaljuje z rezultati poglobljenega pregleda 40 člankov, ki so bili objavljeni v zadnjih dvajsetih letih in so preizkušali različne dejavnike uspešnosti v hotelski industriji. Končni rezultat raziskave sta seznam in opis 30 dejavnikov, ki so pritegnili največ pozornosti raziskovalcev. Literatura ponuja številne dejavnike, vendar ne pojasnjuje njihovega relativnega pomena za vzpostavitev dolgoročne konkurenčne prednosti podjetja na področju hotelirstva. Iz tega razloga smo v metodološkem delu uporabili metodo Delphi v skupini 10 strokovnjakov s področja hotelirstva in turizma iz Slovenije in Hrvaške. Metoda Delphi je izvedena v treh krogih. Študija predstavlja rezultate vsakega izmed treh krogov, kot tudi končni seznam devetih najpomembnejših dejavnikov uspešnosti v hotelski industriji: lokacija, tržna usmerjenost,

5
zadovoljstvo strank, razvoj proizvodov, kakovost storitev, prilagodljivost oz. fleksibilnost, poslovni procesi, kompetence zaposlenih in sodelovanje med deležniki v turizmu. Končni seznam dejavnikov primerjamo z analizo literature za boljše razumevanje, koliko pozornosti je Akademija posvetila vsakemu izmed dejavnikov v primerjavi s pomenom istega dejavnika, ki ga je prepoznala skupina strokovnjakov. Glavni prispevek poglavja je razvrstitev relevantnih dejavnikov uspešnosti v skladu z njihovim pomenom za izvajalce v hotelski industriji. S teoretičnega stališča to poglavje prispeva k prepoznavanju in razvrščanju dejavnikov uspešnosti glede na njihov pomen. Kljub temu pa nekateri dejavniki, ki so jih prepoznali strokovnjaki v literaturi, še niso bili preizkušeni. Tako ta članek kaže tudi na potencialne vrzeli in usmerja na območja odprta za prihodnje raziskave. V zaključku tega poglavja razpravljamo o splošnih ugotovitvah in pojasnjujemo omejitve raziskave. Rezultati raziskave jasno kažejo potrebo po nadaljnji operacionalizaciji glavnih dejavnikov, razvoju njihovih merilnih lestvic in nadaljnje empirično preizkušanje s pomočjo kvantitativne raziskave. Tretje poglavje obravnava razlike v ključnih kazalcih turističnega razvoja obeh držav.
Četrto poglavje se osredotoča na dve državi (Slovenijo in Hrvaško) ter preizkuša pomen devetih ključnih dejavnikov za uspešnost hotelskega podjetja. Glavni raziskovalni vprašanji tega poglavja sta naslednji: Kateri so najpomembnejši dejavniki uspešnosti hotelov očeh hotelirjev Slovenije in Hrvaške? Ali se pomembnost dejavnikov uspešnosti razlikuje med hoteli in kako to razlikovanje vpliva na uspešnost?
Četrto poglavje poskuša prispevati k znanju s pomočjo preizkušanja uspešnosti hotelov na vzorcu podjetij, ki se ukvarjajo s hotelirstvom, iz Slovenije in Hrvaške. To poglavje še naprej uporablja znanje in strukturo dejavnikov uspešnosti kot opredmetena sredstva, neopredmetena sredstva in zmogljivosti na osnovi teorije, ki temelji na virih, ter združuje strukturo z ugotovitvami in študije Delphi iz drugega poglavja. Devet ključnih dejavnikov uspešnosti hotelskih podjetij po mnenju strokovnjakov, predstavlja vhodne podatke kvantitativne raziskave, ki je bila izvedena v 60 podjetjih, ki upravljajo 228 hotelov v dveh državah – Sloveniji in na Hrvaškem. Za obe državi velja, da sta šli skozi tranzicijo iz socializma v tržno gospodarstvo in se v zadnjem času soočata z dvomestnimi stopnjami rasti v turizmu. Pomen in vpliv devetih ključnih dejavnikov sta med vodstvi hotelov preizkušena skozi 64 izjav. Podatki samoocene o pomenu dejavnikov uspešnosti hotela so povezani s kazalci finančne uspešnosti, ki so jih posredovale nacionalne agencije, ki zbirajo računovodske izkaze podjetij (AJPES v Sloveniji in FINA na Hrvaškem) za obdobje 2013–2016. Rezultati raziskave nakazujejo, da imajo, po mnenju vodij v hotelskih podjetjih iz Slovenije in Hrvaške, h kupcem usmerjeni dejavniki (kakovost storitev, segmentacija gostov, zadovoljstvo gostov) glavni vpliv na uspešnost hotelskih podjetij. V drugem koraku vodje predlagajo, da se hotelska podjetja morajo osredotočiti na procesni razvoj, podatkovne baze in nove tehnologije, katerim naj sledita tržna usmerjenost in prilagodljivost. Na naše presenečenje so dejavniki upravljanje zaposlenih, lokacija in

6
sodelovanje med deležniki prejeli nizko relativno končno oceno glede pomembnosti na uspešnost poslovanja.
Podatki iz kvantitativnih raziskav so bili nato povezani s podatki o finančni uspešnosti podjetij in izvedena je bila analiza skupin. Rezultati analize skupin kažejo, da obstaja pet skupin podjetij (majhna zasebna podjetja, podjetja z nedokončano tranzicijo, podjetja z raznolikim portfeljem, privatizirana podjetja s slabo tržno usmerjenostjo in uspešno privatizirana podjetja z jasno vizijo), ki se glede na vrednotenje pomena določenih dejavnikov uspešnosti bistveno razlikujejo v modelih lastništva in razvojnih fazah, v katerih se nahajajo. V okviru raziskovalnega procesa smo izvedli tudi regresijsko analizo, vendar zaradi narave podatkov in velikosti vzorca metoda ni bila primerna za analizo tega specifičnega sklopa podatkov. V primeru izredno raznolikega vzorca podjetij, je analiza skupin veliko bolj primerna metoda, saj podjetja razvršča v podobne skupine, pri čemer upošteva vrednotenje dejavnikov uspešnosti v študiji. Rezultati analize skupin razvrščajo podjetja v pet skupin glede na vrednotenje vpliva dejavnikov na uspešnost s strani vodij v hotelskih podjetjih. Teh pet skupin se med seboj precej razlikuje z vidika razvojne stopnje, lastništva in stanja tranzicije v katerih se podjetja v skupinah nahajajo. Skupine so naslednje: majhna zasebna podjetja, podjetja z nedokončano tranzicijo, podjetja z raznolikim portfeljem, privatizirana podjetja s slabo tržno usmerjenostjo in uspešno privatizirana podjetja z jasno vizijo. Omenjene skupine podjetij se pomembno razlikujejo v svojem vrednotenju dejavnikov uspešnosti in lastništva ter specifikah razvoja. Rezultati tega poglavja razkrivajo dva večja prispevka. Eden je drugačen pristop pri opazovanju dejavnikov uspešnosti v hotelski industriji. Raziskava nam pokaže, da se teh devet ključnih dejavnikov po pomenu med različnimi vrstami podjetij znatno razlikuje, zato združevanje podjetij lahko ponudi bolj pojasnjevalne rezultate kot pa podatki pridobljeni na celotnem vzorcu podjetij. Nadalje ta raziskava tudi nakazuje specifičnost rezultatov za določene primere in jih je mogoče uporabiti na primeru tranzicijskih držav, ki se istočasno soočajo z rastjo panoge in tranzicijskimi spremembami. Rezultati tega poglavja nakazujejo, da je uspešnost kompleksen pojav. Dejavniki uspešnosti se znatno razlikujejo glede na vrsto podjetja, velikost, upravljanje ali lastniško strukturo. Za majhna podjetja sta najpomembnejša dejavnika uspešnosti sodelovanje z drugimi deležniki in zadovoljstvo gostov. Za podjetja, ki so še vedno v procesu privatizacije, je lokacija ocenjena kot najpomembnejši dejavnik uspešnosti, medtem ko vodeči v podjetjih, ki so bila uspešno privatizirana, kot zelo pomembne ocenjujejo vseh devet dejavnikov uspešnosti. To prihodnjim raziskovalcem nudi dragocene informacije o tem, kako vrednotiti dejavnike uspešnosti na različnih trgih. Prav tako nudi dragocen okvir za tranzicijska gospodarstva in zagotavlja boljše razumevanje o tem kako značilnosti, specifične za posamezne trge, vplivajo na uspešnost hotelskih podjetij. Najpomembnejši teoretični in praktični prispevki te disertacije so naslednji:

7
- Analiza obsežnega telesa teoretičnih in empiričnih raziskav ter uporaba vsebinske analize
za kritično strukturiranje teh raziskav. Rezultati prikazujejo strukturiran pogled na razvoj teorije in njenih najpomembnejših konceptov ter predstavljajo izzive povezane z njihovimi medsebojnimi vplivi, pomanjkanjem njihove operacionalizacije in posledično težavami glede merjenja njihovega vpliva na uspešnost.
- Osredotočanje na identifikacijo dejavnikov uspešnosti v hotelski industriji. Razvrščanje in kritično razmišljanje o dejavnikih uspešnosti v hotelirstvu z namenom boljšega razumevanja različnih vrst dejavnikov, ki so bili najbolj preučevani v raziskavah s področja hotelirstva. Strukturiranje dejavnikov glede na vire (opredmetena sredstva, neopredmetena sredstva in zmogljivosti) in predstavitev rezultatov analize glede povezave med njimi in izmerjenim vplivom na uspešnost. Končni rezultat raziskave na osnovi vsebinske analize je identifikacija 30 najbolj raziskanih in empirično preizkušenih dejavnikov uspešnosti v dejavnosti hotelirstva.
- S pomočjo kvalitativne analize podatkov (trije krogi metode Delphi s strokovnjaki s
področja hotelirstva in turizma) je seznam 30 najpomembnejših dejavnikov uspešnosti na podlagi mnenj strokovnjakov iz Slovenije in Hrvaške skrajšan na devet ključnih dejavnikov uspešnosti v hotelski industriji. Ti dejavniki so: lokacija, tržna usmerjenost, zadovoljstvo strank, razvoj proizvodov, kakovost storitev, prilagodljivost oz. fleksibilnost, poslovni procesi, kompetence zaposlenih in sodelovanje med deležniki v turizmu.
- Za vsakega od teh devet ključnih dejavnikov uspešnosti je posebej opredeljena merilna
lestvica. Skupno vse lestvice obsegajo 64 izjav in so namenjene vrednotenju pomena devetih dejavnikov uspešnosti. Kvantitativna raziskava je bila izvedena med hotelskimi managerji v Sloveniji in na Hrvaškem. Osrednji prispevek te raziskave je razvrstitev dejavnikov uspešnosti glede na pomen, ki so jim ga pripisali managerji v hotelskih podjetjih. Rezultati jasno nakazujejo fokus in usmerjenost k strankam (gostom) pred dejavniki povezanimi s procesi, tržno usmerjenostjo, fleksibilnostjo, zaposlenimi, lokacijo in sodelovanjem.
- Analiza skupin je izvedena z namenom opredelitve razlik med vrednotenjem pomena
dejavnikov uspešnosti med podjetji v dveh državah (Slovenija in Hrvaška) v tranziciji in pod vplivom ugodnih trendov rasti v panogi. Rezultati analize skupin razvrščajo podjetja v pet skupin: majhna zasebna podjetja, podjetja z nedokončano tranzicijo, podjetja z raznolikim portfeljem, privatizirana podjetja s slabo tržno usmerjenostjo in uspešno privatizirana podjetja z jasno vizijo. Teh pet skupin se med seboj precej razlikuje z vidika razvojne stopnje, lastništva in stopnje tranzicije v kateri se nahajajo. Prispevek rezultatov jasno kaže na to, kako različne skupine podjetij različno vrednotijo pomen posameznih dejavnikov uspešnosti.

8
- Primer Slovenije in Hrvaške ponuja vpogled v dejavnike uspešnosti v hotelski industriji v kontekstu dveh hitro rastočih trgov, ki se soočata s tranzicijo in hkratnem hitrem razvoju in rasti turizma.
Pristop k raziskovanju te doktorske disertacije je celosten. Disertacija analizira teoretično in empirično znanje ter oblikuje širok okvir možnih dejavnikov, ki lahko postanejo viri konkurenčne prednosti v hotelski industriji. Skozi ustrezno raziskovalno metodologijo sistematično znižuje število dejavnikov in vrednoti njihov pomen za uspešnost hotelskih podjetij v Sloveniji in na Hrvaškem. Disertacija nudi jasno razumevanje, kaj so ključni dejavniki uspešnosti hotelskih podjetij, kako pomembni so in kako vplivajo na uspešnost hotelskih podjetij na trgih s turistično rastjo in razvojem pod vplivom tranzicijskih sprememb. Disertacija odpira številne nove poti za prihodnje raziskave. Če primerjamo rezultate raziskav opravljenih na področju hotelirstva in turizma z rezultati raziskav na poslovnem in ekonomskem področju raziskovanja, ugotovimo vrzel pri preizkušanju vpliva vodij (managerjev) in njihove učinkovitosti in produktivnosti na uspešnost poslovanja hotelskih podjetij. Prav tako so podjetniška orientiranost, organizacijska kultura, ugled, odnosi med zaposlenimi in posebna znanja o trgih in tehnologijah dobro raziskovana v raziskavah izven dejavnosti hotelirstva. Osredotočanje na te koncepte in njihov vpliv na uspešnost je prva od usmeritev za bodoča raziskovanja v tej panogi. Ker je večina študij do sedaj preverjala zgolj enega ali le nekaj dejavnikov znotraj posamezne vrste virov in njihov vpliv na uspešnost, se postavlja pod vprašaj veljavnosti tovrstnih študij. Konceptualne študije namreč jasno kažejo, da je za odgovor na vprašanje o ključnih dolgoročnih konkurenčnih prednostih podjetja, potrebno preverjati različne vrste sredstev in zmogljivosti in njihov vpliv na uspešnost poslovanja podjetja. Omenjeno kaže na potrebo po bolj celostnem pristopu, ki pod drobnogled postavlja širok razpon različnih sredstev in sposobnosti podjetja in pri tem upošteva tudi njihove medsebojne vplive v povezave pri merjenju učinka na uspešnost poslovanja. V raziskavah vpliva posameznih vrst virov (opredmetena sredstva, neopredmetena sredstva, zmogljivosti) na uspešnost, so avtorji raziskav največ pozornosti namenili predvsem vlogi neopredmetenih sredstev (organizacijski, relacijski, socialni kapital, informacijsko komunikacijske tehnologije, okolijske politike in podobno), medtem ko so bile zmogljivosti in opredmetena sredstva po pomenu in številu raziskav na področju hotelirstva zanemarljive v primerjavi s študijami na ekonomskem in poslovnem področju. Posebej v hotelirstvu, ki je investicijsko zelo intenzivna panoga, velja, da je pomen stalnih vlaganj v prenovo, posodobitev in atraktivnost ponudbe izjemnega pomena za oceno kakovosti nudenja storitev na trgu. Da so opredmetena sredstva pomemben vir za oblikovanje konkurenčne prednosti podjetja, je pokazala turi raziskava Delphi v drugem poglavju te doktorske disertacije. Verjamemo, da bodoče študije preprosto morajo upoštevati pri preverjanju dejavnikov uspešnosti poslovanja poleg opredmetenih sredstev in zmogljivosti tudi zelo pomembno vlogo opredmetenih sredstev.

9
Neopredmeteni viri bodo tudi v bodoče pritegnili večino pozornosti raziskovalcev pri preverjanju njihove vloge in vpliva na gradnjo dolgoročne konkurenčne prednosti podjetja. Znotraj njih poslovna in ekonomska literatura pomemben del pozornosti danes namenja dinamičnim zmogljivostim podjetij. Dinamične zmogljivosti omogočajo podjetjem, da se hitro odzivajo in prilagajajo vsakodnevni dinamiki poslovnega okolja in se zelo razlikujejo od operativnih sposobnosti, ki podjetjem omogočajo učinkovito izvajanje dnevnih procesov in rutin. Turizem je visoko dinamičen sektor in sposobnost prilagajanja spremembam je pogosto ključ do uspeha podjetij znotraj te panoge (Dwayer, Knezevic, Edwards, Mihalič, 2012). Tudi raziskava Delphi v tej disertaciji je pokazala, da strokovnjaki s področja turizma in hotelirstva verjamejo, da so zmogljivosti pomemben vir konkurenčne prednosti za podjetja v teh dejavnostih. Iz tega razloga je razumevanje kako hitro in uspešno se hotelska podjetja prilagajajo dinamiki hitro spreminjajočega se okolja, zelo pomembno zato bodo konceptualne in empirične raziskave na tem področju v bodoče zelo dobrodošle. Za ustrezno preverjanje povezave med dinamičnimi zmogljivostmi in poslovno uspešnostjo podjetij, bo potrebno pozornost nameniti tudi razvoju in oblikovanju ustreznih merilnih instrumentov za to vrsto sredstev. Ta disertacija usmerja nadaljnje raziskave na področja oblikovanja ustreznih procesov in postopkov, razvoja produktov, fleksibilnosti in tržne orientiranosti podjetij ter vzpostavitve dobrega sodelovanja med pomembnimi deležniki na trgih in destinacijah. Rezultati raziskav v tej doktorski disertaciji nakazujejo tudi potrebo po nadaljnjih raziskavah na področju držav v hitrem razvoju in rastjo v turistični dejavnosti. Dejavniki uspešnosti poslovanja podjetij se lahko v teh državah občutno razlikujejo v primerjavi z razvitimi trgi zato so primerjave med različnimi državami ali destinacijami in raziskovanje različnih dejavnikov uspešnosti poslovanja v prihodnje zelo zaželene. Rezultati raziskave na dveh hitro rastočih turističnih trgih v Sloveniji in na Hrvaškem kažejo, da je pri preverjanju zelo velikega števila dejavnikov in njihovega vpliva na uspešnost poslovanja podjetij, pomembno zbrati pravilen metodološki pristop. V primeru vzorcev, ki vključujejo veliko število podjetij, ki se med seboj zelo razlikujejo glede na fazo razvoja podjetja, lastništvo, diverzifikacijo portfelja in velikost podjetij, je smiselno preučevati pomembnost posameznih dejavnikov z razvrstitvijo podjetij v homogene skupine. Na takšen način se pridobi informacije, ki vsebujejo širši pogled in razumevanje zakaj in na kaj podjetja v skupinah dajejo poudarek, na kaj se osredotočajo in kako se ta odnos odraža na poslovnih rezultatih teh skupin podjetij. Pri ugotovitvah glede pomena posameznih dejavnikov na uspešnost hotelskih podjetij ta doktorska disertacija kaže, da managerji v državah s hitro rastjo panoge in razvojnimi spremembami verjamejo, da imajo pri doseganju poslovne uspešnost dejavniki, ki so osredotočeni na stranko (gosta) prednost pred ostalimi dejavniki. Kakovost storitev, segmentacija gostov in razvoj proizvodov zanje in zadovoljstvo gostov so postavljeni glede na pomen vpliva na uspešnost, povsem v ospredje. Na drugo mesto managerji postavljajo dejavnika notranjih virov konkurenčnih prednosti podjetij kot sta razvoj informacijskih tehnologij in upravljanje z zaposlenimi. Na tretje mesto se uvrščata dejavnika, ki poudarjata dinamične zmogljivosti hotelskih podjetij, kot sta tržna orientiranost in fleksibilnost podjetij, da se hitro odzovejo in

10
prilagodijo svojo ponudbo in trženjske aktivnosti spremenjenim zahtevam trga. Na zadnji dve mesti med devetimi najpomembnejšimi dejavniki, ki pomembno vplivajo na uspešnost poslovanja hotelskih podjetij, so managerji v hotelih Slovenije in Hrvaške uvrstili lokacijo in sodelovanje med ključnimi turističnimi deležniki na destinaciji ali v državi. Zaradi specifike raziskave izvedene na dveh trgih in na omejenem vzorcu, se zaključki ne morejo posploševati. Nadaljnje raziskave in preverjanje vpliva različnih dejavnikov na različnih trgih in v različnih razvojnih ciklih bodo sliko o pomenu in vlogi posameznih dejavnikov na poslovno uspešnost še dodatno razjasnile in konkretizirale. Disertacija kot celota poudarja, da je uspešnost kompleksen pojav, dejavniki uspešnosti pa se lahko zelo razlikujejo v odvisnosti od lastništva in upravljanja podjetij, konteksta preučevanja dejavnikov, razvojnih trendov v industriji in v gospodarstvu na splošno. Ključne besede: viri, zmogljivosti, konkurenčna prednost, hotelirstvo, hotelska industrija, metoda Delphi, dejavniki uspešnosti.

11
Appendix 2: Sample questionnaire for the quantitative analysis Dear Sir or Madam! We are addressing you with this questionnaire examining success factor of hotel companies. A research aims to answers the question of what hotel companies need to focus on if they want to increase the performance of their business. The research is carried out in Slovenia and Croatia and it consists of 9 sets. Answer the questions in each section by choosing the answer on the 7-step Likert scale. The benefits of the research will be clear guidelines on the most important performance success factor of hotel companies and the comparability of results between Slovenian and Croatian hotel companies. We will be very pleased if you respond to our invitation to participate, which will take approximately 10 minutes of your time. Information obtained by your answers will be used solely for aggregate analysis. We will comply with the principle of protection of business secrets with the name of the company remaining confidential. We will be pleased to provide you with the research results available end of September 2017. Hoping to your soonest reply, we are thanking you in advance. In case of any problems or questions, please contact Valentina Božič ([email protected]). Thank you once again for your understanding and willingness to participate.

12
1. Please indicate the company's registration number or name (compulsory): 2. Please indicate your position in the company: 3. Do you want us to submit you the research results?
YES NO 4. Please fill in information relating to your hotel company.
1 OR 2* 3* 4* 5*
Number of hotels in each category
5. Please read the following statements regarding the LOCATION of your hotel(s) and rate the
level of agreement with them (1 - completely disagree; 4 – neither agree nor disagree and 7 - completely agree). If a company has in its ownership or management more than one hotel, please give a joint rating for all the hotels.
STATEMENT RATING (1 - COMPLETELY DISAGREE; 2 - DISAGREE;
3 - PARTIALLY DISAGREE; 4- NEITHER AGREE NOR DISAGREE; 5 - PARTIALLY AGREE; 6 - AGREE; 7 - COMPLETELY AGREE)
Our hotel(s) are very well accessible by air connections. 1 2 3 4 5 6 7
Our hotel(s) are very well accessible by public road connections. 1 2 3 4 5 6 7
Our hotel(s) are very well accessible by railway connections. 1 2 3 4 5 6 7
Our hotel(s) have enough parking facilities, so our guests don't have any problems with parking.
1 2 3 4 5 6 7
Our hotel(s) are close to city centre. 1 2 3 4 5 6 7
Our hotel(s) are close to natural attractions. 1 2 3 4 5 6 7
The location of our hotels is favourable for business guests. 1 2 3 4 5 6 7
Our hotel(s) are located in the destinations that create typical tourist demand (our destinations are among the leading in the region).
1 2 3 4 5 6 7

13
6. Please read the following statements regarding the COOPERATION BETWEEN TOURIST PARTICIPANTS IN THE DESTINATION and rate the level of agreement with them (1 - completely disagree; 4 – neither agree nor disagree and 7 - completely agree). If your company is operating in several destinations, please give a joint rating for all destinations where your hotels are located.
STATEMENT RATING (1 - COMPLETELY DISAGREE; 2 - DISAGREE;
3 - PARTIALLY DISAGREE; 4- NEITHER AGREE NOR DISAGREE; 5 - PARTIALLY AGREE; 6 - AGREE; 7 - COMPLETELY AGREE)
Key tourist participants in our destinations meet regularly in order to exchange information.
1 2 3 4 5 6 7
Key tourist participants in our destinations perform joint business activities (e.g. joint appearance on foreign markets).
1 2 3 4 5 6 7
Key tourist participants in our destinations actively participate in the formation of a joint development strategy of the destination.
1 2 3 4 5 6 7
Participants in our destinations actively participate in the implementation of the development strategy of the destination.
1 2 3 4 5 6 7
7. Please read the following statements regarding the MARKET ORIENTATION in your company
and rate the level of agreement with them (1 - completely disagree; 4 – neither agree nor disagree and 7 - completely agree).
STATEMENT RATING (1 - COMPLETELY DISAGREE; 2 - DISAGREE;
3 - PARTIALLY DISAGREE; 4- NEITHER AGREE NOR DISAGREE; 5 - PARTIALLY AGREE; 6 - AGREE; 7 - COMPLETELY AGREE)
In our company we quickly adapt to changes in our guests' preferences. 1 2 3 4 5 6 7
In our company we quickly adapt to changes in the industry (e.g. sharing economy, climate change, etc.).
1 2 3 4 5 6 7
If something important happens to one of our key customers, all our hotel employees know that immediately.
1 2 3 4 5 6 7
If one of our departments learns something important about our competitors, it immediately informs all other departments.
1 2 3 4 5 6 7
In our company we all understand marketing information which are key to our business.
1 2 3 4 5 6 7
In our company we have the same understanding regarding the effects of marketing activities on our company’s business.
1 2 3 4 5 6 7
We respond in a very short time to price-oriented actions of our competitors. 1 2 3 4 5 6 7
We respond immediately if one of our most important competitors directs marketing promotion to acquiring our guests.
1 2 3 4 5 6 7

14
8. Please read the following statements regarding YOUR COMPANY'S ATTITUDE TO GUESTS' SATISFACTION and rate the level of agreement with them (1 - completely disagree; 4 – neither agree nor disagree and 7 - completely agree).
STATEMENT RATING (1 - COMPLETELY DISAGREE; 2 - DISAGREE;
3 - PARTIALLY DISAGREE; 4- NEITHER AGREE NOR DISAGREE; 5 - PARTIALLY AGREE; 6 - AGREE; 7 - COMPLETELY AGREE)
Satisfaction of our guests has been continuously growing in the last three years. 1 2 3 4 5 6 7
The level of service delivery in our company is in line with our guest's expectations. 1 2 3 4 5 6 7
The number of guests' complaints (including online complaints) has been steadily decreasing in the last three years.
1 2 3 4 5 6 7
The average of online ratings on guests’ satisfaction with the services of our company is higher than the average of online ratings of our direct competitors.
1 2 3 4 5 6 7
Our company has a higher share of regular guests than our direct competitors. 1 2 3 4 5 6 7
Number of regular guests in our company has been steadily growing in the last three years.
1 2 3 4 5 6 7
9. Please read the following statements regarding your company's attitude to QUALITY OF
SERVICES and rate the level of agreement with them (1 - completely disagree; 4 – neither agree nor disagree and 7 - completely agree).
STATEMENT RATING (1 - COMPLETELY DISAGREE; 2 - DISAGREE;
3 - PARTIALLY DISAGREE; 4- NEITHER AGREE NOR DISAGREE; 5 - PARTIALLY AGREE; 6 - AGREE; 7 - COMPLETELY AGREE)
Our company is regularly investing (min. 5% of total revenue) in building maintenance and hotel(s) equipment.
1 2 3 4 5 6 7
The appearance of our hotels is more attractive compared to our direct competitors.
1 2 3 4 5 6 7
Our employees' image (overall image) is better compared to our direct competitors.
1 2 3 4 5 6 7
In our company our guests are accurately informed when services will be carried out.
1 2 3 4 5 6 7
In our company employees are always ready to serve the guests. 1 2 3 4 5 6 7
In our company employees are quick to respond to guest's requests. 1 2 3 4 5 6 7
In our company we trust our employees. 1 2 3 4 5 6 7
Our employees know their work well in order to satisfy the guests. 1 2 3 4 5 6 7
Our employees have all the necessary support to be able to do their job well. 1 2 3 4 5 6 7
Employees in our company are very familiar with the needs of our guests. 1 2 3 4 5 6 7
Well-being of our guests is the basis of our operation. 1 2 3 4 5 6 7
In our company the opening hours are in accordance with the needs of all our guests.
1 2 3 4 5 6 7
In our company we serve quality food which is well presented to our guests. 1 2 3 4 5 6 7
The food in our hotels is always fresh. 1 2 3 4 5 6 7

15
10. Please read the following statements regarding your company's attitude to PRODUCT SEGMENTATION and rate the level of agreement with them (1 - completely disagree; 4 – neither agree nor disagree and 7 - completely agree).
STATEMENT RATING (1 - COMPLETELY DISAGREE; 2 - DISAGREE;
3 - PARTIALLY DISAGREE; 4- NEITHER AGREE NOR DISAGREE; 5 - PARTIALLY AGREE; 6 - AGREE; 7 - COMPLETELY AGREE)
In our company we perform product segmentation according to target markets. 1 2 3 4 5 6 7
In our company we perform product segmentation by sales channels. 1 2 3 4 5 6 7
In our company we know segments of our guests for individual tourist products. 1 2 3 4 5 6 7
11. Please read the following statements regarding your company's attitude to EMPLOYEE
COMPETENCIES and rate the level of agreement with them (1 - completely disagree; 4 – neither agree nor disagree and 7 - completely agree).
STATEMENT RATING (1 - COMPLETELY DISAGREE; 2 - DISAGREE;
3 - PARTIALLY DISAGREE; 4- NEITHER AGREE NOR DISAGREE; 5 - PARTIALLY AGREE; 6 - AGREE; 7 - COMPLETELY AGREE)
Employees in our company are well qualified for their work. 1 2 3 4 5 6 7
Our company is attractive for highly professional quality personnel. 1 2 3 4 5 6 7
Employees' resignations don't pose any particular issue to our company. 1 2 3 4 5 6 7
New employees have on average of at least two years of working experience in the industry.
1 2 3 4 5 6 7
In our company the share of the seasonal employees in the total number of the employees is lower than the industry's average.
1 2 3 4 5 6 7
Our employees are constantly developing their knowledge. 1 2 3 4 5 6 7
Employees in our company are learning also from our guests. 1 2 3 4 5 6 7
Employees in our company are regularly (at least once a year) educating for the need of their workplace.
1 2 3 4 5 6 7
Employees in our company regularly share ideas. 1 2 3 4 5 6 7

16
12. Please read the following statements regarding BUSINESS PROCESSES in your company and rate the level of agreement with them (1 - completely disagree; 4 – neither agree nor disagree and 7 - completely agree).
STATEMENT RATING (1 - COMPLETELY DISAGREE; 2 - DISAGREE;
3 - PARTIALLY DISAGREE; 4- NEITHER AGREE NOR DISAGREE; 5 - PARTIALLY AGREE; 6 - AGREE; 7 - COMPLETELY AGREE)
In our company the processes are efficient, which enables us to have all necessary information for our business on daily basis.
1 2 3 4 5 6 7
In our company we execute processes in accordance with the defined hotel and quality standards.
1 2 3 4 5 6 7
Internal processes in our company are being constantly improved. 1 2 3 4 5 6 7
In our company we have quality databases which help in making business decisions.
1 2 3 4 5 6 7
In our company we have good data analytics which helps in making business decisions.
1 2 3 4 5 6 7
In our company we've managed to optimize key business processes with the help of technology.
1 2 3 4 5 6 7
In our company we already use smart reception solutions (technology for easier on-line check- in process, etc.)
1 2 3 4 5 6 7
13. Please read the following statements regarding FLEXIBILITY of your company and rate the
level of agreement with them (1 - completely disagree; 4 – neither agree nor disagree and 7 - completely agree).
STATEMENT RATING (1 - COMPLETELY DISAGREE; 2 - DISAGREE;
3 - PARTIALLY DISAGREE; 4- NEITHER AGREE NOR DISAGREE; 5 - PARTIALLY AGREE; 6 - AGREE; 7 - COMPLETELY AGREE)
In our company we quickly introduce technological solutions that are important for our business.
1 2 3 4 5 6 7
In our company we implement all safety recommendations with the aim of ensuring the highest possible level of safety for all participants.
1 2 3 4 5 6 7
In our company we adapt our offer to demographic changes. 1 2 3 4 5 6 7
In our company we perform environment protection activities. 1 2 3 4 5 6 7
In the company we provide e-mobile services to all participants (transport, e-communication, etc.).
1 2 3 4 5 6 7
In our company we develop new business models which take into account the growth of sharing economy.
1 2 3 4 5 6 7
Our company works well with local environment and respond to its needs. 1 2 3 4 5 6 7

17
14. Please rate the INDICATORS of your company's business in the last three years compared to one's own set goals (1 = significantly worse than the set goals, 4 = neither better nor worse than the set goals; 7 = significantly better than the set goals )
BUSINESS INDICATORS OF YOUR COMPANY COMPARED TO THE SLOVENIAN INDUSTRY'S AVERAGE
RATING (1 = SIGNIFICANTLY WORSE THAN THE SET GOALS; 2= WORSE, 3= SLIGHTLY WORSE; 4 = NEITHER BETTER
NOR WORSE THAN THE SET GOALS; 5= SLIGHTLY BETTER; 6= BETTER; 7 = SIGNIFICANTLY BETTER THAN THE SET GOALS)
Economic indicators
Sales growth 1 2 3 4 5 6 7
Market share 1 2 3 4 5 6 7
Guest satisfaction 1 2 3 4 5 6 7
Share of regular guests 1 2 3 4 5 6 7
Return on investment (ROI) 1 2 3 4 5 6 7
Return on equity (ROE) 1 2 3 4 5 6 7
Room occupancy rate 1 2 3 4 5 6 7
RevPAR (Revenue per available room) 1 2 3 4 5 6 7
You have answered all the questions in this research. We sincerely thank you for your participation!

18
Appendix 3: Ranking table for all statements from descriptive analysis
DESCRIPTION OF THE STATEMENT MEAN MEDIAN STD.
DEVIATION RANK DRIVER OF PERFORMANCE
Focus on the guests’ needs and well being 6,66 7,00 ,545 1 Quality of services
Willingness to meet the guests' expectations 6,20 6,00 ,898 2 Quality of services
Responsiveness to guests' requirements 6,17 6,00 ,894 3 Quality of services
Quality of food and service 6,14 6,00 1042 4 Quality of services
Support towards employees 6,13 6,00 ,892 5 Quality of services
Trust towards employees 6,07 6,00 ,907 6 Quality of services
Continuous improvement of internal processes 6,00 6,00 ,766 7 IT development
Employee qualifications to meet guests needs 5,98 6,00 ,799 8 Quality of services
Implementation of safety recommendations 5,97 6,00 ,758 9 Flexibility
Parking capacities 5,95 6,00 1320 11 Location
Constant growth of guests' satisfaction 5,95 6,00 ,946 11 Guests' satisfaction
Employee qualifications to perform well 5,92 6,00 ,671 13 Employee management
Adaptation to guests preferences 5,88 6,00 ,865 14 Market orientation
Knowing the guests’ needs 5,80 6,00 ,898 15 Quality of services
Guest' service expectations and compliance with the performance
5,77 6,00 ,621 16 Guests' satisfaction
Feedback precision towards guests 5,77 6,00 ,909 16 Quality of services
Product segmentation 5,77 6,00 1125 16 Segmentation
Collaboration with the local environment and responsiveness to its needs
5,74 6,00 ,943 19 Flexibility
Implementation of processes in accordance with service standards and procedures
5,71 6,00 1001 20 IT development
Responsiveness to competitors' market attacks 5,68 6,00 1081 21 Market orientation
Effective processes with key daily information for decision-making
5,68 6,00 ,860 21 IT development
Constant decline in the number of guests complaints 5,67 6,00 1068 23 Guests' satisfaction
Regular guests' share constant growth 5,62 6,00 1180 24 Guests' satisfaction
Learning from guests 5,57 6,00 1226 25 Employee management
Constant investment in hotel maintenance 5,55 6,00 1443 26 Quality of services
Destination with substantial demand 5,53 6,00 1775 27 Location
Public transport accessibility 5,52 6,00 1546 28 Location
Constant sharing of ideas 5,52 6,00 1049 28 Employee management
Implementation of environmental protection activities 5,52 6,00 1295 28 Flexibility
Sales channel segmentation 5,47 6,00 1282 31 Segmentation
Closeness to natural attraction 5,46 6,00 1381 32 Location
Target market segmentation 5,37 6,00 1365 33 Segmentation
Business convenience 5,34 6,00 1636 34 Location
Competitors' information dissemination 5,33 6,00 1271 35 Market orientation
Company's appeal for quality staff 5,32 5,00 1200 36 Employee management
Responsivness to competitors' price oriented actions 5,30 5,00 1357 37 Market orientation
Quality detabases for decision making 5,29 5,00 1190 38 IT development
Quality of data analytics for decision making 5,28 5,50 1316 39 IT development
Closness to city center 5,27 6,00 1803 40 Location
Adaptation to demographic trends 5,27 5,00 1006 40 Flexibility
Adaptation to industry changes 5,21 5,00 1136 41 Market orientation
Continious knowledge development 5,17 5,00 1196 42 Employee management

19
DESCRIPTION OF THE STATEMENT MEAN MEDIAN STD.
DEVIATION RANK DRIVER OF PERFORMANCE
Regular workplace education 5,15 5,00 1412 43 Employee management
Customers' information dissemination 5,13 6,00 1523 44 Market orientation
Hotel/s attractiveness compared to competitors 5,12 5,00 1342 45 Qualitiy of services
Enabling E-mobility services 5,10 5,00 1362 46 Flexibility
Share of seasonal employees compared to main competitors 5,08 6,00 1889 47 Employee management
Technology optimization of processes 5,07 5,00 1219 48 IT development
Regular guests' share compared to main competitors 5,03 5,00 1248 49 Guests' satisfaction
Visual corporate identity of employees compared to main competitors
4,92 5,00 1183 50 Qualitiy of services
Average value of online ratings compared to main competitors
4,83 5,00 1542 51 Guests' satisfaction
Introduction of industry technological solutions 4,83 5,00 1452 51 Flexibility
Uniform understanding of market information 4,81 5,00 1332 53 Market orientation
Uniform understanding of market activities effects 4,73 5,00 1388 54 Market orientation
Work experience in the industry 4,65 5,00 1560 55 Employee management
Resistance to employee dismissal 4,53 5,00 1396 56 Employee management
Introduction of new business models (Sharing economy etc.)
4,38 5,00 1508 57 Flexibility
Joint business activities 4,37 5,00 1697 58 Cooperation
Information sharing 4,25 5,00 1580 59 Cooperation
Common design of destination development strategy 4,07 5,00 1656 60 Cooperation
Airline transport accessibility 4,02 4,50 1827 61 Location
Common implementation of destination development strategy
3,90 4,00 1644 62 Cooperation
Smart technology (Smart reception etc.) 3,88 4,00 1905 63 IT development
Railway transport accessibility 3,52 3,00 1662 64 Location
Own product development department 1,18 1,00 ,390 65 Segmentation

20
Appendix 4: Results of the cluster analysis Ward Linkage
AGGLOMERATION SCHEDULE
STAGE CLUSTER COMBINED
COEFFICIENTS STAGE CLUSTER FIRST APPEARS
NEXT STAGE CLUSTER 1 CLUSTER 2 CLUSTER 1 CLUSTER 2
1 30 56 ,325 0 0 4
2 50 54 ,655 0 0 5
3 57 60 1,155 0 0 8
4 30 43 1,757 1 0 15
5 9 50 2,425 0 2 26
6 8 49 3,121 0 0 40
7 13 41 4,066 0 0 12
8 29 57 5,123 0 3 26
9 32 39 6,289 0 0 30
10 16 46 7,512 0 0 20
11 20 35 8,828 0 0 37
12 13 55 10,186 7 0 23
13 7 38 11,712 0 0 32
14 12 37 13,327 0 0 31
15 27 30 15,118 0 4 31
16 25 33 17,027 0 0 27
17 34 58 19,129 0 0 41
18 10 44 21,255 0 0 35
19 31 48 23,560 0 0 45
20 16 26 26,025 10 0 37
21 15 52 28,546 0 0 33
22 18 28 31,138 0 0 29
23 13 51 33,743 12 0 30
24 17 36 36,411 0 0 32
25 14 53 39,150 0 0 38
26 9 29 42,046 5 8 35
27 2 25 45,024 0 16 50
28 5 6 48,028 0 0 51
29 11 18 51,064 0 22 44
30 13 32 54,289 23 9 42
31 12 27 57,893 14 15 40
32 7 17 61,507 13 24 41
33 1 15 65,448 0 21 39
34 22 24 69,943 0 0 47
35 9 10 74,544 26 18 44
36 45 59 79,373 0 0 42
37 16 20 84,518 20 11 52
38 14 21 90,055 25 0 49
39 1 42 95,944 33 0 48
40 8 12 102,289 6 31 52
41 7 34 109,048 32 17 54
42 13 45 116,013 30 36 53
21
AGGLOMERATION SCHEDULE
STAGE CLUSTER COMBINED
COEFFICIENTS STAGE CLUSTER FIRST APPEARS
NEXT STAGE CLUSTER 1 CLUSTER 2 CLUSTER 1 CLUSTER 2
43 19 40 123,474 0 0 46
44 9 11 131,625 35 29 54
45 3 31 139,871 0 19 48
46 19 47 149,201 43 0 53
47 4 22 158,989 0 34 51
48 1 3 170,166 39 45 55
49 14 23 182,297 38 0 50
50 2 14 196,862 27 49 56
51 4 5 211,550 47 28 57
52 8 16 228,197 40 37 56
53 13 19 245,584 42 46 55
54 7 9 266,097 41 44 59
55 1 13 290,419 48 53 58
56 2 8 322,076 50 52 57
57 2 4 357,631 56 51 58
58 1 2 401,216 55 57 59
59 1 7 531,000 58 54 0

22
Source: Field, A. (2009). Discovering Statistics Using SPSS. London: SAGE.

23
ANOVA Table
SUM OF SQUARES
DF MEAN SQUARE F SIG.
Zscore: S1; Location * Cluster Number of Case
Between Groups (Combined) 13,526 4 3,381 4,090 ,006
Within Groups 45,474 55 ,827
Total 59,000 59
Zscore: S2: Cooperation * Cluster Number of Case
Between Groups (Combined) 22,910 4 5,728 8,729 ,000
Within Groups 36,090 55 ,656
Total 59,000 59
Zscore: S3: Market orientation* Cluster Number of Case
Between Groups (Combined) 16,049 4 4,012 5,138 ,001
Within Groups 42,951 55 ,781
Total 59,000 59
Zscore: S4: Guests' satisfaction * Cluster Number of Case
Between Groups (Combined) 32,997 4 8,249 17,448 ,000
Within Groups 26,003 55 ,473
Total 59,000 59
Zscore: S5: Service quality * Cluster Number of Case
Between Groups (Combined) 30,892 4 7,723 15,111 ,000
Within Groups 28,108 55 ,511
Total 59,000 59
Zscore: S6: Segmentation * Cluster Number of Case
Between Groups (Combined) 28,220 4 7,055 12,607 ,000
Within Groups 30,780 55 ,560
Total 59,000 59
Zscore: S7: Employee management* Cluster Number of Case
Between Groups (Combined) 32,574 4 8,144 16,949 ,000
Within Groups 26,426 55 ,480
Total 59,000 59
Zscore: S8: Flexibility * Cluster Number of Case
Between Groups (Combined) 30,431 4 7,608 14,646 ,000
Within Groups 28,569 55 ,519
Total 59,000 59
Zscore: S9: Business development * Cluster Number of Case
Between Groups (Combined) 42,072 4 10,518 34,173 ,000
Within Groups 16,928 55 ,308
Total 59,000 59
ROA_mean * Cluster Number of Case
Between Groups (Combined) 7679,591 4 1919,898 ,821 ,518
Within Groups 121673,443 52 2339,874
Total 129353,034 56
ROE_mean * Cluster Number of Case
Between Groups (Combined) 5193,705 4 1298,426 2,622 ,045
Within Groups 25252,357 51 495,144
Total 30446,061 55
GOP_mean * Cluster Number of Case
Between Groups (Combined) 2630,965 4 657,741 ,997 ,418
Within Groups 34308,379 52 659,777
Total 36939,345 56
Sales growth * Cluster Number of Case
Between Groups (Combined) 4212,450 4 1053,113 1,018 ,407
Within Groups 51704,707 50 1034,094
Total 55917,157 54
Growth of assets * Cluster Number of Case
Between Groups (Combined) 30770,016 4 7692,504 1,053 ,390
Within Groups 365294,526 50 7305,891
Total 396064,542 54
Selfevaluation * Cluster Number of Case
Between Groups (Combined) 8,292 4 2,073 2,259 ,075
Within Groups 47,708 52 ,917
Total 56,000 56

24
SUM OF SQUARES
DF MEAN SQUARE F SIG.
Environmental policies * Cluster Number of Case
Between Groups (Combined) 9,820 4 2,455 2,771 ,037
Within Groups 45,180 51 ,886
Total 55,000 55
Cooperation and employee management * Cluster Number of Case
Between Groups (Combined) 5,757 4 1,439 1,488 ,219
Within Groups 52,243 54 ,967
Total 58,000 58
Statistics
N
MEAN MEDIAN STD.
DEVIATION Valid Missing
Please read the following statement: Our hotel(s) are very well accessible by air connections.
60 0 4,02 4,50 1,827
Please read the following statement: Our hotel(s) are very well accessible by public connections.
60 0 5,52 6,00 1,546
Please read the following statement: Our hotel(s) are very well accessible by public road connections.
60 0 3,52 3,00 1,662
Please read the following statement: Our hotel(s) have enough parking facilities, so our guests don't have any problems with parking.
60 0 5,95 6,00 1,320
Please read the following statement: Our hotel(s) are close to city centre. 60 0 5,27 6,00 1,803
Please read the following statement: Our hotels are close to natural attractions.
59 1 5,46 6,00 1,381
Please read the following statement: The location of our hotels is favourable for business guests.
59 1 5,34 6,00 1,636
Please read the following statement: Our hotel(s) are located in the destinations that create typical tourist demand (among the leading in the region)
59 1 5,53 6,00 1,775
Please read the following statement: Key tourism participants in our destinations meet regularly in order to exchange ideas
60 0 4,25 5,00 1,580
Please read the following statement: Key tourism participants in our destinations perform joint business activities (e.g. joint appearance on foreign markets).
60 0 4,37 5,00 1,697
Please read the following statement: Key tourism participants in our destinations actively participate in the formation of a joint development strategy of the destination.
60 0 4,07 5,00 1,656
Please read the following statement: Participants in our destinations actively participate in the implementation of the development strategy of the destination.
60 0 3,90 4,00 1,644
Please read the following statement: In our company we quickly adapt to changes in our guest's preferences.
60 0 5,88 6,00 ,865
Please read the following statement: In our company we quickly adapt to changes in the industry (e.g. sharing economy, climate changes in the industry).
58 2 5,21 5,00 1,136
Please read the following statement: If something important happens to one of our key customers, all our hotel employees know it immediately.
60 0 5,13 6,00 1,523
Please read the following statement: If one of our departments learns something important about our competitors, it immediately informs all other departments.
60 0 5,33 6,00 1,271
Please read the following statement: In our company we all understand marketing information, which are key to our business.
59 1 4,81 5,00 1,332
Please read the following statement: In our company we have the same understanding regarding the effects of marketing activities on our company's business.
60 0 4,73 5,00 1,388
Please read the following statement: We respond in a very short time to price-oriented actions of our competitors.
60 0 5,30 5,00 1,357

25
N
MEAN MEDIAN STD.
DEVIATION Valid Missing
Please read the following statement: We respond immediately if one of our most important competitors directs marketing promotion to acquire our guests.
60 0 5,68 6,00 1,081
Please read the following statement: Satisfaction of our guests has been continuously growing in the last three years.
60 0 5,95 6,00 ,946
Please read the following statement: The level of service delivery in our company is in line with our guest's expectations.
60 0 5,77 6,00 ,621
Please read the following statement: The number of guest's complaints (including online complaints) has been steadily decreasing in the last three years.
60 0 5,67 6,00 1,068
Please read the following statement: The average on online ratings on guest's satisfaction with the service of our company is higher than the average of online ratings of our direct competitors.
60 0 4,83 5,00 1,542
Please read the following statement: Our company has a higher share of regular guests than our direct competitors.
60 0 5,03 5,00 1,248
Please read the following statement: Number of regular guests in our company has been steadily growing in the last three years.
60 0 5,62 6,00 1,180
Please read the following statement: Our company is regularly investing (min 5% of total revenue) in building maintenance and hotel equipment.
60 0 5,55 6,00 1,443
Please read the following statement: The appearance of our hotels is more attractive compared to our direct competitors.
60 0 5,12 5,00 1,342
Please read the following statement: Our employees' image is better compared to our direct competitors.
60 0 4,92 5,00 1,183
Please read the following statement: In our company guests are accurately informed when services will be carried out.
60 0 5,77 6,00 ,909
Please read the following statement: In our company employees are always ready to serve the guests.
60 0 6,20 6,00 ,898
Please read the following statement: In our company employees are quick to respond to guest's requests.
59 1 6,17 6,00 ,894
Please read the following statement: In our company we trust our employees. 59 1 6,07 6,00 ,907
Please read the following statement: Our employees know their work well in order to satisfy the guests.
59 1 5,98 6,00 ,799
Please read the following statement: Our employees have all necessary support to be able to do their job well.
60 0 6,13 6,00 ,892
Please read the following statement: Employees in our company are familiar with the needs of our guests.
60 0 5,80 6,00 ,898
Please read the following statement: Well-being of our guests is the basis of our operation.
59 1 6,66 7,00 ,545
Please read the following statement: In our hotel we serve quality food, which is well presented, to our guests.
59 1 5,97 6,00 1,098
Please read the following statement: The food in our hotels is always fresh. 59 1 6,14 6,00 1,042
Please read the following statement: In our company we perform segmentation according to target markets.
60 0 5,37 6,00 1,365
Please read the following statement: In our company we perform segmentation by sales channels.
60 0 5,47 6,00 1,282
Please read the following statement: In our company we know segments of our guests for individual tourist products.
60 0 5,77 6,00 1,125
Please read the following statement: Employees in our company are well qualified for their work.
60 0 5,92 6,00 ,671
Please read the following statement: Our company is attractive for highly professional quality personnel.
60 0 5,32 5,00 1,200
Please read the following statement: Employees’ resignations don’t pose any particular issue to our company
60 0 4,53 5,00 1,396

26
N
MEAN MEDIAN STD.
DEVIATION Valid Missing
Please read the following statement: New employees have on average of at least two years of working experience in the industry.
60 0 4,65 5,00 1,560
Please read the following statement: In our company the share of seasonal employees in the total number of the employees in lower than the industry’s average.
60 0 5,08 6,00 1,889
Please read the following statement: Our employees are constantly developing their knowledge.
60 0 5,17 5,00 1,196
Please read the following statement: Employees in our company are learning also from our guests.
60 0 5,57 6,00 1,226
Please read the following statement: Employees in our company are regularly (at least once a year) educating for the need of their workplace.
60 0 5,15 5,00 1,412
Please read the following statement: Employees in our company regularly share ideas.
60 0 5,52 6,00 1,049
Please read the following statement: In our company processes are efficient, which enables us to have all necessary information for our business on daily basis.
59 1 5,68 6,00 ,860
Please read the following statement: In our company we execute processes in accordance with the defined hotel and quality standards.
59 1 5,71 6,00 1,001
Please read the following statement: Internal processes in our company are being constantly improved.
59 1 6,00 6,00 ,766
Please read the following statement: In our company we have quality databases, which help us in making business decisions.
59 1 5,29 5,00 1,190
Please read the following statement: In our company we have good data analytics, which helps in making business decisions.
60 0 5,28 5,50 1,316
Please read the following statement: In our company we’ve managed to optimize key business processes with the help of technology.
60 0 5,07 5,00 1,219
Please read the following statement: In our company we already use smart reception solutions (on line check-in, etc)
60 0 3,88 4,00 1,905
Please read the following statement: In our company we quickly introduce technological solutions that are important for our business.
60 0 4,83 5,00 1,452
Please read the following statement: In our company we implement all safety recommendations with the aim of ensuring the highest possible level of safety for all participants.
60 0 5,97 6,00 ,758
Please read the following statement: In our company we adapt our offer to demographic changes.
60 0 5,27 5,00 1,006
Please read the following statement: In our company we perform environmental protection activities.
60 0 5,52 6,00 1,295
Please read the following statement: In the company we provide e-mobile services to all participants (transport, e-communication, etc.)
60 0 5,10 5,00 1,362
Please read the following statement: In our company we develop new business models, which take into account the growth of sharing economy.
60 0 4,38 5,00 1,508
Please read the following statement: Our company works well with local environment and respond to its needs.
47 13 5,74 6,00 ,943
Please read the following statement: Sales growth 58 2 5,74 6,00 1,052
Please read the following statement: Market share 58 2 5,43 6,00 ,939
Please read the following statement: Guest satisfaction 58 2 5,59 6,00 ,918
Please read the following statement: Share of regular guests 58 2 5,50 6,00 1,030
Please read the following statement: Return on investment (ROI) 58 2 5,21 5,00 1,151
Please read the following statement: Return on equity (ROE) 58 2 5,02 5,00 1,235
Please read the following statement: Room occupancy rate 57 3 5,75 6,00 ,892
Please read the following statement: RevPAR (Revenue per available room) 57 3 5,46 6,00 ,983

27
Appendix 5: Descriptive statistics and correlations Statistics
COUNTRY ROA_MEAN ROE_MEAN GOP_MEAN ASSET’S GROWTH
HOTELS CATEGORY 1* OR 2*
HOTELS CATEGORY 3*
HOTELS CATEGORY 4*
HOTELS CATEGORY 5* SALES 2013 SALES 014 SALES 2015 SALES 2016
SLO N Valid 45 45 45 45 48 48 48 48 28 28 30 45
Missing 3 3 3 3 0 0 0 0 20 20 18 3
Mean -1,1473 9,3877 45,5327 17,7552 ,13 ,79 1,44 ,15 16.589.109,9 16.187.047,9 15.725.946,0 11.150.161,5
Median 1,1804 2,8422 49,5571 ,0000 ,00 1,00 1,00 ,00 6.616.210,5 6.359.545,0 6.423.984,5 2.471.436,7
Std. Deviation 50,79054 24,35206 17,31234 93,97043 ,489 1,071 1,649 ,412 24.431.312,8 24.543.600,65 24.404.787,9 21.611.035,2
Sum -51,63 422,44 2048,97 798,98 6 38 69 7 464.495.077,0 453.237.341,0 471.778.379,0 501.757.266,0
Percentiles 25 -1,1928 -2,5291 40,8507 -13,3836 ,00 ,00 ,00 ,00 1.246.601,0 1.332.276,8 1.812.768,0 409.140,7
50 1,1804 2,8422 49,5571 ,0000 ,00 1,00 1,00 ,00 6.616.210,5 6.359.545,0 6.423.984,5 2.471.436,7
75 5,0266 20,3694 55,0098 ,8672 ,00 1,00 3,00 ,00 22.862.811,0 21.135.770,8 20.243.981,5 15.642.368,1
HR N Valid 12 11 12 10 12 12 12 12 9 9 10 12
Missing 0 1 0 2 0 0 0 0 3 3 2 0
Mean 10,7508 1,7027 14,9475 12,4770 ,75 3,25 3,83 1,17 41.789.010,0 47.287.525,8 46.245.822,7 43.770.905,0
Median ,9700 1,6000 26,4300 2,5600 ,00 1,00 2,00 ,50 36.459.540,0 37.124.373,0 27.159.210,5 15.034.805,0
Std. Deviation 36,31430 5,58307 36,79131 28,47456 1,357 4,475 5,237 1,586 39.679.978,3 49.963.313,8 54.565.374,1 61.351.020,1
Sum 129,01 18,73 179,37 124,77 9 39 46 14 376.101.090,0 425.587.732,0 462.458.227,0 525.250.860,0
Percentiles 25 -2,1425 -2,2500 4,6575 -12,9750 ,00 ,00 ,00 ,00 7.323.969,5 7.266.031,5 4.990.158,5 2.964.838,0
50 ,9700 1,6000 26,4300 2,5600 ,00 1,00 2,00 ,50 36.459.540,0 37.124.373,0 27.159.210,5 15.034.805,0
75 4,3350 7,2500 41,6000 40,8625 1,00 6,50 4,75 2,50 78.143.975,5 83.685.690,0 76.772,904,5 59.900.372,8

28
Correlations
ROA ROE GOP REVENUE GROWTH LOCATION COOPERATION
MARKET ORIENTATION
GUESTS SATISFACTION
QUALITY OF SERVICES SEGMENTATION
EMPLOYEE MANAGEMENT FLEXIBILITY
IT DEVELOPMENT
ROA Pearson Correlation 1 ,042 -,128 -,139 -,088 ,215 ,321* -,071 ,119 -,080 ,137 ,167 ,085 Sig. (2-tailed) ,759 ,343 ,311 ,517 ,108 ,015 ,598 ,378 ,554 ,308 ,215 ,528 N 57 56 57 55 57 57 57 57 57 57 57 57 57
ROE Pearson Correlation ,042 1 -,131 -,050 -,092 -,286* ,199 ,154 ,321* -,164 ,059 ,142 ,078 Sig. (2-tailed) ,759 ,335 ,717 ,501 ,033 ,140 ,256 ,016 ,227 ,665 ,295 ,567 N 56 56 56 54 56 56 56 56 56 56 56 56 56
GOP Pearson Correlation -,128 -,131 1 ,036 -,122 ,006 -,170 ,035 -,140 ,065 ,020 -,129 -,094 Sig. (2-tailed) ,343 ,335 ,791 ,365 ,962 ,205 ,798 ,299 ,631 ,882 ,339 ,486 N 57 56 57 55 57 57 57 57 57 57 57 57 57
Revenue Growth
Pearson Correlation -,139 -,050 ,036 1 ,096 ,137 ,102 ,109 ,011 ,195 ,097 ,019 -,030 Sig. (2-tailed) ,311 ,717 ,791 ,485 ,320 ,457 ,430 ,939 ,153 ,481 ,889 ,830 N 55 54 55 55 55 55 55 55 55 55 55 55 55
Location Pearson Correlation -,088 -,092 -,122 ,096 1 ,251 -,079 -,028 ,015 ,127 -,150 ,017 -,033 Sig. (2-tailed) ,517 ,501 ,365 ,485 ,053 ,550 ,834 ,909 ,334 ,253 ,899 ,802 N 57 56 57 55 60 60 60 60 60 60 60 60 60
Cooperation Pearson Correlation ,215 -,286* ,006 ,137 ,251 1 ,221 ,268* ,163 ,374** ,281* ,222 ,278* Sig. (2-tailed) ,108 ,033 ,962 ,320 ,053 ,089 ,039 ,215 ,003 ,030 ,088 ,031 N 57 56 57 55 60 60 60 60 60 60 60 60 60
Market Orientation
Pearson Correlation ,321* ,199 -,170 ,102 -,079 ,221 1 ,359** ,467** ,228 ,464** ,392** ,310* Sig. (2-tailed) ,015 ,140 ,205 ,457 ,550 ,089 ,005 ,000 ,080 ,000 ,002 ,016 N 57 56 57 55 60 60 60 60 60 60 60 60 60
Guests Satisfaction
Pearson Correlation -,071 ,154 ,035 ,109 -,028 ,268* ,359** 1 ,522** ,040 ,550** ,342** ,299* Sig. (2-tailed) ,598 ,256 ,798 ,430 ,834 ,039 ,005 ,000 ,762 ,000 ,007 ,020 N 57 56 57 55 60 60 60 60 60 60 60 60 60
Quality of Services
Pearson Correlation ,119 ,321* -,140 ,011 ,015 ,163 ,467** ,522** 1 ,185 ,428** ,411** ,447**
Sig. (2-tailed) ,378 ,016 ,299 ,939 ,909 ,215 ,000 ,000 ,157 ,001 ,001 ,000 N 57 56 57 55 60 60 60 60 60 60 60 60 60
Segmentation Pearson Correlation -,080 -,164 ,065 ,195 ,127 ,374** ,228 ,040 ,185 1 ,292* ,450** ,367** Sig. (2-tailed) ,554 ,227 ,631 ,153 ,334 ,003 ,080 ,762 ,157 ,023 ,000 ,004 N 57 56 57 55 60 60 60 60 60 60 60 60 60

29
Employee Management
Pearson Correlation ,137 ,059 ,020 ,097 -,150 ,281* ,464** ,550** ,428** ,292* 1 ,546** ,388** Sig. (2-tailed) ,308 ,665 ,882 ,481 ,253 ,030 ,000 ,000 ,001 ,023 ,000 ,002 N 57 56 57 55 60 60 60 60 60 60 60 60 60
Flexibility Pearson Correlation ,167 ,142 -,129 ,019 ,017 ,222 ,392** ,342** ,411** ,450** ,546** 1 ,601** Sig. (2-tailed) ,215 ,295 ,339 ,889 ,899 ,088 ,002 ,007 ,001 ,000 ,000 ,000 N 57 56 57 55 60 60 60 60 60 60 60 60 60
IT Development
Pearson Correlation ,085 ,078 -,094 -,030 -,033 ,278* ,310* ,299* ,447** ,367** ,388** ,601** 1 Sig. (2-tailed) ,528 ,567 ,486 ,830 ,802 ,031 ,016 ,020 ,000 ,004 ,002 ,000 N 57 56 57 55 60 60 60 60 60 60 60 60 60
*. Correlation is significant at the 0.05 level (2-tailed). **. Correlation is significant at the 0.01 level (2-tailed).

30
ANOVA Table
SUM OF SQUARES DF MEAN SQUARE F SIG.
ROA_mean * Country Between Groups (Combined) 1341,141 1 1341,141 ,576 ,451
Within Groups 128011,893 55 2327,489
Total 129353,034 56
ROE_mean * Country Between Groups (Combined) 522,032 1 522,032 1,068 ,306
Within Groups 26404,710 54 488,976
Total 26926,742 55
GOP_mean * Country Between Groups (Combined) 8862,186 1 8862,186 17,360 ,000
Within Groups 28077,158 55 510,494
Total 36939,345 56
Sales growth * Country Between Groups (Combined) 744,175 1 744,175 ,715 ,402
Within Groups 55172,982 53 1041,000
Total 55917,157 54
Sales 2013 * Country Between Groups (Combined) 4325103007657151,000 1 4325103007657151,000 5,272 ,028
Within Groups 28712009578510356,000 35 820343130814581,600
Total 33037112586167508,000 36
Sales 2014 * Country Between Groups (Combined) 6587686773431088,000 1 6587686773431088,000 6,363 ,016
Within Groups 36235146797051360,000 35 1035289908487181,800
Total 42822833570482448,000 36
Sales 2015 * Country Between Groups (Combined) 6985971568633957,000 1 6985971568633957,000 6,024 ,019
Within Groups 44068636954919632,000 38 1159700972497885,000
Total 51054608523553592,000 39
Sales 2016 * Country Between Groups (Combined) 10081069661610006,000 1 10081069661610006,000 8,950 ,004
Within Groups 61953045391683944,000 55 1126419007121526,200
Total 72034115053293952,000 56
Growth of Assets * Country
Between Groups (Combined) 227,937 1 227,937 ,031 ,862
Within Groups 395836,605 53 7468,615
Total 396064,542 54
Descriptive Statistics
N MEAN STD. DEVIATION
ROA_mean 57 1,3576 48,06117
ROE_mean 56 7,8781 22,12639
GOP_mean 57 39,0937 25,68329
Sales growth 55 14,8080 32,17923
Assets growth 55 16,7955 85,64186
Valid N (listwise) 54

31
Correlations
ROE_MEAN ROA_MEAN GOP_MEAN SALES 2016
ROE_mean Pearson Correlation 1 ,042 -,131 -,128
Sig. (2-tailed) ,759 ,335 ,345
N 56 56 56 56
ROA_mean Pearson Correlation ,042 1 -,128 ,005
Sig. (2-tailed) ,759 ,343 ,970
N 56 57 57 57
GOP_mean Pearson Correlation -,131 -,128 1 ,117
Sig. (2-tailed) ,335 ,343 ,386
N 56 57 57 57
Sales 2016 Pearson Correlation -,128 ,005 ,117 1
Sig. (2-tailed) ,345 ,970 ,386
N 56 57 57 57
Sig. (2-tailed) ,455 ,365 ,272 ,118
N 53 54 54 54
Nonparametric Correlations SPEARMAN'S RHO ROE_MEAN ROA_MEAN GOP_MEAN SALES 2016
ROE_mean Correlation Coefficient 1,000 ,510** -,276* -,325*
Sig. (2-tailed) . ,000 ,039 ,015
N 56 56 56 56
ROA_mean Correlation Coefficient ,510** 1,000 -,055 -,178
Sig. (2-tailed) ,000 . ,687 ,185
N 56 57 57 57
GOP_mean Correlation Coefficient -,276* -,055 1,000 ,239
Sig. (2-tailed) ,039 ,687 . ,074
N 56 57 57 57
Sales 2016 Correlation Coefficient -,325* -,178 ,239 1,000
Sig. (2-tailed) ,015 ,185 ,074 .
N 56 57 57 57


![Klara BožIč,9[1].D Nega Las](https://img.dokumen.tips/doc/110x75/55d0dcadbb61eb44798b460e/klara-bozic91d-nega-las.jpg)