Embed Size (px)
Citation preview
The College of Forest Resources University of Washington
Report to the Washington State Legislature
Wood to Energy in Washington: Imperatives, Opportunities, and
Obstacles to Progress
June 2009
C. Larry Mason, Richard Gustafson, John Calhoun, Bruce R. Lippke, and Natalia Raffaeli
University of Washington College of Forest Resources
Box 352100 Seattle, WA. 98195-2100

i
Acknowledgements This report represents a synthesis of information and analysis provided from many sources. The work of the research team included a review of scientific, government, non-governmental organization, and industry literature; the popular press; and interviews with government agency personnel, industry professionals, products venders, community representatives, tribal leaders, and others. Members of the collaborative research team included Larry Mason, Research Scientist and Project Coordinator of the Rural Technology Initiative (RTI); Richard Gustafson, Professor of Pulp and Paper Sciences and Director of the Bioenergy Workgroup at the University of Washington; John Calhoun, Director of the Olympic Natural Resources Center (ONRC); Bruce Lippke, Economics Professor and Director of the Consortium for Research in Renewable Industrial Materials (CORRIM) and Director of RTI; Natalia Raffaeli, Research Assistant and PhD. candidate. Administrative support was provided by Clara Burnett (RTI). Additional assistance was provided by David Sjoding and Kim Lyons, Washington State University Energy Program; Peter Moulton, Tony Usibelli, Greg Nothstein, and Tim Stearns, Washington Department of Community, Trade and Economic Development; Mark Fuchs, Washington Department of Ecology; Craig Frear, Don Young, and Jonathan Yoder, Washington State University School of Economic Sciences, and many others. This work was made possible by funding provided by and under the mandate of the Washington State Legislature through the Washington Department of Community, Trade and Economic Development. Any opinions, findings, conclusions, or recommendations expressed in this publication are those of the authors and do not necessarily reflect the views of the University of Washington, the Washington State Legislature or the many project cooperators. The full document can be accessed and down loaded from the following address: http://www.ruraltech.org/pubs/reports/2009/wood_to_energy/index.asp “The fuel of the future is going to come from apples, weeds, sawdust—almost anything. There is fuel in every bit of vegetable matter that can be fermented.” Henry Ford, "Ford Predicts Fuel from Vegetation," New York Times, Sept. 20, 1925, p. 24. "With all due deference for the dream chemists, armchair farmers and platform orators who have touted alcohol-gasoline as the greatest of all fuels, oil industry technologists know and automotive engineers know that it is not as satisfactory a fuel as straight gasoline of normal quality." Conger Reynolds, "The Alcohol Gasoline Proposal," American Petroleum Institute Proceedings, 20th Annual Meeting, Nov. 9, 1939.
ii
Executive Summary At the request of the Washington State Legislature, a thorough investigation of the potential for utilization of wood for renewable energy in Washington has been conducted by University of Washington scientists. Summary findings and recommendations are presented below.
Key Study Findings:
Three fundamental imperatives compel changes in energy policy: Climate Change Mitigation, Energy Independence, and Sustainability.
Washington is 100 percent reliant upon oil imported from other states or abroad. Petroleum consumption for transportation accounts for half of all Washington greenhouse gas (GHG) emissions. Washingtonians spent $9 billion on fuel imports in 2006.
Washington, with substantial hydro-electric and nuclear generation capacity, is a net power exporter, has low electricity rates, and generates the cleanest electricity in the Nation. Unlike the transportation sector, changes in electricity generation have comparatively limited potential to reduce greenhouse emissions.
Where possible, development of renewable in-state sources of transportation fuel should be the State’s highest energy priority.
Plant biomass is the only Washington renewable resource that can be converted to biofuels for transportation, such as ethanol.
Wood is the dominant biomass resource in Washington; accounting for two-thirds of all potentially available biomass.
Production of renewable biofuels in Washington will necessarily require wood as a primary feedstock and efforts to reduce State greenhouse gas emissions must fully consider forests and forest resources.
Forests play a unique role in climate change mitigation by absorbing CO2 through photosynthesis, storing carbon in tree biomass and building products, offsetting use of polluting building product alternatives, and by providing biomass for energy.
Thinning forests to avoid CO2 emissions from catastrophic wildfires while providing wood resources for green building materials and renewable biofuels will deliver double greenhouse gas emission reduction benefits while sustaining forest ecosystems. As example, in 2006, greenhouse gas emissions from wildfires in Washington were greater than total emissions from electricity generation.
The forest industry represents the State’s largest biomass collection system, is the largest industrial provider of renewable energy, and has potential to significantly improve wood-to-energy recoveries and outputs.
Energy recovery of liquid fuels from wood biomass will require large integrated biorefinery installations that must be able to secure resources for operations and markets for bioenergy outputs.
Significant production of biofuels in Washington will be dependent upon regular collection of millions of tons of wood biomass augmented, where possible, with recovered biomass from cities and fields.
Federal policies, such as the Energy Independence and Security Act of 2007, restrict use of wood biomass from National Forests for energy conversions undermining both biofuels development and reduction of CO2 emissions from forest fires.
Where possible, co-location of biorefineries with pulp and paper mills represents the greatest potential State opportunity to maximize energy recovery of liquid fuels, electricity, and process steam from woody biomass resources. Co-location will bring reduced capital costs, access to
iii
needed infrastructure, synergies for integrated raw materials and product streams, and an engaged corps of highly-skilled chemical engineers and union workers.
Sustainable development of renewable energy alternatives to fossil fuels will require careful planning, resource conservation, and committed policy supports.
Where biorefinery development is feasible, State policies must be designed to accommodate considerable biomass deliveries.
Where biorefinery development is not feasible, secondary wood-to-energy priorities could include co-fired generation, wood pellet manufacture, or institutional heating.
Washington State must have a cohesive strategy for renewable energy development to meet its renewable energy and green house emission goals.
Washington does not have a Department of Energy or other organizational framework for effective scientific participation in policy consideration of the interrelated topics of energy, climate, and forest resources.
Criteria for comparisons of potential alternative energy and resource applications have not been developed to inform energy policy priorities. As example, the implications of wood biomass combustion for electricity verses chemical conversion to transportation fuels appear, as of yet, to have not been considered in State energy policy.
The many public benefits of energy alternatives to fossil fuels are not readily captured by consumer markets and, in lieu of integrated planning, are not adequately characterized in State energy policy.
Current State energy policies, such as I-937, inadvertently favor small-scale and inefficient conversions of biomass to electricity which fail to address energy independence, have poor raw material-to-energy yields, and compromise biofuels development.
In absence of integrated planning and enduring commitment to change, opportunities for wood to energy are compromised while combustion of imported fossil fuels and associated green house gas emissions continue to increase.
Recommendations:
A lead State agency is needed to coordinate policy development for the interrelated topic areas of climate change mitigation, energy independence, and sustainable management of State natural resources.
An inter-disciplinary team of scientists from Washington’s universities should be assembled to develop recommendations for realistic, effective, and implementable strategies for renewable energy development and climate change mitigation.
Robust methodologies such as Life Cycle Assessments (LCA) and Net Energy Balance (NEB) must be employed for energy alternative evaluations if comparative benefits are to be understood.
Energy priorities need to be identified to inform development of a cohesive State energy plan.
Policy mechanisms should be designed to capture the non-market values and avoided costs of reduced reliance upon fossil energy.
An effectiveness comparison for Washington of a cap and trade program verses a carbon tax or other climate policy option should be conducted once energy priorities are identified.
Policy supports must be developed to encourage investment in renewable energy and assure viable markets for energy products.
iv
Washington should pursue policies that support large-scale biofuels projects rather than inefficient small-scale power projects.
A pilot project for an integrated biorefinery, located at a pulp and paper mill, should be developed and implemented in Washington.
Washington policy makers should pursue regulatory changes that broaden rather than constrain access to forest biomass resources.
Investments in thinning for forest health offer unique opportunities to combine ecosystem protections with bioenergy development.
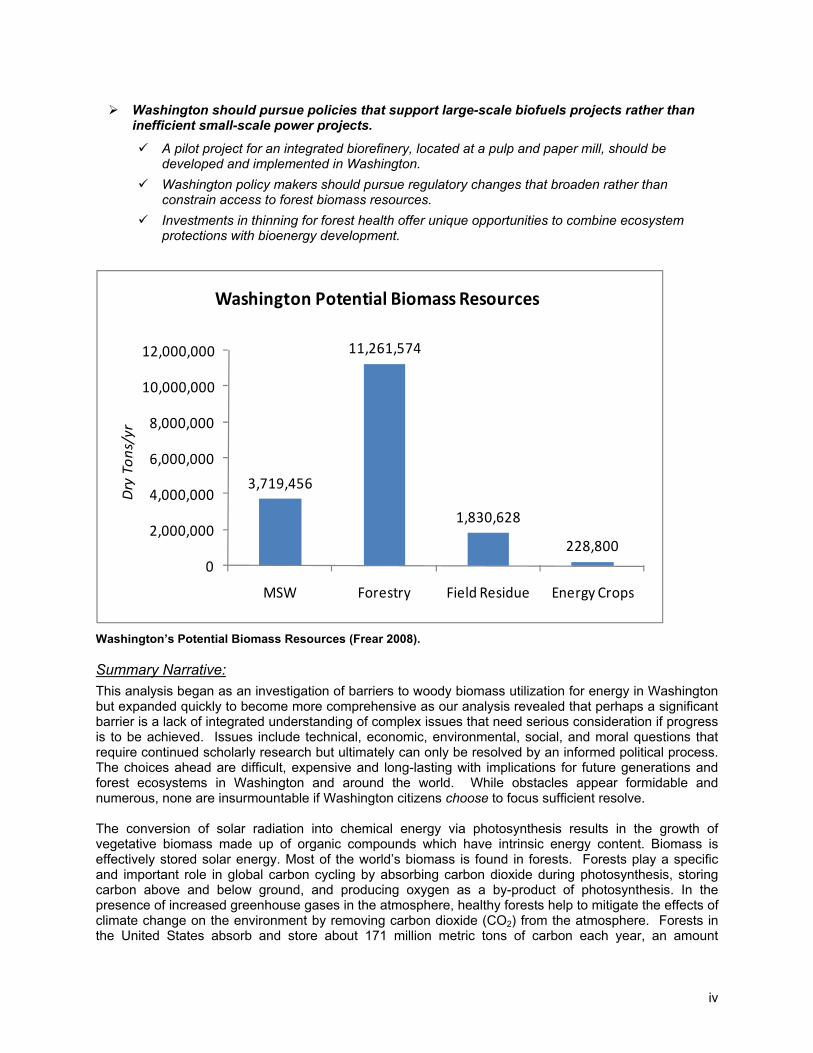
Washington’s Potential Biomass Resources (Frear 2008). Summary Narrative: This analysis began as an investigation of barriers to woody biomass utilization for energy in Washington but expanded quickly to become more comprehensive as our analysis revealed that perhaps a significant barrier is a lack of integrated understanding of complex issues that need serious consideration if progress is to be achieved. Issues include technical, economic, environmental, social, and moral questions that require continued scholarly research but ultimately can only be resolved by an informed political process. The choices ahead are difficult, expensive and long-lasting with implications for future generations and forest ecosystems in Washington and around the world. While obstacles appear formidable and numerous, none are insurmountable if Washington citizens choose to focus sufficient resolve. The conversion of solar radiation into chemical energy via photosynthesis results in the growth of vegetative biomass made up of organic compounds which have intrinsic energy content. Biomass is effectively stored solar energy. Most of the world’s biomass is found in forests. Forests play a specific and important role in global carbon cycling by absorbing carbon dioxide during photosynthesis, storing carbon above and below ground, and producing oxygen as a by-product of photosynthesis. In the presence of increased greenhouse gases in the atmosphere, healthy forests help to mitigate the effects of climate change on the environment by removing carbon dioxide (CO2) from the atmosphere. Forests in the United States absorb and store about 171 million metric tons of carbon each year, an amount
3,719,456
11,261,574
1,830,628
228,8000
2,000,000
4,000,000
6,000,000
8,000,000
10,000,000
12,000,000
MSW Forestry Field Residue Energy Crops
Dry Ton
s/yr
Washington Potential Biomass Resources
v
equivalent to 11 percent of the country’s CO2 emissions. The highest sustained carbon accumulation rates for American forests are reported to occur with new forest growth on high productivity sites in the western Pacific Northwest. Sustainably-managed forests that are periodically harvested, planted, and re-grown to produce a continuing series of short- and long-lived products and energy feedstocks, sequester and offset more cumulative carbon than forests that are left unharvested. When forest health declines or when forest fires occur, releases of stored forest carbon transform forests so that they become a carbon source rather than a sink. Wood residues from forests can be referred to as woody biomass or as lignocellulosic or cellulosic energy feedstocks. All wood fiber that does not have higher value product potential for non-energy applications can be considered as woody biomass. Woody biomass can include forest residues such as tops, limbs, foliage, bark, rotten logs, and stumps (otherwise commonly known as logging slash) that historically have been left on site or burned following timber harvest. Woody biomass may also include such materials as may be salvaged from pre-commercial thinning activities, designed to reduce stocking densities in young forests such that remaining tree growth is optimized. Forest fuels reductions (generally in fire-prone dry forests) can produce woody biomass as small diameter understory stems and ladder fuels are removed to create conditions such that, when an ignition occurs, a comparatively benign ground fire is the result rather than a destructive crown fire. Woody biomass also refers to primary and secondary wood product manufacturing residuals including bark, saw dust, planer shavings, and ground wood pieces known as hog fuel. Wood chips that are manufactured from round logs not suitable for lumber manufacture or sawmill slabs and pieces may also be used for energy feedstocks but are generally considered to have higher value for paper manufacture. A by-product of pulp and paper manufacture is black liquor; which is another wood process residual that is used for energy. Dedicated tree plantation crops such as fast-growing poplar and willow may also be used for energy generation. The yield from such crops is considered woody biomass although the cultivation practices more closely resemble those of agriculture. There are many contemporary wood-to-energy conversion alternatives that can be and are employed to produce heat and electricity as well as solid, liquid, or gaseous fuels. Energy conversions can be as simple as combustion for heat or as sophisticated as biochemical and thermochemical processes to produce transportation fuels such as ethanol. We find that, while conversion technologies are improving through continued research, many wood-to-energy applications have been used for decades, are technically feasible, and could be immediately implemented; albeit at costs that are not readily competitive with fossil fuel alternatives given current energy market dynamics. Examination of energy markets reveals that significant environmental and economic costs resulting from fossil fuel combustion and reliance upon imported oil have not been incorporated into consumer prices. For example, societal costs of climate change and health impacts from gasoline combustion have been estimated at more than $1.00 per gallon while reliance upon imported oil from politically volatile areas of the world has been shown to reduce US gross domestic product by upwards of one percent. These real public costs add up to hundreds of billions of dollars annually but are not included in the consumer price of fossil energy. There are also substantial public costs associated with failure to manage forests to reduce overstocked densities. Especially compelling are the considerable potentially avoided environmental and economic costs of catastrophic wildfires. US wildfire suppression costs alone are in the billions of dollars annually and the Climate Impacts Group at the University of Washington forecasts that, without action, global warming will increase incidence and intensities of forest fires in the inland west. Wood biomass is the dominant State non-hydro source of renewable energy; representing fully two-thirds of Washington’s potentially available biomass inventory. Unlike agriculture, forests don’t require large amounts of polluting fertilizers, volumes of water for irrigation, or transformations of ecosystems to non-native vegetation. The Washington forest industry represents the largest biomass collection infrastructure in the state. Given Washington commitments to renewable energy development and greenhouse gas emissions reductions, utilization of wood wastes for energy should be a high priority. However, if progress is to occur then the economics and other benefits of wood biomass for energy must be better understood. Given that fossil fuels are energy-rich and inexpensive, policy supports for
vi
renewable energy alternatives, based upon explicit cost/benefit analyses, will be needed. It should be recognized that the existing forest industry infrastructure is a significant contributor of renewable energy and that, with policy support for investment, could increase energy outputs from the existing captured resources such as hog fuel and black liquor. Manufacturing wastes are a byproduct of higher value solid wood and paper manufacture and are the lowest cost source of biomass. The pulp and paper industry has potential for biorefinery development to efficiently produce a mixture of products outputs that could be expanded to include heat, electricity, and liquid fuels, such as ethanol, at lower cost than new stand-alone energy plants. Low cost hog fuel, when mixed with higher cost forest residues, can result in a raw material cost index to support broad utilization of wood biomass resources. We identify three imperatives for guiding progress that have been well-documented in the literature, but have not been adequately integrated into policy. Energy policies should seek to maximize integrated achievement of three important goals: climate change mitigation, energy independence, and sustainability. When viewed from this perspective, it is readily apparent that the state energy priority should be liquid transportation fuels and that, for Washington, wood is the primary raw material available for biofuels conversions. Combustion of fossil fuels for transportation accounts for fully one-half of the annual greenhouse emissions in Washington; more than twice that released from any other source. Other than minor in-state production of biodiesel, all transportation fuels consumed in Washington are imported from other states or abroad whereas Washington, with abundant hydro-power, generates the cleanest electricity in the nation and is a net electricity exporter. Wind power installations are adding new clean electricity capacity but cannot provide for liquid fuel needs. The decline in Alaska oil production, on which Washington is dependent, should further focus State attention towards securing new liquid fuel resources. Washington’s potentially available wood biomass resource has been estimated to be more than 11 million bone dry tons per year. For relative perspective on the magnitude of this resource, we offer the following theoretical conversions. Total potential ethanol produced from all Washington wood biomass resources could be 900 million gallons per year; enough to replace one-third of 2008 gasoline consumption. WSU colleagues have estimated that the potential electricity from Washington’s wood biomass would be equal to 11.5 million MWh or about 13 percent of total Washington electricity use. We find, however, that a lack of strategic energy priorities in Washington, compounded by political disagreements, has resulted in a peculiar assortment of counterproductive policies (discussed below) that inadvertently reward underutilization of energy resources by focusing on small-scale, capital-intensive, and inefficient conversion projects to produce low-priority electricity. Further, although State policy makers have clearly identified greenhouse gas emissions reductions and renewable energy development as very important public objectives, policies appear to have overlooked the need to integrate resource stewardship and energy generation towards best fit with existing industrial infrastructure. While obstacles appear formidable and numerous, we hypothesize that none are insurmountable if Washington citizens choose to focus enlightened resolve. We refer the reader to the history of ethanol development in Brazil as example. On the other hand, the challenges to substantive reductions in fossil fuel consumption must not be discounted. Fossil fuels are energy-rich, are supported by a vast infrastructure, and, without consideration of factors such as greenhouse gas emissions and energy independence, appear as least-cost energy options for consumers. Important to any discussion of renewable energy substitution for fossil fuels is a recognition that progress will occur at the margin. Review of domestic and international analyses indicates that total energy independence from fossil fuels is not potentially achievable within any foreseeable planning window. This does not imply, however, that incremental improvements can not be important or should not be pursued. Development of all potential domestic renewable resources, with careful planning towards an integrated energy portfolio, will ensure optimized levels of success. Evolving public perceptions regarding forests, biomass exploitation, and non-market amenities will play a major role in how much of the wood resource base may be used for energy. The public must be credibly assured that woody biomass produced from Washington State forests is an environmentally sound and
vii
safe source of renewable energy. However, given the mounting problems of global warming and forest health declines, concerned stakeholders must be challenged to revisit out-dated notions that forests unmanaged are protected. It will be important that the consequences of failing to act be fully appreciated. As demonstrated in many of the discussions presented throughout this report, failure to mitigate climate change, reduce fossil fuel pollution, increase energy independence, and implement practices to ensure forest sustainability is already resulting in significant environmental, social, and economic costs. Numerous international, national, and state political leaders have characterized the need for effective response to current climate and energy challenges as the paramount concerns of the twenty-first century. The Intergovernmental Panel on Climate Change (IPCC) is a globally-convened body of hundreds of scientists that are generally recognized as the pre-eminent international authority on climate change. IPCC investigation into potential climate change mitigation options resulted in the following conclusion. “In the long term, a sustainable forest management strategy aimed at maintaining or increasing forest carbon stocks, while producing an annual sustained yield of timber, fiber, or energy from the forest, will generate the largest sustained mitigation benefit.” (IPCC. 2007. Climate Change 2007: Mitigation. Contribution of Working Group III to the Fourth Assessment Report of the IPCC.). The four most important findings that emerge from this study:
1) Energy policy must be examined in the context of three over-arching imperatives that compel immediate attention: Climate Change Mitigation, Energy Independence, and Sustainability.
2) Wood is second only to water as a source of renewable energy for Washington, and, conversions to liquid transportation fuels emerge as the highest priority for maximizing integrated achievement of the imperative objectives.
3) Liquid fuels conversions from wood biomass will require large biorefinery capacity designed to utilize dispersed biomass resources for maximized bioenergy outputs. Co-location with State pulp and paper mills represents the greatest opportunity for success.
4) While a paradigm shift from fossil fuels to renewable energy will be difficult and expensive, the environmental and economic costs of inaction outweigh needed investment for change.
Expanded Discussion and Recommendations Linked to Report Text The following text presents key recommendations and support discussions from the Wood to Energy in Washington study with reference to pertinent sections of main body of the report for ease of navigation to greater detail. Climate change • Discussion: Significant research contributions regarding climate change are being achieved by the
Climate Impacts Group at the University of Washington. However, alarming findings, in the absence of suggested strategies for mitigation and adaptation, can serve to confuse policy discussions resulting in uninformed and counterproductive political responses as discussed in Section IV: 4.4. Obstacle 4 – Policy and regulations. The Climate Leadership Initiative, in a study conducted for the Washington Department of Ecology, estimated that by 2020 the cumulative costs of climate change in Washington will be equal to $3.8 billion per year, about 1.2 percent of total State 2007 GDP. Part of this cost is attributed to increases in incidence and intensity of wildfires. As mentioned above, such public cost liabilities are not currently incorporated into commercial energy markets. See Section II: 2.1. Greenhouse Gases and Climate Change; In Washington State and The costs of inaction and Section III: 3.3. Biomass from forests – opportunities and benefits; Forest health.
• Recommendation: Policy mechanisms to include non-market values and avoided costs in energy accounting are needed.
viii
Energy independence • Discussion: The value of energy independence appears to be significant but under-appreciated in
policy frameworks. US expenditures on oil imports were $330 billion in 2007 and accounted for 40 percent of the national trade deficit. In 2005, Alan Greenspan estimated that oil imports reduced US GDP by $100 billion. Washington citizens spent $9 billion on fuel imports in 2006. When policy makers combine strategies for energy independence with climate change mitigation, the economic benefits of energy independence should serve to underwrite the costs of biofuels development and greenhouse gas emissions reductions. See Section II: 2.2. Energy independence; Price is not cost.
• Recommendation: An assessment of costs and benefits that could derive from reduced reliance upon imported fossil fuels in Washington resulting from development of wood biomass for ethanol should be conducted.
Forest health • Discussion: Deforestation refers to a loss of forestland to another land-use. For example,
deforestation could result from clearing forests for agriculture or could occur as a result of fires or floods. Most global deforestation occurs in developing countries with tropical forests; however, deforestation is occurring in Washington with net losses of forestlands to wildfires, insects and disease and from land-use conversion for development. When deforestation occurs the loss is two-fold. The carbon that has been stored (sequestered) in the forest is released and the opportunity for future sequestration of atmospheric carbon is also lost. Increases in forest mortality and wildfire frequency and intensity have reached crisis levels. Reports from climate scientists indicate that, as the planet warms, the destructive impacts of forest health declines will escalate resulting in releases of stored forest carbon transforming forests so that they become a carbon source rather than a sink. In 2006, 33 million metric tons of CO2 were released into the atmosphere by wildfires in Washington accounting for 42 percent of the state annual total CO2 releases; close to three times the emissions released by electric power generators. We suggest that forest biomass removals that address climate change mitigation and energy independence through production of biofuels warrant public investment to avoid much larger long-term costs. Critical to the dual goals of forest health and biomass energy development will be a change towards proactive stewardship on National Forests. See Section III: 3.3. Biomass from forests – opportunities and benefits; Forest health and Section IV: 4.1. Obstacle 1- Access to the resource; Supply assurance and Section IV: 4.2. Obstacle 2 – Public perception; What is deforestation?
• Recommendation: Washington needs a plan to integrate biomass removals for forest health with climate change mitigation and energy development. Policy makers should urge revision of current restrictions that exclude biomass from National Forests for renewable energy conversions.
Wood biomass resources • Discussion: All types of wood-derived biomass resources including black liquor, and recoverable
wood and paper from municipal solid waste should be recognized as renewable energy resources. Ambiguous terminologies such as “old growth” are unnecessary, redundant, and counterproductive when used to limit potentially available wood biomass. There are abundant limitations in statute that restrict removals of forest biomass from reserved forests. Forests that aren’t reserved and may have potential for sustainable biomass removals should be managed to do so. Maximizing the procurable wood resource for energy within identified tributary areas is of paramount importance to supply assurance, energy investment, and biofuels production. As this investigation has shown, woody biomass contribution from all forest ownerships will be required in most regions of the state if sufficient resources are to be made available for the large-scale conversion facilities needed to efficiently produce biofuels. See Section I: 1.3. Biomass and energy – Terminology and Section IV: 4.1. Obstacle 1 – access to the resource; Supply assurance and Section IV: 4.2. Obstacle 2 – public perception; Social license and Forests; neither factory nor wilderness and How we think about forests and Section IV: 4.4. Obstacle 4 – Policy and regulations; I-937 – Washington’s defacto energy priority and Energy Independence and Security Act of 2007 (EISA).
ix
• Recommendation: Arbitrary constraints that limit biomass availability for renewable energy, such as appear in I-937, should be revised. If a cohesive strategy for biomass supply assurance and utilization is not developed quickly, Washington resources may be exported into other markets, like Oregon, where biofuels development is further advanced.
Guidelines for slash removals • Discussion: Existing state forest practice rules did not anticipate increased interest in removals of
harvest residues. Limiting factors for consideration include soil productivity, water quality, biodiversity, wildlife habitats, cultural values, forest health, and forest sustainability. In anticipation of an increased demand for woody biomass, a number of states are developing guidelines for removals of harvest residues. See Section III: 3.3. Biomass from forests – opportunities and benefits; Slash recovery and Section IV: 4.1. Obstacle 1 – access to the resource; Guidelines for slash removals.
• Recommendation: As evidenced by successes in other states, forest biomass collection guidelines should be developed and incorporated into Washington forest practice rules.
Integrated infrastructure and product hierarchies • Discussion: The value of existing forest industry investment in renewable energy production and
the cost-effective utilization of the wood resource must not be underestimated. Higher use wood products such as solid building materials underwrite the costs of biomass collection and provide environmentally preferable product alternatives to steel and concrete. The present policy paradigm (I-937) inadvertently prioritizes development of small-scale inefficient distributed wood power generators that will waste the resource, create undesirable competition for the least-expensive process residuals, effectively undermine recovery of more costly forest residues, and ultimately jeopardize the industrial infrastructure and employment base upon which significant development of biofuels must depend. See Section III: 3.2. Woody biomass – material and process opportunities and Section IV: 4.1. Obstacle 1 – access to the resource and Section IV: 4.4. Obstacle 4 – Policy and regulations; I-937 – Washington’s defacto energy priority.
• Recommendation: Biomass energy priorities should favor liquid fuels conversions at integrated biorefineries that can optimize energy yields through recovery of heat, electricity, and chemical byproducts. As possible, biorefineries will be best sited with pulp and paper mills. State investment in support of biorefinery development would be the most effective biomass-to-energy approach for response to the three imperatives of climate change mitigation, energy independence, and sustainability.
Conversion technology advancement • Discussion: The technologies for wood heating and combined heat and power systems are mature
and implementable, however, while conversion technologies for wood-to-liquid fuels, such as ethanol, are technically feasible, no commercial-scale operations are yet deployed. An important finding of this investigation has been that biomass resources are finite and, when renewable energy alternatives from potentially available resources are compared in the context of the three imperatives (climate change mitigation, energy independence, and sustainability), liquid fuels conversions emerge as the over-arching priority. It will be imperative that the biomass resource is used prudently to maximize energy yields. Since liquid fuels conversions will require large scale facilities, mixed feedstocks from forests, fields, and cities may be needed to ensure that adequate biomass volumes can be sustained. Additional biomass may become available from dedicated energy crops once biorefineries become established. Conversion strategies will need customization to accommodate local resource availability. For example, at sites close to urban areas, mixtures of forest-derived materials and recovered wood and paper from municipal solid waste may be attractive while in rural areas of eastern Washington mixed feedstocks comprised of forest and agricultural residues may make the most sense. Where inexpensive rail and water freight are available, biomass tributary areas can be expanded to facilitate transport of diverse feedstocks to assure access to adequate volumes of biomass. An ancillary benefit may also be increased and diversified raw material availability for pulp and paper production as research at the University of Washington into the
x
potential use of grasses and other vegetative material for paper products shows promise. The strategic economic benefits of captured process residues as an inexpensive anchor feedstock with potential for bioenergy recovery augmented by addition of more expensive recovered field residuals are discussed in this report and will be important factors for consideration of conversion technology development options. See Section I: 1.4. Wood-to-energy – conversion options and Section III: 3.2. Woody Biomass – material and process opportunities and Section IV: 4.1. Obstacle 1 – access to the resource; Raw materials.
• Recommendation: Continued research investment to develop superior conversion technologies for liquid fuel production from Washington biomass resources will help to identify advancements that provide maximum energy yields at least costs. Investment in a pilot project towards development of a commercial integrated biorefinery is highly recommended as an important next step. Research towards further development of mixed biomass applications for liquid fuels conversions customized for effective exploitation of locally available resources will be essential to assure sufficient raw material availability and maximized energy yields.
Social license • Discussion: As demonstrated by our review of the scientific literature, failure to mitigate climate
change, reduce fossil fuel pollution, increase energy independence, and implement practices to ensure forest sustainability will result in significant environmental, social, and economic costs. The public must be credibly assured that woody biomass produced from Washington State forests is an environmentally sound and safe source of renewable energy. Educational outreach and consensus building activities such as those undertaken by the University of Washington through the Northwest Environmental Forum and the Olympic Natural Resource Center have been successful at building stakeholder consensus in support of sustainable forestry and wood biomass to energy. Communication alliances also provide fertile opportunity for cooperative interaction between stakeholders, scientists, and State agency personnel. See Section IV: 4.2. Obstacle 2 – public perception and Section IV: 4.5. Obstacle 5 – Research; Science and education.
• Recommendation: These and other programs that facilitate public education and dialogue towards consensus solutions to contemporary resource and energy challenges are worthy of State support.
Green jobs • Discussion: There is a growing shortage of skilled forestry professionals in Washington. Workforce
challenges are an obstacle to wood-for-energy development but remarkably, forestry is excluded from the State “green jobs” program. Management of forest ecosystems with resultant production of “green” building products and renewable energy feedstocks represents the single greatest State opportunity to reduce both GHG emissions and imported fossil fuel reliance. See Section IV: 4.1. Obstacle 1 – access to the resource; The foresters, the loggers, and the truckers and Section IV: 4.4 Obstacle 4 – Policy and regulations; Green jobs.
• Recommendation: We recommend that State leaders acknowledge forest biomass-to-energy as a cornerstone element of a clean future economy. State agencies should work with universities and community colleges to establish training programs for forestry workers that cover the spectrum from collection through conversion.
Green building products • Discussion: State programs for green building have potential for beneficial change but only if
rigorous assessment methodologies for product comparisons such as life cycle assessment (LCA) and net energy balance (NEB) are used to develop uniform performance standards. Current programs rely upon arbitrary product standards that are not scientifically supported. Unintended consequences include under-appreciation of the environmental benefits of locally-grown renewable wood building products as compared to alternative construction materials like steel or concrete. Failure to value wood as a green building product undermines both the green building program and
xi
the viability of the Washington wood industry and while jeopardizing the product value hierarchy needed to support utilization of woody biomass for bioenergy. See Section III: 3.4 Forests, products, energy, and carbon; Life cycle assessment and Section IV: 4.4 Obstacle 4 – Policy and regulations; Green building standards.
• Recommendation: Green building standards should be revised to include product comparisons based upon rigorous scientifically-supported performance standards such as LCA and NEB.
Policy Guidance • Discussion: We suggest that, without a cohesive strategy for progress based upon targeted
renewable energy priorities, substantive improvements in climate change mitigation, energy independence, and sustainability are unlikely to occur. In lieu of a consistent science-based policy framework, various regulatory mechanisms evolve in isolation with narrow focus. We find a number of counterproductive contradictions in current policy framework that limit potential for biofuels development. As example, consider I-937, the Western Climate Initiative (WCI), and the Energy Independence and Security Act of 2007 (EISA). I-937 is a State initiative that, in function, excludes portions of the wood resource from use and directs the eligible biomass subset to small-scale inefficient electric generators (rather than biorefineries) that could undermine the viability of existing infrastructure and result in considerable portions of the wood biomass resource left too isolated for recovery. The WCI, a regional climate change mitigation consortium of which Washington is a member, has evolved an elaborately complicated cap and trade scheme that, given its priority to address the electric sector in its first phase of implementation, is partially redundant to the renewable portfolio standard established by I-937 and fails to address the State’s largest emissions problem: transportation. Based upon the experience of the European cap and trade program, we conclude that WCI may also result in increased energy price volatility which has been shown to discourage renewable energy investment. EISA, on the other hand, was passed by the US Congress to create a national renewable fuel standard based upon ambitious additions of cellulosic ethanol capacity to be added by 2022. WA has one-twentieth of the Nation’s forest biomass inventory but current State prioritization of biomass-to-electricity (I-937 and WCI) acts to undermine the EISA cellulosic ethanol target as well as to compromise the State’s need to reduce greenhouse gas emissions and fuel imports. EISA, in apparent direct conflict with its ambitious schedule for cellulosic ethanol expansion, excludes wood from National Forests as eligible for conversion to renewable energy. Yet two-thirds of the nation’s forest health crisis is occurring on National Forests and in many areas of the west, including Washington, wood biomass contribution from federal forests will be necessary if cellulosic ethanol is to be produced. We find that current State and national energy policies represent significant obstacles to wood-to-energy in Washington. See Section IV: 4.4. Obstacle 4 – Policy and regulations.
• Recommendation: Liquid transportation fuels, such as ethanol, should be the State energy priority. Formal scientific review of existing policies and potential policy alternatives to examine barriers to wood for biofuels conversion is recommended. Special attention should be given to I-937, WCI, and EISA.
Interdisciplinary science support for energy policy development • Discussion: Washington’s universities are home to many prestigious scientists, yet it is rare that
scientists of differing disciplines and from different research organizations are asked to work together to develop integrated analysis of resource policy alternatives. See Section IV: 4.4. Obstacle 4 – Policy and regulations.
• Recommendation: Sorely needed is programmatic investment in sustained in-state interdisciplinary research to assist policy makers and stakeholders in the development of realistic and effective strategies to address the difficult and complex challenges of renewable energy development and climate change mitigation.
xii
Research • Discussion: The Government Accountability Office reports that, in contrast to increasingly urgent
national calls for climate change mitigation and energy independence, US investments in research have generally declined over the last thirty years. In Washington, there is no programmatic investment in sustained in-state interdisciplinary research to accelerate development of renewable energy from wood biomass or to investigate the role of sustainable forest management and wood products in climate change mitigation. There is also no continuing state program to enlist forest scientists in support of policy development or educational outreach to stakeholder groups. By contrast, the Oregon Legislature created the Oregon Forest Resources Institute (OFRI) in 1991 to improve public understanding of the state’s forest resources and to encourage environmentally sound forest management. OFRI is funded by a dedicated harvest tax on forest products producers. Issues include technical, economic, environmental, social, and moral questions that require continued scholarly research but ultimately can only be resolved by an informed political process. The choices ahead are difficult, expensive and long-lasting with implications for future generations and forest ecosystems in Washington and around the world. See Section IIV: 4.5. Obstacle 5 – Research.
• Recommendation: Our analysis has revealed that a significant obstacle to wood utilization for renewable energy in Washington is a lack of integrated understanding of many complex issues that need serious consideration if progress towards climate change mitigation, energy independence, and sustainability is to proceed. We recommend that Washington establish a permanent interdisciplinary program of research and outreach to address emerging topics concerning biomass energy development with implications for the environment and the economy as discussed in greater detail throughout this report.
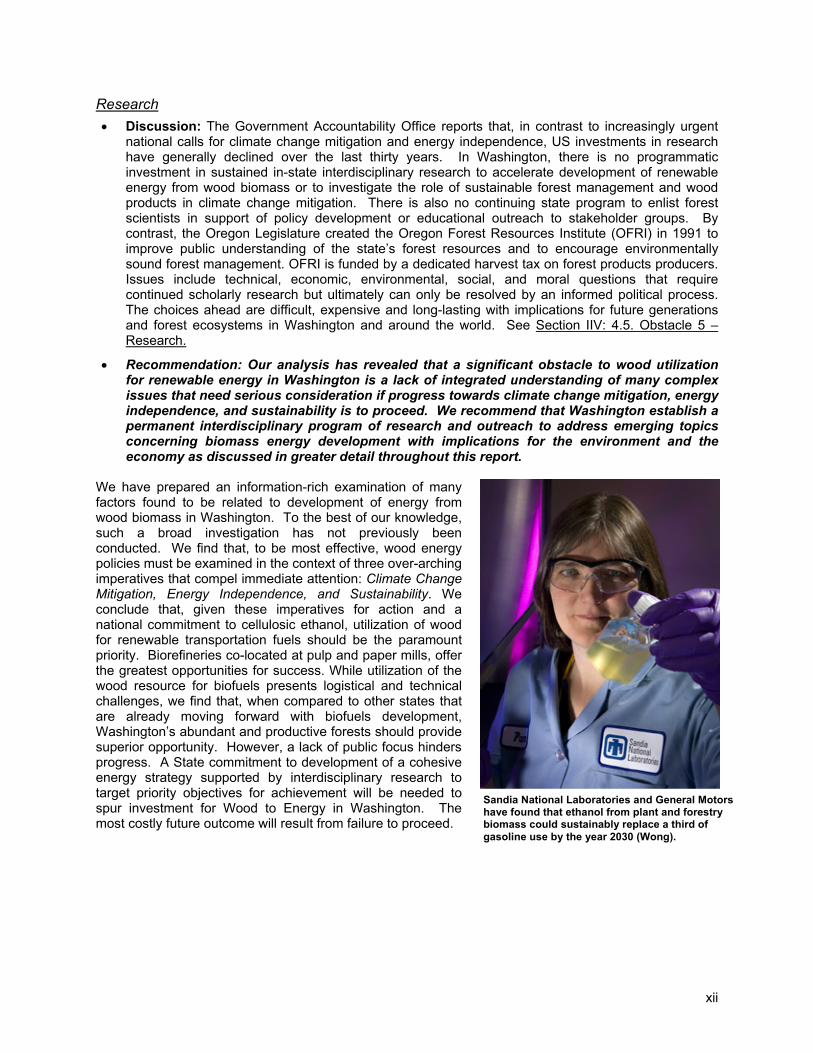
We have prepared an information-rich examination of many factors found to be related to development of energy from wood biomass in Washington. To the best of our knowledge, such a broad investigation has not previously been conducted. We find that, to be most effective, wood energy policies must be examined in the context of three over-arching imperatives that compel immediate attention: Climate Change Mitigation, Energy Independence, and Sustainability. We conclude that, given these imperatives for action and a national commitment to cellulosic ethanol, utilization of wood for renewable transportation fuels should be the paramount priority. Biorefineries co-located at pulp and paper mills, offer the greatest opportunities for success. While utilization of the wood resource for biofuels presents logistical and technical challenges, we find that, when compared to other states that are already moving forward with biofuels development, Washington’s abundant and productive forests should provide superior opportunity. However, a lack of public focus hinders progress. A State commitment to development of a cohesive energy strategy supported by interdisciplinary research to target priority objectives for achievement will be needed to spur investment for Wood to Energy in Washington. The most costly future outcome will result from failure to proceed.
Sandia National Laboratories and General Motors have found that ethanol from plant and forestry biomass could sustainably replace a third of gasoline use by the year 2030 (Wong).
xiii
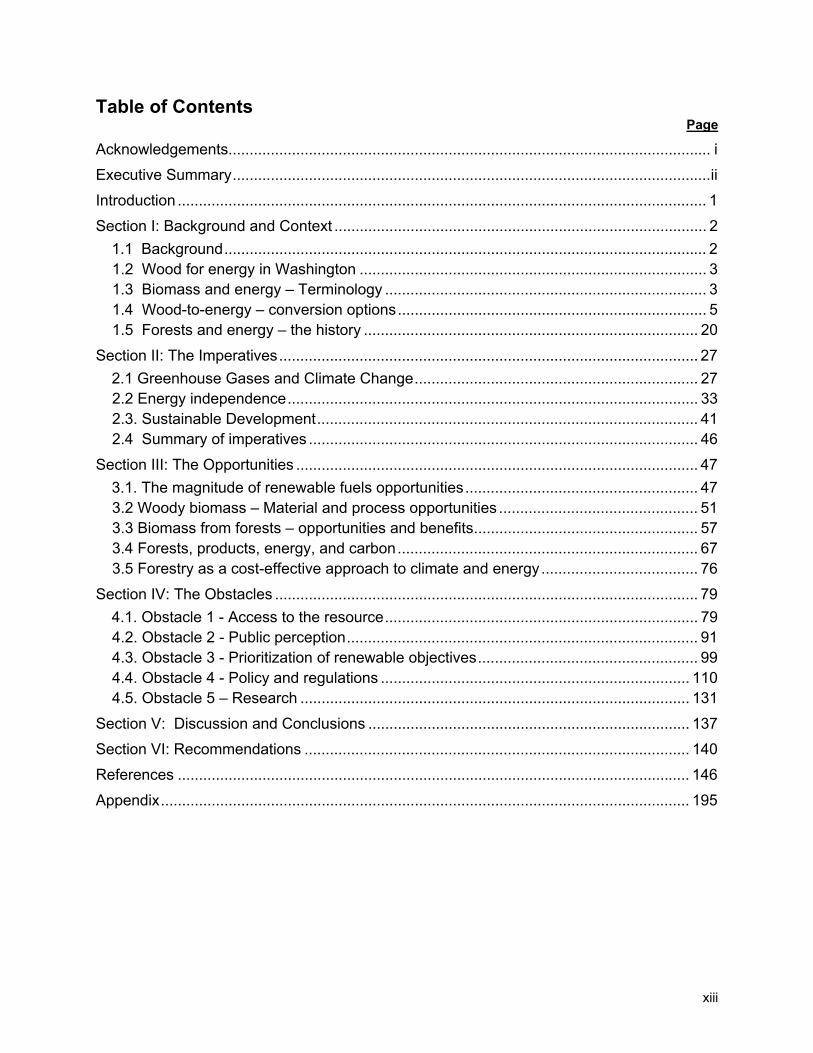
Table of Contents Page
Acknowledgements.................................................................................................................. i
Executive Summary ................................................................................................................. ii
Introduction ............................................................................................................................. 1
Section I: Background and Context ........................................................................................ 2 1.1 Background .................................................................................................................. 2 1.2 Wood for energy in Washington .................................................................................. 3 1.3 Biomass and energy – Terminology ............................................................................ 3 1.4 Wood-to-energy – conversion options ......................................................................... 5 1.5 Forests and energy – the history ............................................................................... 20
Section II: The Imperatives ................................................................................................... 27 2.1 Greenhouse Gases and Climate Change ................................................................... 27 2.2 Energy independence ................................................................................................. 33 2.3. Sustainable Development .......................................................................................... 41 2.4 Summary of imperatives ............................................................................................ 46
Section III: The Opportunities ............................................................................................... 47 3.1. The magnitude of renewable fuels opportunities ....................................................... 47 3.2 Woody biomass – Material and process opportunities ............................................... 51 3.3 Biomass from forests – opportunities and benefits ..................................................... 57 3.4 Forests, products, energy, and carbon ....................................................................... 67 3.5 Forestry as a cost-effective approach to climate and energy ..................................... 76
Section IV: The Obstacles .................................................................................................... 79 4.1. Obstacle 1 - Access to the resource .......................................................................... 79 4.2. Obstacle 2 - Public perception ................................................................................... 91 4.3. Obstacle 3 - Prioritization of renewable objectives .................................................... 99 4.4. Obstacle 4 - Policy and regulations ......................................................................... 110 4.5. Obstacle 5 – Research ............................................................................................ 131
Section V: Discussion and Conclusions ............................................................................ 137
Section VI: Recommendations ........................................................................................... 140
References ......................................................................................................................... 146
Appendix ............................................................................................................................. 195
xiv
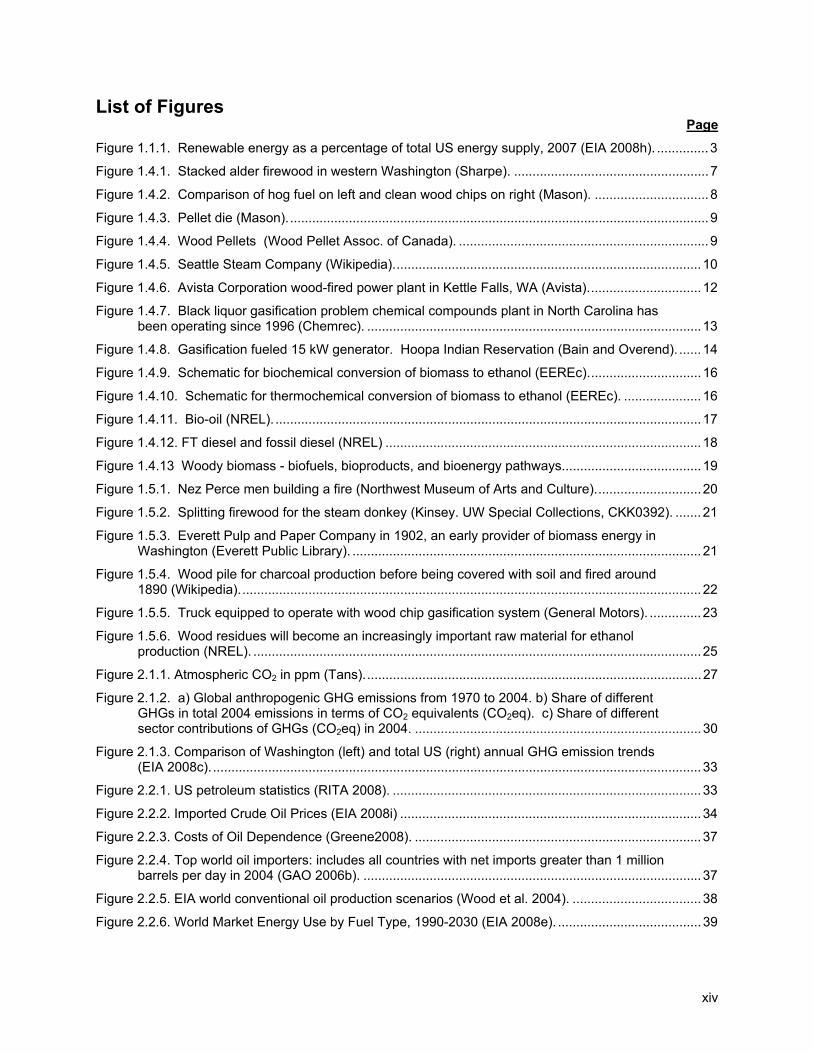
List of Figures Page
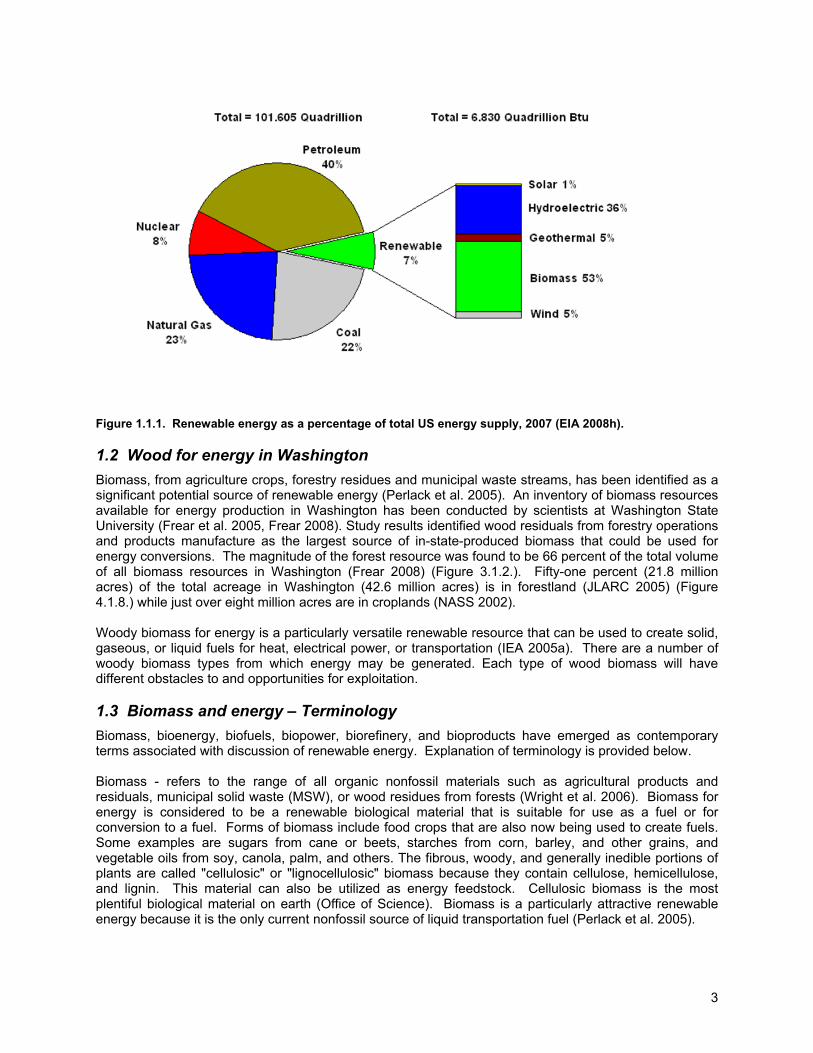
Figure 1.1.1. Renewable energy as a percentage of total US energy supply, 2007 (EIA 2008h). .............. 3
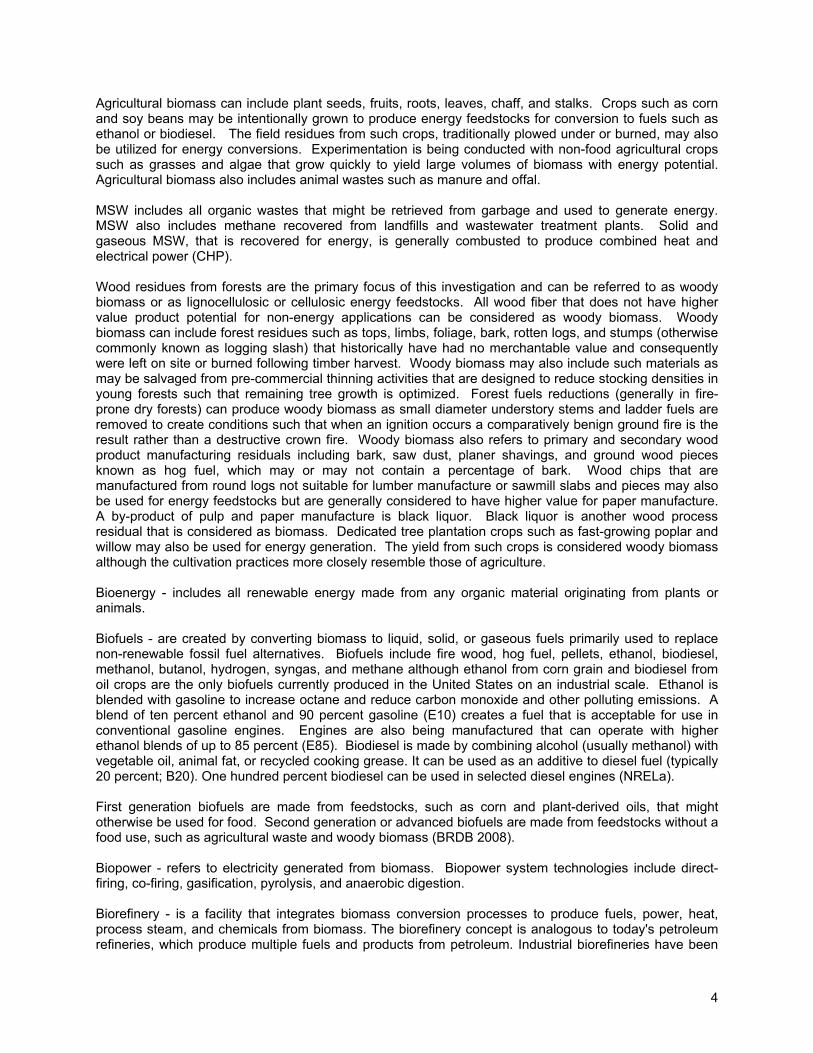
Figure 1.4.1. Stacked alder firewood in western Washington (Sharpe). ..................................................... 7
Figure 1.4.2. Comparison of hog fuel on left and clean wood chips on right (Mason). ............................... 8
Figure 1.4.3. Pellet die (Mason). .................................................................................................................. 9
Figure 1.4.4. Wood Pellets (Wood Pellet Assoc. of Canada). .................................................................... 9
Figure 1.4.5. Seattle Steam Company (Wikipedia). ................................................................................... 10
Figure 1.4.6. Avista Corporation wood-fired power plant in Kettle Falls, WA (Avista). .............................. 12
Figure 1.4.7. Black liquor gasification problem chemical compounds plant in North Carolina has been operating since 1996 (Chemrec). ........................................................................................... 13
Figure 1.4.8. Gasification fueled 15 kW generator. Hoopa Indian Reservation (Bain and Overend). ...... 14
Figure 1.4.9. Schematic for biochemical conversion of biomass to ethanol (EEREc). .............................. 16
Figure 1.4.10. Schematic for thermochemical conversion of biomass to ethanol (EEREc). ..................... 16
Figure 1.4.11. Bio-oil (NREL). .................................................................................................................... 17
Figure 1.4.12. FT diesel and fossil diesel (NREL) ...................................................................................... 18
Figure 1.4.13 Woody biomass - biofuels, bioproducts, and bioenergy pathways. ..................................... 19
Figure 1.5.1. Nez Perce men building a fire (Northwest Museum of Arts and Culture). ............................ 20
Figure 1.5.2. Splitting firewood for the steam donkey (Kinsey. UW Special Collections, CKK0392). ....... 21
Figure 1.5.3. Everett Pulp and Paper Company in 1902, an early provider of biomass energy in Washington (Everett Public Library). ............................................................................................... 21
Figure 1.5.4. Wood pile for charcoal production before being covered with soil and fired around 1890 (Wikipedia). ............................................................................................................................. 22
Figure 1.5.5. Truck equipped to operate with wood chip gasification system (General Motors). .............. 23
Figure 1.5.6. Wood residues will become an increasingly important raw material for ethanol production (NREL). .......................................................................................................................... 25
Figure 2.1.1. Atmospheric CO2 in ppm (Tans). ........................................................................................... 27
Figure 2.1.2. a) Global anthropogenic GHG emissions from 1970 to 2004. b) Share of different GHGs in total 2004 emissions in terms of CO2 equivalents (CO2eq). c) Share of different sector contributions of GHGs (CO2eq) in 2004. .............................................................................. 30
Figure 2.1.3. Comparison of Washington (left) and total US (right) annual GHG emission trends (EIA 2008c). ..................................................................................................................................... 33
Figure 2.2.1. US petroleum statistics (RITA 2008). .................................................................................... 33
Figure 2.2.2. Imported Crude Oil Prices (EIA 2008i) .................................................................................. 34
Figure 2.2.3. Costs of Oil Dependence (Greene2008). .............................................................................. 37
Figure 2.2.4. Top world oil importers: includes all countries with net imports greater than 1 million barrels per day in 2004 (GAO 2006b). ............................................................................................ 37
Figure 2.2.5. EIA world conventional oil production scenarios (Wood et al. 2004). ................................... 38
Figure 2.2.6. World Market Energy Use by Fuel Type, 1990-2030 (EIA 2008e). ....................................... 39
xv
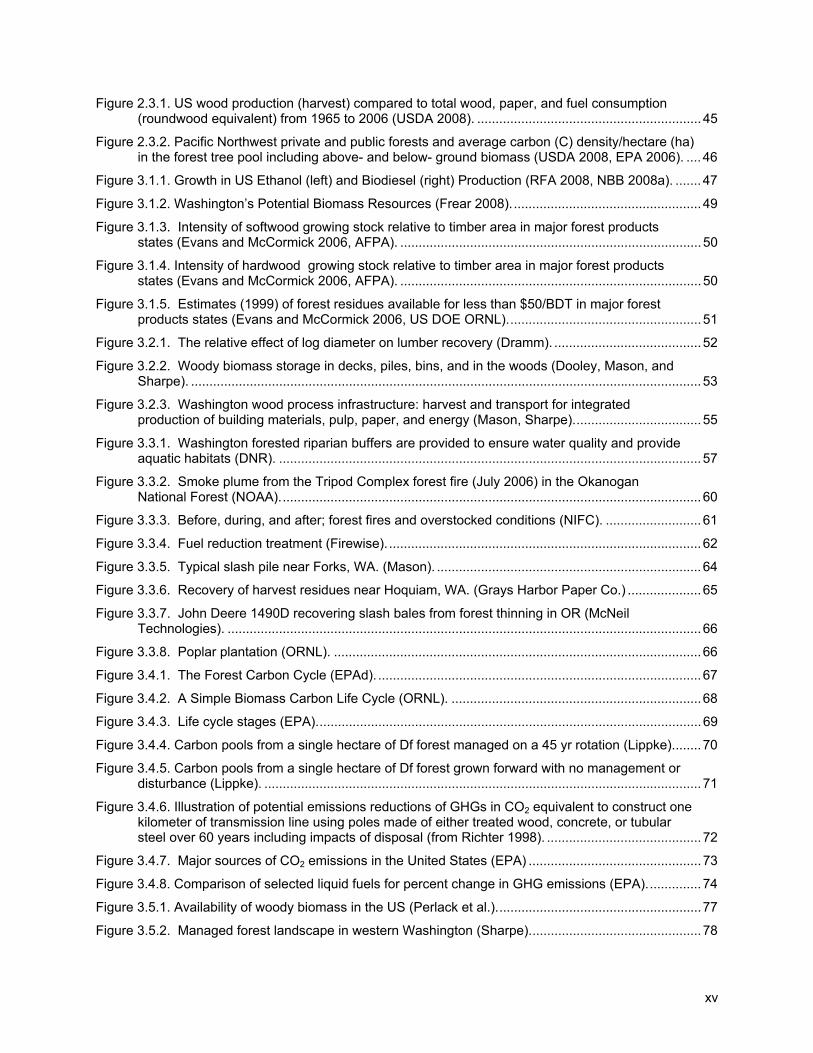
Figure 2.3.1. US wood production (harvest) compared to total wood, paper, and fuel consumption (roundwood equivalent) from 1965 to 2006 (USDA 2008). ............................................................. 45
Figure 2.3.2. Pacific Northwest private and public forests and average carbon (C) density/hectare (ha) in the forest tree pool including above- and below- ground biomass (USDA 2008, EPA 2006). .... 46
Figure 3.1.1. Growth in US Ethanol (left) and Biodiesel (right) Production (RFA 2008, NBB 2008a). ....... 47
Figure 3.1.2. Washington’s Potential Biomass Resources (Frear 2008). ................................................... 49
Figure 3.1.3. Intensity of softwood growing stock relative to timber area in major forest products states (Evans and McCormick 2006, AFPA). .................................................................................. 50
Figure 3.1.4. Intensity of hardwood growing stock relative to timber area in major forest products states (Evans and McCormick 2006, AFPA). .................................................................................. 50
Figure 3.1.5. Estimates (1999) of forest residues available for less than $50/BDT in major forest products states (Evans and McCormick 2006, US DOE ORNL). .................................................... 51
Figure 3.2.1. The relative effect of log diameter on lumber recovery (Dramm). ........................................ 52
Figure 3.2.2. Woody biomass storage in decks, piles, bins, and in the woods (Dooley, Mason, and Sharpe). ........................................................................................................................................... 53
Figure 3.2.3. Washington wood process infrastructure: harvest and transport for integrated production of building materials, pulp, paper, and energy (Mason, Sharpe). .................................. 55
Figure 3.3.1. Washington forested riparian buffers are provided to ensure water quality and provide aquatic habitats (DNR). ................................................................................................................... 57
Figure 3.3.2. Smoke plume from the Tripod Complex forest fire (July 2006) in the Okanogan National Forest (NOAA). .................................................................................................................. 60
Figure 3.3.3. Before, during, and after; forest fires and overstocked conditions (NIFC). .......................... 61
Figure 3.3.4. Fuel reduction treatment (Firewise). ..................................................................................... 62
Figure 3.3.5. Typical slash pile near Forks, WA. (Mason). ........................................................................ 64
Figure 3.3.6. Recovery of harvest residues near Hoquiam, WA. (Grays Harbor Paper Co.) .................... 65
Figure 3.3.7. John Deere 1490D recovering slash bales from forest thinning in OR (McNeil Technologies). ................................................................................................................................. 66
Figure 3.3.8. Poplar plantation (ORNL). .................................................................................................... 66
Figure 3.4.1. The Forest Carbon Cycle (EPAd). ........................................................................................ 67
Figure 3.4.2. A Simple Biomass Carbon Life Cycle (ORNL). .................................................................... 68
Figure 3.4.3. Life cycle stages (EPA). ........................................................................................................ 69
Figure 3.4.4. Carbon pools from a single hectare of Df forest managed on a 45 yr rotation (Lippke). ....... 70
Figure 3.4.5. Carbon pools from a single hectare of Df forest grown forward with no management or disturbance (Lippke). ....................................................................................................................... 71
Figure 3.4.6. Illustration of potential emissions reductions of GHGs in CO2 equivalent to construct one kilometer of transmission line using poles made of either treated wood, concrete, or tubular steel over 60 years including impacts of disposal (from Richter 1998). .......................................... 72
Figure 3.4.7. Major sources of CO2 emissions in the United States (EPA) ............................................... 73
Figure 3.4.8. Comparison of selected liquid fuels for percent change in GHG emissions (EPA). .............. 74
Figure 3.5.1. Availability of woody biomass in the US (Perlack et al.). ....................................................... 77
Figure 3.5.2. Managed forest landscape in western Washington (Sharpe). .............................................. 78
xvi
Figure 4.1.1. Post harvest logging slash piled on a landing in NE Washington (Oneil). ............................ 80
Figure 4.1.2. Hog fuel (NREL). ................................................................................................................... 81
Figure 4.1.3. Wood Chips (NREL). ............................................................................................................. 82
Figure 4.1.4. Chip trailer in the ditch near Omak, WA. (Friedlander). ........................................................ 84
Figure 4.1.5. Portable pelletizers (IMG Pellet Systems). ............................................................................ 85
Figure 4.1.6. The effect of plant size and biomass fuel costs on the cost of energy (McNeil Technologies). ................................................................................................................................. 86
Figure 4.1.7. Biorefinery economies of scale (from WGA 2008b, Antares 2008). ...................................... 86
Figure 4.1.8. Forestland ownership in Washington State (JLARC). ........................................................... 88
Figure 4.1.9. 50-mile radius circles imposed upon a DNR map of Washington that displays ownership type . ................................................................................................................................................ 90
Figure 4.2.1. Large clear cuts 1950s (OR History Project). ........................................................................ 91
Figure 4.2.2. The study of fire scars provides a record of fire history. This sample from a Douglas–fir (Pseudotsuga menziesii) was taken in 1976. 31 forest fires occurred from 1540 to 1876 after which no fire scars are in evidence (Stokes and Dieterich 1980).................................................... 92
Figure 4.2.3. The open park-like conditions of an old forest in 1911 were likely the result of repeated underburning (USDA Forest Service from Helms2004). ................................................................. 93
Figure 4.2.4. Yakama Nation: before forest health treatment (Yakama). ................................................... 94
Figure 4.2.5. Yakama Nation: after forest health treatment (Yakama). ...................................................... 94
Figure 4. 2. 6. Deforestation in Washington: high severity forest fires, insect infestation, and land-use change. ............................................................................................................................................ 96
Figure 4.2.7. Cost and competiveness of selected renewable power technologies (IEA 2007c). .............. 97
Figure 4.2.8. Distribution of current and projected woody biomass resources (Perlack et al. 2005). ........ 98
Figure 4.3.1. Washington and US gross GHG emissions by sector – 2005 (CTED 2007). ...................... 99
Figure 4.3.2. Wood heating system as compared to 11/08 heating oil price (from Maker 2004 and EIA 2009a). .................................................................................................................................... 101
Figure 4.3.3. Wood heating system as compared to 11/08 natural gas price (from Maker 2004 and EIA 2009a). .................................................................................................................................... 101
Figure 4.3.4. Wood heating system as compared to 11/08 electricity price (from Maker 2004 and EIA 2009a). .................................................................................................................................... 101
Figure 4.3.5. Changes in construction commodity costs, 1973-2007 (constant dollar index, 1973=100; 1981=100 for cement costs) (EIA 2008a). .................................................................. 105
Figure 4.3.6. Rising costs of power plant construction (New York Times2007). ...................................... 105
Figure 4.3.7. Fuels from the forest (Tappi). .............................................................................................. 107
Figure 4.4.1. EU-ETS carbon trade: spot and future market volatility 2005-2007 (Point Carbon) ........... 118
Figure 4.4.2. Washington historic CO2e emissions by sector with fire emissions superimposed (adapted from Waterman-Hoey and Nothstein 2007, Wiedinmyer et al. 2006). ........................... 120
Figure 4.4.3. End-use energy consumption in Washington by major source (CTED 2007). .................... 121
Figure 4.4.4. Washington Cumulative Energy-Related CO2 e Emissions by Sector (without fire) with State GHG reduction targets superimposed (from Waterman-Hoey and Nothstein 2007). ... 121
xvii
Figure 4.4.5. Carbon sequestration from an expansion of CDM criteria under Kyoto (Nabuurs et al. 2000). .................................................................................................................... 124
Figure 4.4.6. Comparison of average 2006 international gasoline taxes (from Gross 2006). .................. 126
Figure 4.4.7. US greenhouse gas emissions per capita and per dollar of gross domestic product (EPA 2008). ................................................................................................................................... 126
Figure 4.4.8. Ethanol futures versus corn futures (Chicago Board of Trade). .......................................... 128
Figure 4.4.9. NREL projection suggesting reduced feedstock price as compared to superimposed corn prices (NREL 2007). .............................................................................................................. 128
Figure 4.4.10. World oil projections for three EIA scenarios (EIA 2009c). ............................................... 129
Figure 4.5.1. DOE Budget Authority for renewable, fossil, and nuclear energy R&D, fiscal years 1978-2008 (GAO 2008b). .............................................................................................................. 132
Figure 4.5.2. Comparison of the US energy portfolio in 1973 and in 2006 (GAO 2008b). ...................... 132
List of Tables
Page
Table 1.4.1. Major energy fuels from woody biomass. ................................................................................ 6
Table 1.4.2. Major wood-to-energy processes by primary fuel type. ........................................................... 6
Table 1.4.3. Higher heating values for the wood of some NW species in British thermal units (Btus) per oven-dry pound (Ince 1979). ....................................................................................................... 7
Table 1.4.4. Emissions Intensity of Electricity Produced via Different Methods (NCASI 2008). ............... 11
Table 2.1.1. Major greenhouse gases and global warming potentials (adapted from: Kirby 2008, IPCC 2006, and Cicerone 2001). .................................................................................................... 29
Table 2.2.1. Comparison of tax incentives for petroleum and ethanol fuels: estimates of revenue losses over time in millions of 2000 dollars (GAO 2000). ................................................................ 36
Table 2.2.2. Production targets (in billions of gallons/year) established by EISA for renewable fuels (Curtis 2008). ................................................................................................................................... 40
Table 3.2.1. Product yields by type from a 7-8 inch diameter conifer saw log (Canfor). ........................... 52
Table 3.2.2. Average higher heating values for four biomass resources in BTUs/ dry lb. (California Energy Commission). ..................................................................................................... 53
Table 3.4.1. Production costs for corn and cellulosic ethanol (from Collins 2007). .................................... 75
Table 4.1.1. Area of timberland (thousand acres) by owner and land class in Washington (Bolsinger et al. 1997). ..................................................................................................................... 89
Table 4.2.1. US preferences for energy resources (Farhar 1999). ............................................................. 97
Table 4.2.2. Life cycle emissions (extraction, manufacture, operation, decommission) selected renewables and coal (IEA 1998). .................................................................................................... 97
Table 4.4.1. Generation, consumption, and net imports for six states in the Western Climate Initiative (CARB 2007). ................................................................................................................................ 122

1
Introduction This analysis began as an investigation of barriers to woody biomass utilization for energy in Washington but expanded quickly to become more comprehensive as our analysis revealed that perhaps a significant barrier is a lack of integrated understanding of complex issues that need serious consideration if progress is to be achieved. Issues include technical, economic, environmental, social, and moral questions that require continued scholarly research but ultimately can only be resolved by an informed political process. The choices ahead are difficult, expensive and long-lasting with implications for future generations and forest ecosystems in Washington and around the world. We would be remiss as scientists if we narrowly approached our task and failed to attempt to characterize the interrelationships and trade-offs that must be assessed. Consequently, we have tried to present summarized elements of a discussion about forests and renewable energy that we have identified as inter-related. We conclude that challenges of the twenty-first century will require unprecedented paradigm shifts in how we all think. Our understanding of what is waste and what is resource must change. Legacy notions of environmental mitigation, protection, and adaptation must be re-considered in a context that acknowledges the role of humans in a world dominated by human-induced impacts. Short-term verses long-term costs and benefits need full accounting with an eye towards sustainability. In Washington, forests are inextricably connected to whatever climate and energy choices that we make for the future. Wood is Washington’s largest biomass resource and half of the state is forest. It is the hope of the authors that this report will inform thoughtful consideration of options for the future. There is much to be discussed and yet much more to be learned if unwanted consequences are to be avoided. However, an overarching conclusion from this investigation is that failure to act will be an undesirable course of action. This report tries to add value to existing information by organizing, summarizing, interpreting, and communicating such that complicated interrelationships may become apparent to the reader. We will begin this report in Section I by providing background and context through examination of wood-to-energy conversion options and history. Section II discusses the compelling imperatives that beg coordinated action. Section III identifies the many opportunities that could derive from utilization of wood for both renewable domestic energy and greenhouse gas emissions reductions in Washington. The intent of the first three Sections is to adequately prepare the reader for consideration of the formidable but not insurmountable challenges to progress that our research has uncovered. In Section IV, we address our assigned task: the examination of barriers to expanded use of woody biomass for renewable energy. We change the terminology, however, from barriers to obstacles as indication of a general finding that nothing stops immediate progress but our own societal choices. Section V discusses our conclusions and Section VI offers recommendations.
2
Section I: Background and Context 1.1 Background Climate change and energy security have become dominate linked concerns in the twenty-first century; commanding considerable attention from global leaders, scientists, businesses, environmentalists, and citizens (UNFCCC; The White House 2006). There is accumulating evidence that global climate is warming in response to increases in atmospheric concentrations of carbon dioxide (CO2) and other pollutants, collectively described as green house gases (GHGs), that primarily result from anthropogenic combustion of fossil fuel to produce energy (IPCC 2007a & 2007c). In 2006, the United States used 21 million barrels of petroleum each day. Imports accounted for 60 percent of consumption (EIA 2008a). The State of Washington has responded to the issues of climate change and energy use in several ways. In 2006, the people of Washington passed Initiative 937 that established a schedule of mandatory targets for addition of new capacity for renewable electricity generation (Garber 2006). The Governor’s Climate Change Challenge, Executive Order 07-02 (Gregoire 2007), established a commitment to reduce green house gas emissions and to grow a renewable fuel industry to utilize State natural resources for clean energy. A Climate Advisory Team (CAT), comprised of diverse stakeholders with oversight from the Washington Departments of Ecology and Community, Trade, and Economic Development, has been assembled to recommend policies that will ensure Executive Order objectives are achieved. The State Legislature has passed laws to encourage the use of cleaner energy (E2SHB 1303) and to create a framework for reducing green house gases (E2SHB 2815). Governor Gregoire is a participant in the Western Governors Association Clean and Diversified Energy Initiative and Washington is a member state of the Western Climate Initiative. These organizations are developing regionally coordinated strategies for climate change mitigation and reduced reliance upon fossil fuels for energy. Significant increases to renewable energy produced to reduce GHG emissions, generate employment, and move towards greater energy independence will require utilization of multiple resources including sunlight, wind, geothermal, water, and biomass (Smith et al. 2007). To many people, the most familiar forms of renewable energy may be the wind and the sun. But biomass (plant material and animal waste) is the largest source of domestic renewable energy supplying five times as much energy in the United States as wind and solar power combined—and has the potential to supply much more (EIA 2008b). Forestry wastes provide the largest source of biomass-derived renewable energy in the United States, primarily generated as steam and electricity from lumber, pulp, and paper mill operations (UCS 2006). As part of state efforts to accelerate development of renewable energy, the Washington State Legislature identified wood as an important state resource and requested that scientists from the University of Washington, College of Forest Resources and the Olympic Natural Resource Center, investigate and identify barriers that could limit expanded development for renewable energy. A thorough investigation of potential use of wood for energy within Washington has been conducted. Issues of climate change, energy, and resources are complex and can not be adequately considered if viewed exclusively from within confined political boundaries or narrow time frames. Forest scientists are trained to consider broad landscape interactions from an extended temporal context. Information within this report is consequently presented with attempt to reflect local-to-global sensitivities, historic context, and appreciation for interdisciplinary complexity.
3
Figure 1.1.1. Renewable energy as a percentage of total US energy supply, 2007 (EIA 2008h). 1.2 Wood for energy in Washington Biomass, from agriculture crops, forestry residues and municipal waste streams, has been identified as a significant potential source of renewable energy (Perlack et al. 2005). An inventory of biomass resources available for energy production in Washington has been conducted by scientists at Washington State University (Frear et al. 2005, Frear 2008). Study results identified wood residuals from forestry operations and products manufacture as the largest source of in-state-produced biomass that could be used for energy conversions. The magnitude of the forest resource was found to be 66 percent of the total volume of all biomass resources in Washington (Frear 2008) (Figure 3.1.2.). Fifty-one percent (21.8 million acres) of the total acreage in Washington (42.6 million acres) is in forestland (JLARC 2005) (Figure 4.1.8.) while just over eight million acres are in croplands (NASS 2002). Woody biomass for energy is a particularly versatile renewable resource that can be used to create solid, gaseous, or liquid fuels for heat, electrical power, or transportation (IEA 2005a). There are a number of woody biomass types from which energy may be generated. Each type of wood biomass will have different obstacles to and opportunities for exploitation. 1.3 Biomass and energy – Terminology Biomass, bioenergy, biofuels, biopower, biorefinery, and bioproducts have emerged as contemporary terms associated with discussion of renewable energy. Explanation of terminology is provided below. Biomass - refers to the range of all organic nonfossil materials such as agricultural products and residuals, municipal solid waste (MSW), or wood residues from forests (Wright et al. 2006). Biomass for energy is considered to be a renewable biological material that is suitable for use as a fuel or for conversion to a fuel. Forms of biomass include food crops that are also now being used to create fuels. Some examples are sugars from cane or beets, starches from corn, barley, and other grains, and vegetable oils from soy, canola, palm, and others. The fibrous, woody, and generally inedible portions of plants are called "cellulosic" or "lignocellulosic" biomass because they contain cellulose, hemicellulose, and lignin. This material can also be utilized as energy feedstock. Cellulosic biomass is the most plentiful biological material on earth (Office of Science). Biomass is a particularly attractive renewable energy because it is the only current nonfossil source of liquid transportation fuel (Perlack et al. 2005).
4
Agricultural biomass can include plant seeds, fruits, roots, leaves, chaff, and stalks. Crops such as corn and soy beans may be intentionally grown to produce energy feedstocks for conversion to fuels such as ethanol or biodiesel. The field residues from such crops, traditionally plowed under or burned, may also be utilized for energy conversions. Experimentation is being conducted with non-food agricultural crops such as grasses and algae that grow quickly to yield large volumes of biomass with energy potential. Agricultural biomass also includes animal wastes such as manure and offal. MSW includes all organic wastes that might be retrieved from garbage and used to generate energy. MSW also includes methane recovered from landfills and wastewater treatment plants. Solid and gaseous MSW, that is recovered for energy, is generally combusted to produce combined heat and electrical power (CHP). Wood residues from forests are the primary focus of this investigation and can be referred to as woody biomass or as lignocellulosic or cellulosic energy feedstocks. All wood fiber that does not have higher value product potential for non-energy applications can be considered as woody biomass. Woody biomass can include forest residues such as tops, limbs, foliage, bark, rotten logs, and stumps (otherwise commonly known as logging slash) that historically have had no merchantable value and consequently were left on site or burned following timber harvest. Woody biomass may also include such materials as may be salvaged from pre-commercial thinning activities that are designed to reduce stocking densities in young forests such that remaining tree growth is optimized. Forest fuels reductions (generally in fire-prone dry forests) can produce woody biomass as small diameter understory stems and ladder fuels are removed to create conditions such that when an ignition occurs a comparatively benign ground fire is the result rather than a destructive crown fire. Woody biomass also refers to primary and secondary wood product manufacturing residuals including bark, saw dust, planer shavings, and ground wood pieces known as hog fuel, which may or may not contain a percentage of bark. Wood chips that are manufactured from round logs not suitable for lumber manufacture or sawmill slabs and pieces may also be used for energy feedstocks but are generally considered to have higher value for paper manufacture. A by-product of pulp and paper manufacture is black liquor. Black liquor is another wood process residual that is considered as biomass. Dedicated tree plantation crops such as fast-growing poplar and willow may also be used for energy generation. The yield from such crops is considered woody biomass although the cultivation practices more closely resemble those of agriculture. Bioenergy - includes all renewable energy made from any organic material originating from plants or animals. Biofuels - are created by converting biomass to liquid, solid, or gaseous fuels primarily used to replace non-renewable fossil fuel alternatives. Biofuels include fire wood, hog fuel, pellets, ethanol, biodiesel, methanol, butanol, hydrogen, syngas, and methane although ethanol from corn grain and biodiesel from oil crops are the only biofuels currently produced in the United States on an industrial scale. Ethanol is blended with gasoline to increase octane and reduce carbon monoxide and other polluting emissions. A blend of ten percent ethanol and 90 percent gasoline (E10) creates a fuel that is acceptable for use in conventional gasoline engines. Engines are also being manufactured that can operate with higher ethanol blends of up to 85 percent (E85). Biodiesel is made by combining alcohol (usually methanol) with vegetable oil, animal fat, or recycled cooking grease. It can be used as an additive to diesel fuel (typically 20 percent; B20). One hundred percent biodiesel can be used in selected diesel engines (NRELa). First generation biofuels are made from feedstocks, such as corn and plant-derived oils, that might otherwise be used for food. Second generation or advanced biofuels are made from feedstocks without a food use, such as agricultural waste and woody biomass (BRDB 2008). Biopower - refers to electricity generated from biomass. Biopower system technologies include direct-firing, co-firing, gasification, pyrolysis, and anaerobic digestion. Biorefinery - is a facility that integrates biomass conversion processes to produce fuels, power, heat, process steam, and chemicals from biomass. The biorefinery concept is analogous to today's petroleum refineries, which produce multiple fuels and products from petroleum. Industrial biorefineries have been

5
identified as the most promising route to the creation of a new domestic biobased industry. By producing multiple products, a biorefinery can take advantage of the differences in biomass components and intermediates and maximize the value derived from the biomass feedstock. A biorefinery might, for example, produce one or several low-volume, but high-value, chemical products and a low-value, but high-volume liquid transportation fuel, while generating electricity and process heat for its own use and perhaps enough for sale of electricity. The high-value products enhance profitability, the high-volume fuel helps meet national energy needs, and the power production reduces costs and avoids greenhouse-gas emissions (NRELb). The potential for transforming existing forest products processing facilities (especially pulp and paper mils) into biorefineries for production of renewable energy and bioproducts is being explored by the Agenda 2020 Technology Alliance as a partnership between the American Forest and Paper Association and the U.S. Department of Energy (Agenda 2020 2006, Thorp 2005). Bioproducts - are comparatively low volume but high value products that can be produced along with bioenergy as part of the biorefinery process to maximize return from biomass. Bioproducts that can be made from recovered sugars include antifreeze, plastics, glues, artificial sweeteners, and gel for toothpaste. Bioproducts that can be made from carbon monoxide and hydrogen in syngas include plastics and acids, which can be used to make photographic films, textiles, and synthetic fabrics. Bioproducts that can be made from phenol, one possible extraction from pyrolysis oil, include wood adhesives, molded plastic, and foam insulation (NRELb).
Forest Resources for Renewable Energy Logging Slash - small diameter trees, broken tops and limbs left after commercial timber harvests that are not otherwise merchantable as higher-value wood products. Thinnings - small diameter logs and vegetation thinned from forests to remove surplus fuel loads, reduce fire hazard and/or promote growth of leave trees. Hog Fuel – primary wood product processing residues (bark, saw dust, planer shavings, trim ends, and other wood pieces). May be green or dry. Hog Fuel – secondary wood product processing residues (saw dust, planer shavings, trim ends, and other wood pieces). Normally dry. Biorefinery Sugars - the hemicellulosic component of wood used for pulp and paper. Extracting a portion of the hemicellulose from the wood prior to pulping allows those sugars to be converted to ethanol and other chemicals. Black Liquor – an aqueous solution of lignin residues, hemicellulose, and the inorganic chemicals that is a by-product of pulp and paper production. Contains 35 percent of the original wood energy. Wood Waste – construction and demolition debris, tree trimming, packaging wastes, and other discarded wood. Energy Crops – dedicated fast-growth wood crops such as poplar and willow that are plantation-grown for energy feedstocks.
1.4 Wood-to-energy – conversion options As discussed above, there are a number of sources and types of woody biomass. In addition, there are also a number of conversion options from which wood can be made into a variety of fuel and energy products (Wright et al. 2006, Klass 1998). Many factors influence the selection of the type and scale of a wood-to-energy strategy that may be the most desirable for local development of a specific project. Factors include raw material availability, quality and cost; local energy needs; the capability status of existing process infrastructure; regulatory and policy framework; proprietary access to conversion
6
technologies; and others. Below, for reference and context, is a description of the most generally employed conversion technologies currently available for the production of biofuels, bioenergy, and bioproducts from woody biomass and/or other lignocelluosic materials. Fuel products may be solid, liquid, or gaseous and may be final or intermediary energy feedstocks. Table 1.4.1. Major energy fuels from woody biomass.
Solid Fuels Liquid Fuels Gaseous Fuels Firewood Hog Fuel Pellets
Charcoal
Ethanol Methanol
Bio-Oil Synthetic Diesel
Syngas
Table 1.4.2. Major wood-to-energy processes by primary fuel type.
Solid Fuels Liquid Fuels Gaseous Fuels Size Reduction Compression Torrefaction
Direct Combustion Co-fire
Separation Hydrolysis
Fermentation Distillation
Dehydration Fischer-Tropsch
Pyrolysis Partial Oxidation
Reforming
Firewood Firewood is the oldest and most familiar form of wood for energy. Bergman and Zerbe (2004) estimate that 58 million tons of wood are used each year in the United States for residential and small institutional heating. An EIA (2005) survey of residential energy consumption found that 14.4 million households in the United States use wood for heat. The US Census Bureau (2000) reported five percent (107,000) of Washington households rely upon wood for heat. Residential wood combustion (RWC) emissions are highly variable and are a function of wood characteristics, moisture content, stove quality and operating practices. RWC emissions generally contain some combination of gases (principally CO and CO2), volatile organic compounds (VOC) and small particulate matter (PM 10 and PM 2.5) which are composed of tiny unburned particles of ash and toxic elements. Emissions of PM 2.5 are the primary health concern associated with wood stove smoke (WDOE 1997). In Washington many wood stoves (85 percent in 1997) are old and not certified to meet federal emission standards (WDOE 1997). Since 1988, EPA has required manufacturers of wood stoves to certify that each model line of wood stoves offered for sale in the United States complies with the EPA particulate emissions guidelines in the Clean Air Act (EPAa). EPA-certified wood stoves emit approximately 70% less pollution than older, conventional wood stoves (Schreiber et al. 2005). Towards facilitating improvement, the EPA has a program that works with local partners to assist wood stove upgrades. Replacement of 25 non-certified older stoves with 25 EPA-certified stoves has been shown to prevent emissions of one ton of particulates each year (EPAb,c). In 1997, wood stoves and fireplaces released ten percent of total Washington air pollution but by 2005 the emissions from wood stoves and fireplaces had dropped to four percent of total pollution (WDOE 1997 and 2005). For broader comparison, outdoor burning can produce 12 times the particulate pollution of an EPA-certified wood stove (Schreiber et al. 2005).
7
Conditions that promote a fast burn rate and a higher flame intensity, such as low moisture content and proper air flow, enhance secondary combustion and thereby lower emissions. Secondary combustion is especially important in wood burning because of the high volatile matter content of wood, typically 80 percent by dry weight. Conversely, higher emissions will result from a slow burn rate and lower flame intensity. Such generalizations apply particularly to the earlier stages of the burning cycle, when significant quantities of combustible volatile matter are being driven out of the wood. Later in the burning cycle, when all volatile matter has been driven out of the wood, the charcoal that remains burns with relatively few emissions. Zerbe and Bergman (2004) suggest that most wood stoves will burn wood with up to 20 percent moisture content (MC) without noticeable increase in smoke. Air dry wood stabilizes at 15 percent MC. Freshly cut green wood has MC of approximately50 percent. Four to seven cords of firewood per year are required to provide heat for an average home. A standard cord of stacked wood measures four feet by four feet by eight feet and after accounting for voids contains an average of 80 cubic feet of wood (Zerbe and Bergman 2004). Hendrickson and Gulland (1993) suggest that a comparatively low energy investment in process and transport for residential fire wood use in North America linked to proper forest management and fuel use represents an important but neglected opportunity to integrate rural cultural practices with sustainable development and GHG emission reductions. Table 1.4.3. Higher heating values for the wood of some NW species in British thermal units (Btus) per oven-
dry pound (Ince 1979). Western red
cedar Douglas-fir Western
hemlock Big leaf maple
Red alder Ponderosa Pine
Lodgepole Pine
9,700 8,950 8,370 8,400 8,860 9,616 10,760 Use of fire wood in EPA-approved wood stoves is a cost-competitive and mature technology that provides a clean renewable energy alternative to heating oil or coal. Hog Fuel Hog or hogged fuel is a waste product of wood that has been ground (hogged) for use as a commercial energy source. Any wood species is suitable for hogged fuel. Raw materials that can be hogged include a heterogeneous group: debarker residues, logging slash, small diameter trees, sort yard debris, cull and trim, land clearing debris (brush, stumps, etc.), municipal yard wastes (brush, leaves, branches), industrial packaging (pallets, boxes, crates), and construction/ demolition wood wastes. Wood shall be free of rocks, dirt, metal or other non-combustible material, and should not be painted or coated. Raw wood wastes are fed into a shredder, grinder, or other sizing machinery that can be stationary or mobile and most generally employs rotating hammers and stationary anvils to smash, crush and tear large wood into smaller fragments. In this way, the various sizes and forms are reduced to a relatively uniform size of chips and shreds. Maximum output particle dimension is generally less than 3 inches such that material will flow evenly by conveyor, auger, or other means of mechanized feedstock transport employed by energy conversion facilities.
Figure 1.4.1. Stacked alder firewood in western Washington (Sharpe).
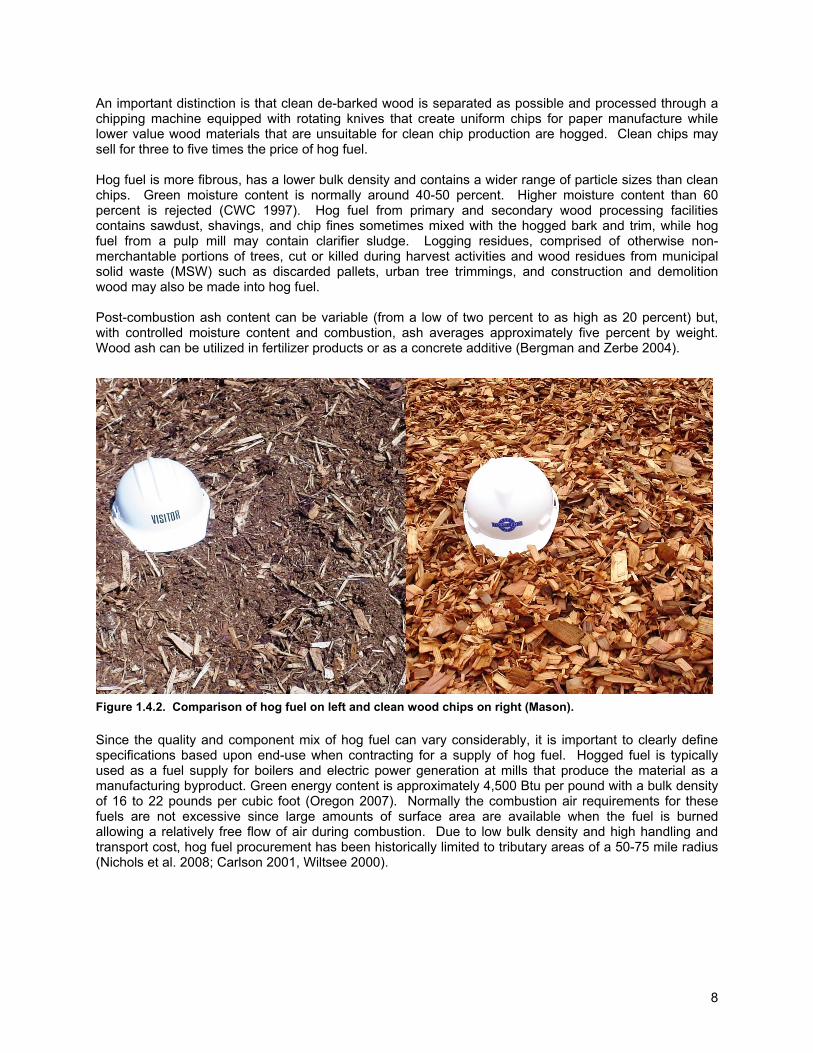
8
An important distinction is that clean de-barked wood is separated as possible and processed through a chipping machine equipped with rotating knives that create uniform chips for paper manufacture while lower value wood materials that are unsuitable for clean chip production are hogged. Clean chips may sell for three to five times the price of hog fuel. Hog fuel is more fibrous, has a lower bulk density and contains a wider range of particle sizes than clean chips. Green moisture content is normally around 40-50 percent. Higher moisture content than 60 percent is rejected (CWC 1997). Hog fuel from primary and secondary wood processing facilities contains sawdust, shavings, and chip fines sometimes mixed with the hogged bark and trim, while hog fuel from a pulp mill may contain clarifier sludge. Logging residues, comprised of otherwise non-merchantable portions of trees, cut or killed during harvest activities and wood residues from municipal solid waste (MSW) such as discarded pallets, urban tree trimmings, and construction and demolition wood may also be made into hog fuel. Post-combustion ash content can be variable (from a low of two percent to as high as 20 percent) but, with controlled moisture content and combustion, ash averages approximately five percent by weight. Wood ash can be utilized in fertilizer products or as a concrete additive (Bergman and Zerbe 2004).
Figure 1.4.2. Comparison of hog fuel on left and clean wood chips on right (Mason). Since the quality and component mix of hog fuel can vary considerably, it is important to clearly define specifications based upon end-use when contracting for a supply of hog fuel. Hogged fuel is typically used as a fuel supply for boilers and electric power generation at mills that produce the material as a manufacturing byproduct. Green energy content is approximately 4,500 Btu per pound with a bulk density of 16 to 22 pounds per cubic foot (Oregon 2007). Normally the combustion air requirements for these fuels are not excessive since large amounts of surface area are available when the fuel is burned allowing a relatively free flow of air during combustion. Due to low bulk density and high handling and transport cost, hog fuel procurement has been historically limited to tributary areas of a 50-75 mile radius (Nichols et al. 2008; Carlson 2001, Wiltsee 2000).
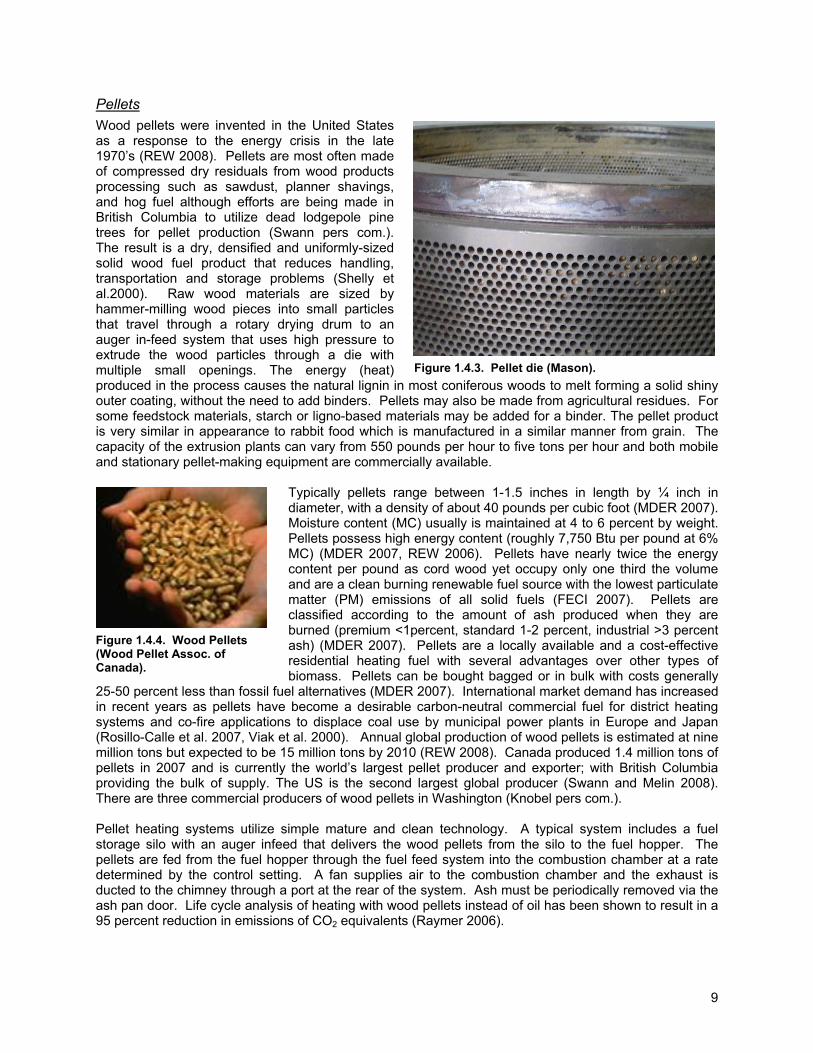
9
Pellets Wood pellets were invented in the United States as a response to the energy crisis in the late 1970’s (REW 2008). Pellets are most often made of compressed dry residuals from wood products processing such as sawdust, planner shavings, and hog fuel although efforts are being made in British Columbia to utilize dead lodgepole pine trees for pellet production (Swann pers com.). The result is a dry, densified and uniformly-sized solid wood fuel product that reduces handling, transportation and storage problems (Shelly et al.2000). Raw wood materials are sized by hammer-milling wood pieces into small particles that travel through a rotary drying drum to an auger in-feed system that uses high pressure to extrude the wood particles through a die with multiple small openings. The energy (heat) produced in the process causes the natural lignin in most coniferous woods to melt forming a solid shiny outer coating, without the need to add binders. Pellets may also be made from agricultural residues. For some feedstock materials, starch or ligno-based materials may be added for a binder. The pellet product is very similar in appearance to rabbit food which is manufactured in a similar manner from grain. The capacity of the extrusion plants can vary from 550 pounds per hour to five tons per hour and both mobile and stationary pellet-making equipment are commercially available.
Typically pellets range between 1-1.5 inches in length by ¼ inch in diameter, with a density of about 40 pounds per cubic foot (MDER 2007). Moisture content (MC) usually is maintained at 4 to 6 percent by weight. Pellets possess high energy content (roughly 7,750 Btu per pound at 6% MC) (MDER 2007, REW 2006). Pellets have nearly twice the energy content per pound as cord wood yet occupy only one third the volume and are a clean burning renewable fuel source with the lowest particulate matter (PM) emissions of all solid fuels (FECI 2007). Pellets are classified according to the amount of ash produced when they are burned (premium <1percent, standard 1-2 percent, industrial >3 percent ash) (MDER 2007). Pellets are a locally available and a cost-effective residential heating fuel with several advantages over other types of biomass. Pellets can be bought bagged or in bulk with costs generally
25-50 percent less than fossil fuel alternatives (MDER 2007). International market demand has increased in recent years as pellets have become a desirable carbon-neutral commercial fuel for district heating systems and co-fire applications to displace coal use by municipal power plants in Europe and Japan (Rosillo-Calle et al. 2007, Viak et al. 2000). Annual global production of wood pellets is estimated at nine million tons but expected to be 15 million tons by 2010 (REW 2008). Canada produced 1.4 million tons of pellets in 2007 and is currently the world’s largest pellet producer and exporter; with British Columbia providing the bulk of supply. The US is the second largest global producer (Swann and Melin 2008). There are three commercial producers of wood pellets in Washington (Knobel pers com.). Pellet heating systems utilize simple mature and clean technology. A typical system includes a fuel storage silo with an auger infeed that delivers the wood pellets from the silo to the fuel hopper. The pellets are fed from the fuel hopper through the fuel feed system into the combustion chamber at a rate determined by the control setting. A fan supplies air to the combustion chamber and the exhaust is ducted to the chimney through a port at the rear of the system. Ash must be periodically removed via the ash pan door. Life cycle analysis of heating with wood pellets instead of oil has been shown to result in a 95 percent reduction in emissions of CO2 equivalents (Raymer 2006).
Figure 1.4.3. Pellet die (Mason).
Figure 1.4.4. Wood Pellets (Wood Pellet Assoc. of Canada).
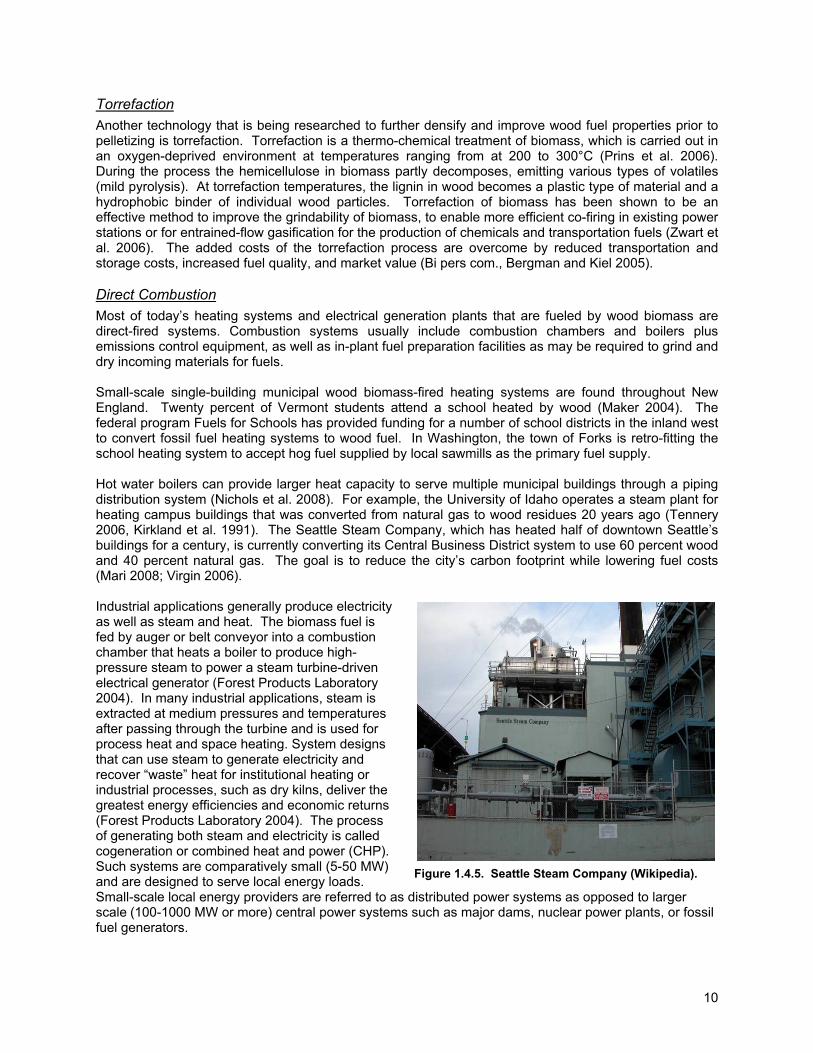
10
Torrefaction Another technology that is being researched to further densify and improve wood fuel properties prior to pelletizing is torrefaction. Torrefaction is a thermo-chemical treatment of biomass, which is carried out in an oxygen-deprived environment at temperatures ranging from at 200 to 300°C (Prins et al. 2006). During the process the hemicellulose in biomass partly decomposes, emitting various types of volatiles (mild pyrolysis). At torrefaction temperatures, the lignin in wood becomes a plastic type of material and a hydrophobic binder of individual wood particles. Torrefaction of biomass has been shown to be an effective method to improve the grindability of biomass, to enable more efficient co-firing in existing power stations or for entrained-flow gasification for the production of chemicals and transportation fuels (Zwart et al. 2006). The added costs of the torrefaction process are overcome by reduced transportation and storage costs, increased fuel quality, and market value (Bi pers com., Bergman and Kiel 2005). Direct Combustion Most of today’s heating systems and electrical generation plants that are fueled by wood biomass are direct-fired systems. Combustion systems usually include combustion chambers and boilers plus emissions control equipment, as well as in-plant fuel preparation facilities as may be required to grind and dry incoming materials for fuels. Small-scale single-building municipal wood biomass-fired heating systems are found throughout New England. Twenty percent of Vermont students attend a school heated by wood (Maker 2004). The federal program Fuels for Schools has provided funding for a number of school districts in the inland west to convert fossil fuel heating systems to wood fuel. In Washington, the town of Forks is retro-fitting the school heating system to accept hog fuel supplied by local sawmills as the primary fuel supply. Hot water boilers can provide larger heat capacity to serve multiple municipal buildings through a piping distribution system (Nichols et al. 2008). For example, the University of Idaho operates a steam plant for heating campus buildings that was converted from natural gas to wood residues 20 years ago (Tennery 2006, Kirkland et al. 1991). The Seattle Steam Company, which has heated half of downtown Seattle’s buildings for a century, is currently converting its Central Business District system to use 60 percent wood and 40 percent natural gas. The goal is to reduce the city’s carbon footprint while lowering fuel costs (Mari 2008; Virgin 2006). Industrial applications generally produce electricity as well as steam and heat. The biomass fuel is fed by auger or belt conveyor into a combustion chamber that heats a boiler to produce high-pressure steam to power a steam turbine-driven electrical generator (Forest Products Laboratory 2004). In many industrial applications, steam is extracted at medium pressures and temperatures after passing through the turbine and is used for process heat and space heating. System designs that can use steam to generate electricity and recover “waste” heat for institutional heating or industrial processes, such as dry kilns, deliver the greatest energy efficiencies and economic returns (Forest Products Laboratory 2004). The process of generating both steam and electricity is called cogeneration or combined heat and power (CHP). Such systems are comparatively small (5-50 MW) and are designed to serve local energy loads. Small-scale local energy providers are referred to as distributed power systems as opposed to larger scale (100-1000 MW or more) central power systems such as major dams, nuclear power plants, or fossil fuel generators.
Figure 1.4.5. Seattle Steam Company (Wikipedia).
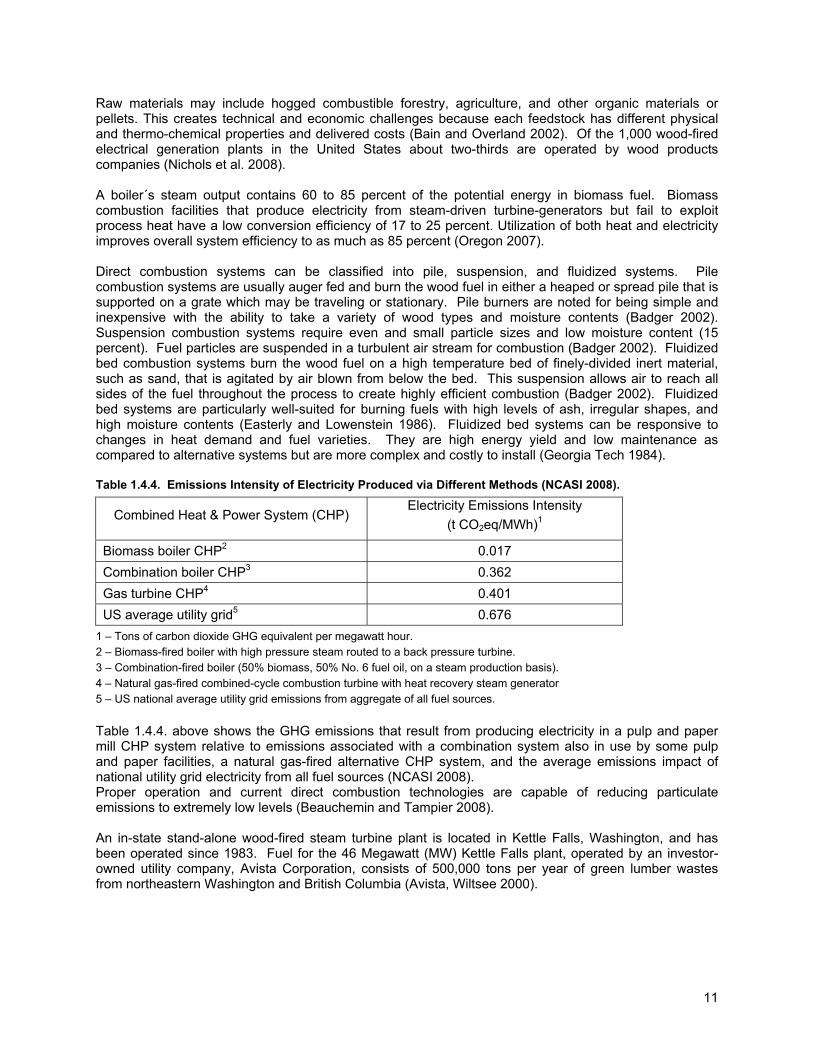
11
Raw materials may include hogged combustible forestry, agriculture, and other organic materials or pellets. This creates technical and economic challenges because each feedstock has different physical and thermo-chemical properties and delivered costs (Bain and Overland 2002). Of the 1,000 wood-fired electrical generation plants in the United States about two-thirds are operated by wood products companies (Nichols et al. 2008). A boiler´s steam output contains 60 to 85 percent of the potential energy in biomass fuel. Biomass combustion facilities that produce electricity from steam-driven turbine-generators but fail to exploit process heat have a low conversion efficiency of 17 to 25 percent. Utilization of both heat and electricity improves overall system efficiency to as much as 85 percent (Oregon 2007). Direct combustion systems can be classified into pile, suspension, and fluidized systems. Pile combustion systems are usually auger fed and burn the wood fuel in either a heaped or spread pile that is supported on a grate which may be traveling or stationary. Pile burners are noted for being simple and inexpensive with the ability to take a variety of wood types and moisture contents (Badger 2002). Suspension combustion systems require even and small particle sizes and low moisture content (15 percent). Fuel particles are suspended in a turbulent air stream for combustion (Badger 2002). Fluidized bed combustion systems burn the wood fuel on a high temperature bed of finely-divided inert material, such as sand, that is agitated by air blown from below the bed. This suspension allows air to reach all sides of the fuel throughout the process to create highly efficient combustion (Badger 2002). Fluidized bed systems are particularly well-suited for burning fuels with high levels of ash, irregular shapes, and high moisture contents (Easterly and Lowenstein 1986). Fluidized bed systems can be responsive to changes in heat demand and fuel varieties. They are high energy yield and low maintenance as compared to alternative systems but are more complex and costly to install (Georgia Tech 1984). Table 1.4.4. Emissions Intensity of Electricity Produced via Different Methods (NCASI 2008).
Combined Heat & Power System (CHP) Electricity Emissions Intensity
(t CO2eq/MWh)1
Biomass boiler CHP2 0.017 Combination boiler CHP3 0.362 Gas turbine CHP4 0.401 US average utility grid5 0.676
1 – Tons of carbon dioxide GHG equivalent per megawatt hour. 2 – Biomass-fired boiler with high pressure steam routed to a back pressure turbine. 3 – Combination-fired boiler (50% biomass, 50% No. 6 fuel oil, on a steam production basis). 4 – Natural gas-fired combined-cycle combustion turbine with heat recovery steam generator 5 – US national average utility grid emissions from aggregate of all fuel sources. Table 1.4.4. above shows the GHG emissions that result from producing electricity in a pulp and paper mill CHP system relative to emissions associated with a combination system also in use by some pulp and paper facilities, a natural gas-fired alternative CHP system, and the average emissions impact of national utility grid electricity from all fuel sources (NCASI 2008). Proper operation and current direct combustion technologies are capable of reducing particulate emissions to extremely low levels (Beauchemin and Tampier 2008). An in-state stand-alone wood-fired steam turbine plant is located in Kettle Falls, Washington, and has been operated since 1983. Fuel for the 46 Megawatt (MW) Kettle Falls plant, operated by an investor-owned utility company, Avista Corporation, consists of 500,000 tons per year of green lumber wastes from northeastern Washington and British Columbia (Avista, Wiltsee 2000).
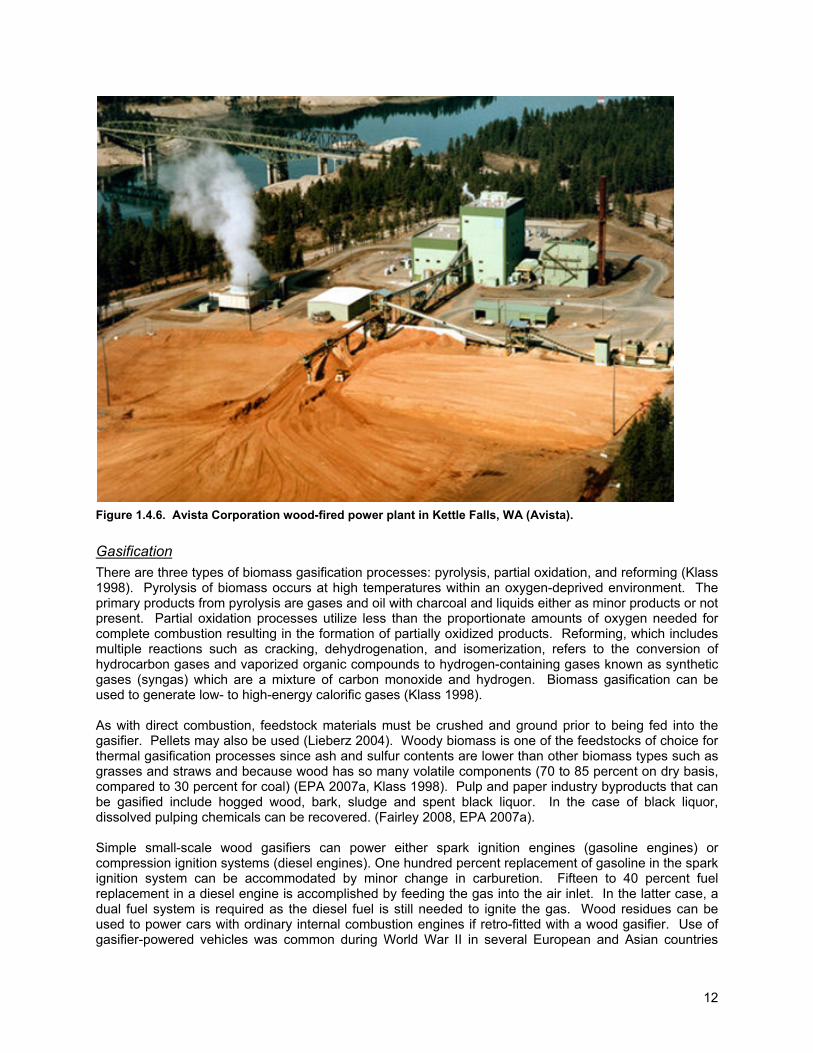
12
Figure 1.4.6. Avista Corporation wood-fired power plant in Kettle Falls, WA (Avista). Gasification There are three types of biomass gasification processes: pyrolysis, partial oxidation, and reforming (Klass 1998). Pyrolysis of biomass occurs at high temperatures within an oxygen-deprived environment. The primary products from pyrolysis are gases and oil with charcoal and liquids either as minor products or not present. Partial oxidation processes utilize less than the proportionate amounts of oxygen needed for complete combustion resulting in the formation of partially oxidized products. Reforming, which includes multiple reactions such as cracking, dehydrogenation, and isomerization, refers to the conversion of hydrocarbon gases and vaporized organic compounds to hydrogen-containing gases known as synthetic gases (syngas) which are a mixture of carbon monoxide and hydrogen. Biomass gasification can be used to generate low- to high-energy calorific gases (Klass 1998). As with direct combustion, feedstock materials must be crushed and ground prior to being fed into the gasifier. Pellets may also be used (Lieberz 2004). Woody biomass is one of the feedstocks of choice for thermal gasification processes since ash and sulfur contents are lower than other biomass types such as grasses and straws and because wood has so many volatile components (70 to 85 percent on dry basis, compared to 30 percent for coal) (EPA 2007a, Klass 1998). Pulp and paper industry byproducts that can be gasified include hogged wood, bark, sludge and spent black liquor. In the case of black liquor, dissolved pulping chemicals can be recovered. (Fairley 2008, EPA 2007a). Simple small-scale wood gasifiers can power either spark ignition engines (gasoline engines) or compression ignition systems (diesel engines). One hundred percent replacement of gasoline in the spark ignition system can be accommodated by minor change in carburetion. Fifteen to 40 percent fuel replacement in a diesel engine is accomplished by feeding the gas into the air inlet. In the latter case, a dual fuel system is required as the diesel fuel is still needed to ignite the gas. Wood residues can be used to power cars with ordinary internal combustion engines if retro-fitted with a wood gasifier. Use of gasifier-powered vehicles was common during World War II in several European and Asian countries
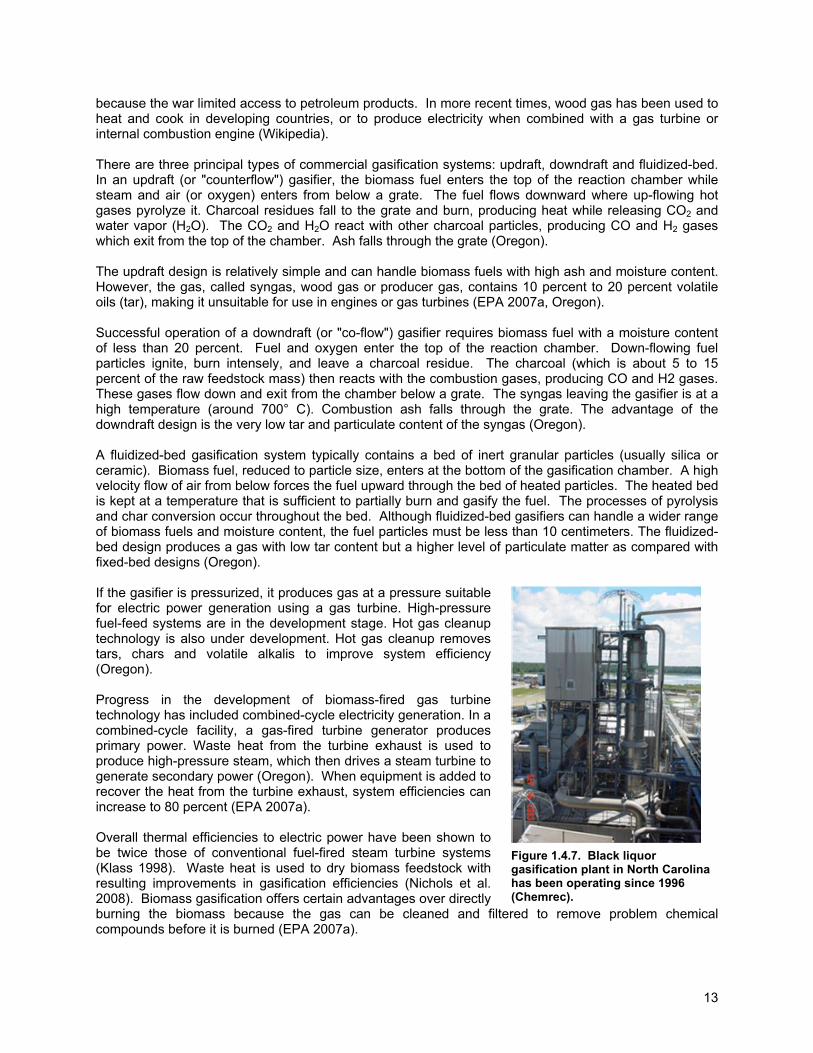
13
because the war limited access to petroleum products. In more recent times, wood gas has been used to heat and cook in developing countries, or to produce electricity when combined with a gas turbine or internal combustion engine (Wikipedia). There are three principal types of commercial gasification systems: updraft, downdraft and fluidized-bed. In an updraft (or "counterflow") gasifier, the biomass fuel enters the top of the reaction chamber while steam and air (or oxygen) enters from below a grate. The fuel flows downward where up-flowing hot gases pyrolyze it. Charcoal residues fall to the grate and burn, producing heat while releasing CO2 and water vapor (H2O). The CO2 and H2O react with other charcoal particles, producing CO and H2 gases which exit from the top of the chamber. Ash falls through the grate (Oregon). The updraft design is relatively simple and can handle biomass fuels with high ash and moisture content. However, the gas, called syngas, wood gas or producer gas, contains 10 percent to 20 percent volatile oils (tar), making it unsuitable for use in engines or gas turbines (EPA 2007a, Oregon). Successful operation of a downdraft (or "co-flow") gasifier requires biomass fuel with a moisture content of less than 20 percent. Fuel and oxygen enter the top of the reaction chamber. Down-flowing fuel particles ignite, burn intensely, and leave a charcoal residue. The charcoal (which is about 5 to 15 percent of the raw feedstock mass) then reacts with the combustion gases, producing CO and H2 gases. These gases flow down and exit from the chamber below a grate. The syngas leaving the gasifier is at a high temperature (around 700° C). Combustion ash falls through the grate. The advantage of the downdraft design is the very low tar and particulate content of the syngas (Oregon). A fluidized-bed gasification system typically contains a bed of inert granular particles (usually silica or ceramic). Biomass fuel, reduced to particle size, enters at the bottom of the gasification chamber. A high velocity flow of air from below forces the fuel upward through the bed of heated particles. The heated bed is kept at a temperature that is sufficient to partially burn and gasify the fuel. The processes of pyrolysis and char conversion occur throughout the bed. Although fluidized-bed gasifiers can handle a wider range of biomass fuels and moisture content, the fuel particles must be less than 10 centimeters. The fluidized-bed design produces a gas with low tar content but a higher level of particulate matter as compared with fixed-bed designs (Oregon). If the gasifier is pressurized, it produces gas at a pressure suitable for electric power generation using a gas turbine. High-pressure fuel-feed systems are in the development stage. Hot gas cleanup technology is also under development. Hot gas cleanup removes tars, chars and volatile alkalis to improve system efficiency (Oregon). Progress in the development of biomass-fired gas turbine technology has included combined-cycle electricity generation. In a combined-cycle facility, a gas-fired turbine generator produces primary power. Waste heat from the turbine exhaust is used to produce high-pressure steam, which then drives a steam turbine to generate secondary power (Oregon). When equipment is added to recover the heat from the turbine exhaust, system efficiencies can increase to 80 percent (EPA 2007a). Overall thermal efficiencies to electric power have been shown to be twice those of conventional fuel-fired steam turbine systems (Klass 1998). Waste heat is used to dry biomass feedstock with resulting improvements in gasification efficiencies (Nichols et al. 2008). Biomass gasification offers certain advantages over directly burning the biomass because the gas can be cleaned and filtered to remove problem chemical compounds before it is burned (EPA 2007a).
Figure 1.4.7. Black liquor gasification plant in North Carolina has been operating since 1996 (Chemrec).
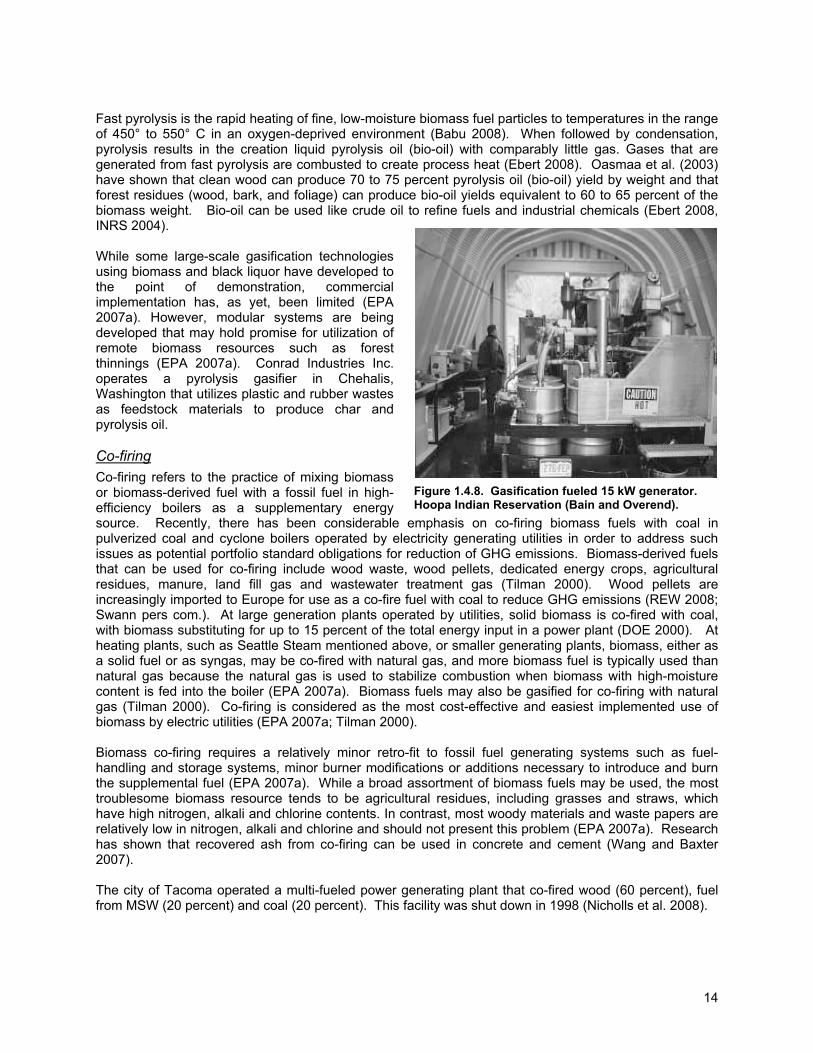
14
Fast pyrolysis is the rapid heating of fine, low-moisture biomass fuel particles to temperatures in the range of 450° to 550° C in an oxygen-deprived environment (Babu 2008). When followed by condensation, pyrolysis results in the creation liquid pyrolysis oil (bio-oil) with comparably little gas. Gases that are generated from fast pyrolysis are combusted to create process heat (Ebert 2008). Oasmaa et al. (2003) have shown that clean wood can produce 70 to 75 percent pyrolysis oil (bio-oil) yield by weight and that forest residues (wood, bark, and foliage) can produce bio-oil yields equivalent to 60 to 65 percent of the biomass weight. Bio-oil can be used like crude oil to refine fuels and industrial chemicals (Ebert 2008, INRS 2004). While some large-scale gasification technologies using biomass and black liquor have developed to the point of demonstration, commercial implementation has, as yet, been limited (EPA 2007a). However, modular systems are being developed that may hold promise for utilization of remote biomass resources such as forest thinnings (EPA 2007a). Conrad Industries Inc. operates a pyrolysis gasifier in Chehalis, Washington that utilizes plastic and rubber wastes as feedstock materials to produce char and pyrolysis oil. Co-firing Co-firing refers to the practice of mixing biomass or biomass-derived fuel with a fossil fuel in high-efficiency boilers as a supplementary energy source. Recently, there has been considerable emphasis on co-firing biomass fuels with coal in pulverized coal and cyclone boilers operated by electricity generating utilities in order to address such issues as potential portfolio standard obligations for reduction of GHG emissions. Biomass-derived fuels that can be used for co-firing include wood waste, wood pellets, dedicated energy crops, agricultural residues, manure, land fill gas and wastewater treatment gas (Tilman 2000). Wood pellets are increasingly imported to Europe for use as a co-fire fuel with coal to reduce GHG emissions (REW 2008; Swann pers com.). At large generation plants operated by utilities, solid biomass is co-fired with coal, with biomass substituting for up to 15 percent of the total energy input in a power plant (DOE 2000). At heating plants, such as Seattle Steam mentioned above, or smaller generating plants, biomass, either as a solid fuel or as syngas, may be co-fired with natural gas, and more biomass fuel is typically used than natural gas because the natural gas is used to stabilize combustion when biomass with high-moisture content is fed into the boiler (EPA 2007a). Biomass fuels may also be gasified for co-firing with natural gas (Tilman 2000). Co-firing is considered as the most cost-effective and easiest implemented use of biomass by electric utilities (EPA 2007a; Tilman 2000). Biomass co-firing requires a relatively minor retro-fit to fossil fuel generating systems such as fuel-handling and storage systems, minor burner modifications or additions necessary to introduce and burn the supplemental fuel (EPA 2007a). While a broad assortment of biomass fuels may be used, the most troublesome biomass resource tends to be agricultural residues, including grasses and straws, which have high nitrogen, alkali and chlorine contents. In contrast, most woody materials and waste papers are relatively low in nitrogen, alkali and chlorine and should not present this problem (EPA 2007a). Research has shown that recovered ash from co-firing can be used in concrete and cement (Wang and Baxter 2007). The city of Tacoma operated a multi-fueled power generating plant that co-fired wood (60 percent), fuel from MSW (20 percent) and coal (20 percent). This facility was shut down in 1998 (Nicholls et al. 2008).
Figure 1.4.8. Gasification fueled 15 kW generator. Hoopa Indian Reservation (Bain and Overend).
15
There are currently many technology options for co-firing that are mature, efficient, and reliable. Competitive performance as compared to fossil fuels can be favorable where low cost residues are available and investment costs are minimal (EERE 2004). A 15 percent fuel replacement with wood biomass in a coal power plant results in an 18 percent GHG emissions reduction (NREL 2000). Gasification technologies, once proven at a commercial scale, will provide even better possibilities for co-firing with biomass (IEA 2007a). Ethanol Ethanol has a long history of usage as a liquid fuel for internal combustion engines. It can be used by itself (neat fuel), as a fuel extender with petroleum fuels (blended fuel), as an octane enhancement (racing fuels), and as a source of dissolved oxygen in gasoline (MTBE replacement) (NREL 1999, Klass 1998, IQ Learning Systems). Ethanol offers the anti-knock and oxygenation benefits of a high octane but contains 34 percent less energy than gasoline resulting in cleaner but reduced car mileage per gallon of fuel. Almost all of the ethanol made in the United States today comes from corn but ethanol can also be made from wood. There is considerable international interest in production of ethanol from wood (Enecon 2002). Ethanol from wood (and other plant material) is referred to as cellulosic or lignocellulosic ethanol and is considered to be a second generation or advanced biofuel. The Energy Independence and Security Act of 2007 (EISA) mandates that by 2022 there will be 21 billion gallons of advanced biofuels produced annually in the United States (Sissine 2007). Several types of woody biomass can be used for this purpose: forest residues, debarking waste, paper mill residues, sawdust, wood chips, energy crops, etc. For best economic performance, biomass feedstocks should be available at a consistent price, quality, and quantity, and must be harvested, stored, and transported cost-effectively year-round in sufficient volumes to provide operating efficiencies. The minimum production volume for economies of scale and cost-efficient conversion of wood to ethanol is estimated at 50 million gallons per year (Busby et al. 2008, Solomon et al. 2007) but optimum size may be much larger (Wright and Brown 2007). At an approximate yield of 80 gallons per bone dry ton (BDT) of woody biomass, a 50 million gallon per year commercial wood-to-ethanol facility would require 625,000 BDT per year of raw material (EEREa, Kerstetter and Lyons 2001); about the size of a moderate capacity pulp mill. The proportion of cellulose and hemicelluloses in wood (about 70 percent) provides an excellent opportunity for conversion to ethanol (Shelly et al. 2000). Making ethanol from cellulosic feedstocks, such as wood, however, is more challenging than making ethanol from starch and sugar feedstocks such as corn and cane (EEREb&c). The basic conversion process involves the pretreatment of lignocellulosic feedstock (wood) to separate it into its main constituents, cellulose, hemicellulose and lignin; this can be accomplished by mechanical, chemical or biological means, or a combination of each (Hamelinck et al. 2005). Pretreatment reduces particle size and increases surface area. Following pretreatment, hydrolysis of carbohydrate polymers liberates sugar monomers; this is usually accomplished through acid or enzymatic methods (Wright et al. 2006). There are two acid hydrolysis processes commonly used: dilute acid and concentrated acid. The dilute acid process is conducted under high temperature and pressure, and has a reaction time in the range of seconds or minutes, which facilitates continuous processing. The conversion efficiency with this method is about 50 percent (Graf and Koehler 2000). The concentrated acid process uses relatively mild temperatures, and the only pressures involved are those created by pumping materials from vessel to vessel. Reaction times are typically much longer than for dilute acid. The conversion efficiency oscillates around 80-90 percent (Graf and Koehler 2000). Enzymatic hydrolysis involves the use of cellulases that are produced from strains of bacteria and fungi, which catalyze the depolymerization of cellulose chains (NREL 2007). Cellulases were first developed from mold encountered during WWII in the South Pacific (Bernton et al. 1982). Hydrolysis is followed by fermentation of sugars from the cellulose and hemicelluose using genetically engineered yeast or bacteria to produce ethanol and carbon dioxide as a byproduct (Oregon).
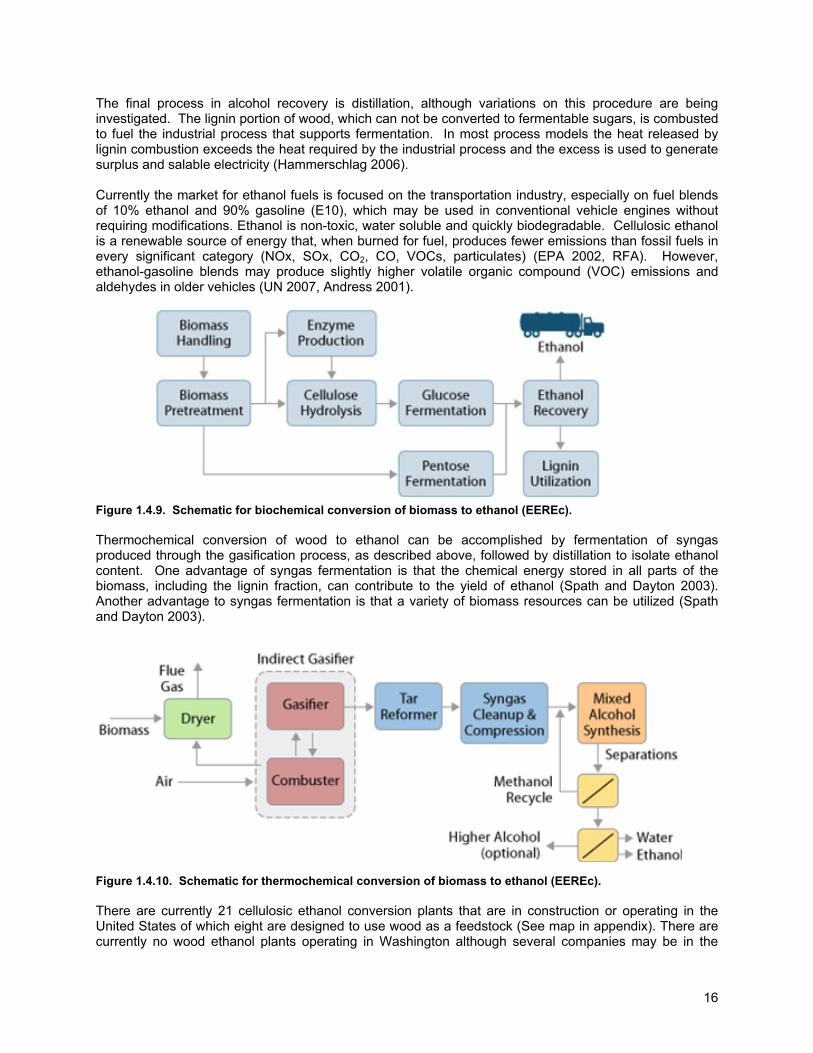
16
The final process in alcohol recovery is distillation, although variations on this procedure are being investigated. The lignin portion of wood, which can not be converted to fermentable sugars, is combusted to fuel the industrial process that supports fermentation. In most process models the heat released by lignin combustion exceeds the heat required by the industrial process and the excess is used to generate surplus and salable electricity (Hammerschlag 2006). Currently the market for ethanol fuels is focused on the transportation industry, especially on fuel blends of 10% ethanol and 90% gasoline (E10), which may be used in conventional vehicle engines without requiring modifications. Ethanol is non-toxic, water soluble and quickly biodegradable. Cellulosic ethanol is a renewable source of energy that, when burned for fuel, produces fewer emissions than fossil fuels in every significant category (NOx, SOx, CO2, CO, VOCs, particulates) (EPA 2002, RFA). However, ethanol-gasoline blends may produce slightly higher volatile organic compound (VOC) emissions and aldehydes in older vehicles (UN 2007, Andress 2001).
Figure 1.4.9. Schematic for biochemical conversion of biomass to ethanol (EEREc). Thermochemical conversion of wood to ethanol can be accomplished by fermentation of syngas produced through the gasification process, as described above, followed by distillation to isolate ethanol content. One advantage of syngas fermentation is that the chemical energy stored in all parts of the biomass, including the lignin fraction, can contribute to the yield of ethanol (Spath and Dayton 2003). Another advantage to syngas fermentation is that a variety of biomass resources can be utilized (Spath and Dayton 2003). Figure 1.4.10. Schematic for thermochemical conversion of biomass to ethanol (EEREc). There are currently 21 cellulosic ethanol conversion plants that are in construction or operating in the United States of which eight are designed to use wood as a feedstock (See map in appendix). There are currently no wood ethanol plants operating in Washington although several companies may be in the
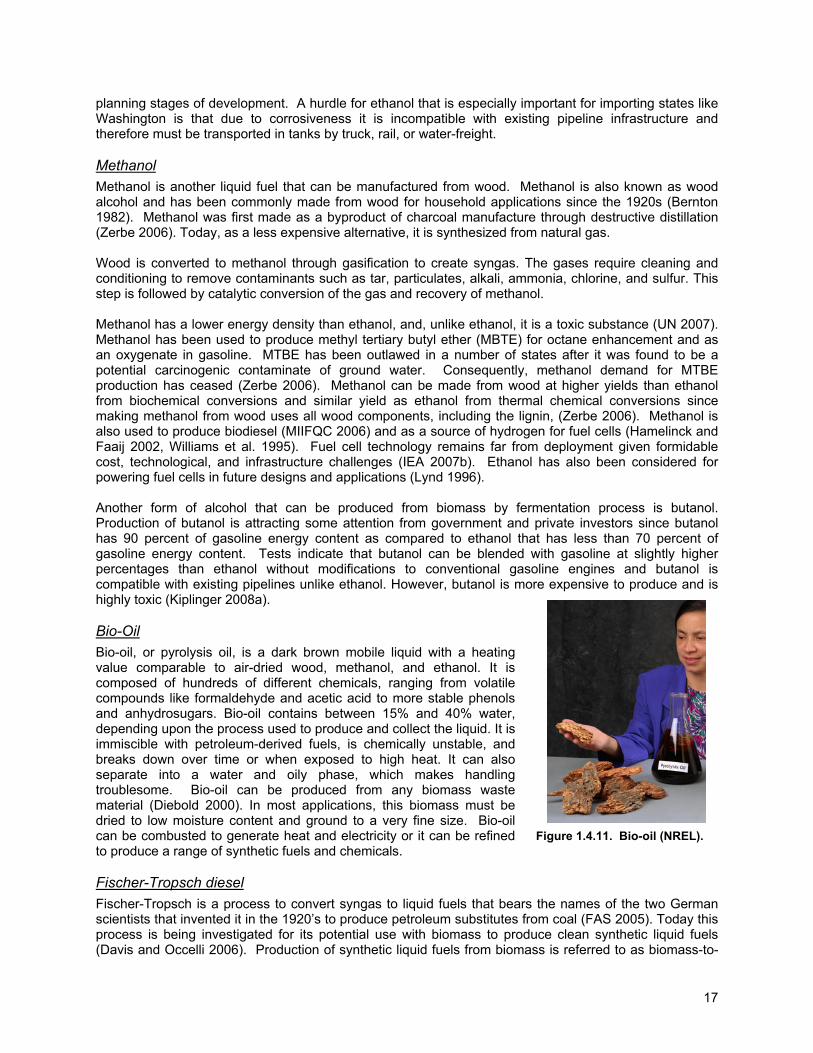
17
planning stages of development. A hurdle for ethanol that is especially important for importing states like Washington is that due to corrosiveness it is incompatible with existing pipeline infrastructure and therefore must be transported in tanks by truck, rail, or water-freight. Methanol Methanol is another liquid fuel that can be manufactured from wood. Methanol is also known as wood alcohol and has been commonly made from wood for household applications since the 1920s (Bernton 1982). Methanol was first made as a byproduct of charcoal manufacture through destructive distillation (Zerbe 2006). Today, as a less expensive alternative, it is synthesized from natural gas. Wood is converted to methanol through gasification to create syngas. The gases require cleaning and conditioning to remove contaminants such as tar, particulates, alkali, ammonia, chlorine, and sulfur. This step is followed by catalytic conversion of the gas and recovery of methanol. Methanol has a lower energy density than ethanol, and, unlike ethanol, it is a toxic substance (UN 2007). Methanol has been used to produce methyl tertiary butyl ether (MBTE) for octane enhancement and as an oxygenate in gasoline. MTBE has been outlawed in a number of states after it was found to be a potential carcinogenic contaminate of ground water. Consequently, methanol demand for MTBE production has ceased (Zerbe 2006). Methanol can be made from wood at higher yields than ethanol from biochemical conversions and similar yield as ethanol from thermal chemical conversions since making methanol from wood uses all wood components, including the lignin, (Zerbe 2006). Methanol is also used to produce biodiesel (MIIFQC 2006) and as a source of hydrogen for fuel cells (Hamelinck and Faaij 2002, Williams et al. 1995). Fuel cell technology remains far from deployment given formidable cost, technological, and infrastructure challenges (IEA 2007b). Ethanol has also been considered for powering fuel cells in future designs and applications (Lynd 1996). Another form of alcohol that can be produced from biomass by fermentation process is butanol. Production of butanol is attracting some attention from government and private investors since butanol has 90 percent of gasoline energy content as compared to ethanol that has less than 70 percent of gasoline energy content. Tests indicate that butanol can be blended with gasoline at slightly higher percentages than ethanol without modifications to conventional gasoline engines and butanol is compatible with existing pipelines unlike ethanol. However, butanol is more expensive to produce and is highly toxic (Kiplinger 2008a). Bio-Oil Bio-oil, or pyrolysis oil, is a dark brown mobile liquid with a heating value comparable to air-dried wood, methanol, and ethanol. It is composed of hundreds of different chemicals, ranging from volatile compounds like formaldehyde and acetic acid to more stable phenols and anhydrosugars. Bio-oil contains between 15% and 40% water, depending upon the process used to produce and collect the liquid. It is immiscible with petroleum-derived fuels, is chemically unstable, and breaks down over time or when exposed to high heat. It can also separate into a water and oily phase, which makes handling troublesome. Bio-oil can be produced from any biomass waste material (Diebold 2000). In most applications, this biomass must be dried to low moisture content and ground to a very fine size. Bio-oil can be combusted to generate heat and electricity or it can be refined to produce a range of synthetic fuels and chemicals. Fischer-Tropsch diesel Fischer-Tropsch is a process to convert syngas to liquid fuels that bears the names of the two German scientists that invented it in the 1920’s to produce petroleum substitutes from coal (FAS 2005). Today this process is being investigated for its potential use with biomass to produce clean synthetic liquid fuels (Davis and Occelli 2006). Production of synthetic liquid fuels from biomass is referred to as biomass-to-
Figure 1.4.11. Bio-oil (NREL).
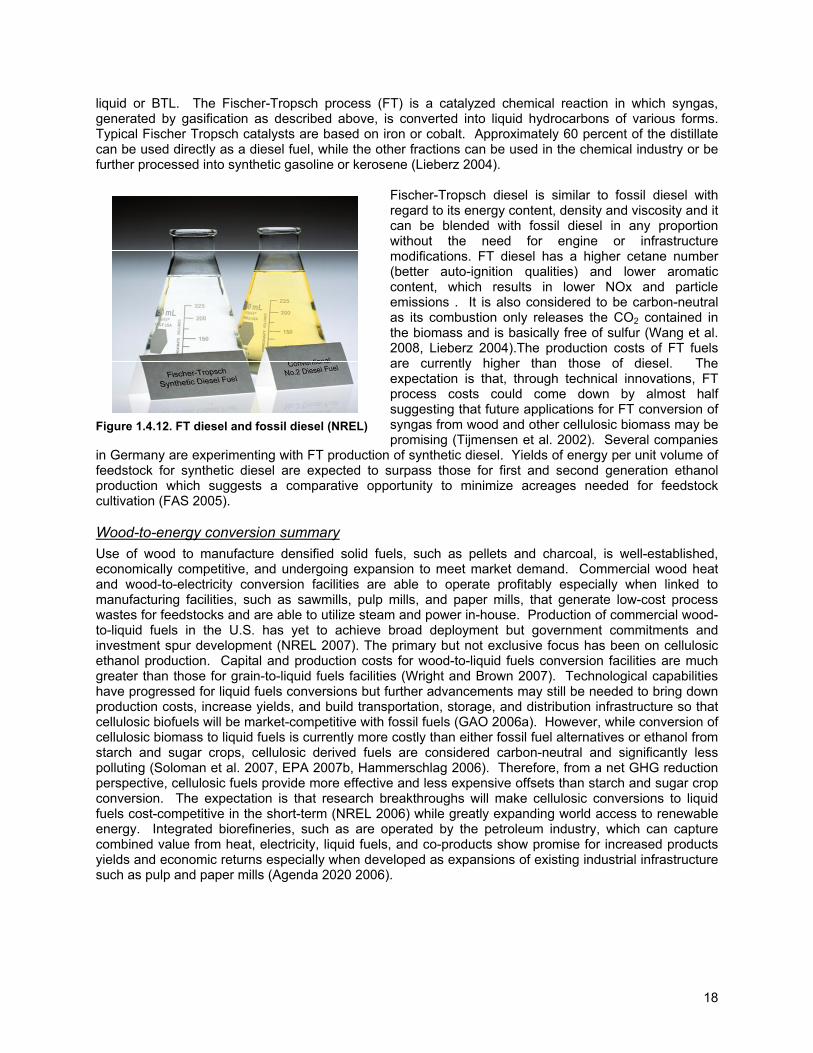
18
liquid or BTL. The Fischer-Tropsch process (FT) is a catalyzed chemical reaction in which syngas, generated by gasification as described above, is converted into liquid hydrocarbons of various forms. Typical Fischer Tropsch catalysts are based on iron or cobalt. Approximately 60 percent of the distillate can be used directly as a diesel fuel, while the other fractions can be used in the chemical industry or be further processed into synthetic gasoline or kerosene (Lieberz 2004).
Fischer-Tropsch diesel is similar to fossil diesel with regard to its energy content, density and viscosity and it can be blended with fossil diesel in any proportion without the need for engine or infrastructure modifications. FT diesel has a higher cetane number (better auto-ignition qualities) and lower aromatic content, which results in lower NOx and particle emissions . It is also considered to be carbon-neutral as its combustion only releases the CO2 contained in the biomass and is basically free of sulfur (Wang et al. 2008, Lieberz 2004).The production costs of FT fuels are currently higher than those of diesel. The expectation is that, through technical innovations, FT process costs could come down by almost half suggesting that future applications for FT conversion of syngas from wood and other cellulosic biomass may be promising (Tijmensen et al. 2002). Several companies
in Germany are experimenting with FT production of synthetic diesel. Yields of energy per unit volume of feedstock for synthetic diesel are expected to surpass those for first and second generation ethanol production which suggests a comparative opportunity to minimize acreages needed for feedstock cultivation (FAS 2005). Wood-to-energy conversion summary Use of wood to manufacture densified solid fuels, such as pellets and charcoal, is well-established, economically competitive, and undergoing expansion to meet market demand. Commercial wood heat and wood-to-electricity conversion facilities are able to operate profitably especially when linked to manufacturing facilities, such as sawmills, pulp mills, and paper mills, that generate low-cost process wastes for feedstocks and are able to utilize steam and power in-house. Production of commercial wood-to-liquid fuels in the U.S. has yet to achieve broad deployment but government commitments and investment spur development (NREL 2007). The primary but not exclusive focus has been on cellulosic ethanol production. Capital and production costs for wood-to-liquid fuels conversion facilities are much greater than those for grain-to-liquid fuels facilities (Wright and Brown 2007). Technological capabilities have progressed for liquid fuels conversions but further advancements may still be needed to bring down production costs, increase yields, and build transportation, storage, and distribution infrastructure so that cellulosic biofuels will be market-competitive with fossil fuels (GAO 2006a). However, while conversion of cellulosic biomass to liquid fuels is currently more costly than either fossil fuel alternatives or ethanol from starch and sugar crops, cellulosic derived fuels are considered carbon-neutral and significantly less polluting (Soloman et al. 2007, EPA 2007b, Hammerschlag 2006). Therefore, from a net GHG reduction perspective, cellulosic fuels provide more effective and less expensive offsets than starch and sugar crop conversion. The expectation is that research breakthroughs will make cellulosic conversions to liquid fuels cost-competitive in the short-term (NREL 2006) while greatly expanding world access to renewable energy. Integrated biorefineries, such as are operated by the petroleum industry, which can capture combined value from heat, electricity, liquid fuels, and co-products show promise for increased products yields and economic returns especially when developed as expansions of existing industrial infrastructure such as pulp and paper mills (Agenda 2020 2006).
Figure 1.4.12. FT diesel and fossil diesel (NREL)
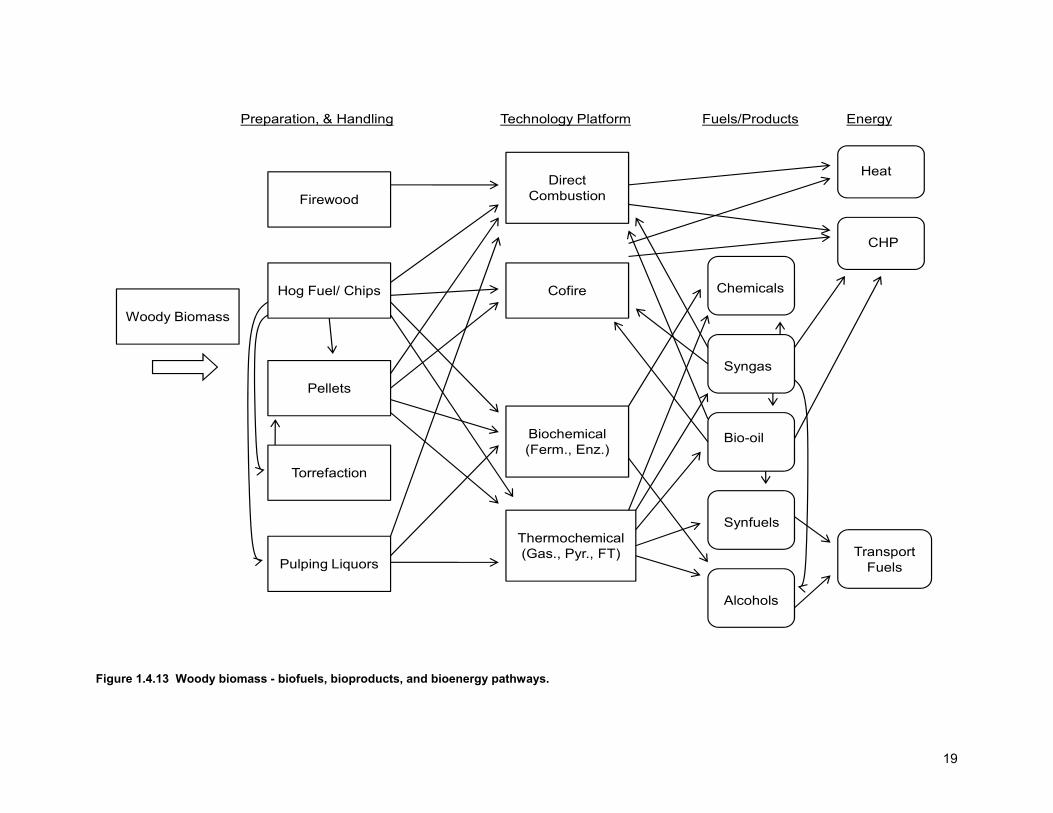
19
Figure 1.4.13 Woody biomass - biofuels, bioproducts, and bioenergy pathways.
Woody Biomass
Preparation, & Handling Technology Platform
Firewood
Hog Fuel/ Chips
Pellets
Torrefaction
Thermochemical(Gas., Pyr., FT)
Biochemical(Ferm., Enz.)
Cofire
Direct Combustion
Fuels/Products
Synthetic Bio-oil
Synfuels
Syngas
Heat
CHP
Synthetic Alcohols
Transport Fuels
Energy
Chemicals
Pulping Liquors
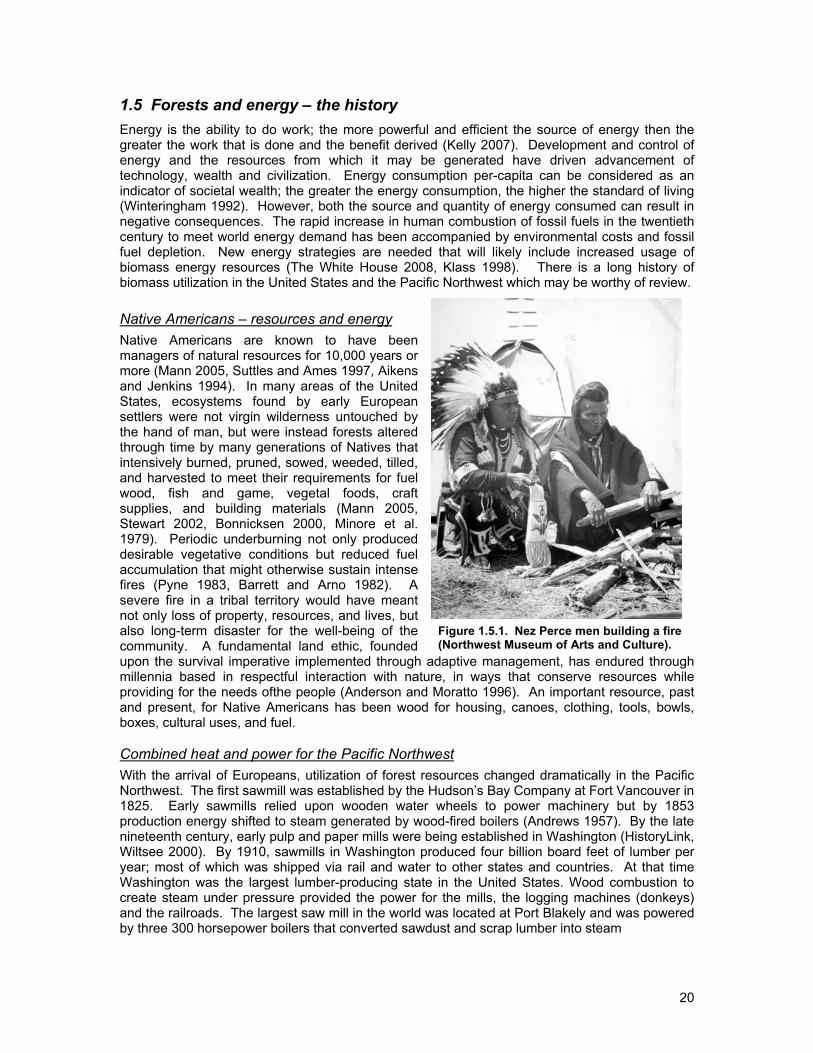
20
1.5 Forests and energy – the history Energy is the ability to do work; the more powerful and efficient the source of energy then the greater the work that is done and the benefit derived (Kelly 2007). Development and control of energy and the resources from which it may be generated have driven advancement of technology, wealth and civilization. Energy consumption per-capita can be considered as an indicator of societal wealth; the greater the energy consumption, the higher the standard of living (Winteringham 1992). However, both the source and quantity of energy consumed can result in negative consequences. The rapid increase in human combustion of fossil fuels in the twentieth century to meet world energy demand has been accompanied by environmental costs and fossil fuel depletion. New energy strategies are needed that will likely include increased usage of biomass energy resources (The White House 2008, Klass 1998). There is a long history of biomass utilization in the United States and the Pacific Northwest which may be worthy of review. Native Americans – resources and energy Native Americans are known to have been managers of natural resources for 10,000 years or more (Mann 2005, Suttles and Ames 1997, Aikens and Jenkins 1994). In many areas of the United States, ecosystems found by early European settlers were not virgin wilderness untouched by the hand of man, but were instead forests altered through time by many generations of Natives that intensively burned, pruned, sowed, weeded, tilled, and harvested to meet their requirements for fuel wood, fish and game, vegetal foods, craft supplies, and building materials (Mann 2005, Stewart 2002, Bonnicksen 2000, Minore et al. 1979). Periodic underburning not only produced desirable vegetative conditions but reduced fuel accumulation that might otherwise sustain intense fires (Pyne 1983, Barrett and Arno 1982). A severe fire in a tribal territory would have meant not only loss of property, resources, and lives, but also long-term disaster for the well-being of the community. A fundamental land ethic, founded upon the survival imperative implemented through adaptive management, has endured through millennia based in respectful interaction with nature, in ways that conserve resources while providing for the needs ofthe people (Anderson and Moratto 1996). An important resource, past and present, for Native Americans has been wood for housing, canoes, clothing, tools, bowls, boxes, cultural uses, and fuel. Combined heat and power for the Pacific Northwest With the arrival of Europeans, utilization of forest resources changed dramatically in the Pacific Northwest. The first sawmill was established by the Hudson’s Bay Company at Fort Vancouver in 1825. Early sawmills relied upon wooden water wheels to power machinery but by 1853 production energy shifted to steam generated by wood-fired boilers (Andrews 1957). By the late nineteenth century, early pulp and paper mills were being established in Washington (HistoryLink, Wiltsee 2000). By 1910, sawmills in Washington produced four billion board feet of lumber per year; most of which was shipped via rail and water to other states and countries. At that time Washington was the largest lumber-producing state in the United States. Wood combustion to create steam under pressure provided the power for the mills, the logging machines (donkeys) and the railroads. The largest saw mill in the world was located at Port Blakely and was powered by three 300 horsepower boilers that converted sawdust and scrap lumber into steam
Figure 1.5.1. Nez Perce men building a fire (Northwest Museum of Arts and Culture).
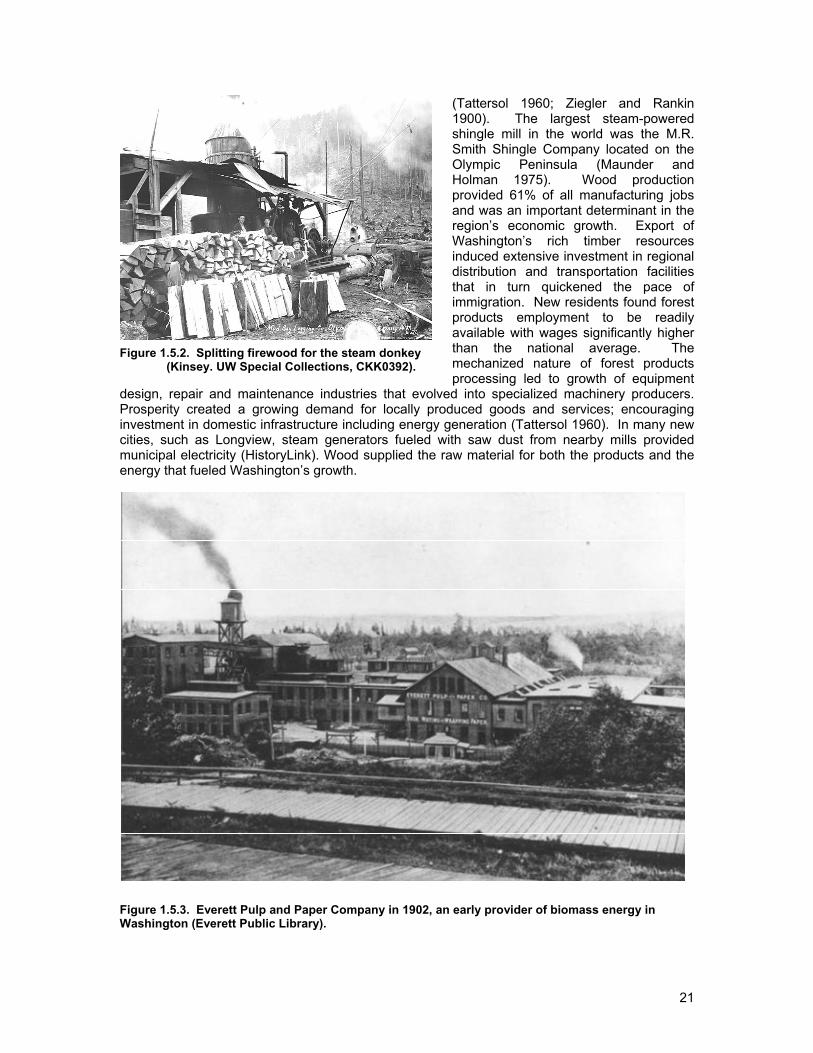
21
(Tattersol 1960; Ziegler and Rankin 1900). The largest steam-powered shingle mill in the world was the M.R. Smith Shingle Company located on the Olympic Peninsula (Maunder and Holman 1975). Wood production provided 61% of all manufacturing jobs and was an important determinant in the region’s economic growth. Export of Washington’s rich timber resources induced extensive investment in regional distribution and transportation facilities that in turn quickened the pace of immigration. New residents found forest products employment to be readily available with wages significantly higher than the national average. The mechanized nature of forest products processing led to growth of equipment
design, repair and maintenance industries that evolved into specialized machinery producers. Prosperity created a growing demand for locally produced goods and services; encouraging investment in domestic infrastructure including energy generation (Tattersol 1960). In many new cities, such as Longview, steam generators fueled with saw dust from nearby mills provided municipal electricity (HistoryLink). Wood supplied the raw material for both the products and the energy that fueled Washington’s growth.
Figure 1.5.3. Everett Pulp and Paper Company in 1902, an early provider of biomass energy in Washington (Everett Public Library).
Figure 1.5.2. Splitting firewood for the steam donkey (Kinsey. UW Special Collections, CKK0392).
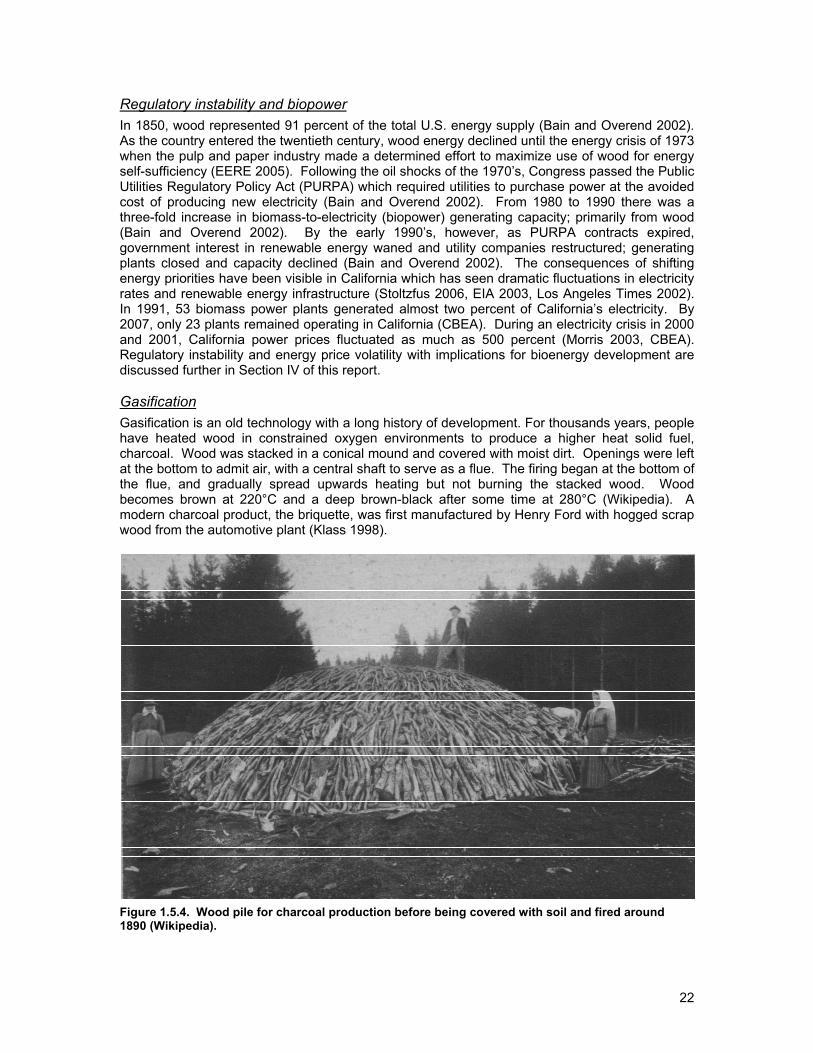
22
Regulatory instability and biopower In 1850, wood represented 91 percent of the total U.S. energy supply (Bain and Overend 2002). As the country entered the twentieth century, wood energy declined until the energy crisis of 1973 when the pulp and paper industry made a determined effort to maximize use of wood for energy self-sufficiency (EERE 2005). Following the oil shocks of the 1970’s, Congress passed the Public Utilities Regulatory Policy Act (PURPA) which required utilities to purchase power at the avoided cost of producing new electricity (Bain and Overend 2002). From 1980 to 1990 there was a three-fold increase in biomass-to-electricity (biopower) generating capacity; primarily from wood (Bain and Overend 2002). By the early 1990’s, however, as PURPA contracts expired, government interest in renewable energy waned and utility companies restructured; generating plants closed and capacity declined (Bain and Overend 2002). The consequences of shifting energy priorities have been visible in California which has seen dramatic fluctuations in electricity rates and renewable energy infrastructure (Stoltzfus 2006, EIA 2003, Los Angeles Times 2002). In 1991, 53 biomass power plants generated almost two percent of California’s electricity. By 2007, only 23 plants remained operating in California (CBEA). During an electricity crisis in 2000 and 2001, California power prices fluctuated as much as 500 percent (Morris 2003, CBEA). Regulatory instability and energy price volatility with implications for bioenergy development are discussed further in Section IV of this report. Gasification Gasification is an old technology with a long history of development. For thousands years, people have heated wood in constrained oxygen environments to produce a higher heat solid fuel, charcoal. Wood was stacked in a conical mound and covered with moist dirt. Openings were left at the bottom to admit air, with a central shaft to serve as a flue. The firing began at the bottom of the flue, and gradually spread upwards heating but not burning the stacked wood. Wood becomes brown at 220°C and a deep brown-black after some time at 280°C (Wikipedia). A modern charcoal product, the briquette, was first manufactured by Henry Ford with hogged scrap wood from the automotive plant (Klass 1998).
Figure 1.5.4. Wood pile for charcoal production before being covered with soil and fired around 1890 (Wikipedia).
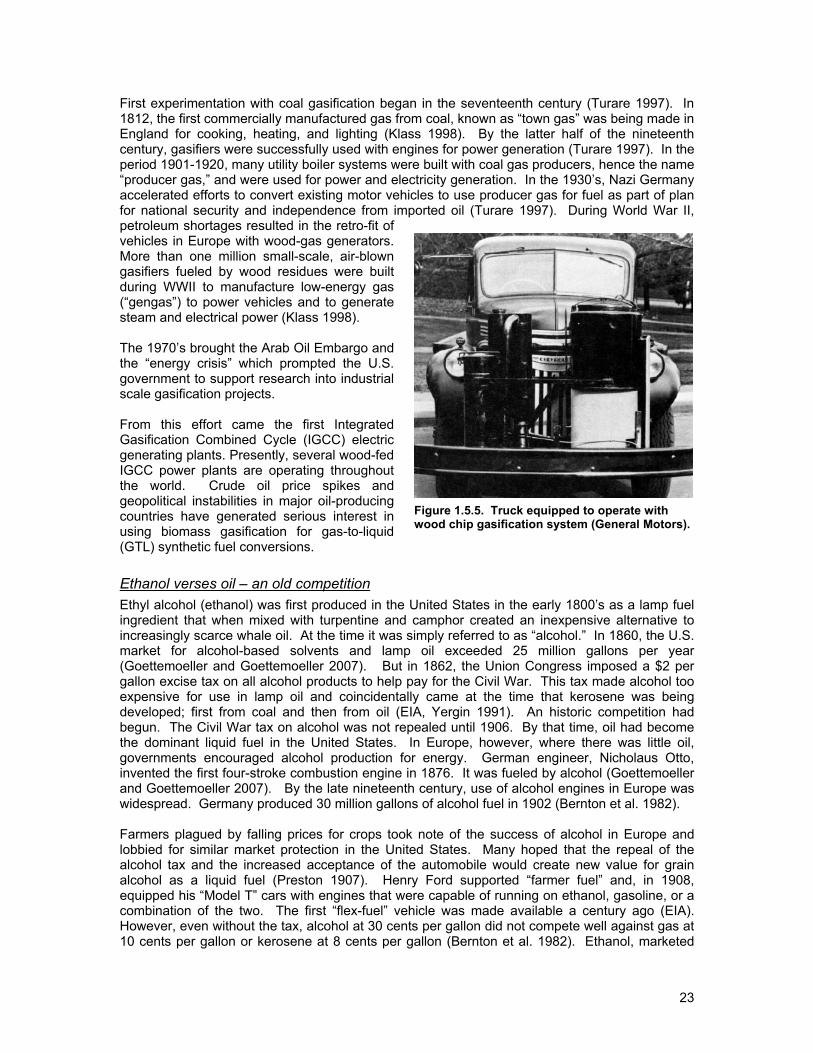
23
First experimentation with coal gasification began in the seventeenth century (Turare 1997). In 1812, the first commercially manufactured gas from coal, known as “town gas” was being made in England for cooking, heating, and lighting (Klass 1998). By the latter half of the nineteenth century, gasifiers were successfully used with engines for power generation (Turare 1997). In the period 1901-1920, many utility boiler systems were built with coal gas producers, hence the name “producer gas,” and were used for power and electricity generation. In the 1930’s, Nazi Germany accelerated efforts to convert existing motor vehicles to use producer gas for fuel as part of plan for national security and independence from imported oil (Turare 1997). During World War II, petroleum shortages resulted in the retro-fit of vehicles in Europe with wood-gas generators. More than one million small-scale, air-blown gasifiers fueled by wood residues were built during WWII to manufacture low-energy gas (“gengas”) to power vehicles and to generate steam and electrical power (Klass 1998). The 1970’s brought the Arab Oil Embargo and the “energy crisis” which prompted the U.S. government to support research into industrial scale gasification projects. From this effort came the first Integrated Gasification Combined Cycle (IGCC) electric generating plants. Presently, several wood-fed IGCC power plants are operating throughout the world. Crude oil price spikes and geopolitical instabilities in major oil-producing countries have generated serious interest in using biomass gasification for gas-to-liquid (GTL) synthetic fuel conversions. Ethanol verses oil – an old competition Ethyl alcohol (ethanol) was first produced in the United States in the early 1800’s as a lamp fuel ingredient that when mixed with turpentine and camphor created an inexpensive alternative to increasingly scarce whale oil. At the time it was simply referred to as “alcohol.” In 1860, the U.S. market for alcohol-based solvents and lamp oil exceeded 25 million gallons per year (Goettemoeller and Goettemoeller 2007). But in 1862, the Union Congress imposed a $2 per gallon excise tax on all alcohol products to help pay for the Civil War. This tax made alcohol too expensive for use in lamp oil and coincidentally came at the time that kerosene was being developed; first from coal and then from oil (EIA, Yergin 1991). An historic competition had begun. The Civil War tax on alcohol was not repealed until 1906. By that time, oil had become the dominant liquid fuel in the United States. In Europe, however, where there was little oil, governments encouraged alcohol production for energy. German engineer, Nicholaus Otto, invented the first four-stroke combustion engine in 1876. It was fueled by alcohol (Goettemoeller and Goettemoeller 2007). By the late nineteenth century, use of alcohol engines in Europe was widespread. Germany produced 30 million gallons of alcohol fuel in 1902 (Bernton et al. 1982). Farmers plagued by falling prices for crops took note of the success of alcohol in Europe and lobbied for similar market protection in the United States. Many hoped that the repeal of the alcohol tax and the increased acceptance of the automobile would create new value for grain alcohol as a liquid fuel (Preston 1907). Henry Ford supported “farmer fuel” and, in 1908, equipped his “Model T” cars with engines that were capable of running on ethanol, gasoline, or a combination of the two. The first “flex-fuel” vehicle was made available a century ago (EIA). However, even without the tax, alcohol at 30 cents per gallon did not compete well against gas at 10 cents per gallon or kerosene at 8 cents per gallon (Bernton et al. 1982). Ethanol, marketed
Figure 1.5.5. Truck equipped to operate with wood chip gasification system (General Motors).
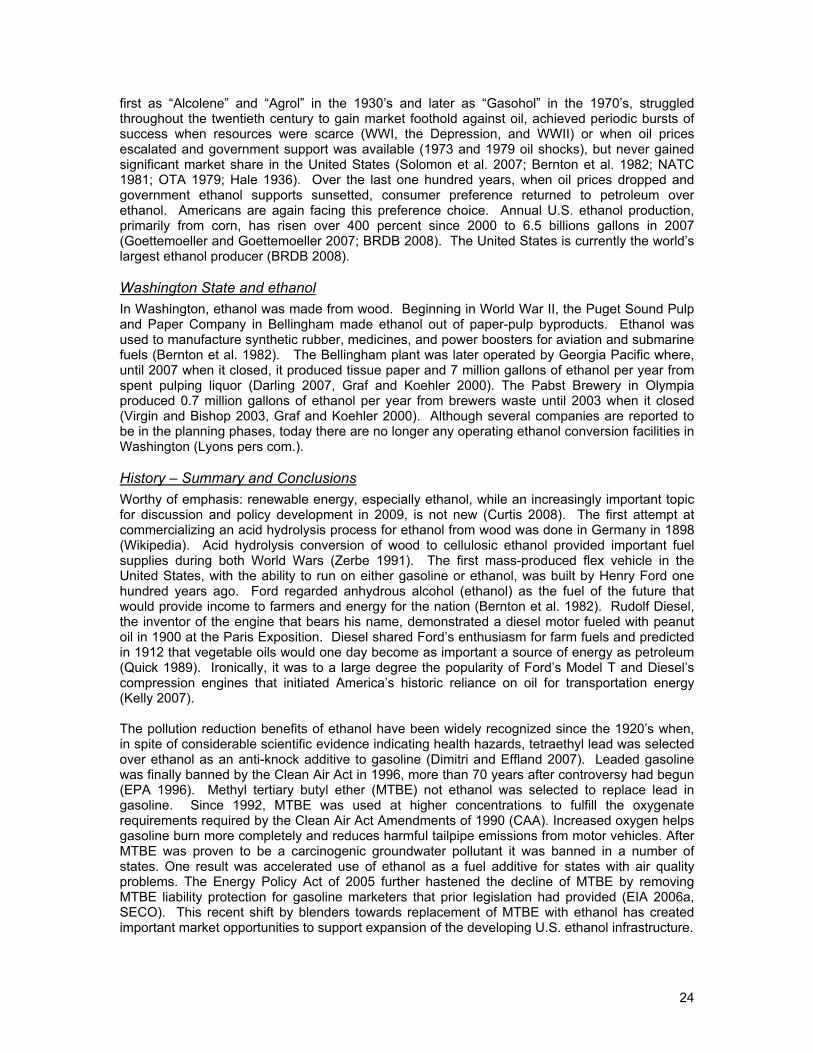
24
first as “Alcolene” and “Agrol” in the 1930’s and later as “Gasohol” in the 1970’s, struggled throughout the twentieth century to gain market foothold against oil, achieved periodic bursts of success when resources were scarce (WWI, the Depression, and WWII) or when oil prices escalated and government support was available (1973 and 1979 oil shocks), but never gained significant market share in the United States (Solomon et al. 2007; Bernton et al. 1982; NATC 1981; OTA 1979; Hale 1936). Over the last one hundred years, when oil prices dropped and government ethanol supports sunsetted, consumer preference returned to petroleum over ethanol. Americans are again facing this preference choice. Annual U.S. ethanol production, primarily from corn, has risen over 400 percent since 2000 to 6.5 billions gallons in 2007 (Goettemoeller and Goettemoeller 2007; BRDB 2008). The United States is currently the world’s largest ethanol producer (BRDB 2008). Washington State and ethanol In Washington, ethanol was made from wood. Beginning in World War II, the Puget Sound Pulp and Paper Company in Bellingham made ethanol out of paper-pulp byproducts. Ethanol was used to manufacture synthetic rubber, medicines, and power boosters for aviation and submarine fuels (Bernton et al. 1982). The Bellingham plant was later operated by Georgia Pacific where, until 2007 when it closed, it produced tissue paper and 7 million gallons of ethanol per year from spent pulping liquor (Darling 2007, Graf and Koehler 2000). The Pabst Brewery in Olympia produced 0.7 million gallons of ethanol per year from brewers waste until 2003 when it closed (Virgin and Bishop 2003, Graf and Koehler 2000). Although several companies are reported to be in the planning phases, today there are no longer any operating ethanol conversion facilities in Washington (Lyons pers com.). History – Summary and Conclusions Worthy of emphasis: renewable energy, especially ethanol, while an increasingly important topic for discussion and policy development in 2009, is not new (Curtis 2008). The first attempt at commercializing an acid hydrolysis process for ethanol from wood was done in Germany in 1898 (Wikipedia). Acid hydrolysis conversion of wood to cellulosic ethanol provided important fuel supplies during both World Wars (Zerbe 1991). The first mass-produced flex vehicle in the United States, with the ability to run on either gasoline or ethanol, was built by Henry Ford one hundred years ago. Ford regarded anhydrous alcohol (ethanol) as the fuel of the future that would provide income to farmers and energy for the nation (Bernton et al. 1982). Rudolf Diesel, the inventor of the engine that bears his name, demonstrated a diesel motor fueled with peanut oil in 1900 at the Paris Exposition. Diesel shared Ford’s enthusiasm for farm fuels and predicted in 1912 that vegetable oils would one day become as important a source of energy as petroleum (Quick 1989). Ironically, it was to a large degree the popularity of Ford’s Model T and Diesel’s compression engines that initiated America’s historic reliance on oil for transportation energy (Kelly 2007). The pollution reduction benefits of ethanol have been widely recognized since the 1920’s when, in spite of considerable scientific evidence indicating health hazards, tetraethyl lead was selected over ethanol as an anti-knock additive to gasoline (Dimitri and Effland 2007). Leaded gasoline was finally banned by the Clean Air Act in 1996, more than 70 years after controversy had begun (EPA 1996). Methyl tertiary butyl ether (MTBE) not ethanol was selected to replace lead in gasoline. Since 1992, MTBE was used at higher concentrations to fulfill the oxygenate requirements required by the Clean Air Act Amendments of 1990 (CAA). Increased oxygen helps gasoline burn more completely and reduces harmful tailpipe emissions from motor vehicles. After MTBE was proven to be a carcinogenic groundwater pollutant it was banned in a number of states. One result was accelerated use of ethanol as a fuel additive for states with air quality problems. The Energy Policy Act of 2005 further hastened the decline of MTBE by removing MTBE liability protection for gasoline marketers that prior legislation had provided (EIA 2006a, SECO). This recent shift by blenders towards replacement of MTBE with ethanol has created important market opportunities to support expansion of the developing U.S. ethanol infrastructure.
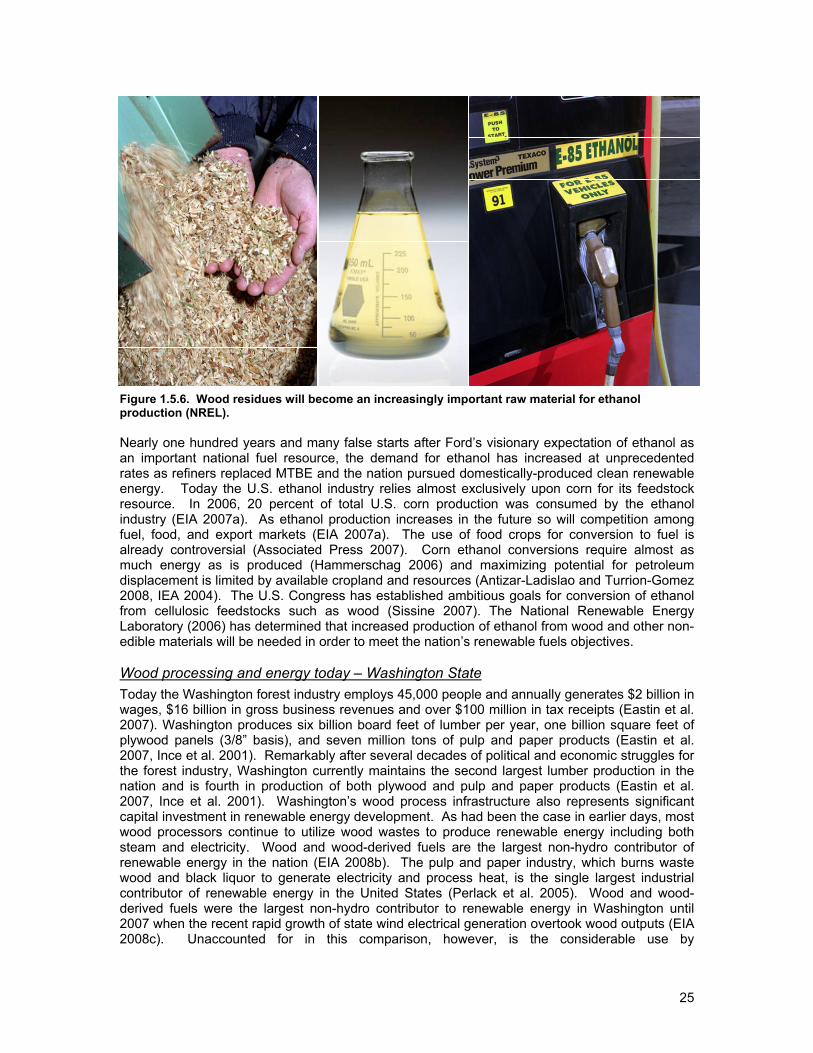
25
Figure 1.5.6. Wood residues will become an increasingly important raw material for ethanol production (NREL). Nearly one hundred years and many false starts after Ford’s visionary expectation of ethanol as an important national fuel resource, the demand for ethanol has increased at unprecedented rates as refiners replaced MTBE and the nation pursued domestically-produced clean renewable energy. Today the U.S. ethanol industry relies almost exclusively upon corn for its feedstock resource. In 2006, 20 percent of total U.S. corn production was consumed by the ethanol industry (EIA 2007a). As ethanol production increases in the future so will competition among fuel, food, and export markets (EIA 2007a). The use of food crops for conversion to fuel is already controversial (Associated Press 2007). Corn ethanol conversions require almost as much energy as is produced (Hammerschag 2006) and maximizing potential for petroleum displacement is limited by available cropland and resources (Antizar-Ladislao and Turrion-Gomez 2008, IEA 2004). The U.S. Congress has established ambitious goals for conversion of ethanol from cellulosic feedstocks such as wood (Sissine 2007). The National Renewable Energy Laboratory (2006) has determined that increased production of ethanol from wood and other non-edible materials will be needed in order to meet the nation’s renewable fuels objectives. Wood processing and energy today – Washington State Today the Washington forest industry employs 45,000 people and annually generates $2 billion in wages, $16 billion in gross business revenues and over $100 million in tax receipts (Eastin et al. 2007). Washington produces six billion board feet of lumber per year, one billion square feet of plywood panels (3/8” basis), and seven million tons of pulp and paper products (Eastin et al. 2007, Ince et al. 2001). Remarkably after several decades of political and economic struggles for the forest industry, Washington currently maintains the second largest lumber production in the nation and is fourth in production of both plywood and pulp and paper products (Eastin et al. 2007, Ince et al. 2001). Washington’s wood process infrastructure also represents significant capital investment in renewable energy development. As had been the case in earlier days, most wood processors continue to utilize wood wastes to produce renewable energy including both steam and electricity. Wood and wood-derived fuels are the largest non-hydro contributor of renewable energy in the nation (EIA 2008b). The pulp and paper industry, which burns waste wood and black liquor to generate electricity and process heat, is the single largest industrial contributor of renewable energy in the United States (Perlack et al. 2005). Wood and wood-derived fuels were the largest non-hydro contributor to renewable energy in Washington until 2007 when the recent rapid growth of state wind electrical generation overtook wood outputs (EIA 2008c). Unaccounted for in this comparison, however, is the considerable use by

26
Washingtonians of fire wood and wood pellets for heating fuels. Total estimated volumes of wood consumption in Washington are not known. Washington Indian Tribes, that own forest resources, have been recognized for their ability to manage forests sustainably for integrated economic, cultural and environmental values (USDA 2008, Blatner et al. 2005, Forest Health Strategy Work Group 2004). Native Americans have evolved traditional utilization of forests to include job and revenue generation and have become increasingly important regional contributors to Washington forest industry infrastructure. For example, Tribal enterprises now dominate wood processing activity in central Washington. Yakama Forest Products operates two sawmills in White Swan and the Confederated Tribes of the Colville Reservation operate a sawmill and a plywood plant in Omak. Both Indian Nations are currently pursuing opportunities to expand tribal enterprise operations to include utilization of wood residues for production of renewable energy (Rigdon pers com., Clark pers com).

27
Section II: The Imperatives There is growing interest in the utilization of biomass as an alternative energy resource to fossil fuels which has potential to reduce emissions of greenhouse gases that have been linked to global warming trends (Stupak et al. 2007). In the United States, an additional incentive for shifts away from fossil fuel reliance is to improve national security and reduce the impacts to the economy that result from energy imports (BRDB 2008). Forests can provide a considerable source of biomass resources but care must be taken to ensure that utilization is sustainable (WGA 2008a,b,&c). This section will examine climate change and energy independence as compelling imperatives for aggressive development of bioenergy resources when considered in the context of a third imperative: sustainability. Climate change, energy independence, and sustainability are discussed throughout this report as performance metrics from which to gauge the merits of alternative courses for action. 2.1 Greenhouse Gases and Climate Change There is accumulating evidence that global climate is changing in response to increases in atmospheric concentrations of carbon dioxide (CO2) and other pollutants, collectively described as green house gases (GHGs), that are released as a result of fossil fuel combustion to produce energy (IPCC 2007a & 2007c). Deforestation and agriculture have also been identified as sources of GHG releases (IPCC 2007b). Observed consequences include elevated temperatures, altered precipitation cycles, declining snowpacks, rising sea levels, threats to native species, risks to public health, extreme weather events, and increased incidence and severity of forest fires (IPCC 2007b; FAO 2001). A growing scientific consensus Since 1958, from a unique laboratory located 11,500 feet above sea level and 2000 miles from the nearest continent, the National Oceanographic and Atmospheric Administration (NOAA) has measured the concentration of trace gases in the atmosphere, including CO2 (Keeling 1976). The data collected by this laboratory, on the lava-covered upper slopes of Mauna Loa in Hawaii, represents the longest established record of direct measurements of CO2 in the atmosphere. Air is slowly pumped through a small cylindrical cell and infrared light is transmitted through the air and measured by a detector that is sensitive to infrared radiation. The infrared light absorbed by CO2 present in the air is calculated, converted to a molecular count, and compared to the total number of molecules of air less water vapor. The result is an estimate of the ratio of CO2 molecules to dry air molecules expressed as parts per million (ppm) of CO2 in dry air. Accuracy is considered to be within 0.2 ppm (Tans). Over the years, two trends become apparent from an examination of Mauna Loa CO2 measurements (Figure 2.1.1). The oscillations (red) are a result of the seasonal differences in the photosynthesis of plants in the Northern Hemisphere. In the summer, atmospheric CO2 declines as vegetative photosynthesis (dominated by forests) increases. In winter, atmospheric CO2 increases as flora become dormant (Woodwell and Pecan 1972). The trend line (black), however, shows a continuous increase in resident atmospheric CO2. This phenomenon has become a source of growing contemporary global concern (Kirby 2008, Gore 2006). Figure 2.1.1. Atmospheric CO2 in ppm (Tans).
28
The possibility that combustion of fossil fuels by modern civilization might be changing climate was first suggested by Callendar in 1938. He found that atmospheric concentrations of CO2 had risen during the twentieth century and he identified anthropogenic burning of coal, oil, and natural gas as the source of increase. Callendar (1938, 1949) hypothesized that global warming could result. For decades, Callendar’s theories were discounted by many scientists but, by the early 1970’s, data from Mauna Loa was starting to show a trend and a growing number of scientists agreed that Callendar might be correct (Botkin 1990, Woodwell and Pecan 1972). It is referred to as the “greenhouse effect.” Put very simply, the greenhouse effect is a naturally occurring process that heats Earth's surface and atmosphere. Energy received from the sun and emitted to space by the Earth’s surface is affected by the chemical composition of the atmosphere. Certain atmospheric gases, such as CO2, water vapor, and methane (CH4), influence the energy balance of the planet by absorbing long-wave radiation emitted from the Earth's surface. Without the greenhouse effect the average temperature of the Earth would be much colder (about negative 18° Celsius), rather than the current average of positive 15° Celsius. As energy (radiation) from the sun passes through the atmosphere a portion (about 30 percent globally) is reflected or scattered back to space by clouds (water vapor) and other atmospheric particles. About 19 percent of the energy available is absorbed by clouds, gases, and particles in the atmosphere leaving about 51 percent to reach the surface. This energy heats the ground surface, evaporates water, and contributes to plant photosynthesis. The Earth’s surface reradiates energy at infrared wave lengths; a portion of which is trapped by green house gases. Increasing levels of GHGs, primarily CO2 but including other trace gases such as CH4, magnify the greenhouse effect, trap heat, and cause the planet to warm (Pidwirny 2006, Kiehl and Trenberth 1997). Analysis of the composition of air enclosed in bubbles in ice cores from Greenland and Antarctica has provided scientists with estimates of historic (pre-industrial) atmospheric CO2 and other GHGs. For the ten thousand years leading up to 1750 there is very high confidence that atmospheric CO2 stayed relatively constant at 280 ppm within a range of ± 20 ppm (Indermühle et al. 1999). Today the consensus estimate is that atmospheric CO2 content has risen to around 380 ppm (Le Quéré et al. 2008). The amount of CO2 in the atmosphere has increased by about 36%. While climate science is an evolving and complex field of study that includes many uncertainties, there is significant scientific agreement that increased CO2 can be associated with human activities, primarily the combustion of fossil fuels, and that global warming has been the result (Le Treut et al. 2007, Bjørke and Seki 2005). Increases in atmospheric content of other GHGs such as CH4, nitrous oxide (N2O), nitrogen oxides (NOx), carbon monoxide (CO), non-methane hydrocarbons (NMHC, also known as volatile organic compounds, VOC), and a variety of fluorine-containing halogenated substances (CFC, HCFC, and others) are also credited to anthropogenic sources (Le Treut et al. 2007). IPCC The Intergovernmental Panel on Climate Change (IPCC) is a globally-convened body of hundreds of scientists that are generally recognized as the pre-eminent international authority on climate change (EPA 2008, CCSP 2008a, Bast and Taylor 2007). The IPCC was established in 1988 by the World Meteorological Organization (WMO) and the United Nations Environment Programme (UNEP). Since its inception, IPCC has presented four assessment reports (comprehensive scientific reviews of the evolving literature) on global climate change beginning in 1990 with the latest report released in 2007. IPCC scientists were recognized for their work when they shared the 2007 Nobel Peace Prize with former Vice President, Albert Gore Jr. A main activity of the IPCC is publishing special scientific reports on topics relevant to the implementation of the United Nations Framework Convention on Climate Change (UNFCCC), an international treaty that acknowledges the possibility of harmful climate change. The findings of the first IPCC Assessment Report of 1990 played a decisive role in leading to the UNFCCC, which was opened for signature by countries of the world in Rio de Janeiro at the “Earth Summit” in 1992 and entered into force in 1994. UNFCCC provides the overall international governmental policy
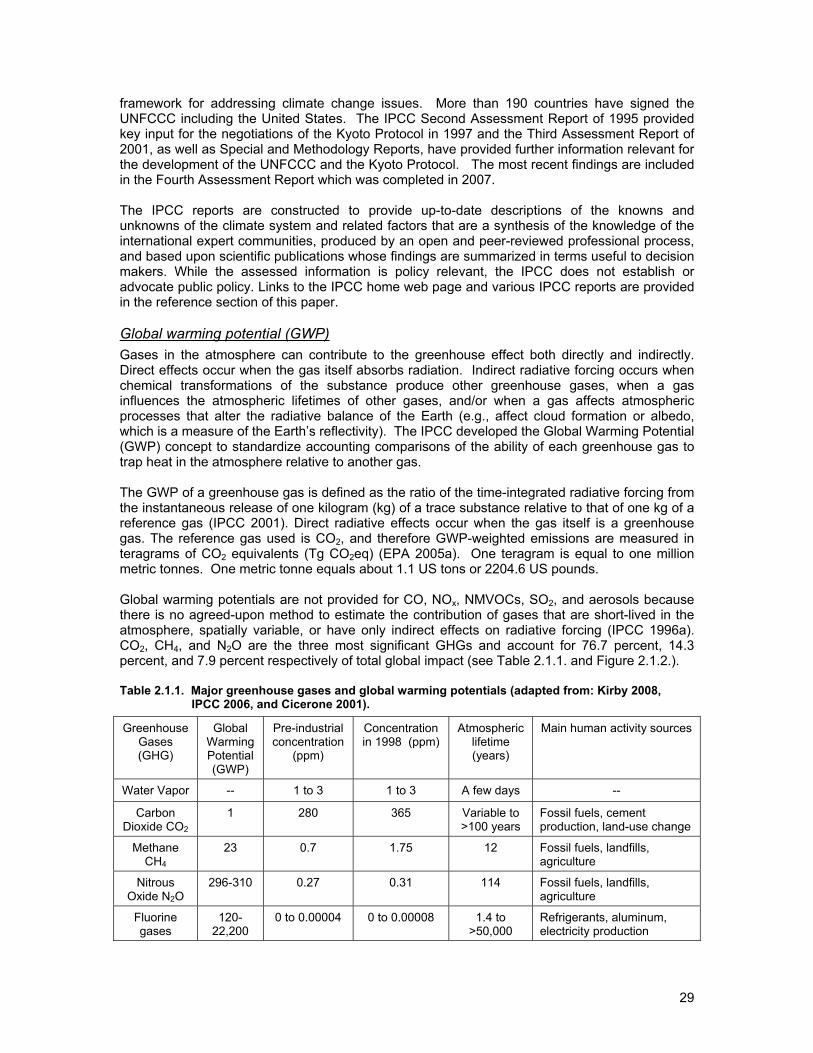
29
framework for addressing climate change issues. More than 190 countries have signed the UNFCCC including the United States. The IPCC Second Assessment Report of 1995 provided key input for the negotiations of the Kyoto Protocol in 1997 and the Third Assessment Report of 2001, as well as Special and Methodology Reports, have provided further information relevant for the development of the UNFCCC and the Kyoto Protocol. The most recent findings are included in the Fourth Assessment Report which was completed in 2007. The IPCC reports are constructed to provide up-to-date descriptions of the knowns and unknowns of the climate system and related factors that are a synthesis of the knowledge of the international expert communities, produced by an open and peer-reviewed professional process, and based upon scientific publications whose findings are summarized in terms useful to decision makers. While the assessed information is policy relevant, the IPCC does not establish or advocate public policy. Links to the IPCC home web page and various IPCC reports are provided in the reference section of this paper. Global warming potential (GWP) Gases in the atmosphere can contribute to the greenhouse effect both directly and indirectly. Direct effects occur when the gas itself absorbs radiation. Indirect radiative forcing occurs when chemical transformations of the substance produce other greenhouse gases, when a gas influences the atmospheric lifetimes of other gases, and/or when a gas affects atmospheric processes that alter the radiative balance of the Earth (e.g., affect cloud formation or albedo, which is a measure of the Earth’s reflectivity). The IPCC developed the Global Warming Potential (GWP) concept to standardize accounting comparisons of the ability of each greenhouse gas to trap heat in the atmosphere relative to another gas. The GWP of a greenhouse gas is defined as the ratio of the time-integrated radiative forcing from the instantaneous release of one kilogram (kg) of a trace substance relative to that of one kg of a reference gas (IPCC 2001). Direct radiative effects occur when the gas itself is a greenhouse gas. The reference gas used is CO2, and therefore GWP-weighted emissions are measured in teragrams of CO2 equivalents (Tg CO2eq) (EPA 2005a). One teragram is equal to one million metric tonnes. One metric tonne equals about 1.1 US tons or 2204.6 US pounds. Global warming potentials are not provided for CO, NOx, NMVOCs, SO2, and aerosols because there is no agreed-upon method to estimate the contribution of gases that are short-lived in the atmosphere, spatially variable, or have only indirect effects on radiative forcing (IPCC 1996a). CO2, CH4, and N2O are the three most significant GHGs and account for 76.7 percent, 14.3 percent, and 7.9 percent respectively of total global impact (see Table 2.1.1. and Figure 2.1.2.). Table 2.1.1. Major greenhouse gases and global warming potentials (adapted from: Kirby 2008,
IPCC 2006, and Cicerone 2001).
Greenhouse Gases (GHG)
Global Warming Potential (GWP)
Pre-industrial concentration
(ppm)
Concentration in 1998 (ppm)
Atmospheric lifetime (years)
Main human activity sources
Water Vapor -- 1 to 3 1 to 3 A few days --
Carbon Dioxide CO2
1 280 365 Variable to >100 years
Fossil fuels, cement production, land-use change
Methane CH4
23 0.7 1.75 12 Fossil fuels, landfills, agriculture
Nitrous Oxide N2O
296-310 0.27 0.31 114 Fossil fuels, landfills, agriculture
Fluorine gases
120-22,200
0 to 0.00004 0 to 0.00008 1.4 to >50,000
Refrigerants, aluminum, electricity production
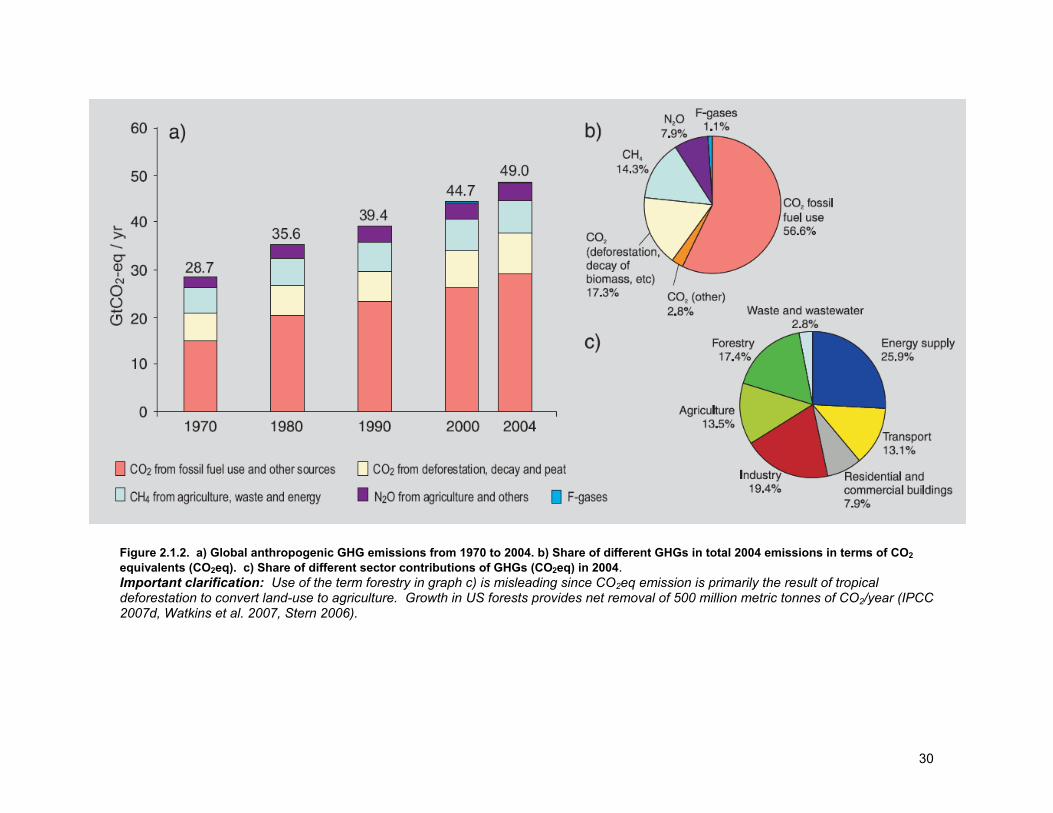
30
Figure 2.1.2. a) Global anthropogenic GHG emissions from 1970 to 2004. b) Share of different GHGs in total 2004 emissions in terms of CO2 equivalents (CO2eq). c) Share of different sector contributions of GHGs (CO2eq) in 2004. Important clarification: Use of the term forestry in graph c) is misleading since CO2eq emission is primarily the result of tropical deforestation to convert land-use to agriculture. Growth in US forests provides net removal of 500 million metric tonnes of CO2/year (IPCC 2007d, Watkins et al. 2007, Stern 2006).
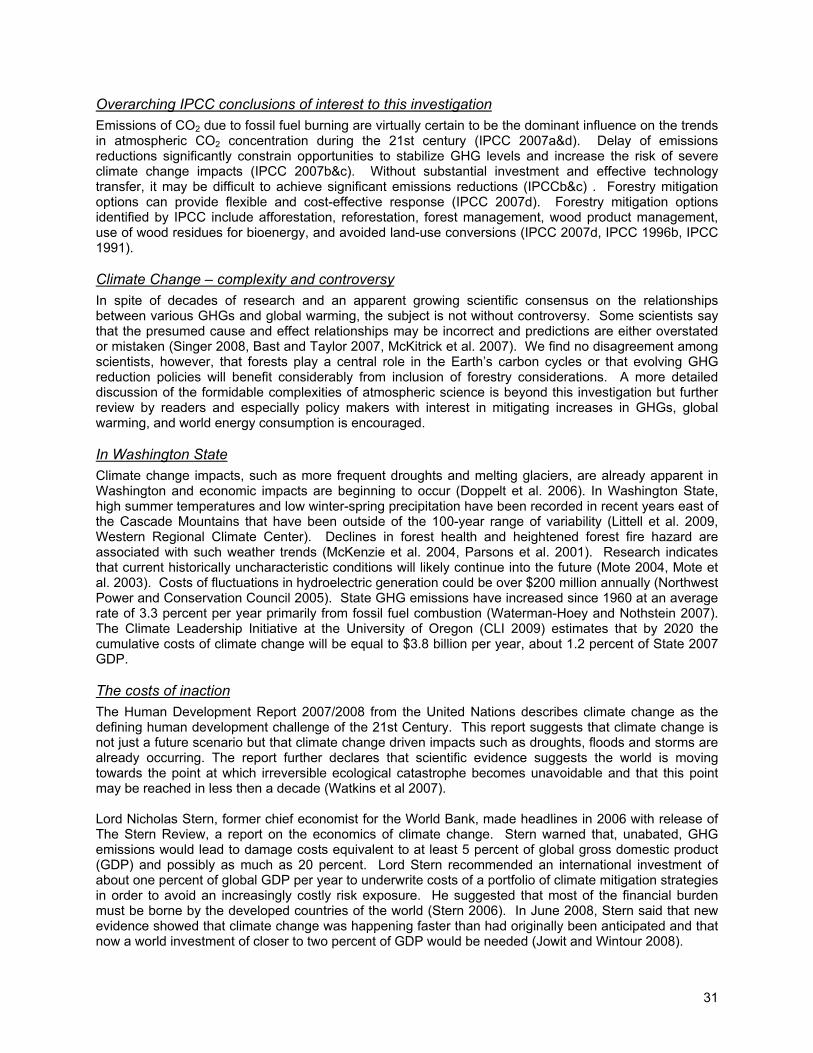
31
Overarching IPCC conclusions of interest to this investigation Emissions of CO2 due to fossil fuel burning are virtually certain to be the dominant influence on the trends in atmospheric CO2 concentration during the 21st century (IPCC 2007a&d). Delay of emissions reductions significantly constrain opportunities to stabilize GHG levels and increase the risk of severe climate change impacts (IPCC 2007b&c). Without substantial investment and effective technology transfer, it may be difficult to achieve significant emissions reductions (IPCCb&c) . Forestry mitigation options can provide flexible and cost-effective response (IPCC 2007d). Forestry mitigation options identified by IPCC include afforestation, reforestation, forest management, wood product management, use of wood residues for bioenergy, and avoided land-use conversions (IPCC 2007d, IPCC 1996b, IPCC 1991). Climate Change – complexity and controversy In spite of decades of research and an apparent growing scientific consensus on the relationships between various GHGs and global warming, the subject is not without controversy. Some scientists say that the presumed cause and effect relationships may be incorrect and predictions are either overstated or mistaken (Singer 2008, Bast and Taylor 2007, McKitrick et al. 2007). We find no disagreement among scientists, however, that forests play a central role in the Earth’s carbon cycles or that evolving GHG reduction policies will benefit considerably from inclusion of forestry considerations. A more detailed discussion of the formidable complexities of atmospheric science is beyond this investigation but further review by readers and especially policy makers with interest in mitigating increases in GHGs, global warming, and world energy consumption is encouraged. In Washington State Climate change impacts, such as more frequent droughts and melting glaciers, are already apparent in Washington and economic impacts are beginning to occur (Doppelt et al. 2006). In Washington State, high summer temperatures and low winter-spring precipitation have been recorded in recent years east of the Cascade Mountains that have been outside of the 100-year range of variability (Littell et al. 2009, Western Regional Climate Center). Declines in forest health and heightened forest fire hazard are associated with such weather trends (McKenzie et al. 2004, Parsons et al. 2001). Research indicates that current historically uncharacteristic conditions will likely continue into the future (Mote 2004, Mote et al. 2003). Costs of fluctuations in hydroelectric generation could be over $200 million annually (Northwest Power and Conservation Council 2005). State GHG emissions have increased since 1960 at an average rate of 3.3 percent per year primarily from fossil fuel combustion (Waterman-Hoey and Nothstein 2007). The Climate Leadership Initiative at the University of Oregon (CLI 2009) estimates that by 2020 the cumulative costs of climate change will be equal to $3.8 billion per year, about 1.2 percent of State 2007 GDP. The costs of inaction The Human Development Report 2007/2008 from the United Nations describes climate change as the defining human development challenge of the 21st Century. This report suggests that climate change is not just a future scenario but that climate change driven impacts such as droughts, floods and storms are already occurring. The report further declares that scientific evidence suggests the world is moving towards the point at which irreversible ecological catastrophe becomes unavoidable and that this point may be reached in less then a decade (Watkins et al 2007). Lord Nicholas Stern, former chief economist for the World Bank, made headlines in 2006 with release of The Stern Review, a report on the economics of climate change. Stern warned that, unabated, GHG emissions would lead to damage costs equivalent to at least 5 percent of global gross domestic product (GDP) and possibly as much as 20 percent. Lord Stern recommended an international investment of about one percent of global GDP per year to underwrite costs of a portfolio of climate mitigation strategies in order to avoid an increasingly costly risk exposure. He suggested that most of the financial burden must be borne by the developed countries of the world (Stern 2006). In June 2008, Stern said that new evidence showed that climate change was happening faster than had originally been anticipated and that now a world investment of closer to two percent of GDP would be needed (Jowit and Wintour 2008).
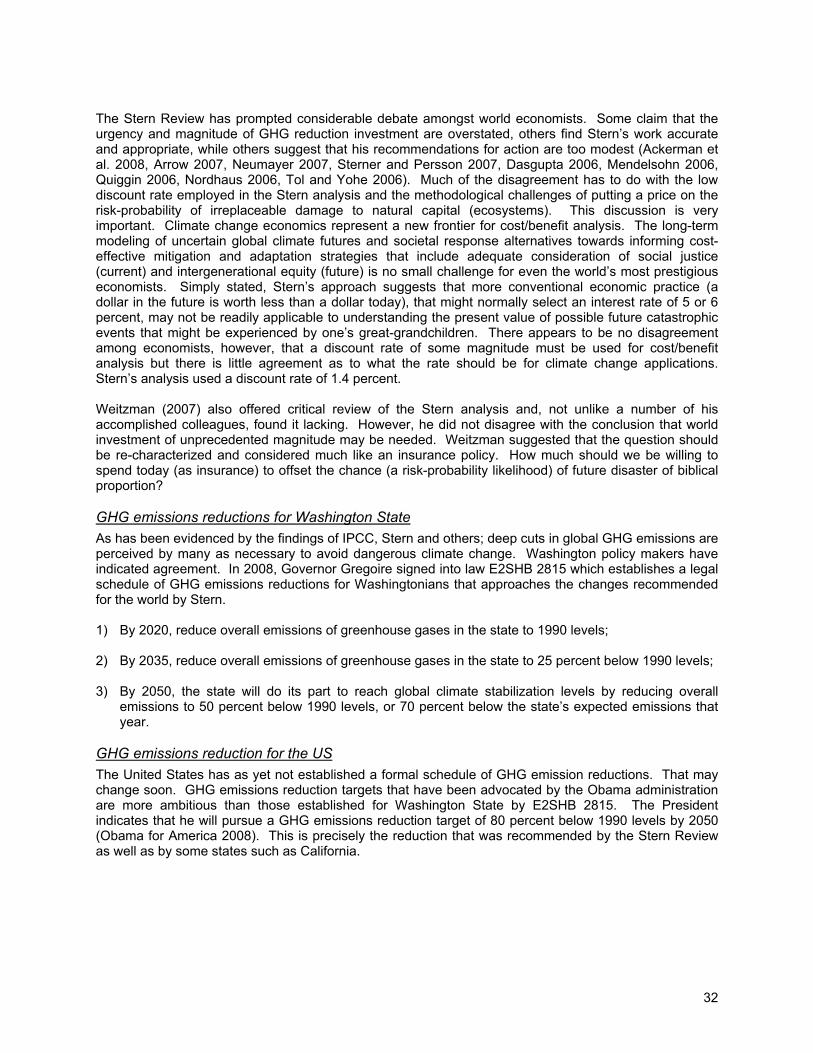
32
The Stern Review has prompted considerable debate amongst world economists. Some claim that the urgency and magnitude of GHG reduction investment are overstated, others find Stern’s work accurate and appropriate, while others suggest that his recommendations for action are too modest (Ackerman et al. 2008, Arrow 2007, Neumayer 2007, Sterner and Persson 2007, Dasgupta 2006, Mendelsohn 2006, Quiggin 2006, Nordhaus 2006, Tol and Yohe 2006). Much of the disagreement has to do with the low discount rate employed in the Stern analysis and the methodological challenges of putting a price on the risk-probability of irreplaceable damage to natural capital (ecosystems). This discussion is very important. Climate change economics represent a new frontier for cost/benefit analysis. The long-term modeling of uncertain global climate futures and societal response alternatives towards informing cost-effective mitigation and adaptation strategies that include adequate consideration of social justice (current) and intergenerational equity (future) is no small challenge for even the world’s most prestigious economists. Simply stated, Stern’s approach suggests that more conventional economic practice (a dollar in the future is worth less than a dollar today), that might normally select an interest rate of 5 or 6 percent, may not be readily applicable to understanding the present value of possible future catastrophic events that might be experienced by one’s great-grandchildren. There appears to be no disagreement among economists, however, that a discount rate of some magnitude must be used for cost/benefit analysis but there is little agreement as to what the rate should be for climate change applications. Stern’s analysis used a discount rate of 1.4 percent. Weitzman (2007) also offered critical review of the Stern analysis and, not unlike a number of his accomplished colleagues, found it lacking. However, he did not disagree with the conclusion that world investment of unprecedented magnitude may be needed. Weitzman suggested that the question should be re-characterized and considered much like an insurance policy. How much should we be willing to spend today (as insurance) to offset the chance (a risk-probability likelihood) of future disaster of biblical proportion? GHG emissions reductions for Washington State As has been evidenced by the findings of IPCC, Stern and others; deep cuts in global GHG emissions are perceived by many as necessary to avoid dangerous climate change. Washington policy makers have indicated agreement. In 2008, Governor Gregoire signed into law E2SHB 2815 which establishes a legal schedule of GHG emissions reductions for Washingtonians that approaches the changes recommended for the world by Stern. 1) By 2020, reduce overall emissions of greenhouse gases in the state to 1990 levels;
2) By 2035, reduce overall emissions of greenhouse gases in the state to 25 percent below 1990 levels;
3) By 2050, the state will do its part to reach global climate stabilization levels by reducing overall
emissions to 50 percent below 1990 levels, or 70 percent below the state’s expected emissions that year.
GHG emissions reduction for the US The United States has as yet not established a formal schedule of GHG emission reductions. That may change soon. GHG emissions reduction targets that have been advocated by the Obama administration are more ambitious than those established for Washington State by E2SHB 2815. The President indicates that he will pursue a GHG emissions reduction target of 80 percent below 1990 levels by 2050 (Obama for America 2008). This is precisely the reduction that was recommended by the Stern Review as well as by some states such as California.
33
Figure 2.1.3. Comparison of Washington (left) and total US (right) annual GHG emission trends (EIA 2008c). 2.2 Energy independence The Stern Review recommended that an expenditure of one percent of world GDP per year would be needed to reduce global GHG emissions to 80 percent of 1990 levels by 2050 (Stern 2006). This seems a somewhat arbitrary number with, as mentioned above, some saying less and others (including a more-recent Stern) calling for more. One percent does, however, offer a convenient reference point from which
Figure 2.2.1. US petroleum statistics (RITA 2008).
4,000
4,500
5,000
5,500
6,000
60
65
70
75
80
85
90
1990 1991 1992 1993 1994 1995 1996 1997 1998 1999 2000 2001 2002 2003
US
mill
ion
met
ric to
ns C
O2e
WA
mill
ion
met
ric to
ns C
O2e
Washington and Total US Annual GHG Emissions 1990-2003
WA Total US
0
5
10
15
20
25
milli
on b
arre
ls/d
ay
US Production,Imports, and Consumption of Petroleum Products 1960-2007
Domestic production Gross imports Petroleum consumption
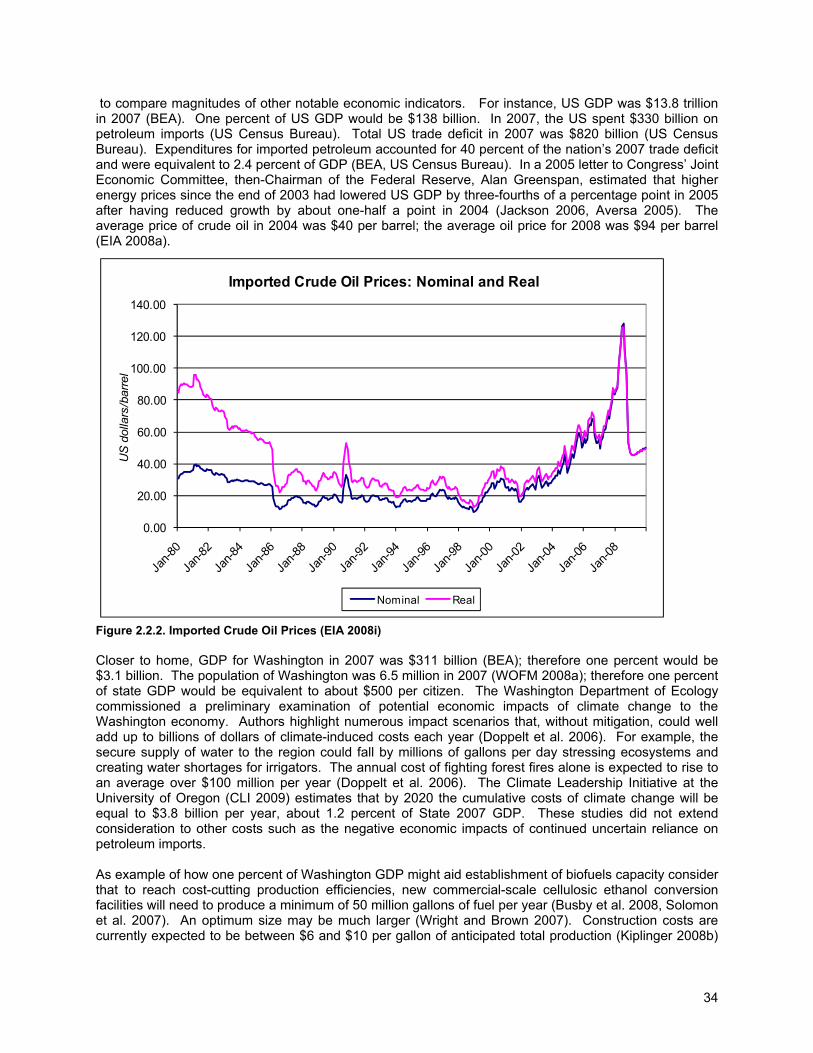
34
to compare magnitudes of other notable economic indicators. For instance, US GDP was $13.8 trillion in 2007 (BEA). One percent of US GDP would be $138 billion. In 2007, the US spent $330 billion on petroleum imports (US Census Bureau). Total US trade deficit in 2007 was $820 billion (US Census Bureau). Expenditures for imported petroleum accounted for 40 percent of the nation’s 2007 trade deficit and were equivalent to 2.4 percent of GDP (BEA, US Census Bureau). In a 2005 letter to Congress’ Joint Economic Committee, then-Chairman of the Federal Reserve, Alan Greenspan, estimated that higher energy prices since the end of 2003 had lowered US GDP by three-fourths of a percentage point in 2005 after having reduced growth by about one-half a point in 2004 (Jackson 2006, Aversa 2005). The average price of crude oil in 2004 was $40 per barrel; the average oil price for 2008 was $94 per barrel (EIA 2008a).
Figure 2.2.2. Imported Crude Oil Prices (EIA 2008i) Closer to home, GDP for Washington in 2007 was $311 billion (BEA); therefore one percent would be $3.1 billion. The population of Washington was 6.5 million in 2007 (WOFM 2008a); therefore one percent of state GDP would be equivalent to about $500 per citizen. The Washington Department of Ecology commissioned a preliminary examination of potential economic impacts of climate change to the Washington economy. Authors highlight numerous impact scenarios that, without mitigation, could well add up to billions of dollars of climate-induced costs each year (Doppelt et al. 2006). For example, the secure supply of water to the region could fall by millions of gallons per day stressing ecosystems and creating water shortages for irrigators. The annual cost of fighting forest fires alone is expected to rise to an average over $100 million per year (Doppelt et al. 2006). The Climate Leadership Initiative at the University of Oregon (CLI 2009) estimates that by 2020 the cumulative costs of climate change will be equal to $3.8 billion per year, about 1.2 percent of State 2007 GDP. These studies did not extend consideration to other costs such as the negative economic impacts of continued uncertain reliance on petroleum imports. As example of how one percent of Washington GDP might aid establishment of biofuels capacity consider that to reach cost-cutting production efficiencies, new commercial-scale cellulosic ethanol conversion facilities will need to produce a minimum of 50 million gallons of fuel per year (Busby et al. 2008, Solomon et al. 2007). An optimum size may be much larger (Wright and Brown 2007). Construction costs are currently expected to be between $6 and $10 per gallon of anticipated total production (Kiplinger 2008b)
0.00
20.00
40.00
60.00
80.00
100.00
120.00
140.00
US
dol
lars
/bar
rel
Imported Crude Oil Prices: Nominal and Real
Nominal Real
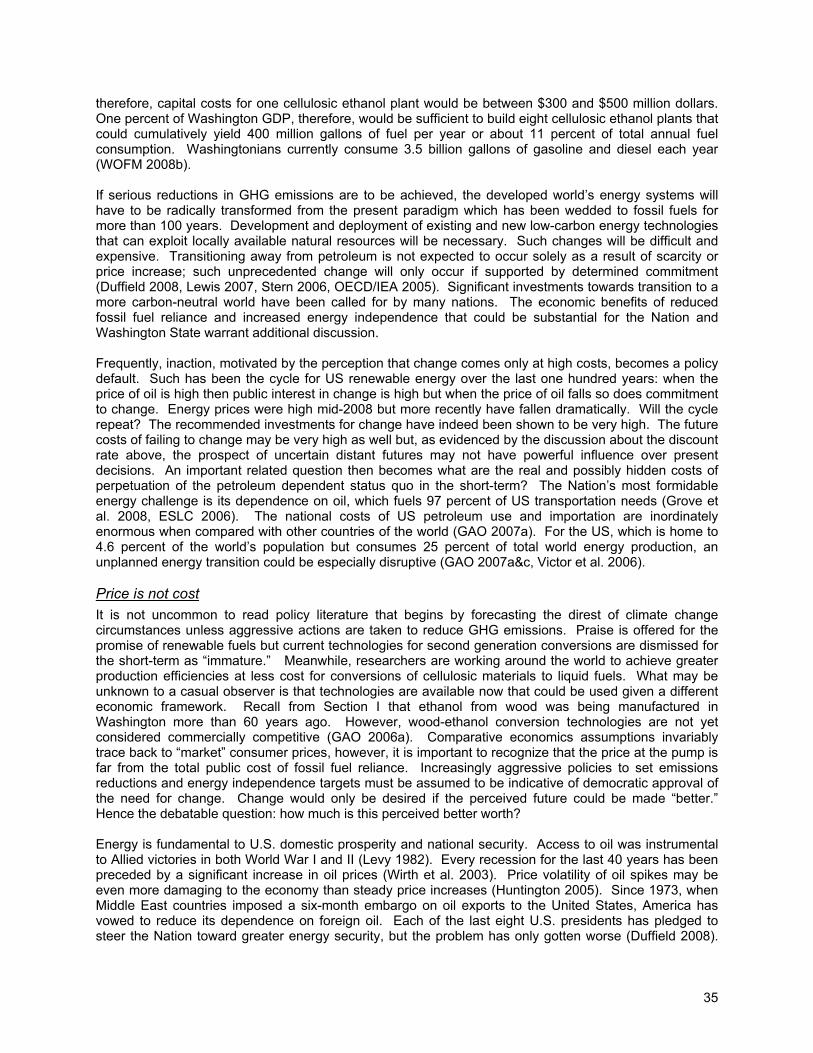
35
therefore, capital costs for one cellulosic ethanol plant would be between $300 and $500 million dollars. One percent of Washington GDP, therefore, would be sufficient to build eight cellulosic ethanol plants that could cumulatively yield 400 million gallons of fuel per year or about 11 percent of total annual fuel consumption. Washingtonians currently consume 3.5 billion gallons of gasoline and diesel each year (WOFM 2008b). If serious reductions in GHG emissions are to be achieved, the developed world’s energy systems will have to be radically transformed from the present paradigm which has been wedded to fossil fuels for more than 100 years. Development and deployment of existing and new low-carbon energy technologies that can exploit locally available natural resources will be necessary. Such changes will be difficult and expensive. Transitioning away from petroleum is not expected to occur solely as a result of scarcity or price increase; such unprecedented change will only occur if supported by determined commitment (Duffield 2008, Lewis 2007, Stern 2006, OECD/IEA 2005). Significant investments towards transition to a more carbon-neutral world have been called for by many nations. The economic benefits of reduced fossil fuel reliance and increased energy independence that could be substantial for the Nation and Washington State warrant additional discussion. Frequently, inaction, motivated by the perception that change comes only at high costs, becomes a policy default. Such has been the cycle for US renewable energy over the last one hundred years: when the price of oil is high then public interest in change is high but when the price of oil falls so does commitment to change. Energy prices were high mid-2008 but more recently have fallen dramatically. Will the cycle repeat? The recommended investments for change have indeed been shown to be very high. The future costs of failing to change may be very high as well but, as evidenced by the discussion about the discount rate above, the prospect of uncertain distant futures may not have powerful influence over present decisions. An important related question then becomes what are the real and possibly hidden costs of perpetuation of the petroleum dependent status quo in the short-term? The Nation’s most formidable energy challenge is its dependence on oil, which fuels 97 percent of US transportation needs (Grove et al. 2008, ESLC 2006). The national costs of US petroleum use and importation are inordinately enormous when compared with other countries of the world (GAO 2007a). For the US, which is home to 4.6 percent of the world’s population but consumes 25 percent of total world energy production, an unplanned energy transition could be especially disruptive (GAO 2007a&c, Victor et al. 2006). Price is not cost It is not uncommon to read policy literature that begins by forecasting the direst of climate change circumstances unless aggressive actions are taken to reduce GHG emissions. Praise is offered for the promise of renewable fuels but current technologies for second generation conversions are dismissed for the short-term as “immature.” Meanwhile, researchers are working around the world to achieve greater production efficiencies at less cost for conversions of cellulosic materials to liquid fuels. What may be unknown to a casual observer is that technologies are available now that could be used given a different economic framework. Recall from Section I that ethanol from wood was being manufactured in Washington more than 60 years ago. However, wood-ethanol conversion technologies are not yet considered commercially competitive (GAO 2006a). Comparative economics assumptions invariably trace back to “market” consumer prices, however, it is important to recognize that the price at the pump is far from the total public cost of fossil fuel reliance. Increasingly aggressive policies to set emissions reductions and energy independence targets must be assumed to be indicative of democratic approval of the need for change. Change would only be desired if the perceived future could be made “better.” Hence the debatable question: how much is this perceived better worth? Energy is fundamental to U.S. domestic prosperity and national security. Access to oil was instrumental to Allied victories in both World War I and II (Levy 1982). Every recession for the last 40 years has been preceded by a significant increase in oil prices (Wirth et al. 2003). Price volatility of oil spikes may be even more damaging to the economy than steady price increases (Huntington 2005). Since 1973, when Middle East countries imposed a six-month embargo on oil exports to the United States, America has vowed to reduce its dependence on foreign oil. Each of the last eight U.S. presidents has pledged to steer the Nation toward greater energy security, but the problem has only gotten worse (Duffield 2008).
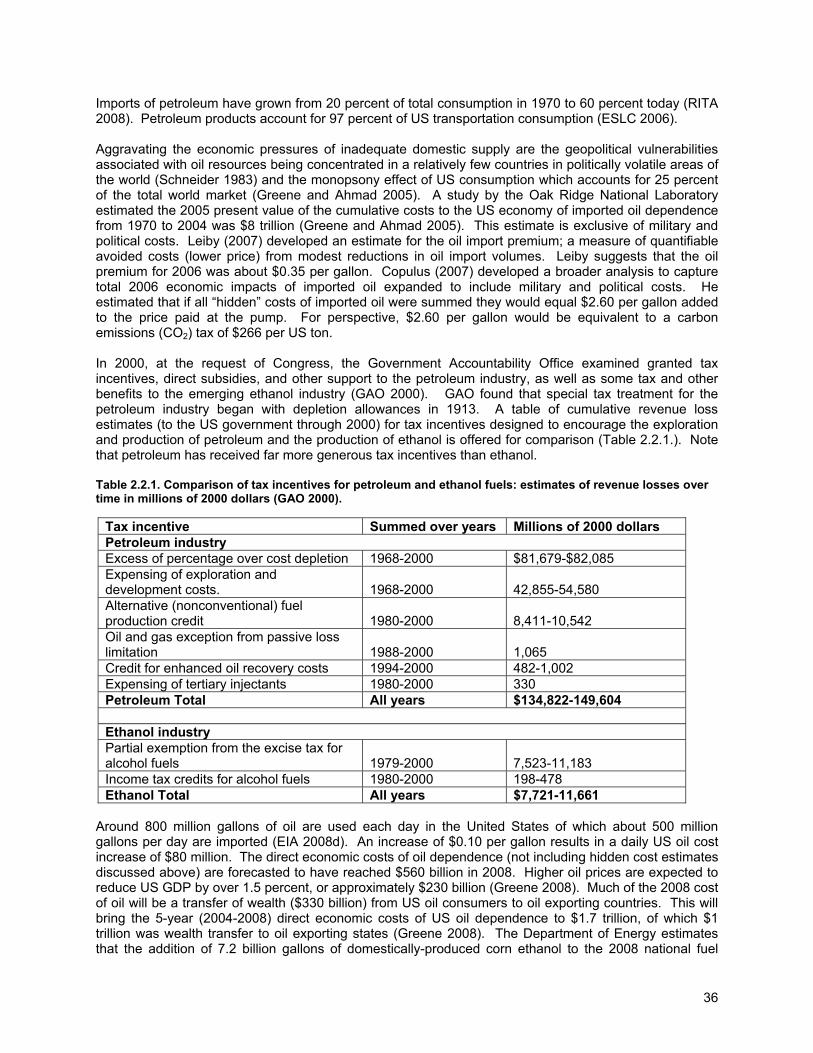
36
Imports of petroleum have grown from 20 percent of total consumption in 1970 to 60 percent today (RITA 2008). Petroleum products account for 97 percent of US transportation consumption (ESLC 2006). Aggravating the economic pressures of inadequate domestic supply are the geopolitical vulnerabilities associated with oil resources being concentrated in a relatively few countries in politically volatile areas of the world (Schneider 1983) and the monopsony effect of US consumption which accounts for 25 percent of the total world market (Greene and Ahmad 2005). A study by the Oak Ridge National Laboratory estimated the 2005 present value of the cumulative costs to the US economy of imported oil dependence from 1970 to 2004 was $8 trillion (Greene and Ahmad 2005). This estimate is exclusive of military and political costs. Leiby (2007) developed an estimate for the oil import premium; a measure of quantifiable avoided costs (lower price) from modest reductions in oil import volumes. Leiby suggests that the oil premium for 2006 was about $0.35 per gallon. Copulus (2007) developed a broader analysis to capture total 2006 economic impacts of imported oil expanded to include military and political costs. He estimated that if all “hidden” costs of imported oil were summed they would equal $2.60 per gallon added to the price paid at the pump. For perspective, $2.60 per gallon would be equivalent to a carbon emissions (CO2) tax of $266 per US ton. In 2000, at the request of Congress, the Government Accountability Office examined granted tax incentives, direct subsidies, and other support to the petroleum industry, as well as some tax and other benefits to the emerging ethanol industry (GAO 2000). GAO found that special tax treatment for the petroleum industry began with depletion allowances in 1913. A table of cumulative revenue loss estimates (to the US government through 2000) for tax incentives designed to encourage the exploration and production of petroleum and the production of ethanol is offered for comparison (Table 2.2.1.). Note that petroleum has received far more generous tax incentives than ethanol. Table 2.2.1. Comparison of tax incentives for petroleum and ethanol fuels: estimates of revenue losses over time in millions of 2000 dollars (GAO 2000).
Around 800 million gallons of oil are used each day in the United States of which about 500 million gallons per day are imported (EIA 2008d). An increase of $0.10 per gallon results in a daily US oil cost increase of $80 million. The direct economic costs of oil dependence (not including hidden cost estimates discussed above) are forecasted to have reached $560 billion in 2008. Higher oil prices are expected to reduce US GDP by over 1.5 percent, or approximately $230 billion (Greene 2008). Much of the 2008 cost of oil will be a transfer of wealth ($330 billion) from US oil consumers to oil exporting countries. This will bring the 5-year (2004-2008) direct economic costs of US oil dependence to $1.7 trillion, of which $1 trillion was wealth transfer to oil exporting states (Greene 2008). The Department of Energy estimates that the addition of 7.2 billion gallons of domestically-produced corn ethanol to the 2008 national fuel
Tax incentive Summed over years Millions of 2000 dollarsPetroleum industry Excess of percentage over cost depletion 1968-2000 $81,679-$82,085 Expensing of exploration and development costs. 1968-2000 42,855-54,580 Alternative (nonconventional) fuel production credit 1980-2000 8,411-10,542 Oil and gas exception from passive loss limitation 1988-2000 1,065 Credit for enhanced oil recovery costs 1994-2000 482-1,002 Expensing of tertiary injectants 1980-2000 330 Petroleum Total All years $134,822-149,604 Ethanol industry Partial exemption from the excise tax for alcohol fuels 1979-2000 7,523-11,183 Income tax credits for alcohol fuels 1980-2000 198-478 Ethanol Total All years $7,721-11,661
37
supply effectively lowered gas prices by $0.20 to $0.35 per gallon (DOE 2008a). Deutsch and Schlesinger (2006) estimate that, due to the magnitude of US market presences, a ten percent drop in US oil demand could cause a temporary decline in global oil prices of 12 to 25 percent. Forecasts suggest that, with an average oil price of $50 per barrel, the US will spend more than $5 trillion on oil imports over the next two decades (Duffield 2008, EIA 2006b, Klare 2004). Washington citizens spent $9 billion in 2006 on imported fuel (Gregoire 2007). Washington imports all but a small fraction of liquid transportation fuels from either other states or from abroad (Lyons pers com). By contrast, Washington is the largest hydroelectric power producer in the Nation and is a net electricity exporter, supplying clean power to markets from Canada to California (EIA 2009a).
Figure 2.2.4. Top world oil importers: includes all countries with net imports greater than 1 million barrels per day in 2004 (GAO 2006b). The contrasting contributions of transportation fuels and electricity generation to a combined energy portfolio warrant a brief comment with implications for energy policy. The electricity distribution system in the United States is a complicated and important part of the country's national energy infrastructure. In this digital age, the need for high-quality, reliable electricity makes the transmission grid as vast and as important as the highway system. In 2003, domestic electricity use produced revenues equal to about four percent of the U.S. GDP (Wirth et al. 2003). A big difference, however, between US transportation fuels and electricity is that the former requires massive volumes of imports while the latter can be produced largely from domestic supplies. Further, new technologies such as wind a solar that don’t require biomass already help provide renewable electricity for our nation. Energy independence in the US is about liquid fuels not electricity (WGA 2008a). GHG reductions may be about both electricity and transportation. For Washington, however, with clean instate hydro and nuclear providing most electrical generation, the focus of strategies for emissions reductions when combined with energy independence should logically be transportation fuels. The importance of this conclusion does not appear to be recognized in state energy policy and will be further discussed in this report.
Figure 2.2.3. Costs of Oil Dependence (Greene2008).
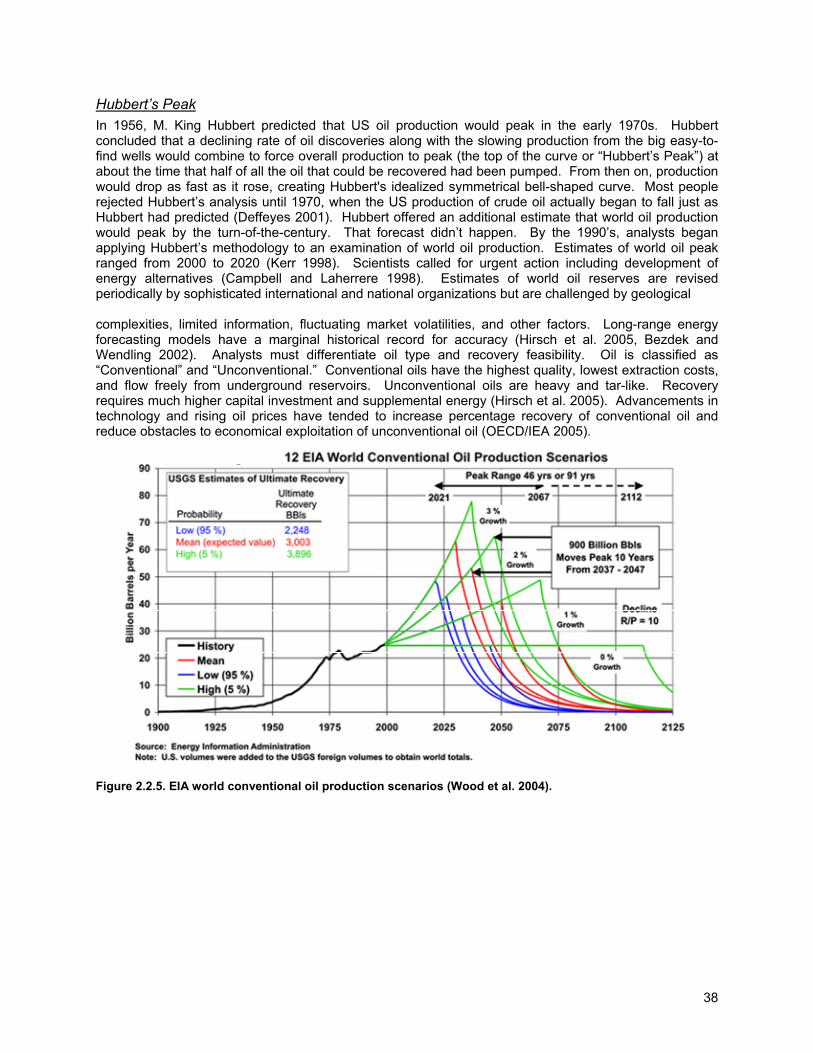
38
Hubbert’s Peak In 1956, M. King Hubbert predicted that US oil production would peak in the early 1970s. Hubbert concluded that a declining rate of oil discoveries along with the slowing production from the big easy-to-find wells would combine to force overall production to peak (the top of the curve or “Hubbert’s Peak”) at about the time that half of all the oil that could be recovered had been pumped. From then on, production would drop as fast as it rose, creating Hubbert's idealized symmetrical bell-shaped curve. Most people rejected Hubbert’s analysis until 1970, when the US production of crude oil actually began to fall just as Hubbert had predicted (Deffeyes 2001). Hubbert offered an additional estimate that world oil production would peak by the turn-of-the-century. That forecast didn’t happen. By the 1990’s, analysts began applying Hubbert’s methodology to an examination of world oil production. Estimates of world oil peak ranged from 2000 to 2020 (Kerr 1998). Scientists called for urgent action including development of energy alternatives (Campbell and Laherrere 1998). Estimates of world oil reserves are revised periodically by sophisticated international and national organizations but are challenged by geological complexities, limited information, fluctuating market volatilities, and other factors. Long-range energy forecasting models have a marginal historical record for accuracy (Hirsch et al. 2005, Bezdek and Wendling 2002). Analysts must differentiate oil type and recovery feasibility. Oil is classified as “Conventional” and “Unconventional.” Conventional oils have the highest quality, lowest extraction costs, and flow freely from underground reservoirs. Unconventional oils are heavy and tar-like. Recovery requires much higher capital investment and supplemental energy (Hirsch et al. 2005). Advancements in technology and rising oil prices have tended to increase percentage recovery of conventional oil and reduce obstacles to economical exploitation of unconventional oil (OECD/IEA 2005).
Figure 2.2.5. EIA world conventional oil production scenarios (Wood et al. 2004).
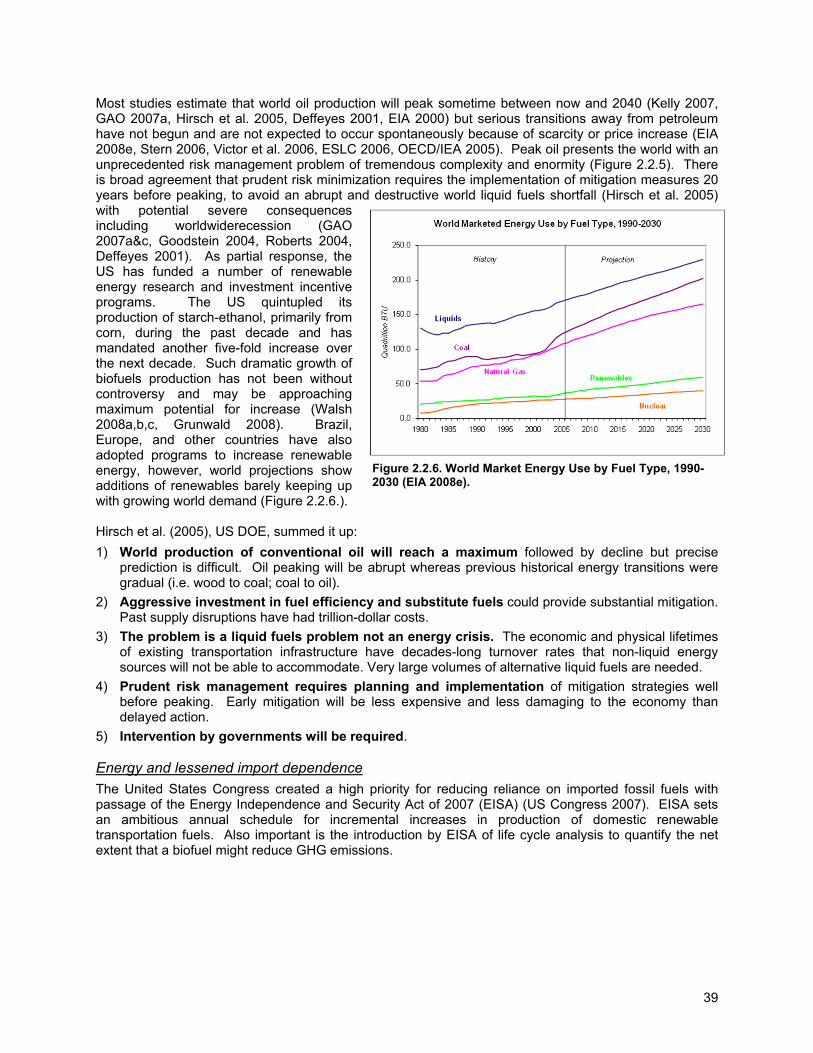
39
Most studies estimate that world oil production will peak sometime between now and 2040 (Kelly 2007, GAO 2007a, Hirsch et al. 2005, Deffeyes 2001, EIA 2000) but serious transitions away from petroleum have not begun and are not expected to occur spontaneously because of scarcity or price increase (EIA 2008e, Stern 2006, Victor et al. 2006, ESLC 2006, OECD/IEA 2005). Peak oil presents the world with an unprecedented risk management problem of tremendous complexity and enormity (Figure 2.2.5). There is broad agreement that prudent risk minimization requires the implementation of mitigation measures 20 years before peaking, to avoid an abrupt and destructive world liquid fuels shortfall (Hirsch et al. 2005) with potential severe consequences including worldwiderecession (GAO 2007a&c, Goodstein 2004, Roberts 2004, Deffeyes 2001). As partial response, the US has funded a number of renewable energy research and investment incentive programs. The US quintupled its production of starch-ethanol, primarily from corn, during the past decade and has mandated another five-fold increase over the next decade. Such dramatic growth of biofuels production has not been without controversy and may be approaching maximum potential for increase (Walsh 2008a,b,c, Grunwald 2008). Brazil, Europe, and other countries have also adopted programs to increase renewable energy, however, world projections show additions of renewables barely keeping up with growing world demand (Figure 2.2.6.). Hirsch et al. (2005), US DOE, summed it up: 1) World production of conventional oil will reach a maximum followed by decline but precise
prediction is difficult. Oil peaking will be abrupt whereas previous historical energy transitions were gradual (i.e. wood to coal; coal to oil).
2) Aggressive investment in fuel efficiency and substitute fuels could provide substantial mitigation. Past supply disruptions have had trillion-dollar costs.
3) The problem is a liquid fuels problem not an energy crisis. The economic and physical lifetimes of existing transportation infrastructure have decades-long turnover rates that non-liquid energy sources will not be able to accommodate. Very large volumes of alternative liquid fuels are needed.
4) Prudent risk management requires planning and implementation of mitigation strategies well before peaking. Early mitigation will be less expensive and less damaging to the economy than delayed action.
5) Intervention by governments will be required.
Energy and lessened import dependence The United States Congress created a high priority for reducing reliance on imported fossil fuels with passage of the Energy Independence and Security Act of 2007 (EISA) (US Congress 2007). EISA sets an ambitious annual schedule for incremental increases in production of domestic renewable transportation fuels. Also important is the introduction by EISA of life cycle analysis to quantify the net extent that a biofuel might reduce GHG emissions.
Figure 2.2.6. World Market Energy Use by Fuel Type, 1990-2030 (EIA 2008e).
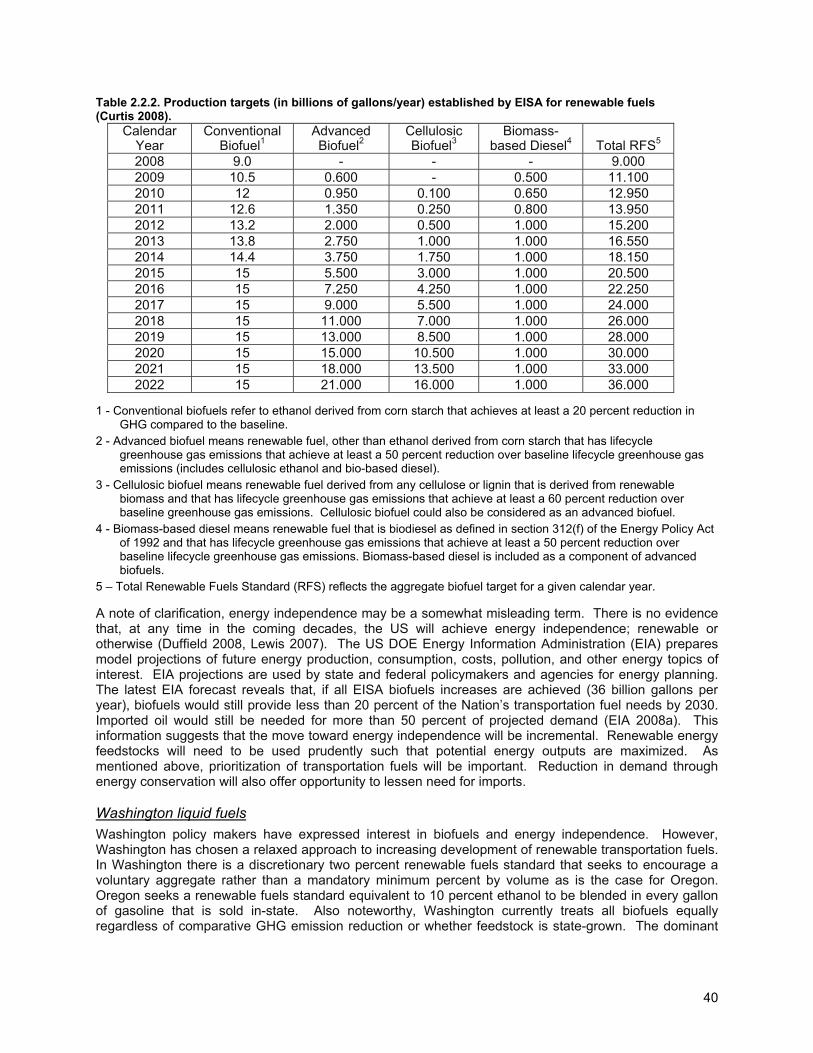
40
Table 2.2.2. Production targets (in billions of gallons/year) established by EISA for renewable fuels (Curtis 2008).
Calendar Year
Conventional Biofuel1
AdvancedBiofuel2
Cellulosic Biofuel3
Biomass-based Diesel4
Total RFS5
2008 9.0 - - - 9.000 2009 10.5 0.600 - 0.500 11.100 2010 12 0.950 0.100 0.650 12.950 2011 12.6 1.350 0.250 0.800 13.950 2012 13.2 2.000 0.500 1.000 15.200 2013 13.8 2.750 1.000 1.000 16.550 2014 14.4 3.750 1.750 1.000 18.150 2015 15 5.500 3.000 1.000 20.500 2016 15 7.250 4.250 1.000 22.250 2017 15 9.000 5.500 1.000 24.000 2018 15 11.000 7.000 1.000 26.000 2019 15 13.000 8.500 1.000 28.000 2020 15 15.000 10.500 1.000 30.000 2021 15 18.000 13.500 1.000 33.000 2022 15 21.000 16.000 1.000 36.000
1 - Conventional biofuels refer to ethanol derived from corn starch that achieves at least a 20 percent reduction in
GHG compared to the baseline. 2 - Advanced biofuel means renewable fuel, other than ethanol derived from corn starch that has lifecycle
greenhouse gas emissions that achieve at least a 50 percent reduction over baseline lifecycle greenhouse gas emissions (includes cellulosic ethanol and bio-based diesel).
3 - Cellulosic biofuel means renewable fuel derived from any cellulose or lignin that is derived from renewable biomass and that has lifecycle greenhouse gas emissions that achieve at least a 60 percent reduction over baseline greenhouse gas emissions. Cellulosic biofuel could also be considered as an advanced biofuel.
4 - Biomass-based diesel means renewable fuel that is biodiesel as defined in section 312(f) of the Energy Policy Act of 1992 and that has lifecycle greenhouse gas emissions that achieve at least a 50 percent reduction over baseline lifecycle greenhouse gas emissions. Biomass-based diesel is included as a component of advanced biofuels.
5 – Total Renewable Fuels Standard (RFS) reflects the aggregate biofuel target for a given calendar year. A note of clarification, energy independence may be a somewhat misleading term. There is no evidence that, at any time in the coming decades, the US will achieve energy independence; renewable or otherwise (Duffield 2008, Lewis 2007). The US DOE Energy Information Administration (EIA) prepares model projections of future energy production, consumption, costs, pollution, and other energy topics of interest. EIA projections are used by state and federal policymakers and agencies for energy planning. The latest EIA forecast reveals that, if all EISA biofuels increases are achieved (36 billion gallons per year), biofuels would still provide less than 20 percent of the Nation’s transportation fuel needs by 2030. Imported oil would still be needed for more than 50 percent of projected demand (EIA 2008a). This information suggests that the move toward energy independence will be incremental. Renewable energy feedstocks will need to be used prudently such that potential energy outputs are maximized. As mentioned above, prioritization of transportation fuels will be important. Reduction in demand through energy conservation will also offer opportunity to lessen need for imports. Washington liquid fuels Washington policy makers have expressed interest in biofuels and energy independence. However, Washington has chosen a relaxed approach to increasing development of renewable transportation fuels. In Washington there is a discretionary two percent renewable fuels standard that seeks to encourage a voluntary aggregate rather than a mandatory minimum percent by volume as is the case for Oregon. Oregon seeks a renewable fuels standard equivalent to 10 percent ethanol to be blended in every gallon of gasoline that is sold in-state. Also noteworthy, Washington currently treats all biofuels equally regardless of comparative GHG emission reduction or whether feedstock is state-grown. The dominant
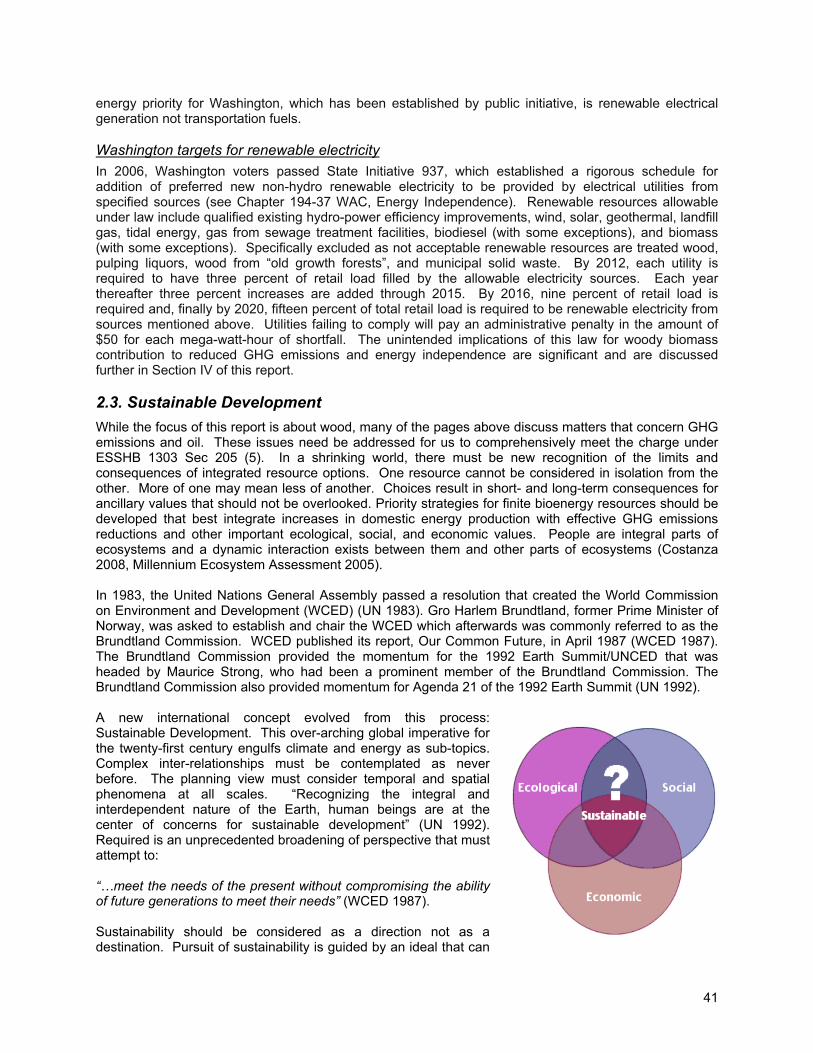
41
energy priority for Washington, which has been established by public initiative, is renewable electrical generation not transportation fuels. Washington targets for renewable electricity In 2006, Washington voters passed State Initiative 937, which established a rigorous schedule for addition of preferred new non-hydro renewable electricity to be provided by electrical utilities from specified sources (see Chapter 194-37 WAC, Energy Independence). Renewable resources allowable under law include qualified existing hydro-power efficiency improvements, wind, solar, geothermal, landfill gas, tidal energy, gas from sewage treatment facilities, biodiesel (with some exceptions), and biomass (with some exceptions). Specifically excluded as not acceptable renewable resources are treated wood, pulping liquors, wood from “old growth forests”, and municipal solid waste. By 2012, each utility is required to have three percent of retail load filled by the allowable electricity sources. Each year thereafter three percent increases are added through 2015. By 2016, nine percent of retail load is required and, finally by 2020, fifteen percent of total retail load is required to be renewable electricity from sources mentioned above. Utilities failing to comply will pay an administrative penalty in the amount of $50 for each mega-watt-hour of shortfall. The unintended implications of this law for woody biomass contribution to reduced GHG emissions and energy independence are significant and are discussed further in Section IV of this report. 2.3. Sustainable Development While the focus of this report is about wood, many of the pages above discuss matters that concern GHG emissions and oil. These issues need be addressed for us to comprehensively meet the charge under ESSHB 1303 Sec 205 (5). In a shrinking world, there must be new recognition of the limits and consequences of integrated resource options. One resource cannot be considered in isolation from the other. More of one may mean less of another. Choices result in short- and long-term consequences for ancillary values that should not be overlooked. Priority strategies for finite bioenergy resources should be developed that best integrate increases in domestic energy production with effective GHG emissions reductions and other important ecological, social, and economic values. People are integral parts of ecosystems and a dynamic interaction exists between them and other parts of ecosystems (Costanza 2008, Millennium Ecosystem Assessment 2005). In 1983, the United Nations General Assembly passed a resolution that created the World Commission on Environment and Development (WCED) (UN 1983). Gro Harlem Brundtland, former Prime Minister of Norway, was asked to establish and chair the WCED which afterwards was commonly referred to as the Brundtland Commission. WCED published its report, Our Common Future, in April 1987 (WCED 1987). The Brundtland Commission provided the momentum for the 1992 Earth Summit/UNCED that was headed by Maurice Strong, who had been a prominent member of the Brundtland Commission. The Brundtland Commission also provided momentum for Agenda 21 of the 1992 Earth Summit (UN 1992). A new international concept evolved from this process: Sustainable Development. This over-arching global imperative for the twenty-first century engulfs climate and energy as sub-topics. Complex inter-relationships must be contemplated as never before. The planning view must consider temporal and spatial phenomena at all scales. “Recognizing the integral and interdependent nature of the Earth, human beings are at the center of concerns for sustainable development” (UN 1992). Required is an unprecedented broadening of perspective that must attempt to: “…meet the needs of the present without compromising the ability of future generations to meet their needs” (WCED 1987). Sustainability should be considered as a direction not as a destination. Pursuit of sustainability is guided by an ideal that can
42
be approached but never realized. Sustainability is not static. The questions addressed by sustainability affect all areas of human activity. Sustainability is in fact an anthropogenic concept complete with moral implications that constrain options. Planning, mitigating, and adapting for sustainability requires an interdisciplinary approach to problem-solving that integrates social, ecological, and economic sciences towards understanding the range of technically possible options and implementing actions deemed most likely to approximate a desired outcome that must include allowance for future options (OECD 2001). Monitoring for results (scientific oversight) must be ongoing as corrections through adaptive management are a regular and inevitable occurrence (Costanza 2008). The question of sustainability is one of enlightened self-interest dedicated to perpetuating indefinite healthy residence of the human race on planet Earth (Clayton and Radcliffe 1996). Goals of sustainability have been formally embraced by the US government and by Washington State (Bush 2007, Locke 2002, The President’s Council on Sustainable Development 1999). Climate change and fossil fuel depletion are classic sustainability issues. There is growing concern among world leaders that current and projected human demands will exceed world mineral and biological capacities precipitating adverse consequences manifested as ecological, social, and economic disruptions. Recent developments in science and technology along with a consequent extension of human influence have served to accelerate actual and potential rates of change (Bare 2002). Some observers have suggested that climate changes are already occurring while others argue that there is considerable uncertainty as to how realistic some threatening scenarios might be. Disagreement when combined with potential high costs of change tends to create hesitant response. However, given that worst-case scenarios have very severe consequences, prudent action should be justified. Fortunately, the challenges discussed do not appear to be problems of absolute shortages of energy, resources, or pollution absorption capacity. The problems are in the patterns of interaction and usage. The problems of climate and energy are the result of unsustainable management choices that require mitigation and adaptation (Clayton and Radcliffe 1996). Sustainability – concept to process The challenge for scientists, stakeholders, and policy makers then becomes how to adequately assess options for change such that benefits are maximized, unintended consequences are avoided, and futures aren’t foreclosed. A first process step must be an inclusive list of values important for consideration. Values are inherently cultural and consequently should be first indentified by stakeholders and policy makers. Suggested additions may be recommended by scientists. As a second step, methodologies will be needed to compare the relative performances (costs and benefits) of strategic alternatives for 1) mitigation and 2) adaptation within the context of existing constraints towards fulfillment of identified value objectives such as less GHG emissions or more domestic energy. As evidenced by the information presented above, economic analysis alone appears inadequate. Interdisciplinary sciences will be needed to comprehensively assess market and non-market values, hidden costs, ecosystem services, gross and net emissions releases, aesthetics, existence values, risk probabilities, and other metrics as might be revealed in process. As a third process step, aided by technical support from scientists, stakeholders and policy makers must make difficult choices and action must be implemented. Successful decision-making procedures will require that implicit value judgments be made explicit and defensible such that the decision-making process is transparent (OECD 2001). This is particularly important since transitions toward sustainability will involve choosing between options that have been developed on the basis of assumptions and estimates which have different benefits and costs for different people at different times. Ultimately such decisions will require value judgments as to what is “best” for society. Lastly, outcomes must be monitored by scientists such that adaptive management opportunities are identified and brought to the attention of stakeholders and policy makers for strategic review (OECD 2001). It is important to understand that sustainability is an iterative undertaking and that, if change is desired, past and current institutional assumptions must be periodically revisited. The IPCC has begun such work at the global level with coarse resolution results that have served to demonstrate the interconnectedness of climate and energy challenges. Global study, however, falls short of finer resolution analyses needed to inform local strategies for implementation. For instance, the local strategies of specific concern for this investigation are those best applicable to the needs of Washington with special emphasis on the potential benefits from management of forest resources and utilization of woody biomass for clean instate energy
43
with resultant GHG emissions reductions. Local strategies, however, must always be developed against a broader backdrop of global interactions and consequences. The three-legged stool Sustainability is often described as an integration of three essential realms of consideration: ecological carrying capacity, social justice, and economic efficiency that while overlapping are individually inadequate to fully encompass the challenge (Bare 2002). The metaphor is that of a three-legged stool with equal weight given to each realm of responsibility towards creating a balanced framework that is stable and durable. While this simplification is useful as a conversational characterization it discounts the dynamic and complex nature of sustainability in practice (adaptive management); preferential treatment may shift from one realm to another as need may arise (USDA 2008, Kates et al. 2005). For example, as indicated by the discussion above of the generally agreed upon need to transition away from current fossil fuel consumption, short-term economic benefit may need to be compromised in order to chart a longer term course towards a more sustainable global environment. Any thoughtful discussion of sustainability must include recognition that it is multi-dimensional and that it involves trade-offs towards achievement of improvements to the human condition (OECD 2001). A systems approach Analysis of using forest biomass potential for bioenergy will require a systems approach grounded in sustainability. Fortunately, forest scientists are especially aware of such interconnections and the jeopardy of unintended consequences when a scope of investigation is arbitrarily defined or when complex interactions are inappropriately simplified (Fedkiw et al. 2004, Floyd 2002). For example, commercial investments in forest activities today will not bring financial returns for decades. Ecosystem and habitat enhancement projects may not realize intended benefits for centuries. Landscape planning (much like climate change mitigation) requires long-term scheduling based upon 50- to 100- year windows of incremental operations that sustain cash flows while providing both consistent raw material supplies to process infrastructure and habitats required by wildlife species. Forest scientists are also acutely aware of the need to integrate objectives across multiple and often competing values since forestry activities are both highly visible and politically sensitive. Adding to the complexities of ecosystem resource management in Washington is a diversity of public and private forestland ownerships each of which comes with its own set of stakeholders and interest groups. Interested members of the lay public as well as resource managers must be informed such that reviews of choices for action are based in common understanding of complex yet transparent analysis not subject to distrust. Further, as the following pages of this report will reveal, forests and foresters are already dealing with the impacts of climate change on forest health. Twenty-first century foresters rely upon a systems approach to planning, aided by computer technologies and modeling frameworks that could provide instructional example for climate change mitigation and energy planning in Washington. Utilization of woody biomass for bioenergy must be addressed within the context of the full suite of ecological, social, and economic forestry considerations as will be shown by discussions in the following sections. Organizing complexities to understand trade-offs associated with alternative management choices is the fundamental challenge to developing successful policies (OECD 2001). The body of information to be considered is huge and the planning process is formidable. Infrastructure is limited, funding is scarce, costs high, and conflicts rampant. Strategies to help professionals, publics, and policy-makers gain better understanding of the present circumstances and the future consequences of alternative management choices will be helpful. The need is to have a way of incorporating information from different domains into a single decision-making process. A systems approach embraces a multi-dimensional framework in which information from different disciplines and domains can be integrated into a single-dimensional framework (Clayton and Radcliffe 1996). A systems approach conceptualizes hierarchal relationships between provinces of interest much like attribute layers are used in geographical systems analysis. For a very simplified example, consider forests, energy, and GHG emissions in Washington from a perspective of the three fundamental realms of sustainability with integration of dominant values of interest to be identified by stakeholders and policy makers. The first layer is the forests which must be grouped into subsets usually based upon geographical location, ecotype and ownership. Forest subsets
44
are evaluated relative to potential delivery over time of desired outputs (ecological, economic, and social) that are identified as mentioned above. The second layer would be energy. Goals and opportunities for state energy development, of which forest resources are one subset, are examined to identify maximum potential for alternative applications (vehicle fuels, electricity, etc.) prior to imposition of constraints. A third layer, GHG emissions, must be examined with understanding that energy and forests are both subsets and feedback loops that contribute to or detract from objectives. Again potential contributions should be estimated prior to imposition of constraints. Maximum possible outputs are then reduced based upon selected constraints scenarios such that interactive trade-offs can be assessed to inform political choices. The product of this exercise would become a decision support matrix to assist selection of strategies for implementation. This analytical approach can be useful as well to test effectiveness of existing policy frameworks. A more complete tutorial of systems analysis and decision support matrices is beyond the resources of this investigation; however, this discussion has been offered to highlight the need for organizational metrics from which to assess performance of options relative to desired goals. Understanding of several performance metrics pertinent to energy and GHG emissions will be helpful as we continue towards considering opportunities and obstacles for woody biomass utilization. Climate and energy Policy goals such as reducing greenhouse gas emissions and increasing energy independence can be at odds with each other. For example, consider transportation fuels in the US. The largest producer of ethanol, the dominant international alternative to gasoline, is the United States. Most US ethanol is produced from corn but there are limits as to how much corn ethanol can be produced (Curtis 2008). Hill et al. (2006) claim that dedicating the entire US corn crop to ethanol production would meet only 12 percent of domestic gasoline demand and make only a modest contribution to emissions reductions because of the low net energy return from corn ethanol. It takes about the equivalent of four gallons of fossil energy to produce five gallons of corn ethanol. Based upon this ratio, the entire US corn crop would only eliminate an equivalent of 2.4 percent of fossil fuel emissions from gasoline. Other scientists suggest that when land-use conversions to croplands are considered, corn-based ethanol may actually add to GHG emissions (Searchinger 2008). However, while the use of corn for ethanol may not be remarkably attractive from a GHG mitigation perspective, it certainly is helpful for energy independence. There is no single renewable energy source with potential to replace more than a portion fossil fuel energy demand (EIA 2008a). Hence there is need for a portfolio of energy contributions from many sources including “second” generation biofuels from wood feedstocks (WGA 2008a). The Energy Information Administration of the Department of Energy produces an Annual Energy Outlook (EIA 2008a) every year that presents long-term projections of energy supply, demand, and prices. The 2008 Annual Energy Outlook provides projections through 2030 that assume increases in renewable fuels commensurate with state and federal objectives. Cars and light trucks are assumed to gain fuel efficiencies to average 35 miles per gallon. The EIA reference case projects that by 2030, US population will grow by 22 percent, GDP by 79 percent, energy consumption by 19 percent, emissions per capita is expected to decline by 5 percent, but aggregate CO2 emissions will increase by 16 percent. Forecasted imports of petroleum are reduced from 60 percent of total consumption (current) to 54 percent of total consumption (2030). Considerable increases in renewables and gains in energy efficiencies are forecasted to keep up with increases in demand and result in a 6 percent reduction of imports. Forecasted 2030 petroleum consumption still accounts for 88 percent of total transportation energy (EIA 2008a). The EIA analysis reveals that potential domestic renewable energy development has limits. These limits have been recognized in the literature (Marshal Institute 2006). The corn ethanol example presented above is an example of a strategy that effectively contributes to the goal of energy independence but is less effective at reducing GHG emissions. A logical conclusion would be that priority strategies for renewable energy resources should be developed that best integrate increases in domestic energy production with effective GHG emissions reductions. All renewables aren’t created equal. Forests and sustainability The Rio Declaration on Environment and Development (UN 1992) established 27 international principles for sustainable development of which the US is a signatory. A review of Principles 2, 3, 7, and 8 is helpful
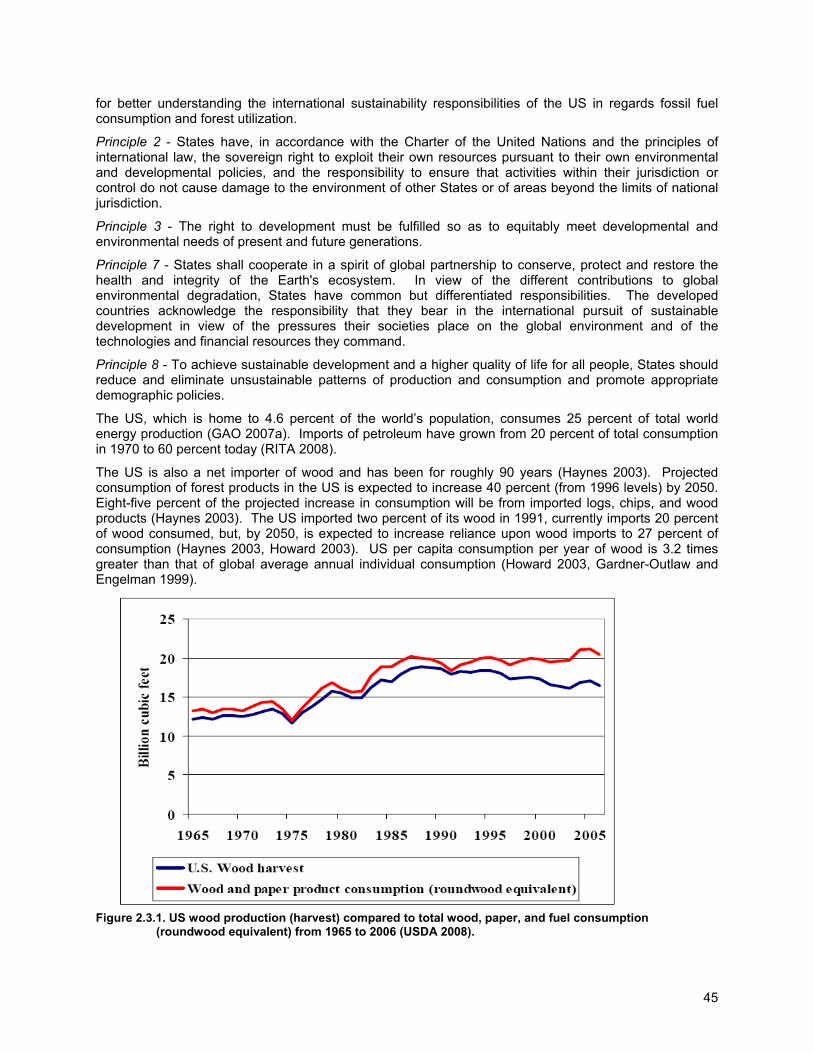
45
for better understanding the international sustainability responsibilities of the US in regards fossil fuel consumption and forest utilization.
Principle 2 - States have, in accordance with the Charter of the United Nations and the principles of international law, the sovereign right to exploit their own resources pursuant to their own environmental and developmental policies, and the responsibility to ensure that activities within their jurisdiction or control do not cause damage to the environment of other States or of areas beyond the limits of national jurisdiction.
Principle 3 - The right to development must be fulfilled so as to equitably meet developmental and environmental needs of present and future generations.
Principle 7 - States shall cooperate in a spirit of global partnership to conserve, protect and restore the health and integrity of the Earth's ecosystem. In view of the different contributions to global environmental degradation, States have common but differentiated responsibilities. The developed countries acknowledge the responsibility that they bear in the international pursuit of sustainable development in view of the pressures their societies place on the global environment and of the technologies and financial resources they command.
Principle 8 - To achieve sustainable development and a higher quality of life for all people, States should reduce and eliminate unsustainable patterns of production and consumption and promote appropriate demographic policies.
The US, which is home to 4.6 percent of the world’s population, consumes 25 percent of total world energy production (GAO 2007a). Imports of petroleum have grown from 20 percent of total consumption in 1970 to 60 percent today (RITA 2008).
The US is also a net importer of wood and has been for roughly 90 years (Haynes 2003). Projected consumption of forest products in the US is expected to increase 40 percent (from 1996 levels) by 2050. Eight-five percent of the projected increase in consumption will be from imported logs, chips, and wood products (Haynes 2003). The US imported two percent of its wood in 1991, currently imports 20 percent of wood consumed, but, by 2050, is expected to increase reliance upon wood imports to 27 percent of consumption (Haynes 2003, Howard 2003). US per capita consumption per year of wood is 3.2 times greater than that of global average annual individual consumption (Howard 2003, Gardner-Outlaw and Engelman 1999).
Figure 2.3.1. US wood production (harvest) compared to total wood, paper, and fuel consumption (roundwood equivalent) from 1965 to 2006 (USDA 2008).
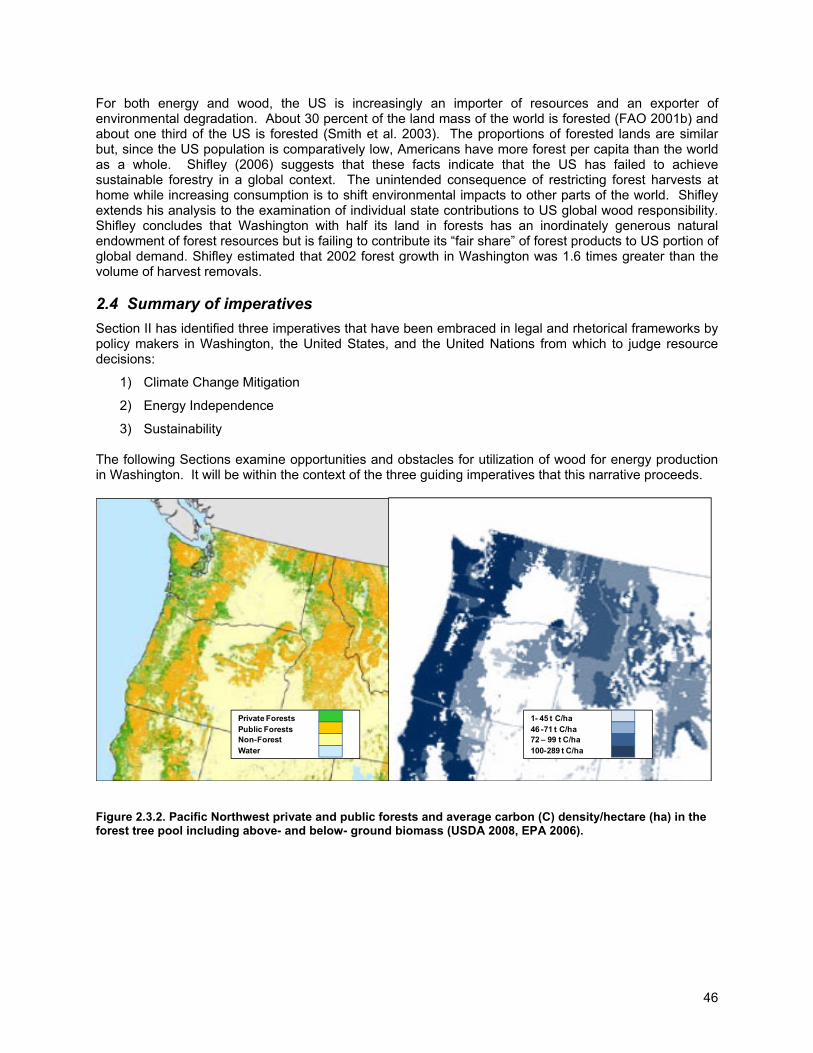
46
For both energy and wood, the US is increasingly an importer of resources and an exporter of environmental degradation. About 30 percent of the land mass of the world is forested (FAO 2001b) and about one third of the US is forested (Smith et al. 2003). The proportions of forested lands are similar but, since the US population is comparatively low, Americans have more forest per capita than the world as a whole. Shifley (2006) suggests that these facts indicate that the US has failed to achieve sustainable forestry in a global context. The unintended consequence of restricting forest harvests at home while increasing consumption is to shift environmental impacts to other parts of the world. Shifley extends his analysis to the examination of individual state contributions to US global wood responsibility. Shifley concludes that Washington with half its land in forests has an inordinately generous natural endowment of forest resources but is failing to contribute its “fair share” of forest products to US portion of global demand. Shifley estimated that 2002 forest growth in Washington was 1.6 times greater than the volume of harvest removals. 2.4 Summary of imperatives Section II has identified three imperatives that have been embraced in legal and rhetorical frameworks by policy makers in Washington, the United States, and the United Nations from which to judge resource decisions:
1) Climate Change Mitigation
2) Energy Independence
3) Sustainability The following Sections examine opportunities and obstacles for utilization of wood for energy production in Washington. It will be within the context of the three guiding imperatives that this narrative proceeds.
Figure 2.3.2. Pacific Northwest private and public forests and average carbon (C) density/hectare (ha) in the forest tree pool including above- and below- ground biomass (USDA 2008, EPA 2006).
Private ForestsPublic ForestsNon-ForestWater
1- 45 t C/ha 46 -71 t C/ha72 – 99 t C/ha100-289 t C/ha
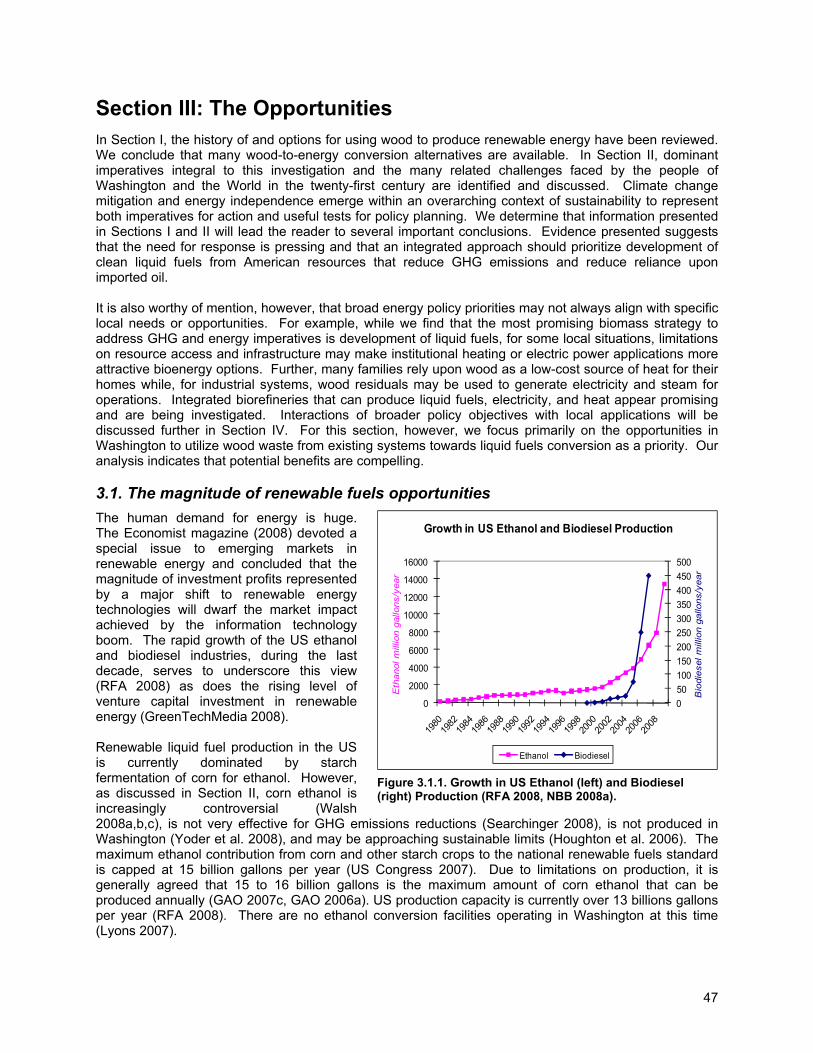
47
Section III: The Opportunities In Section I, the history of and options for using wood to produce renewable energy have been reviewed. We conclude that many wood-to-energy conversion alternatives are available. In Section II, dominant imperatives integral to this investigation and the many related challenges faced by the people of Washington and the World in the twenty-first century are identified and discussed. Climate change mitigation and energy independence emerge within an overarching context of sustainability to represent both imperatives for action and useful tests for policy planning. We determine that information presented in Sections I and II will lead the reader to several important conclusions. Evidence presented suggests that the need for response is pressing and that an integrated approach should prioritize development of clean liquid fuels from American resources that reduce GHG emissions and reduce reliance upon imported oil. It is also worthy of mention, however, that broad energy policy priorities may not always align with specific local needs or opportunities. For example, while we find that the most promising biomass strategy to address GHG and energy imperatives is development of liquid fuels, for some local situations, limitations on resource access and infrastructure may make institutional heating or electric power applications more attractive bioenergy options. Further, many families rely upon wood as a low-cost source of heat for their homes while, for industrial systems, wood residuals may be used to generate electricity and steam for operations. Integrated biorefineries that can produce liquid fuels, electricity, and heat appear promising and are being investigated. Interactions of broader policy objectives with local applications will be discussed further in Section IV. For this section, however, we focus primarily on the opportunities in Washington to utilize wood waste from existing systems towards liquid fuels conversion as a priority. Our analysis indicates that potential benefits are compelling. 3.1. The magnitude of renewable fuels opportunities The human demand for energy is huge. The Economist magazine (2008) devoted a special issue to emerging markets in renewable energy and concluded that the magnitude of investment profits represented by a major shift to renewable energy technologies will dwarf the market impact achieved by the information technology boom. The rapid growth of the US ethanol and biodiesel industries, during the last decade, serves to underscore this view (RFA 2008) as does the rising level of venture capital investment in renewable energy (GreenTechMedia 2008). Renewable liquid fuel production in the US is currently dominated by starch fermentation of corn for ethanol. However, as discussed in Section II, corn ethanol is increasingly controversial (Walsh 2008a,b,c), is not very effective for GHG emissions reductions (Searchinger 2008), is not produced in Washington (Yoder et al. 2008), and may be approaching sustainable limits (Houghton et al. 2006). The maximum ethanol contribution from corn and other starch crops to the national renewable fuels standard is capped at 15 billion gallons per year (US Congress 2007). Due to limitations on production, it is generally agreed that 15 to 16 billion gallons is the maximum amount of corn ethanol that can be produced annually (GAO 2007c, GAO 2006a). US production capacity is currently over 13 billions gallons per year (RFA 2008). There are no ethanol conversion facilities operating in Washington at this time (Lyons 2007).
Figure 3.1.1. Growth in US Ethanol (left) and Biodiesel (right) Production (RFA 2008, NBB 2008a).
050100150200250300350400450500
0
2000
4000
6000
8000
10000
12000
14000
16000
Bio
dies
el m
illio
n ga
llons
/yea
r
Eth
anol
mill
ion
gallo
ns/y
ear
Growth in US Ethanol and Biodiesel Production
Ethanol Biodiesel
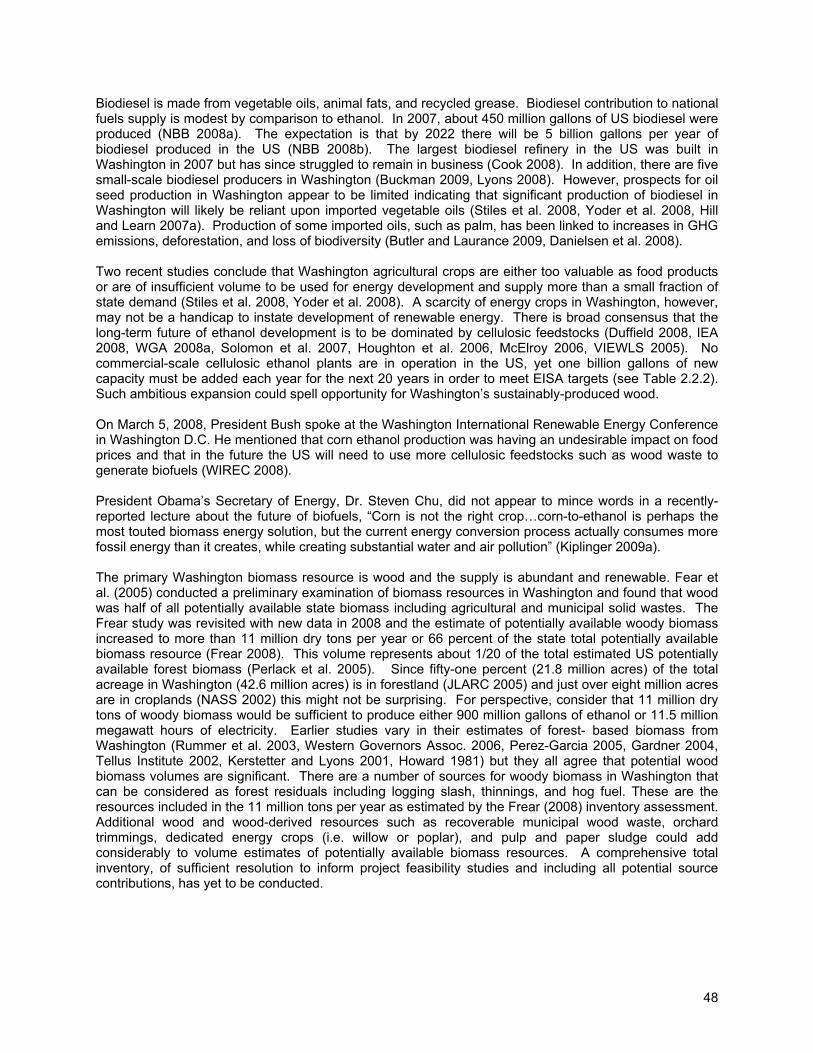
48
Biodiesel is made from vegetable oils, animal fats, and recycled grease. Biodiesel contribution to national fuels supply is modest by comparison to ethanol. In 2007, about 450 million gallons of US biodiesel were produced (NBB 2008a). The expectation is that by 2022 there will be 5 billion gallons per year of biodiesel produced in the US (NBB 2008b). The largest biodiesel refinery in the US was built in Washington in 2007 but has since struggled to remain in business (Cook 2008). In addition, there are five small-scale biodiesel producers in Washington (Buckman 2009, Lyons 2008). However, prospects for oil seed production in Washington appear to be limited indicating that significant production of biodiesel in Washington will likely be reliant upon imported vegetable oils (Stiles et al. 2008, Yoder et al. 2008, Hill and Learn 2007a). Production of some imported oils, such as palm, has been linked to increases in GHG emissions, deforestation, and loss of biodiversity (Butler and Laurance 2009, Danielsen et al. 2008). Two recent studies conclude that Washington agricultural crops are either too valuable as food products or are of insufficient volume to be used for energy development and supply more than a small fraction of state demand (Stiles et al. 2008, Yoder et al. 2008). A scarcity of energy crops in Washington, however, may not be a handicap to instate development of renewable energy. There is broad consensus that the long-term future of ethanol development is to be dominated by cellulosic feedstocks (Duffield 2008, IEA 2008, WGA 2008a, Solomon et al. 2007, Houghton et al. 2006, McElroy 2006, VIEWLS 2005). No commercial-scale cellulosic ethanol plants are in operation in the US, yet one billion gallons of new capacity must be added each year for the next 20 years in order to meet EISA targets (see Table 2.2.2). Such ambitious expansion could spell opportunity for Washington’s sustainably-produced wood. On March 5, 2008, President Bush spoke at the Washington International Renewable Energy Conference in Washington D.C. He mentioned that corn ethanol production was having an undesirable impact on food prices and that in the future the US will need to use more cellulosic feedstocks such as wood waste to generate biofuels (WIREC 2008). President Obama’s Secretary of Energy, Dr. Steven Chu, did not appear to mince words in a recently-reported lecture about the future of biofuels, “Corn is not the right crop…corn-to-ethanol is perhaps the most touted biomass energy solution, but the current energy conversion process actually consumes more fossil energy than it creates, while creating substantial water and air pollution” (Kiplinger 2009a). The primary Washington biomass resource is wood and the supply is abundant and renewable. Fear et al. (2005) conducted a preliminary examination of biomass resources in Washington and found that wood was half of all potentially available state biomass including agricultural and municipal solid wastes. The Frear study was revisited with new data in 2008 and the estimate of potentially available woody biomass increased to more than 11 million dry tons per year or 66 percent of the state total potentially available biomass resource (Frear 2008). This volume represents about 1/20 of the total estimated US potentially available forest biomass (Perlack et al. 2005). Since fifty-one percent (21.8 million acres) of the total acreage in Washington (42.6 million acres) is in forestland (JLARC 2005) and just over eight million acres are in croplands (NASS 2002) this might not be surprising. For perspective, consider that 11 million dry tons of woody biomass would be sufficient to produce either 900 million gallons of ethanol or 11.5 million megawatt hours of electricity. Earlier studies vary in their estimates of forest- based biomass from Washington (Rummer et al. 2003, Western Governors Assoc. 2006, Perez-Garcia 2005, Gardner 2004, Tellus Institute 2002, Kerstetter and Lyons 2001, Howard 1981) but they all agree that potential wood biomass volumes are significant. There are a number of sources for woody biomass in Washington that can be considered as forest residuals including logging slash, thinnings, and hog fuel. These are the resources included in the 11 million tons per year as estimated by the Frear (2008) inventory assessment. Additional wood and wood-derived resources such as recoverable municipal wood waste, orchard trimmings, dedicated energy crops (i.e. willow or poplar), and pulp and paper sludge could add considerably to volume estimates of potentially available biomass resources. A comprehensive total inventory, of sufficient resolution to inform project feasibility studies and including all potential source contributions, has yet to be conducted.
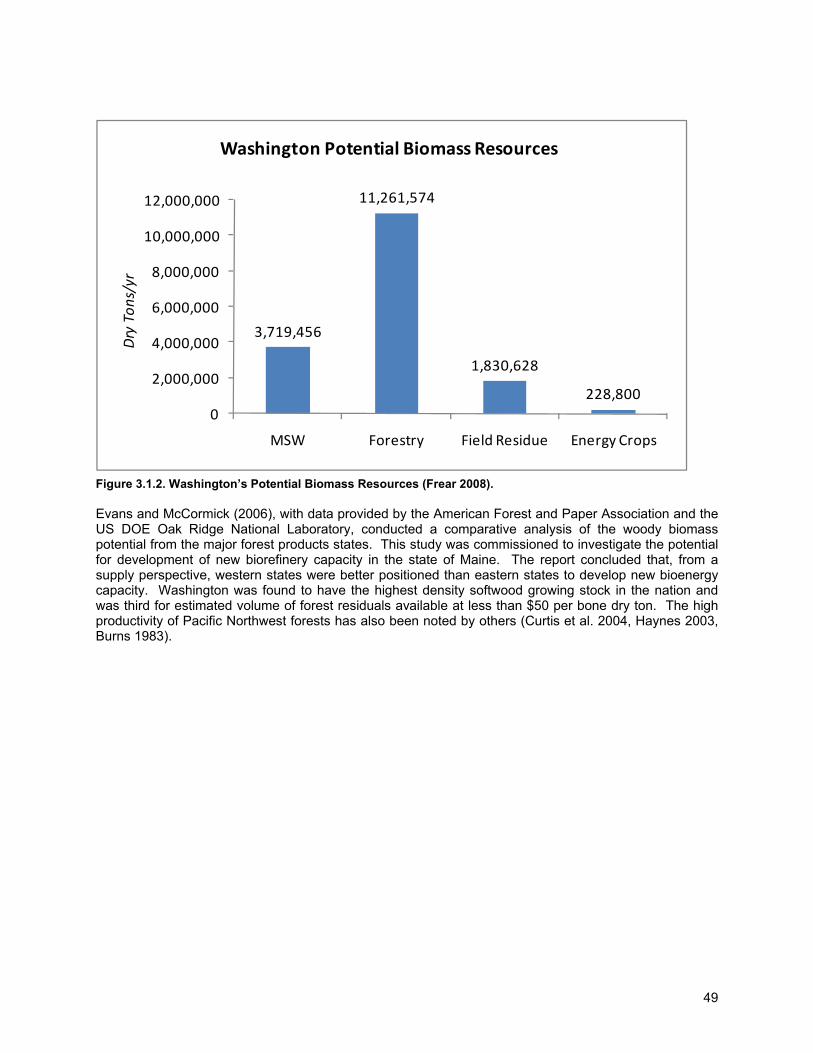
49
Figure 3.1.2. Washington’s Potential Biomass Resources (Frear 2008). Evans and McCormick (2006), with data provided by the American Forest and Paper Association and the US DOE Oak Ridge National Laboratory, conducted a comparative analysis of the woody biomass potential from the major forest products states. This study was commissioned to investigate the potential for development of new biorefinery capacity in the state of Maine. The report concluded that, from a supply perspective, western states were better positioned than eastern states to develop new bioenergy capacity. Washington was found to have the highest density softwood growing stock in the nation and was third for estimated volume of forest residuals available at less than $50 per bone dry ton. The high productivity of Pacific Northwest forests has also been noted by others (Curtis et al. 2004, Haynes 2003, Burns 1983).
3,719,456
11,261,574
1,830,628
228,8000
2,000,000
4,000,000
6,000,000
8,000,000
10,000,000
12,000,000
MSW Forestry Field Residue Energy Crops
Dry Ton
s/yr
Washington Potential Biomass Resources
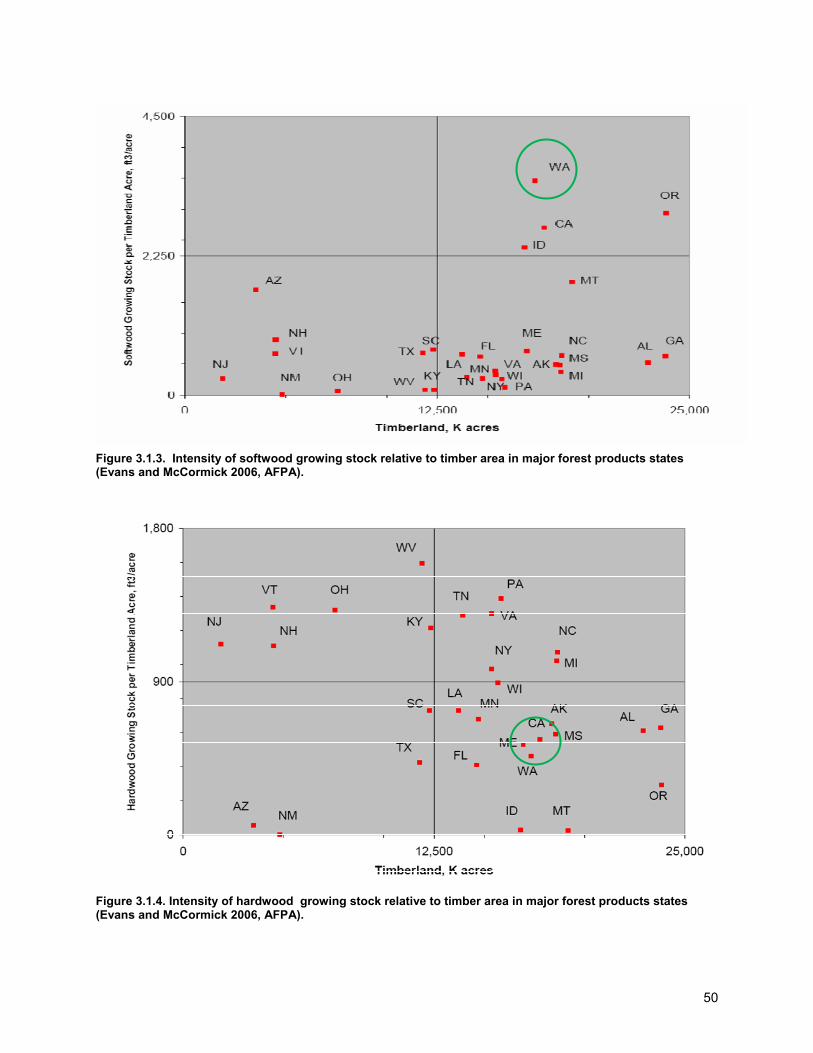
50
Figure 3.1.3. Intensity of softwood growing stock relative to timber area in major forest products states (Evans and McCormick 2006, AFPA). Figure 3.1.4. Intensity of hardwood growing stock relative to timber area in major forest products states (Evans and McCormick 2006, AFPA).
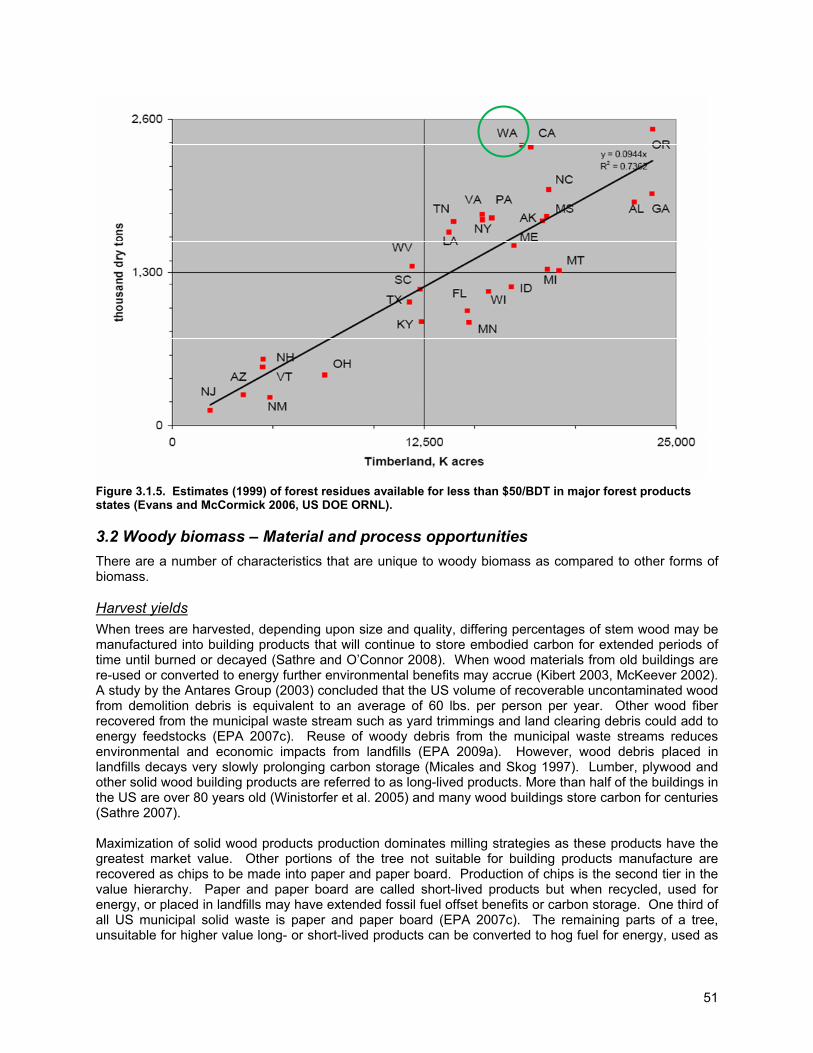
51
Figure 3.1.5. Estimates (1999) of forest residues available for less than $50/BDT in major forest products states (Evans and McCormick 2006, US DOE ORNL). 3.2 Woody biomass – Material and process opportunities There are a number of characteristics that are unique to woody biomass as compared to other forms of biomass. Harvest yields When trees are harvested, depending upon size and quality, differing percentages of stem wood may be manufactured into building products that will continue to store embodied carbon for extended periods of time until burned or decayed (Sathre and O’Connor 2008). When wood materials from old buildings are re-used or converted to energy further environmental benefits may accrue (Kibert 2003, McKeever 2002). A study by the Antares Group (2003) concluded that the US volume of recoverable uncontaminated wood from demolition debris is equivalent to an average of 60 lbs. per person per year. Other wood fiber recovered from the municipal waste stream such as yard trimmings and land clearing debris could add to energy feedstocks (EPA 2007c). Reuse of woody debris from the municipal waste streams reduces environmental and economic impacts from landfills (EPA 2009a). However, wood debris placed in landfills decays very slowly prolonging carbon storage (Micales and Skog 1997). Lumber, plywood and other solid wood building products are referred to as long-lived products. More than half of the buildings in the US are over 80 years old (Winistorfer et al. 2005) and many wood buildings store carbon for centuries (Sathre 2007). Maximization of solid wood products production dominates milling strategies as these products have the greatest market value. Other portions of the tree not suitable for building products manufacture are recovered as chips to be made into paper and paper board. Production of chips is the second tier in the value hierarchy. Paper and paper board are called short-lived products but when recycled, used for energy, or placed in landfills may have extended fossil fuel offset benefits or carbon storage. One third of all US municipal solid waste is paper and paper board (EPA 2007c). The remaining parts of a tree, unsuitable for higher value long- or short-lived products can be converted to hog fuel for energy, used as
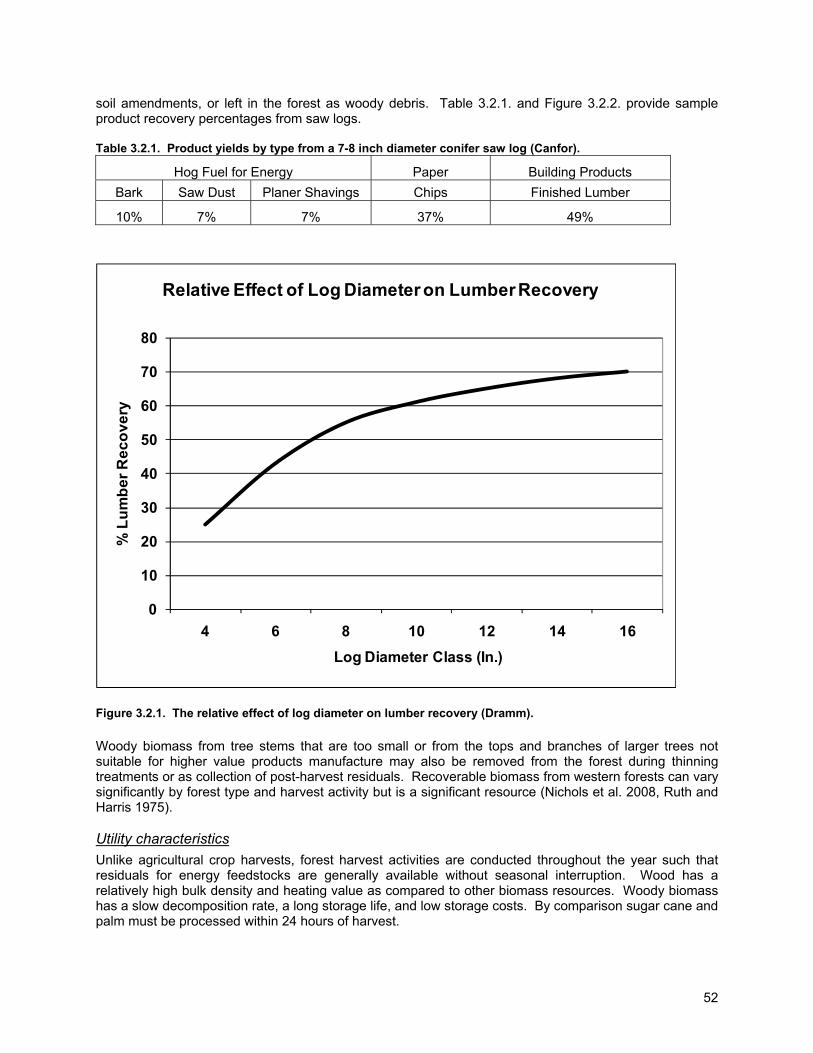
52
soil amendments, or left in the forest as woody debris. Table 3.2.1. and Figure 3.2.2. provide sample product recovery percentages from saw logs. Table 3.2.1. Product yields by type from a 7-8 inch diameter conifer saw log (Canfor).
Hog Fuel for Energy Paper Building Products Bark Saw Dust Planer Shavings Chips Finished Lumber
10% 7% 7% 37% 49%
Figure 3.2.1. The relative effect of log diameter on lumber recovery (Dramm). Woody biomass from tree stems that are too small or from the tops and branches of larger trees not suitable for higher value products manufacture may also be removed from the forest during thinning treatments or as collection of post-harvest residuals. Recoverable biomass from western forests can vary significantly by forest type and harvest activity but is a significant resource (Nichols et al. 2008, Ruth and Harris 1975). Utility characteristics Unlike agricultural crop harvests, forest harvest activities are conducted throughout the year such that residuals for energy feedstocks are generally available without seasonal interruption. Wood has a relatively high bulk density and heating value as compared to other biomass resources. Woody biomass has a slow decomposition rate, a long storage life, and low storage costs. By comparison sugar cane and palm must be processed within 24 hours of harvest.
0
10
20
30
40
50
60
70
80
4 6 8 10 12 14 16
% L
umbe
r Rec
over
y
Log Diameter Class (In.)
Relative Effect of Log Diameter on Lumber Recovery
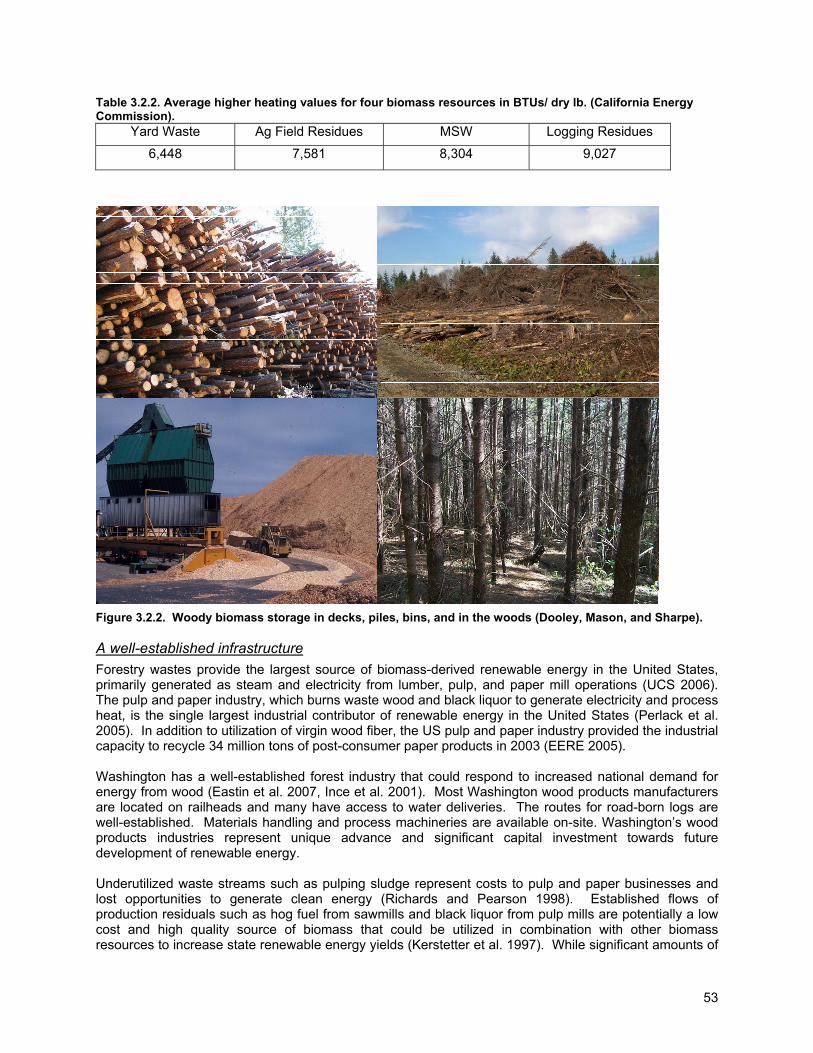
53
Table 3.2.2. Average higher heating values for four biomass resources in BTUs/ dry lb. (California Energy Commission).
Yard Waste Ag Field Residues MSW Logging Residues
6,448 7,581 8,304 9,027
Figure 3.2.2. Woody biomass storage in decks, piles, bins, and in the woods (Dooley, Mason, and Sharpe). A well-established infrastructure Forestry wastes provide the largest source of biomass-derived renewable energy in the United States, primarily generated as steam and electricity from lumber, pulp, and paper mill operations (UCS 2006). The pulp and paper industry, which burns waste wood and black liquor to generate electricity and process heat, is the single largest industrial contributor of renewable energy in the United States (Perlack et al. 2005). In addition to utilization of virgin wood fiber, the US pulp and paper industry provided the industrial capacity to recycle 34 million tons of post-consumer paper products in 2003 (EERE 2005). Washington has a well-established forest industry that could respond to increased national demand for energy from wood (Eastin et al. 2007, Ince et al. 2001). Most Washington wood products manufacturers are located on railheads and many have access to water deliveries. The routes for road-born logs are well-established. Materials handling and process machineries are available on-site. Washington’s wood products industries represent unique advance and significant capital investment towards future development of renewable energy. Underutilized waste streams such as pulping sludge represent costs to pulp and paper businesses and lost opportunities to generate clean energy (Richards and Pearson 1998). Established flows of production residuals such as hog fuel from sawmills and black liquor from pulp mills are potentially a low cost and high quality source of biomass that could be utilized in combination with other biomass resources to increase state renewable energy yields (Kerstetter et al. 1997). While significant amounts of
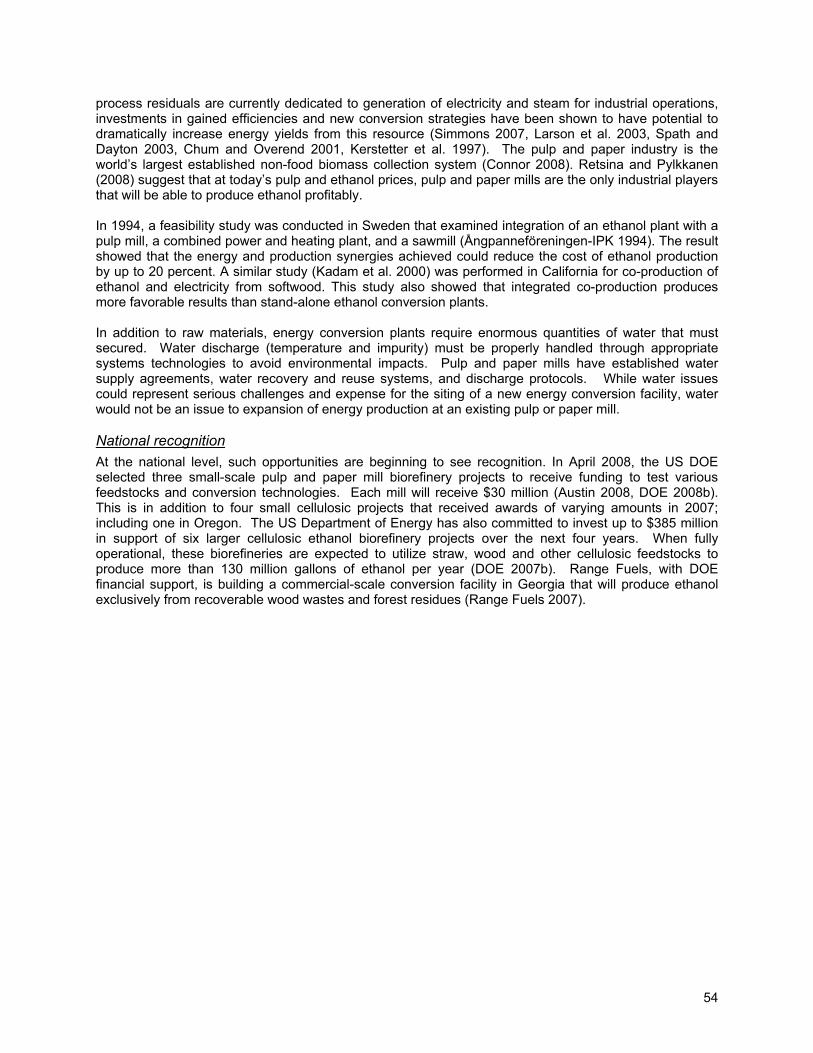
54
process residuals are currently dedicated to generation of electricity and steam for industrial operations, investments in gained efficiencies and new conversion strategies have been shown to have potential to dramatically increase energy yields from this resource (Simmons 2007, Larson et al. 2003, Spath and Dayton 2003, Chum and Overend 2001, Kerstetter et al. 1997). The pulp and paper industry is the world’s largest established non-food biomass collection system (Connor 2008). Retsina and Pylkkanen (2008) suggest that at today’s pulp and ethanol prices, pulp and paper mills are the only industrial players that will be able to produce ethanol profitably. In 1994, a feasibility study was conducted in Sweden that examined integration of an ethanol plant with a pulp mill, a combined power and heating plant, and a sawmill (Ångpanneföreningen-IPK 1994). The result showed that the energy and production synergies achieved could reduce the cost of ethanol production by up to 20 percent. A similar study (Kadam et al. 2000) was performed in California for co-production of ethanol and electricity from softwood. This study also showed that integrated co-production produces more favorable results than stand-alone ethanol conversion plants. In addition to raw materials, energy conversion plants require enormous quantities of water that must secured. Water discharge (temperature and impurity) must be properly handled through appropriate systems technologies to avoid environmental impacts. Pulp and paper mills have established water supply agreements, water recovery and reuse systems, and discharge protocols. While water issues could represent serious challenges and expense for the siting of a new energy conversion facility, water would not be an issue to expansion of energy production at an existing pulp or paper mill. National recognition At the national level, such opportunities are beginning to see recognition. In April 2008, the US DOE selected three small-scale pulp and paper mill biorefinery projects to receive funding to test various feedstocks and conversion technologies. Each mill will receive $30 million (Austin 2008, DOE 2008b). This is in addition to four small cellulosic projects that received awards of varying amounts in 2007; including one in Oregon. The US Department of Energy has also committed to invest up to $385 million in support of six larger cellulosic ethanol biorefinery projects over the next four years. When fully operational, these biorefineries are expected to utilize straw, wood and other cellulosic feedstocks to produce more than 130 million gallons of ethanol per year (DOE 2007b). Range Fuels, with DOE financial support, is building a commercial-scale conversion facility in Georgia that will produce ethanol exclusively from recoverable wood wastes and forest residues (Range Fuels 2007).
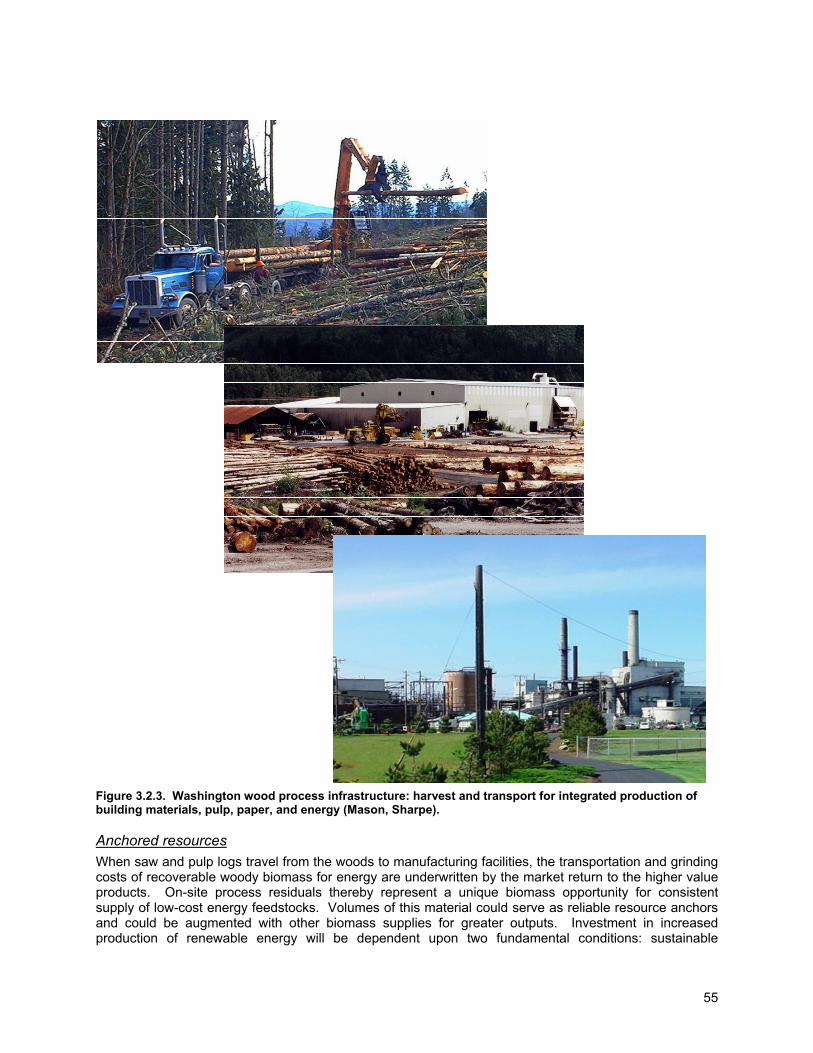
55
Anchored resources When saw and pulp logs travel from the woods to manufacturing facilities, the transportation and grinding costs of recoverable woody biomass for energy are underwritten by the market return to the higher value products. On-site process residuals thereby represent a unique biomass opportunity for consistent supply of low-cost energy feedstocks. Volumes of this material could serve as reliable resource anchors and could be augmented with other biomass supplies for greater outputs. Investment in increased production of renewable energy will be dependent upon two fundamental conditions: sustainable
Figure 3.2.3. Washington wood process infrastructure: harvest and transport for integrated production of building materials, pulp, paper, and energy (Mason, Sharpe).
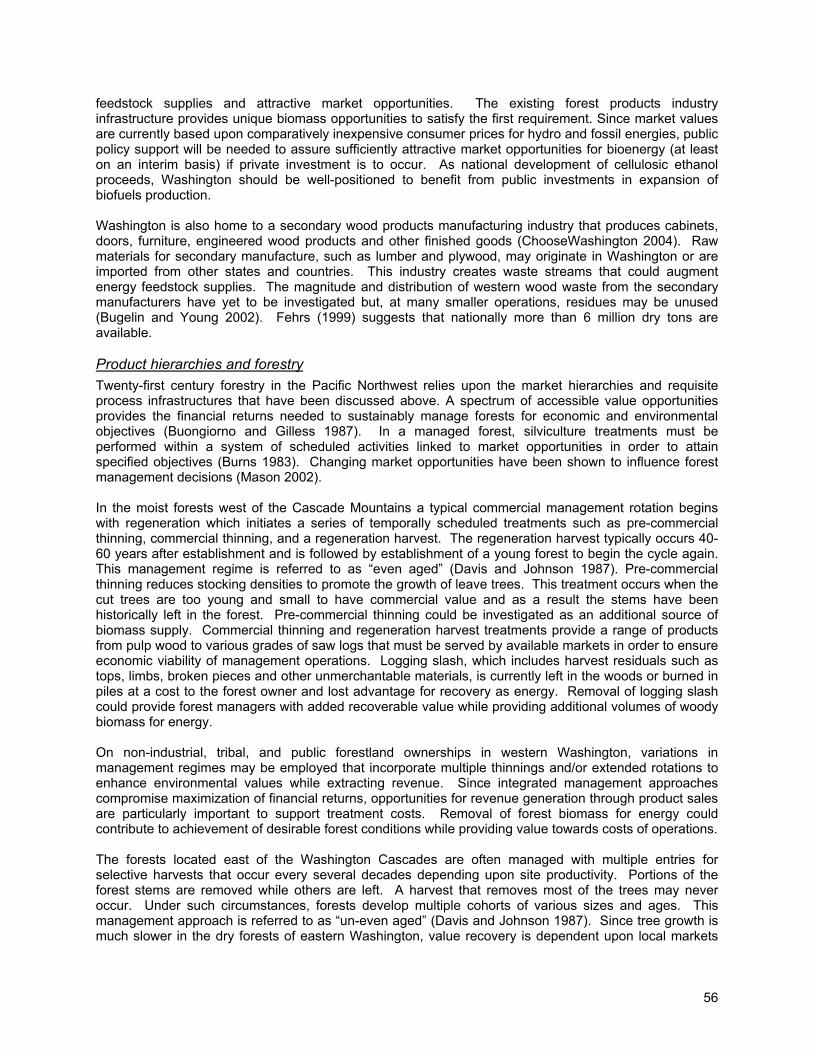
56
feedstock supplies and attractive market opportunities. The existing forest products industry infrastructure provides unique biomass opportunities to satisfy the first requirement. Since market values are currently based upon comparatively inexpensive consumer prices for hydro and fossil energies, public policy support will be needed to assure sufficiently attractive market opportunities for bioenergy (at least on an interim basis) if private investment is to occur. As national development of cellulosic ethanol proceeds, Washington should be well-positioned to benefit from public investments in expansion of biofuels production. Washington is also home to a secondary wood products manufacturing industry that produces cabinets, doors, furniture, engineered wood products and other finished goods (ChooseWashington 2004). Raw materials for secondary manufacture, such as lumber and plywood, may originate in Washington or are imported from other states and countries. This industry creates waste streams that could augment energy feedstock supplies. The magnitude and distribution of western wood waste from the secondary manufacturers have yet to be investigated but, at many smaller operations, residues may be unused (Bugelin and Young 2002). Fehrs (1999) suggests that nationally more than 6 million dry tons are available. Product hierarchies and forestry Twenty-first century forestry in the Pacific Northwest relies upon the market hierarchies and requisite process infrastructures that have been discussed above. A spectrum of accessible value opportunities provides the financial returns needed to sustainably manage forests for economic and environmental objectives (Buongiorno and Gilless 1987). In a managed forest, silviculture treatments must be performed within a system of scheduled activities linked to market opportunities in order to attain specified objectives (Burns 1983). Changing market opportunities have been shown to influence forest management decisions (Mason 2002). In the moist forests west of the Cascade Mountains a typical commercial management rotation begins with regeneration which initiates a series of temporally scheduled treatments such as pre-commercial thinning, commercial thinning, and a regeneration harvest. The regeneration harvest typically occurs 40-60 years after establishment and is followed by establishment of a young forest to begin the cycle again. This management regime is referred to as “even aged” (Davis and Johnson 1987). Pre-commercial thinning reduces stocking densities to promote the growth of leave trees. This treatment occurs when the cut trees are too young and small to have commercial value and as a result the stems have been historically left in the forest. Pre-commercial thinning could be investigated as an additional source of biomass supply. Commercial thinning and regeneration harvest treatments provide a range of products from pulp wood to various grades of saw logs that must be served by available markets in order to ensure economic viability of management operations. Logging slash, which includes harvest residuals such as tops, limbs, broken pieces and other unmerchantable materials, is currently left in the woods or burned in piles at a cost to the forest owner and lost advantage for recovery as energy. Removal of logging slash could provide forest managers with added recoverable value while providing additional volumes of woody biomass for energy. On non-industrial, tribal, and public forestland ownerships in western Washington, variations in management regimes may be employed that incorporate multiple thinnings and/or extended rotations to enhance environmental values while extracting revenue. Since integrated management approaches compromise maximization of financial returns, opportunities for revenue generation through product sales are particularly important to support treatment costs. Removal of forest biomass for energy could contribute to achievement of desirable forest conditions while providing value towards costs of operations. The forests located east of the Washington Cascades are often managed with multiple entries for selective harvests that occur every several decades depending upon site productivity. Portions of the forest stems are removed while others are left. A harvest that removes most of the trees may never occur. Under such circumstances, forests develop multiple cohorts of various sizes and ages. This management approach is referred to as “un-even aged” (Davis and Johnson 1987). Since tree growth is much slower in the dry forests of eastern Washington, value recovery is dependent upon local markets
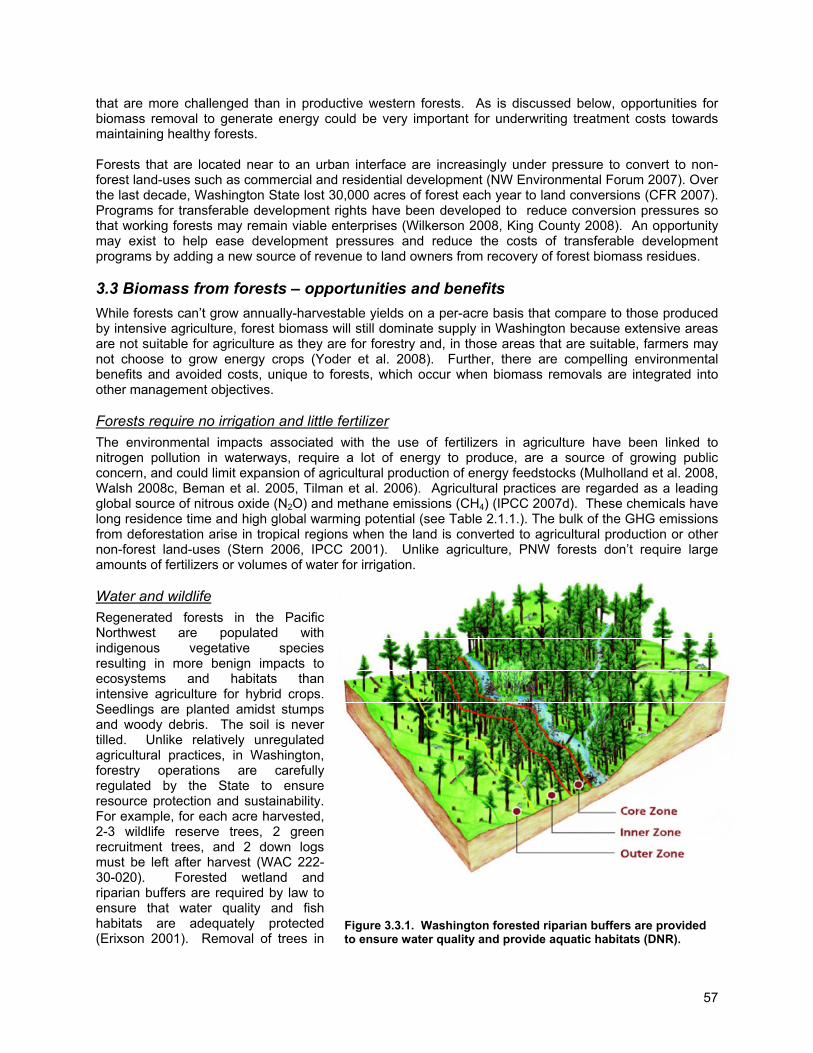
57
that are more challenged than in productive western forests. As is discussed below, opportunities for biomass removal to generate energy could be very important for underwriting treatment costs towards maintaining healthy forests. Forests that are located near to an urban interface are increasingly under pressure to convert to non-forest land-uses such as commercial and residential development (NW Environmental Forum 2007). Over the last decade, Washington State lost 30,000 acres of forest each year to land conversions (CFR 2007). Programs for transferable development rights have been developed to reduce conversion pressures so that working forests may remain viable enterprises (Wilkerson 2008, King County 2008). An opportunity may exist to help ease development pressures and reduce the costs of transferable development programs by adding a new source of revenue to land owners from recovery of forest biomass residues. 3.3 Biomass from forests – opportunities and benefits While forests can’t grow annually-harvestable yields on a per-acre basis that compare to those produced by intensive agriculture, forest biomass will still dominate supply in Washington because extensive areas are not suitable for agriculture as they are for forestry and, in those areas that are suitable, farmers may not choose to grow energy crops (Yoder et al. 2008). Further, there are compelling environmental benefits and avoided costs, unique to forests, which occur when biomass removals are integrated into other management objectives. Forests require no irrigation and little fertilizer The environmental impacts associated with the use of fertilizers in agriculture have been linked to nitrogen pollution in waterways, require a lot of energy to produce, are a source of growing public concern, and could limit expansion of agricultural production of energy feedstocks (Mulholland et al. 2008, Walsh 2008c, Beman et al. 2005, Tilman et al. 2006). Agricultural practices are regarded as a leading global source of nitrous oxide (N2O) and methane emissions (CH4) (IPCC 2007d). These chemicals have long residence time and high global warming potential (see Table 2.1.1.). The bulk of the GHG emissions from deforestation arise in tropical regions when the land is converted to agricultural production or other non-forest land-uses (Stern 2006, IPCC 2001). Unlike agriculture, PNW forests don’t require large amounts of fertilizers or volumes of water for irrigation. Water and wildlife Regenerated forests in the Pacific Northwest are populated with indigenous vegetative species resulting in more benign impacts to ecosystems and habitats than intensive agriculture for hybrid crops. Seedlings are planted amidst stumps and woody debris. The soil is never tilled. Unlike relatively unregulated agricultural practices, in Washington, forestry operations are carefully regulated by the State to ensure resource protection and sustainability. For example, for each acre harvested, 2-3 wildlife reserve trees, 2 green recruitment trees, and 2 down logs must be left after harvest (WAC 222-30-020). Forested wetland and riparian buffers are required by law to ensure that water quality and fish habitats are adequately protected (Erixson 2001). Removal of trees in
Figure 3.3.1. Washington forested riparian buffers are provided to ensure water quality and provide aquatic habitats (DNR).
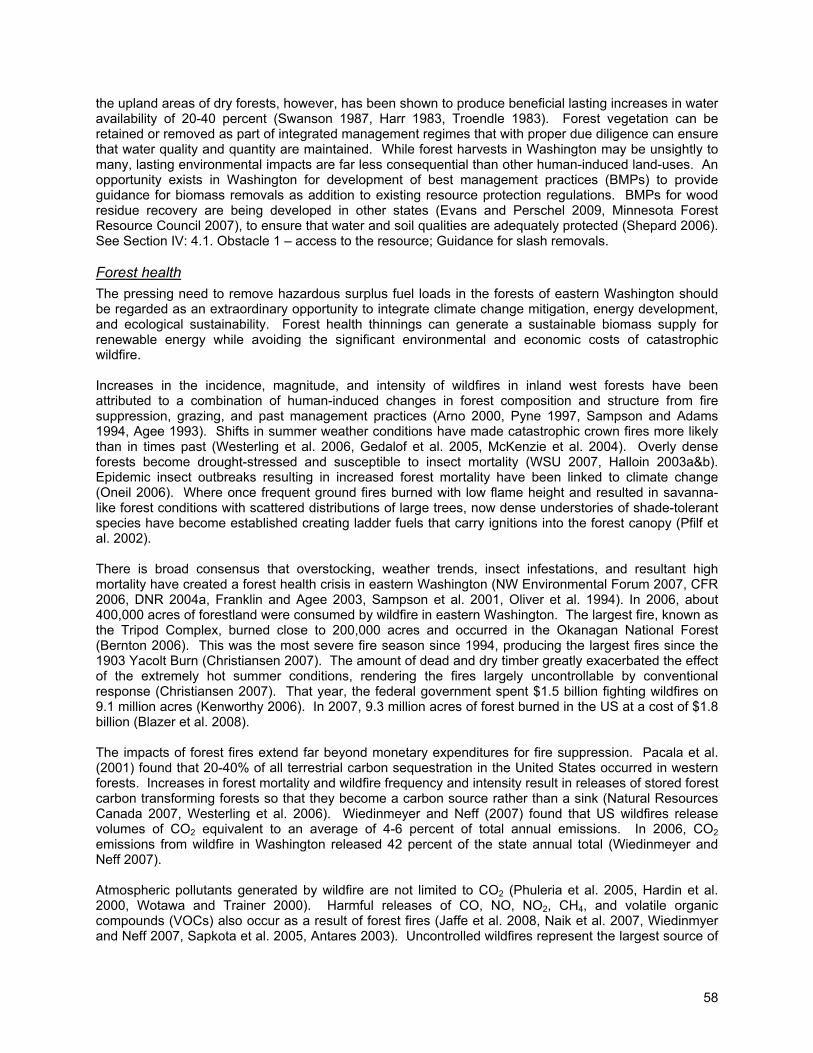
58
the upland areas of dry forests, however, has been shown to produce beneficial lasting increases in water availability of 20-40 percent (Swanson 1987, Harr 1983, Troendle 1983). Forest vegetation can be retained or removed as part of integrated management regimes that with proper due diligence can ensure that water quality and quantity are maintained. While forest harvests in Washington may be unsightly to many, lasting environmental impacts are far less consequential than other human-induced land-uses. An opportunity exists in Washington for development of best management practices (BMPs) to provide guidance for biomass removals as addition to existing resource protection regulations. BMPs for wood residue recovery are being developed in other states (Evans and Perschel 2009, Minnesota Forest Resource Council 2007), to ensure that water and soil qualities are adequately protected (Shepard 2006). See Section IV: 4.1. Obstacle 1 – access to the resource; Guidance for slash removals. Forest health The pressing need to remove hazardous surplus fuel loads in the forests of eastern Washington should be regarded as an extraordinary opportunity to integrate climate change mitigation, energy development, and ecological sustainability. Forest health thinnings can generate a sustainable biomass supply for renewable energy while avoiding the significant environmental and economic costs of catastrophic wildfire. Increases in the incidence, magnitude, and intensity of wildfires in inland west forests have been attributed to a combination of human-induced changes in forest composition and structure from fire suppression, grazing, and past management practices (Arno 2000, Pyne 1997, Sampson and Adams 1994, Agee 1993). Shifts in summer weather conditions have made catastrophic crown fires more likely than in times past (Westerling et al. 2006, Gedalof et al. 2005, McKenzie et al. 2004). Overly dense forests become drought-stressed and susceptible to insect mortality (WSU 2007, Halloin 2003a&b). Epidemic insect outbreaks resulting in increased forest mortality have been linked to climate change (Oneil 2006). Where once frequent ground fires burned with low flame height and resulted in savanna-like forest conditions with scattered distributions of large trees, now dense understories of shade-tolerant species have become established creating ladder fuels that carry ignitions into the forest canopy (Pfilf et al. 2002). There is broad consensus that overstocking, weather trends, insect infestations, and resultant high mortality have created a forest health crisis in eastern Washington (NW Environmental Forum 2007, CFR 2006, DNR 2004a, Franklin and Agee 2003, Sampson et al. 2001, Oliver et al. 1994). In 2006, about 400,000 acres of forestland were consumed by wildfire in eastern Washington. The largest fire, known as the Tripod Complex, burned close to 200,000 acres and occurred in the Okanagan National Forest (Bernton 2006). This was the most severe fire season since 1994, producing the largest fires since the 1903 Yacolt Burn (Christiansen 2007). The amount of dead and dry timber greatly exacerbated the effect of the extremely hot summer conditions, rendering the fires largely uncontrollable by conventional response (Christiansen 2007). That year, the federal government spent $1.5 billion fighting wildfires on 9.1 million acres (Kenworthy 2006). In 2007, 9.3 million acres of forest burned in the US at a cost of $1.8 billion (Blazer et al. 2008). The impacts of forest fires extend far beyond monetary expenditures for fire suppression. Pacala et al. (2001) found that 20-40% of all terrestrial carbon sequestration in the United States occurred in western forests. Increases in forest mortality and wildfire frequency and intensity result in releases of stored forest carbon transforming forests so that they become a carbon source rather than a sink (Natural Resources Canada 2007, Westerling et al. 2006). Wiedinmeyer and Neff (2007) found that US wildfires release volumes of CO2 equivalent to an average of 4-6 percent of total annual emissions. In 2006, CO2 emissions from wildfire in Washington released 42 percent of the state annual total (Wiedinmeyer and Neff 2007). Atmospheric pollutants generated by wildfire are not limited to CO2 (Phuleria et al. 2005, Hardin et al. 2000, Wotawa and Trainer 2000). Harmful releases of CO, NO, NO2, CH4, and volatile organic compounds (VOCs) also occur as a result of forest fires (Jaffe et al. 2008, Naik et al. 2007, Wiedinmyer and Neff 2007, Sapkota et al. 2005, Antares 2003). Uncontrolled wildfires represent the largest source of
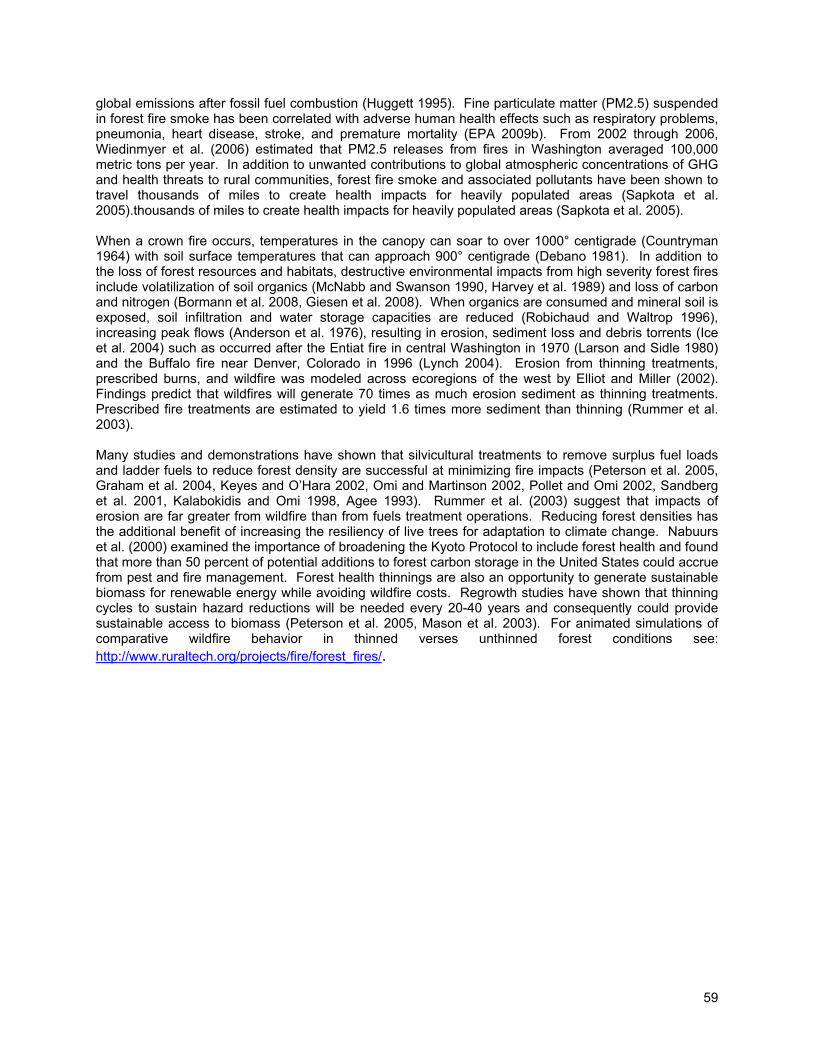
59
global emissions after fossil fuel combustion (Huggett 1995). Fine particulate matter (PM2.5) suspended in forest fire smoke has been correlated with adverse human health effects such as respiratory problems, pneumonia, heart disease, stroke, and premature mortality (EPA 2009b). From 2002 through 2006, Wiedinmyer et al. (2006) estimated that PM2.5 releases from fires in Washington averaged 100,000 metric tons per year. In addition to unwanted contributions to global atmospheric concentrations of GHG and health threats to rural communities, forest fire smoke and associated pollutants have been shown to travel thousands of miles to create health impacts for heavily populated areas (Sapkota et al. 2005).thousands of miles to create health impacts for heavily populated areas (Sapkota et al. 2005). When a crown fire occurs, temperatures in the canopy can soar to over 1000° centigrade (Countryman 1964) with soil surface temperatures that can approach 900° centigrade (Debano 1981). In addition to the loss of forest resources and habitats, destructive environmental impacts from high severity forest fires include volatilization of soil organics (McNabb and Swanson 1990, Harvey et al. 1989) and loss of carbon and nitrogen (Bormann et al. 2008, Giesen et al. 2008). When organics are consumed and mineral soil is exposed, soil infiltration and water storage capacities are reduced (Robichaud and Waltrop 1996), increasing peak flows (Anderson et al. 1976), resulting in erosion, sediment loss and debris torrents (Ice et al. 2004) such as occurred after the Entiat fire in central Washington in 1970 (Larson and Sidle 1980) and the Buffalo fire near Denver, Colorado in 1996 (Lynch 2004). Erosion from thinning treatments, prescribed burns, and wildfire was modeled across ecoregions of the west by Elliot and Miller (2002). Findings predict that wildfires will generate 70 times as much erosion sediment as thinning treatments. Prescribed fire treatments are estimated to yield 1.6 times more sediment than thinning (Rummer et al. 2003). Many studies and demonstrations have shown that silvicultural treatments to remove surplus fuel loads and ladder fuels to reduce forest density are successful at minimizing fire impacts (Peterson et al. 2005, Graham et al. 2004, Keyes and O’Hara 2002, Omi and Martinson 2002, Pollet and Omi 2002, Sandberg et al. 2001, Kalabokidis and Omi 1998, Agee 1993). Rummer et al. (2003) suggest that impacts of erosion are far greater from wildfire than from fuels treatment operations. Reducing forest densities has the additional benefit of increasing the resiliency of live trees for adaptation to climate change. Nabuurs et al. (2000) examined the importance of broadening the Kyoto Protocol to include forest health and found that more than 50 percent of potential additions to forest carbon storage in the United States could accrue from pest and fire management. Forest health thinnings are also an opportunity to generate sustainable biomass for renewable energy while avoiding wildfire costs. Regrowth studies have shown that thinning cycles to sustain hazard reductions will be needed every 20-40 years and consequently could provide sustainable access to biomass (Peterson et al. 2005, Mason et al. 2003). For animated simulations of comparative wildfire behavior in thinned verses unthinned forest conditions see: http://www.ruraltech.org/projects/fire/forest_fires/.
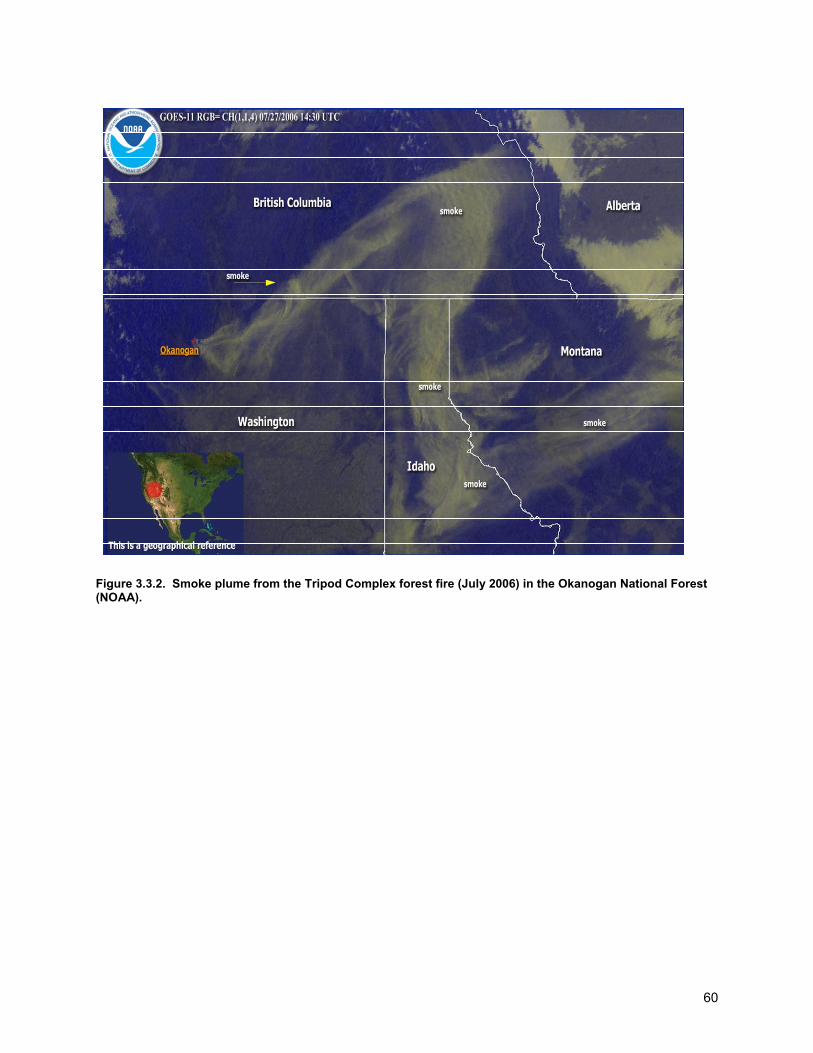
60
Figure 3.3.2. Smoke plume from the Tripod Complex forest fire (July 2006) in the Okanogan National Forest (NOAA).
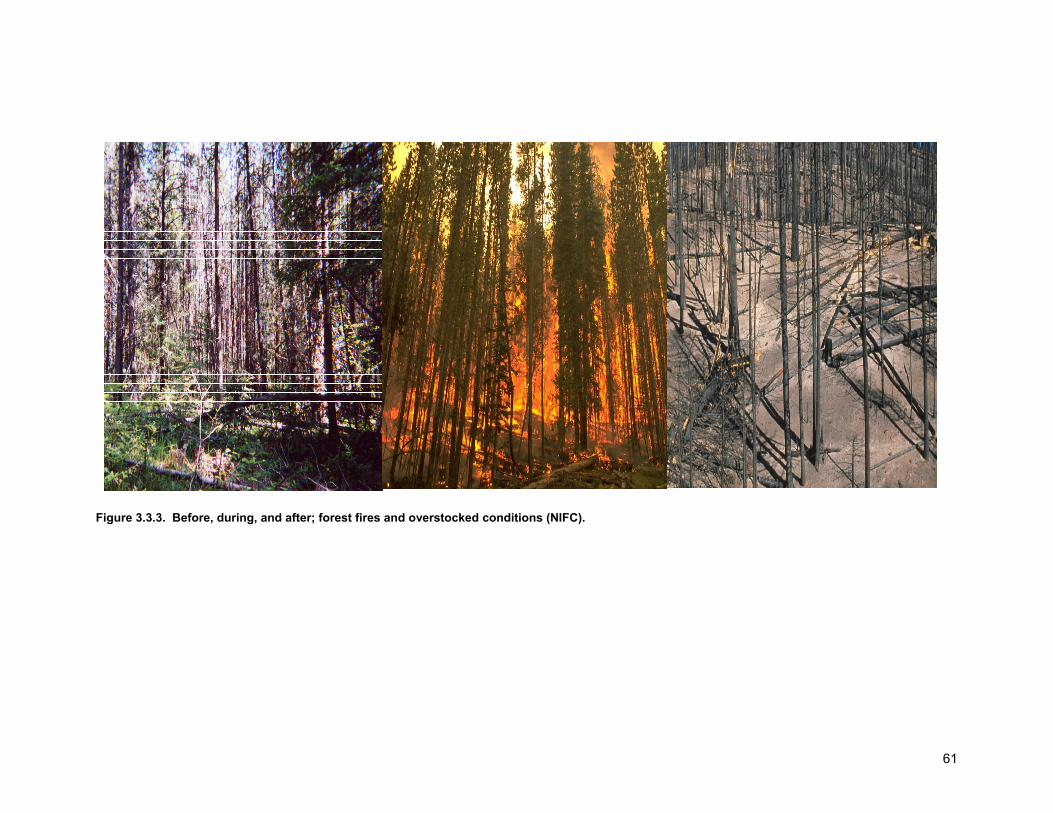
61
Figure 3.3.3. Before, during, and after; forest fires and overstocked conditions (NIFC).
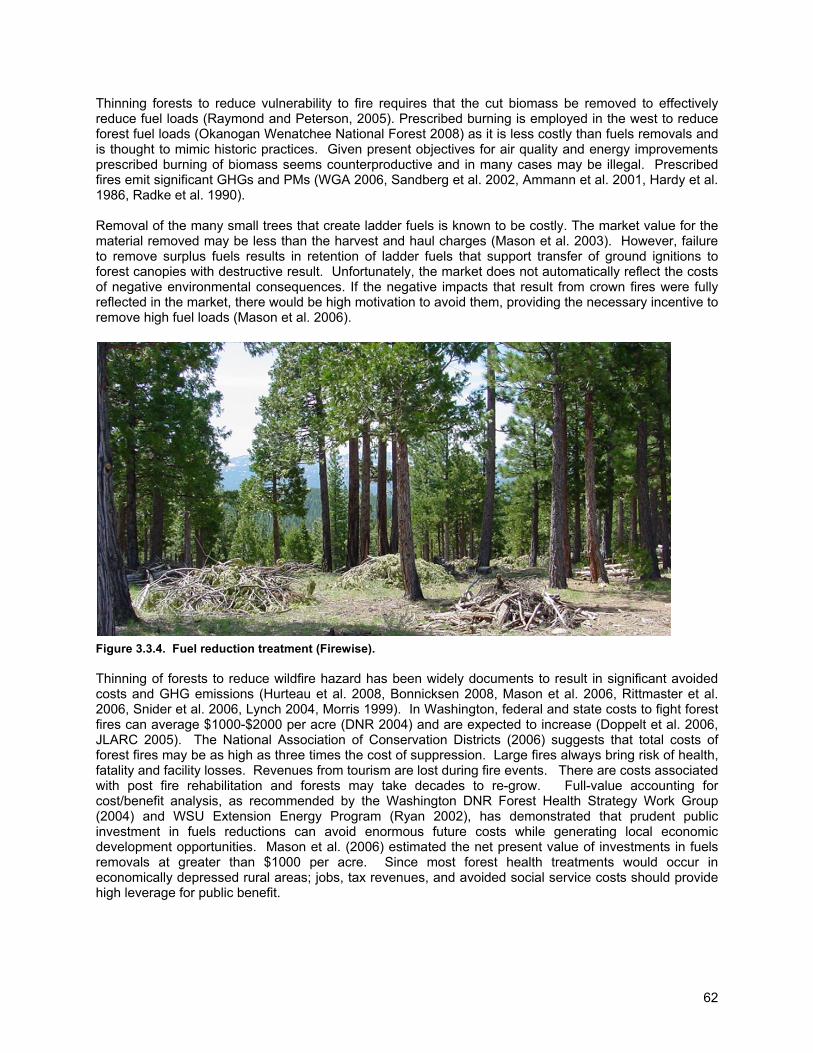
62
Thinning forests to reduce vulnerability to fire requires that the cut biomass be removed to effectively reduce fuel loads (Raymond and Peterson, 2005). Prescribed burning is employed in the west to reduce forest fuel loads (Okanogan Wenatchee National Forest 2008) as it is less costly than fuels removals and is thought to mimic historic practices. Given present objectives for air quality and energy improvements prescribed burning of biomass seems counterproductive and in many cases may be illegal. Prescribed fires emit significant GHGs and PMs (WGA 2006, Sandberg et al. 2002, Ammann et al. 2001, Hardy et al. 1986, Radke et al. 1990). Removal of the many small trees that create ladder fuels is known to be costly. The market value for the material removed may be less than the harvest and haul charges (Mason et al. 2003). However, failure to remove surplus fuels results in retention of ladder fuels that support transfer of ground ignitions to forest canopies with destructive result. Unfortunately, the market does not automatically reflect the costs of negative environmental consequences. If the negative impacts that result from crown fires were fully reflected in the market, there would be high motivation to avoid them, providing the necessary incentive to remove high fuel loads (Mason et al. 2006).
Figure 3.3.4. Fuel reduction treatment (Firewise). Thinning of forests to reduce wildfire hazard has been widely documents to result in significant avoided costs and GHG emissions (Hurteau et al. 2008, Bonnicksen 2008, Mason et al. 2006, Rittmaster et al. 2006, Snider et al. 2006, Lynch 2004, Morris 1999). In Washington, federal and state costs to fight forest fires can average $1000-$2000 per acre (DNR 2004) and are expected to increase (Doppelt et al. 2006, JLARC 2005). The National Association of Conservation Districts (2006) suggests that total costs of forest fires may be as high as three times the cost of suppression. Large fires always bring risk of health, fatality and facility losses. Revenues from tourism are lost during fire events. There are costs associated with post fire rehabilitation and forests may take decades to re-grow. Full-value accounting for cost/benefit analysis, as recommended by the Washington DNR Forest Health Strategy Work Group (2004) and WSU Extension Energy Program (Ryan 2002), has demonstrated that prudent public investment in fuels reductions can avoid enormous future costs while generating local economic development opportunities. Mason et al. (2006) estimated the net present value of investments in fuels removals at greater than $1000 per acre. Since most forest health treatments would occur in economically depressed rural areas; jobs, tax revenues, and avoided social service costs should provide high leverage for public benefit.
63
Biodiversity pathways Opportunities for thinning forests and recovering woody biomass are not limited to eastern Washington. There has been increasing regulatory pressure on public and private forestlands to provide for the ecosystem services associated with old forests. Whether in riparian zones or habitat areas, the result has been that thousands of acres of previously-harvested forestlands have been placed in reserve status and are no longer being managed. The assumptions behind these decisions are now being revisited. Research is indicating that planted young forests may not be able to provide old forest functionality without management to reduce stem densities (Muir et. al. 2002, Rapp 2002, Hunter 2001). These investigations suggest that many of today's young, previously harvested forests may be on developmental pathways that are very different from those that resulted in pre-settlement old forest conditions. Young planted forests, established at high densities in very short time periods with the expectation of pre-commercial and commercial thinnings, are typically uniform and dense with little differentiation. Without density reductions, planted forests eventually evidence suppressed growth, high height to diameter ratios, and short crowns; conditions that have been shown to make stands susceptible to windthrow and inhibit the development of the large trees associated with older forests (Wilson & Oliver 2000). Studies have shown that thinning of younger forests can accelerate the development of old forest characteristics (Acker et. al 1998, Tappeiner et. al. 1997, Carey et al. 1999, Muir et. al. 2002, Bailey & Tappeiner 1998, Garman 2003). Some scientists, environmentalists, and forest managers are recommending more active management in young stands (Curtis et. al. 1998, Franklin et. al. 2002, Carey et. al. 1998, Heiken 2003, Spies et al. 2002). Such management strategies have become known as biodiversity management pathways or biopathways (Carey et al. 1999). Several key features characterize biopathways including periodic thinnings, long rotations, and supplementary attention to legacy features including snags, downed logs, and understory hardwoods (Lippke et al. 2007). Development of “biodiversity pathways” that utilize silvicultural applications to accelerate creation of old forest habitats in western Washington has been well researched but never linked to ancillary benefits such as recovery of biomass for energy feedstocks. Integration of biodiversity enhancement with provision of biomass for energy could provide opportunity for double benefits in western Washington forests. Adaptation and mitigation Climate change and the forest health crisis in eastern Washington have been discussed above. Some scientists are now concluding that there are significant increases in tree mortality of all ages and sizes in the coastal forests of the Pacific Northwest that are positively correlated with increased mean annual temperatures and water deficits (van Mantgem et al. 2009). Cwynar (1987) analyzed pollen samples preserved in a lake bed in the North Cascades that dated back 12,000 years and noted that relatively minor climate changes can have dramatic effect on fire regimes and species distributions. In 2007, the Governmental Accountability Office (GAO 2007b), following an investigation into climate change and the effects on federal lands, produced a report for Congress that found federal lands vulnerable to climate change impacts and that increased forest mortality is already occurring. They recommended that adaptive management is needed but that institutional relationships, historic management paradigms, and lack of guidance constrained response. The US Climate Change Science Program (CCSP 2008b) looked across federal land management agencies and reached similar conclusion: adaptive management that accepts levels of uncertainty is needed to increase the resilience of ecological systems to climate change. They suggest that paths forward will require interventions for adaptations that adjust forest environments towards increasing resiliencies while providing complementary mitigation opportunities to reduce greenhouse gas emissions. Reductions in forest densities that lessen stress sensitivities are regarded as pro-active adaptive management. Use of recovered wood for increasing carbon storage in long-lived wood products and use of biomass for bioenergy to offset fossil fuels are recognized as mitigations (CCSP 2008b). Crisis-response to unplanned consequences of no management was found to be undesirable. Federal agencies are advised to re-examine cultural assumptions about what constitutes protection of ecosystems. Integrated response strategies will provide opportunities for bioenergy development.
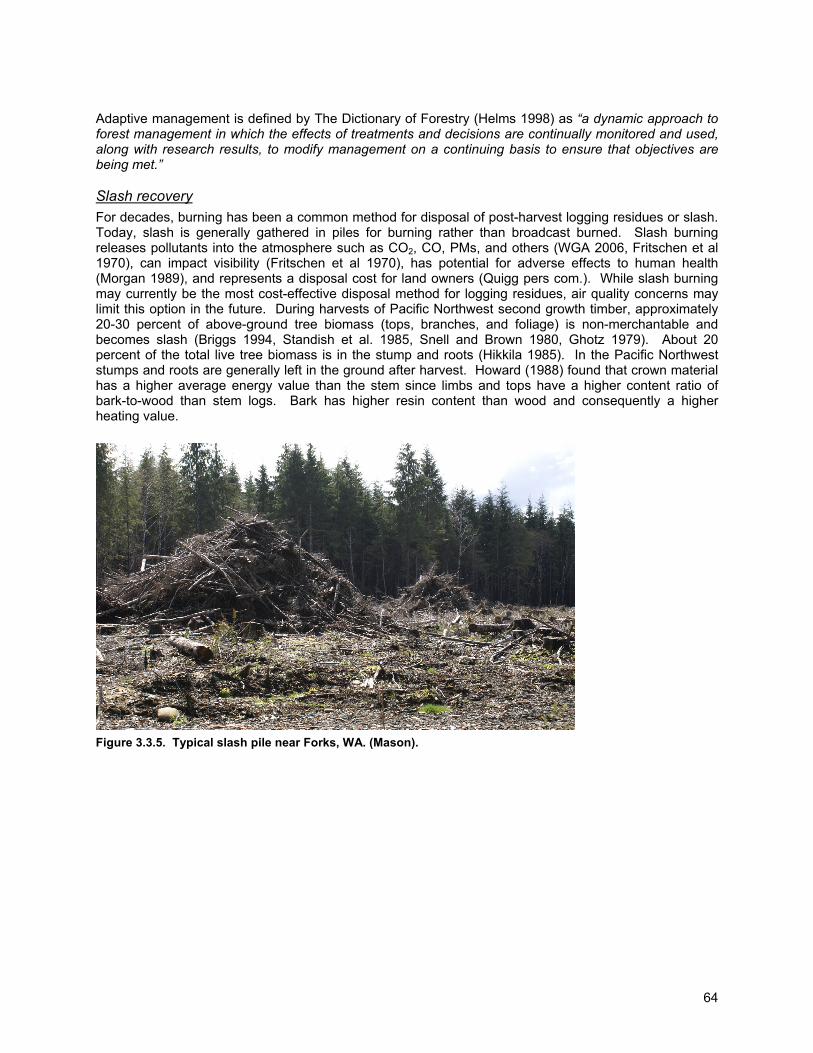
64
Adaptive management is defined by The Dictionary of Forestry (Helms 1998) as “a dynamic approach to forest management in which the effects of treatments and decisions are continually monitored and used, along with research results, to modify management on a continuing basis to ensure that objectives are being met.” Slash recovery For decades, burning has been a common method for disposal of post-harvest logging residues or slash. Today, slash is generally gathered in piles for burning rather than broadcast burned. Slash burning releases pollutants into the atmosphere such as CO2, CO, PMs, and others (WGA 2006, Fritschen et al 1970), can impact visibility (Fritschen et al 1970), has potential for adverse effects to human health (Morgan 1989), and represents a disposal cost for land owners (Quigg pers com.). While slash burning may currently be the most cost-effective disposal method for logging residues, air quality concerns may limit this option in the future. During harvests of Pacific Northwest second growth timber, approximately 20-30 percent of above-ground tree biomass (tops, branches, and foliage) is non-merchantable and becomes slash (Briggs 1994, Standish et al. 1985, Snell and Brown 1980, Ghotz 1979). About 20 percent of the total live tree biomass is in the stump and roots (Hikkila 1985). In the Pacific Northwest stumps and roots are generally left in the ground after harvest. Howard (1988) found that crown material has a higher average energy value than the stem since limbs and tops have a higher content ratio of bark-to-wood than stem logs. Bark has higher resin content than wood and consequently a higher heating value.
Figure 3.3.5. Typical slash pile near Forks, WA. (Mason).
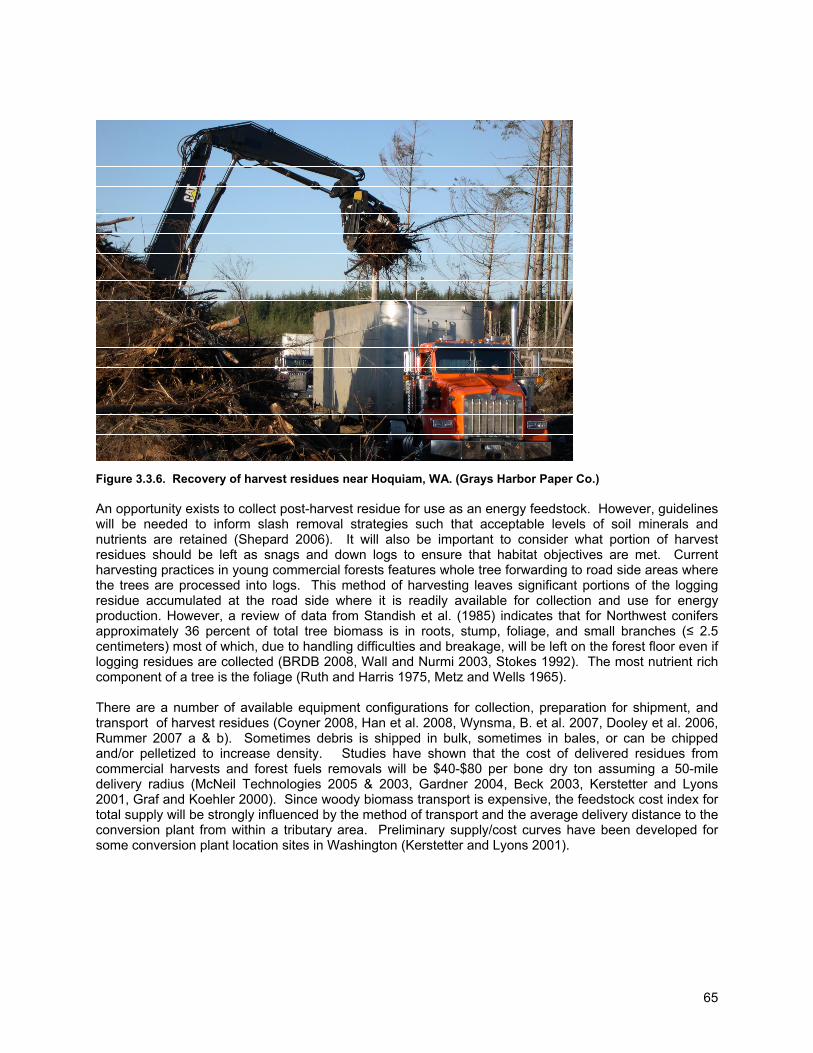
65
Figure 3.3.6. Recovery of harvest residues near Hoquiam, WA. (Grays Harbor Paper Co.) An opportunity exists to collect post-harvest residue for use as an energy feedstock. However, guidelines will be needed to inform slash removal strategies such that acceptable levels of soil minerals and nutrients are retained (Shepard 2006). It will also be important to consider what portion of harvest residues should be left as snags and down logs to ensure that habitat objectives are met. Current harvesting practices in young commercial forests features whole tree forwarding to road side areas where the trees are processed into logs. This method of harvesting leaves significant portions of the logging residue accumulated at the road side where it is readily available for collection and use for energy production. However, a review of data from Standish et al. (1985) indicates that for Northwest conifers approximately 36 percent of total tree biomass is in roots, stump, foliage, and small branches (≤ 2.5 centimeters) most of which, due to handling difficulties and breakage, will be left on the forest floor even if logging residues are collected (BRDB 2008, Wall and Nurmi 2003, Stokes 1992). The most nutrient rich component of a tree is the foliage (Ruth and Harris 1975, Metz and Wells 1965). There are a number of available equipment configurations for collection, preparation for shipment, and transport of harvest residues (Coyner 2008, Han et al. 2008, Wynsma, B. et al. 2007, Dooley et al. 2006, Rummer 2007 a & b). Sometimes debris is shipped in bulk, sometimes in bales, or can be chipped and/or pelletized to increase density. Studies have shown that the cost of delivered residues from commercial harvests and forest fuels removals will be $40-$80 per bone dry ton assuming a 50-mile delivery radius (McNeil Technologies 2005 & 2003, Gardner 2004, Beck 2003, Kerstetter and Lyons 2001, Graf and Koehler 2000). Since woody biomass transport is expensive, the feedstock cost index for total supply will be strongly influenced by the method of transport and the average delivery distance to the conversion plant from within a tributary area. Preliminary supply/cost curves have been developed for some conversion plant location sites in Washington (Kerstetter and Lyons 2001).
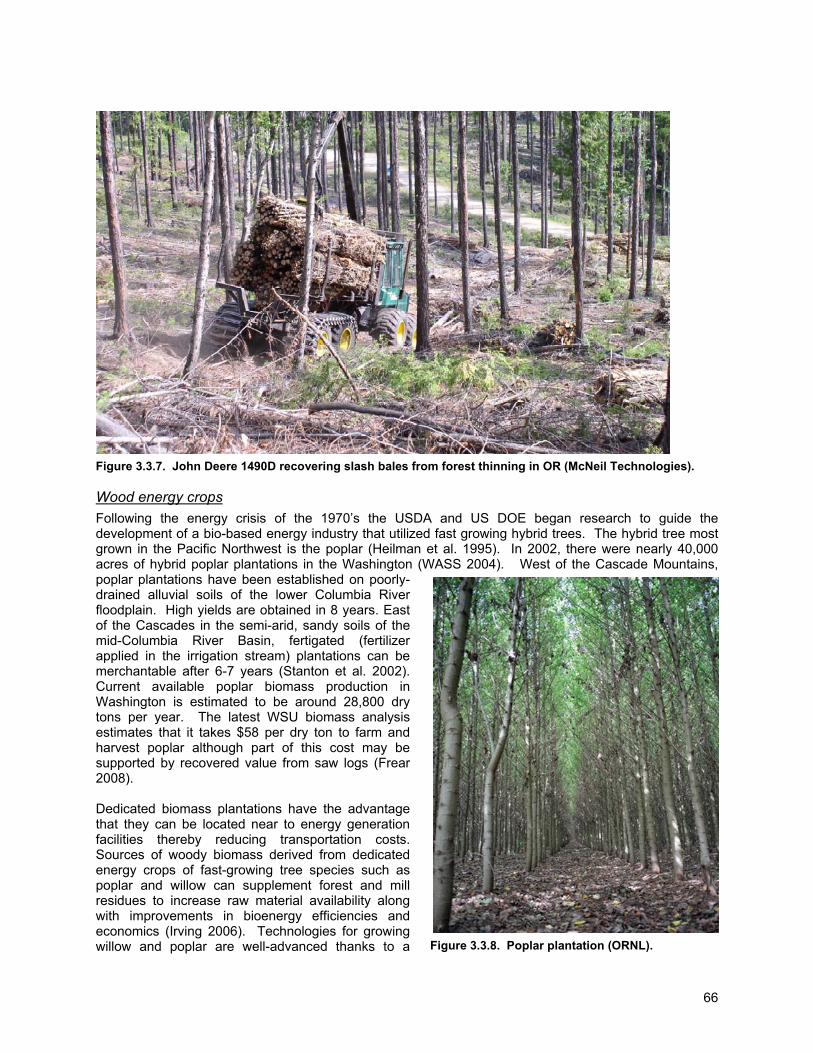
66
Figure 3.3.7. John Deere 1490D recovering slash bales from forest thinning in OR (McNeil Technologies). Wood energy crops Following the energy crisis of the 1970’s the USDA and US DOE began research to guide the development of a bio-based energy industry that utilized fast growing hybrid trees. The hybrid tree most grown in the Pacific Northwest is the poplar (Heilman et al. 1995). In 2002, there were nearly 40,000 acres of hybrid poplar plantations in the Washington (WASS 2004). West of the Cascade Mountains, poplar plantations have been established on poorly-drained alluvial soils of the lower Columbia River floodplain. High yields are obtained in 8 years. East of the Cascades in the semi-arid, sandy soils of the mid-Columbia River Basin, fertigated (fertilizer applied in the irrigation stream) plantations can be merchantable after 6-7 years (Stanton et al. 2002). Current available poplar biomass production in Washington is estimated to be around 28,800 dry tons per year. The latest WSU biomass analysis estimates that it takes $58 per dry ton to farm and harvest poplar although part of this cost may be supported by recovered value from saw logs (Frear 2008). Dedicated biomass plantations have the advantage that they can be located near to energy generation facilities thereby reducing transportation costs. Sources of woody biomass derived from dedicated energy crops of fast-growing tree species such as poplar and willow can supplement forest and mill residues to increase raw material availability along with improvements in bioenergy efficiencies and economics (Irving 2006). Technologies for growing willow and poplar are well-advanced thanks to a Figure 3.3.8. Poplar plantation (ORNL).
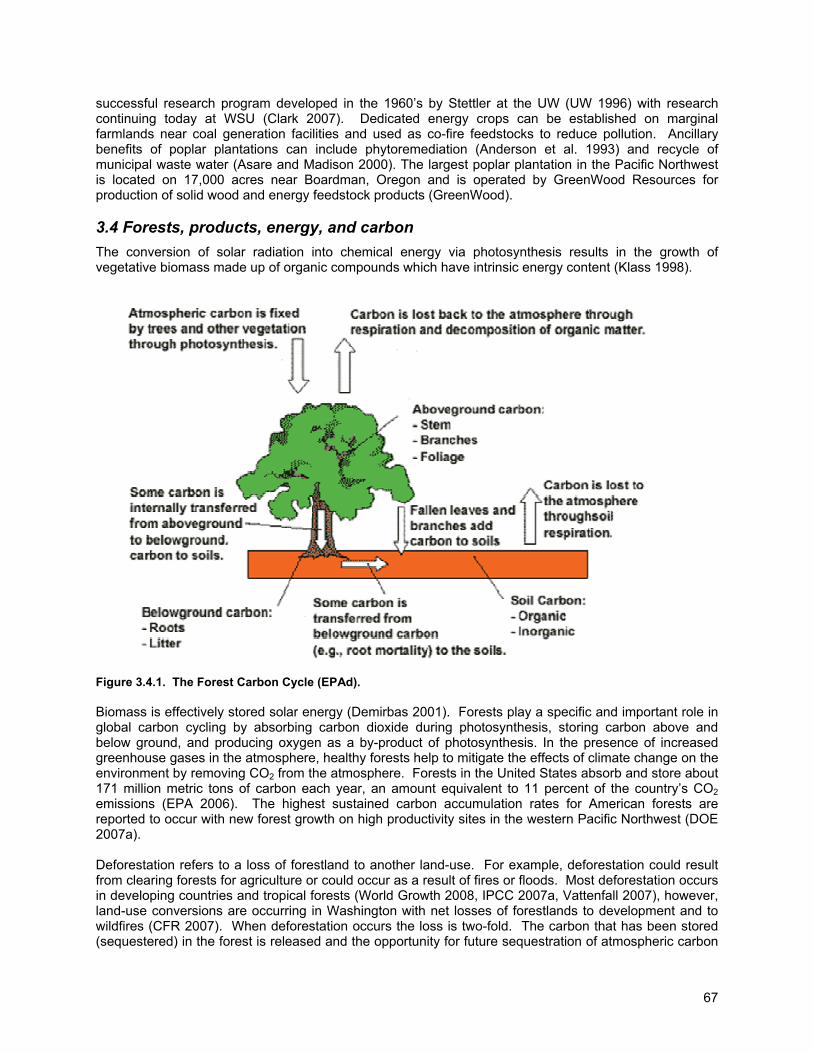
67
successful research program developed in the 1960’s by Stettler at the UW (UW 1996) with research continuing today at WSU (Clark 2007). Dedicated energy crops can be established on marginal farmlands near coal generation facilities and used as co-fire feedstocks to reduce pollution. Ancillary benefits of poplar plantations can include phytoremediation (Anderson et al. 1993) and recycle of municipal waste water (Asare and Madison 2000). The largest poplar plantation in the Pacific Northwest is located on 17,000 acres near Boardman, Oregon and is operated by GreenWood Resources for production of solid wood and energy feedstock products (GreenWood). 3.4 Forests, products, energy, and carbon The conversion of solar radiation into chemical energy via photosynthesis results in the growth of vegetative biomass made up of organic compounds which have intrinsic energy content (Klass 1998).
Figure 3.4.1. The Forest Carbon Cycle (EPAd). Biomass is effectively stored solar energy (Demirbas 2001). Forests play a specific and important role in global carbon cycling by absorbing carbon dioxide during photosynthesis, storing carbon above and below ground, and producing oxygen as a by-product of photosynthesis. In the presence of increased greenhouse gases in the atmosphere, healthy forests help to mitigate the effects of climate change on the environment by removing CO2 from the atmosphere. Forests in the United States absorb and store about 171 million metric tons of carbon each year, an amount equivalent to 11 percent of the country’s CO2 emissions (EPA 2006). The highest sustained carbon accumulation rates for American forests are reported to occur with new forest growth on high productivity sites in the western Pacific Northwest (DOE 2007a). Deforestation refers to a loss of forestland to another land-use. For example, deforestation could result from clearing forests for agriculture or could occur as a result of fires or floods. Most deforestation occurs in developing countries and tropical forests (World Growth 2008, IPCC 2007a, Vattenfall 2007), however, land-use conversions are occurring in Washington with net losses of forestlands to development and to wildfires (CFR 2007). When deforestation occurs the loss is two-fold. The carbon that has been stored (sequestered) in the forest is released and the opportunity for future sequestration of atmospheric carbon
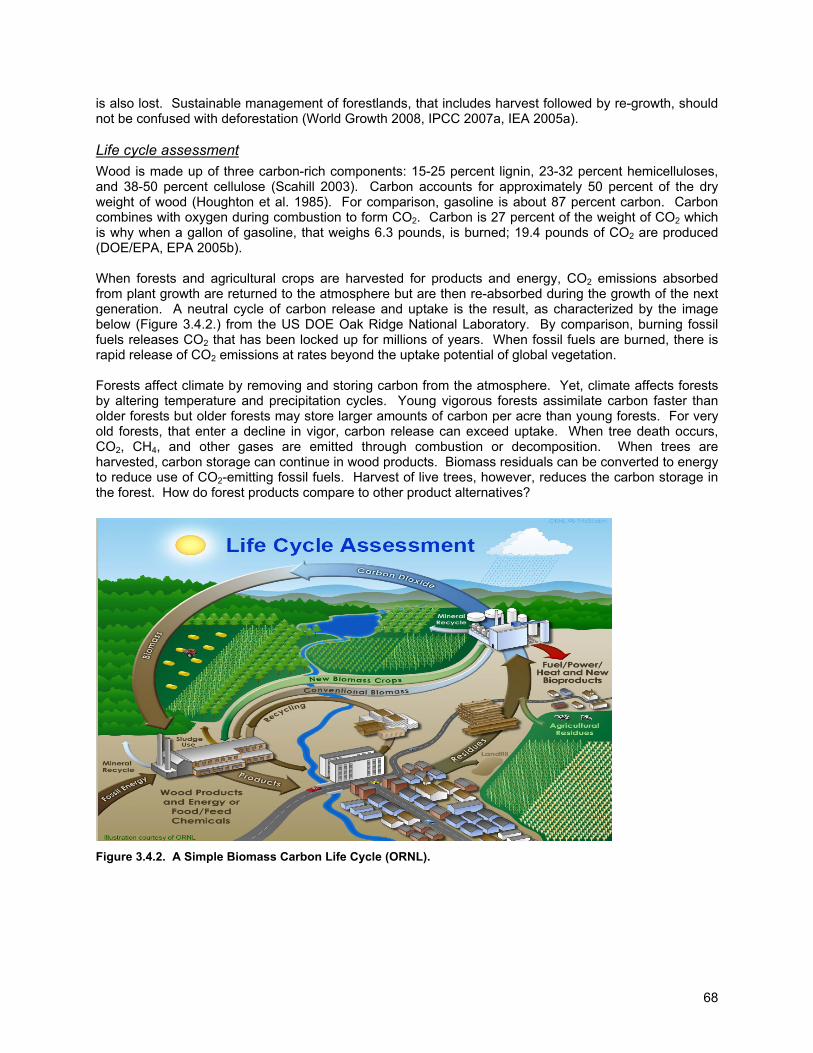
68
is also lost. Sustainable management of forestlands, that includes harvest followed by re-growth, should not be confused with deforestation (World Growth 2008, IPCC 2007a, IEA 2005a). Life cycle assessment Wood is made up of three carbon-rich components: 15-25 percent lignin, 23-32 percent hemicelluloses, and 38-50 percent cellulose (Scahill 2003). Carbon accounts for approximately 50 percent of the dry weight of wood (Houghton et al. 1985). For comparison, gasoline is about 87 percent carbon. Carbon combines with oxygen during combustion to form CO2. Carbon is 27 percent of the weight of CO2 which is why when a gallon of gasoline, that weighs 6.3 pounds, is burned; 19.4 pounds of CO2 are produced (DOE/EPA, EPA 2005b). When forests and agricultural crops are harvested for products and energy, CO2 emissions absorbed from plant growth are returned to the atmosphere but are then re-absorbed during the growth of the next generation. A neutral cycle of carbon release and uptake is the result, as characterized by the image below (Figure 3.4.2.) from the US DOE Oak Ridge National Laboratory. By comparison, burning fossil fuels releases CO2 that has been locked up for millions of years. When fossil fuels are burned, there is rapid release of CO2 emissions at rates beyond the uptake potential of global vegetation. Forests affect climate by removing and storing carbon from the atmosphere. Yet, climate affects forests by altering temperature and precipitation cycles. Young vigorous forests assimilate carbon faster than older forests but older forests may store larger amounts of carbon per acre than young forests. For very old forests, that enter a decline in vigor, carbon release can exceed uptake. When tree death occurs, CO2, CH4, and other gases are emitted through combustion or decomposition. When trees are harvested, carbon storage can continue in wood products. Biomass residuals can be converted to energy to reduce use of CO2-emitting fossil fuels. Harvest of live trees, however, reduces the carbon storage in the forest. How do forest products compare to other product alternatives?
Figure 3.4.2. A Simple Biomass Carbon Life Cycle (ORNL).
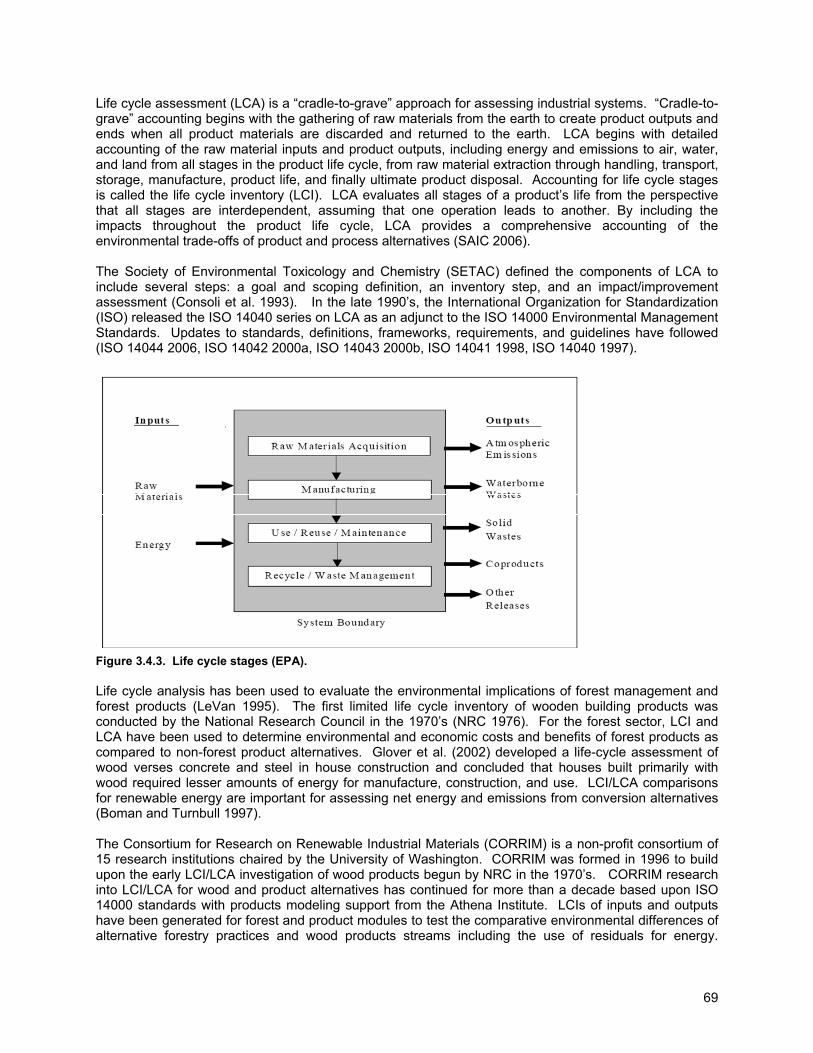
69
Life cycle assessment (LCA) is a “cradle-to-grave” approach for assessing industrial systems. “Cradle-to-grave” accounting begins with the gathering of raw materials from the earth to create product outputs and ends when all product materials are discarded and returned to the earth. LCA begins with detailed accounting of the raw material inputs and product outputs, including energy and emissions to air, water, and land from all stages in the product life cycle, from raw material extraction through handling, transport, storage, manufacture, product life, and finally ultimate product disposal. Accounting for life cycle stages is called the life cycle inventory (LCI). LCA evaluates all stages of a product’s life from the perspective that all stages are interdependent, assuming that one operation leads to another. By including the impacts throughout the product life cycle, LCA provides a comprehensive accounting of the environmental trade-offs of product and process alternatives (SAIC 2006). The Society of Environmental Toxicology and Chemistry (SETAC) defined the components of LCA to include several steps: a goal and scoping definition, an inventory step, and an impact/improvement assessment (Consoli et al. 1993). In the late 1990’s, the International Organization for Standardization (ISO) released the ISO 14040 series on LCA as an adjunct to the ISO 14000 Environmental Management Standards. Updates to standards, definitions, frameworks, requirements, and guidelines have followed (ISO 14044 2006, ISO 14042 2000a, ISO 14043 2000b, ISO 14041 1998, ISO 14040 1997).
Figure 3.4.3. Life cycle stages (EPA). Life cycle analysis has been used to evaluate the environmental implications of forest management and forest products (LeVan 1995). The first limited life cycle inventory of wooden building products was conducted by the National Research Council in the 1970’s (NRC 1976). For the forest sector, LCI and LCA have been used to determine environmental and economic costs and benefits of forest products as compared to non-forest product alternatives. Glover et al. (2002) developed a life-cycle assessment of wood verses concrete and steel in house construction and concluded that houses built primarily with wood required lesser amounts of energy for manufacture, construction, and use. LCI/LCA comparisons for renewable energy are important for assessing net energy and emissions from conversion alternatives (Boman and Turnbull 1997). The Consortium for Research on Renewable Industrial Materials (CORRIM) is a non-profit consortium of 15 research institutions chaired by the University of Washington. CORRIM was formed in 1996 to build upon the early LCI/LCA investigation of wood products begun by NRC in the 1970’s. CORRIM research into LCI/LCA for wood and product alternatives has continued for more than a decade based upon ISO 14000 standards with products modeling support from the Athena Institute. LCIs of inputs and outputs have been generated for forest and product modules to test the comparative environmental differences of alternative forestry practices and wood products streams including the use of residuals for energy.
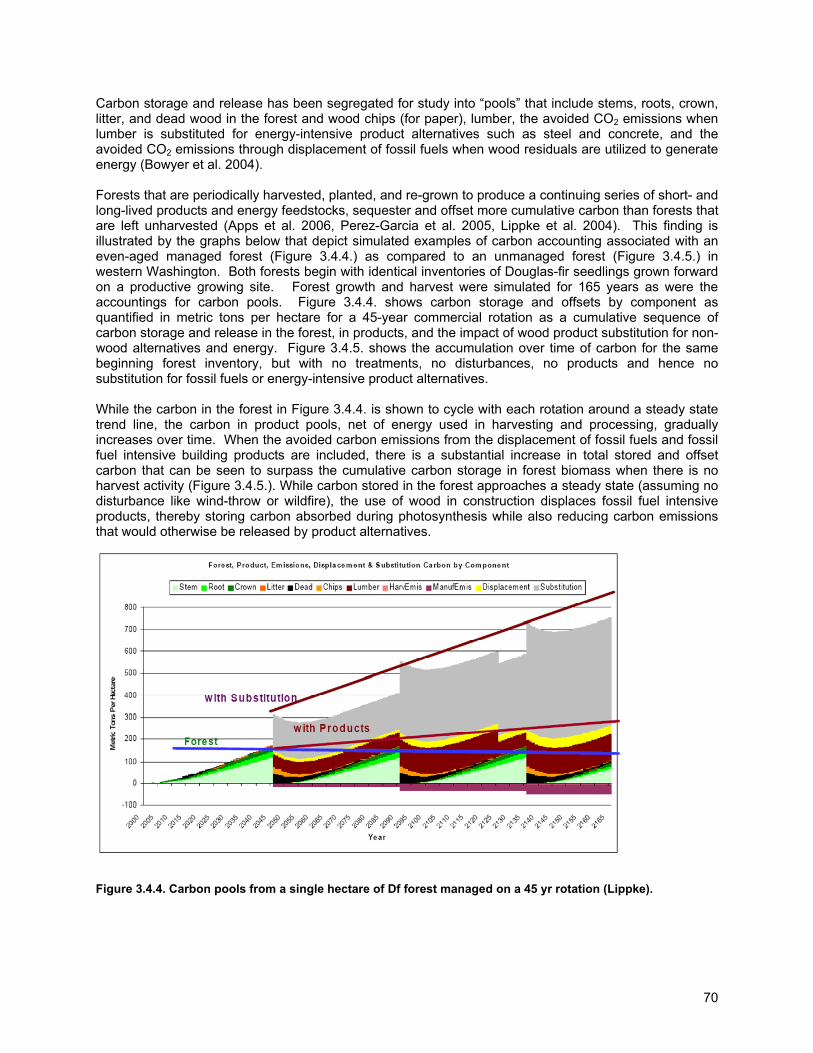
70
Carbon storage and release has been segregated for study into “pools” that include stems, roots, crown, litter, and dead wood in the forest and wood chips (for paper), lumber, the avoided CO2 emissions when lumber is substituted for energy-intensive product alternatives such as steel and concrete, and the avoided CO2 emissions through displacement of fossil fuels when wood residuals are utilized to generate energy (Bowyer et al. 2004). Forests that are periodically harvested, planted, and re-grown to produce a continuing series of short- and long-lived products and energy feedstocks, sequester and offset more cumulative carbon than forests that are left unharvested (Apps et al. 2006, Perez-Garcia et al. 2005, Lippke et al. 2004). This finding is illustrated by the graphs below that depict simulated examples of carbon accounting associated with an even-aged managed forest (Figure 3.4.4.) as compared to an unmanaged forest (Figure 3.4.5.) in western Washington. Both forests begin with identical inventories of Douglas-fir seedlings grown forward on a productive growing site. Forest growth and harvest were simulated for 165 years as were the accountings for carbon pools. Figure 3.4.4. shows carbon storage and offsets by component as quantified in metric tons per hectare for a 45-year commercial rotation as a cumulative sequence of carbon storage and release in the forest, in products, and the impact of wood product substitution for non-wood alternatives and energy. Figure 3.4.5. shows the accumulation over time of carbon for the same beginning forest inventory, but with no treatments, no disturbances, no products and hence no substitution for fossil fuels or energy-intensive product alternatives. While the carbon in the forest in Figure 3.4.4. is shown to cycle with each rotation around a steady state trend line, the carbon in product pools, net of energy used in harvesting and processing, gradually increases over time. When the avoided carbon emissions from the displacement of fossil fuels and fossil fuel intensive building products are included, there is a substantial increase in total stored and offset carbon that can be seen to surpass the cumulative carbon storage in forest biomass when there is no harvest activity (Figure 3.4.5.). While carbon stored in the forest approaches a steady state (assuming no disturbance like wind-throw or wildfire), the use of wood in construction displaces fossil fuel intensive products, thereby storing carbon absorbed during photosynthesis while also reducing carbon emissions that would otherwise be released by product alternatives.
Figure 3.4.4. Carbon pools from a single hectare of Df forest managed on a 45 yr rotation (Lippke).
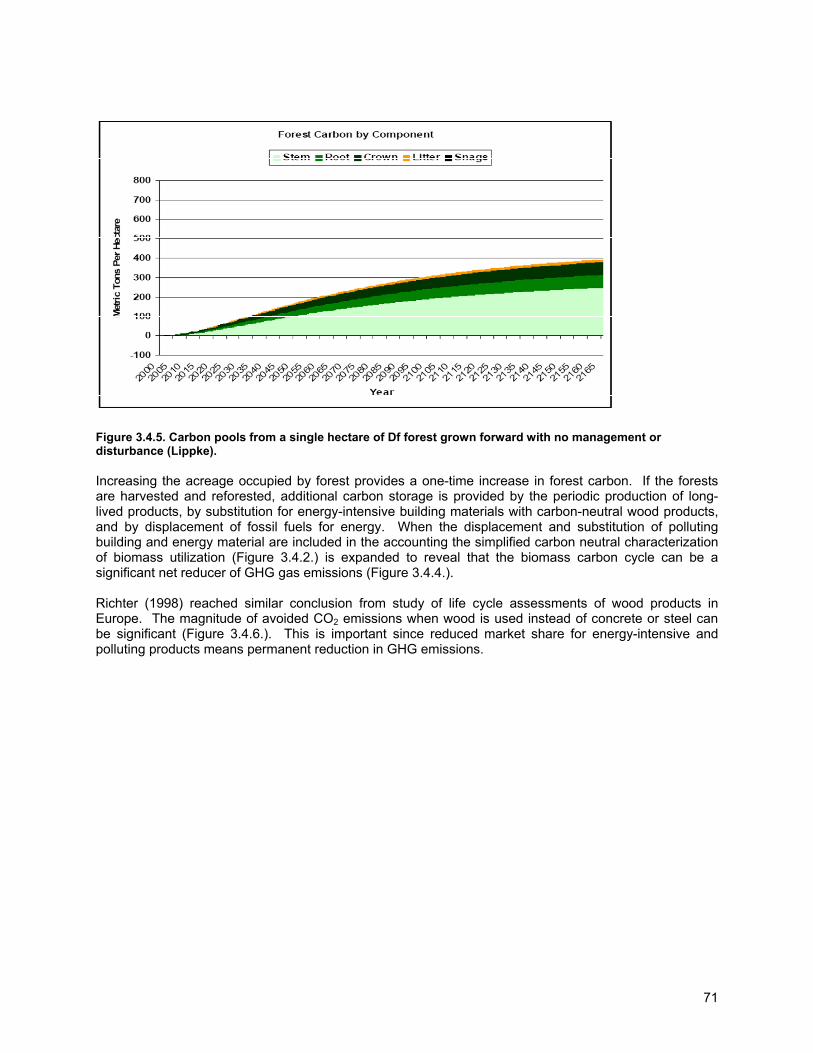
71
Figure 3.4.5. Carbon pools from a single hectare of Df forest grown forward with no management or disturbance (Lippke). Increasing the acreage occupied by forest provides a one-time increase in forest carbon. If the forests are harvested and reforested, additional carbon storage is provided by the periodic production of long-lived products, by substitution for energy-intensive building materials with carbon-neutral wood products, and by displacement of fossil fuels for energy. When the displacement and substitution of polluting building and energy material are included in the accounting the simplified carbon neutral characterization of biomass utilization (Figure 3.4.2.) is expanded to reveal that the biomass carbon cycle can be a significant net reducer of GHG gas emissions (Figure 3.4.4.). Richter (1998) reached similar conclusion from study of life cycle assessments of wood products in Europe. The magnitude of avoided CO2 emissions when wood is used instead of concrete or steel can be significant (Figure 3.4.6.). This is important since reduced market share for energy-intensive and polluting products means permanent reduction in GHG emissions.
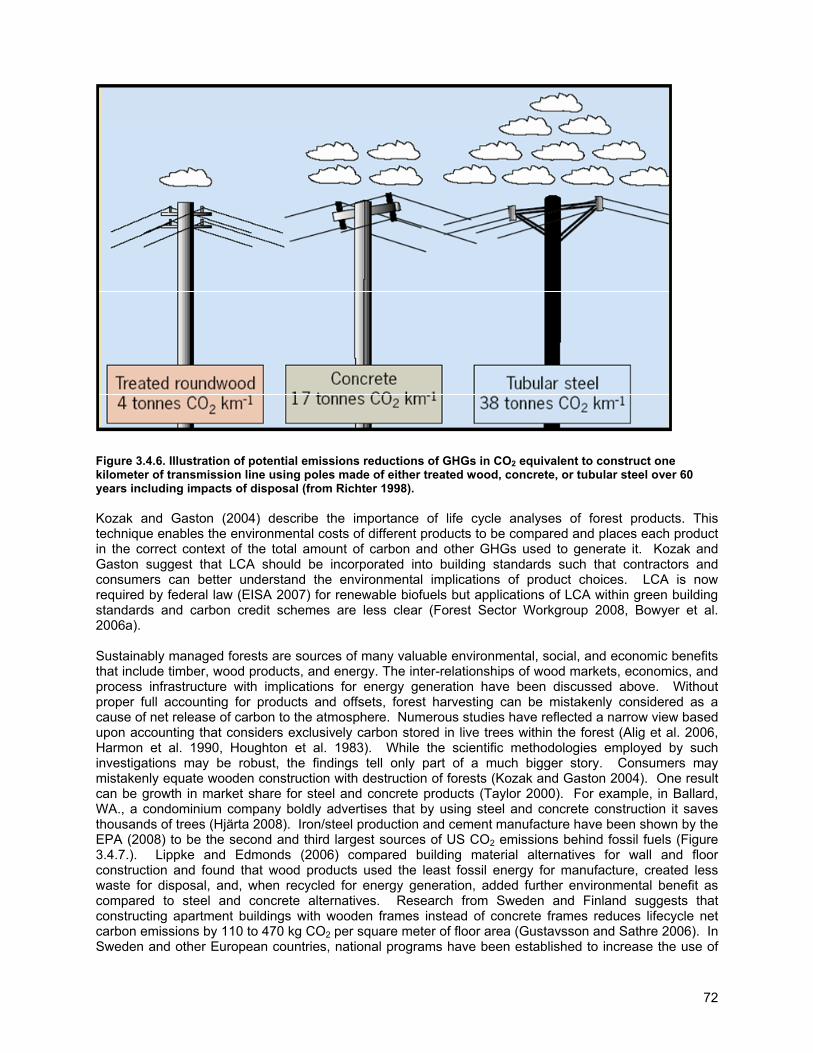
72
Figure 3.4.6. Illustration of potential emissions reductions of GHGs in CO2 equivalent to construct one kilometer of transmission line using poles made of either treated wood, concrete, or tubular steel over 60 years including impacts of disposal (from Richter 1998). Kozak and Gaston (2004) describe the importance of life cycle analyses of forest products. This technique enables the environmental costs of different products to be compared and places each product in the correct context of the total amount of carbon and other GHGs used to generate it. Kozak and Gaston suggest that LCA should be incorporated into building standards such that contractors and consumers can better understand the environmental implications of product choices. LCA is now required by federal law (EISA 2007) for renewable biofuels but applications of LCA within green building standards and carbon credit schemes are less clear (Forest Sector Workgroup 2008, Bowyer et al. 2006a). Sustainably managed forests are sources of many valuable environmental, social, and economic benefits that include timber, wood products, and energy. The inter-relationships of wood markets, economics, and process infrastructure with implications for energy generation have been discussed above. Without proper full accounting for products and offsets, forest harvesting can be mistakenly considered as a cause of net release of carbon to the atmosphere. Numerous studies have reflected a narrow view based upon accounting that considers exclusively carbon stored in live trees within the forest (Alig et al. 2006, Harmon et al. 1990, Houghton et al. 1983). While the scientific methodologies employed by such investigations may be robust, the findings tell only part of a much bigger story. Consumers may mistakenly equate wooden construction with destruction of forests (Kozak and Gaston 2004). One result can be growth in market share for steel and concrete products (Taylor 2000). For example, in Ballard, WA., a condominium company boldly advertises that by using steel and concrete construction it saves thousands of trees (Hjärta 2008). Iron/steel production and cement manufacture have been shown by the EPA (2008) to be the second and third largest sources of US CO2 emissions behind fossil fuels (Figure 3.4.7.). Lippke and Edmonds (2006) compared building material alternatives for wall and floor construction and found that wood products used the least fossil energy for manufacture, created less waste for disposal, and, when recycled for energy generation, added further environmental benefit as compared to steel and concrete alternatives. Research from Sweden and Finland suggests that constructing apartment buildings with wooden frames instead of concrete frames reduces lifecycle net carbon emissions by 110 to 470 kg CO2 per square meter of floor area (Gustavsson and Sathre 2006). In Sweden and other European countries, national programs have been established to increase the use of
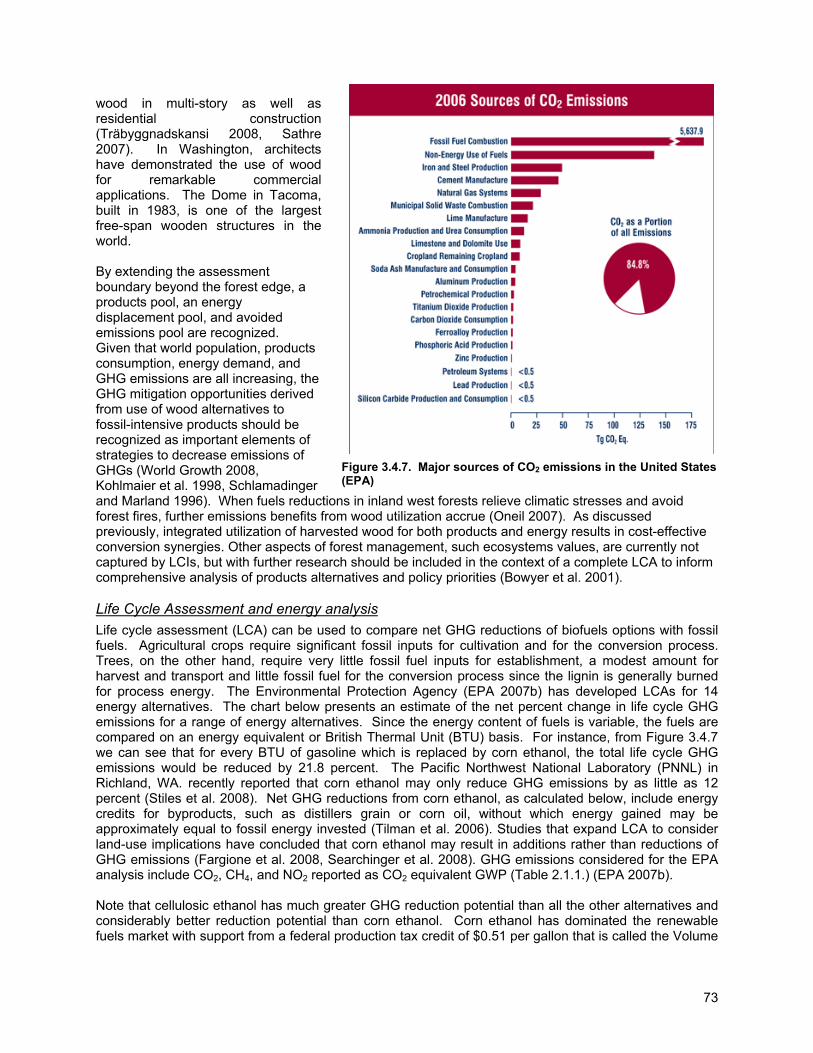
73
wood in multi-story as well as residential construction (Träbyggnadskansi 2008, Sathre 2007). In Washington, architects have demonstrated the use of wood for remarkable commercial applications. The Dome in Tacoma, built in 1983, is one of the largest free-span wooden structures in the world. By extending the assessment boundary beyond the forest edge, a products pool, an energy displacement pool, and avoided emissions pool are recognized. Given that world population, products consumption, energy demand, and GHG emissions are all increasing, the GHG mitigation opportunities derived from use of wood alternatives to fossil-intensive products should be recognized as important elements of strategies to decrease emissions of GHGs (World Growth 2008, Kohlmaier et al. 1998, Schlamadinger and Marland 1996). When fuels reductions in inland west forests relieve climatic stresses and avoid forest fires, further emissions benefits from wood utilization accrue (Oneil 2007). As discussed previously, integrated utilization of harvested wood for both products and energy results in cost-effective conversion synergies. Other aspects of forest management, such ecosystems values, are currently not captured by LCIs, but with further research should be included in the context of a complete LCA to inform comprehensive analysis of products alternatives and policy priorities (Bowyer et al. 2001). Life Cycle Assessment and energy analysis Life cycle assessment (LCA) can be used to compare net GHG reductions of biofuels options with fossil fuels. Agricultural crops require significant fossil inputs for cultivation and for the conversion process. Trees, on the other hand, require very little fossil fuel inputs for establishment, a modest amount for harvest and transport and little fossil fuel for the conversion process since the lignin is generally burned for process energy. The Environmental Protection Agency (EPA 2007b) has developed LCAs for 14 energy alternatives. The chart below presents an estimate of the net percent change in life cycle GHG emissions for a range of energy alternatives. Since the energy content of fuels is variable, the fuels are compared on an energy equivalent or British Thermal Unit (BTU) basis. For instance, from Figure 3.4.7 we can see that for every BTU of gasoline which is replaced by corn ethanol, the total life cycle GHG emissions would be reduced by 21.8 percent. The Pacific Northwest National Laboratory (PNNL) in Richland, WA. recently reported that corn ethanol may only reduce GHG emissions by as little as 12 percent (Stiles et al. 2008). Net GHG reductions from corn ethanol, as calculated below, include energy credits for byproducts, such as distillers grain or corn oil, without which energy gained may be approximately equal to fossil energy invested (Tilman et al. 2006). Studies that expand LCA to consider land-use implications have concluded that corn ethanol may result in additions rather than reductions of GHG emissions (Fargione et al. 2008, Searchinger et al. 2008). GHG emissions considered for the EPA analysis include CO2, CH4, and NO2 reported as CO2 equivalent GWP (Table 2.1.1.) (EPA 2007b). Note that cellulosic ethanol has much greater GHG reduction potential than all the other alternatives and considerably better reduction potential than corn ethanol. Corn ethanol has dominated the renewable fuels market with support from a federal production tax credit of $0.51 per gallon that is called the Volume
Figure 3.4.7. Major sources of CO2 emissions in the United States (EPA)
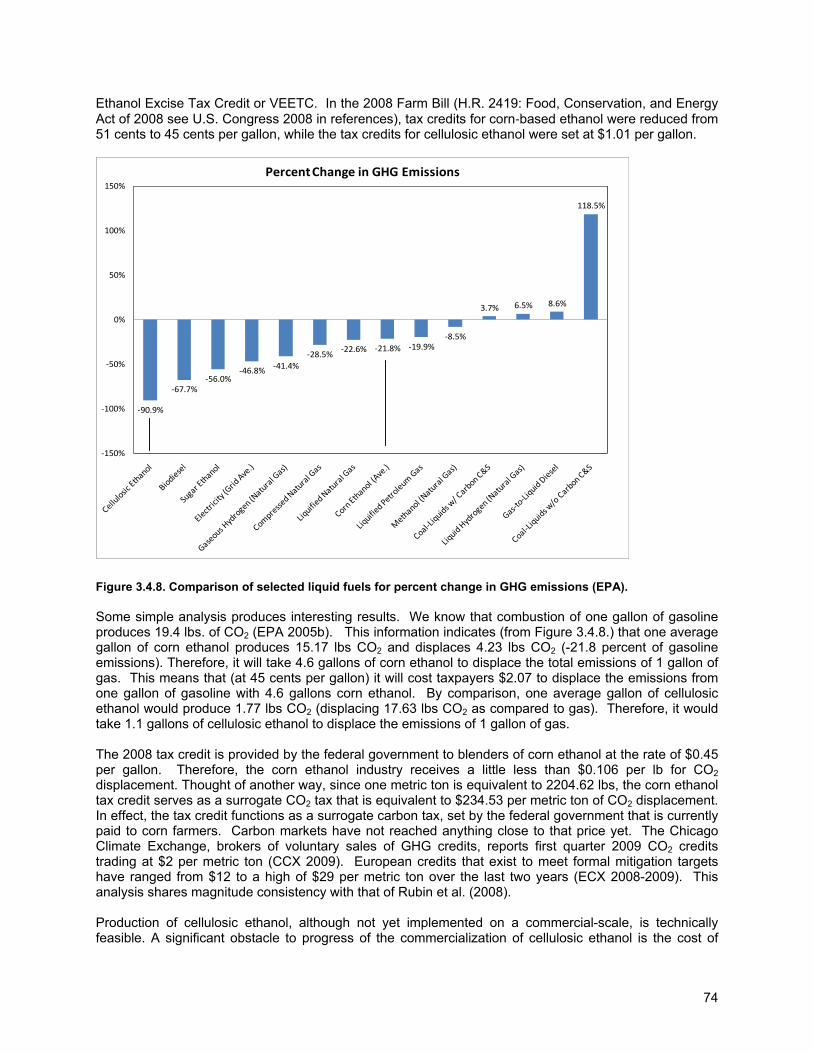
74
Ethanol Excise Tax Credit or VEETC. In the 2008 Farm Bill (H.R. 2419: Food, Conservation, and Energy Act of 2008 see U.S. Congress 2008 in references), tax credits for corn‐based ethanol were reduced from 51 cents to 45 cents per gallon, while the tax credits for cellulosic ethanol were set at $1.01 per gallon.
Figure 3.4.8. Comparison of selected liquid fuels for percent change in GHG emissions (EPA). Some simple analysis produces interesting results. We know that combustion of one gallon of gasoline produces 19.4 lbs. of CO2 (EPA 2005b). This information indicates (from Figure 3.4.8.) that one average gallon of corn ethanol produces 15.17 lbs CO2 and displaces 4.23 lbs CO2 (-21.8 percent of gasoline emissions). Therefore, it will take 4.6 gallons of corn ethanol to displace the total emissions of 1 gallon of gas. This means that (at 45 cents per gallon) it will cost taxpayers $2.07 to displace the emissions from one gallon of gasoline with 4.6 gallons corn ethanol. By comparison, one average gallon of cellulosic ethanol would produce 1.77 lbs CO2 (displacing 17.63 lbs CO2 as compared to gas). Therefore, it would take 1.1 gallons of cellulosic ethanol to displace the emissions of 1 gallon of gas. The 2008 tax credit is provided by the federal government to blenders of corn ethanol at the rate of $0.45 per gallon. Therefore, the corn ethanol industry receives a little less than $0.106 per lb for CO2 displacement. Thought of another way, since one metric ton is equivalent to 2204.62 lbs, the corn ethanol tax credit serves as a surrogate CO2 tax that is equivalent to $234.53 per metric ton of CO2 displacement. In effect, the tax credit functions as a surrogate carbon tax, set by the federal government that is currently paid to corn farmers. Carbon markets have not reached anything close to that price yet. The Chicago Climate Exchange, brokers of voluntary sales of GHG credits, reports first quarter 2009 CO2 credits trading at $2 per metric ton (CCX 2009). European credits that exist to meet formal mitigation targets have ranged from $12 to a high of $29 per metric ton over the last two years (ECX 2008-2009). This analysis shares magnitude consistency with that of Rubin et al. (2008). Production of cellulosic ethanol, although not yet implemented on a commercial-scale, is technically feasible. A significant obstacle to progress of the commercialization of cellulosic ethanol is the cost of
‐90.9%
‐67.7%‐56.0%
‐46.8% ‐41.4%‐28.5%
‐22.6% ‐21.8% ‐19.9%‐8.5%
3.7% 6.5% 8.6%
118.5%
‐150%
‐100%
‐50%
0%
50%
100%
150%Percent Change in GHG Emissions
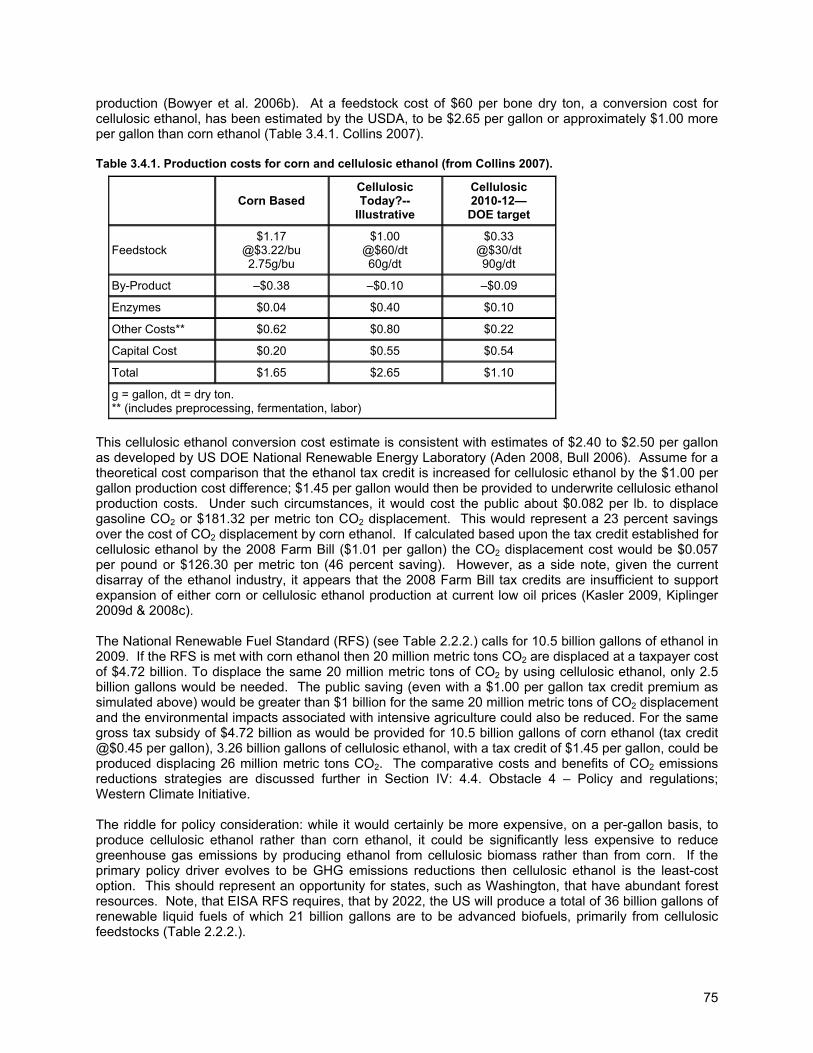
75
production (Bowyer et al. 2006b). At a feedstock cost of $60 per bone dry ton, a conversion cost for cellulosic ethanol, has been estimated by the USDA, to be $2.65 per gallon or approximately $1.00 more per gallon than corn ethanol (Table 3.4.1. Collins 2007). Table 3.4.1. Production costs for corn and cellulosic ethanol (from Collins 2007).
Corn Based CellulosicToday?--
Illustrative
Cellulosic2010-12— DOE target
Feedstock $1.17
@$3.22/bu 2.75g/bu
$1.00 @$60/dt 60g/dt
$0.33 @$30/dt 90g/dt
By-Product –$0.38 –$0.10 –$0.09
Enzymes $0.04 $0.40 $0.10
Other Costs** $0.62 $0.80 $0.22
Capital Cost $0.20 $0.55 $0.54
Total $1.65 $2.65 $1.10
g = gallon, dt = dry ton. ** (includes preprocessing, fermentation, labor)
This cellulosic ethanol conversion cost estimate is consistent with estimates of $2.40 to $2.50 per gallon as developed by US DOE National Renewable Energy Laboratory (Aden 2008, Bull 2006). Assume for a theoretical cost comparison that the ethanol tax credit is increased for cellulosic ethanol by the $1.00 per gallon production cost difference; $1.45 per gallon would then be provided to underwrite cellulosic ethanol production costs. Under such circumstances, it would cost the public about $0.082 per lb. to displace gasoline CO2 or $181.32 per metric ton CO2 displacement. This would represent a 23 percent savings over the cost of CO2 displacement by corn ethanol. If calculated based upon the tax credit established for cellulosic ethanol by the 2008 Farm Bill ($1.01 per gallon) the CO2 displacement cost would be $0.057 per pound or $126.30 per metric ton (46 percent saving). However, as a side note, given the current disarray of the ethanol industry, it appears that the 2008 Farm Bill tax credits are insufficient to support expansion of either corn or cellulosic ethanol production at current low oil prices (Kasler 2009, Kiplinger 2009d & 2008c). The National Renewable Fuel Standard (RFS) (see Table 2.2.2.) calls for 10.5 billion gallons of ethanol in 2009. If the RFS is met with corn ethanol then 20 million metric tons CO2 are displaced at a taxpayer cost of $4.72 billion. To displace the same 20 million metric tons of CO2 by using cellulosic ethanol, only 2.5 billion gallons would be needed. The public saving (even with a $1.00 per gallon tax credit premium as simulated above) would be greater than $1 billion for the same 20 million metric tons of CO2 displacement and the environmental impacts associated with intensive agriculture could also be reduced. For the same gross tax subsidy of $4.72 billion as would be provided for 10.5 billion gallons of corn ethanol (tax credit @$0.45 per gallon), 3.26 billion gallons of cellulosic ethanol, with a tax credit of $1.45 per gallon, could be produced displacing 26 million metric tons CO2. The comparative costs and benefits of CO2 emissions reductions strategies are discussed further in Section IV: 4.4. Obstacle 4 – Policy and regulations; Western Climate Initiative. The riddle for policy consideration: while it would certainly be more expensive, on a per-gallon basis, to produce cellulosic ethanol rather than corn ethanol, it could be significantly less expensive to reduce greenhouse gas emissions by producing ethanol from cellulosic biomass rather than from corn. If the primary policy driver evolves to be GHG emissions reductions then cellulosic ethanol is the least-cost option. This should represent an opportunity for states, such as Washington, that have abundant forest resources. Note, that EISA RFS requires, that by 2022, the US will produce a total of 36 billion gallons of renewable liquid fuels of which 21 billion gallons are to be advanced biofuels, primarily from cellulosic feedstocks (Table 2.2.2.).
76
For cost comparison, Mason et al (2003) found, in simulations of wild fire in overstocked stands on the Okanogan National Forest, that an average of 18.5 metric tons CO2 were released per acre during forest biomass combustion followed by legacy releases of 1.85 tons CO2 per acre per year from decay. Simulated treatments to remove hazardous fuel loads and reduce risk of crown fires with consequent CO2 emissions were shown to average $580 per acre (Mason et al. 2003). At $580 per acre, the cost of avoided CO2 release from wildfire smoke would be less than $30 per metric ton. Forest fuels reductions to reduce fire intensity and recover biomass for cellulosic ethanol could offer dual opportunity to reduce CO2 emissions from wildfires and recover forest biomass for renewable energy to offset fossil fuel reliance. Summary of carbon accounting The carbon benefits of product substitution associated with displacement of fossil fuel energy and energy-intensive non-wood building materials have been well-documented (Perlack et al. 2005, Perez-Garcia et al. 2005, Boman and Turnbull 1997, Schlamadinger and Marland 1996, Buchanan and Honey 1995). Naburrs et al. (2000) examined the importance of broadening the Kyoto Protocol and found that more than 50 percent of potential additions to forest carbon storage in the United States could accrue from pest and fire management. Lippke et al. (2006) demonstrated that, primarily as a result of reduced forest fire emissions and increased long-lived product production, 56 percent more carbon was stored over a 50-year period in a managed rather than an unmanaged eastern Washington forest. Forests of Washington can be managed to reduce atmospheric carbon in four basic ways:
1) Absorption of atmospheric carbon through photosynthesis to storage in forests or other vegetation.
2) Extension of carbon storage in long-lived products.
3) Reduction of fossil fuel emissions through wood substitution for energy and building products.
4) Reduction of carbon releases associated with forest mortality, decay, and wildfire. Further benefits accrue when wood waste is recovered for energy generation or when deconstructed building materials such as trusses, timbers, and glue lams are recycled into new construction. The Intergovernmental Panel on Climate Change (IPCC) has acknowledged forest growth, products, substitution, and disturbance avoidance as integral components of managed forest ecosystems and the global carbon cycle. Recognition of carbon boundary conditions, that include all forest flows, represents a choice for comprehensive versus selective environmental accounting with implications for improvement in forest health and climate change adaptation and mitigation effectiveness. “In the long term, a sustainable forest management strategy aimed at maintaining or increasing forest carbon stocks, while producing an annual sustained yield of timber, fiber, or energy from the forest, will generate the largest sustained mitigation benefit.” (IPCC 2007c). 3.5 Forestry as a cost-effective approach to climate and energy Woody biomass is a uniquely versatile energy feedstock that can be a source of firm electrical power with steam and heat as valuable byproducts or it can be used to produce liquid and gaseous fuels to reduce reliance on fossil fuels for transportation applications. Valuable industrial chemicals can be extracted in the process. While energy conversion applications must be customized to local circumstances, a broader policy priority should be to encourage the use of forest resources for conversion to the highest value products, chemicals, fuels, and energy. Residuals from the manufacture of forest products have been proven to be a readily available and cost-effective source of biomass-to-energy feedstocks. Biomass energy derived from process residuals is already widely used in Washington. However, new developments in hog fuel and black liquor energy recovery, when combined with investments in conversion upgrades, could significantly increase renewable energy contributions from currently dedicated process residuals. Forest management residues, typically burned in piles after timber harvests or left on the forest floor represent another large source of woody biomass that is currently underutilized. Forest thinnings, such as fuel load reductions on eastside dry land forests or biodiversity thinnings in westside forests, can provide woody biomass for
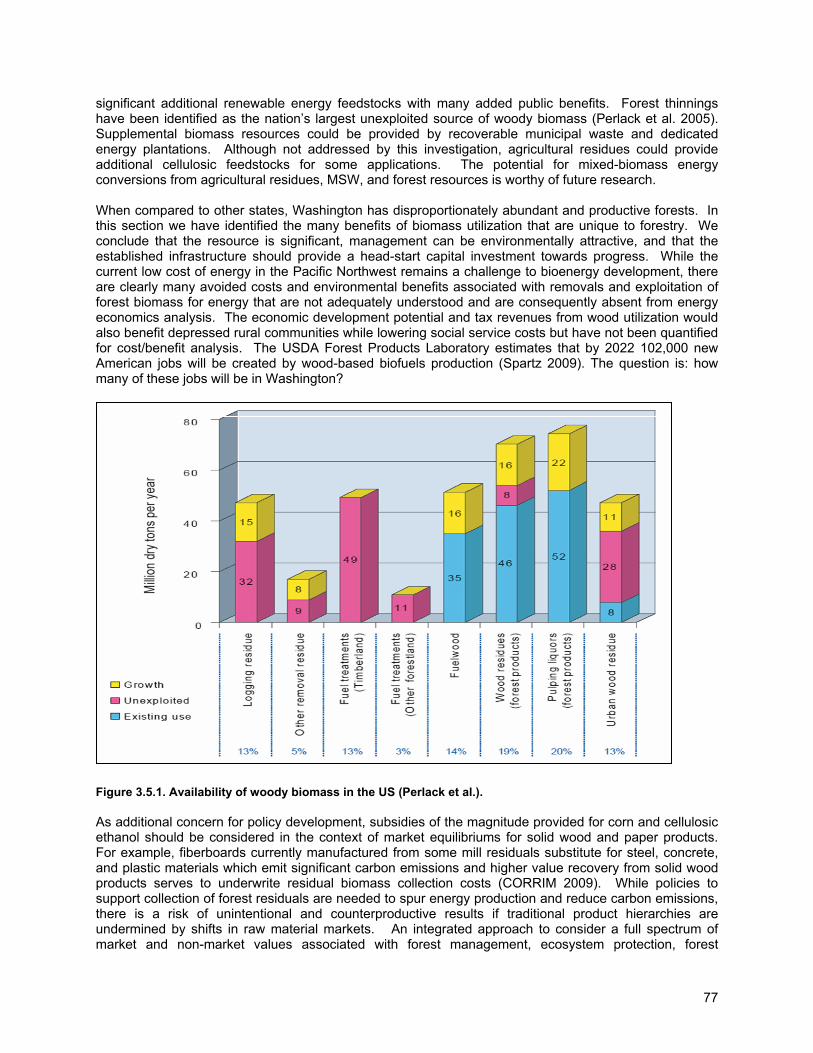
77
significant additional renewable energy feedstocks with many added public benefits. Forest thinnings have been identified as the nation’s largest unexploited source of woody biomass (Perlack et al. 2005). Supplemental biomass resources could be provided by recoverable municipal waste and dedicated energy plantations. Although not addressed by this investigation, agricultural residues could provide additional cellulosic feedstocks for some applications. The potential for mixed-biomass energy conversions from agricultural residues, MSW, and forest resources is worthy of future research. When compared to other states, Washington has disproportionately abundant and productive forests. In this section we have identified the many benefits of biomass utilization that are unique to forestry. We conclude that the resource is significant, management can be environmentally attractive, and that the established infrastructure should provide a head-start capital investment towards progress. While the current low cost of energy in the Pacific Northwest remains a challenge to bioenergy development, there are clearly many avoided costs and environmental benefits associated with removals and exploitation of forest biomass for energy that are not adequately understood and are consequently absent from energy economics analysis. The economic development potential and tax revenues from wood utilization would also benefit depressed rural communities while lowering social service costs but have not been quantified for cost/benefit analysis. The USDA Forest Products Laboratory estimates that by 2022 102,000 new American jobs will be created by wood-based biofuels production (Spartz 2009). The question is: how many of these jobs will be in Washington?
Figure 3.5.1. Availability of woody biomass in the US (Perlack et al.). As additional concern for policy development, subsidies of the magnitude provided for corn and cellulosic ethanol should be considered in the context of market equilibriums for solid wood and paper products. For example, fiberboards currently manufactured from some mill residuals substitute for steel, concrete, and plastic materials which emit significant carbon emissions and higher value recovery from solid wood products serves to underwrite residual biomass collection costs (CORRIM 2009). While policies to support collection of forest residuals are needed to spur energy production and reduce carbon emissions, there is a risk of unintentional and counterproductive results if traditional product hierarchies are undermined by shifts in raw material markets. An integrated approach to consider a full spectrum of market and non-market values associated with forest management, ecosystem protection, forest
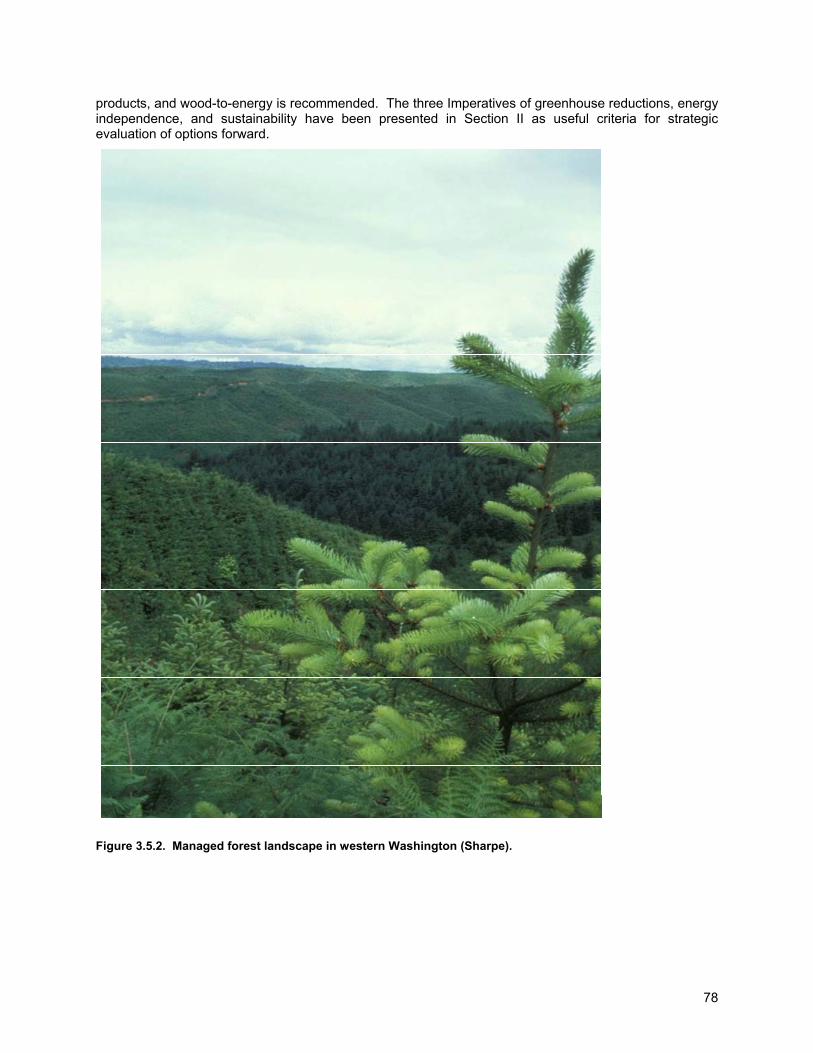
78
products, and wood-to-energy is recommended. The three Imperatives of greenhouse reductions, energy independence, and sustainability have been presented in Section II as useful criteria for strategic evaluation of options forward.
Figure 3.5.2. Managed forest landscape in western Washington (Sharpe).
79
Section IV: The Obstacles In the previous sections of this report, we provided background and context followed by the imperatives that urge action and the descriptions of the many opportunities that we find associated with the use of wood biomass for energy. We conclude that a renewable energy policy priority for Washington (subject to local circumstances but that most effectively addresses the imperatives) should be liquid fuels, Washington is already the leading national producer of renewable electricity, woody biomass (the largest available state biomass resource) has significant potential for biofuels contribution, and that Washington (with abundant forests and an established infrastructure) should be positioned to benefit. We find, however, that there are many complex hurdles to be addressed that do not appear to be well-understood. Complicating matters further, there are continuing uncertainties and debates about what and how to measure for comparison of resource alternatives and how to link specific indicators to time-bound targets and thresholds with which to gauge achievement (Pintér et al. 2005). Adding to the complexity, in the absence of a cohesive national strategy, states have evolved a chaos of different policy responses (Leggett 2009, Becker and Lee 2008, Yoder et al. 2008). Progress is slow and the default consequences are economic and environmental decline (CIG 2009, CLI 2009, Ruth et al. 2007, Doppelt 2006). It seems remarkable that the US could have been able to split the atom more than 60 years ago but struggles to accelerate conversion of wood to energy today (Pethokoukis 2009, Stine 2008, Yang and Oppenheimer 2007). This investigation has uncovered many obstacles that are discussed in some depth within this section of our report. A common thread is the complexity of the interrelationships between climate change, energy, forestry, and public policy. While obstacles appear formidable and numerous, we hypothesize that none are insurmountable if society chooses to focus sufficient resolve. Analyses reveal that motivations for action command attention while doing nothing leads to an increasingly costly outcome (Ackerman et al. 2008, Ruth et al. 2007, Doppelt et al. 2006, Parson et al. 2001). On the other hand, the challenges to substantive reductions in fossil fuel consumption must not be discounted. Fossil fuels are energy-rich, are firmly imbedded in American life, and, without consideration of many ancillary and hidden costs that are not readily captured by commercial markets, appear as least-cost energy options for consumers (EIA 2008f). Important to any discussion of renewable energy substitution for fossil fuels is an unembellished recognition that progress will occur at the margin. Review of domestic and international energy analyses and forecasts indicates that energy independence from fossil fuels is not potentially achievable within any foreseeable planning window (EIA 2008a, EIA 2008e, EIA 2008g, EIA 2007a, IEA 2007b, IEA 2005b). The most optimistic expectation that was encountered during this investigation was a 30 percent reduction in fossil reliance by 2030 (Perlack et al 2005). This does not imply, however, that incremental improvements can not be important or should not be pursued. Development of all potential domestic renewable resources, with careful planning towards an integrated energy portfolio, will ensure optimized levels of success. Competition between renewable energy alternatives is counterproductive but identification of state energy priorities tied to assessment of resource availability will hasten progress. Evolving public perceptions regarding land use, biomass exploitation, and non-market amenities will play a major role in how much of the wood resource base may be used for energy (EIA 1998). Consumer behavior will determine ultimate demand for bioenergy. Public attitudes about energy prices, comparative performance, and environmental improvement will affect the volumes and types of bioenergies selected for development (EIA 2007a). 4.1. Obstacle 1 - Access to the resource As has been discussed throughout this report, fully understanding the many costs and benefits associated with the development of woody biomass for GHG emissions reductions and energy development is complicated. A first significant, but perhaps not widely appreciated, consideration is that wood “waste” is an intrinsically valuable and finite resource that, while not presently exploited to best advantage, is the state’s most abundant renewable biomass resource with significant potential for reducing fossil fuel reliance and GHG emissions. In addition, we find that considerations discussed
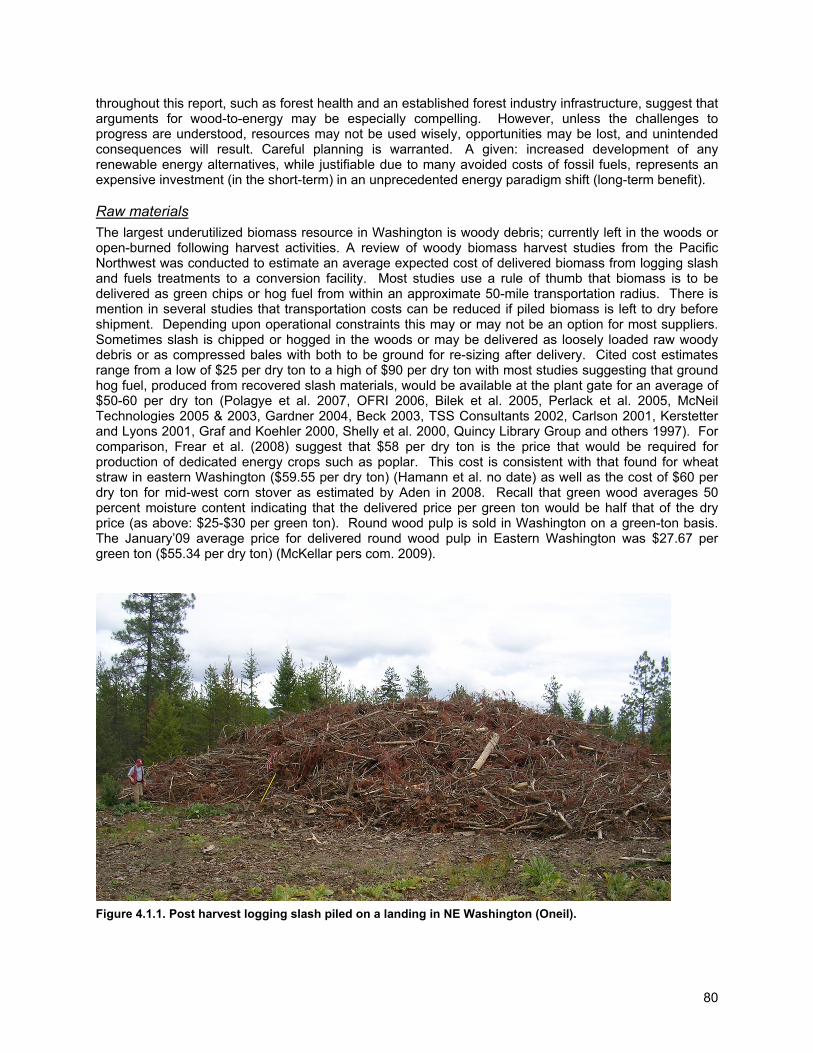
80
throughout this report, such as forest health and an established forest industry infrastructure, suggest that arguments for wood-to-energy may be especially compelling. However, unless the challenges to progress are understood, resources may not be used wisely, opportunities may be lost, and unintended consequences will result. Careful planning is warranted. A given: increased development of any renewable energy alternatives, while justifiable due to many avoided costs of fossil fuels, represents an expensive investment (in the short-term) in an unprecedented energy paradigm shift (long-term benefit). Raw materials The largest underutilized biomass resource in Washington is woody debris; currently left in the woods or open-burned following harvest activities. A review of woody biomass harvest studies from the Pacific Northwest was conducted to estimate an average expected cost of delivered biomass from logging slash and fuels treatments to a conversion facility. Most studies use a rule of thumb that biomass is to be delivered as green chips or hog fuel from within an approximate 50-mile transportation radius. There is mention in several studies that transportation costs can be reduced if piled biomass is left to dry before shipment. Depending upon operational constraints this may or may not be an option for most suppliers. Sometimes slash is chipped or hogged in the woods or may be delivered as loosely loaded raw woody debris or as compressed bales with both to be ground for re-sizing after delivery. Cited cost estimates range from a low of $25 per dry ton to a high of $90 per dry ton with most studies suggesting that ground hog fuel, produced from recovered slash materials, would be available at the plant gate for an average of $50-60 per dry ton (Polagye et al. 2007, OFRI 2006, Bilek et al. 2005, Perlack et al. 2005, McNeil Technologies 2005 & 2003, Gardner 2004, Beck 2003, TSS Consultants 2002, Carlson 2001, Kerstetter and Lyons 2001, Graf and Koehler 2000, Shelly et al. 2000, Quincy Library Group and others 1997). For comparison, Frear et al. (2008) suggest that $58 per dry ton is the price that would be required for production of dedicated energy crops such as poplar. This cost is consistent with that found for wheat straw in eastern Washington ($59.55 per dry ton) (Hamann et al. no date) as well as the cost of $60 per dry ton for mid-west corn stover as estimated by Aden in 2008. Recall that green wood averages 50 percent moisture content indicating that the delivered price per green ton would be half that of the dry price (as above: $25-$30 per green ton). Round wood pulp is sold in Washington on a green-ton basis. The January’09 average price for delivered round wood pulp in Eastern Washington was $27.67 per green ton ($55.34 per dry ton) (McKellar pers com. 2009).
Figure 4.1.1. Post harvest logging slash piled on a landing in NE Washington (Oneil).
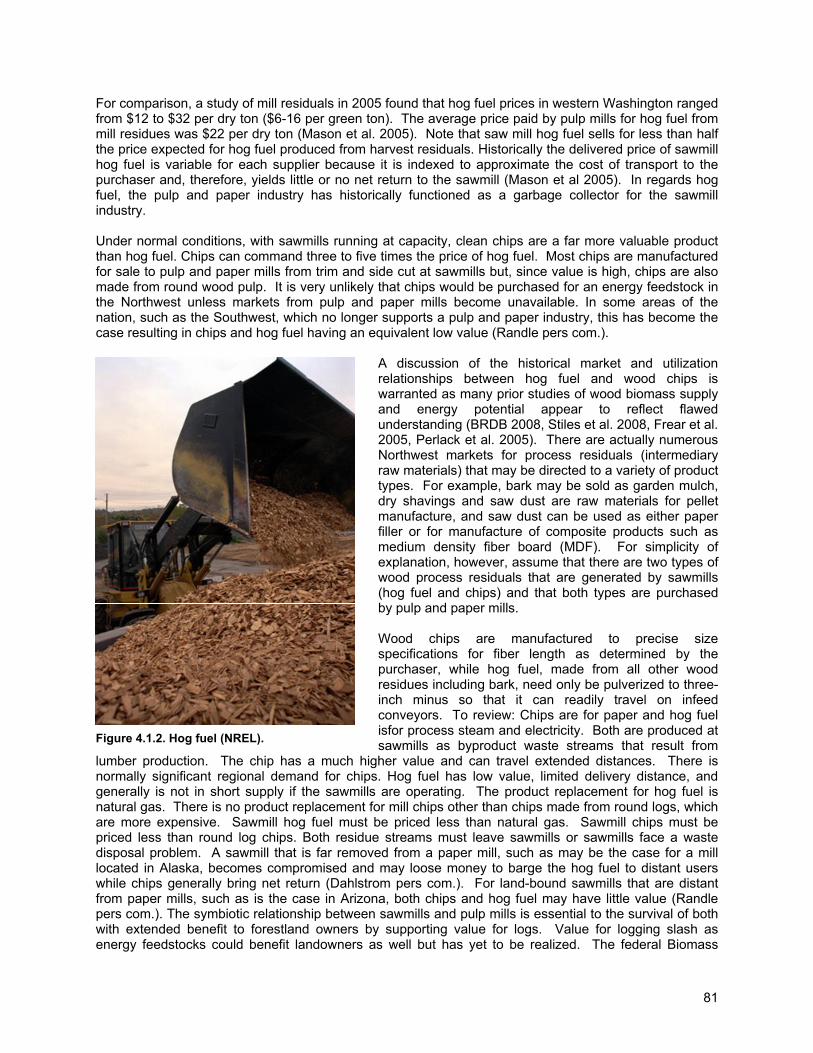
81
For comparison, a study of mill residuals in 2005 found that hog fuel prices in western Washington ranged from $12 to $32 per dry ton ($6-16 per green ton). The average price paid by pulp mills for hog fuel from mill residues was $22 per dry ton (Mason et al. 2005). Note that saw mill hog fuel sells for less than half the price expected for hog fuel produced from harvest residuals. Historically the delivered price of sawmill hog fuel is variable for each supplier because it is indexed to approximate the cost of transport to the purchaser and, therefore, yields little or no net return to the sawmill (Mason et al 2005). In regards hog fuel, the pulp and paper industry has historically functioned as a garbage collector for the sawmill industry. Under normal conditions, with sawmills running at capacity, clean chips are a far more valuable product than hog fuel. Chips can command three to five times the price of hog fuel. Most chips are manufactured for sale to pulp and paper mills from trim and side cut at sawmills but, since value is high, chips are also made from round wood pulp. It is very unlikely that chips would be purchased for an energy feedstock in the Northwest unless markets from pulp and paper mills become unavailable. In some areas of the nation, such as the Southwest, which no longer supports a pulp and paper industry, this has become the case resulting in chips and hog fuel having an equivalent low value (Randle pers com.).
A discussion of the historical market and utilization relationships between hog fuel and wood chips is warranted as many prior studies of wood biomass supply and energy potential appear to reflect flawed understanding (BRDB 2008, Stiles et al. 2008, Frear et al. 2005, Perlack et al. 2005). There are actually numerous Northwest markets for process residuals (intermediary raw materials) that may be directed to a variety of product types. For example, bark may be sold as garden mulch, dry shavings and saw dust are raw materials for pellet manufacture, and saw dust can be used as either paper filler or for manufacture of composite products such as medium density fiber board (MDF). For simplicity of explanation, however, assume that there are two types of wood process residuals that are generated by sawmills (hog fuel and chips) and that both types are purchased by pulp and paper mills. Wood chips are manufactured to precise size specifications for fiber length as determined by the purchaser, while hog fuel, made from all other wood residues including bark, need only be pulverized to three-inch minus so that it can readily travel on infeed conveyors. To review: Chips are for paper and hog fuel isfor process steam and electricity. Both are produced at sawmills as byproduct waste streams that result from
lumber production. The chip has a much higher value and can travel extended distances. There is normally significant regional demand for chips. Hog fuel has low value, limited delivery distance, and generally is not in short supply if the sawmills are operating. The product replacement for hog fuel is natural gas. There is no product replacement for mill chips other than chips made from round logs, which are more expensive. Sawmill hog fuel must be priced less than natural gas. Sawmill chips must be priced less than round log chips. Both residue streams must leave sawmills or sawmills face a waste disposal problem. A sawmill that is far removed from a paper mill, such as may be the case for a mill located in Alaska, becomes compromised and may loose money to barge the hog fuel to distant users while chips generally bring net return (Dahlstrom pers com.). For land-bound sawmills that are distant from paper mills, such as is the case in Arizona, both chips and hog fuel may have little value (Randle pers com.). The symbiotic relationship between sawmills and pulp mills is essential to the survival of both with extended benefit to forestland owners by supporting value for logs. Value for logging slash as energy feedstocks could benefit landowners as well but has yet to be realized. The federal Biomass
Figure 4.1.2. Hog fuel (NREL).
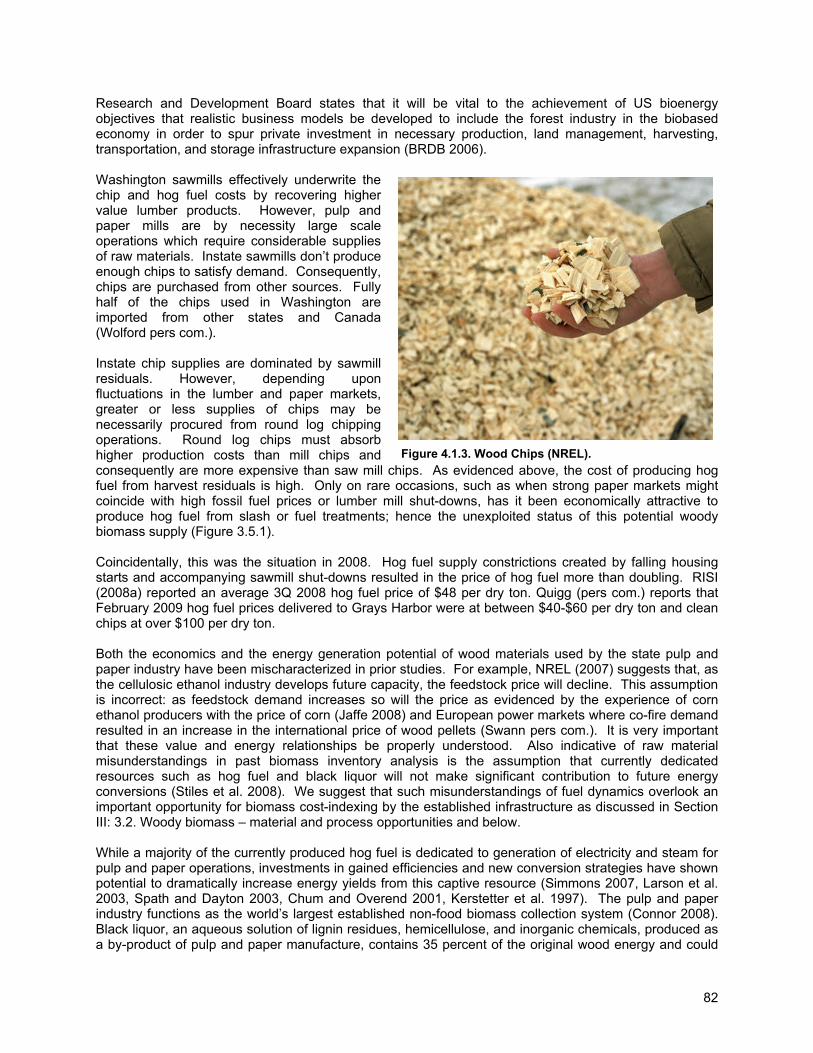
82
Research and Development Board states that it will be vital to the achievement of US bioenergy objectives that realistic business models be developed to include the forest industry in the biobased economy in order to spur private investment in necessary production, land management, harvesting, transportation, and storage infrastructure expansion (BRDB 2006). Washington sawmills effectively underwrite the chip and hog fuel costs by recovering higher value lumber products. However, pulp and paper mills are by necessity large scale operations which require considerable supplies of raw materials. Instate sawmills don’t produce enough chips to satisfy demand. Consequently, chips are purchased from other sources. Fully half of the chips used in Washington are imported from other states and Canada (Wolford pers com.). Instate chip supplies are dominated by sawmill residuals. However, depending upon fluctuations in the lumber and paper markets, greater or less supplies of chips may be necessarily procured from round log chipping operations. Round log chips must absorb higher production costs than mill chips and consequently are more expensive than saw mill chips. As evidenced above, the cost of producing hog fuel from harvest residuals is high. Only on rare occasions, such as when strong paper markets might coincide with high fossil fuel prices or lumber mill shut-downs, has it been economically attractive to produce hog fuel from slash or fuel treatments; hence the unexploited status of this potential woody biomass supply (Figure 3.5.1). Coincidentally, this was the situation in 2008. Hog fuel supply constrictions created by falling housing starts and accompanying sawmill shut-downs resulted in the price of hog fuel more than doubling. RISI (2008a) reported an average 3Q 2008 hog fuel price of $48 per dry ton. Quigg (pers com.) reports that February 2009 hog fuel prices delivered to Grays Harbor were at between $40-$60 per dry ton and clean chips at over $100 per dry ton. Both the economics and the energy generation potential of wood materials used by the state pulp and paper industry have been mischaracterized in prior studies. For example, NREL (2007) suggests that, as the cellulosic ethanol industry develops future capacity, the feedstock price will decline. This assumption is incorrect: as feedstock demand increases so will the price as evidenced by the experience of corn ethanol producers with the price of corn (Jaffe 2008) and European power markets where co-fire demand resulted in an increase in the international price of wood pellets (Swann pers com.). It is very important that these value and energy relationships be properly understood. Also indicative of raw material misunderstandings in past biomass inventory analysis is the assumption that currently dedicated resources such as hog fuel and black liquor will not make significant contribution to future energy conversions (Stiles et al. 2008). We suggest that such misunderstandings of fuel dynamics overlook an important opportunity for biomass cost-indexing by the established infrastructure as discussed in Section III: 3.2. Woody biomass – material and process opportunities and below. While a majority of the currently produced hog fuel is dedicated to generation of electricity and steam for pulp and paper operations, investments in gained efficiencies and new conversion strategies have shown potential to dramatically increase energy yields from this captive resource (Simmons 2007, Larson et al. 2003, Spath and Dayton 2003, Chum and Overend 2001, Kerstetter et al. 1997). The pulp and paper industry functions as the world’s largest established non-food biomass collection system (Connor 2008). Black liquor, an aqueous solution of lignin residues, hemicellulose, and inorganic chemicals, produced as a by-product of pulp and paper manufacture, contains 35 percent of the original wood energy and could
Figure 4.1.3. Wood Chips (NREL).
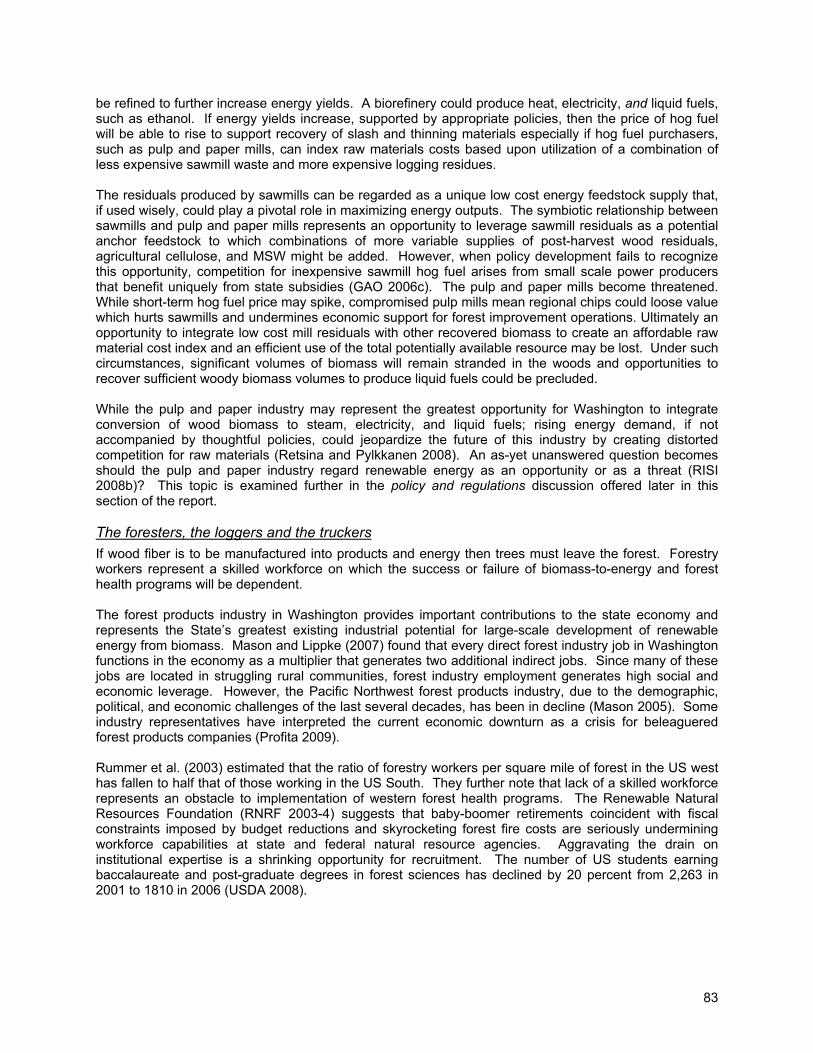
83
be refined to further increase energy yields. A biorefinery could produce heat, electricity, and liquid fuels, such as ethanol. If energy yields increase, supported by appropriate policies, then the price of hog fuel will be able to rise to support recovery of slash and thinning materials especially if hog fuel purchasers, such as pulp and paper mills, can index raw materials costs based upon utilization of a combination of less expensive sawmill waste and more expensive logging residues. The residuals produced by sawmills can be regarded as a unique low cost energy feedstock supply that, if used wisely, could play a pivotal role in maximizing energy outputs. The symbiotic relationship between sawmills and pulp and paper mills represents an opportunity to leverage sawmill residuals as a potential anchor feedstock to which combinations of more variable supplies of post-harvest wood residuals, agricultural cellulose, and MSW might be added. However, when policy development fails to recognize this opportunity, competition for inexpensive sawmill hog fuel arises from small scale power producers that benefit uniquely from state subsidies (GAO 2006c). The pulp and paper mills become threatened. While short-term hog fuel price may spike, compromised pulp mills mean regional chips could loose value which hurts sawmills and undermines economic support for forest improvement operations. Ultimately an opportunity to integrate low cost mill residuals with other recovered biomass to create an affordable raw material cost index and an efficient use of the total potentially available resource may be lost. Under such circumstances, significant volumes of biomass will remain stranded in the woods and opportunities to recover sufficient woody biomass volumes to produce liquid fuels could be precluded. While the pulp and paper industry may represent the greatest opportunity for Washington to integrate conversion of wood biomass to steam, electricity, and liquid fuels; rising energy demand, if not accompanied by thoughtful policies, could jeopardize the future of this industry by creating distorted competition for raw materials (Retsina and Pylkkanen 2008). An as-yet unanswered question becomes should the pulp and paper industry regard renewable energy as an opportunity or as a threat (RISI 2008b)? This topic is examined further in the policy and regulations discussion offered later in this section of the report. The foresters, the loggers and the truckers If wood fiber is to be manufactured into products and energy then trees must leave the forest. Forestry workers represent a skilled workforce on which the success or failure of biomass-to-energy and forest health programs will be dependent. The forest products industry in Washington provides important contributions to the state economy and represents the State’s greatest existing industrial potential for large-scale development of renewable energy from biomass. Mason and Lippke (2007) found that every direct forest industry job in Washington functions in the economy as a multiplier that generates two additional indirect jobs. Since many of these jobs are located in struggling rural communities, forest industry employment generates high social and economic leverage. However, the Pacific Northwest forest products industry, due to the demographic, political, and economic challenges of the last several decades, has been in decline (Mason 2005). Some industry representatives have interpreted the current economic downturn as a crisis for beleaguered forest products companies (Profita 2009). Rummer et al. (2003) estimated that the ratio of forestry workers per square mile of forest in the US west has fallen to half that of those working in the US South. They further note that lack of a skilled workforce represents an obstacle to implementation of western forest health programs. The Renewable Natural Resources Foundation (RNRF 2003-4) suggests that baby-boomer retirements coincident with fiscal constraints imposed by budget reductions and skyrocketing forest fire costs are seriously undermining workforce capabilities at state and federal natural resource agencies. Aggravating the drain on institutional expertise is a shrinking opportunity for recruitment. The number of US students earning baccalaureate and post-graduate degrees in forest sciences has declined by 20 percent from 2,263 in 2001 to 1810 in 2006 (USDA 2008).
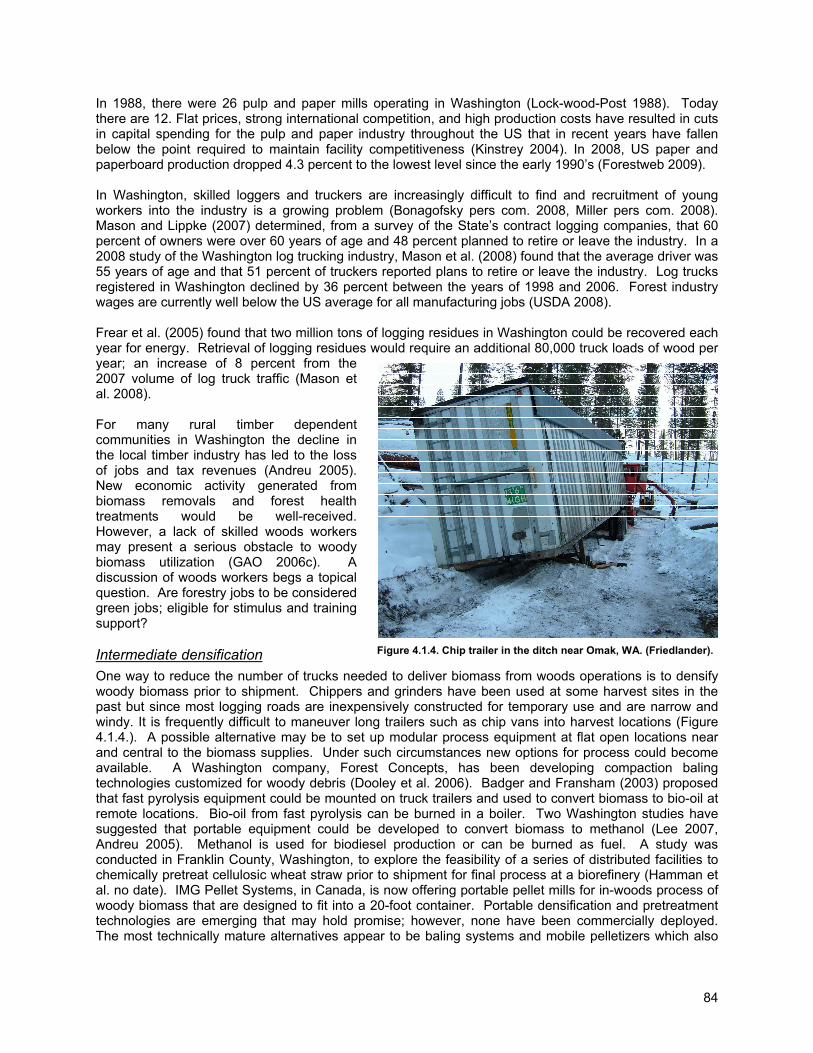
84
In 1988, there were 26 pulp and paper mills operating in Washington (Lock-wood-Post 1988). Today there are 12. Flat prices, strong international competition, and high production costs have resulted in cuts in capital spending for the pulp and paper industry throughout the US that in recent years have fallen below the point required to maintain facility competitiveness (Kinstrey 2004). In 2008, US paper and paperboard production dropped 4.3 percent to the lowest level since the early 1990’s (Forestweb 2009). In Washington, skilled loggers and truckers are increasingly difficult to find and recruitment of young workers into the industry is a growing problem (Bonagofsky pers com. 2008, Miller pers com. 2008). Mason and Lippke (2007) determined, from a survey of the State’s contract logging companies, that 60 percent of owners were over 60 years of age and 48 percent planned to retire or leave the industry. In a 2008 study of the Washington log trucking industry, Mason et al. (2008) found that the average driver was 55 years of age and that 51 percent of truckers reported plans to retire or leave the industry. Log trucks registered in Washington declined by 36 percent between the years of 1998 and 2006. Forest industry wages are currently well below the US average for all manufacturing jobs (USDA 2008). Frear et al. (2005) found that two million tons of logging residues in Washington could be recovered each year for energy. Retrieval of logging residues would require an additional 80,000 truck loads of wood per year; an increase of 8 percent from the 2007 volume of log truck traffic (Mason et al. 2008). For many rural timber dependent communities in Washington the decline in the local timber industry has led to the loss of jobs and tax revenues (Andreu 2005). New economic activity generated from biomass removals and forest health treatments would be well-received. However, a lack of skilled woods workers may present a serious obstacle to woody biomass utilization (GAO 2006c). A discussion of woods workers begs a topical question. Are forestry jobs to be considered green jobs; eligible for stimulus and training support? Intermediate densification One way to reduce the number of trucks needed to deliver biomass from woods operations is to densify woody biomass prior to shipment. Chippers and grinders have been used at some harvest sites in the past but since most logging roads are inexpensively constructed for temporary use and are narrow and windy. It is frequently difficult to maneuver long trailers such as chip vans into harvest locations (Figure 4.1.4.). A possible alternative may be to set up modular process equipment at flat open locations near and central to the biomass supplies. Under such circumstances new options for process could become available. A Washington company, Forest Concepts, has been developing compaction baling technologies customized for woody debris (Dooley et al. 2006). Badger and Fransham (2003) proposed that fast pyrolysis equipment could be mounted on truck trailers and used to convert biomass to bio-oil at remote locations. Bio-oil from fast pyrolysis can be burned in a boiler. Two Washington studies have suggested that portable equipment could be developed to convert biomass to methanol (Lee 2007, Andreu 2005). Methanol is used for biodiesel production or can be burned as fuel. A study was conducted in Franklin County, Washington, to explore the feasibility of a series of distributed facilities to chemically pretreat cellulosic wheat straw prior to shipment for final process at a biorefinery (Hamman et al. no date). IMG Pellet Systems, in Canada, is now offering portable pellet mills for in-woods process of woody biomass that are designed to fit into a 20-foot container. Portable densification and pretreatment technologies are emerging that may hold promise; however, none have been commercially deployed. The most technically mature alternatives appear to be baling systems and mobile pelletizers which also
Figure 4.1.4. Chip trailer in the ditch near Omak, WA. (Friedlander).
85
could have a potential advantage over the other pretreatment options since condensed materials are a market-flexible product and can be used as a feedstock material for any industrial conversion application (heat, co-fire, electricity, or liquid fuels). Portable equipment for baling or manufacture of pellets would require significantly lower capital investment than the liquid fuels pretreatment options. For example, the cost for a portable pellet mill plus the necessary support equipment for materials handling would be in the realm of $500,000 while liquid fuels equipment could be several times as expensive. For a start-up company, purchase of logging equipment could add another $1,000,000. Businesses will need to secure investment capital for equipment to recover, process, and deliver biomass. An adequate supply of raw material must be assured to justify investment. The uncertainty of wood biomass availability is an obstacle to progress.
Figure 4.1.5. Portable pelletizers (IMG Pellet Systems). Supply assurance For either electrical generation or liquid fuels conversions, sizeable facilities are needed if costs and feedstocks requirements per unit energy output are to be minimized through achievement of investment effectiveness and operational efficiencies. For example, an Oregon study of biomass potential found that a 50 MW biomass generation facility would require 5.8 times as much fuel as a 5 MW plant yet would generate 10 times the electricity (McNeil Technologies 2003). If feedstock cost is held at $46 per dry ton, the McNeil comparison shows that a 5 MW plant would produce power at $0.13 per kWh while the 50 MW plant could produce at $0.085 per kWh. The Antares Group (2008), as part of a broader study commissioned by the Western Governors Association (2008b), modeled comparative unit costs of conversion for biorefineries of differing output capacities. Variables influencing the unit cost of conversion included increased feedstock cost as larger facility demand expanded the delivery area and decreases in capital and production costs per unit output as scales of efficiency were achieved. Biorefineries with less than 50 million gallons per year of output capacity were shown to have significantly higher unit costs of conversion than larger plants.
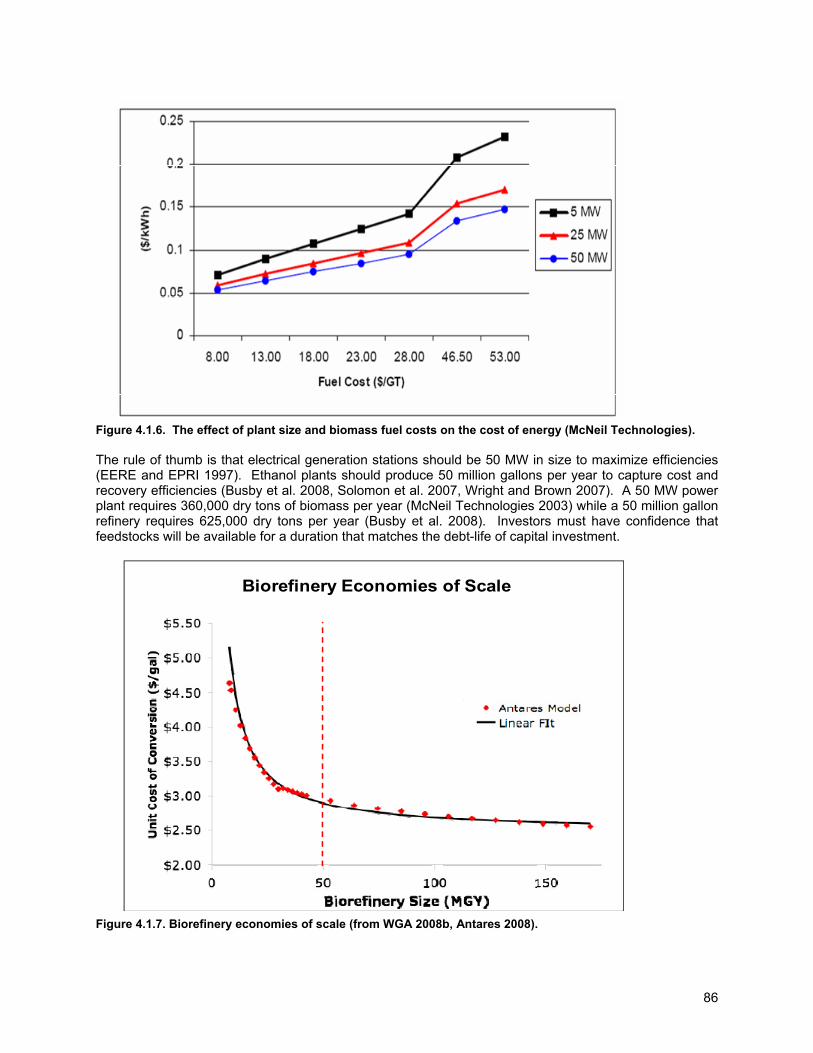
86
Figure 4.1.6. The effect of plant size and biomass fuel costs on the cost of energy (McNeil Technologies). The rule of thumb is that electrical generation stations should be 50 MW in size to maximize efficiencies (EERE and EPRI 1997). Ethanol plants should produce 50 million gallons per year to capture cost and recovery efficiencies (Busby et al. 2008, Solomon et al. 2007, Wright and Brown 2007). A 50 MW power plant requires 360,000 dry tons of biomass per year (McNeil Technologies 2003) while a 50 million gallon refinery requires 625,000 dry tons per year (Busby et al. 2008). Investors must have confidence that feedstocks will be available for a duration that matches the debt-life of capital investment.
Figure 4.1.7. Biorefinery economies of scale (from WGA 2008b, Antares 2008).
Biorefinery Economies of Scale
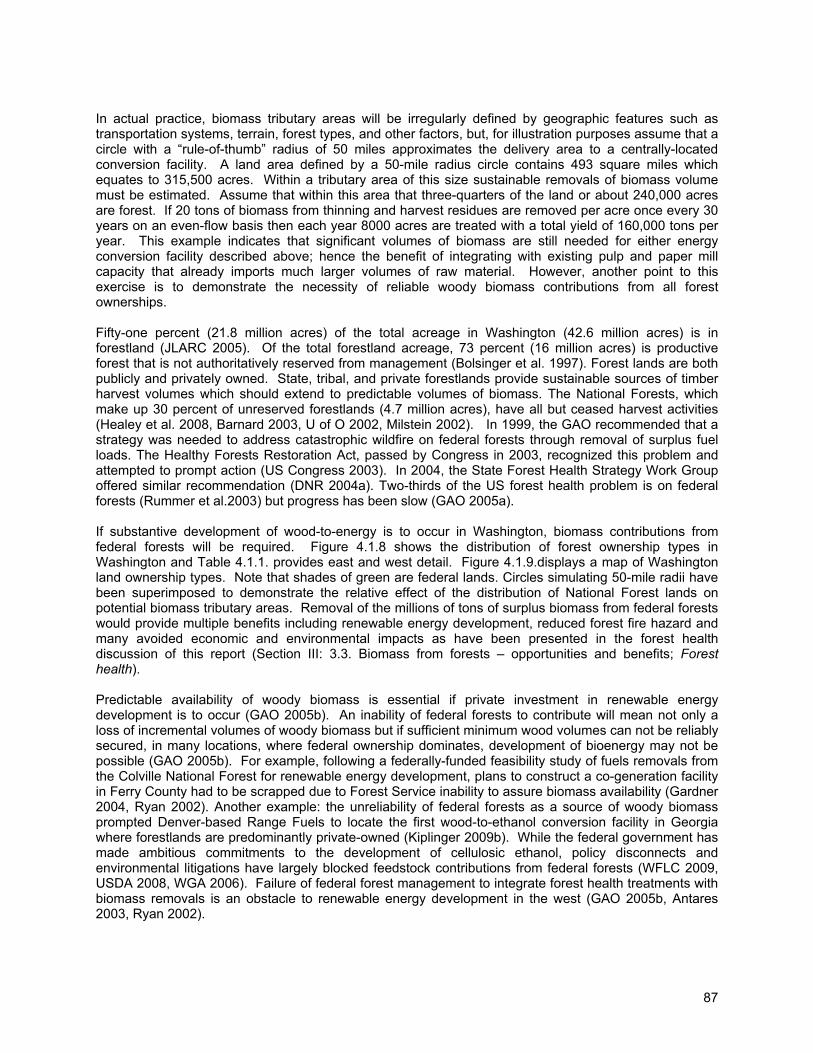
87
In actual practice, biomass tributary areas will be irregularly defined by geographic features such as transportation systems, terrain, forest types, and other factors, but, for illustration purposes assume that a circle with a “rule-of-thumb” radius of 50 miles approximates the delivery area to a centrally-located conversion facility. A land area defined by a 50-mile radius circle contains 493 square miles which equates to 315,500 acres. Within a tributary area of this size sustainable removals of biomass volume must be estimated. Assume that within this area that three-quarters of the land or about 240,000 acres are forest. If 20 tons of biomass from thinning and harvest residues are removed per acre once every 30 years on an even-flow basis then each year 8000 acres are treated with a total yield of 160,000 tons per year. This example indicates that significant volumes of biomass are still needed for either energy conversion facility described above; hence the benefit of integrating with existing pulp and paper mill capacity that already imports much larger volumes of raw material. However, another point to this exercise is to demonstrate the necessity of reliable woody biomass contributions from all forest ownerships. Fifty-one percent (21.8 million acres) of the total acreage in Washington (42.6 million acres) is in forestland (JLARC 2005). Of the total forestland acreage, 73 percent (16 million acres) is productive forest that is not authoritatively reserved from management (Bolsinger et al. 1997). Forest lands are both publicly and privately owned. State, tribal, and private forestlands provide sustainable sources of timber harvest volumes which should extend to predictable volumes of biomass. The National Forests, which make up 30 percent of unreserved forestlands (4.7 million acres), have all but ceased harvest activities (Healey et al. 2008, Barnard 2003, U of O 2002, Milstein 2002). In 1999, the GAO recommended that a strategy was needed to address catastrophic wildfire on federal forests through removal of surplus fuel loads. The Healthy Forests Restoration Act, passed by Congress in 2003, recognized this problem and attempted to prompt action (US Congress 2003). In 2004, the State Forest Health Strategy Work Group offered similar recommendation (DNR 2004a). Two-thirds of the US forest health problem is on federal forests (Rummer et al.2003) but progress has been slow (GAO 2005a). If substantive development of wood-to-energy is to occur in Washington, biomass contributions from federal forests will be required. Figure 4.1.8 shows the distribution of forest ownership types in Washington and Table 4.1.1. provides east and west detail. Figure 4.1.9.displays a map of Washington land ownership types. Note that shades of green are federal lands. Circles simulating 50-mile radii have been superimposed to demonstrate the relative effect of the distribution of National Forest lands on potential biomass tributary areas. Removal of the millions of tons of surplus biomass from federal forests would provide multiple benefits including renewable energy development, reduced forest fire hazard and many avoided economic and environmental impacts as have been presented in the forest health discussion of this report (Section III: 3.3. Biomass from forests – opportunities and benefits; Forest health). Predictable availability of woody biomass is essential if private investment in renewable energy development is to occur (GAO 2005b). An inability of federal forests to contribute will mean not only a loss of incremental volumes of woody biomass but if sufficient minimum wood volumes can not be reliably secured, in many locations, where federal ownership dominates, development of bioenergy may not be possible (GAO 2005b). For example, following a federally-funded feasibility study of fuels removals from the Colville National Forest for renewable energy development, plans to construct a co-generation facility in Ferry County had to be scrapped due to Forest Service inability to assure biomass availability (Gardner 2004, Ryan 2002). Another example: the unreliability of federal forests as a source of woody biomass prompted Denver-based Range Fuels to locate the first wood-to-ethanol conversion facility in Georgia where forestlands are predominantly private-owned (Kiplinger 2009b). While the federal government has made ambitious commitments to the development of cellulosic ethanol, policy disconnects and environmental litigations have largely blocked feedstock contributions from federal forests (WFLC 2009, USDA 2008, WGA 2006). Failure of federal forest management to integrate forest health treatments with biomass removals is an obstacle to renewable energy development in the west (GAO 2005b, Antares 2003, Ryan 2002).
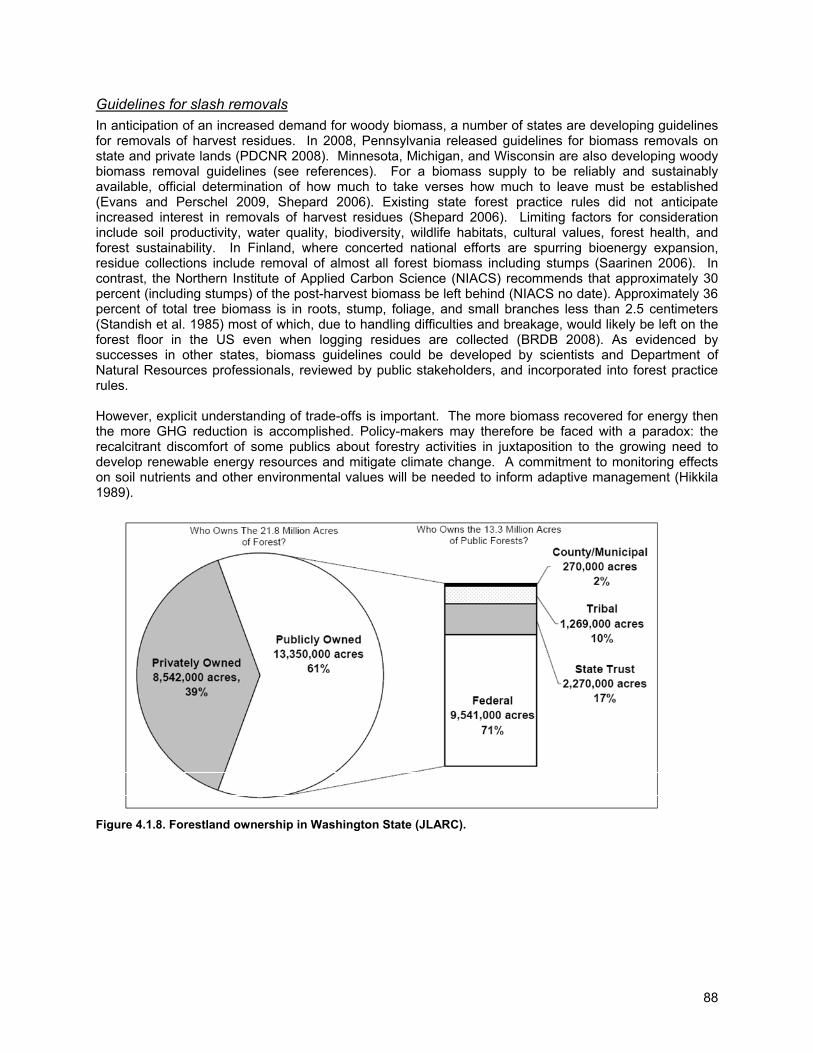
88
Guidelines for slash removals In anticipation of an increased demand for woody biomass, a number of states are developing guidelines for removals of harvest residues. In 2008, Pennsylvania released guidelines for biomass removals on state and private lands (PDCNR 2008). Minnesota, Michigan, and Wisconsin are also developing woody biomass removal guidelines (see references). For a biomass supply to be reliably and sustainably available, official determination of how much to take verses how much to leave must be established (Evans and Perschel 2009, Shepard 2006). Existing state forest practice rules did not anticipate increased interest in removals of harvest residues (Shepard 2006). Limiting factors for consideration include soil productivity, water quality, biodiversity, wildlife habitats, cultural values, forest health, and forest sustainability. In Finland, where concerted national efforts are spurring bioenergy expansion, residue collections include removal of almost all forest biomass including stumps (Saarinen 2006). In contrast, the Northern Institute of Applied Carbon Science (NIACS) recommends that approximately 30 percent (including stumps) of the post-harvest biomass be left behind (NIACS no date). Approximately 36 percent of total tree biomass is in roots, stump, foliage, and small branches less than 2.5 centimeters (Standish et al. 1985) most of which, due to handling difficulties and breakage, would likely be left on the forest floor in the US even when logging residues are collected (BRDB 2008). As evidenced by successes in other states, biomass guidelines could be developed by scientists and Department of Natural Resources professionals, reviewed by public stakeholders, and incorporated into forest practice rules. However, explicit understanding of trade-offs is important. The more biomass recovered for energy then the more GHG reduction is accomplished. Policy-makers may therefore be faced with a paradox: the recalcitrant discomfort of some publics about forestry activities in juxtaposition to the growing need to develop renewable energy resources and mitigate climate change. A commitment to monitoring effects on soil nutrients and other environmental values will be needed to inform adaptive management (Hikkila 1989).
Figure 4.1.8. Forestland ownership in Washington State (JLARC).
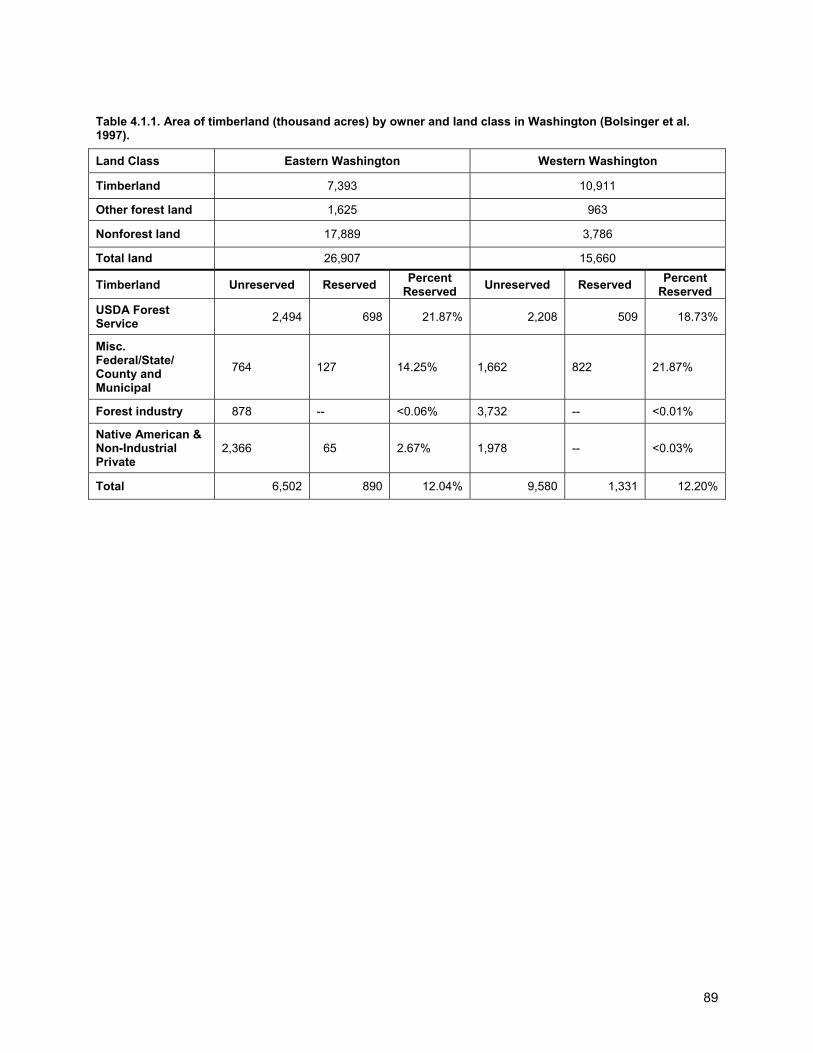
89
Table 4.1.1. Area of timberland (thousand acres) by owner and land class in Washington (Bolsinger et al. 1997).
Land Class Eastern Washington Western Washington
Timberland 7,393 10,911
Other forest land 1,625 963
Nonforest land 17,889 3,786
Total land 26,907 15,660
Timberland Unreserved Reserved Percent Reserved Unreserved Reserved Percent
Reserved USDA Forest Service 2,494 698 21.87% 2,208 509 18.73%
Misc. Federal/State/ County and Municipal
764 127 14.25% 1,662 822 21.87%
Forest industry 878 -- <0.06% 3,732 -- <0.01%
Native American & Non-Industrial Private
2,366 65 2.67% 1,978 -- <0.03%
Total 6,502 890 12.04% 9,580 1,331 12.20%
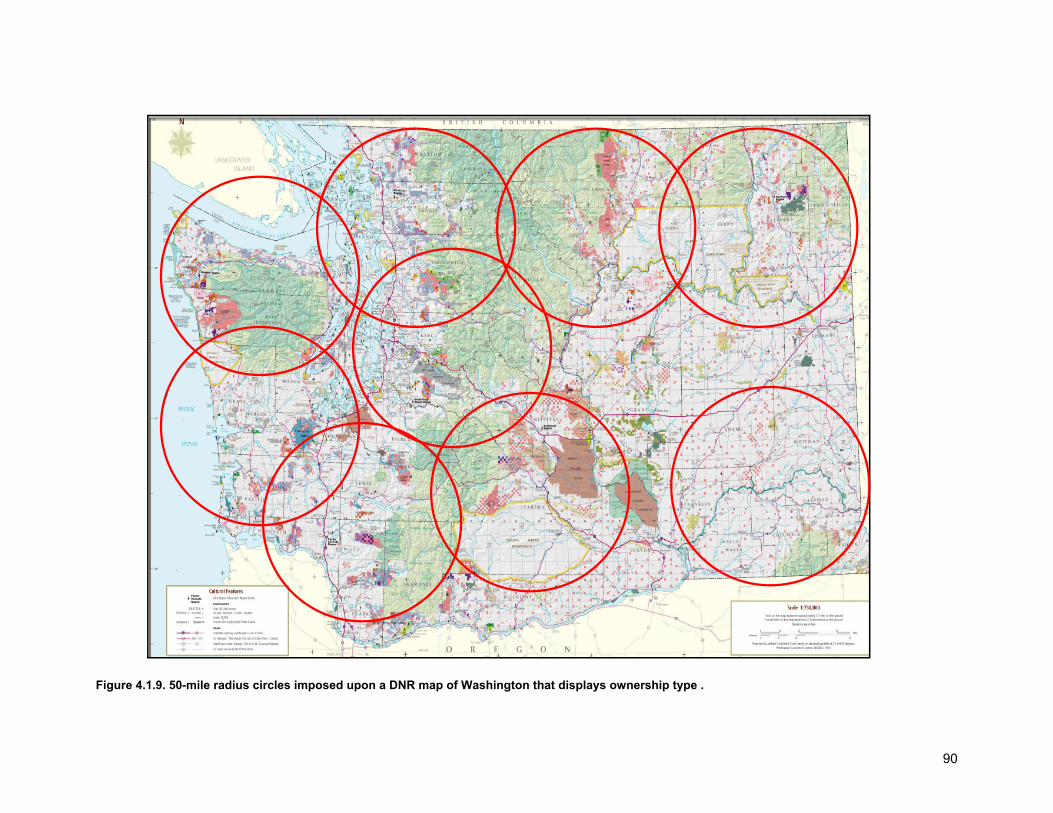
90
Figure 4.1.9. 50-mile radius circles imposed upon a DNR map of Washington that displays ownership type .
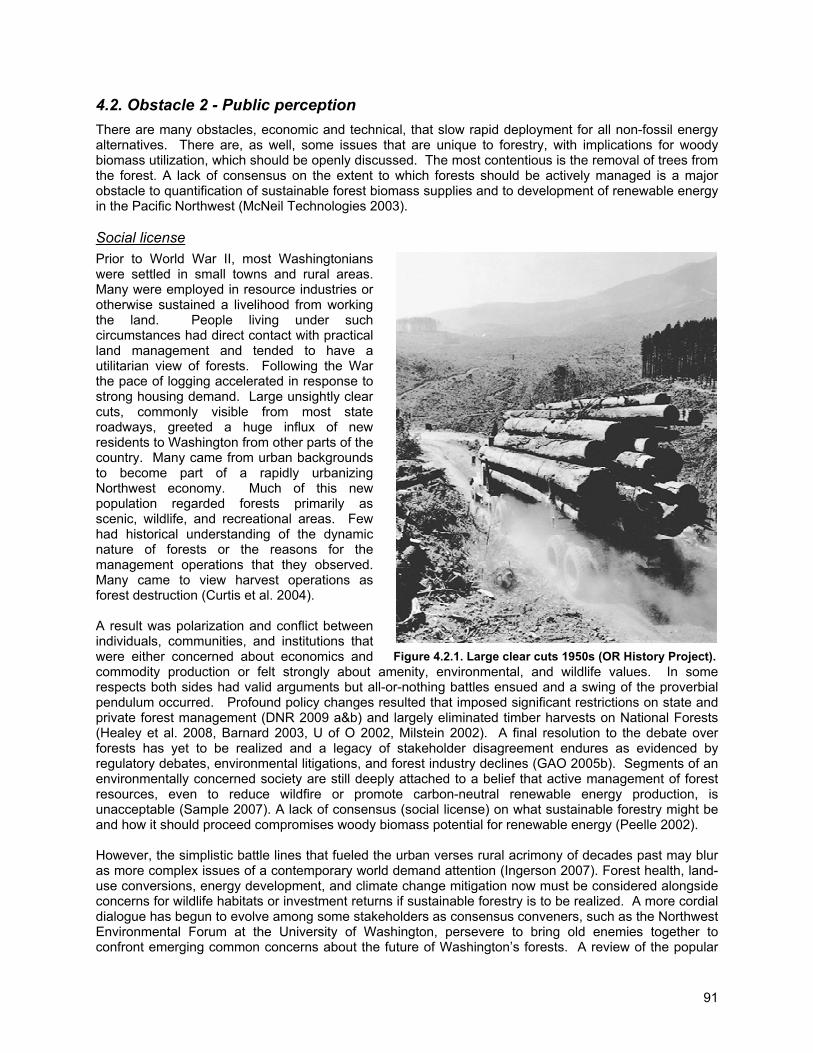
91
4.2. Obstacle 2 - Public perception There are many obstacles, economic and technical, that slow rapid deployment for all non-fossil energy alternatives. There are, as well, some issues that are unique to forestry, with implications for woody biomass utilization, which should be openly discussed. The most contentious is the removal of trees from the forest. A lack of consensus on the extent to which forests should be actively managed is a major obstacle to quantification of sustainable forest biomass supplies and to development of renewable energy in the Pacific Northwest (McNeil Technologies 2003). Social license Prior to World War II, most Washingtonians were settled in small towns and rural areas. Many were employed in resource industries or otherwise sustained a livelihood from working the land. People living under such circumstances had direct contact with practical land management and tended to have a utilitarian view of forests. Following the War the pace of logging accelerated in response to strong housing demand. Large unsightly clear cuts, commonly visible from most state roadways, greeted a huge influx of new residents to Washington from other parts of the country. Many came from urban backgrounds to become part of a rapidly urbanizing Northwest economy. Much of this new population regarded forests primarily as scenic, wildlife, and recreational areas. Few had historical understanding of the dynamic nature of forests or the reasons for the management operations that they observed. Many came to view harvest operations as forest destruction (Curtis et al. 2004). A result was polarization and conflict between individuals, communities, and institutions that were either concerned about economics and commodity production or felt strongly about amenity, environmental, and wildlife values. In some respects both sides had valid arguments but all-or-nothing battles ensued and a swing of the proverbial pendulum occurred. Profound policy changes resulted that imposed significant restrictions on state and private forest management (DNR 2009 a&b) and largely eliminated timber harvests on National Forests (Healey et al. 2008, Barnard 2003, U of O 2002, Milstein 2002). A final resolution to the debate over forests has yet to be realized and a legacy of stakeholder disagreement endures as evidenced by regulatory debates, environmental litigations, and forest industry declines (GAO 2005b). Segments of an environmentally concerned society are still deeply attached to a belief that active management of forest resources, even to reduce wildfire or promote carbon-neutral renewable energy production, is unacceptable (Sample 2007). A lack of consensus (social license) on what sustainable forestry might be and how it should proceed compromises woody biomass potential for renewable energy (Peelle 2002). However, the simplistic battle lines that fueled the urban verses rural acrimony of decades past may blur as more complex issues of a contemporary world demand attention (Ingerson 2007). Forest health, land-use conversions, energy development, and climate change mitigation now must be considered alongside concerns for wildlife habitats or investment returns if sustainable forestry is to be realized. A more cordial dialogue has begun to evolve among some stakeholders as consensus conveners, such as the Northwest Environmental Forum at the University of Washington, persevere to bring old enemies together to confront emerging common concerns about the future of Washington’s forests. A review of the popular
Figure 4.2.1. Large clear cuts 1950s (OR History Project).
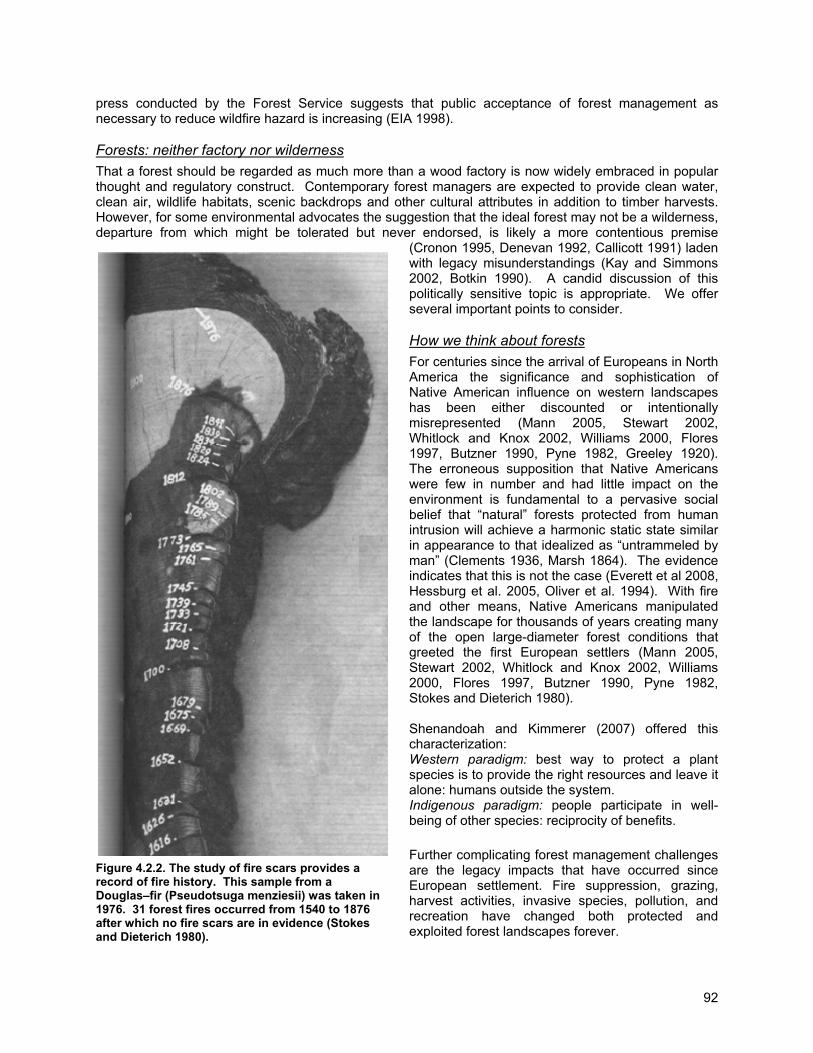
92
press conducted by the Forest Service suggests that public acceptance of forest management as necessary to reduce wildfire hazard is increasing (EIA 1998). Forests: neither factory nor wilderness That a forest should be regarded as much more than a wood factory is now widely embraced in popular thought and regulatory construct. Contemporary forest managers are expected to provide clean water, clean air, wildlife habitats, scenic backdrops and other cultural attributes in addition to timber harvests. However, for some environmental advocates the suggestion that the ideal forest may not be a wilderness, departure from which might be tolerated but never endorsed, is likely a more contentious premise
(Cronon 1995, Denevan 1992, Callicott 1991) laden with legacy misunderstandings (Kay and Simmons 2002, Botkin 1990). A candid discussion of this politically sensitive topic is appropriate. We offer several important points to consider. How we think about forests For centuries since the arrival of Europeans in North America the significance and sophistication of Native American influence on western landscapes has been either discounted or intentionally misrepresented (Mann 2005, Stewart 2002, Whitlock and Knox 2002, Williams 2000, Flores 1997, Butzner 1990, Pyne 1982, Greeley 1920). The erroneous supposition that Native Americans were few in number and had little impact on the environment is fundamental to a pervasive social belief that “natural” forests protected from human intrusion will achieve a harmonic static state similar in appearance to that idealized as “untrammeled by man” (Clements 1936, Marsh 1864). The evidence indicates that this is not the case (Everett et al 2008, Hessburg et al. 2005, Oliver et al. 1994). With fire and other means, Native Americans manipulated the landscape for thousands of years creating many of the open large-diameter forest conditions that greeted the first European settlers (Mann 2005, Stewart 2002, Whitlock and Knox 2002, Williams 2000, Flores 1997, Butzner 1990, Pyne 1982, Stokes and Dieterich 1980). Shenandoah and Kimmerer (2007) offered this characterization: Western paradigm: best way to protect a plant species is to provide the right resources and leave it alone: humans outside the system. Indigenous paradigm: people participate in well-being of other species: reciprocity of benefits. Further complicating forest management challenges are the legacy impacts that have occurred since European settlement. Fire suppression, grazing, harvest activities, invasive species, pollution, and recreation have changed both protected and exploited forest landscapes forever.
Figure 4.2.2. The study of fire scars provides a record of fire history. This sample from a Douglas–fir (Pseudotsuga menziesii) was taken in 1976. 31 forest fires occurred from 1540 to 1876 after which no fire scars are in evidence (Stokes and Dieterich 1980).
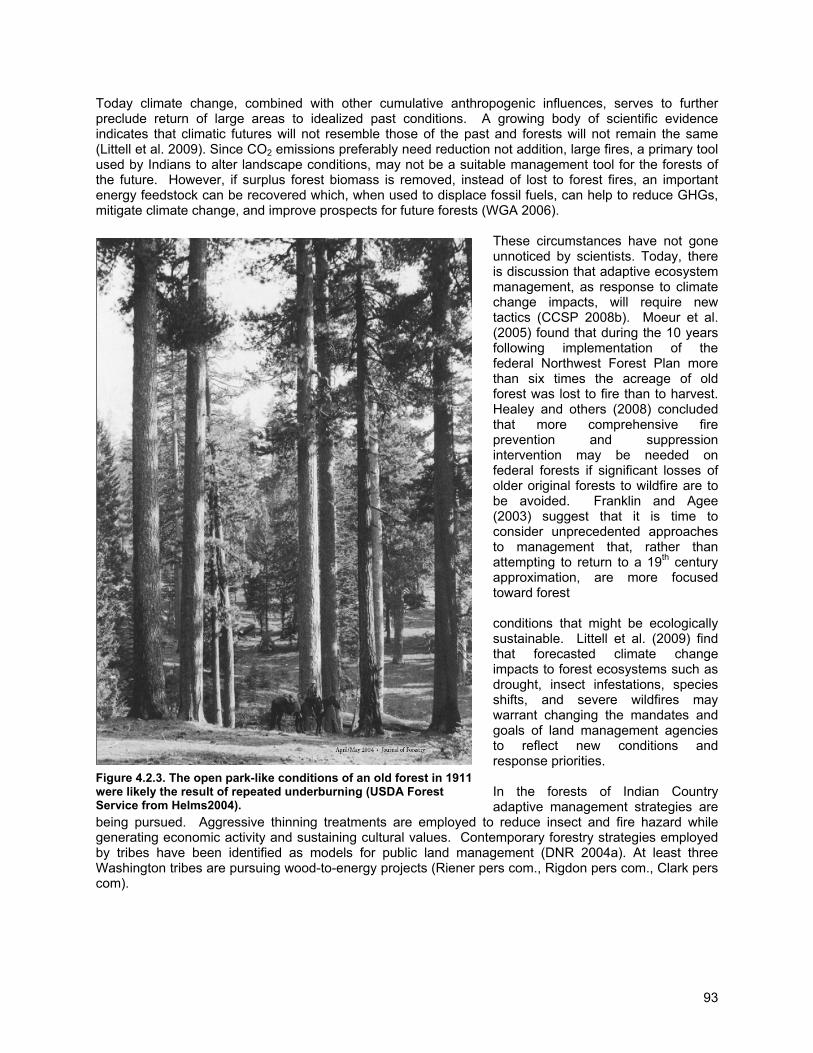
93
Today climate change, combined with other cumulative anthropogenic influences, serves to further preclude return of large areas to idealized past conditions. A growing body of scientific evidence indicates that climatic futures will not resemble those of the past and forests will not remain the same (Littell et al. 2009). Since CO2 emissions preferably need reduction not addition, large fires, a primary tool used by Indians to alter landscape conditions, may not be a suitable management tool for the forests of the future. However, if surplus forest biomass is removed, instead of lost to forest fires, an important energy feedstock can be recovered which, when used to displace fossil fuels, can help to reduce GHGs, mitigate climate change, and improve prospects for future forests (WGA 2006).
These circumstances have not gone unnoticed by scientists. Today, there is discussion that adaptive ecosystem management, as response to climate change impacts, will require new tactics (CCSP 2008b). Moeur et al. (2005) found that during the 10 years following implementation of the federal Northwest Forest Plan more than six times the acreage of old forest was lost to fire than to harvest. Healey and others (2008) concluded that more comprehensive fire prevention and suppression intervention may be needed on federal forests if significant losses of older original forests to wildfire are to be avoided. Franklin and Agee (2003) suggest that it is time to consider unprecedented approaches to management that, rather than attempting to return to a 19th century approximation, are more focused toward forest conditions that might be ecologically sustainable. Littell et al. (2009) find that forecasted climate change impacts to forest ecosystems such as drought, insect infestations, species shifts, and severe wildfires may warrant changing the mandates and goals of land management agencies to reflect new conditions and response priorities. In the forests of Indian Country adaptive management strategies are
being pursued. Aggressive thinning treatments are employed to reduce insect and fire hazard while generating economic activity and sustaining cultural values. Contemporary forestry strategies employed by tribes have been identified as models for public land management (DNR 2004a). At least three Washington tribes are pursuing wood-to-energy projects (Riener pers com., Rigdon pers com., Clark pers com).
Figure 4.2.3. The open park-like conditions of an old forest in 1911 were likely the result of repeated underburning (USDA Forest Service from Helms2004).
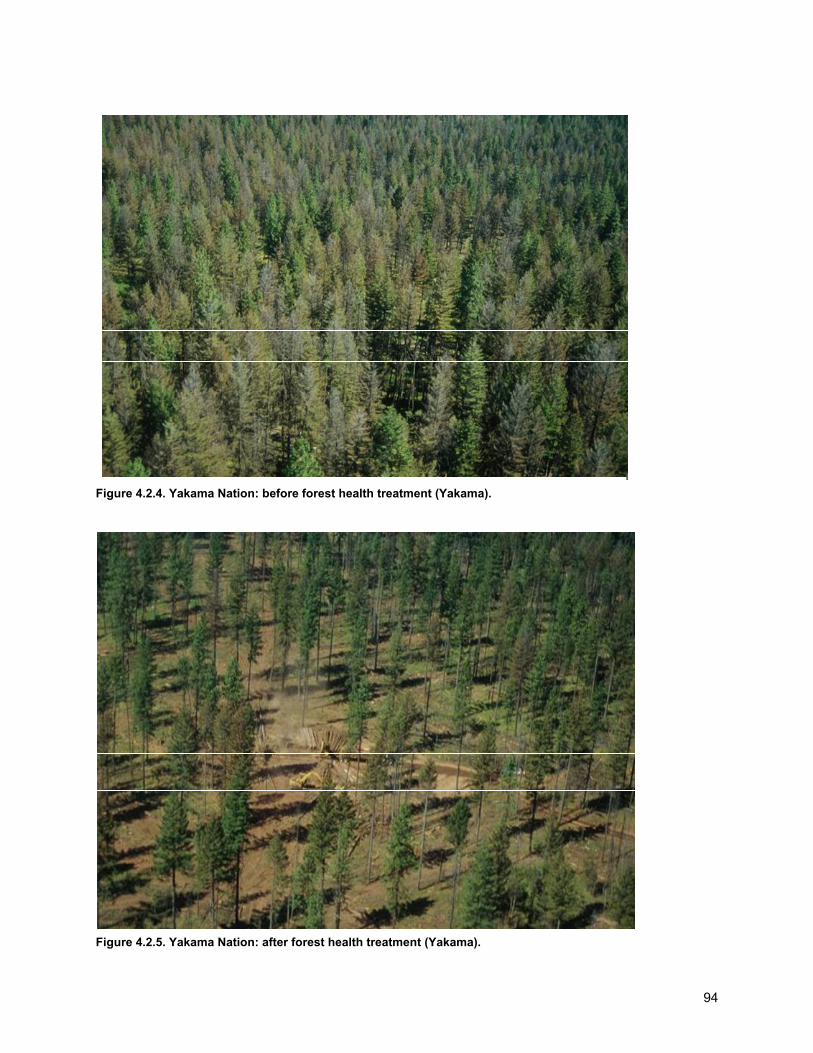
94
Figure 4.2.4. Yakama Nation: before forest health treatment (Yakama).
Figure 4.2.5. Yakama Nation: after forest health treatment (Yakama).
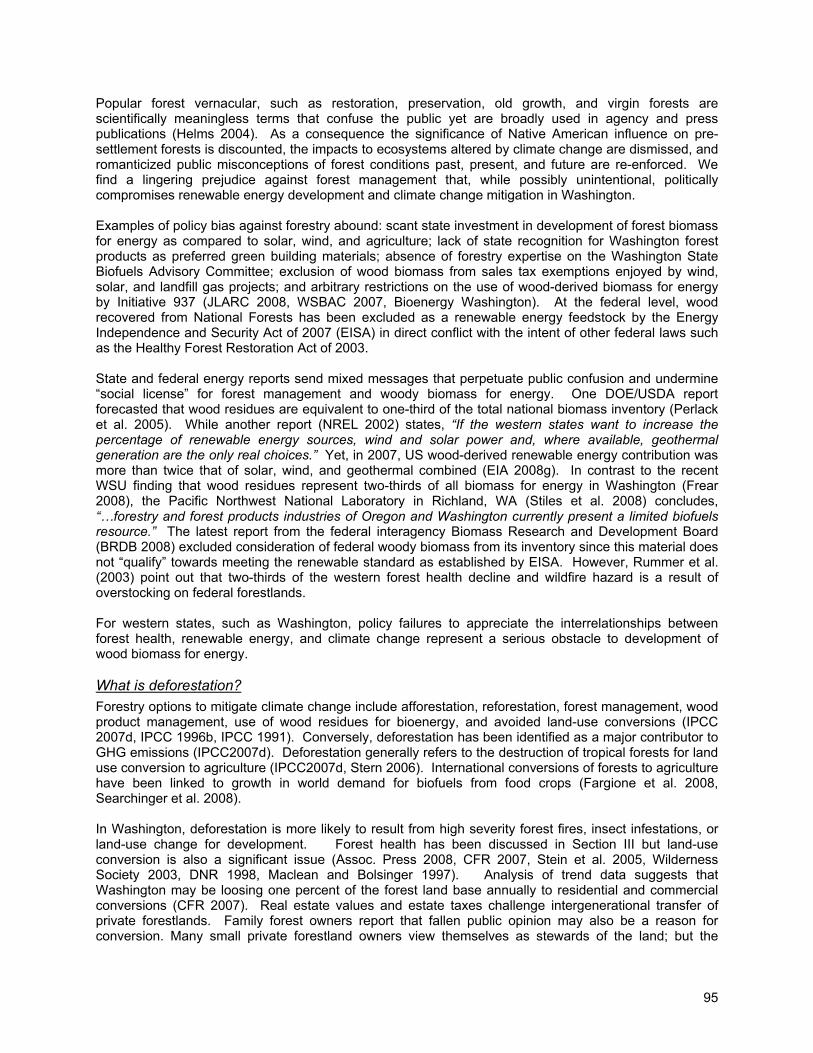
95
Popular forest vernacular, such as restoration, preservation, old growth, and virgin forests are scientifically meaningless terms that confuse the public yet are broadly used in agency and press publications (Helms 2004). As a consequence the significance of Native American influence on pre-settlement forests is discounted, the impacts to ecosystems altered by climate change are dismissed, and romanticized public misconceptions of forest conditions past, present, and future are re-enforced. We find a lingering prejudice against forest management that, while possibly unintentional, politically compromises renewable energy development and climate change mitigation in Washington. Examples of policy bias against forestry abound: scant state investment in development of forest biomass for energy as compared to solar, wind, and agriculture; lack of state recognition for Washington forest products as preferred green building materials; absence of forestry expertise on the Washington State Biofuels Advisory Committee; exclusion of wood biomass from sales tax exemptions enjoyed by wind, solar, and landfill gas projects; and arbitrary restrictions on the use of wood-derived biomass for energy by Initiative 937 (JLARC 2008, WSBAC 2007, Bioenergy Washington). At the federal level, wood recovered from National Forests has been excluded as a renewable energy feedstock by the Energy Independence and Security Act of 2007 (EISA) in direct conflict with the intent of other federal laws such as the Healthy Forest Restoration Act of 2003. State and federal energy reports send mixed messages that perpetuate public confusion and undermine “social license” for forest management and woody biomass for energy. One DOE/USDA report forecasted that wood residues are equivalent to one-third of the total national biomass inventory (Perlack et al. 2005). While another report (NREL 2002) states, “If the western states want to increase the percentage of renewable energy sources, wind and solar power and, where available, geothermal generation are the only real choices.” Yet, in 2007, US wood-derived renewable energy contribution was more than twice that of solar, wind, and geothermal combined (EIA 2008g). In contrast to the recent WSU finding that wood residues represent two-thirds of all biomass for energy in Washington (Frear 2008), the Pacific Northwest National Laboratory in Richland, WA (Stiles et al. 2008) concludes, “…forestry and forest products industries of Oregon and Washington currently present a limited biofuels resource.” The latest report from the federal interagency Biomass Research and Development Board (BRDB 2008) excluded consideration of federal woody biomass from its inventory since this material does not “qualify” towards meeting the renewable standard as established by EISA. However, Rummer et al. (2003) point out that two-thirds of the western forest health decline and wildfire hazard is a result of overstocking on federal forestlands. For western states, such as Washington, policy failures to appreciate the interrelationships between forest health, renewable energy, and climate change represent a serious obstacle to development of wood biomass for energy. What is deforestation? Forestry options to mitigate climate change include afforestation, reforestation, forest management, wood product management, use of wood residues for bioenergy, and avoided land-use conversions (IPCC 2007d, IPCC 1996b, IPCC 1991). Conversely, deforestation has been identified as a major contributor to GHG emissions (IPCC2007d). Deforestation generally refers to the destruction of tropical forests for land use conversion to agriculture (IPCC2007d, Stern 2006). International conversions of forests to agriculture have been linked to growth in world demand for biofuels from food crops (Fargione et al. 2008, Searchinger et al. 2008). In Washington, deforestation is more likely to result from high severity forest fires, insect infestations, or land-use change for development. Forest health has been discussed in Section III but land-use conversion is also a significant issue (Assoc. Press 2008, CFR 2007, Stein et al. 2005, Wilderness Society 2003, DNR 1998, Maclean and Bolsinger 1997). Analysis of trend data suggests that Washington may be loosing one percent of the forest land base annually to residential and commercial conversions (CFR 2007). Real estate values and estate taxes challenge intergenerational transfer of private forestlands. Family forest owners report that fallen public opinion may also be a reason for conversion. Many small private forestland owners view themselves as stewards of the land; but the
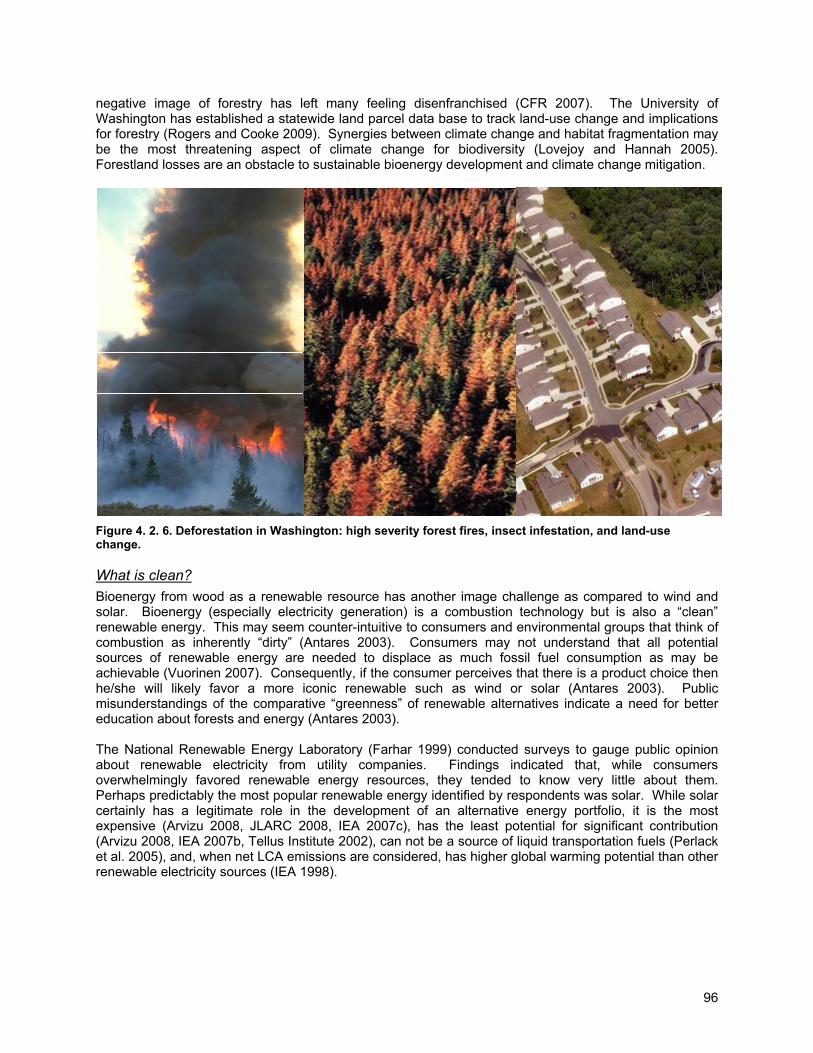
96
negative image of forestry has left many feeling disenfranchised (CFR 2007). The University of Washington has established a statewide land parcel data base to track land-use change and implications for forestry (Rogers and Cooke 2009). Synergies between climate change and habitat fragmentation may be the most threatening aspect of climate change for biodiversity (Lovejoy and Hannah 2005). Forestland losses are an obstacle to sustainable bioenergy development and climate change mitigation.
Figure 4. 2. 6. Deforestation in Washington: high severity forest fires, insect infestation, and land-use change. What is clean? Bioenergy from wood as a renewable resource has another image challenge as compared to wind and solar. Bioenergy (especially electricity generation) is a combustion technology but is also a “clean” renewable energy. This may seem counter-intuitive to consumers and environmental groups that think of combustion as inherently “dirty” (Antares 2003). Consumers may not understand that all potential sources of renewable energy are needed to displace as much fossil fuel consumption as may be achievable (Vuorinen 2007). Consequently, if the consumer perceives that there is a product choice then he/she will likely favor a more iconic renewable such as wind or solar (Antares 2003). Public misunderstandings of the comparative “greenness” of renewable alternatives indicate a need for better education about forests and energy (Antares 2003). The National Renewable Energy Laboratory (Farhar 1999) conducted surveys to gauge public opinion about renewable electricity from utility companies. Findings indicated that, while consumers overwhelmingly favored renewable energy resources, they tended to know very little about them. Perhaps predictably the most popular renewable energy identified by respondents was solar. While solar certainly has a legitimate role in the development of an alternative energy portfolio, it is the most expensive (Arvizu 2008, JLARC 2008, IEA 2007c), has the least potential for significant contribution (Arvizu 2008, IEA 2007b, Tellus Institute 2002), can not be a source of liquid transportation fuels (Perlack et al. 2005), and, when net LCA emissions are considered, has higher global warming potential than other renewable electricity sources (IEA 1998).
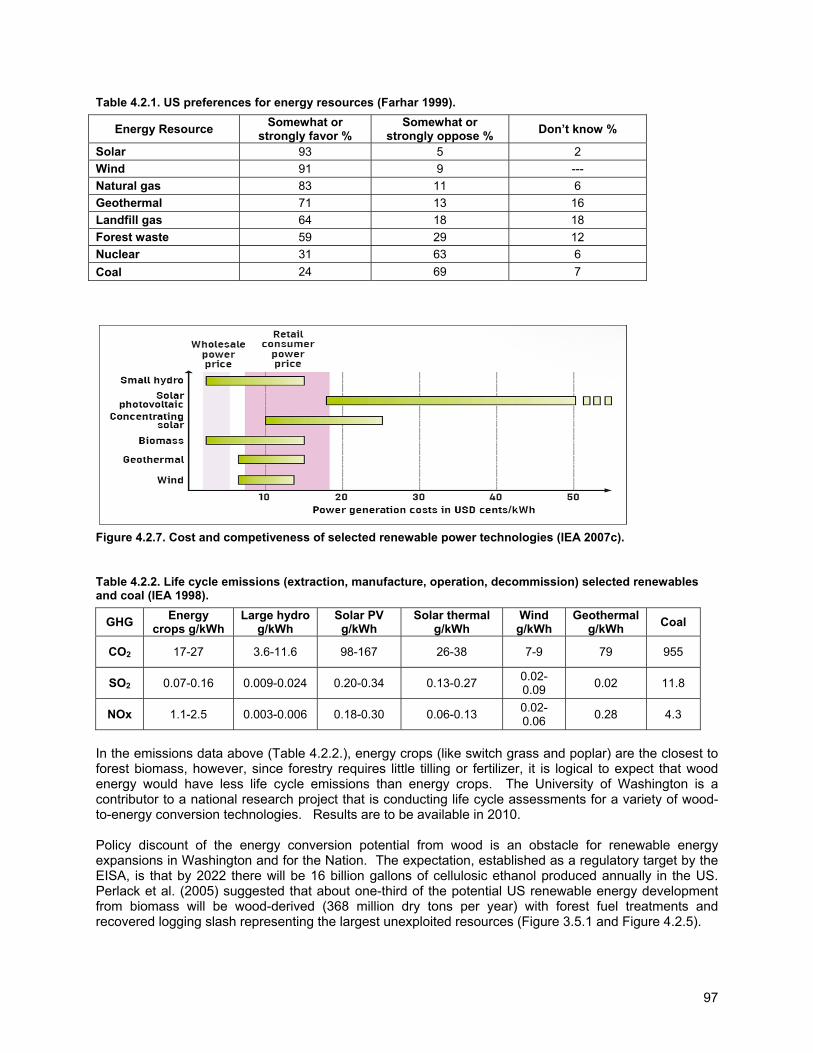
97
Table 4.2.1. US preferences for energy resources (Farhar 1999).
Energy Resource Somewhat or strongly favor %
Somewhat or strongly oppose % Don’t know %
Solar 93 5 2 Wind 91 9 --- Natural gas 83 11 6 Geothermal 71 13 16 Landfill gas 64 18 18 Forest waste 59 29 12 Nuclear 31 63 6 Coal 24 69 7
Figure 4.2.7. Cost and competiveness of selected renewable power technologies (IEA 2007c). Table 4.2.2. Life cycle emissions (extraction, manufacture, operation, decommission) selected renewables and coal (IEA 1998).
GHG Energy crops g/kWh
Large hydro g/kWh
Solar PV g/kWh
Solar thermal g/kWh
Wind g/kWh
Geothermal g/kWh Coal
CO2 17-27 3.6-11.6 98-167 26-38 7-9 79 955
SO2 0.07-0.16 0.009-0.024 0.20-0.34 0.13-0.27 0.02-0.09 0.02 11.8
NOx 1.1-2.5 0.003-0.006 0.18-0.30 0.06-0.13 0.02-0.06 0.28 4.3
In the emissions data above (Table 4.2.2.), energy crops (like switch grass and poplar) are the closest to forest biomass, however, since forestry requires little tilling or fertilizer, it is logical to expect that wood energy would have less life cycle emissions than energy crops. The University of Washington is a contributor to a national research project that is conducting life cycle assessments for a variety of wood-to-energy conversion technologies. Results are to be available in 2010. Policy discount of the energy conversion potential from wood is an obstacle for renewable energy expansions in Washington and for the Nation. The expectation, established as a regulatory target by the EISA, is that by 2022 there will be 16 billion gallons of cellulosic ethanol produced annually in the US. Perlack et al. (2005) suggested that about one-third of the potential US renewable energy development from biomass will be wood-derived (368 million dry tons per year) with forest fuel treatments and recovered logging slash representing the largest unexploited resources (Figure 3.5.1 and Figure 4.2.5).
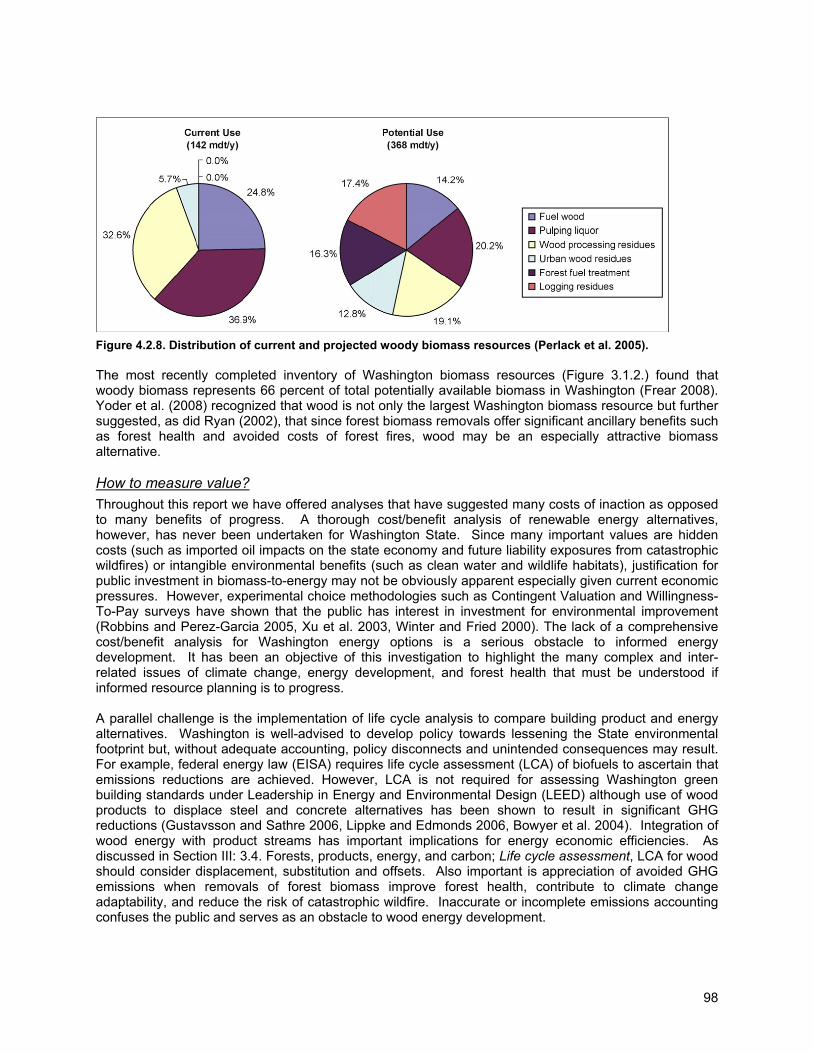
98
Figure 4.2.8. Distribution of current and projected woody biomass resources (Perlack et al. 2005). The most recently completed inventory of Washington biomass resources (Figure 3.1.2.) found that woody biomass represents 66 percent of total potentially available biomass in Washington (Frear 2008). Yoder et al. (2008) recognized that wood is not only the largest Washington biomass resource but further suggested, as did Ryan (2002), that since forest biomass removals offer significant ancillary benefits such as forest health and avoided costs of forest fires, wood may be an especially attractive biomass alternative. How to measure value? Throughout this report we have offered analyses that have suggested many costs of inaction as opposed to many benefits of progress. A thorough cost/benefit analysis of renewable energy alternatives, however, has never been undertaken for Washington State. Since many important values are hidden costs (such as imported oil impacts on the state economy and future liability exposures from catastrophic wildfires) or intangible environmental benefits (such as clean water and wildlife habitats), justification for public investment in biomass-to-energy may not be obviously apparent especially given current economic pressures. However, experimental choice methodologies such as Contingent Valuation and Willingness-To-Pay surveys have shown that the public has interest in investment for environmental improvement (Robbins and Perez-Garcia 2005, Xu et al. 2003, Winter and Fried 2000). The lack of a comprehensive cost/benefit analysis for Washington energy options is a serious obstacle to informed energy development. It has been an objective of this investigation to highlight the many complex and inter-related issues of climate change, energy development, and forest health that must be understood if informed resource planning is to progress. A parallel challenge is the implementation of life cycle analysis to compare building product and energy alternatives. Washington is well-advised to develop policy towards lessening the State environmental footprint but, without adequate accounting, policy disconnects and unintended consequences may result. For example, federal energy law (EISA) requires life cycle assessment (LCA) of biofuels to ascertain that emissions reductions are achieved. However, LCA is not required for assessing Washington green building standards under Leadership in Energy and Environmental Design (LEED) although use of wood products to displace steel and concrete alternatives has been shown to result in significant GHG reductions (Gustavsson and Sathre 2006, Lippke and Edmonds 2006, Bowyer et al. 2004). Integration of wood energy with product streams has important implications for energy economic efficiencies. As discussed in Section III: 3.4. Forests, products, energy, and carbon; Life cycle assessment, LCA for wood should consider displacement, substitution and offsets. Also important is appreciation of avoided GHG emissions when removals of forest biomass improve forest health, contribute to climate change adaptability, and reduce the risk of catastrophic wildfire. Inaccurate or incomplete emissions accounting confuses the public and serves as an obstacle to wood energy development.
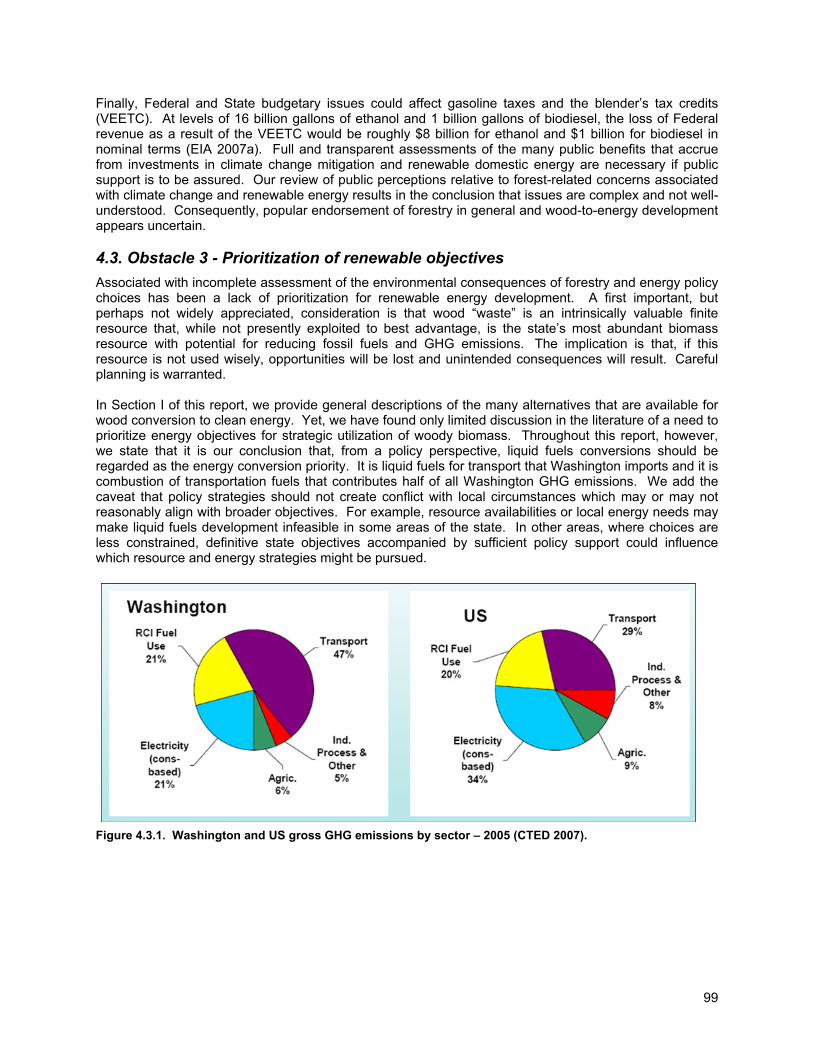
99
Finally, Federal and State budgetary issues could affect gasoline taxes and the blender’s tax credits (VEETC). At levels of 16 billion gallons of ethanol and 1 billion gallons of biodiesel, the loss of Federal revenue as a result of the VEETC would be roughly $8 billion for ethanol and $1 billion for biodiesel in nominal terms (EIA 2007a). Full and transparent assessments of the many public benefits that accrue from investments in climate change mitigation and renewable domestic energy are necessary if public support is to be assured. Our review of public perceptions relative to forest-related concerns associated with climate change and renewable energy results in the conclusion that issues are complex and not well-understood. Consequently, popular endorsement of forestry in general and wood-to-energy development appears uncertain. 4.3. Obstacle 3 - Prioritization of renewable objectives Associated with incomplete assessment of the environmental consequences of forestry and energy policy choices has been a lack of prioritization for renewable energy development. A first important, but perhaps not widely appreciated, consideration is that wood “waste” is an intrinsically valuable finite resource that, while not presently exploited to best advantage, is the state’s most abundant biomass resource with potential for reducing fossil fuels and GHG emissions. The implication is that, if this resource is not used wisely, opportunities will be lost and unintended consequences will result. Careful planning is warranted. In Section I of this report, we provide general descriptions of the many alternatives that are available for wood conversion to clean energy. Yet, we have found only limited discussion in the literature of a need to prioritize energy objectives for strategic utilization of woody biomass. Throughout this report, however, we state that it is our conclusion that, from a policy perspective, liquid fuels conversions should be regarded as the energy conversion priority. It is liquid fuels for transport that Washington imports and it is combustion of transportation fuels that contributes half of all Washington GHG emissions. We add the caveat that policy strategies should not create conflict with local circumstances which may or may not reasonably align with broader objectives. For example, resource availabilities or local energy needs may make liquid fuels development infeasible in some areas of the state. In other areas, where choices are less constrained, definitive state objectives accompanied by sufficient policy support could influence which resource and energy strategies might be pursued.
Figure 4.3.1. Washington and US gross GHG emissions by sector – 2005 (CTED 2007).
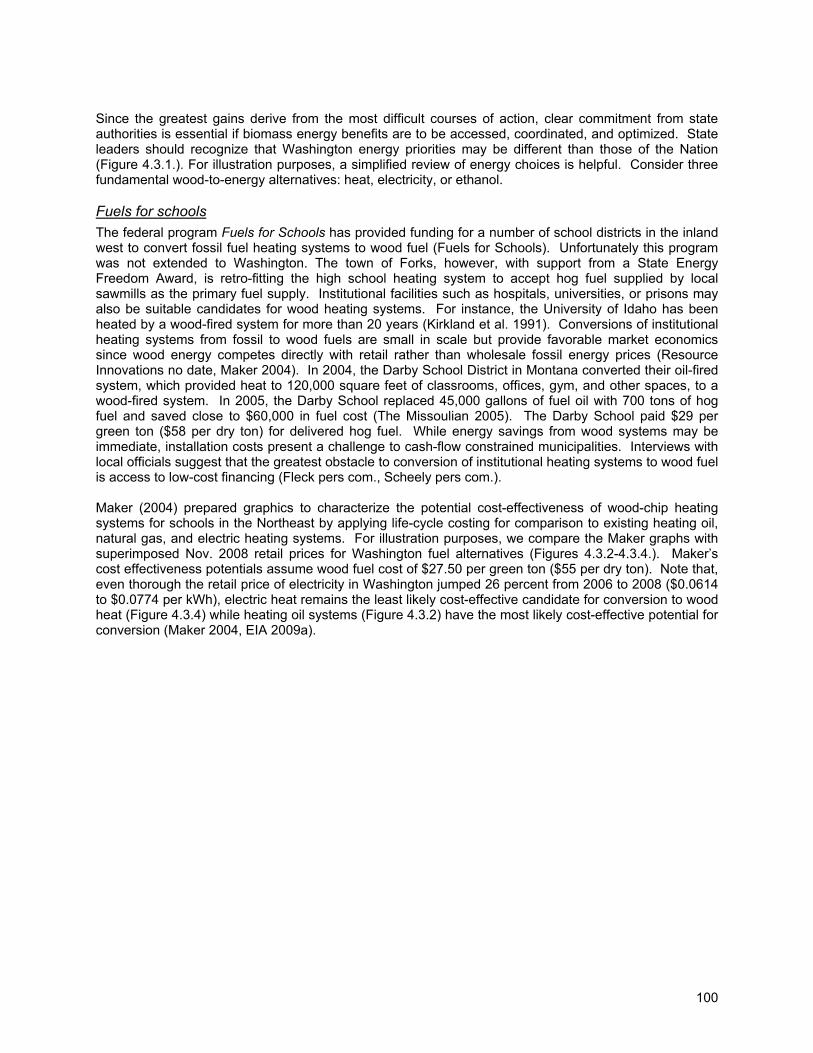
100
Since the greatest gains derive from the most difficult courses of action, clear commitment from state authorities is essential if biomass energy benefits are to be accessed, coordinated, and optimized. State leaders should recognize that Washington energy priorities may be different than those of the Nation (Figure 4.3.1.). For illustration purposes, a simplified review of energy choices is helpful. Consider three fundamental wood-to-energy alternatives: heat, electricity, or ethanol. Fuels for schools The federal program Fuels for Schools has provided funding for a number of school districts in the inland west to convert fossil fuel heating systems to wood fuel (Fuels for Schools). Unfortunately this program was not extended to Washington. The town of Forks, however, with support from a State Energy Freedom Award, is retro-fitting the high school heating system to accept hog fuel supplied by local sawmills as the primary fuel supply. Institutional facilities such as hospitals, universities, or prisons may also be suitable candidates for wood heating systems. For instance, the University of Idaho has been heated by a wood-fired system for more than 20 years (Kirkland et al. 1991). Conversions of institutional heating systems from fossil to wood fuels are small in scale but provide favorable market economics since wood energy competes directly with retail rather than wholesale fossil energy prices (Resource Innovations no date, Maker 2004). In 2004, the Darby School District in Montana converted their oil-fired system, which provided heat to 120,000 square feet of classrooms, offices, gym, and other spaces, to a wood-fired system. In 2005, the Darby School replaced 45,000 gallons of fuel oil with 700 tons of hog fuel and saved close to $60,000 in fuel cost (The Missoulian 2005). The Darby School paid $29 per green ton ($58 per dry ton) for delivered hog fuel. While energy savings from wood systems may be immediate, installation costs present a challenge to cash-flow constrained municipalities. Interviews with local officials suggest that the greatest obstacle to conversion of institutional heating systems to wood fuel is access to low-cost financing (Fleck pers com., Scheely pers com.). Maker (2004) prepared graphics to characterize the potential cost-effectiveness of wood-chip heating systems for schools in the Northeast by applying life-cycle costing for comparison to existing heating oil, natural gas, and electric heating systems. For illustration purposes, we compare the Maker graphs with superimposed Nov. 2008 retail prices for Washington fuel alternatives (Figures 4.3.2-4.3.4.). Maker’s cost effectiveness potentials assume wood fuel cost of $27.50 per green ton ($55 per dry ton). Note that, even thorough the retail price of electricity in Washington jumped 26 percent from 2006 to 2008 ($0.0614 to $0.0774 per kWh), electric heat remains the least likely cost-effective candidate for conversion to wood heat (Figure 4.3.4) while heating oil systems (Figure 4.3.2) have the most likely cost-effective potential for conversion (Maker 2004, EIA 2009a).
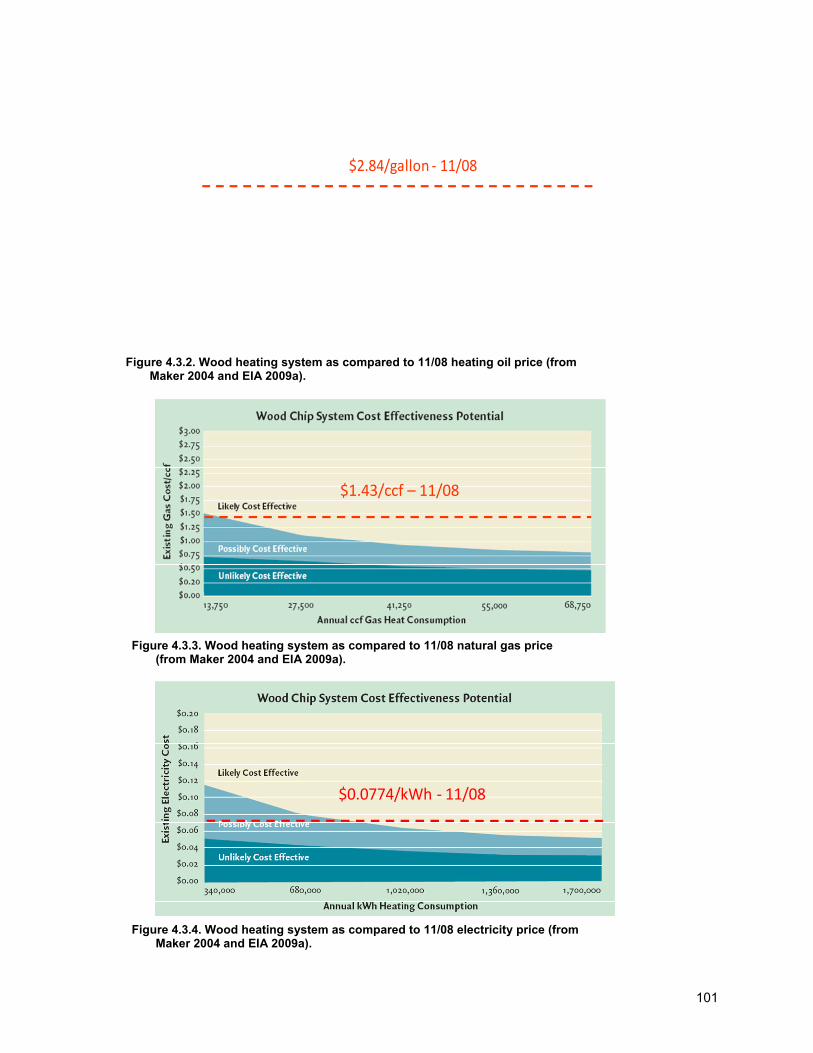
101
Figure 4.3.2. Wood heating system as compared to 11/08 heating oil price (from Maker 2004 and EIA 2009a).
Figure 4.3.3. Wood heating system as compared to 11/08 natural gas price (from Maker 2004 and EIA 2009a).
Figure 4.3.4. Wood heating system as compared to 11/08 electricity price (from Maker 2004 and EIA 2009a).
$2.84/gallon ‐ 11/08
$0.0774/kWh ‐ 11/08
$1.43/ccf – 11/08
102
Use of wood for institutional heating could be considered as a benign example of local circumstances (needs) that, while not necessarily aligning with a broader objective of maximized resource use for reduction of GHG emissions and increases of renewable energy, could provide local economic benefit and cleaner energy consumption. Heating systems use only minor amounts of the woody biomass resource (500 to 1000 tons per year) as compared with commercial conversion systems (100,000 tons plus) so are unlikely to create any competitive conflict for available resources. Competition for woody biomass resources is an issue, however, that should be given careful consideration relative to existing and potentially larger volume users such as electric generation stations, liquid fuels converters, and the pulp and paper industry (Thorp and Akhtar 2009). Wood for electricity or liquid fuels? Along with lower fuel costs and GHG benefits, the relatively small and readily procurable volumes of wood required for municipal heating systems may make conversions locally attractive with little potential for conflict with broader state energy planning objectives. This is not the case for consideration of more ambitious projects such as electricity generation or ethanol conversion. In order to gain operational and conversion efficiencies both conversion processes require significant volumes of wood biomass. Sufficiently large volumes of wood biomass to support commercial-scale conversions are not infinitely procurable. The limited availability of the resource and the cost differentials of process wastes verses harvest residuals pose challenges to wood energy development. Failure to plan for cost indexing of available feedstocks and for plant sizes with conversion efficiencies and most-needed energy outputs will compromise potential energy yields. Strategic choices should be carefully evaluated. Consider electricity in Washington. In 2008, Washington had the tenth lowest residential power rate in the Nation (EIA 2009b). Just five years prior, in 2003, Washington had the second lowest residential power rate in the Nation (NWPCC 2005). Two-thirds of Washington electricity is emission-free hydro-power obtained from dams (CTED 2008). Washington is the largest hydroelectric power producer in the Nation, typically generating about twice that of the next leading State (EIA 2009a). Washington is a major net electricity exporter (EIA 2009a). Eight of the State’s 10 largest power plants are hydroelectric generators, primarily located on the Columbia and Snake Rivers. The 7,079-megawatt Grand Coulee hydroelectric facility, located on the Columbia River, is the largest generating plant in the United States (EIA 2009a). In 2007, biomass power plants supplied 0.5 percent of Washington electric utility fuel mix (CTED 2008). Among combustion system alternatives, combined heat and power plants generate electricity with the lowest costs (Vuorinen 2007, NWPCC 2005). Washington has one large coal-fired plant located near the State’s only coal mine in Centralia that provides 10 percent of State electricity generation but contributes more than 74 percent of the State CO2 emissions that result from electricity generation (CTED 2007). Co-firing of biomass with coal is a low-cost and effective way to reduce pollution from electrical generation (Polagye et al. 2007, FPL 2004, EURBIONET 2000, EERE and EPRI 1997). Biomass can substitute for up to 15 percent of the total energy input in a coal-fired power plant, often with few modifications other than the burner and feed intake systems (DOE 2000). Biomass, as a supplemental fuel in an existing coal boiler, can provide reductions in sulfur oxide, nitrogen oxide, as well as CO2 (DOE 2004). Biomass can also be used for co-fire applications with natural gas (Barmina et al. 2007, Brown and Judd 2006, Silveira 2005). The US Department of Energy has identified Washington as one of the top ten states in the Nation with potential for development of biomass co-firing capability (DOE 2004). Poplar plantations on nearby reclaimed mine fields and marginal farmlands could supply handy low-cost feedstocks for co-fire applications (Burger et al. 2008). Consider transportation fuels in Washington. Washington has the fifth highest gasoline price and eleventh highest diesel price in the Nation (AAA 2009). Washington has no petroleum resources and imports 100 percent of its fossil transportation fuels (EIA 2009a). Use of foreign petroleum drains $9 billion annually from the Washington economy (WSBAC 2007). However, Washington is a principal refining center. Seventy percent of refinery production is consumed instate with the remainder serving Pacific Northwest markets (Nothstein 2007). Five refineries receive crude oil primarily by tanker shipment
103
from Alaska. Since Alaskan oil production (currently 74 percent of total crude oil delivered to State refineries) is in decline, Washington’s refineries are increasingly reliant upon crude oil imports from Canada and other international markets (EIA 2009a). The Trans Mountain Pipeline from Alberta supplies about ten percent of Washington’s crude oil supply (EIA 2009a). Isolation of Washington refineries from US oil pipelines combined with reliance upon oil imports adds cost and volatility to fuel prices (Leffler 2007). Washington’s total petroleum demand is high. Jet fuel consumption is among the highest in the Nation, due in part to several large Air Force and Navy installations (EIA 2009a). The use of oxygenated motor gasoline is required in the Spokane area during the winter months (EIA 2009a). Washington currently has no in-state ethanol production (EIA 2009a). The average freight cost of importing corn ethanol from the Midwest to Washington is $0.22 per gallon which, when blended with gasoline, further serves to increase consumer fuel prices (EPA 2007d). Washington gasoline consumption in 2008 was 2.7 billion gallons (WOFM 2008b). WA taxpayers contribute to the Volume Ethanol Excise Tax Credit (VEETC) enjoyed by corn ethanol ($0.45/gallon) but, unless an instate ethanol program is developed, WA consumers get no readily apparent benefit from this tax expense (total nation ~ $5 billion in VEETC to meet 10.5 billion gallons ethanol required by EISA for 2009; since WA has about 2% of national population, state taxpayer contribution to VEETC may be in the realm of $100 million for 2009). During the summer months of 2008, ethanol imports to Washington averaged 7.4 percent of total ethanol/gas consumption (Lyons pers com.). Reliable production of instate ethanol supplies could help to ease fuel price pressures and reduce consumer costs (Ramm 2007). In 2007, there were 14 ethanol projects in some stage of development but by 2008 all had been either placed on hold or canceled (Yoder et al. 2008). Unless public policy prioritizes biofuels development, there will be counterproductive competition for biomass resources between biopower and biofuel production (WGA 2008c). Washington does host several biodiesel refineries but prospects for oil seed production in Washington appear to be limited indicating that significant production of biodiesel in Washington will likely be reliant upon imported finished fuels or raw feedstocks (Stiles et al. 2008, Yoder et al. 2008, Hill and Learn 2007a, WSBAC 2007). Production of some imported oils, such as palm, has been linked to increases in GHG emissions, deforestation, and loss of biodiversity (Butler and Laurance 2009, Danielsen et al. 2008). In 2007, the State Biofuels Advisory Committee reported that instate oil seed production supported just 0.2 percent of annual diesel consumption (WSBAC 2007). Yoder et al. (2008) report that existing biodiesel plants are operating at limited capacity with many projects that were planned in 2007 canceled or put on hold in 2008. Annual diesel consumption in Washington was 776 million gallons in 2008 (WOFM 2008b), around one quarter of the volume of gasoline. Logistical and technical considerations A number of logistical challenges should be included for consideration in development of prioritized objectives for biomass energy. Transportation systems and congestion are important planning considerations for development of bioenergy (WGA 2008c). A critical component of successful commercialization of bioenergy projects is a secure and reliable feedstock supply system reliant upon regular raw materials deliveries. Perez-Garcia (2007), in a study of forest industry use of roadways for raw material and finished products deliveries, determined that, in 2004, close to 1.25 million loads of logs, lumber, panel products, and chips traveled Washington roads. Retrieval of two million tons of logging residues annually (Frear et al. 2005) would require an additional 80,000 truck loads per year. This number would increase significantly if an aggressive program of hazardous fuels removals was implemented. Efficient use of biomass materials for energy is best accomplished by facilities that require considerable volumes of raw material; on the order of 50 to 100 truckloads per day per conversion facility (McNeil Technologies 2003, Busby et al. 2008). From 1981 to 2007, state population increased by 53 percent from 4.23 million to 6.49 million people (WOFM 2007). During the same period, vehicle miles traveled (VMT) increased by 98 percent from 16.16 billion to 31.97 billion miles per year (WDOT 2008) while total road-miles, available for travel (principle, minor, collector, and interstate), increased by just 2 percent from 6,885 to 7,044 miles (WDOT 2008).
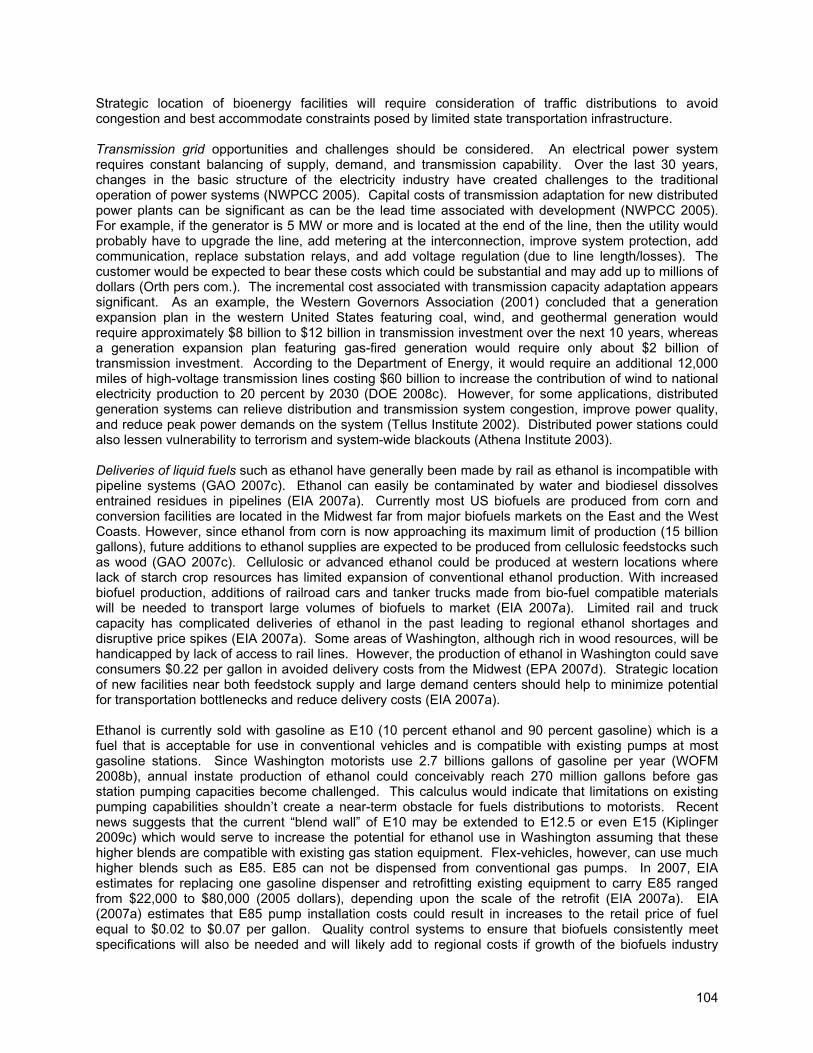
104
Strategic location of bioenergy facilities will require consideration of traffic distributions to avoid congestion and best accommodate constraints posed by limited state transportation infrastructure. Transmission grid opportunities and challenges should be considered. An electrical power system requires constant balancing of supply, demand, and transmission capability. Over the last 30 years, changes in the basic structure of the electricity industry have created challenges to the traditional operation of power systems (NWPCC 2005). Capital costs of transmission adaptation for new distributed power plants can be significant as can be the lead time associated with development (NWPCC 2005). For example, if the generator is 5 MW or more and is located at the end of the line, then the utility would probably have to upgrade the line, add metering at the interconnection, improve system protection, add communication, replace substation relays, and add voltage regulation (due to line length/losses). The customer would be expected to bear these costs which could be substantial and may add up to millions of dollars (Orth pers com.). The incremental cost associated with transmission capacity adaptation appears significant. As an example, the Western Governors Association (2001) concluded that a generation expansion plan in the western United States featuring coal, wind, and geothermal generation would require approximately $8 billion to $12 billion in transmission investment over the next 10 years, whereas a generation expansion plan featuring gas-fired generation would require only about $2 billion of transmission investment. According to the Department of Energy, it would require an additional 12,000 miles of high-voltage transmission lines costing $60 billion to increase the contribution of wind to national electricity production to 20 percent by 2030 (DOE 2008c). However, for some applications, distributed generation systems can relieve distribution and transmission system congestion, improve power quality, and reduce peak power demands on the system (Tellus Institute 2002). Distributed power stations could also lessen vulnerability to terrorism and system-wide blackouts (Athena Institute 2003). Deliveries of liquid fuels such as ethanol have generally been made by rail as ethanol is incompatible with pipeline systems (GAO 2007c). Ethanol can easily be contaminated by water and biodiesel dissolves entrained residues in pipelines (EIA 2007a). Currently most US biofuels are produced from corn and conversion facilities are located in the Midwest far from major biofuels markets on the East and the West Coasts. However, since ethanol from corn is now approaching its maximum limit of production (15 billion gallons), future additions to ethanol supplies are expected to be produced from cellulosic feedstocks such as wood (GAO 2007c). Cellulosic or advanced ethanol could be produced at western locations where lack of starch crop resources has limited expansion of conventional ethanol production. With increased biofuel production, additions of railroad cars and tanker trucks made from bio-fuel compatible materials will be needed to transport large volumes of biofuels to market (EIA 2007a). Limited rail and truck capacity has complicated deliveries of ethanol in the past leading to regional ethanol shortages and disruptive price spikes (EIA 2007a). Some areas of Washington, although rich in wood resources, will be handicapped by lack of access to rail lines. However, the production of ethanol in Washington could save consumers $0.22 per gallon in avoided delivery costs from the Midwest (EPA 2007d). Strategic location of new facilities near both feedstock supply and large demand centers should help to minimize potential for transportation bottlenecks and reduce delivery costs (EIA 2007a). Ethanol is currently sold with gasoline as E10 (10 percent ethanol and 90 percent gasoline) which is a fuel that is acceptable for use in conventional vehicles and is compatible with existing pumps at most gasoline stations. Since Washington motorists use 2.7 billions gallons of gasoline per year (WOFM 2008b), annual instate production of ethanol could conceivably reach 270 million gallons before gas station pumping capacities become challenged. This calculus would indicate that limitations on existing pumping capabilities shouldn’t create a near-term obstacle for fuels distributions to motorists. Recent news suggests that the current “blend wall” of E10 may be extended to E12.5 or even E15 (Kiplinger 2009c) which would serve to increase the potential for ethanol use in Washington assuming that these higher blends are compatible with existing gas station equipment. Flex-vehicles, however, can use much higher blends such as E85. E85 can not be dispensed from conventional gas pumps. In 2007, EIA estimates for replacing one gasoline dispenser and retrofitting existing equipment to carry E85 ranged from $22,000 to $80,000 (2005 dollars), depending upon the scale of the retrofit (EIA 2007a). EIA (2007a) estimates that E85 pump installation costs could result in increases to the retail price of fuel equal to $0.02 to $0.07 per gallon. Quality control systems to ensure that biofuels consistently meet specifications will also be needed and will likely add to regional costs if growth of the biofuels industry
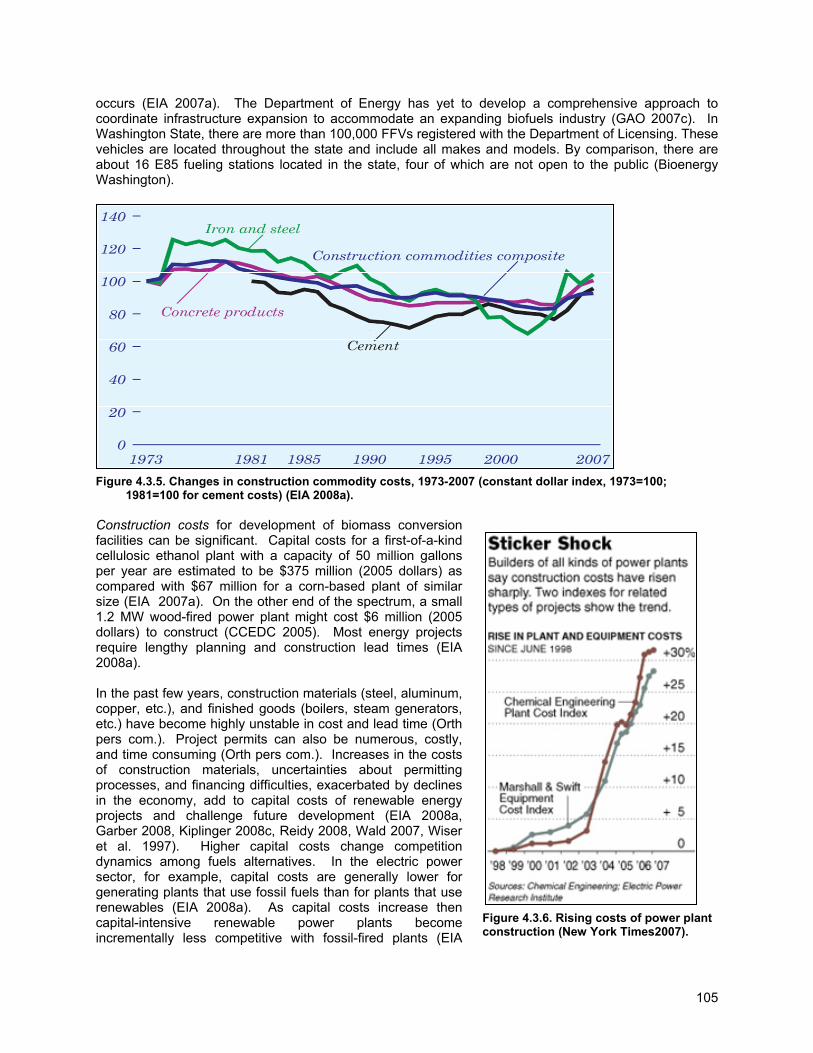
105
occurs (EIA 2007a). The Department of Energy has yet to develop a comprehensive approach to coordinate infrastructure expansion to accommodate an expanding biofuels industry (GAO 2007c). In Washington State, there are more than 100,000 FFVs registered with the Department of Licensing. These vehicles are located throughout the state and include all makes and models. By comparison, there are about 16 E85 fueling stations located in the state, four of which are not open to the public (Bioenergy Washington).
Figure 4.3.5. Changes in construction commodity costs, 1973-2007 (constant dollar index, 1973=100; 1981=100 for cement costs) (EIA 2008a).
Construction costs for development of biomass conversion facilities can be significant. Capital costs for a first-of-a-kind cellulosic ethanol plant with a capacity of 50 million gallons per year are estimated to be $375 million (2005 dollars) as compared with $67 million for a corn-based plant of similar size (EIA 2007a). On the other end of the spectrum, a small 1.2 MW wood-fired power plant might cost $6 million (2005 dollars) to construct (CCEDC 2005). Most energy projects require lengthy planning and construction lead times (EIA 2008a). In the past few years, construction materials (steel, aluminum, copper, etc.), and finished goods (boilers, steam generators, etc.) have become highly unstable in cost and lead time (Orth pers com.). Project permits can also be numerous, costly, and time consuming (Orth pers com.). Increases in the costs of construction materials, uncertainties about permitting processes, and financing difficulties, exacerbated by declines in the economy, add to capital costs of renewable energy projects and challenge future development (EIA 2008a, Garber 2008, Kiplinger 2008c, Reidy 2008, Wald 2007, Wiser et al. 1997). Higher capital costs change competition dynamics among fuels alternatives. In the electric power sector, for example, capital costs are generally lower for generating plants that use fossil fuels than for plants that use renewables (EIA 2008a). As capital costs increase then capital-intensive renewable power plants become incrementally less competitive with fossil-fired plants (EIA
Figure 4.3.6. Rising costs of power plant construction (New York Times2007).
106
2008a). Rising capital costs also lead to higher energy prices which slows replacement of existing fossil energy with new renewable generation capacity (EIA 2008a). Increased debt service for capital costs also makes new projects more vulnerable to volatile fluctuations in energy prices as have occurred 2008-2009. Such uncertainties tend to further discourage investment (Lignol 2009, Galbraith 2008). Bankruptcies of large corn ethanol producers have resulted in fire-sale liquidations that compromise new installation investments especially in regards capital-intensive cellulosic conversion plants. For example, Valero Energy, the largest oil refiner in the US, recently purchased seven corn ethanol conversion facilities (780 million gallons of annual production) from bankrupt VeraSun Energy, formerly the second largest US ethanol producer. The total purchase price ($477 million) equated to $0.61 per gallon of annual production capacity (Kiplinger 2009d). The cost of building a new 100 million gallon per year corn ethanol plant is around $2 per gallon of capacity while the cost of constructing a cellulosic ethanol plant has been estimated (depending upon capacity) to be between $6 and $10 per gallon of production (Kiplinger 2008b, Retsina and Pylkkanen 2008). As a high-cost example, Range Fuels is spending $200 million to build a new plant in Georgia that will produce 20 million gallons of cellulosic ethanol per year (Kiplinger 2008b). The costs, risks, and price volatility of plant construction are an obstacle that could be better accommodated by energy policies. The permitting process may represent an opportunity for review towards providing timelier and less costly development. Water availability for energy conversion processes is an issue of concern. Conflicts over water are common in the west and expensive. For example, the Bonneville Power Administration total expenditures to mitigate the impacts of hydropower dams on fish and wildlife, from 1978 through 2007, amounted to $9,378,800,000 (NWPCC 2008). Warming in western mountains has been projected to lead to decreased snowpack, more winter flooding, and reduced summer stream flows, exacerbating competition for over-allocated water resources (Barnett et al. 2008, IPCC 2007b). Availability of water resources is critical to bioenergy development. Water quality, temperature, and consumption are all potential concerns. Thermal electric plants use substantial volumes of water in cooling cycles requiring investments in cooling towers and other systems to dissipate heat before water is returned to its source (Basheda et al. 2006). For example, a coal-fired power plant on average will use 9.5 gallons per minute per megawatt (MW) of generation output (Aden 2007). For liquid fuel comparisons, dry ground corn-to-ethanol conversion facilities use 3-5 gallons of water per gallon of fuel produced, biochemical cellulosic ethanol might require up to 6 gallons of water per gallon fuel, thermochemical cellulosic ethanol requires 2 gallons of water per gallon fuel, while biodiesel production uses 1 gallon water per gallon fuel (Aden 2007, Pate et al. 2007, Phillips et al. 2007, IATP 2006, Shapouri and Gallegher 2005, Sheehan et al. 1998). For perspective, consumptive water use in petroleum refining is about 1.5 gallons per gallon of fuel produced (Pate et al. 2007). Issues of energy generation and water quality and quantity must be considered in a local and a national context. Locally, it will be important that sufficient water is available and that neither thermal nor chemical water pollution result from energy conversions. Nationally, however, net water use and environmental impacts of alternatives should be compared. If a renewable offsets a fossil energy product then the net water consumption is the difference between the two water usages. For example, if biochemical cellulosic ethanol uses 6 gallons of water per gallon of fuel but replaces petroleum which uses 1.5 gallons per gallon then the net water use is 4.5 gallons for ethanol. It should be noted as well that if one gallon of ethanol is produced from forest feedstocks, which require no irrigation, much less water is used than one gallon of ethanol from corn which on average will need 780 gallons of irrigation water (NRC 2007). Consideration of water and energy crops should also include the pollution and sedimentation associated with run-off that ends up in streams and rivers (NRC 2007). In 2007, US corn cultivation required application of more than 10 million tons of fertilizer (nitrogen, potash, and phosphate) which represented 44 percent of US fertilizer use for all crops (USDA ERS 2008). It has been estimated that cropland erosion accounts for half of the sediment that reaches the nation’s waterways each year (USDA SCS 1993). Increases in water-born nutrient load deliveries from agricultural fertilizers are expanding dead zones (hypoxia) in coastal water bodies (University of Michigan 2008, Goolsby et al. 1999). If projected future increases in the use of corn for ethanol production occur, the increase in harm to US water quality could be considerable (NRC 2007). To move toward a goal of reducing the water impacts from shifts of fossil fuels to biofuels, development of cellulosic resources that require less water and fertilizer will be
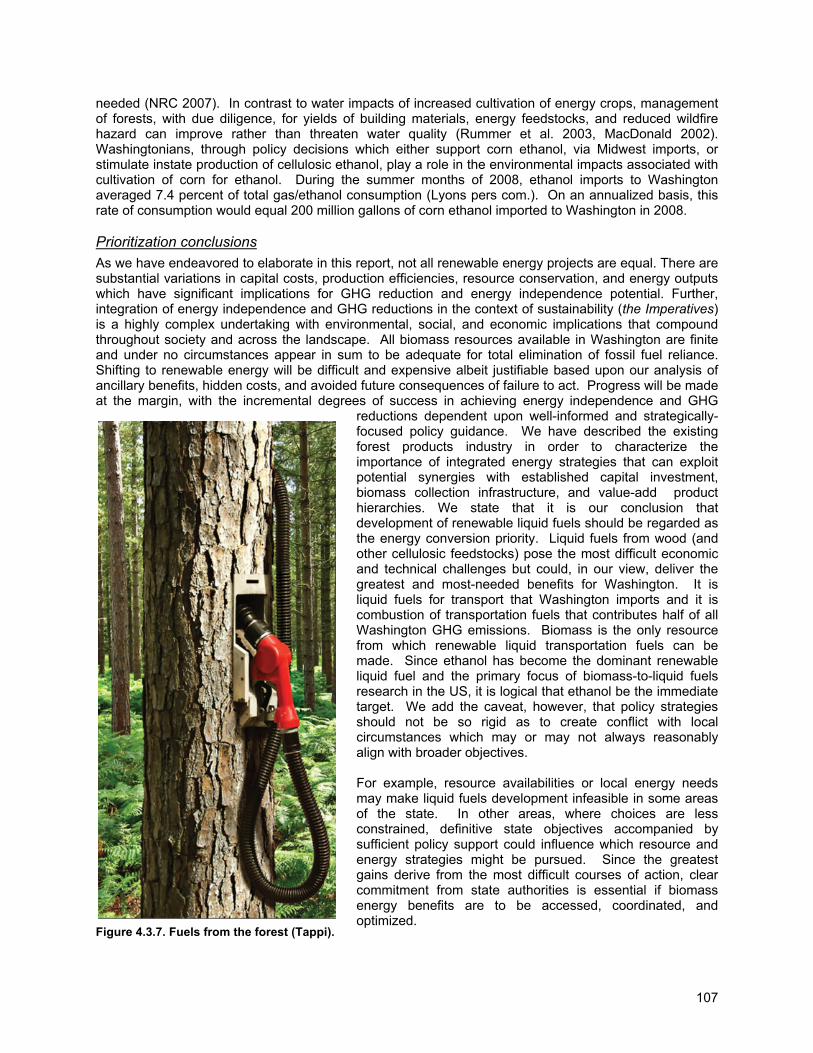
107
needed (NRC 2007). In contrast to water impacts of increased cultivation of energy crops, management of forests, with due diligence, for yields of building materials, energy feedstocks, and reduced wildfire hazard can improve rather than threaten water quality (Rummer et al. 2003, MacDonald 2002). Washingtonians, through policy decisions which either support corn ethanol, via Midwest imports, or stimulate instate production of cellulosic ethanol, play a role in the environmental impacts associated with cultivation of corn for ethanol. During the summer months of 2008, ethanol imports to Washington averaged 7.4 percent of total gas/ethanol consumption (Lyons pers com.). On an annualized basis, this rate of consumption would equal 200 million gallons of corn ethanol imported to Washington in 2008. Prioritization conclusions As we have endeavored to elaborate in this report, not all renewable energy projects are equal. There are substantial variations in capital costs, production efficiencies, resource conservation, and energy outputs which have significant implications for GHG reduction and energy independence potential. Further, integration of energy independence and GHG reductions in the context of sustainability (the Imperatives) is a highly complex undertaking with environmental, social, and economic implications that compound throughout society and across the landscape. All biomass resources available in Washington are finite and under no circumstances appear in sum to be adequate for total elimination of fossil fuel reliance. Shifting to renewable energy will be difficult and expensive albeit justifiable based upon our analysis of ancillary benefits, hidden costs, and avoided future consequences of failure to act. Progress will be made at the margin, with the incremental degrees of success in achieving energy independence and GHG
reductions dependent upon well-informed and strategically-focused policy guidance. We have described the existing forest products industry in order to characterize the importance of integrated energy strategies that can exploit potential synergies with established capital investment, biomass collection infrastructure, and value-add product hierarchies. We state that it is our conclusion that development of renewable liquid fuels should be regarded as the energy conversion priority. Liquid fuels from wood (and other cellulosic feedstocks) pose the most difficult economic and technical challenges but could, in our view, deliver the greatest and most-needed benefits for Washington. It is liquid fuels for transport that Washington imports and it is combustion of transportation fuels that contributes half of all Washington GHG emissions. Biomass is the only resource from which renewable liquid transportation fuels can be made. Since ethanol has become the dominant renewable liquid fuel and the primary focus of biomass-to-liquid fuels research in the US, it is logical that ethanol be the immediate target. We add the caveat, however, that policy strategies should not be so rigid as to create conflict with local circumstances which may or may not always reasonably align with broader objectives. For example, resource availabilities or local energy needs may make liquid fuels development infeasible in some areas of the state. In other areas, where choices are less constrained, definitive state objectives accompanied by sufficient policy support could influence which resource and energy strategies might be pursued. Since the greatest gains derive from the most difficult courses of action, clear commitment from state authorities is essential if biomass energy benefits are to be accessed, coordinated, and optimized. Figure 4.3.7. Fuels from the forest (Tappi).
108
If Washington policy-makers determine that liquid fuels for transportation, from wood and other forms of biomass, should be a high renewable energy priority, identification of potential sites should proceed with consideration of feedstock availability, transportation arterials, transmission grid capabilities, water resources, and opportunities for synergies with existing industries. Increases in energy generation efficiencies as well as additions of new bioenergy capacity at existing industrial locations could result in considerable cost savings and reduced project time-lines (WGA 2008c, Lynd 1996). For example, pulp mills typically have an existing collection infrastructure, a boiler, and waste water treatment facilities, which could save 20 percent or more on capital costs as compared to new construction (Kelly 2006) while reducing time from project conception to completion. Established grid connections and transportation networks also add value. An engaged corps of chemical engineers as well as the many highly-paid and skilled union workers that serve the pulp and paper industry should be recognized as a strategically important state human resource. The ability to mix captive low-cost feedstock materials with more expensive biomass collected from forests and fields will be another plus that has been discussed. Low-cost feedstocks provide an anchor for cost leverage, but this advantage is lost if the feedstock is only available at a small scale (Lynd 1996). Per-unit-output capital costs are increased significantly for small-scale projects and energy recovery efficiencies are poor compared to larger facilities (Kiplinger 2008b, McNeil Technologies 2003, Lynd 1996). Pulp and paper mills are logical candidates for priority consideration. The biorefinery concept for biomass utilization has potential to meet a large proportion of future energy demand (IEA 2007b). Current research, development and demonstration efforts focus on reducing the costs of conversions, mitigating potential environmental impacts, and creating an integrated renewable energy industry that links bioenergy resources with the co-production of liquid fuels from cellulose and hemicelluloses, and electricity and process steam from lignin (IEA 2007b, Larson et al 2006). Connor (2008) suggests that integrated biorefineries at existing mills may offer thermal efficiencies of up to 80 percent. Gasification processes could utilize forest residues, agricultural wastes, energy crops, and spent pulping liquors. Cost-effective reduction of water consumption by ethanol conversion plants is also a research priority and has been a successful focus for continuing efficiency improvements within the pulp and paper industry (NRC 2007). A significant portion of the research and development expenditures of the US pulp and paper industry are dedicated to minimizing operational water discharges and air emissions of pollutants (EERE 2005). Biorefinery capabilities would provide pulp and paper mills with the ability to recover byproduct high value industrial chemicals and polymers that could improve integrated economics of resource use for energy, pulp, paper, and paperboard products (Fairley 2008, Saddler and Mabee 2007, Simmons 2007, Agenda 2020 2006, Larson et al 2006, Kelly 2006, Kerstetter 1997). Inventories of woody biomass supply often assume that energy yields from dedicated process residuals such as hog fuel and black liquor have little potential for increased energy yield. A study by the University of Washington of energy production at Washington pulp and paper mills was recently commissioned to examine potential for increased energy yields if investments in equipment upgrades can be made. Preliminary findings suggest that targeted investments in gained conversion efficiencies could significantly increase the energy yields for some pulp and paper mills without requiring additional fuel inputs (Gustafson pers com). In addition to utilization of virgin wood fiber, the US pulp and paper industry provided the industrial capacity to recycle 34 million tons of post-consumer paper products in 2003 (EERE 2005). However, a considerable portion of US recycled paper has been sold to China; that is until recently. Declines in the global economy have reduced demand and the price of recycled paper has dropped by 90 percent since last year; threatening municipal recycling programs around the country. The city of Seattle pays $27 per ton for recycling services (Richards 2008). One third of all US municipal solid waste is paper and paper board (EPA 2007c). An important ancillary benefit of biorefinery development would be increased utilization potential for recycled paper and recoverable urban wood as either raw material for paper production or as an energy feedstock. Energy products should be considered in the same vain as other market products from wood: the resource should be used wisely such that a value hierarchy of products is maintained. In locations where there is no potential for linking biorefinery development to existing pulp and paper mills but there is

109
sufficient biomass from wood and other sources to produce liquid fuels, establishment of new conversion capacity should be a priority. Liquid fuels production from cellulosic feedstocks at a commercial-scale and a market-competitive cost faces challenges that should not be understated. Considerable research is being done to develop commercial processes the use either biochemical or gasification technologies to produce fuel grade ethanol. Neither technology offers a clear advantage at this point. To date, only pilot scale facilities have been constructed. The results from these pilot plants look promising but commercial viability can’t be assessed until a demonstration scale facility, on the order of tens of millions gallons per year, has been successfully operated for an extended period of time. Long term, processes with considerably lower capital and operating costs will be necessary for these processes to be economically viable. Current estimates for biorefinery capital costs are on the order of $5 - $8 per annual gallon of capacity (Thorp and Akhtar 2009). Enzyme costs, for the biochemical pathway, need to be on the order of $0.10 - $0.20 per gallon of ethanol rather than the current cost, which is estimated to be somewhat over $0.50 per gallon. Industry experts believe that the technology to construct a commercially viable cellulosic biorefinery is close and that you will see considerably more construction of facilities when the current recession ends and the price of oil returns to a level approaching $80/barrel. Catchlight, the Weyerhaeuser – Chevron joint venture, is planning construction of a 50-million-gallon-per-year biorefinery in the 2012 time frame. (Hunter 2009). However, as we have endeavored to illuminate, market prices do not adequately reflect the cost of continued consumption of imported fossil fuels. The avoided costs and gained opportunities from development of instate clean and renewable liquid fuels significantly outweigh the cumulative costs of fossil fuel reliance. A few simple dynamics of global oil markets must be understood and appreciated if policies are to be crafted to facilitate transition to alternatives. First, conventional oil is found-wealth that is energy-rich and inexpensive to produce. Many oil exporting countries rely upon petroleum sales for significant percentages of state GDP. Put simply, regardless of the fact that oil is a finite and nonrenewable resource, oil will always sell for a market price that reflects world demand. As history has shown, the spot price of oil may be more or may very well be less than the cost to produce a renewable alternative such as ethanol. Worse, due to the monopsony effect of US oil purchasing power on the world market, the more renewable fuels that the US produces then the less the world demand for oil and the lower the price of oil becomes. The more renewable fuel that the US produces the more difficult that competition with oil will become. Market supports and an enduring commitment to reducing fossil fuel reliance will be needed if the US is to develop an economically viable renewable fuels industry. The same will be the case for Washington as it considers the priority use of biomass resources. Consider the Brazilian experience. In 1975, two years after the Organization of Petroleum Exporting Countries (OPEC) first coordinated a major oil price spike, Brazilian President Ernesto Geisel instituted the National Alcohol Program (PNA). His decision was not based upon short-term market benefit and was not without controversy. At that time, ethanol distilled from Brazilian sugar cane cost more than twice as much as gasoline refined from imported oil (Bernton et al. 1982). Motor vehicle technology for ethanol was not well-developed. The first ethanol-only vehicles were tough to start on cold mornings and were not immediately popular. However, after years of work and billions of dollars in subsidies, today Brazil is the second largest ethanol producer in the world and, in 2006, achieved energy independence (Lynch 2006). In 2006, there were 29,000 filling stations in Brazil that offered high ethanol blends for flex vehicles (Lynch 2006). In 2007, there were 1900 such stations in the US and six in Washington (E85vehicles 2007). Ironically, the US imposes a $0.54 per gallon tariff and an ad valorum tariff of 2.5 percent on ethanol imported from Brazil (EIA 2009c, Lynch 2006) but has no equivalent tariff on oil imported from the Middle East. Energy projects have twenty- to forty-year productive lives and term debts. While small power generators represent easier paths to energy development, if Washington policy-makers fail to prioritize liquid fuels from biomass and biomass is instead captured for electricity by new generating facilities, the consequences will be a marginal biofuels industry and a substantial cash drain to meet renewable transportation fuel requirements.
110
As a priority, second to liquid fuels production from biomass, we suggest co-firing of biomass in conventional steam boilers at existing generation facilities that produce electricity. Co-firing is a mature technology with a low-cost potential to reduce GHG emissions and to provide beneficial cost-reduction synergies with established operations. Co-firing also requires smaller biomass volumes than large generation or liquid fuels conversion facilities. The costs of adding necessary storage, drying, and processing facilities at a coal plant are far lower than the costs of building a new biomass power plant (Tellus Institute 2002).Biomass fuel supplies may therefore be achievable through establishment of dedicated energy crops which could provide dual value through bioremediation on damaged lands or increased economic returns from cultivation of marginal farmlands. As possible, small electrical generation systems that compromise the conservative use of biomass resources should be avoided rather than encouraged especially in the case of stand-alone facilities with no potential for integrated cogeneration for recovery of energy from process steam and heat. Small-scale electrical generation and distribution efficiency can be as low as 20-29 percent (Wright et al. 2006, Bain and Overend 2002) whereas energy conversion efficiencies for combined heat and power or cellulosic ethanol can be 50 to 90 percent (Antares 2003, Graf and Koehler 2000). As a small scale priority, we suggest institutional heating with biomass as another mature technology that can readily replace fossil systems especially in the rural communities located in the forested areas of our state. Heating systems with wood biomass can be very efficient and could be considered for retrofits or new facilities installations. 4.4. Obstacle 4 - Policy and regulations There have emerged a plethora of state, regional, and federal laws, policies, subsidies, tax credits, grants, and other political instruments that address directly or have implications for forests, climate change mitigation, and energy development in Washington (Yacobucci 2008, Bioenergy Washington). There are also numerous and evolving international conventions, treaties, and other intergovernmental arrangements that exert influence. The maze of political frameworks may very well be as complex as the environmental, social, and economic interrelationships of these issues. A thorough examination of local to global political mechanisms with implications for Washington’s forests, the State’s role in climate change mitigation, and its contribution to US energy independence is well beyond what can be accomplished by this review. However, such analysis could be invaluable to policy-makers tasked with crafting strategies for the future and should be considered for further investigation. We find no evidence that comprehensive review has been undertaken to assess implications for Washington which leads to conclusion that many decisions may be made in lieu of adequate information. In this portion of the report, however, we review evident laws and evolving policies that we find to be of special concern to the charge of this investigation. Our general conclusion is that well-intentioned but overly-simplistic policy approaches are leading towards unintended consequences and lost opportunities. I-937- Washington’s defacto energy priority There is growing popular support for development of renewable energy, however, without guidance, uninformed public interest may manifest as an obstacle rather than an opportunity for progress. Ballot Initiative 937 (I-937) was passed as a clean energy initiative in Washington in 2006 by 52 percent of the voters (Associated Press 2006). Under Initiative 937, utilities with more than 25,000 customers will have to meet 15 percent of their annual total amount of electricity sold to customers (load) by 2020 using eligible newly-developed renewable resources to produce electricity. Examples of eligible renewable resources include wind farms, solar panels, geothermal plants, animal wastes, and some types of biomass. Notable exclusions include crops raised on lands cleared from old growth forests, wood from old growth forests, treated wood, black liquor from paper production, and municipal solid waste. With limited exceptions, use of fresh water by hydroelectric dams and plants is also not included as an eligible renewable resource (Reed 2006). The mandated renewable energy achievements are ambitious. In 2007, Non-hydro renewable energy comprised 1.6 percent of total state electricity sales (CTED 2008). Incremental thresholds of future responsibility have been established. Each utility will have to use eligible renewable resources to serve at
111
least three percent (3%) of its load by 2012 through 2015; nine percent (9%) of load by 2016 through 2019, and fifteen percent (15%) of load by 2020 and thereafter. A utility could comply with its annual renewable resource target by using the requisite amount of eligible renewable resources, by purchasing enough eligible renewable resource credits (or a combination of each), or by investing at least four percent (4%) of its total annual retail revenue in renewable resources (Reed 2006). An investor-owned utility would be entitled to recover from its customers all costs the utility prudently incurred to comply with the measure. Similarly, each publicly-owned utility would be expected to recover its cost of compliance from its customers (Reed 2006). If a utility fails to comply with either the energy conservation or the renewable energy targets, it would have to pay a penalty in the amount of $50 for each megawatt-hour of shortfall. This penalty amount would be adjusted annually for inflation. Penalty payments would go into a special account, and could only be used for the purchase of renewable energy credits or for energy conservation projects at state and local government facilities or publicly-owned educational institutions (Reed 2006). In each year beginning in June 2012, each utility would be required to report to the state Department of Community, Trade, and Economic Development (CTED) on the utility’s progress in the preceding year in meeting the targets. The investor-owned utilities would supply the same information to the Utilities and Transportation Commission (UTC). Each utility would be required to make these reports available to its customers (Reed 2006). In the absence of a cohesive state strategy for renewable energy development and climate change mitigation, passage of I-937 has made generation of electricity Washington’s paramount renewable energy priority empowered with binding legal authority. For renewable energy potential, from sources such as wind and solar, such commitment may yield desired results although we see inherent inefficiencies from incremental accounting, individual utility responsibilities rather than cumulative optimum state outcome, and failure of consideration for the balancing of intermittent with firm power contributions. For example, apparently not well-understood, is that increases in intermittent wind power are generally accompanied by additions of natural gas generating capacity as needed firm power back-up (Prescott 2009). For some utilities the arbitrary cost of the penalty ($50 for each megawatt-hour of shortfall; maximum impact would be on 15 percent of load) may be less than the cost of compliance. Under such circumstances, the penalty would function as a rate payer tax. Further discussion of non-wood resources and I-937 is beyond the scope of this report. Below, we consider the potential implications of I-937 for wood-to-energy. As we have noted, state woody biomass resources are finite and as such should be considered from a perspective of strategic sustainable optimization to produce outputs that best serve state needs. Since biomass is the only state resource that can be converted into liquid fuel, maximizing biomass utilization for this energy output should be the logical state priority. I-937 undermines this objective in several ways first by establishing biopower as the state energy priority, second by differentiating some resources as ineligible (inference being not renewable and not appropriate for energy development), and third by promoting small-scale projects over more efficient and effective large-scale energy conversions. Identification of “eligible” and “non-eligible” renewable resources is arbitrary and may result in subsets of the wood resource used for electricity generation while the broader resource is left isolated and unusable. Biased segregation of resources also perpetuates public misconceptions as discussed earlier in this section of the report. As mentioned previously, raw material cost-indexing is important as is an understanding of raw material volume inputs and project magnitudes needed for efficient energy production. I-937 identifies old growth, black liquor, treated wood, and municipal solid waste as unacceptable resources for energy. To many environmentally concerned members of the public such exceptions may seem appropriate but closer examination suggests a different conclusion. Old growth is an undefined and not particularly useful term; especially given regional climate impacts and declines in forest health. In 1999, the GAO recommended that a strategy was needed to address catastrophic wildfire on federal forests through removal of surplus fuel loads. The Healthy Forests

112
Restoration Act, passed by Congress in 2003, recognized this problem and attempted to prompt action (US Congress 2003). In 2004, the State Forest Health Strategy Work Group offered similar recommendation (DNR 2004a). Two-thirds of the US forest health problem is on federal forests (Rummer et al.2003) but progress has been slow (GAO 2005a). Significant acreages of federal forestland have never been harvested, yet for more than one hundred years wildfire has been excluded resulting in establishment of dense understory vegetation and fuel loads outside of any recent historic range of variability (Pfilf et al. 2002). Different forests may or may not contain large trees or habitats for sensitive species but if never previously harvested could be considered old growth. Never-the-less the question is when such forests will burn not if they will burn. The consequences of catastrophic fire have been discussed. The implications of global warming trends have been acknowledged as aggravating forest health declines. Failure to reduce fuel loads and utilize biomass for products and energy will come at significant costs. Black liquor is an important captive resource for renewable energy, the costs of which have been underwritten by recovery of higher value product streams. Failure to recognize black liquor as a valuable resource reflects legacy misunderstanding that is counterproductive to achievement of climate change and renewable energy objectives. For example, recall that state targets for GHG emissions reductions have been legally mandated by passage of E2SHB 2815. Similar circumstances apply to treated wood and recoverable biomass portions from municipal solid waste with fuel production potential. Both of these resources are currently used by clean energy generating facilities equipped with proper emissions filtration and control equipment in California such as Wheelabrator Shasta Energy Co. (Jolley 2001). Both of these resources can provide low-cost feedstocks as utilization for energy generation offsets disposal costs of placement in landfills (EPA 2007a). The United States Conference of Mayors (Global Insights 2008) recognizes treated wood, recovered wood from municipal solid waste, and black liquor as renewable biomass resources. I-937 has targeted small inefficient and high-cost-per-unit-output distributed power projects for preferential treatment. As a general rule, the smaller the project, the higher the capital and operating costs per unit-output, the less the energy yield per unit of feedstock material, and the more compromised the ability to recover the energy benefits of heat and steam. Biomass power produced from a 5MW plant was found to cost 53 percent more than that from a 50 MW power plant; a difference of $0.13 per kWh verses $0.085 per kWh (McNeil Technologies 2003). Projects under 5MW of electricity production are awarded double credit by I-937 towards meeting a utility district’s power obligations. An additional 25 percent energy credit is given to facilities constructed under a state-approved apprenticeship program. Therefore the total multiplier available to small projects can be as high as 225 percent. There is no logical reason for this benefit if the objective is GHG emissions reductions. The consequences are that the resource is grossly underutilized, only the lowest cost mill residuals are likely to be sought (low hanging fruit) which compromises the ability to recover logging slash and to reduce fire hazard through fuels reduction treatments. Industrial biomass users, such as the pulp and paper industry, are placed at competitive disadvantage for hog fuel which could threaten retention of existing jobs and in-place power production (in this case I-937 functions as a subsidy to small new projects; worth the avoided costs of noncompliance for utilities). The rate-payers absorb the costs of needlessly expensive and inefficient power additions with little in the way of energy independence or GHG emissions reductions achieved. The step schedule of required new energy contributions, as shown above, further encourages utilities to focus on additions of small projects implemented only as needed to meet incremental regulatory thresholds. Utilities are placed in competitive relationship with one another towards securing needed renewable credits rather than rewarded for cooperative state achievement. A review of data from the 2008 Electric Utility Fuel Mix Reports (CTED 2008) revealed that, out of 61 Washington and Oregon utilities reporting, 57 utilities (93 percent) reported electric fuel mixes for 2007 of over 85 percent power from hydro, nuclear, wind, and biomass. Logically, the four utilities with lower than 85 percent of fuel mixes from non-polluting sources should be prioritized for renewable additions while utilities, such as Douglas County with 100 percent hydro-power, should have no I-937 compliance obligations. Further examination of fuel mix
113
data reveals that three of the four most-polluting utilities account for 82 percent of coal and 48 percent of natural gas fuel use of the state totals. Utilities can sell the power, generated by new renewable energy projects, to more lucrative out-of-state markets but still take the credit towards meeting I-937 power production obligations. For example, more than two million MWh of wind-power were generated in Washington in 2007 but nearly three-quarters of the power generated was sold out-of-state. In 2007, wind electricity sales to Washington customers were 546 thousand MWh (CTED 2008). Under such circumstances, little improvement to Washington energy freedom is achieved while significant amounts of power are sacrificed to line loss from long-distance transmission on the grid. The US average line loss has been estimated at nine percent of total transmitted power (EPA 2007e). As comparison, the total renewable energy contribution from all sources to the US 2007 energy portfolio was seven percent (Figure 1.1.1.; EIA 2008h). Renewable Fuel Standard In contrast to the state mandates for renewable electricity additions, Washington has no regulation with binding legal authority to require incremental additions of ethanol to each gallon of gasoline (Yoder et al. 2008). There is a two percent blend target but it is loosely estimated as a portion of the total rather than each individual gallon. In 2008, ethanol was less expensive than gasoline and consequently ethanol was blended with gasoline at levels well beyond the two percent target (Lyons pers com). Oregon, on the other hand, has established a ten percent renewable fuel standard (RFS) that, when in full force, will require every gallon of gasoline sold in Oregon to be blended with ten percent ethanol by volume. Not surprisingly, Oregon now hosts two cellulosic ethanol plants that are located near Boardman by the Columbia River. Such conversion facilities, so located, could compete for woody biomass resources from Washington. At a hearing of the Technology, Energy, and Communications Committee of the Washington State House of Representatives (November 27, 2007), a representative of the Pacific Ethanol Company testified that the ten percent RFS was influential in his company’s decision to locate their facility in Oregon. He went on to suggest that, without a similar standard, investment in Washington to establish renewable fuels conversion facilities could be limited. Hill and Learn (2007b) write that Oregon’s generous 50 percent facilities investment and $10 per ton biomass procurement tax credits (Business Energy Tax Credit, OR HB 2210) also influenced Pacific Ethanol’s decision to locate in Oregon. Possibly of further concern to Washington policy makers, biomass procurement tax credits may give competitive edge to Oregon firms that compete for Washington’s biomass resources. In their 2008 WSU biofuels report to the legislature, Yoder et al. present sound but generic arguments against imposition of a renewable fuel standard in Washington. However, this investigation was narrowly focused on instate biofuels only and did not consider the implications of feedstock competition from instate biopower or from out-of-state biofuels companies. I-937 established a binding renewable portfolio standard for electrical utilities that, in lieu of a corresponding renewable fuel standard, relegates liquid fuels production to a subordinate position that inadvertently may direct biomass away from liquid fuels production. Without adjustment, we expect unintended consequences. Clearly liquid fuels should be the energy priority from both a GHG reductions and an energy independence perspective. Neighboring states such as Oregon (with RFS) and British Columbia (with fossil fuel tax) have established higher priority for liquid fuels conversions. One of two outcomes can be anticipated from which to consider the consequences of these developments. Either the economics of renewable fuels production will improve through policy supports and technical advancements or they won’t. If the former should occur, then greater volumes will be produced; if the latter, then renewable fuels will remain limited with increased consumption of fossil fuels the likely result. For either case, unless Washington proceeds with more aggressive biofuels policies, instate potential for biofuels conversions will be compromised on one hand by companies choosing to take Washington resources to more biofuels-friendly adjacent states or by stagnant development throughout the region. A definitive renewable fuel standard for Washington would be a significant and perhaps necessary incentive for utilization of wood biomass for conversion to biofuels.
114
Green building standards Wood biomass potential for energy development is closely tied to the viability of the Washington forest products industry. Wood has been shown to be a superior building product for reducing GHG emissions as compared to non-renewable and polluting alternatives such as steel and concrete. However, accounting methodologies employed by State-endorsed green building standards appear arbitrary, may understate the value of Washington wood, and fail to include internationally-recognized standards for environmental analysis such as life cycle assessment. We find a number of studies that offer similar conclusion that are worthy of policy review as standards evolve (CEC 2008, CFPC 2008, Bowyer et al. 2006a, Smith et al. 2006, Trusty 2006, Fernholz et al. 2005). Two unintended consequences result: imported polluting and non-renewable products may receive preferential selection for green building projects while locally-produced wood products are overlooked and the production of least-cost woody biomass process residuals may be compromised. Green building standards that discount the environmental value of Washington-grown wood building products function as an obstacle to wood biomass utilization for bioenergy production. Green jobs A lack of recognition of forest resource and biomass related jobs as “green jobs” is an obstacle to more effective use of forest biomass for fuels and power. Wood biomass has been estimated to represent 66 percent of Washington’s potentially available biomass inventory (Frear 2008). If substantive production of bioenergy is to occur in Washington then the wood resource must play a central role. Skog and Ince, economists at the USDA Forest Products Laboratory estimate that wood-based biofuels could provide at least 102,000 new American jobs by 2022 (Spartz 2009). Since the Washington woody biomass inventory has been estimated to represent five percent of the total potentially available US resource (Perlack et al. 2005), the Skog and Ince estimate could imply potential for 5,100 wood-based biofuel jobs for Washington. Further benefit would accrue as many of these jobs would be located in rural communities and, with careful policy planning, retention of the 45,000 current Washington forest industry jobs should be better assured. Wood energy jobs are not limited to plant operations. Morris (1999) found that, for wood biomass-to-electricity conversions in California, twice as many support jobs in fuel-production operations were needed as jobs in the generating plant. In a feasibility study of biomass power facility potential in eastern Oregon, McNeil estimated that establishment of a 25 MW wood-fired power plant would require 17 employees to operate the plant with 54 people engaged in fuel procurement (McNeil 2003). Analysis of job creation from a 15 million-gallon per year wood ethanol plant, co-located with an existing biomass electricity generator indicated that 28 jobs would be created in the plant and 60-128 jobs would be needed in the woods to gather feedstock materials (Quincy Library Group and others 1997). In an extensive examination of the renewable energy and energy efficiencies industries in the US, the American Solar Energy Society and Management Services Inc. (ASES and MISI 2008) offer this definition: “Environmental jobs are perhaps best understood when viewed in a continuum across a spectrum, with jobs that generate obvious environmental resource degradation or extraction at one end; a range of greener jobs involving clean production measures and technologies to reduce environmental impacts in the center, and the other end of the spectrum where jobs have a positive environmental impact. Environmental industries and green jobs are those which, as a result of environmental pressures and concerns, have produced the development of numerous products, processes, and services, which specifically target the reduction of environmental impact. Environment-related jobs include those created both directly and indirectly by environmental protection expenditures.” In 2007, over 70 percent of US renewable energy jobs were in the biomass sector – primarily ethanol and biomass power, and the second largest number of jobs was in the wind sector, followed by the geothermal and photovoltaics sectors (ASES and MISI 2008). Our review of the literature found the above definition of green jobs, while still less than explicit, possibly one of the better available. Of particular importance is recognition of the continuum. For forestry, an example of a “green” continuum might begin with a forest thinning to reduce wildfire and insect hazard that results in protection of forestlands and resources, followed by provision of wood for “green” products
115
and renewable energy, and future recovery of discarded wood waste for recycle or energy. However, we find no rigorous and well-accepted definition of an environmental job that explicitly includes forestry beyond passing mention of biomass for energy. In fact, many definitions are ambiguous and may be contradictory. For example, an environmental engineer might be readily recognized as a green job but would a resource manager with a state or federal agency receive such recognition? Many might agree that a job in a recycling plant would be considered green but is it green if the recycling plant adds demand for coal-generated electricity and produces air pollution? Especially pertinent to wood-energy, are all alternative energy producers considered equally green? Is a welder in a pulp mill that is generating combined heat and power not termed green while a welder in a solar panel factory is counted as a green job? While it may not be commonly understood, we suggest that biomass procurement and process employment provide a suite of environmental benefits that range from management of forest ecosystems to provision of environmentally-friendly products and energy. Recognition of foresters, harvesters, manufacturers, and energy producers as green jobs will be important to wood biomass energy development as skilled workers are needed. Washington universities and technical colleges offer research and education programs in all forestry-related fields pertinent to sustainable management of forests linked to extraction and process of products and energy. The necessity of these programs and the educated workers that they produce should not be discounted in a rush to wind mills and solar panels if wood-based energy in Washington is to be realized. The anticipation is that there will be 25,000 “clean energy sector jobs” by 2020 in Washington State, however, no definition is offered (E2SB 6001). For example, we direct the reader to the Washington Dept of Ecology “Green Economy” web page http://www.ecy.wa.gov/climatechange/GreenEconomy.htm which heralds the state commitment to a “green economy.” Excerpts are provided below. “What is a green economy? What is a green job? Definitions of "green," "clean," and "sustainable" are hotly debated and used interchangeably. In addition, labor and industry codes have not kept pace with new innovations – clean energy, nanotechnology and photonics are some of the industries that are not coded and captured in labor and industry statistics.
Washington uses the following definitions: The green economy is rooted in the development and use of products and services that promote environmental protection, energy independence, and economic development.
Environmental protection includes the prevention and reduction of environmental pollution, as well as efforts to mitigate environmental pollution. For example, conservation and recycling.
Energy independence includes the development and use of energy efficiency, renewable energy, and smart energy products and services.
Green jobs are those in the primary industries of a green economy that promote environmental protection and energy independence.
Clean energy is the largest element of the green economy. Clean energy industries include:
• Energy efficiency - Energy efficiency is by far the largest element of the clean energy sector. The Environmental & Energy Study Institute (EESI) reported gross revenues over $900 billion and 8 million jobs created in 2006. Their study includes manufacturing, recycling and construction. In Washington the energy efficiency industry employed more than 4,000 people in almost 200 companies.
• Renewable energy - Renewable energy includes hydroelectricity, biomass, biofuels, geothermal, wind, and solar. According to the U.S. Energy Information Administration, in 2006 renewable energies produced about six percent of total U.S. energy. The industry grossed revenues of $40 billion and created nearly half a million jobs.
• Smart energy - Smart energy takes advantage of digital technology, electronics and "intelligence" when generating, distributing, and consuming electricity. “ – Washington’s Green Economy
Since 53 percent of 2007 US renewable energy (see Figure 1.1.1) was produced from biomass with the largest contribution coming from forest industries (EIA 2008h, Perlack et al. 2005) and the pulp and paper
116
industry is the single largest industrial contributor of renewable energy in the United States (Perlack et al. 2005), shouldn’t this industry be regarded as a creator of “green jobs?” The Washington forest industry employs 45,000 people and annually generates $2 billion in wages, $16 billion in gross business revenues and over $100 million in tax receipts (Eastin et al. 2007). Washington produces six billion board feet of lumber per year, one billion square feet of plywood panels (3/8” basis), and seven million tons of pulp and paper products (Eastin et al. 2007, Ince et al. 2001). Washington currently maintains the second largest lumber production in the nation and is fourth in production of both plywood and pulp and paper products (Eastin et al. 2007, Ince et al. 2001). Wood products are significantly less polluting building alternatives than steel and concrete (Gustavsson and Sathre 2006, Lippke and Edmonds 2006, Bowyer et al. 2004). Washington’s wood process infrastructure also represents significant capital investment in renewable energy development for wood biomass which has been estimated to be 66 percent of the total state biomass resource (Frear 2008). Ecology currently estimates that Washington hosts 8,400 vaguely defined “green” jobs and continues with the following misleading and unproductive comment:
“Washington has a greater concentration of clean tech jobs than the national average: Larger than the state's logging industry and coffee/espresso shop industry. “ – Washington’s Green Economy
The Washington Department of Ecology does not acknowledge forestry as part of the State “green economy” yet the web site does take unassigned credit for the significant renewable energy contribution that is made by the forestry industry. A vague reference to forestry work as a “green related” job is found in a recently-released Washington green economy jobs definitions publication (CTED 2009) which follows an equally vague 2005 report (CTED 2005). “Green job” is a political terminology that may at best be inspiring but at worst misleading. There is no North American Industry Classification System (NAICS) industrial classification for a green job because conceptually such jobs are industrially cross-sectional as demonstrated by the examples above. Therefore, suggesting comparison between numbers of green jobs as compared to numbers of jobs in actual separable industries in disingenuous (Morriss et al. 2009). Interestingly CTED (2009) concludes that natural resource industries are not appropriate for inclusion under the “green” job umbrella:
“Forestry and agriculture are not included in the definitional list. If the green economy is “the development and use of products and services that promote environmental protection and/or energy security,” then forestry and agriculture seem outside the scope of this definitional list. The conservation practices – and biomass - from these sectors are captured in other green-economy industries, such as renewable energy, water conservation, waste management, etc. (CTED 2009).
Lack of appreciation for the important contributions made by Washington resource industries to the state economy and to present and future renewable energy potential is a significant obstacle to biomass for energy development in Washington. Agencies, without a clear and common understanding of energy priorities and strategic possibilities for Washington State, will be ill-equipped to guide the profound energy and climate change transitions that have been envisioned. Remarkably, State discussion of green jobs reflects a lack of understanding that significant development of Washington-grown biofuels potential can not occur without utilization of woody biomass and retention of forest industry infrastructure. Western Climate Initiative (WCI) We find that the cap and trade program, envisioned by WCI, fails to adequately recognize current and potential contributions of forests to GHG emissions reductions and could impose significant obstacles to biofuels development from wood biomass in Washington. We offer a number of issues that are worthy of discussion. The following text in italics is an overview of the WCI program taken from the web site (WCI 2009). The Western Climate Initiative (WCI) was launched in February 2007 by the governors of Arizona, California, New Mexico, Oregon, and Washington, signaling a long-term commitment to significantly reduce regional greenhouse gas emissions. Since the WCI first formed, the states of Montana and Utah and the Canadian provinces of British Columbia, Manitoba, Ontario, and Quebec have joined the
117
partnership. The WCI Partners share a commitment to identify, evaluate and implement collective and cooperative ways to address climate change through a regional reduction of greenhouse gases (GHG). To this end, the WCI Partners are recommending the implementation of a market-based cap-and-trade program. This program is an important component of a comprehensive regional effort to reduce GHG emissions by 15 percent below 2005 levels by 2020 (authors’ note: Washington’s more-stringent objective is to reduce GHG emissions to 1990 levels by 2020). If approved, the new, multi-sector program would be the most comprehensive carbon-reduction strategy designed to date. It would cover nearly 90 percent of the region’s emissions, including those from electricity, industry, transportation, and residential and commercial fuel use. Together, the seven states and four provinces represent over 70 percent of the Canadian economy and 20 percent of the U.S. economy. Based on extensive study of existing programs, economic analysis and extensive stakeholder consultation, the cap-and-trade design is intended to lower the cost of achieving emission reductions and mitigate the economic impact on consumers and businesses. The low-carbon economy that the cap-and-trade program will help create is expected to produce a variety of tangible gains throughout the region. The program will slash GHG pollution, spur growth in new green technologies, help build a strong clean-energy economy, and reduce dependence on foreign oil. Cap and Trade is considered by WCI partners to be the best means of reducing the GHG emissions that cause global warming while simultaneously providing industry with incentives that will encourage alternative, renewable energy sources and technologies. A cap-and-trade program sets a clear, mandatory, enforceable limit on GHG emissions and then allows the market to identify the most cost-effective ways to achieve the limit. The state or provincial government sets an absolute aggregate limit (or “cap”) on GHG emissions from a sector or multiple sectors. Tradable emissions “allowances,” or permits, are then distributed in an amount that equals the total emissions permitted by the cap. These allowances can be distributed by auction and/or be allocated at no cost. Partner governments will specify which entities and facilities must surrender allowances to cover their emissions. In crafting its cap-and-trade program, the WCI Partners carefully assessed the designs and performance of programs such as the U.S. Environmental Protection Agency’s Acid Rain program and the European Union’s Emission Trading Scheme. The design recommendations take into account lessons learned from existing programs and reflect the diversity of the WCI Partner economies, including energy production and consumption patterns. A comprehensive review of the Western Climate Initiative and its proposed cap and trade program is beyond the scope of this investigation. However, to inform analysis of the potential impacts of the WCI program on wood biomass for energy development in Washington, we reviewed a number of WCI and related documents including Design Recommendations for the WCI Regional Cap-and-Trade Program (WCI 2008), Economic Analysis and Modeling Support to the Western Climate Initiative – Energy 2020 Model Inputs and Assumptions (ICF Consulting 2008), and Recommendations for Designing a Greenhouse Gas Cap-and-Trade System for California (CARB 2007). While we caution that our findings are preliminary, we find many inconsistencies that could result in unintended consequences and suggest that a more thorough peer-review by university scientists in Washington is warranted prior to implementation. Our colleagues at WSU have offered thoughtful preliminary review comments and conclude that a fossil tax may be more suitable for achievement of GHG emissions reductions than the proposed cap and trade program (Yoder et al. 2008). We recommend this text as useful background and build upon their conclusions with focus on implications for wood to energy in Washington. We agree with the WCI partners and others (Leggett 2009) that achieving substantive GHG reductions from business as usual projections will require extraordinary changes in what energy sources are exploited and how energy is
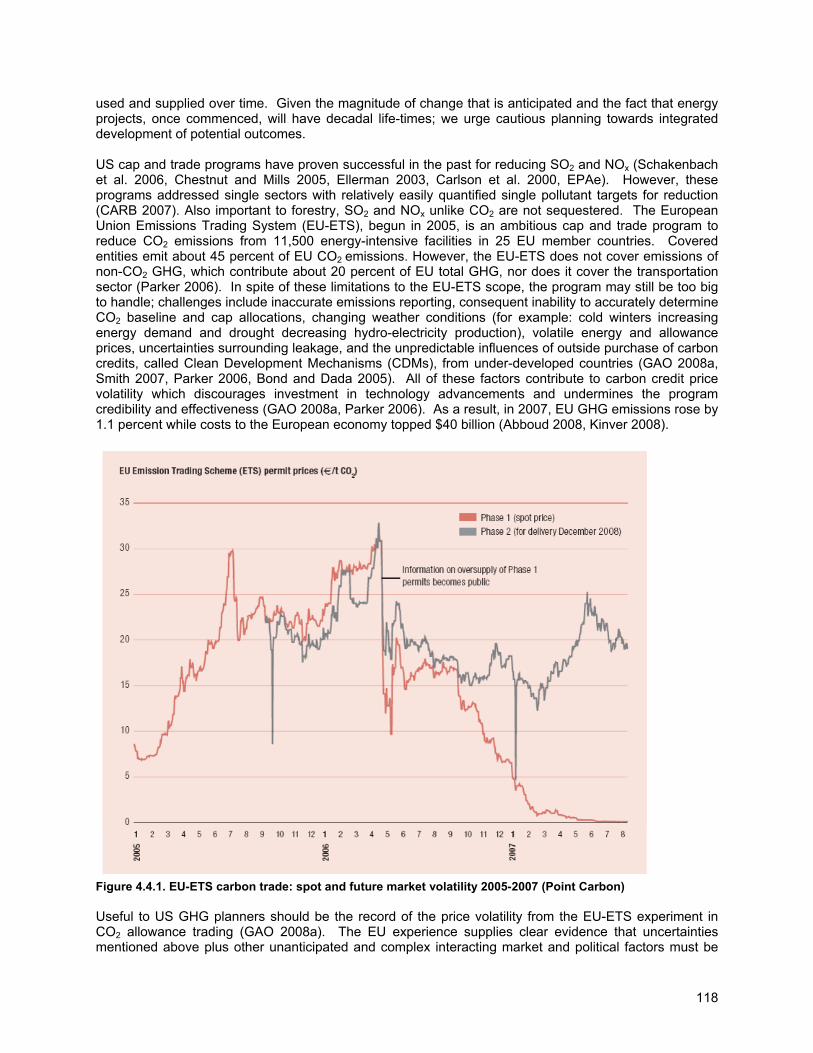
118
used and supplied over time. Given the magnitude of change that is anticipated and the fact that energy projects, once commenced, will have decadal life-times; we urge cautious planning towards integrated development of potential outcomes. US cap and trade programs have proven successful in the past for reducing SO2 and NOx (Schakenbach et al. 2006, Chestnut and Mills 2005, Ellerman 2003, Carlson et al. 2000, EPAe). However, these programs addressed single sectors with relatively easily quantified single pollutant targets for reduction (CARB 2007). Also important to forestry, SO2 and NOx unlike CO2 are not sequestered. The European Union Emissions Trading System (EU-ETS), begun in 2005, is an ambitious cap and trade program to reduce CO2 emissions from 11,500 energy-intensive facilities in 25 EU member countries. Covered entities emit about 45 percent of EU CO2 emissions. However, the EU-ETS does not cover emissions of non-CO2 GHG, which contribute about 20 percent of EU total GHG, nor does it cover the transportation sector (Parker 2006). In spite of these limitations to the EU-ETS scope, the program may still be too big to handle; challenges include inaccurate emissions reporting, consequent inability to accurately determine CO2 baseline and cap allocations, changing weather conditions (for example: cold winters increasing energy demand and drought decreasing hydro-electricity production), volatile energy and allowance prices, uncertainties surrounding leakage, and the unpredictable influences of outside purchase of carbon credits, called Clean Development Mechanisms (CDMs), from under-developed countries (GAO 2008a, Smith 2007, Parker 2006, Bond and Dada 2005). All of these factors contribute to carbon credit price volatility which discourages investment in technology advancements and undermines the program credibility and effectiveness (GAO 2008a, Parker 2006). As a result, in 2007, EU GHG emissions rose by 1.1 percent while costs to the European economy topped $40 billion (Abboud 2008, Kinver 2008).
Figure 4.4.1. EU-ETS carbon trade: spot and future market volatility 2005-2007 (Point Carbon) Useful to US GHG planners should be the record of the price volatility from the EU-ETS experiment in CO2 allowance trading (GAO 2008a). The EU experience supplies clear evidence that uncertainties mentioned above plus other unanticipated and complex interacting market and political factors must be
119
very carefully considered (Figure 4.4.1.). Price volatility is very difficult if not impossible to forecast. Typically research organizations, such as the IPCC or the EIA, develop multiple scenarios for sensitivity analysis of a variety of outcomes associated with different modeling assumptions. It appears, instead, that WCI relies upon a single modeled reference case based upon “reasonable expectations” and accompanied by the caveat that “caution should be used in applying a high level of precision to the modeling results” (ICF Consulting 2008). We posed several questions in this regard to the modeler but received no response. The inevitable development of both spot and futures markets augmented by unpredictable credits that enter from outside of the system, such as CDMs that are of uncertain verifiability and are priced by forces both within and without the established market boundaries, logically must result in volatility. The CO2 price volatility created by the EU-ETS aggravates notoriously volatile energy markets which serve to focus investor attention on short-term strategies rather than long-term improvement (not unlike what we anticipate from I-937). Renewable energy investments require a minimum term-life of 20 years with many extending to 40 years. An important policy objective should be to stabilize investment opportunities rather than to aggravate market uncertainties. The planned cap and trade program under development by WCI will be the most ambitious GHG allowance trading program yet to be devised and will be much more complex than the EU-ETS trading scheme (WCI 2008). The greenhouse gasses covered will be expanded to include CO2, CH4, N2O, hydrofluorocarbons, perfluorocarbons, and sulfur hexafluoride based upon CO2e global warming potential. Ultimately WCI plans to address up to 90 percent of total emissions sources including transportation fuels but methodologies for transportation fuel appear to be as yet to be in development and inclusion is to be delayed for at least three years past the program start date of 2012. It is evident that significant investment has already been made towards bringing this program forward but we find that our review of WCI reports indicates substantial program uncertainties compounded by unsupportable assumptions that have been based upon energy price estimates and consumption forecasts that have already proven to be inaccurate. The questions that we submitted to the WCI technical specialist went unanswered. However, we did receive comments back from state agency personnel assigned to the WCI planning group that warrant mention. An important issue that has been discussed throughout this report is the lack of cohesive state prioritization of energy objectives. We asked if the resource allocation and the energy independence implications of delay in addressing transportation verses early inclusion of electricity had been discussed by WCI participants. The response was that when plans were being developed the gasoline price was over $4 per gallon making transportation too expensive to consider and that energy independence was not an assigned task for WCI consideration. Sandia National Laboratory and General Motors (2009) and GAO (2007a) find that, without sustained high oil prices, policies to develop and adopt biofuels will fail. The current economic woes of the ethanol industry offer evidence of the impacts to biofuels of falling oil prices. Increased energy independence may not be an assigned task but it is an expected outcome that is explicitly stated in the WCI literature. As discussed in Section II, policy strategies that link climate change mitigation with reduced reliance upon imported oil will be important for maximizing public benefits from wood-to-energy development. Failure to include consideration of market influences of energy independence undermine cap and trade program cost estimate accuracy and since electricity is prioritized over transportation will treat domestic fossil resources such as natural gas and coal (used to generate electricity) with prejudice as compared to imported oil (used for transportation). It appears that one assumption included in the WCI Energy 2020 modeled reference case is that the national biofuels objectives as established by EISA will be met on schedule (including 21 billions of advanced biofuels by 2022). If EISA objectives are to be met then modeling should include forecast of fuel market impacts, such lower oil prices. For example, the US Department of Energy estimated that the addition of just 7.2 billion gallons of domestically-produced corn ethanol to the 2008 national fuel supply effectively lowered gas prices by $0.20 to $0.35 per gallon (DOE 2008a). Market implications should not be underestimated as lower gas prices both challenge renewable fuel competitive ability and generally are associated with increases in consumption and emissions. In contrast to WCI assumptions, the EIA Annual Energy Outlook (2009c) does not forecast that EISA biofuels targets are fully met by 2030.
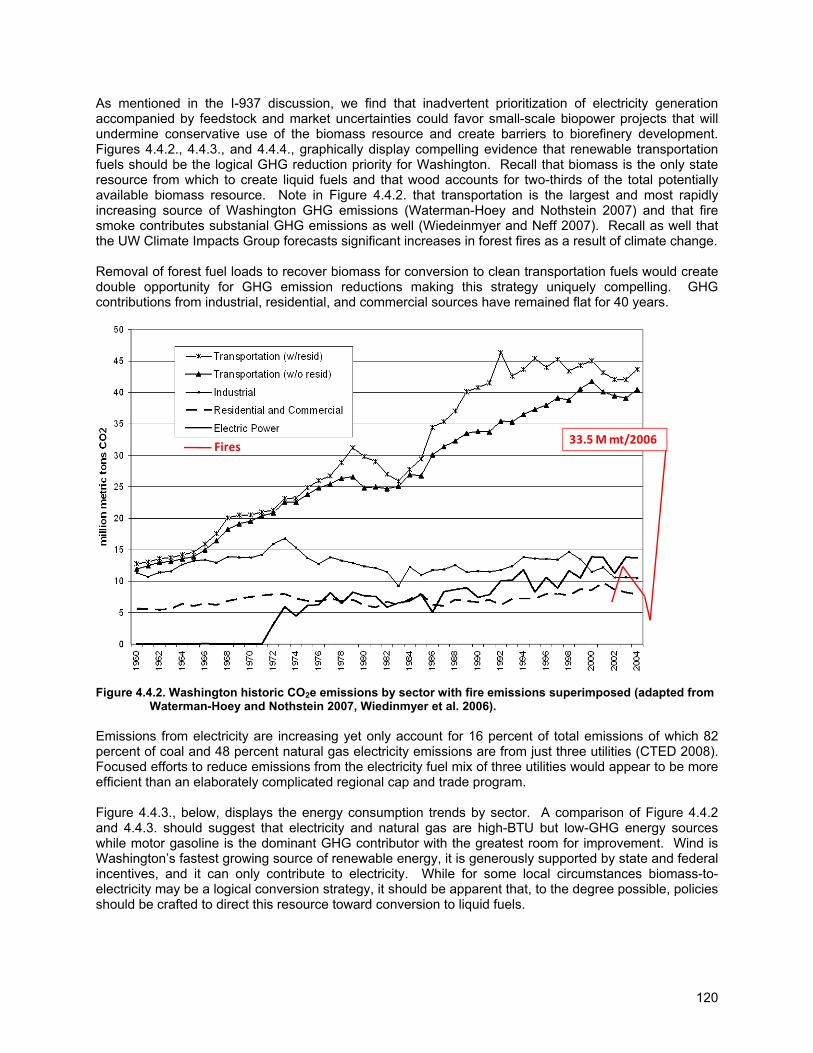
120
As mentioned in the I-937 discussion, we find that inadvertent prioritization of electricity generation accompanied by feedstock and market uncertainties could favor small-scale biopower projects that will undermine conservative use of the biomass resource and create barriers to biorefinery development. Figures 4.4.2., 4.4.3., and 4.4.4., graphically display compelling evidence that renewable transportation fuels should be the logical GHG reduction priority for Washington. Recall that biomass is the only state resource from which to create liquid fuels and that wood accounts for two-thirds of the total potentially available biomass resource. Note in Figure 4.4.2. that transportation is the largest and most rapidly increasing source of Washington GHG emissions (Waterman-Hoey and Nothstein 2007) and that fire smoke contributes substanial GHG emissions as well (Wiedeinmyer and Neff 2007). Recall as well that the UW Climate Impacts Group forecasts significant increases in forest fires as a result of climate change. Removal of forest fuel loads to recover biomass for conversion to clean transportation fuels would create double opportunity for GHG emission reductions making this strategy uniquely compelling. GHG contributions from industrial, residential, and commercial sources have remained flat for 40 years.
Figure 4.4.2. Washington historic CO2e emissions by sector with fire emissions superimposed (adapted from Waterman-Hoey and Nothstein 2007, Wiedinmyer et al. 2006).
Emissions from electricity are increasing yet only account for 16 percent of total emissions of which 82 percent of coal and 48 percent natural gas electricity emissions are from just three utilities (CTED 2008). Focused efforts to reduce emissions from the electricity fuel mix of three utilities would appear to be more efficient than an elaborately complicated regional cap and trade program. Figure 4.4.3., below, displays the energy consumption trends by sector. A comparison of Figure 4.4.2 and 4.4.3. should suggest that electricity and natural gas are high-BTU but low-GHG energy sources while motor gasoline is the dominant GHG contributor with the greatest room for improvement. Wind is Washington’s fastest growing source of renewable energy, it is generously supported by state and federal incentives, and it can only contribute to electricity. While for some local circumstances biomass-to-electricity may be a logical conversion strategy, it should be apparent that, to the degree possible, policies should be crafted to direct this resource toward conversion to liquid fuels.
Fires 33.5 M mt/2006

121
Figure 4.4.3. End-use energy consumption in Washington by major source (CTED 2007). Figure 4.4.4. displays the cumulative CO2e emissions for Washington by sector with the superimposed targets for GHG emissions reductions, as established by E2SHB 2815. The magnitude of this ambitious program for emissions reductions is not to be underestimated. Elimination of all electricity emissions would likely be insufficient to reduce GHG to just the first step, equivalent to 1990 levels by 2020. Elimination of all fossil electricity in Washington would be imprudent since a diversified portfolio of firm electricity sources is needed for energy security and for support of intermittent power sources such as wind and solar (Prescott 2009).
Figure 4.4.4. Washington Cumulative Energy-Related CO2 e Emissions by Sector (without fire) with State GHG reduction targets superimposed (from Waterman-Hoey and Nothstein 2007).
2020 to 1990
2050 to 50% 1990
2035 to 25% 1990
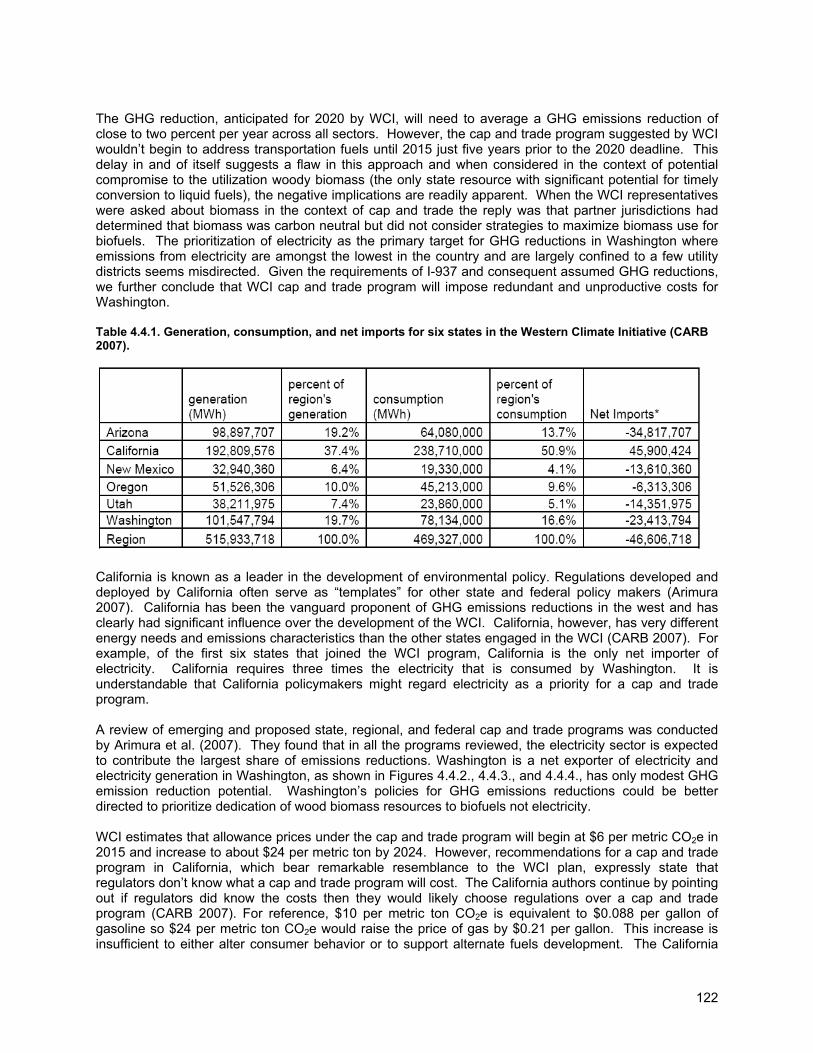
122
The GHG reduction, anticipated for 2020 by WCI, will need to average a GHG emissions reduction of close to two percent per year across all sectors. However, the cap and trade program suggested by WCI wouldn’t begin to address transportation fuels until 2015 just five years prior to the 2020 deadline. This delay in and of itself suggests a flaw in this approach and when considered in the context of potential compromise to the utilization woody biomass (the only state resource with significant potential for timely conversion to liquid fuels), the negative implications are readily apparent. When the WCI representatives were asked about biomass in the context of cap and trade the reply was that partner jurisdictions had determined that biomass was carbon neutral but did not consider strategies to maximize biomass use for biofuels. The prioritization of electricity as the primary target for GHG reductions in Washington where emissions from electricity are amongst the lowest in the country and are largely confined to a few utility districts seems misdirected. Given the requirements of I-937 and consequent assumed GHG reductions, we further conclude that WCI cap and trade program will impose redundant and unproductive costs for Washington. Table 4.4.1. Generation, consumption, and net imports for six states in the Western Climate Initiative (CARB 2007).
California is known as a leader in the development of environmental policy. Regulations developed and deployed by California often serve as “templates” for other state and federal policy makers (Arimura 2007). California has been the vanguard proponent of GHG emissions reductions in the west and has clearly had significant influence over the development of the WCI. California, however, has very different energy needs and emissions characteristics than the other states engaged in the WCI (CARB 2007). For example, of the first six states that joined the WCI program, California is the only net importer of electricity. California requires three times the electricity that is consumed by Washington. It is understandable that California policymakers might regard electricity as a priority for a cap and trade program. A review of emerging and proposed state, regional, and federal cap and trade programs was conducted by Arimura et al. (2007). They found that in all the programs reviewed, the electricity sector is expected to contribute the largest share of emissions reductions. Washington is a net exporter of electricity and electricity generation in Washington, as shown in Figures 4.4.2., 4.4.3., and 4.4.4., has only modest GHG emission reduction potential. Washington’s policies for GHG emissions reductions could be better directed to prioritize dedication of wood biomass resources to biofuels not electricity. WCI estimates that allowance prices under the cap and trade program will begin at $6 per metric CO2e in 2015 and increase to about $24 per metric ton by 2024. However, recommendations for a cap and trade program in California, which bear remarkable resemblance to the WCI plan, expressly state that regulators don’t know what a cap and trade program will cost. The California authors continue by pointing out if regulators did know the costs then they would likely choose regulations over a cap and trade program (CARB 2007). For reference, $10 per metric ton CO2e is equivalent to $0.088 per gallon of gasoline so $24 per metric ton CO2e would raise the price of gas by $0.21 per gallon. This increase is insufficient to either alter consumer behavior or to support alternate fuels development. The California
123
analysis of cap and trade acknowledges that allowance trading is not likely to result in any significant GHG reduction from the transportation sector (CARB 2007). However, while the WCI cap and trade estimate of allowance price escalation appears modest in nominal terms it does represent a 330 percent expected increase ($6 to $24) in nine years suggesting that price volatility and market speculation are likely to accompany the WCI cap and trade program as has been the case for the EU-ETS. Several studies have examined proposed federal cap and trade programs that are comparable to WCI. EIA (2007b) estimated the allowance price under the Lieberman-McCain proposal would be between $31 and $58 (2005$ per metric ton CO2e) and under the Bingaman-Specter proposal to be $24 (2005$ per metric ton CO2e). Paltsev et al. (2007) developed predicted allowance prices, using the MIT Emissions Prediction and Policy Analysis Model, for the Sanders-Boxer, Kerry-Snowe, and Lieberman-McCain proposals and found that the allowance price range was much larger from a low of $22 to a high of $210 (2005$ per metric ton CO2e). For further reference, consider an IPCC (2007b) review of relevant studies in the literature of the estimated marginal costs of climate change. The estimates ranged from $10 per metric ton CO2e to $350 per metric ton CO2e. Peer-reviewed estimates had a mean value of $43 per metric ton CO2e with a standard deviation of $83 per metric ton CO2e. The results of these studies should serve to demonstrate the high degree of price uncertainty associated with estimates of CO2e value and cap and trade allowance price for an unprecedented WCI trial of a cap and trade scheme expanded to include multiple GHGs and industry sectors. Offsets are to be included in the WCI program and are to be allowed for up to 49 percent of total emission reduction credits. Offsets are considered as verifiable GHG emission reductions, GHG emissions avoided, or GHG removals from the atmosphere; measured in metric tons CO2e. Offset credits can be traded or used for compliance purposes (WCI 2008). Standards and processes are still in development but it appears that Clean Development Mechanisms (CDMs) from outside the WCI region will be allowed. CDMs have their origin in Kyoto negotiations and were designed ostensively to lower costs of climate change mitigation for industrialized countries while providing a way to engage countries without emission reduction targets (Streck et al. 2008). In comparison to energy and industrial CDM projects, in which numerous creative ways to reduce emissions are eligible, forestry CDMs under the Kyoto Protocol are limited in the following ways: (1) they are confined to afforestation and reforestation activities; (2) neither emission reductions from forest conservation nor carbon removals from improved forest management are currently eligible (authors’ note: for Washington, read as fuels reductions); (3) CDM forestry projects are awarded “temporary” credits rather than “regular” permanent carbon credits; and (4) forestry credits can be used only within narrow limits by the parties to the Kyoto Protocol (Streck et al. 2008). Partly as a result of the complicated requirements and the prolonged contentious development of agreements, only one forestry project had gained approval of the CDM Executive Board as of February 2008, as compared to more 900 registered projects overall (UNFCCC 2008). While the environmental value of harvested wood products, wood energy, and wood substitution for energy-intensive product alternatives is recognized by many countries as important to climate change mitigation, the carbon storage benefits of wood products and energy are not acknowledged under the Kyoto Protocol (Grêt-Regamey et al. 2008). WCI CDM protocols have yet to be fully developed, but the apparent intent is to model criteria for acceptable offsets after CDMs under the Kyoto Protocol. As illustration of how significant correct allocation of forestry offsets can for effective GHG emissions reductions in western states, we show a graph in Figure 4.4.5. taken from research by Nabuurs et al. (2000). Nabuurs et al. (2000) examined the importance of broadening the CDM criteria under the Kyoto Protocol for forested countries throughout the world and found that more than 50 percent of potential protection of forest carbon storage in the United States could accrue from pest and fire management. In Canada, the carbon sequestration benefits of forest health treatments amounted to 85 percent of total potential. This range of activities is much broader than the limited afforestation and reforestation actions covered since 1990 by article 3.3 of the Kyoto Protocol. Nabuurs et al. (2000) carbon sequestration estimate is over 13 times higher than the maximum estimate by article 3.3 for annex B countries. Forestry mitigation options as suggested by IPCC are also broadened beyond Kyoto and include afforestation, reforestation, forest management, wood product management, use of wood residues for bioenergy, and avoided land-use conversions (IPCC 2007d, IPCC 1996b, IPCC 1991). The next re-negotiation of Kyoto CDM forestry criteria won’t occur until 2012.
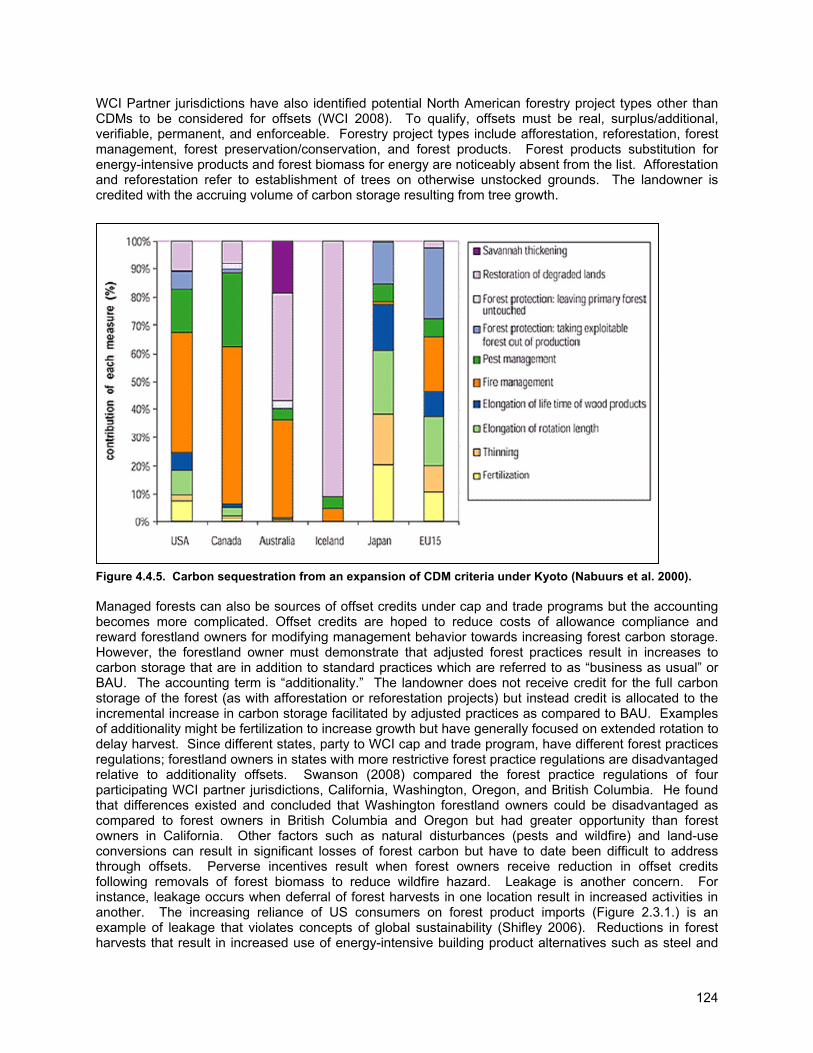
124
WCI Partner jurisdictions have also identified potential North American forestry project types other than CDMs to be considered for offsets (WCI 2008). To qualify, offsets must be real, surplus/additional, verifiable, permanent, and enforceable. Forestry project types include afforestation, reforestation, forest management, forest preservation/conservation, and forest products. Forest products substitution for energy-intensive products and forest biomass for energy are noticeably absent from the list. Afforestation and reforestation refer to establishment of trees on otherwise unstocked grounds. The landowner is credited with the accruing volume of carbon storage resulting from tree growth.
Figure 4.4.5. Carbon sequestration from an expansion of CDM criteria under Kyoto (Nabuurs et al. 2000). Managed forests can also be sources of offset credits under cap and trade programs but the accounting becomes more complicated. Offset credits are hoped to reduce costs of allowance compliance and reward forestland owners for modifying management behavior towards increasing forest carbon storage. However, the forestland owner must demonstrate that adjusted forest practices result in increases to carbon storage that are in addition to standard practices which are referred to as “business as usual” or BAU. The accounting term is “additionality.” The landowner does not receive credit for the full carbon storage of the forest (as with afforestation or reforestation projects) but instead credit is allocated to the incremental increase in carbon storage facilitated by adjusted practices as compared to BAU. Examples of additionality might be fertilization to increase growth but have generally focused on extended rotation to delay harvest. Since different states, party to WCI cap and trade program, have different forest practices regulations; forestland owners in states with more restrictive forest practice regulations are disadvantaged relative to additionality offsets. Swanson (2008) compared the forest practice regulations of four participating WCI partner jurisdictions, California, Washington, Oregon, and British Columbia. He found that differences existed and concluded that Washington forestland owners could be disadvantaged as compared to forest owners in British Columbia and Oregon but had greater opportunity than forest owners in California. Other factors such as natural disturbances (pests and wildfire) and land-use conversions can result in significant losses of forest carbon but have to date been difficult to address through offsets. Perverse incentives result when forest owners receive reduction in offset credits following removals of forest biomass to reduce wildfire hazard. Leakage is another concern. For instance, leakage occurs when deferral of forest harvests in one location result in increased activities in another. The increasing reliance of US consumers on forest product imports (Figure 2.3.1.) is an example of leakage that violates concepts of global sustainability (Shifley 2006). Reductions in forest harvests that result in increased use of energy-intensive building product alternatives such as steel and
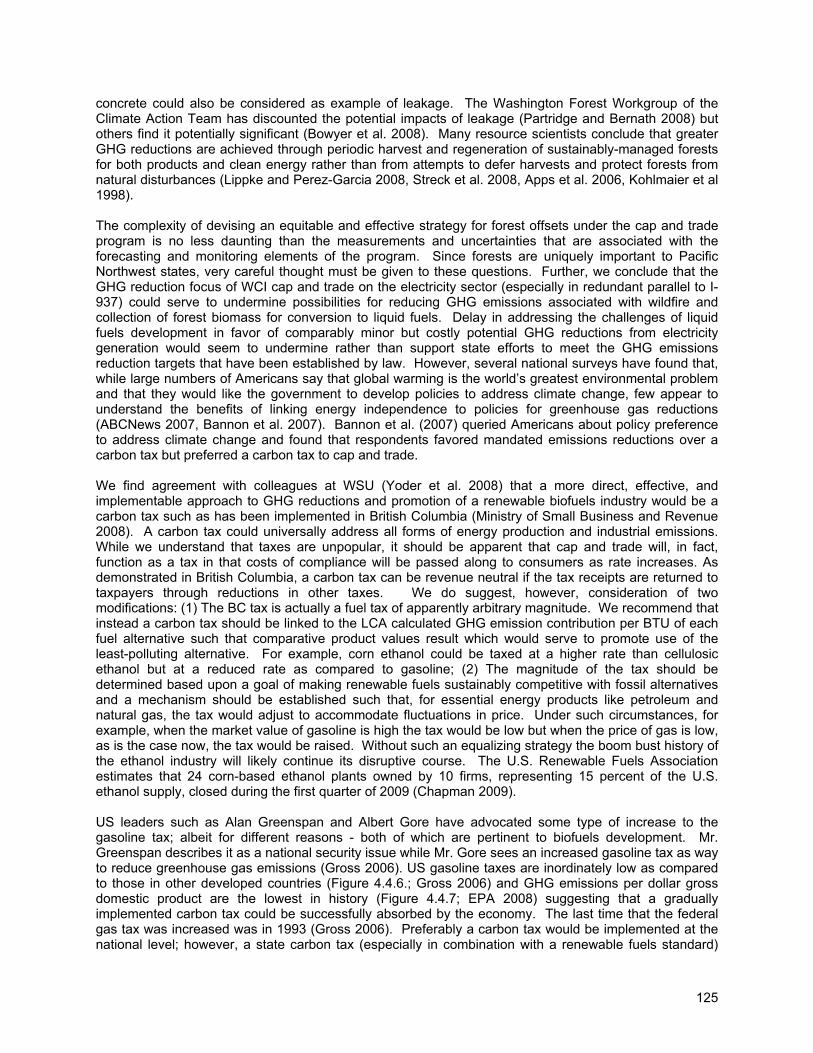
125
concrete could also be considered as example of leakage. The Washington Forest Workgroup of the Climate Action Team has discounted the potential impacts of leakage (Partridge and Bernath 2008) but others find it potentially significant (Bowyer et al. 2008). Many resource scientists conclude that greater GHG reductions are achieved through periodic harvest and regeneration of sustainably-managed forests for both products and clean energy rather than from attempts to defer harvests and protect forests from natural disturbances (Lippke and Perez-Garcia 2008, Streck et al. 2008, Apps et al. 2006, Kohlmaier et al 1998). The complexity of devising an equitable and effective strategy for forest offsets under the cap and trade program is no less daunting than the measurements and uncertainties that are associated with the forecasting and monitoring elements of the program. Since forests are uniquely important to Pacific Northwest states, very careful thought must be given to these questions. Further, we conclude that the GHG reduction focus of WCI cap and trade on the electricity sector (especially in redundant parallel to I-937) could serve to undermine possibilities for reducing GHG emissions associated with wildfire and collection of forest biomass for conversion to liquid fuels. Delay in addressing the challenges of liquid fuels development in favor of comparably minor but costly potential GHG reductions from electricity generation would seem to undermine rather than support state efforts to meet the GHG emissions reduction targets that have been established by law. However, several national surveys have found that, while large numbers of Americans say that global warming is the world’s greatest environmental problem and that they would like the government to develop policies to address climate change, few appear to understand the benefits of linking energy independence to policies for greenhouse gas reductions (ABCNews 2007, Bannon et al. 2007). Bannon et al. (2007) queried Americans about policy preference to address climate change and found that respondents favored mandated emissions reductions over a carbon tax but preferred a carbon tax to cap and trade. We find agreement with colleagues at WSU (Yoder et al. 2008) that a more direct, effective, and implementable approach to GHG reductions and promotion of a renewable biofuels industry would be a carbon tax such as has been implemented in British Columbia (Ministry of Small Business and Revenue 2008). A carbon tax could universally address all forms of energy production and industrial emissions. While we understand that taxes are unpopular, it should be apparent that cap and trade will, in fact, function as a tax in that costs of compliance will be passed along to consumers as rate increases. As demonstrated in British Columbia, a carbon tax can be revenue neutral if the tax receipts are returned to taxpayers through reductions in other taxes. We do suggest, however, consideration of two modifications: (1) The BC tax is actually a fuel tax of apparently arbitrary magnitude. We recommend that instead a carbon tax should be linked to the LCA calculated GHG emission contribution per BTU of each fuel alternative such that comparative product values result which would serve to promote use of the least-polluting alternative. For example, corn ethanol could be taxed at a higher rate than cellulosic ethanol but at a reduced rate as compared to gasoline; (2) The magnitude of the tax should be determined based upon a goal of making renewable fuels sustainably competitive with fossil alternatives and a mechanism should be established such that, for essential energy products like petroleum and natural gas, the tax would adjust to accommodate fluctuations in price. Under such circumstances, for example, when the market value of gasoline is high the tax would be low but when the price of gas is low, as is the case now, the tax would be raised. Without such an equalizing strategy the boom bust history of the ethanol industry will likely continue its disruptive course. The U.S. Renewable Fuels Association estimates that 24 corn-based ethanol plants owned by 10 firms, representing 15 percent of the U.S. ethanol supply, closed during the first quarter of 2009 (Chapman 2009). US leaders such as Alan Greenspan and Albert Gore have advocated some type of increase to the gasoline tax; albeit for different reasons - both of which are pertinent to biofuels development. Mr. Greenspan describes it as a national security issue while Mr. Gore sees an increased gasoline tax as way to reduce greenhouse gas emissions (Gross 2006). US gasoline taxes are inordinately low as compared to those in other developed countries (Figure 4.4.6.; Gross 2006) and GHG emissions per dollar gross domestic product are the lowest in history (Figure 4.4.7; EPA 2008) suggesting that a gradually implemented carbon tax could be successfully absorbed by the economy. The last time that the federal gas tax was increased was in 1993 (Gross 2006). Preferably a carbon tax would be implemented at the national level; however, a state carbon tax (especially in combination with a renewable fuels standard)
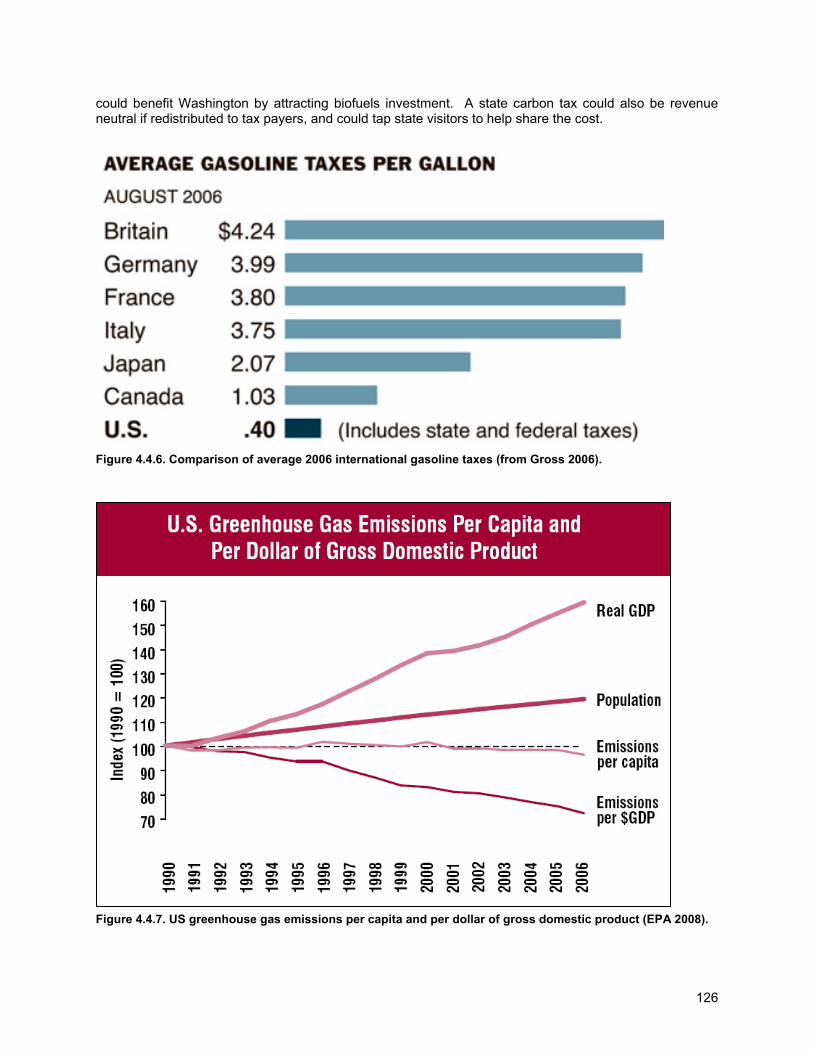
126
could benefit Washington by attracting biofuels investment. A state carbon tax could also be revenue neutral if redistributed to tax payers, and could tap state visitors to help share the cost.
Figure 4.4.6. Comparison of average 2006 international gasoline taxes (from Gross 2006).
Figure 4.4.7. US greenhouse gas emissions per capita and per dollar of gross domestic product (EPA 2008).
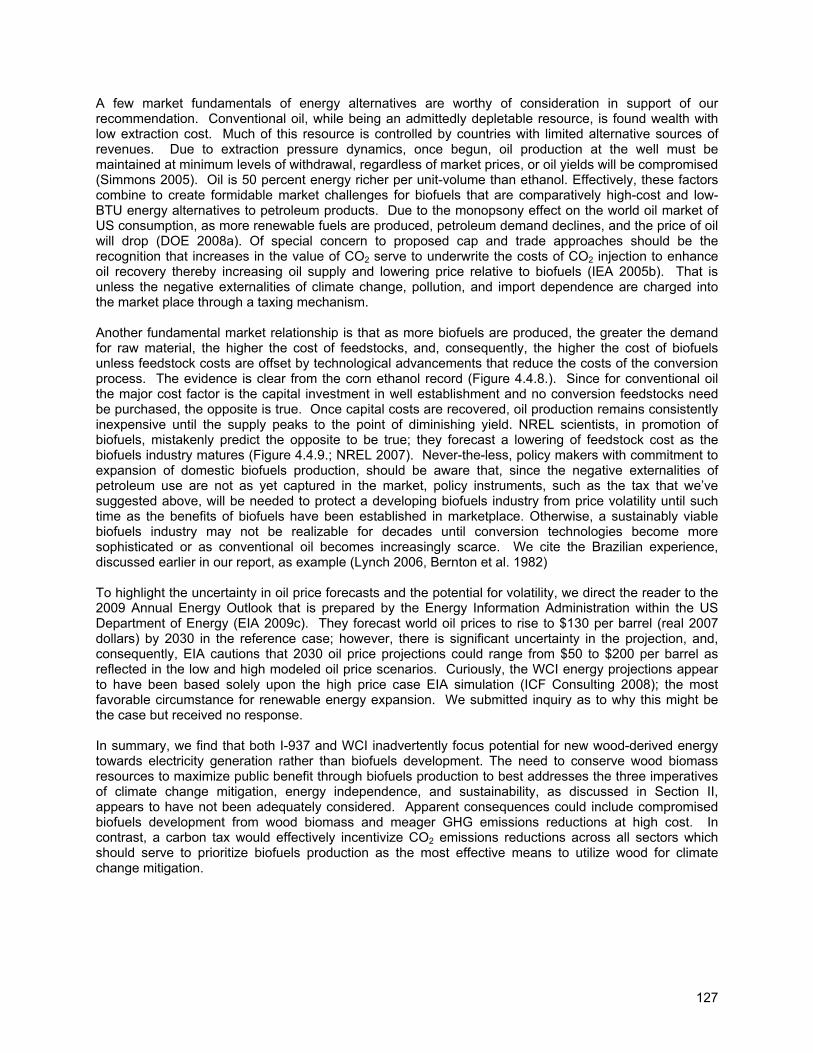
127
A few market fundamentals of energy alternatives are worthy of consideration in support of our recommendation. Conventional oil, while being an admittedly depletable resource, is found wealth with low extraction cost. Much of this resource is controlled by countries with limited alternative sources of revenues. Due to extraction pressure dynamics, once begun, oil production at the well must be maintained at minimum levels of withdrawal, regardless of market prices, or oil yields will be compromised (Simmons 2005). Oil is 50 percent energy richer per unit-volume than ethanol. Effectively, these factors combine to create formidable market challenges for biofuels that are comparatively high-cost and low-BTU energy alternatives to petroleum products. Due to the monopsony effect on the world oil market of US consumption, as more renewable fuels are produced, petroleum demand declines, and the price of oil will drop (DOE 2008a). Of special concern to proposed cap and trade approaches should be the recognition that increases in the value of CO2 serve to underwrite the costs of CO2 injection to enhance oil recovery thereby increasing oil supply and lowering price relative to biofuels (IEA 2005b). That is unless the negative externalities of climate change, pollution, and import dependence are charged into the market place through a taxing mechanism. Another fundamental market relationship is that as more biofuels are produced, the greater the demand for raw material, the higher the cost of feedstocks, and, consequently, the higher the cost of biofuels unless feedstock costs are offset by technological advancements that reduce the costs of the conversion process. The evidence is clear from the corn ethanol record (Figure 4.4.8.). Since for conventional oil the major cost factor is the capital investment in well establishment and no conversion feedstocks need be purchased, the opposite is true. Once capital costs are recovered, oil production remains consistently inexpensive until the supply peaks to the point of diminishing yield. NREL scientists, in promotion of biofuels, mistakenly predict the opposite to be true; they forecast a lowering of feedstock cost as the biofuels industry matures (Figure 4.4.9.; NREL 2007). Never-the-less, policy makers with commitment to expansion of domestic biofuels production, should be aware that, since the negative externalities of petroleum use are not as yet captured in the market, policy instruments, such as the tax that we’ve suggested above, will be needed to protect a developing biofuels industry from price volatility until such time as the benefits of biofuels have been established in marketplace. Otherwise, a sustainably viable biofuels industry may not be realizable for decades until conversion technologies become more sophisticated or as conventional oil becomes increasingly scarce. We cite the Brazilian experience, discussed earlier in our report, as example (Lynch 2006, Bernton et al. 1982) To highlight the uncertainty in oil price forecasts and the potential for volatility, we direct the reader to the 2009 Annual Energy Outlook that is prepared by the Energy Information Administration within the US Department of Energy (EIA 2009c). They forecast world oil prices to rise to $130 per barrel (real 2007 dollars) by 2030 in the reference case; however, there is significant uncertainty in the projection, and, consequently, EIA cautions that 2030 oil price projections could range from $50 to $200 per barrel as reflected in the low and high modeled oil price scenarios. Curiously, the WCI energy projections appear to have been based solely upon the high price case EIA simulation (ICF Consulting 2008); the most favorable circumstance for renewable energy expansion. We submitted inquiry as to why this might be the case but received no response. In summary, we find that both I-937 and WCI inadvertently focus potential for new wood-derived energy towards electricity generation rather than biofuels development. The need to conserve wood biomass resources to maximize public benefit through biofuels production to best addresses the three imperatives of climate change mitigation, energy independence, and sustainability, as discussed in Section II, appears to have not been adequately considered. Apparent consequences could include compromised biofuels development from wood biomass and meager GHG emissions reductions at high cost. In contrast, a carbon tax would effectively incentivize CO2 emissions reductions across all sectors which should serve to prioritize biofuels production as the most effective means to utilize wood for climate change mitigation.
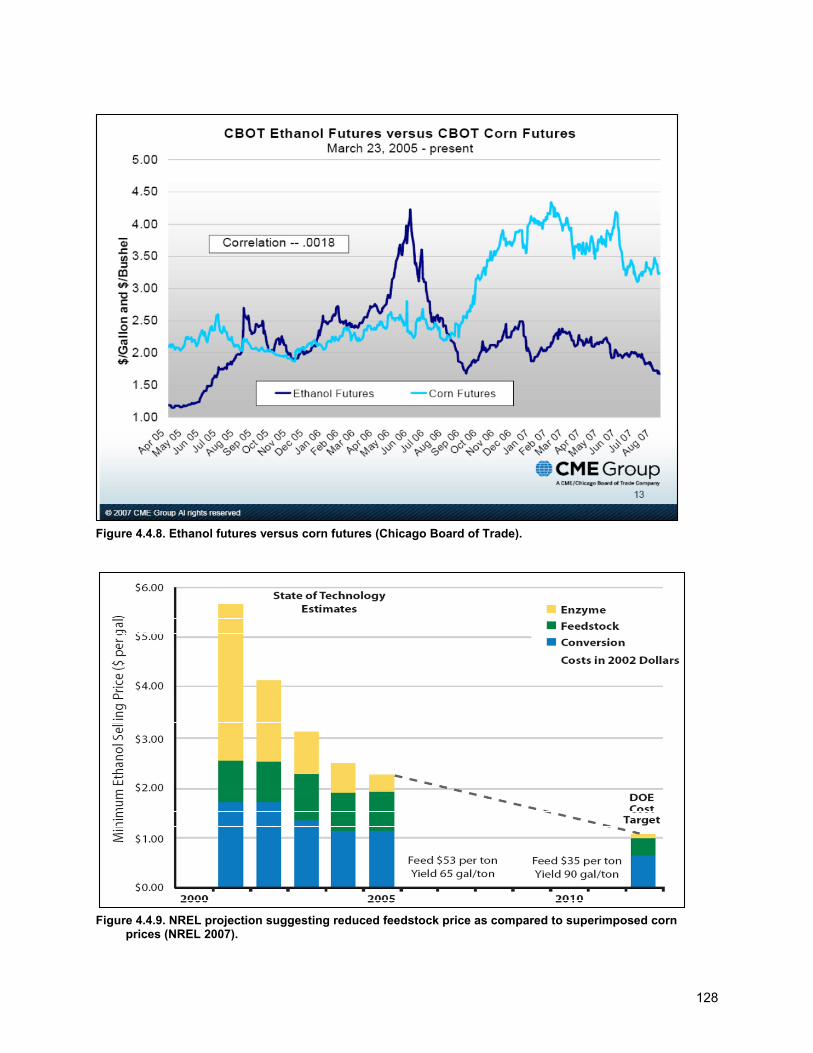
128
Figure 4.4.8. Ethanol futures versus corn futures (Chicago Board of Trade).
Figure 4.4.9. NREL projection suggesting reduced feedstock price as compared to superimposed corn prices (NREL 2007).
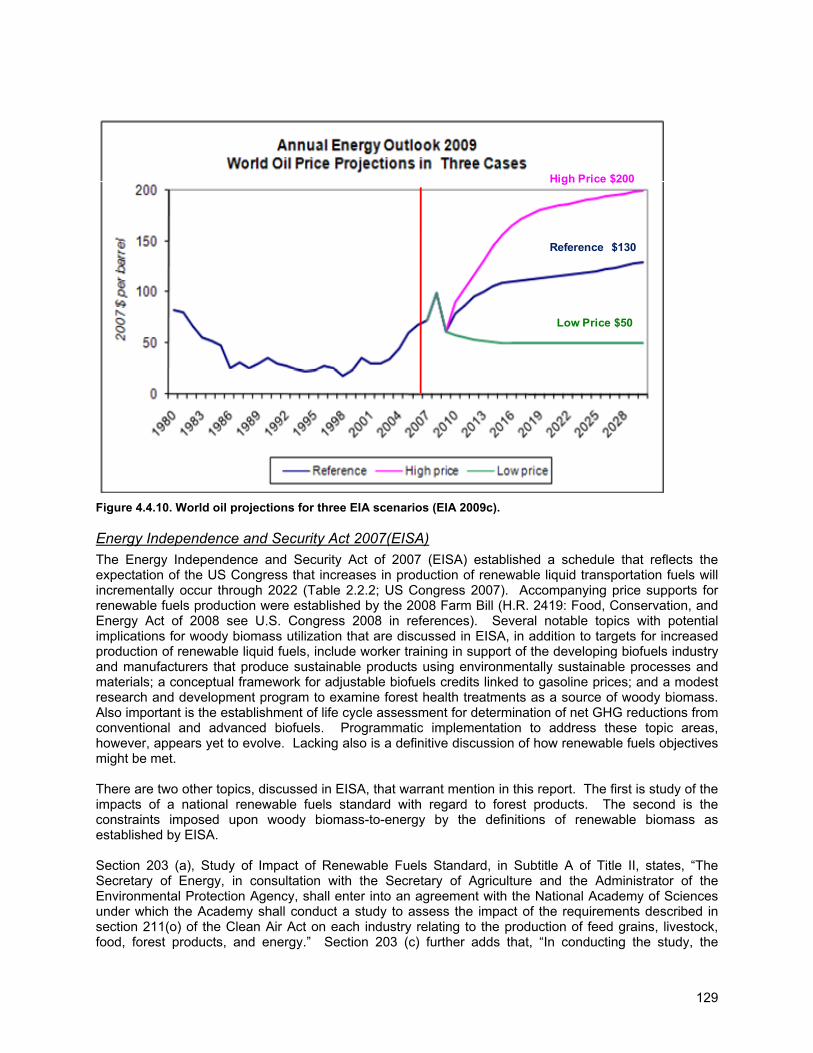
129
Figure 4.4.10. World oil projections for three EIA scenarios (EIA 2009c). Energy Independence and Security Act 2007(EISA) The Energy Independence and Security Act of 2007 (EISA) established a schedule that reflects the expectation of the US Congress that increases in production of renewable liquid transportation fuels will incrementally occur through 2022 (Table 2.2.2; US Congress 2007). Accompanying price supports for renewable fuels production were established by the 2008 Farm Bill (H.R. 2419: Food, Conservation, and Energy Act of 2008 see U.S. Congress 2008 in references). Several notable topics with potential implications for woody biomass utilization that are discussed in EISA, in addition to targets for increased production of renewable liquid fuels, include worker training in support of the developing biofuels industry and manufacturers that produce sustainable products using environmentally sustainable processes and materials; a conceptual framework for adjustable biofuels credits linked to gasoline prices; and a modest research and development program to examine forest health treatments as a source of woody biomass. Also important is the establishment of life cycle assessment for determination of net GHG reductions from conventional and advanced biofuels. Programmatic implementation to address these topic areas, however, appears yet to evolve. Lacking also is a definitive discussion of how renewable fuels objectives might be met. There are two other topics, discussed in EISA, that warrant mention in this report. The first is study of the impacts of a national renewable fuels standard with regard to forest products. The second is the constraints imposed upon woody biomass-to-energy by the definitions of renewable biomass as established by EISA. Section 203 (a), Study of Impact of Renewable Fuels Standard, in Subtitle A of Title II, states, “The Secretary of Energy, in consultation with the Secretary of Agriculture and the Administrator of the Environmental Protection Agency, shall enter into an agreement with the National Academy of Sciences under which the Academy shall conduct a study to assess the impact of the requirements described in section 211(o) of the Clean Air Act on each industry relating to the production of feed grains, livestock, food, forest products, and energy.” Section 203 (c) further adds that, “In conducting the study, the
High Price $200
Low Price $50
Reference $130
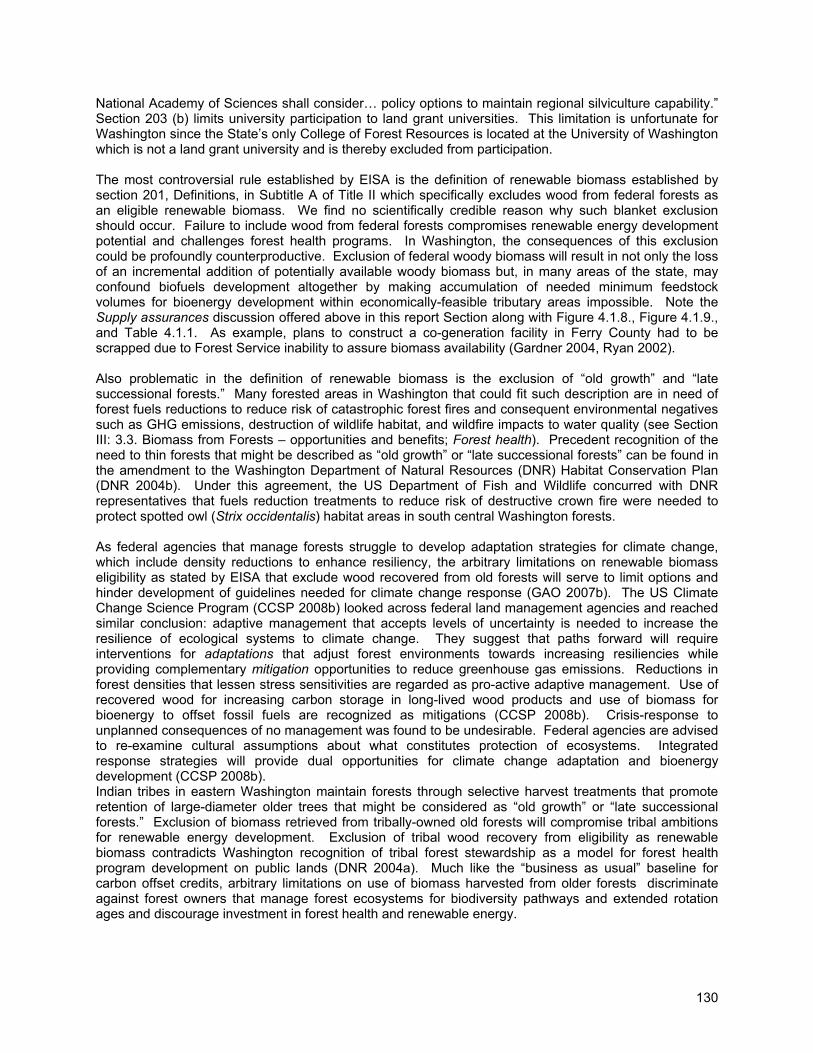
130
National Academy of Sciences shall consider… policy options to maintain regional silviculture capability.” Section 203 (b) limits university participation to land grant universities. This limitation is unfortunate for Washington since the State’s only College of Forest Resources is located at the University of Washington which is not a land grant university and is thereby excluded from participation. The most controversial rule established by EISA is the definition of renewable biomass established by section 201, Definitions, in Subtitle A of Title II which specifically excludes wood from federal forests as an eligible renewable biomass. We find no scientifically credible reason why such blanket exclusion should occur. Failure to include wood from federal forests compromises renewable energy development potential and challenges forest health programs. In Washington, the consequences of this exclusion could be profoundly counterproductive. Exclusion of federal woody biomass will result in not only the loss of an incremental addition of potentially available woody biomass but, in many areas of the state, may confound biofuels development altogether by making accumulation of needed minimum feedstock volumes for bioenergy development within economically-feasible tributary areas impossible. Note the Supply assurances discussion offered above in this report Section along with Figure 4.1.8., Figure 4.1.9., and Table 4.1.1. As example, plans to construct a co-generation facility in Ferry County had to be scrapped due to Forest Service inability to assure biomass availability (Gardner 2004, Ryan 2002). Also problematic in the definition of renewable biomass is the exclusion of “old growth” and “late successional forests.” Many forested areas in Washington that could fit such description are in need of forest fuels reductions to reduce risk of catastrophic forest fires and consequent environmental negatives such as GHG emissions, destruction of wildlife habitat, and wildfire impacts to water quality (see Section III: 3.3. Biomass from Forests – opportunities and benefits; Forest health). Precedent recognition of the need to thin forests that might be described as “old growth” or “late successional forests” can be found in the amendment to the Washington Department of Natural Resources (DNR) Habitat Conservation Plan (DNR 2004b). Under this agreement, the US Department of Fish and Wildlife concurred with DNR representatives that fuels reduction treatments to reduce risk of destructive crown fire were needed to protect spotted owl (Strix occidentalis) habitat areas in south central Washington forests. As federal agencies that manage forests struggle to develop adaptation strategies for climate change, which include density reductions to enhance resiliency, the arbitrary limitations on renewable biomass eligibility as stated by EISA that exclude wood recovered from old forests will serve to limit options and hinder development of guidelines needed for climate change response (GAO 2007b). The US Climate Change Science Program (CCSP 2008b) looked across federal land management agencies and reached similar conclusion: adaptive management that accepts levels of uncertainty is needed to increase the resilience of ecological systems to climate change. They suggest that paths forward will require interventions for adaptations that adjust forest environments towards increasing resiliencies while providing complementary mitigation opportunities to reduce greenhouse gas emissions. Reductions in forest densities that lessen stress sensitivities are regarded as pro-active adaptive management. Use of recovered wood for increasing carbon storage in long-lived wood products and use of biomass for bioenergy to offset fossil fuels are recognized as mitigations (CCSP 2008b). Crisis-response to unplanned consequences of no management was found to be undesirable. Federal agencies are advised to re-examine cultural assumptions about what constitutes protection of ecosystems. Integrated response strategies will provide dual opportunities for climate change adaptation and bioenergy development (CCSP 2008b). Indian tribes in eastern Washington maintain forests through selective harvest treatments that promote retention of large-diameter older trees that might be considered as “old growth” or “late successional forests.” Exclusion of biomass retrieved from tribally-owned old forests will compromise tribal ambitions for renewable energy development. Exclusion of tribal wood recovery from eligibility as renewable biomass contradicts Washington recognition of tribal forest stewardship as a model for forest health program development on public lands (DNR 2004a). Much like the “business as usual” baseline for carbon offset credits, arbitrary limitations on use of biomass harvested from older forests discriminate against forest owners that manage forest ecosystems for biodiversity pathways and extended rotation ages and discourage investment in forest health and renewable energy.
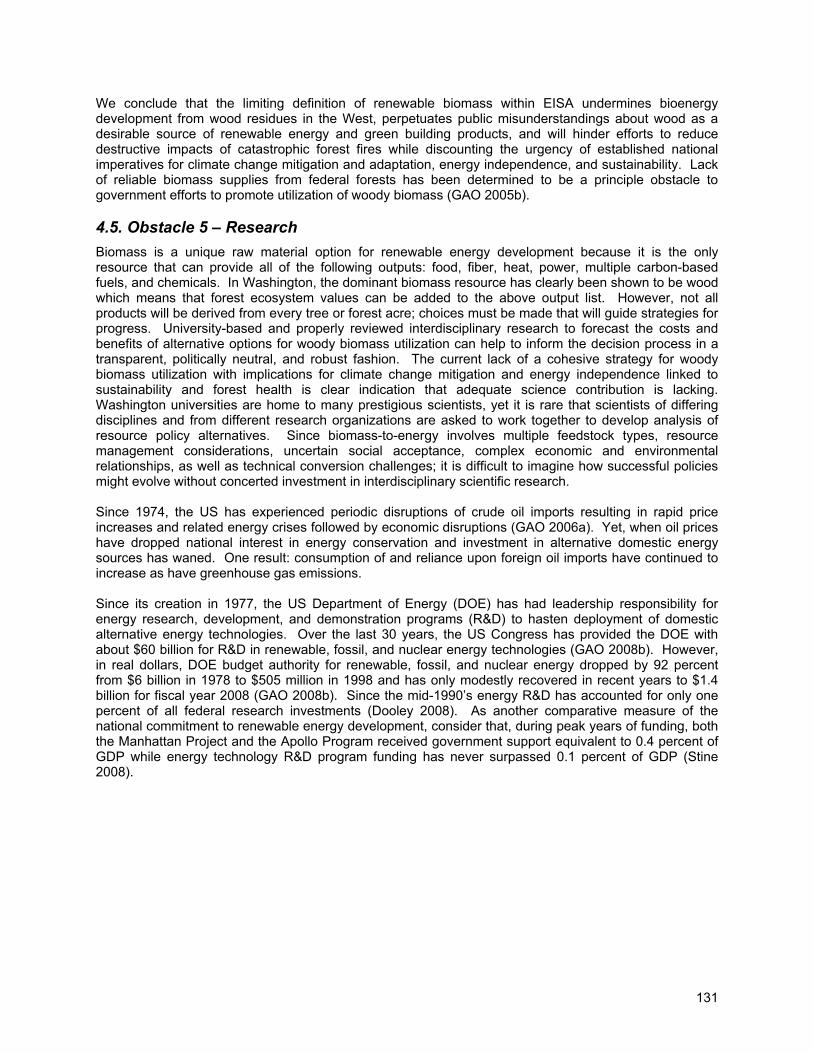
131
We conclude that the limiting definition of renewable biomass within EISA undermines bioenergy development from wood residues in the West, perpetuates public misunderstandings about wood as a desirable source of renewable energy and green building products, and will hinder efforts to reduce destructive impacts of catastrophic forest fires while discounting the urgency of established national imperatives for climate change mitigation and adaptation, energy independence, and sustainability. Lack of reliable biomass supplies from federal forests has been determined to be a principle obstacle to government efforts to promote utilization of woody biomass (GAO 2005b). 4.5. Obstacle 5 – Research Biomass is a unique raw material option for renewable energy development because it is the only resource that can provide all of the following outputs: food, fiber, heat, power, multiple carbon-based fuels, and chemicals. In Washington, the dominant biomass resource has clearly been shown to be wood which means that forest ecosystem values can be added to the above output list. However, not all products will be derived from every tree or forest acre; choices must be made that will guide strategies for progress. University-based and properly reviewed interdisciplinary research to forecast the costs and benefits of alternative options for woody biomass utilization can help to inform the decision process in a transparent, politically neutral, and robust fashion. The current lack of a cohesive strategy for woody biomass utilization with implications for climate change mitigation and energy independence linked to sustainability and forest health is clear indication that adequate science contribution is lacking. Washington universities are home to many prestigious scientists, yet it is rare that scientists of differing disciplines and from different research organizations are asked to work together to develop analysis of resource policy alternatives. Since biomass-to-energy involves multiple feedstock types, resource management considerations, uncertain social acceptance, complex economic and environmental relationships, as well as technical conversion challenges; it is difficult to imagine how successful policies might evolve without concerted investment in interdisciplinary scientific research. Since 1974, the US has experienced periodic disruptions of crude oil imports resulting in rapid price increases and related energy crises followed by economic disruptions (GAO 2006a). Yet, when oil prices have dropped national interest in energy conservation and investment in alternative domestic energy sources has waned. One result: consumption of and reliance upon foreign oil imports have continued to increase as have greenhouse gas emissions. Since its creation in 1977, the US Department of Energy (DOE) has had leadership responsibility for energy research, development, and demonstration programs (R&D) to hasten deployment of domestic alternative energy technologies. Over the last 30 years, the US Congress has provided the DOE with about $60 billion for R&D in renewable, fossil, and nuclear energy technologies (GAO 2008b). However, in real dollars, DOE budget authority for renewable, fossil, and nuclear energy dropped by 92 percent from $6 billion in 1978 to $505 million in 1998 and has only modestly recovered in recent years to $1.4 billion for fiscal year 2008 (GAO 2008b). Since the mid-1990’s energy R&D has accounted for only one percent of all federal research investments (Dooley 2008). As another comparative measure of the national commitment to renewable energy development, consider that, during peak years of funding, both the Manhattan Project and the Apollo Program received government support equivalent to 0.4 percent of GDP while energy technology R&D program funding has never surpassed 0.1 percent of GDP (Stine 2008).
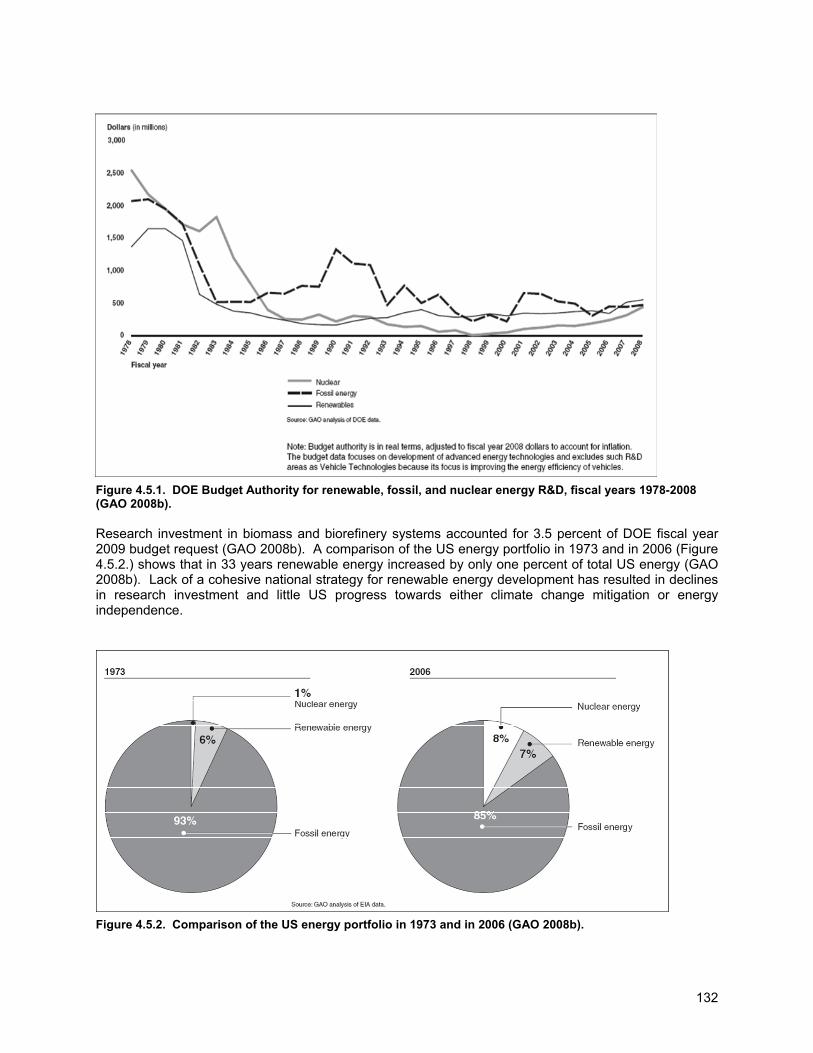
132
Figure 4.5.1. DOE Budget Authority for renewable, fossil, and nuclear energy R&D, fiscal years 1978-2008 (GAO 2008b). Research investment in biomass and biorefinery systems accounted for 3.5 percent of DOE fiscal year 2009 budget request (GAO 2008b). A comparison of the US energy portfolio in 1973 and in 2006 (Figure 4.5.2.) shows that in 33 years renewable energy increased by only one percent of total US energy (GAO 2008b). Lack of a cohesive national strategy for renewable energy development has resulted in declines in research investment and little US progress towards either climate change mitigation or energy independence.
Figure 4.5.2. Comparison of the US energy portfolio in 1973 and in 2006 (GAO 2008b).
133
In Washington, where wood is the primary biomass resource and forests are increasingly at risk from insects, disease and wildfire; insufficient investment, absence of energy priorities, confused policy developments, and public misunderstandings of the benefits of sustainable forest management have compromised progress. Sorely needed is programmatic investment in sustained instate interdisciplinary research to assist policy makers and stakeholders in the development of realistic and effective strategies to address the difficult and complex challenges of climate change, energy independence, and sustainability. Solutions are not likely to evolve from sporadic investment in crisis-driven investigations of short duration and limited resources (Pethokoukis 2009, Stine 2008, Yang and Oppenheimer 2007). Better quality resource data Prior investigations that have estimated the wood biomass resource inventories, such as Frear (2008) and Kerstetter and Lyons (2001) have been discussed and referenced. These studies and others have provided valuable information on the magnitude and general distribution of the resource, but estimates of potentially available wood biomass have been developed from sparse Forest Inventory and Analysis (FIA) data (Forest Service 2004), haven’t differentiated source materials by species, age, ownership, terrain, and other important factors, and have been based upon 30-year-old out-dated conversion ratios. Consequently, estimates of potentially available woody biomass are coarse resolution of insufficient quality to support detailed policy analysis or bioenergy project planning. A useful example of more thorough analysis was recently completed for the Montana Department of Natural Resources and Conservation (Morgan 2009). However, the Montana study is limited in that it also relied upon FIA data (the only currently available nonproprietary multi-ownership forest inventory). An opportunity exists for university scientists to work with the Washington Department of Natural Resources to establish a record-keeping system to track volumes of wood biomass resulting from thinning and harvest activities such that current estimators of the ratio between log volume yields and recoverable residues for different forest types might be calculated, periodically updated, and reported for all timber harvesting activities. The data created from such a program would provide increasingly accurate measurements of available biomass that could support energy project planning. Accurate assessments of forestlands not being treated, such as vast expanses of National Forests, are also needed such that the consequences of forest health declines linked to climate change can be better understood in the context of lost opportunities for climate change mitigation and adaptation as well as biofuels development. Woody biomass collection and transport In-woods collection of forest biomass will be associated with pre-commercial thinning, commercial thinning, regeneration harvests, and forest improvement treatments such as fuel reductions and habitat enhancement projects. Effective retrieval of forest residues will require adjustments to traditional practices such that sufficient biomass is removed for energy as well as retained in the forest for ecological functions. New practices will need development to understand additional costs and customized equipment configurations. In some cases, forest practices may change considerably. For example, where mechanized cut-to-length (CTL) harvesting systems are used, tree limbs are trimmed from stems in the woods and placed on the skid trail to create a “slash mat” that CTL equipment travels over. This practice may make biomass unusable because of contamination from dirt and rocks (Morgan 2009). Densification options have been discussed to reduce transportation costs. In forest areas where densification may be desirable, harvest unit, landing sites, and road configurations will require adjustment from traditional standards. Forest engineering and economics research will be needed to investigate the costs, logistics, and environmental impacts of new biomass recovery options. Conversion technology advancement The technologies for wood heating and combined heat and power systems are mature and implementable, however, while conversion technologies for wood-to-liquid fuels, such as ethanol, are technically feasible, no commercial-scale operations are yet deployed. An important finding of this investigation has been that biomass resources are finite and when renewable energy alternatives from potentially available resources are compared in the context of the three imperatives (climate change mitigation, energy independence, and sustainability) liquid fuels conversions emerge as the over-arching priority. Continued research investment to develop superior conversion technologies for liquid fuel production from Washington forest biomass resources will help to identify advancements that provide
134
maximum energy yields at least costs. It will be imperative that the biomass resource is used prudently to maximize energy yields. Investment in a pilot project towards development of a commercial integrated biorefinery is highly recommended as an important next step towards achievement of the many energy conversion efficiency and economic benefits that have been discussed throughout this report. Operational experience with this pilot unit can be used to attract companies looking to develop commercial biorefineries and to investigate promising approaches to commercialization such co-location with a pulp and paper mill. We expect that significant gains in energy yields from currently dedicated resources can be achieved with investment in new energy conversion technologies. Since liquid fuels conversions will require large scale facilities, mixed feedstocks from forests, fields, and cities may be needed to ensure that adequate biomass volumes can be sustained. Additional biomass may become available from dedicated energy crops once biorefineries become established. Research towards further development of mixed biomass applications for liquid fuels conversions customized for effective exploitation of locally available resources is essential. For example, at sites close to urban areas, mixtures of forest derived materials and recovered wood and paper from municipal solid may be attractive while in rural areas of eastern Washington mixed feedstocks comprised of forest and agricultural residues may make the most sense. Where inexpensive rail and water freight are available, biomass tributary areas can be expanded to facilitate transport of diverse feedstocks to assure access to adequate volumes of biomass. An ancillary benefit may also be increased and diversified raw material availability for pulp and paper production as research at the University of Washington into the potential use of grasses and other vegetative material for paper products shows promise. The strategic economic benefits of captured process residues as an inexpensive anchor feedstock with potential for bioenergy recovery augmented by addition of more expensive recovered field residuals have been discussed in previous sections of this report. The economics of renewable energy Past research analyses have attempted to characterize the economic challenge to renewable energy development in terms of technological improvements that reduce production costs such that renewables compete favorably with fossil fuels in retail markets. We find this premise to be too simplistic. Fossil fuels are found wealth that are uniquely energy-rich and inexpensive to bring to market. As more renewables are produced, the cost of renewable feedstocks will rise with increased demand while the price of fossil fuel alternatives will drop as market share contracts. Such market dynamics have been discussed in some detail in various sections of this report. The question then, if a shift to renewable energy is to succeed, becomes what governmental interventions will be most effective to support enduring economic viability of investments in renewable energy? The primary government responsibility is to assure that the dual objectives of reduced green house gas emissions and energy independence can be translated into monetary terms and reflected in the price paid for all energy and fuels. The mechanisms for setting and implementing these necessary monetary valuations is beyond the scope of this report but it is clear that the renewable energy industry will never be significant without them (Sandia and General Motors 2009, GAO 2007a). Research in this regard is needed to establish a public value differential between fossil fuels and renewable energy alternatives in order to inform policy development to achieve the value objectives described above. Arbitrary incentives and subsidies of various magnitudes subject to political impermanence have been used unsuccessfully in the past. This haphazard approach has led to significant energy price volatility which is destructive to the developing of a new renewable energy industry (Sandia and General Motors 2009, GAO 2007a). The magnitude of investments for biorefineries requires that investors have confidence in the long-term viability of a project and not be at the mercy of changing government policies and wild swings in resource costs or product values. We have suggested in the cap and trade discussion presented above that a variable carbon tax linked to fluctuating international fossil fuel markets appears to have the greatest potential as a means to achieve renewable energy market stability. However, the magnitude of such tax and the regulatory mechanism for implementation are unclear. Investment in development of full accounting for costs and benefits of energy alternatives linked to life cycle assessments in the context of the three identified imperatives is needed. Identification of cost/benefit relationships must be coordinated with energy market research to inform development of appropriate and flexible policy actions in support of desired results. Incomplete approaches such as I-937 and WCI, that minimize important aspects of market dynamics and the need for creative support of
135
integrated resource and energy industries are costly and will produce unintended consequences with lasting compromise to climate change mitigation, energy independence, and sustainability objectives. An informative study supported by state of Minnesota and recently completed by Hill et al. (2009) developed life-cycle climate change and health costs comparisons for a variety of biofuels and gasoline. They concluded that the climate change and health costs of corn ethanol and gasoline were approximately the same while cellulosic ethanol costs were much lower. Unfortunately, the cellulosic conversions examined were limited to corn stover and various grass feedstocks. We hypothesize that similar calculations conducted with forest residues as the biomass feedstock should reveal further reduction in environmental costs as forests require very little use of fossil inputs associated with cultivation of annual crops and that significant avoided emissions result when wildfire hazard is reduced through removal from forests of surplus biomass fuel loads. An extension of Hill et al. methodologies to examine the net life-cycle climate change and health costs of woody biomass conversions to cellulosic ethanol and other biofuels would be especially important for western states like Washington where wood is the dominant biofuel potential. Social science and education Long-standing societal discomforts over presumed ecological impacts to forests thought to result from commercial harvest operations remain unresolved. Concern over forest management has historically been tied to an assumption that no action is the most environmentally beneficial alternative. However, wood needed for energy as well as green building products will only be obtained through active management of forest resources. Active management of forests to reduce unprecedented stem densities is also needed to avoid forest health declines and significant pulse releases of GHG emissions from forest fires. Misconceptions about the origins of pre-European settlement forest conditions that discount thousands of years of profound Native American influences on the landscape are counter-productive, ecologically inaccurate, and have prejudicial origins (Mann 2005). Unless steps are taken to share more enlightened information with concerned publics and to provide assurances that sustainably managed forests will be protected from ecological damage, proposals for biomass removals will not gain needed public support. Without social license to actively manage forests, renewable energy objectives can not be realized. As a first step, an integration rather than separation of indigenous ecological knowledge with western science is needed to inform ecosystem management. The holistic management approach of Indian forest programs is in contrast to the fragmented policies of recent decades that have resulted in the coincident declines of National Forests, rural economies, and forest industries in the west. Interdisciplinary and cross-cultural research and educational outreach to better integrate historical context and indigenous wisdom with science-based adaptations for forest health recovery and resources utilization is needed. However, no resource stewardship approach can ever achieve a static panacea. Adaptive management informed by hazard analysis and explicit discussion of the costs of public choices must be pursued. Environmental performance methodologies such as life cycle assessments and net energy balances are being developed to inform comparisons of energy alternatives. Use of such methodologies for development of state renewable priorities will help interested publics to better understand the importance of woody biomass to state energy potential and climate change mitigation. Robust life cycle assessments of Washington energy alternatives should be developed by university researchers with peer-reviewed findings acknowledged by state agencies and communicated to interested members of the public. Until the multiple benefits of wood biomass utilization are made more broadly known, reflected in public opinion, and prioritized for strategic importance; the needed social license for forest management and biomass removals will remain elusive. Two fundamental understandings must accompany plans for implementation: 1) lessening reliance upon energy-rich fossil fuels will neither be inexpensive or easy and 2) non-fossil energy resources are intrinsically valuable and finite so must be used optimally to maximize environmental benefits. Managing forests for multiple values will require complex integration of ecological, social, and economic costs and benefits informed by ongoing interdisciplinary scientific research. Haphazard energy policies driven by political negotiations between competing special interests in the absence of scientific oversight are unlikely to generate productive results.
136
The increasing incidence and magnitude of devastating wildfires and insect infestations threaten the sustainability of east-side forest ecosystems. On the west-side, forestland conversions for residential and commercial uses result in urban sprawl and loss of forest ecosystems. Therefore, the most basic of assurances that must be provided is that the State is committed to protection of a sustainable forestland base. Notable efforts are currently underway. The WA DNR, at the direction of the Legislature and in consultation with scientists at the University of Washington, is implementing a forest health strategy for eastern Washington. At some time in the future, fuel load reductions to restore forest health may result in significant volumes of woody biomass being made available for energy generation. On the west-side, the Northwest Environmental Forum at the College of Forest Resources, University of Washington, has been successful at focusing the attention of the State’s forestry and environmental leaders on the issue of forestland conversions. A series of workshops, “Saving Washington’s Working Forests”, has provided a forum of common ground for family forest owners, environmental groups, industrial forestry representatives, tribal leaders, agency representatives, and policy makers. Research findings from university investigations when integrated into forest management and public outreach represent the beginning of a positive paradigm shift relative to the social license needed to practice forestry. Close communication and collaboration between scholarly researchers and State agencies is critical to successful public resource education and energy policy development. However, the linkages between forest conservation and renewable energy development remain in early stages of discussion. Two areas of ecological concern that need further investigation relative to biomass removals are potential impacts to soil productivity and habitat qualities. Research to specifically address these questions within a regulatory and stewardship context would help provide assurances to Washington citizens that acceptable standards for biomass removals for energy can be developed that result in benign impacts to soil and habitats while effecting forest health enhancements. As recommended above in Section III: 3.3 Biomass from forests – opportunities and benefits; Slash recovery and Section IV: 4.1 Obstacle 1 – access to the resource; Guidelines for slash removals, scientific review should inform the development of forest practice rules to provide regulatory guidance for collection of forest harvest residuals. A cohesive agenda for research and educational outreach is needed A comprehensive and transparent effort to provide the public with the information and assurances needed to establish “social license” is advisable if state renewable energy targets are to be achieved. The public must be legitimately convinced that woody biomass produced from Washington State forests is an environmentally sound and safe source of renewable energy. It is also important that the consequences of failing to act are better understood. An example of the scope and scale of such an effort can be found in the state of Massachusetts. The Massachusetts Sustainable Forest Bio-energy Initiative supports a broad program of information gathering and dissemination. Similar programmatic approaches have been undertaken in other states such as Oregon and California. An active program of information gathering, regulation, long-term monitoring and public outreach increases the probability of gaining public confidence and support for utilization of woody biomass for energy production in Washington State. State research universities should be encouraged to work together to develop information and recommendations for energy applications that are most likely to achieve state energy objectives. State energy planners need to recruit assistance from university scientists towards development of explicit priorities for investments in expansion of renewable energy capacity. Energy priorities will necessarily include greater recognition of the significant role that wood biomass must play in Washington’s future if alternative energy development and pollution reduction objectives are to be met. The costs of inaction must be properly assessed. An integrated plan that links the benefits of renewable domestic energy, climate change mitigation, and forest health restoration to sustainable forest management is needed to answer public concerns and build consensus for “social license.” State funding for university research should demonstrate real commitment to informed change and, as evidenced by successes in other states, can provide high leverage to attract additional federal and private investment.
137
Section V: Discussion and Conclusions This analysis began as an investigation of barriers to woody biomass utilization for energy in Washington but expanded quickly to become more comprehensive as our analysis revealed that perhaps a significant barrier is a lack of integrated understanding of complex issues that need serious consideration if progress is to be achieved. Issues include technical, economic, environmental, social, and moral questions that require continued scholarly research but ultimately can only be resolved by an informed political process. The choices ahead are difficult, expensive and long-lasting with implications for future generations and forest ecosystems in Washington and around the world. While obstacles appear formidable and numerous, we hypothesize that none are insurmountable if Washington citizens choose to focus sufficient resolve. The conversion of solar radiation into chemical energy via photosynthesis results in the growth of vegetative biomass made up of organic compounds which have intrinsic energy content. Biomass is effectively stored solar energy. Most of the world’s biomass is found in forests. Forests play a specific and important role in global carbon cycling by absorbing carbon dioxide during photosynthesis, storing carbon above and below ground, and producing oxygen as a by-product of photosynthesis. In the presence of increased greenhouse gases in the atmosphere, healthy forests help to mitigate the effects of climate change on the environment by removing carbon dioxide (CO2) from the atmosphere. Forests in the United States absorb and store about 171 million metric tons of carbon each year, an amount equivalent to 11 percent of the country’s CO2 emissions. The highest sustained carbon accumulation rates for American forests are reported to occur with new forest growth on high productivity sites in the western Pacific Northwest. Sustainably-managed forests that are periodically harvested, planted, and re-grown to produce a continuing series of short- and long-lived products and energy feedstocks, sequester and offset more cumulative carbon than forests that are left unharvested. When forest health declines or when forest fires occur, releases of stored forest carbon transform forests so that they become a carbon source rather than a sink. Wood residues from forests can be referred to as woody biomass or as lignocellulosic or cellulosic energy feedstocks. All wood fiber that does not have higher value product potential for non-energy applications can be considered as woody biomass. Woody biomass can include forest residues such as tops, limbs, foliage, bark, rotten logs, and stumps (otherwise commonly known as logging slash) that historically have been left on site or burned following timber harvest. Woody biomass may also include such materials as may be salvaged from pre-commercial thinning activities, designed to reduce stocking densities in young forests such that remaining tree growth is optimized. Forest fuels reductions (generally in fire-prone dry forests) can produce woody biomass as small diameter understory stems and ladder fuels are removed to create conditions such that, when an ignition occurs, a comparatively benign ground fire is the result rather than a destructive crown fire. Woody biomass also refers to primary and secondary wood product manufacturing residuals including bark, saw dust, planer shavings, and ground wood pieces known as hog fuel. Wood chips that are manufactured from round logs not suitable for lumber manufacture or sawmill slabs and pieces may also be used for energy feedstocks but are generally considered to have higher value for paper manufacture. A by-product of pulp and paper manufacture is black liquor; which is another wood process residual that is used for energy. Dedicated tree plantation crops such as fast-growing poplar and willow may also be used for energy generation. The yield from such crops is considered woody biomass although the cultivation practices more closely resemble those of agriculture. There are many contemporary wood-to-energy conversion alternatives that can be and are employed to produce heat and electricity as well as solid, liquid, or gaseous fuels. Energy conversions can be as simple as combustion for heat or as sophisticated as biochemical and thermochemical processes to produce transportation fuels such as ethanol. We find that, while conversion technologies are improving through continued research, many wood-to-energy applications have been used for decades, are technically feasible, and could be immediately implemented; albeit at costs that are not readily competitive with fossil fuel alternatives given current energy market dynamics.
138
Examination of energy markets reveals that significant environmental and economic costs resulting from fossil fuel combustion and reliance upon imported oil have not been incorporated into consumer prices. For example, societal costs of climate change and health impacts from gasoline combustion have been estimated at more than $1.00 per gallon while reliance upon imported oil from politically volatile areas of the world has been shown to reduce US gross domestic product by upwards of one percent. These real public costs add up to hundreds of billions of dollars annually but are not included in the consumer price of fossil energy. There are also substantial public costs associated with failure to manage forests to reduce overstocked densities. Especially compelling are the considerable potentially avoided environmental and economic costs of catastrophic wildfires. US wildfire suppression costs alone are in the billions of dollars annually and the Climate Impacts Group at the University of Washington forecasts that, without action, global warming will increase incidence and intensities of forest fires in the inland west. Wood biomass is the dominant State non-hydro source of renewable energy; representing fully two-thirds of Washington’s potentially available biomass inventory. Unlike agriculture, forests don’t require large amounts of polluting fertilizers, volumes of water for irrigation, or transformations of ecosystems to non-native vegetation. The Washington forest industry represents the largest biomass collection infrastructure in the state. Given Washington commitments to renewable energy development and greenhouse gas emissions reductions, utilization of wood wastes for energy should be a high priority. However, if progress is to occur then the economics and other benefits of wood biomass for energy must be better understood. Given that fossil fuels are energy-rich and inexpensive, policy supports for renewable energy alternatives, based upon explicit cost/benefit analyses, will be needed. It should be recognized that the existing forest industry infrastructure is a significant contributor of renewable energy and that, with policy support for investment, could increase energy outputs from the existing captured resources such as hog fuel and black liquor. Manufacturing wastes are a byproduct of higher value solid wood and paper manufacture and are the lowest cost source of biomass. The pulp and paper industry has potential for biorefinery development to efficiently produce a mixture of products outputs that could be expanded to include heat, electricity, and liquid fuels, such as ethanol, at lower cost than new stand-alone energy plants. Low cost hog fuel, when mixed with higher cost forest residues, can result in a raw material cost index to support broad utilization of wood biomass resources. We identify three imperatives for guiding progress that have been well-documented in the literature, but have not been adequately integrated into policy. Energy policies should seek to maximize integrated achievement of three important goals: climate change mitigation, energy independence, and sustainability. When viewed from this perspective, it is readily apparent that the state energy priority should be liquid transportation fuels and that, for Washington; wood is the primary raw material available for biofuels conversions. Combustion of fossil fuels for transportation accounts for fully one-half of the annual greenhouse emissions in Washington; more than twice that released from any other source. Other than minor in-state production of biodiesel, all transportation fuels consumed in Washington are imported from other states or abroad whereas Washington, with abundant hydro-power, generates the cleanest electricity in the nation and is a net electricity exporter. Wind power installations are adding new clean electricity capacity but can not provide for liquid fuel needs. The decline in Alaska oil production, on which Washington is dependent, should further focus State attention towards securing new liquid fuel resources. Washington’s potentially available wood biomass resource has been estimated to be more than 11 million bone dry tons per year. For relative perspective on the magnitude of this resource, we offer the following theoretical conversions. Total potential ethanol produced from all Washington wood biomass resources could be 900 million gallons per year; enough to replace one-third of 2008 gasoline consumption. WSU colleagues have estimated that the potential electricity from Washington’s wood biomass would be equal to 11.5 million MWh or about 13 percent of total Washington electricity use. We find, however, that a lack of strategic energy priorities in Washington, compounded by political disagreements, has resulted in a peculiar assortment of counterproductive policies (discussed below) that inadvertently reward underutilization of energy resources by focusing on small-scale, capital-intensive,
139
and inefficient conversion projects to produce low-priority electricity. Further, although State policy makers have clearly identified greenhouse gas emissions reductions and renewable energy development as very important public objectives, policies appear to have overlooked the need to integrate resource stewardship and energy generation towards best fit with existing industrial infrastructure. While obstacles appear formidable and numerous, we hypothesize that none are insurmountable if Washington citizens choose to focus enlightened resolve. We refer the reader to the history of ethanol development in Brazil as example. On the other hand, the challenges to substantive reductions in fossil fuel consumption must not be discounted. Fossil fuels are energy-rich, are supported by a vast infrastructure, and, without consideration of factors such as greenhouse gas emissions and energy independence, appear as least-cost energy options for consumers. Important to any discussion of renewable energy substitution for fossil fuels is a recognition that progress will occur at the margin. Review of domestic and international analyses indicates that total energy independence from fossil fuels is not potentially achievable within any foreseeable planning window. This does not imply, however, that incremental improvements can not be important or should not be pursued. Development of all potential domestic renewable resources, with careful planning towards an integrated energy portfolio, will ensure optimized levels of success. Evolving public perceptions regarding forests, biomass exploitation, and non-market amenities will play a major role in how much of the wood resource base may be used for energy. The public must be credibly assured that woody biomass produced from Washington State forests is an environmentally sound and safe source of renewable energy. However, given the mounting problems of global warming and forest health declines, concerned stakeholders must be challenged to revisit out-dated notions that forests unmanaged are protected. It will be important that the consequences of failing to act be fully appreciated. As demonstrated in many of the discussions presented throughout this report, failure to mitigate climate change, reduce fossil fuel pollution, increase energy independence, and implement practices to ensure forest sustainability is already resulting in significant environmental, social, and economic costs. Numerous international, national, and state political leaders have characterized the need for effective response to current climate and energy challenges as the paramount concerns of the twenty-first century. The Intergovernmental Panel on Climate Change (IPCC) is a globally-convened body of hundreds of scientists that are generally recognized as the pre-eminent international authority on climate change. IPCC investigation into potential climate change mitigation options resulted in the following conclusion. “In the long term, a sustainable forest management strategy aimed at maintaining or increasing forest carbon stocks, while producing an annual sustained yield of timber, fiber, or energy from the forest, will generate the largest sustained mitigation benefit.” (IPCC. 2007. Climate Change 2007: Mitigation. Contribution of Working Group III to the Fourth Assessment Report of the IPCC.). The four most important findings that emerge from this study: 1) Energy policy must be examined in the context of three over-arching imperatives that compel
immediate attention: Climate Change Mitigation, Energy Independence, and Sustainability. 2) Wood is second only to water as a source of renewable energy for Washington, and, conversions to
liquid transportation fuels emerge as the highest priority for maximizing integrated achievement of the imperative objectives.
3) Liquid fuels conversions from wood biomass will require large biorefinery capacity designed to utilize dispersed biomass resources for maximized bioenergy outputs. Co-location with State pulp and paper mills represents the greatest opportunity for success.
4) While a paradigm shift from fossil fuels to renewable energy will be difficult and expensive, the environmental and economic costs of inaction outweigh needed investment for change.
140
Section VI: Recommendations Key recommendations from the Wood to Energy in Washington study are presented below with reference to pertinent sections of this report: Climate change • Discussion: Significant research contributions regarding climate change are being achieved by the
Climate Impacts Group at the University of Washington. However, alarming findings, in the absence of suggested strategies for mitigation and adaptation, can serve to confuse policy discussions resulting in uninformed and counterproductive political responses as discussed in Section IV: 4.4. Obstacle 4 – Policy and regulations. The Climate Leadership Initiative, in a study conducted for the Washington Department of Ecology, estimated that by 2020 the cumulative costs of climate change in Washington will be equal to $3.8 billion per year, about 1.2 percent of total State 2007 GDP. Part of this cost is attributed to increases in incidence and intensity of wildfires. As mentioned above, such public cost liabilities are not currently incorporated into commercial energy markets. See Section II: 2.1. Greenhouse Gases and Climate Change; In Washington State and The costs of inaction and Section III: 3.3. Biomass from forests – opportunities and benefits; Forest health.
• Recommendation: Policy mechanisms to include non-market values and avoided costs in energy accounting are needed.
Energy independence • Discussion: The value of energy independence appears to be significant but under-appreciated in
policy frameworks. US expenditures on oil imports were $330 billion in 2007 and accounted for 40 percent of the national trade deficit. In 2005, Alan Greenspan estimated that oil imports reduced US GDP by $100 billion. Washington citizens spent $9 billion on fuel imports in 2006. When policy makers combine strategies for energy independence with climate change mitigation, the economic benefits of energy independence should serve to underwrite the costs of biofuels development and greenhouse gas emissions reductions. See Section II: 2.2. Energy independence; Price is not cost.
• Recommendation: An assessment of costs and benefits that could derive from reduced reliance upon imported fossil fuels in Washington resulting from development of wood biomass for ethanol should be conducted.
Forest health • Discussion: Deforestation refers to a loss of forestland to another land-use. For example,
deforestation could result from clearing forests for agriculture or could occur as a result of fires or floods. Most global deforestation occurs in developing countries with tropical forests; however, deforestation is occurring in Washington with net losses of forestlands to wildfires, insects and disease and from land-use conversion for development. When deforestation occurs the loss is two-fold. The carbon that has been stored (sequestered) in the forest is released and the opportunity for future sequestration of atmospheric carbon is also lost. Increases in forest mortality and wildfire frequency and intensity have reached crisis levels. Reports from climate scientists indicate that, as the planet warms, the destructive impacts of forest health declines will escalate resulting in releases of stored forest carbon transforming forests so that they become a carbon source rather than a sink. In 2006, 33 million metric tons of CO2 were released into the atmosphere by wildfires in Washington accounting for 42 percent of the state annual total CO2 releases; close to three times the emissions released by electric power generators. We suggest that forest biomass removals that address climate change mitigation and energy independence through production of biofuels warrant public investment to avoid much larger long-term costs. Critical to the dual goals of forest health and biomass energy development will be a change towards proactive stewardship on National Forests. See Section III: 3.3. Biomass from forests – opportunities and benefits; Forest health and Section IV: 4.1. Obstacle 1- Access to the resource; Supply assurance and Section IV: 4.2. Obstacle 2 – Public perception; What is deforestation?
141
• Recommendation: Washington needs a plan to integrate biomass removals for forest health with climate change mitigation and energy development. Policy makers should urge revision of current restrictions that exclude biomass from National Forests for renewable energy conversions.
Wood biomass resources • Discussion: All types of wood-derived biomass resources including black liquor, and recoverable
wood and paper from municipal solid waste should be recognized as renewable energy resources. Ambiguous terminologies such as “old growth” are unnecessary, redundant, and counterproductive when used to limit potentially available wood biomass. There are abundant limitations in salute that restrict removals of forest biomass from reserved forests. Forests that aren’t reserved and may have potential for sustainable biomass removals should be managed to do so. Maximizing the procurable wood resource for energy within identified tributary areas is of paramount importance to supply assurance, energy investment, and biofuels production. As this investigation has shown, woody biomass contribution from all forest ownerships will be required in most regions of the state if sufficient resources are to be made available for the large-scale conversion facilities needed to efficiently produce biofuels. See Section I: 1.3. Biomass and energy – Terminology and Section IV: 4.1. Obstacle 1 – access to the resource; Supply assurance and Section IV: 4.2. Obstacle 2 – public perception; Social license and Forests; neither factory nor wilderness and How we think about forests and Section IV: 4.4. Obstacle 4 – Policy and regulations; I-937 – Washington’s defacto energy priority and Energy Independence and Security Act of 2007 (EISA).
• Recommendation: Arbitrary constraints that limit biomass availability for renewable energy, such as appear in I-937, should be revised. If a cohesive strategy for biomass supply assurance and utilization is not developed quickly, Washington resources may be exported into other markets, like Oregon, where biofuels development is further advanced.
Guidelines for slash removals • Discussion: Existing state forest practice rules did not anticipate increased interest in removals of
harvest residues. Limiting factors for consideration include soil productivity, water quality, biodiversity, wildlife habitats, cultural values, forest health, and forest sustainability. In anticipation of an increased demand for woody biomass, a number of states are developing guidelines for removals of harvest residues. See Section III: 3.3. Biomass from forests – opportunities and benefits; Slash recovery and Section IV: 4.1. Obstacle 1 – access to the resource; Guidelines for slash removals.
• Recommendation: As evidenced by successes in other states, forest biomass collection guidelines should be developed and incorporated into Washington forest practice rules.
Integrated infrastructure and product hierarchies • Discussion: The value of existing forest industry investment in renewable energy production and
the cost-effective utilization of the wood resource must not be underestimated. Higher use wood products such as solid building materials underwrite the costs of biomass collection and provide environmentally preferable product alternatives to steel and concrete. The present policy paradigm (I-937) inadvertently prioritizes development of small-scale inefficient distributed wood power generators will waste the resource, create undesirable competition for the least-expensive process residuals, effectively undermine recovery of more costly forest residues, and ultimately jeopardize the industrial infrastructure and employment base upon which significant development of biofuels must depend. See Section III: 3.2. Woody biomass – material and process opportunities and Section IV: 4.1. Obstacle 1 – access to the resource and Section IV: 4.4. Obstacle 4 – Policy and regulations; I-937 – Washington’s defacto energy priority.
• Recommendation: Biomass energy priorities should favor liquid fuels conversions at integrated biorefineries that can optimize energy yields through recovery of heat, electricity, and chemical byproducts. As possible, biorefineries will be best sited with pulp and paper mills. State investment in support of biorefinery development would be the most effective
142
biomass-to-energy approach for response to the three imperatives of climate change mitigation, energy independence, and sustainability.
Conversion technology advancement • Discussion: The technologies for wood heating and combined heat and power systems are mature
and implementable, however, while conversion technologies for wood-to-liquid fuels, such as ethanol, are technically feasible, no commercial-scale operations are yet deployed. An important finding of this investigation has been that biomass resources are finite and, when renewable energy alternatives from potentially available resources are compared in the context of the three imperatives (climate change mitigation, energy independence, and sustainability), liquid fuels conversions emerge as the over-arching priority. It will be imperative that the biomass resource is used prudently to maximize energy yields. Since liquid fuels conversions will require large scale facilities, mixed feedstocks from forests, fields, and cities may be needed to ensure that adequate biomass volumes can be sustained. Additional biomass may become available from dedicated energy crops once biorefineries become established. Conversion strategies will need customization to accommodate local resource availability. For example, at sites close to urban areas, mixtures of forest-derived materials and recovered wood and paper from municipal solid waste may be attractive while in rural areas of eastern Washington mixed feedstocks comprised of forest and agricultural residues may make the most sense. Where inexpensive rail and water freight are available, biomass tributary areas can be expanded to facilitate transport of diverse feedstocks to assure access to adequate volumes of biomass. An ancillary benefit may also be increased and diversified raw material availability for pulp and paper production as research at the University of Washington into the potential use of grasses and other vegetative material for paper products shows promise. The strategic economic benefits of captured process residues as an inexpensive anchor feedstock with potential for bioenergy recovery augmented by addition of more expensive recovered field residuals are discussed in this report and will be important factors for consideration of conversion technology development options. See Section I: 1.4. Wood-to-energy – conversion options and Section III: 3.2. Woody Biomass – material and process opportunities and Section IV: 4.1. Obstacle 1 – access to the resource; Raw materials.
• Recommendation: Continued research investment to develop superior conversion technologies for liquid fuel production from Washington biomass resources will help to identify advancements that provide maximum energy yields at least costs. Investment in a pilot project towards development of a commercial integrated biorefinery is highly recommended as an important next step. Research towards further development of mixed biomass applications for liquid fuels conversions customized for effective exploitation of locally available resources will be essential to assure sufficient raw material availability and maximized energy yields.
Social license • Discussion: As demonstrated by our review of the scientific literature, failure to mitigate climate
change, reduce fossil fuel pollution, increase energy independence, and implement practices to ensure forest sustainability will result in significant environmental, social, and economic costs. The public must be credibly assured that woody biomass produced from Washington State forests is an environmentally sound and safe source of renewable energy. Educational outreach and consensus building activities such as those undertaken by the University of Washington through the Northwest Environmental Forum and the Olympic Natural Resource Center have been successful at building stakeholder consensus in support of sustainable forestry and wood biomass to energy. Communication alliances also provide fertile opportunity for cooperative interaction between stakeholders, scientists, and State agency personel. See Section IV: 4.2. Obstacle 2 – public perception and Section IV: 4.5. Obstacle 5 – Research; Science and education.
• Recommendation: These and other programs that facilitate public education and dialogue towards consensus solutions to contemporary resource and energy challenges are worthy of State support.
143
Green jobs • Discussion: There is a growing shortage of skilled forestry professionals in Washington.
Workforce challenges are an obstacle to wood-for-energy development but remarkably, forestry is excluded from the State “green jobs” program. Management of forest ecosystems with resultant production of “green” building products and renewable energy feedstocks represents the single greatest State opportunity to reduce both GHG emissions and imported fossil fuel reliance. See Section IV: 4.1. Obstacle 1 – access to the resource; The foresters, the loggers, and the truckers and Section IV: 4.4 Obstacle 4 – Policy and regulations; Green jobs.
• Recommendation: We recommend that State leaders acknowledge forest biomass-to-energy as a cornerstone element of a clean future economy. State agencies should work with universities and community colleges to establish training programs for forestry workers that cover the spectrum from collection through conversion.
Green building products • Discussion: State programs for green building have potential for beneficial change but only if
rigorous assessment methodologies for product comparisons such as life cycle assessment (LCA) and net energy balance (NEB) are used to develop uniform performance standards. Current programs rely upon arbitrary product standards that are not scientifically supported. Unintended consequences include under-appreciation of the environmental benefits of locally-grown renewable wood building products as compared to alternative construction materials like steel or concrete. Failure to value wood as a green building product undermines both the green building program and the viability of the Washington wood industry and while jeopardizing the product value hierarchy needed to support utilization of woody biomass for bioenergy. See Section III: 3.4 Forests, products, energy, and carbon; Life cycle assessment and Section IV: 4.4 Obstacle 4 – Policy and regulations; Green building standards.
• Recommendation: Green building standards should be revised to include product comparisons based upon rigorous scientifically-supported performance standards such as LCA and NEB.
Policy Guidance • Discussion: We suggest that, without a cohesive strategy for progress based upon targeted
renewable energy priorities, substantive improvements in climate change mitigation, energy independence, and sustainability are unlikely to occur. In lieu of a consistent science-based policy framework, various regulatory mechanisms evolve in isolation with narrow focus. We find a number of counterproductive contradictions in current policy framework that limit potential for biofuels development. As example, consider I-937, the Western Climate Initiative (WCI), and the Energy Independence and Security Act of 2007 (EISA). I-937 is a State initiative that, in function, excludes portions of the wood resource from use and directs the eligible biomass subset to small-scale inefficient electric generators (rather than biorefineries) that could undermine the viability of existing infrastructure and result in considerable portions of the wood biomass resource left too isolated for recovery. The WCI, a regional climate change mitigation consortium of which Washington is a member, has evolved an elaborately complicated cap and trade scheme that, given its priority to address the electric sector in its first phase of implementation, is partially redundant to the renewable portfolio standard established by I-937 and fails to address the State’s largest emissions problem: transportation. Based upon the experience of the European cap and trade program, we conclude that WCI may also result in increased energy price volatility which has been shown to discourage renewable energy investment. EISA, on the other hand, was passed by the US Congress to create a national renewable fuel standard based upon ambitious additions of cellulosic ethanol capacity to be added by 2022. WA has one-twentieth of the Nation’s forest biomass inventory but current State prioritization of biomass-to-electricity (I-937 and WCI) acts to undermine the EISA cellulosic ethanol target as well as to compromise the State’s need to reduce greenhouse gas emissions and fuel imports. EISA, in apparent direct conflict with its ambitious schedule for cellulosic ethanol expansion, excludes wood from National Forests as eligible for conversion to renewable energy. Yet two-thirds of the nation’s forest health crisis is occurring on National
144
Forests and in many areas of the west, including Washington, wood biomass contribution from federal forests will be necessary if cellulosic ethanol is to be produced. We find that current State and national energy policies represent significant obstacles to wood-to-energy in Washington. See Section IV: 4.4. Obstacle 4 – Policy and regulations.
• Recommendation: Liquid transportation fuels, such as ethanol, should be the State energy priority. Formal scientific review of existing policies and potential policy alternatives to examine barriers to wood for biofuels conversion is recommended. Special attention should be given to I-937, WCI, and EISA.
Interdisciplinary science support for energy policy development • Discussion: Washington’s universities are home to many prestigious scientists, yet it is rare that
scientists of differing disciplines and from different research organizations are asked to work together to develop integrated analysis of resource policy alternatives. See Section IV: 4.4. Obstacle 4 – Policy and regulations.
• Recommendation: Sorely needed is programmatic investment in sustained in-state interdisciplinary research to assist policy makers and stakeholders in the development of realistic and effective strategies to address the difficult and complex challenges of renewable energy development and climate change mitigation.
Research • Discussion: The Government Accountability Office reports that, in contrast to increasingly urgent
national calls for climate change mitigation and energy independence, US investments in research have generally declined over the last thirty years. In Washington, there is no programmatic investment in sustained in-state interdisciplinary research to accelerate development of renewable energy from wood biomass or to investigate the role of sustainable forest management and wood products in climate change mitigation. There is also no continuing state program to enlist forest scientists in support of policy development or educational outreach to stakeholder groups. By contrast, the Oregon Legislature created the Oregon Forest Resources Institute (OFRI) in 1991 to improve public understanding of the state’s forest resources and to encourage environmentally sound forest management. OFRI is funded by a dedicated harvest tax on forest products producers. Issues include technical, economic, environmental, social, and moral questions that require continued scholarly research but ultimately can only be resolved by an informed political process. The choices ahead are difficult, expensive and long-lasting with implications for future generations and forest ecosystems in Washington and around the world. See Section IIV: 4.5. Obstacle 5 – Research.
• Recommendation: Our analysis has revealed that the most significant obstacle to wood utilization for renewable energy in Washington is a lack of integrated understanding of many complex issues that need serious consideration if progress towards climate change mitigation, energy independence, and sustainability is to proceed. We recommend that Washington establish a permanent interdisciplinary program of research and outreach to address emerging topics concerning biomass energy development with implications the environment and the economy as discussed in greater detail throughout this report.
We have prepared an information-rich examination of many factors found to be related to development of energy from wood biomass in Washington. To the best of our knowledge, such a broad investigation has not previously been conducted. We find that, to be most effective, wood energy policies must be examined in the context of three over-arching imperatives that compel immediate attention: Climate Change Mitigation, Energy Independence, and Sustainability. We conclude that, given these imperatives for action and a national commitment to cellulosic ethanol, utilization of wood for renewable transportation fuels should be the paramount priority. Biorefineries co-located at pulp and paper mills, offer the greatest opportunities for success. While utilization of the wood resource for biofuels presents logistical and technical challenges, we find that, when compared to other states that are already moving forward with biofuels development, Washington’s abundant and productive forests should provide superior opportunity. However, a lack of public focus hinders progress. A State commitment to development of a cohesive

145
energy strategy supported by interdisciplinary research to target priority objectives for achievement will be needed to spur investment for Wood to Energy in Washington. The most costly future outcome will result from failure to proceed.
146
References Abboud, L. 2008. EU greenhouse gas emissions rose 1.1% last year. Wall Street Journal. Apr. 3, 2008. ABCNews/Washington Post. 2007. Stanford Poll: The Environment. Concern Soars about Global
Warming as World’s Top Environmental Threat. http://abcnews.go.com/images/US/1035a1Environment.pdf
Acker, S.A., T.E Sabin, L.M Ganio, & W.A. McKee. 1998. Development of old-growth structure and timber
volume growth trends in maturing Douglas-fir stands. Forest Ecology and Management 104 (1/3): 265-280.
Ackerman, F., E.A. Stanton, C. Hope, S. Alberth, J. Fisher, and B. Biewald. 2008. What We’ll Pay if
Global Warming Continues Unchecked. Natural Resources Defense Council. 32 pp. http://www.nrdc.org/globalwarming/cost/cost.pdf
Aden, A. 2008. Biochemical Production of Ethanol from Corn Stover: 2007 State of Technology Model.
NREL/TP-510-43205. 10 pp. http://www.nrel.gov/docs/fy08osti/43205.pdf Aden, A. 2007. Water usage for current and future ethanol production. Southwest Hydrology. Sept/Oct
2007: 22-23. Agee, J.K. 1993. Fire Ecology of Pacific Northwest Forests. Island Press. WA. D.C. 493 pp. Agenda 2020 Technology Alliance and Energetics Inc. (Agenda 2020). 2006. Forest Products Industry
Technology Roadmap. 53 pp. plus appendices. Aikens, C.M. and D.L. Jenkins (eds.). 1994. Archaeological Researches in the Northern Great Basin: Fort
Rock Archaeology since Cressman. Univ. of OR. Anthro. Pap. 50. Univ. of Oregon. Eugene, OR. 628 pp.
Alig, R.J., O. Krankina, A. Yost, and J. Kuzminykh. 2006. Forest carbon dynamics in the Pacific Northwest
(USA) and the St. Petersburg region of Russia: Comparisons and policy implications. Climate Change. 79(3-4):335-360.
American Automobile Association (AAA). 2009. Daily Fuel Gauge Report.
http://www.fuelgaugereport.com/sbsavg.asp American Solar Energy Society and Management Services Inc. (ASES and MISI). 2008. Defining,
Estimating, and Forecasting the Renewable Energy and Energy Efficiency Industries in the U.S. and in Colorado. Boulder and WA. D.C. 182 pp. http://www.ases.org/images/stories/ASES/pdfs/CO_Jobs_Final_Report_December2008.pdf
Ammann, H., R. Blaisdell, M. Lipsett, S.L. Stone and S. Therriault. 2001. Wildfire Smoke: A Guide for
Public Health Officials. CA Air Resources Board. http://www.arb.ca.gov/smp/progdev/pubeduc/wfgv8.pdf
Anderson, M. and M. Moratto. 1996. Native American Land-Use Practices and Ecological Impacts. 187-
206. In: Sierra Nevada Ecosystem Project: Final Report to Congress, Vol. II, Assessments and Scientific Basis for Management Options. Section II: Human Components of the Sierra Ecosystem. University of California, Centers for Water and Wildland Resources. Davis, CA. http://ceres.ca.gov/snep/pubs/v2.html
Anderson, T.A., E.A. Gutherie, and B.T. Walton. 1993. Bioremediation. Environmental Sci. and Tech.
27(13).
147
Anderson, H.W., M.D. Hoover, and K.G. Reinhart. 1976. Forests and water: effects of forest management
on floods, sedimentation, and water supply. Gen. Tech. Rep. PSW-18. USDA Forest Service. PSW Forest and Range Exp. Sta. Berkeley, CA. 115 pp. http://www.treesearch.fs.fed.us/pubs/24048
Andress, D. 2001. Air quality and GHG emissions associated with using ethanol in gasoline blends.
Report to the Oak Ridge National Laboratory, UT-Batelle, Inc. 29 pp. http://www.oregon.gov/ENERGY/RENEW/Biomass/docs/FORUM/Andress2000.pdf
Andrews, R.W. 1957. This Was Sawmilling. Superior Publishing Company. Seattle, WA. 176 pp. Andreu, M. G. 2005. Economic, social, and silvicultural analysis of converting residual forest biomass to methanol. Ph.D. Thesis. University of Washington, Seattle, WA. Ångpanneföreningen-IPK. 1994. System study – Techno/economic reviews of process combinations of
ethanol processes and other relevant industrial processes. Report P23332–1, NUTEK, Stockholm, Sweden.
Antares Group Inc. 2008. Strategic Development of Biorefinery in the Western States: Development of
Supply Scenarios Linked to Policy Recommendations; Section 2: Bioenergy Conversion Technology Characteristics. WGA.
Antares Group Inc. 2003. Assessment of Power Production at Rural Utilities Using Forest Thinnings and
Commercially Available Biomass Power Technologies. Report to US DOE , USDA, and NREL. Antizar-Ladislao, B. and J.L. Turrion-Gomez. 2008. Second generation biofuels and local bioenergy
systems. Biofuels, Bioprod. Bioref. 2: 455-469. Apps, M.J., P.Y. Bernier, and J.S. Bhatti. 2006. Forests in the Global Carbon Cycle: Implications of
Climate Change. 175-200. In: Climate Change and Managed Ecosystems (Bhatti, J.S., R. Lal, M.J. Apps, and M.A. Price. eds). Taylor and Francis Group. Boca Raton, FL. 446 pp.
Arimura, T.H., D. Burtraw, A. Krupnick, and K. Palmer. 2007. U.S. Climate Policy Developments.
Resources for the Future Discussion Paper. RFF DP 07-45. WA. D.C. 39 pp. http://www.rff.org/documents/RFF-DP-07-45.pdf
Arno, S.F. 2000. Fire in Western Forest Ecosystems. In: Brown, J.K., Smith, J.K., eds. Wildland Fire in
Ecosystems: Effects of Fire on Flora. RMRS-GTR-42: vol. 2. USDA For. Serv. Rocky Mtn. Res. Sta.: 97-120.
Arrow, K.J. 2007. Global climate change a challenge to policy. Economist’s Voice. June 2007: 1-5.
http://www.bepress.com/cgi/viewcontent.cgi?article=1270&context=ev Arvizu, D.E. 2008. Renewable Energy – Moving Technologies into the Marketplace. DOE NREL.
http://www.nrel.gov/director/pdfs/swed_american_entrepr_day_2008-0407.pdf Asare, S. and M. Madison. 2000. Use of hybrid poplars for phytoremediation and other environmental
applications. 21-24. In: Hybrid poplars in the Pacific Northwest: Culture, Commerce, and Capability. WSU Cooperative Extension. Pullman,WA.
Associated Press. 2008. Owners choice: Sell timber or land. The Seattle Times. Nov. 10, 2008.
http://seattletimes.nwsource.com/ Associated Press. 2007. UN expert calls turning food crops into fuel "a crime against humanity."
International Herald Tribune. http://www.iht.com/articles/ap/2007/10/26/news/UN-GEN-UN-Food-vs-Biofuel.php
148
Associated Press. 2006. Washington voters approve renewable energy. Nov. 10, 2006. MSNBC.
http://www.msnbc.msn.com/default.aspx/id/15652935/ Athena Institute. http://www.athenasmi.org/ Athena Institute. 2003. Poised for Profit: Prospects for the Smart Energy Sector in the Pacific Northwest.
71 pp. http://www.climatesolutions.org/?s=publications Aulisi, A. A. Sauer, F. Wellington. 2008. Trees in the Greenhouse – Why Climate Change is Transforming
the Forest Products Business. World Resources Institute. WA. D.C. 74 pp. http://www.wri.org/publication/trees-in-the-greenhouse
Austin, A. 2008. Reinventing the mill. Biomass Magazine. Dec. 2008.
http://www.biomassmagazine.com/article.jsp?article_id=2221&q=&page=all Aversa, J. 2005. Oil prices said to slow U.S. economy a bit. The Washington Post. July 18, 2005. Avista Corporation- Kettle Falls.
http://www.avistautilities.com/inside/resources/kettlefalls/Pages/default.aspx Babu, B.V. 2008. Biomass pyrolysis: a state-of-the-art review. Biofuels, Bioprod. Bioref. 2:393–414. Badger, P.C. and P. Fransham. 2003. Use of mobile fast pyrolysis plants to densify biomass and reduce
biomass handling costs—A preliminary assessment. Biomass and Bioenergy 30 (2006) 321–325. Badger, P.C. 2002. Processing Cost Analysis for Biomass Feedstocks. US DOE EERE. Oak Ridge
National Laboratory. Oak Ridge, TN. 52 pp. http://bioenergy.ornl.gov/main.aspx Bailey, J.D., and J.C. Tappeiner. 1998. Effects of thinning on structural development in 40- to 100-year-
old Douglas-fir stands in western Oregon. Forest Ecology & Management. 108: 99-113. Bain, R.L. and R.P. Overland. 2002. Biomass for Heat and Power. Forest Products Journal. 52(2): 12-19.
http://www.fpl.fs.fed.us/tmu/resources/documents/fps_feb2002feature_richbain.pdf Bannon, B. et al. 2007. American’s Evaluations of Policies to Reduce Greenhouse Gas Emissions.
Stanford University, Resources for the Future, and New Scientist Magazine. 40 pp. http://woods.stanford.edu/docs/surveys/GW_New_Scientist_Poll_Technical_Report.pdf
Bare, B.B. 2002. Defining the Scientific Basis of Sustainability. University of Washington, College of
Forest Resources. Seattle, WA. 7 pp. http://faculty.washington.edu/bare/sus2.html Barmina, I., A. Desnickis, A. Meijere, and M. Zake. 2007. Development of Biomass and Gas Cofiring
Technology to Reduce Greenhouse Gaseous Emissions. In: Advanced Combustion and Aerothermal Technologies. NATO Science for Peace and Security Series C: Environmental Security. Springer Netherlands. 221-230.
Barnard, J. 2003. Northwest Forest plan faulted by one of its authors. Seattle Times June 30, 2003.
http://community.seattletimes.nwsource.com/archive/?date=20030630&slug=forestplan30m Barnett, T.P. et al. 2008. Human-induced changes in the hydrology of the western United States.
Science. 319:1080-1083. Barrett, S.W. and S.F. Arno. 1982. Indian fires as an ecological influence in the Northern Rockies. Journal
of Forestry. 80(10): 647-651.
149
Basheda, G., M.Chupka, P. Fox-Penner, J. Pfeifenberger, and A. Schumaker. 2006. Why are electricity prices increasing? An industry wide perspective. The Brattle Group. Report prepared for Edison Electric Institute. Cambridge, MA. 119 pp. http://www.eei.org/ourissues/finance/Documents/Brattle_Report.pdf
Bast, R.L. and J.M. Taylor. 2007. Scientific consensus on global warming: Results of an international
survey of climate scientists. The Heartland Institute. Chicago, IL. 24 pp. http://www.heartland.org/custom/semod_policybot/pdf/20861.pdf
Beauchemin, P.A. and M. Tampier. 2008. Emissions from wood-fired combustion equipment. Report
prep[ared for the British Columbia Ministry of the Environment. 50 pp. plus Appendices. http://www.env.gov.bc.ca/epd/industrial/pulp_paper_lumber/pdf/emissions_report_08.pdf
Beck, R.W. 2003. Review of Biomass Fuels and Technologies: Yakima County. Yakima, WA. 49 pp. Becker, D.R. and C. Lee. 2008. State Woody Biomass Utilization Policies. Staff Paper Series No. 199.
Department of Forest Resources. College of Food, Agricultural and Natural Resource Sciences. University of Minnesota. St. Paul, MN. 183 pp. http://www.forestrycenter.org/library.cfm?RefID=104795
Beman, J.M., K.R. Arrigo, and P.A. Matson. 2005. Agricultural runoff fuels large phytoplankton blooms in
vulnerable areas of the ocean. Nature 434(March 2005):211-214. Bergman, P. and J. Kiel. 2005. Torrefaction for biomass upgrading. In proceedings: 14th European
Biomass Conference & Exhibition. Paris, France. Bergmann, R. and J. Zerbe. 2004. Primer on Wood Biomass for Energy. USDA Forest Service, State and
Private Forestry Technology Marketing Unit. Forest Products Laboratory. Madison, WI. 10 pp. http://www.fpl.fs.fed.us/tmu/wood_for_energy/primer_on_wood_biomass_for_energy.html
Bernton, H. 2006. The forest was easy prey for raging Tripod fire. Sept. 24, 2006.
http://seattletimes.nwsource.com/html/localnews/2003273021_beetleburn24m.html Bernton, H., W. Kovarik, and S. Sklar. 1982. The Forbidden Fuel: Power Alcohol in the Twentieth
Century. Boyd Griffen. NY. 274 pp. Bezdek, R.H. and R.M. Wendling. 2002. A Half Century of Long-Range Energy Forecasts: Errors Made,
Lessons Learned, and Implications for Forecasting. Journal of Fusion Energy. 21(3/4): 155-172. Bi, X. 2008. Personal communication. Dr. Bi is a Professor of Chemicaland Biological Engineering at the
University of British Columbia currently conducting research into torrefaction. Bilek, E.M., K.E. Skog, J. Fried, and G. Christensen. 2005. Fuel to Burn: Economics of Converting Forest
Thinnings to Energy Using BioMax in Southern Oregon. USDA Forest Service. Forest Products Laboratory. Gen. Tech. Rep. FPL-GTR-157. Madison, WI. 31 pp. http://www.fpl.fs.fed.us/documnts/fplgtr/fpl_gtr157.pdf
Bioenergy Washington. About Us. http://www.bioenergy.wa.gov/About.aspx Bioenergy Washington. Biofuel Availability. http://bioenergy.wa.gov/BiofuelAvailability.aspx Bioenergy Washington. Washington State Biofuels Laws and Incentives.
http://www.bioenergy.wa.gov/BiofuelIncentives.aspx
150
Biomass Research and Development Board (BRDB). 2008. Increasing feedstock production for biofuels: economic drivers, environmental implications, and the role of research. 148 pp. http://www.brdisolutions.com/default.aspx
Biomass Research and Development Board (BRDB) 2006. Vision for Bioenergy and Biobased Products
in the United States – Bioeconomy for a Sustainable Future. WA. D.C. 21 pp. http://www1.eere.energy.gov/biomass/pdfs/final_2006_vision.pdf
Bjørke, S.A. and M. Seki (eds). 2005. Vital climate change graphics. United Nations Environmental
Programme. http://www.grida.no/publications/vg/climate2/ Blatner, K.A., C.E. Keegan, S.R. Shook, and F.G. Wagner. 2005. Washington’s Forest Products Industry:
Current Conditions and Forecast 2005. WSU Ext. Pullman, WA. 8 pp. http://cru.cahe.wsu.edu/CEPublications/misc0549/misc0549.pdf
Blazer, A., S. Caudle, R.E. Clevette, J.R. Shelly, and T. Szayna. 2008. 2007 U.S. Forest Service and
Department of Interior Large Wildfire Cost Review. Brookings Inst. 70 pp. http://www.fs.fed.us/fire/publications/ilwc-panel/report-2007.pdf
Bolsinger, C., N. McKay, D. Gedney, and C. Alerich. 1997. Washington’s Public and Private Forests.
Resource Bulletin. PNW-RB-218. USDA Forest Service. PNW Res. Sta. Portland, OR. 144 pp. http://www.treesearch.fs.fed.us/pubs/6942
Boman, U.R., and J.H. Turnbull. 1997. Integrated biomass energy systems and emissions of carbon
dioxide. Biomass and Bioenergy 13:333-343. Bonagofsky, J. 2008. Personal Communication. Mr. Bonagofsky is the Director of the Washington
Contract Loggers Association. Bond, P. and R. Dada (eds). 2005. Trouble in the Air Global - Warming and the Privatized Atmosphere.
Centre for Civil Society (South Africa) and Transnational Institute (TheNetherlands). 225 pp. http://www.thecornerhouse.org.uk/item.shtml?x=397683
Bonnicksen, T.M. 2008. Greenhouse gas emissions from four California wildfires: Opportunities to prevent
and reverse environmental and climate impacts. Forest Carbon and Emissions Model Report No. 2. The Forest Foundation. Auburn, CA.19pp. http://www.calforestfoundation.org/pdf/FCEM-2.pdf
Bonnicksen, T.M. 2000. America’s Ancient Forests: From Ice Age to the Age of Discovery. John Wiley
and Sons. NY, NY. 608 pp. Borman, B.T. et al. 2008. Intense forest wildfire sharply reduces mineral soil C and N: the first direct
evidence. Can. J. For. Res. 38: 2771-2783. Botkin, D.B. 1990. Discordant Harmonies: A New Ecology for the Twenty-first Century. Oxford University
Press. NY,NY. 241 pp. Bowyer, J., S. Bratkovich, A. Lindburg, and K. Fernholz. 2008. Wood Products and Carbon Protocols –
Carbon Storage and Low Energy Intensity Should Be Considered. Dovetail Partners Inc. 12 pp. http://www.dovetailinc.org/files/DovetailCarbon0408hz_0.pdf
Bowyer, J., J. Howe, K. Fernholz, and A. Lindburg. 2006a. Designation of Environmentally Preferable
Building Materials – Fundamental Change Needed Within Leed. Dovetail Partners Inc. 11 pp. www.dovetailinc.org
151
Bowyer, J.L., J. Howe, and K. Fernholz. 2006b. Biomass energy – from farms to forests an emerging opportunity for rural America. Dovetail Partners. 16 pp. www.dovetailinc.org
Bowyer, J., D. Briggs, B. Lippke, J. Perez-Garcia, J. Wilson. 2004. Life Cycle Environmental Performance
of Renewable Materials in Context of Residential Building Construction: Phase I Research Report. Consortium for Research on Renewable Industrial Materials CORRIM Inc. Seattle WA. 60pp +15 chapter modules of approximately 600pp. http://www.corrim.org/reports/
Bowyer, J., D. Briggs, L. Johnson, and others. 2001. CORRIM: a report of progress and a glimpse of the
future. Forest Products Journal. 51: 10-22. Briggs, D. 1994. Chapt. 11 Biomass and Utilization of Trees. In: Forest Products Measurements and
Conversion Factors: With Special Emphasis on the U.S. Pacific Northwest. University of Washington. College of Forest Resources. Seattle. WA. 161 pp. http://www.ruraltech.org/projects/conversions/briggs_conversions/briggs_book.asp
Brown, M. and R.W. Judd. 2006. Emissions Reduction through Biomass and Gas Co-firing – The BAGIT
Project. 23rd World Gas Conference. Amsterdam, The Netherlands. 13 pp. http://www.advanticagroup.com/PDF/WGC_paper_2006%20_2.pdf
Buchanan, A.H. and B.G. Honey. 1995. Energy and carbon dioxide implications of building construction.
Energy and Buildings 20: 205-217. Buckman, R. 2009. Who Wants My Biofuel? Forbes. Apr. 27, 2009:40-42 Bugelin, R. and T. Young. 2002. Wood Waste Generation by Secondary Wood Products Manufacturers.
University of Tennessee Center for Industrial Services and Oak Ridge National Laboratory. Knoxville, TN.
Bull, S. 2006. Ethanol Production Costs. In: Forest Bioenergy Sustaining Our Future with Renewable
Resources. Module 6: Economics of Forest Biomass and Bioenergy. http://www.forestbioenergy.net/training-materials/powerpoint-presentations
Buongiorno, J.and J.K. Gilless. 1987. Forest Management and Economics: A Primer in Quantitative
Methods. MacMillan Pub. Co. 285 pp. Bureau of Economic Analysis (BEA). US Dept. of Commerce. http://www.bea.gov Burger, J., B. Amichev, and C. Fields-Johnson. 2008. Reforestation of mined land for productive land
uses and environmental quality. Progress Report 2007-2008. Forestry Dept. Virginia Tech. http://www.cses.vt.edu/PRP/Reports_08/Burger_Reforestation_2008.pdf
Burns, R.M. (tech. comp.). 1983. Silvicultural Systems for the Major Forest Types of the Unites States.
Agric. Handb. 445. USDA Forest Service. WA. D.C. 191 pp. Busby, D.P., A.L. Phillips, and C.W. Herndon. 2008. Construction cost sensitivity of lignocellulosic ethanol
biorefinery. Southern Agricultural Economics Association. Dallas, TX. 18 pp. http://ageconsearch.umn.edu/bitstream/6784/2/sp08bu08.pdf
Bush, G.W. 2007. Executive Order 13423—Strengthening Federal Environmental, Energy, and
Transportation Management. Federal Register. 72(17): 3919-3923. Butler, R.A. and W.F. Laurance. 2009. Is palm oil the next emerging threat to the Amazon? Tropical
Conservation Science. 2(1):1-10. http://tropicalconservationscience.mongabay.com/content/v2/09-03-23_butler-laurance_1-10.pdf
152
Butzner, K.W. 1990. The Indian legacy in the American landscape. In: The Making of the American Landscape. (Conzen, M.P. ed.). Unwin Hyamn. Boston, MA. 433 pp.
California Air Resources Board (CARB). 2007. Recommendations for Designing a Greenhouse Gas Cap-
and-Trade System for California. 109 pp. http://www.climatechange.ca.gov/events/2007-06-12_mac_meeting/2007-06-01_MAC_DRAFT_REPORT.PDF
California Biomass Energy Alliance (CBEA). http://www.calbiomass.org/ California Forest Products Commission (CFPC). 2008. The Wood-Users Guide to Green Building.
California Forest Products Commission. Auburn, CA. 36 pp. http://www.calforestfoundation.org Callendar, G.S. 1938. The artificial production of carbon dioxide and its influence on temperature.
Quarterly Journal of the Royal Meteorological Society. 64: 223-237. Callendar, G.S. 1949. Can carbon dioxide influence climate? Weather 4: 310-314. Callicott, J.B. 1991. The wilderness idea revisited: The sustainable development alternative.
Environmental Professional. 13:235-247. Campbell, C.J. and J.H. Laherrere. 1998. The end of cheap oil. Scientific American. 278(3): 78-83. Carey, A.B., B.R. Lippke, J. Sessions. 1999. Intentional Systems Management: Managing Forests for
Biodiversity. Journal of Sustainable Forestry 9(3/4):83-125. Carey, A. B. 1998. Ecological foundations of biodiversity: lessons from natural and managed forests of
the Pacific Northwest. Northwest Science 72 (special issue):127-133. Carey, A., C. Elliot, B. Lippke, J. Sessions, C. Chambers, C. Oliver, J. Franklin, and M. Raphael. 1996.
Washington landscape Management Project – A Pragmatic, Ecological Approach to Small Landscape Management. Washington Department of Natural Resources. Washington Department of Fish and Wildlife. USDA Forest Service, PNW Research Station. 90 pp. plus appendices.
Carlson, W.H. 2001. Use of Public Lands to Fuel Biomass Electric Power Production. Wheelabrator
Environmental Systems, Inc. In proceedings: National Conference on Opportunities to Expand Renewable Energy on Public Lands.
Carlson, C., D. Burtraw, M. Cropper, and K.L. Palmer. 2000. Sulfur dioxide control by electric utilities:
What are the gains from trade? Journal of Political Economy. 108(6):1292-1326. Chapman, L. 2009. Grain Ethanol Strikes. Clean Tech Group.
http://cleantech.com/news/4328/grain-ethanol-strikes-back Chestnut, L.G. and D.M. Mills, 2005. A Fresh Look at the Benefits and Cost of the US Acid Rain Program.
Journal of Environmental Management. 77(3):252-266. Chicago Climate Exchange (CCX). 2009. Market Overview. http://www.chicagoclimatex.com/ ChooseWashington. 2004. Forest Products in Washington State.
http://www.choosewashington.com/app_news/downloads/40_Forest_Products_Industry_Overview.pdf Christiansen, V. 2007. DNR Testimony to Congressional Subcommittee on Forests and Forest Health -
Wildfires and Their Aftermath: Protecting Communities, Watersheds and Wildlife. Presented on October 4th, 2006 by the Executive Director of Regulatory Programs, Washington State Department of Natural Resources.
153
Chum, H.L. and R.P. Overend. 2001. Biomass and renewable fuels. Fuel Processing Technology. 71(1-3): 187-195.
Cicerone, R.J. et al. 2001. Climate Change Science: An Analysis of Some Key Questions. Committee on
the Science of Climate Change. Division on Earth and Life Studies. National Research Council. National Academies Press. WA. DC. 29 pp. http://www.gcrio.org/OnLnDoc/pdf/ClimateChangeScience.pdf
Clallam County Economic Development Council (CCEDC). 2005. Biomass-to-Energy Feasibility Study. 73
pp. plus appendices. Clark, E. 2008. Personal Communication. Mr. Clark is the Coordinator for the Tribal Energy Program of
the Colville Confederated Tribes. Clark, B. 2007. WSU Researcher Wins Grant to Research Poplar Wood Biofuel Feasibility
http://cahnrsnews.wsu.edu/reportertools/news/2007/johnson-poplar-2007-08.html Clayton, A.M.H. and N.J. Radcliffe. 1996. Sustainability; A Systems Approach. Earthscan, London, UK.
258 pp. Clean Washington Center (CWC). 1997. Quality Specifications for Hogged Fuel.
http://www.cwc.org/wd_bp/wd_bp_pdf/4-05-01.pdf Clements, F.E. 1936. Nature and structure of climax. Journal of Ecology. 24(1):252-284. Climate Advisory Team (CAT). 2008. http://www.ecy.wa.gov/climatechange/2008CAT_overview.htm Climate Advisory Team (CAT). 2008. Leading the Way: A Comprehensive Approach to Reducing
Greenhouse Gases in Washington State. Recommendations of the Washington Climate Advisory Team. 101 pp. http://www.ecy.wa.gov/climatechange/CATdocs/020708_InterimCATreport_final.pdf
Climate Change Science Program (CCSP). 2008a. The effects of climate change on agriculture, land
resources, water resources, and biodiversity in the United States. Report by the U.S. Climate Change Science Program and the Subcommittee on Global Change Research. USDA. WA. D.C. 362 pp. http://www.usda.gov/oce/global_change/files/CCSPFinalReport.pdf
Climate Change Science Program (CCSP). 2008b. Preliminary Review of Adaptation Options for
Climate-Sensitive Ecosystems and Resources. Final Report, Synthesis, and Assessment Product 4.4. 873 pp. http://www.climatescience.gov/Library/sap/sap4-4/final-report/
Climate Impacts Group (CIG). 2009. Evaluating Washington’s Future in a Changing Climate. A Report by
the Climate Impacts Group. University of Washington. http://cses.washington.edu/db/pdf/wacciaexecsummary638.pdf
Climate Leadership Initiative (CLI). 2009. An Overview of Potential Economic Costs to Washington of a
Business-As-Usual Approach to Climate Change. University of Oregon. 47 pp. http://www.ecy.wa.gov/climatechange/docs/021609_ClimateEconomicsImpactsReport.pdf
College of Forest Resources (CFR). 2007. The Forest of Washington’s Forests and Forest Industries.
Report to the State Legislature. College of Forest Resources, University of Washington. Seattle, WA. 320 pp. plus Discussion Papers. http://www.ruraltech.org/projects/fwaf/final_report/index.asp
Collins. 2007. Ethanol production cost estimate comparisons. http://zfacts.com/metaPage/lib/USDA-
2007b_03-Collins-chief-econ-bio-fuels-z.pdf
154
Commission for Environmental Cooperation (CEC). 2008. Green Building in North America. Secretariat Report to Council Under Article 13 of the North American Agreement on Environmental Cooperation. Montreal, CA. 75 pp. http://www.cec.org/greenbuilding
Connor, E. 2008. The integrated forest biorefinery: the pathway to our bio-future and the range of product
opportunities. Tappi Journal. (March 2008):4-9. Consoli et al. (eds.). 1993. Guidelines for Life-Cycle Assessment: A Code of Practice. Society of
Environmental Toxicology and Chemistry (SETAC). Pensacola. Fl. Consortium for Research in Renewable Industrial Materials (CORRIM). http://www.corrim.org/ Consortium for Research in Renewable Industrial Materials (CORRIM). 2009. Maximizing Forest
Contributions to Carbon Mitigation. CORRIM Fact Sheet #5 http://www.corrim.org/ Cook, J. 2008. Imperium loses biodiesel contract. Seattle Post-Intelligencer. Aug. 14.
http://seattlepi.nwsource.com/business/375065_imperium15.html Copulos, M.R. 2007. The Hidden Cost of Oil: An Update. The National Defense Council Foundation. 6
pp. http://www.ndcf.org/ Costanza, R. 2008. Stewardship for a “full” world. Current History. 107(705):30-35. Countryman, C.M. 1964. Mass fires and fire behavior. U.S. Forest Service. Res. Paper PSW-19, Pacific
Southwest Forest and Range Exp. Sta., Berkeley, CA. 53 pp. Coyner, B. 2008. Jointed trailer moves chips efficiently. Capital Press. Nov. 27, 2008. Cronon,W. (ed.). 1995. Uncommon Ground: Toward Re-inventing Nature. W.W. Norton. NY, NY. 544 pp. Curtis, B. 2008. U.S. Ethanol Industry: The Next Inflection Point. 2007 Year in Review. The Office of
Energy Efficiency and Renewable Energy’s Biomass Program. US DOE. WA. D.C. 43 pp. http://www1.eere.energy.gov/biomass/pdfs/2007ethanolreview.pdf
Curtis, R.O., D.D. Marshall, and D.S. DeBell. (eds). 2004. Silvicultural Options for Young-Growth
Douglas-Fir Forests: The Capitol Forest Study-Establishment and First Results. Gen. Tech. Rep. PNW-GTR-598. USDA Forest Service. PNW Res. Sta. Portland, OR. 110 pp. http://www.treesearch.fs.fed.us/pubs/6372
Curtis, R.O., D.S. DeBell, C.A. Harrington, D.P. Lavender, J.C. Tappeiner, & J.D. Walstad. 1998.
Silviculture for multiple objectives in the Douglas-fir region. Gen. Tech. Rep. GTR-PNW- 435. USDA Forest Service, PNW Research Station. 123 pp. http://www.fs.fed.us/pnw/pubs/gtr435/gtr435a.pdf
Cwynar, L.C. 1987. Fire and the forest history in the North Cascade range. Ecology 68(4): 791-802. Dahlstrom, K. 2008. Personal Communication. Mr. Dahlstrom is the owner of Viking Lumber Company in
Craig, AK. Danielsen et al. 2008. Biofuel plan tations on forested lands: double jeopardy for biodiversity and climate.
Cons. Bio. Nov. 2008. Darling, J. 2007. Georgia Pacific announces closure of Bellingham Plant. Port of Bellingham.
http://www.portofbellingham.com/content/NewsItem_1640_v Dasgupta, P. 2006. Comments on the Stern Review’s Economics of Climate Change. University of
Cambridge. Cambridge, UK. 9 pp. http://www.econ.cam.ac.uk/faculty/dasgupta/STERN.pdf
155
Davis, B.H. and M.L. Occelli. 2006. Fischer-Tropsch Synthesis, Catalysts, and Catalysis. Elsevier.
Boston, MA. 430 pp. Davis, L.S. and K.N. Johnson. 1987. Forest Management. Cobb/Dunlap Pub. Serv.Inc. 790 pp. DeBano, L.F. 1981. Water-repellent soils: A state-of-the-art. USDA Forest Service Gen. Tech. Rep. PSW-
46. PSW For. and Range Exp. Sta. Berkeley, CA. 21 pp. http://www.treesearch.fs.fed.us/pubs/26997
Deffeyes, K.S. 2001. Hubbert’s Peak: The Impending World Oil Shortage. Princeton University Press.
Princeton, NJ. 208 pp. Demirbas, A. 2001. Bioresource facilities and biomass conversion processing for fuels and chemicals.
Energ. Conver. Manage. 42:1357–1378. Denevan, W. 1992. The pristine myth: The landscape of the Americas in 1492. Annals of the Association
of American Geographers. 82:369-385. Deutsch, J. and J.R. Schlesinger. 2006. National Security Consequences of U.S. Oil Dependency. Report
of an Independent Task Force. Council on Foreign Affairs. NY, NY. 67 pp. http://www.cfr.org/content/publications/attachments/EnergyTFR.pdf
Diebold, J.P. 2000. A Review of the Chemical and Physical Mechanisms of the Storage Stability of Fast
Pyrolysis Bio-Oils. US DOE NREL. Golden, CO. 51 pp. http://webdev.its.iastate.edu/webnews/data/site_biorenew_reading/19/webnewsfilefield_file/ReviewOfMechanisms.pdf
Dimitri, C. and A. Effland. 2007. Fueling the automobile: an economic exploration of early adoption of
gasoline over ethanol. Journal of Agricultural and Food Organization. Berkeley Electronic Press 5(2): 1-20.
Dooley, J.J. 2008. U.S. Federal investments in Energy R&D: 1961-2008. Pacific Northwest National
Laboratory. Richland, WA. http://www.pnl.gov/main/publications/external/technical_reports/PNNL-17952.pdf
Dooley, J.H., J.L. Fridley, M.S. DeTray, and D.N. Lanning. 2006. Large rectangular bales for woody
biomass. In proceedings: 2006 ASABE Annual International Meeting. Portland, OR. Doppelt, B., Y. Bauman, S. Maze, and E. Wolf. 2006. Impacts of Climate Change on Washington’s
Economy: A preliminary assessment of risks and opportunities. WA Dept of Ecology. WA Dept of Community, Trade and Economic Development. 119 pp. http://www.ecy.wa.gov/pubs/0701010.pdf
Dram, J.R. 2002. Small Log Sawmilling 101. USDA Forest Service. State and Private Forestry. Madison,
WI. http://www.forestprod.org/smallwood02_dramm.pdf Du, X. and D.J. Hayes. 2008. The Impact of Ethanol Production on the U.S. and Regional gasoline Prices
and on the Profitability of the U.S. Oil Refinery Industry. 08-WP 467. Center for Agricultural and Rural Development. Iowa State University. Ames, IA. 25 pp. http://www.card.iastate.edu/publications/DBS/PDFFiles/08wp467.pdf
Duffield, J.S. 2008. Over a Barrel: The Costs of U.S. Foreign Oil Dependence. Stanford University
Press. Stanford, CA. 290 pp. E85vehicles. 2007. E85 Stations. http://e85vehicles.com/e85-stations.htm
156
Easterly, J.L. and M.Z. Lowenstein. 1986. Cogeneration from biofuels: a technical guidebook. US DOE. Southeastern Regional Biomass Energy Program. Muscle Shoals, AL. 130 pp. http://www.p2pays.org/ref/15/14433.pdf
Eastin, I., I. Ganguly, D. Sasatani and B. Lippke. 2007. Section 3: Economic Contribution. In: The Future
of Washington’s Forests and Forest Industries. University of Washington; College of Forest Resources. Seattle, WA. 320 pp. plus Appendices. http://www.ruraltech.org/projects/fwaf/final_report/index.asp
Ebert, J. 2008. Syngas 101. Biomass Magazine.
http://www.biomassmagazine.com/article.jsp?article_id=1399&q=syngas%20101 Economist. 2008. The future of energy; It’s closer than you think. June 21-27, 2008.. Ellerman, A.D. 2003. Are cap-and-trade programs more environmentally effective than conventional
regulation? Massachusetts Institute of Technology. Center for Energy and Environmental Policy Research. WP 03-015. 17 pp.http://econpapers.repec.org/paper/meewpaper/0315.htm
Elliot, W.J. and I.S. Miller. 2002. Estimating erosion impacts from implementing the National Fire Plan.
Paper 02-5011. St. Joseph, MI. American Academy of Agricultural Engineers. 25 pp. Enecon Pty Ltd. 2002. Wood for Alcohol Fuels; Status of technology and cost/benefit of farm forestry for
biomass energy. Rural Industries and Research Development Corporation and Australia Joint Venture of Agroforestry Program. http://www.rirdc.gov.au/reports/AFT/02-141.pdf
Energy Efficiency and Renewable Energy (EEREa). Theoretical Ethanol Yield Calculator. US DOE.
WA.D.C. http://www1.eere.energy.gov/biomass/ethanol_yield_calculator.html Energy Efficiency and Renewable Energy (EEREb). What is Ethanol? US DOE. WA. D.C.
http://www.afdc.energy.gov/afdc/ethanol/what_is.html Energy Efficiency and Renewable Energy (EEREc). Cellulosic Ethanol Production. US DOE.
http://www.afdc.energy.gov/afdc/ethanol/production_cellulosic.html Energy Efficiency and Renewable Energy (EERE). 2005. Energy and Environmental Profile of the US
Pulp and Paper Industry. US DOE. WA. D.C. 88 pp. http://www1.eere.energy.gov/industry/forest/pdfs/pulppaper_profile.pdf
Energy Efficiency and Renewable Energy (EERE). 2004. Biomass Co-firing in Coal-Fired Boilers. US
DOE Federal Energy Management Program. 34 pp. http://www1.eere.energy.gov/femp/pdfs/fta_biomass_co-firing.pdf
Energy Efficiency and Renewable Energy (EERE) and Electric Power Research Institute (EPRI). 1997.
Renewable Energy Technology Characterizations. TR-109496. US DOE. WA. D.C. and Palo Alto, CA. 283 pp. http://www1.eere.energy.gov/ba/pba/pdfs/entire_document.pdf
Energy Information Administration (EIA). 2009a. State Energy Profile – Washington. US DOE.
http://tonto.eia.doe.gov/state/state_energy_profiles.cfm?sid=WA#Datum Energy Information Administration (EIA). 2009b. Average Retail Price of Electricity to Ultimate Customers
by End-Use Sector, by State. US DOE. http://www.eia.doe.gov/cneaf/electricity/epm/table5_6_a.html Energy Information Administration (EIA). 2009c. Annual Energy Outlook 2009 with Projections to 2030.
US DOE. 230 pp. http://www.eia.doe.gov/oiaf/aeo/pdf/0383(2009).pdf
157
Energy Information Administration (EIA). 2008a. Annual Energy Outlook 2008 with Projections to 2030. US DOE. 224 pp. http://www.eia.doe.gov/oiaf/aeo/pdf/0383(2008).pdf
Energy Information Administration (EIA). 2008b. Renewable energy consumption and electricity
preliminary 2007 statistics. US DOE. WA DC. 16 pp. http://www.eia.doe.gov/fuelrenewable.html
Energy Information Administration (EIA). 2008c. State emissions by year. US DOE. WA. D.C.
http://www.eia.doe.gov Energy Information Administration (EIA). 2008d. Petroleum Basic Statistics. US DOE. WA. D.C.
http://www.eia.doe.gov/basics/quickoil.html Energy Information Administration (EIA). 2008e. International Energy Outlook – 2008. US DOE. WA.
D.C. http://www.eia.doe.gov/oiaf/ieo Energy Information Administration (EIA). 2008f. Petroleum Products: Consumption. US DOE.
http://www.eia.doe.gov/neic/infosheets/petroleumproductsconsumption.html Energy Information Administration (EIA). 2008g. How Much Renewable Energy Do We Use? US DOE.
http://tonto.eia.doe.gov/energy_in_brief/renewable_energy.cfm Energy Information Administration (EIA). 2008h. The Role of Renewable Energy Consumption in the
Nation’s Energy Supply. US DOE. http://www.eia.doe.gov/cneaf/alternate/page/renew_energy_consump/figure1.html
Energy Information Administration (EIA). 2008i. Real Petroleum Prices.
http://www.eia.doe.gov/emeu/steo/pub/fsheets/real_prices.html Energy Information Administration (EIA). 2007a. Biofuels in the U.S. transportation sector. US DOE.
http://www.eia.doe.gov/oiaf/analysispaper/biomass.html Energy Information Administration (EIA). 2007b. Energy market and economic impacts of S. 280, the
Climate Stewardship and Innovation Act of 2007. US DOE. SR/OIAF/2007-04. 78 pp. http://www.eia.doe.gov/oiaf/servicerpt/csia/pdf/sroiaf(2007)04.pdf
Energy Information Administration (EIA). 2006a. Eliminating MTBE in 2006. US DOE. WA DC.
http://www.eia.doe.gov/pub/oil_gas/petroleum/feature_articles/2006/mtbe2006/mtbe2006.pdf Energy Information Administration (EIA). 2006b. Annual Energy Outlook 2006: With Projections to 2030.
US DOE. WA. D.C. 221 pp. http://www.scag.ca.gov/rcp/pdf/publications/1_2006AnnualEnergyOutlook.pdf
Energy Information Administration (EIA). 2005. Residential Energy Consumption Survey. US DOE.
http://www.eia.doe.gov/emeu/recs/ Energy Information Administration (EIA). 2003. Biomass Milestones. US DOE. WA DC.
http://www.eia.doe.gov/cneaf/solar.renewables/renewable.energy.annual/backgrnd/chap6e.htm Energy Information Administration (EIA). 2000. Energy Plug: Long-term oil world oil supply: A
resource/production path analysis. http://www.eia.doe.gov/emeu/plugs/plworld.html Energy Information Administration (EIA). 1998. Challenges of the Electric Power Industry Restructuring
for Fuel Suppliers. US DOE WA.D.C. 142 pp. http://www.eia.doe.gov/cneaf/electricity/chg_str_fuel/chg_str_fuel.pdf
158
Energy Information Administration (EIA). Ethanol Time Line. Energy Kid’s Page. US DOE. WA DC. http://www.eia.doe.gov/kids/history/timelines/ethanol.html
Energy Security Leadership Council (ESLC). 2006. Recommendations to the Nation on Reducing US
Oil Dependence. 57 pp. http://www.secureenergy.org/reports/ESLC_Oil_Report.pdf Environmental Protection Agency (EPAa). Wood Stove Certification.
http://www.epa.gov/compliance/monitoring/programs/caa/whcert.html Environmental Protection Agency (EPAb). Wood Stove Change Out Campaign.
http://www.epa.gov/woodstoves/changeout.html Environmental Protection Agency (EPAc). Cleaner Burning Woodstoves and Fireplaces.
http://www.epa.gov/woodstoves/ Environmental Protection Agency (EPAd). Carbon Sequestration in Agriculture and Forestry.
http://www.epa.gov/sequestration/local_scale.html Environmental Protection Agency (EPAe). Cap and Trade: Acid Rain Program Results.
http://www.epa.gov/airmarkt/cap-trade/docs/ctresults.pdf Environmental Protection Agency (EPA). 2009a. Waste Resource Conservation – Reduce, Reuse,
Recycle – Construction and Demolition Materials. http://www.epa.gov/epawaste/conserve/rrr/imr/cdm/index.htm
Environmental Protection Agency (EPA). 2009b. Six common air pollutants: particulate matter.
http://www.epa.gov/air/particlepollution/index.html Environmental Protection Agency (EPA). 2008. Inventory of US Greenhouse Gas Emissions and
Sinks: 1990 to 2006. 394 pp. http://www.epa.gov/climatechange/emissions/usinventoryreport.html Environmental Protection Agency (EPA). 2007a. Biomass Combined Heat and Power Catalog of
Technologies. EPA Combined Heat and Power Partnership. 113 pp. http://www.epa.gov/chp/documents/biomass_chp_catalog.pdf
Environmental Protection Agency (EPA). 2007b. Greenhouse gas impacts of expanded renewable and
alternative fuels use. EPA420-F-07-035. http://www.epa.gov/otaq/renewablefuels/420f07035.htm Environmental Protection Agency (EPA). 2007c. Municipal Solid Waste in the United States. 177 pp.
http://www.epa.gov/epawaste/nonhaz/municipal/pubs/msw07-rpt.pdf Environmental Protection Agency (EPA). 2007d. Regulatory Impact Analysis: Renewable Fuel Standard
Program. 352 pp. http://www.epa.gov/otaq/renewablefuels/420r07004.pdf Environmental Protection Agency (EPA). 2007e. Power Profiler: How clean is the energy that I use?
http://www.epa.gov/cleanenergy/energy-and-you/report-large.html Environmental Protection Agency (EPA). 2006. Inventory of US Greenhouse Gas Emissions and Sinks:
1990-2004. EPA-430-R-06-002. WA, D.C. http://www.epa.gov/climatechange/emissions/usgginv_archive.html
Environmental Protection Agency (EPA). 2005a. Emission Facts: Metrics for Expressing Greenhouse Gas
Emissions: Carbon Equivalents and Carbon Dioxide Equivalents. http://www.epa.gov/OMS/climate/420f05002.htm#global
159
Environmental Protection Agency (EPA). 2005b. Emission Facts: Average Carbon Dioxide Emissions Resulting from Gasoline and Diesel Fuel. http://www.epa.gov/OMS/climate/420f05001.htm
Environmental Protection Association (EPA). 2002. Clean Alternative Fuels: Ethanol Fact Sheet. http://eerc.ra.utk.edu/etcfc/docs/EPAFactSheet-ethanol.pdf
Environmental Protection Agency (EPA). 1996. EPA takes final step in phase out of leaded gasoline.
http://www.epa.gov/history/topics/lead/02.htm Erixson, J. 2001. Forest practices contrasted among four states. Northwest Woodlands. 17(2):12-13. European Bioenergy Networks (EURBIONET). 2000. Biomass Co-Firing – An Efficient Way to Reduce
Greenhouse Gas Emissions. Jyväskylä, Finland. 28 pp. http://ec.europa.eu/energy/renewables/studies/doc/bioenergy/0000_cofiring_eu_bionet.pdf
European Climate Exchange (ECX). 2009. Market Snapshot. http://www.ecx.eu/ Evans, A.M. and R.T. Perschel. 2009. An Assessment of Biomass Harvesting Guidelines. Forest Guild.
Santa Fe, NM. 20pp. http://www.forestguild.org/publications/research/2009/biomass_guidelines.pdf Evans, R.J. and D.M. McCormick. 2006. River Valley Biomass Refinery Market Study. US DOE DE-
FG36-04G014246. Lakewood, CO. 139 pp. plus appendices. Everett, R., D. Baumgartner, P. Ohlson, and R. Schelhaas. 2008. Structural age class and age structure
in 1860 and 1940 reconstructed fir-pine stands of eastern Washington. Western North American Naturalist 68(3):278–290.
Fairley, P. 2008. Taking Pulp to the Pump. Technology Review. Massachusetts Institute of Technology.
http://www.technologyreview.com/energy/21811/?a=f Farhar, B.C. 1999. Willingness to pay for electricity from renewable resources: A review of utility market
research. DOE. NREL/TP.550.26148. 20pp. Fargione, J., J. Hill, D. Tilman, S. Polasky, and P. Hawthorne. 2008. Land clearing and the biofuel carbon
debt. Science. 319(5867):1235-1238. http://www.sciencemag.org/cgi/content/full/319/5867/1235 Fedkiw, J., D.W. MacCleery, and W.A. Sample. 2004. Pathway to Sustainability: Defining the Bounds on
Forest Management. Forest History Society. Durham, NC. 64 pp. Feldstein, M. 2003. Reducing America’s Dependency on Foreign Oil Supplies. Annual Meeting of the
American Economic Association. NY, NY. http://www.nber.org/feldstein/oildependenceaea2003.pdf Ferhrs. J. 1999. Secondary Mill Residues and Urban Wood Waste Quantities in the United States.
Northeast Regional Biomass Program. CONEG Policy Research Center. WA. D.C. Fernholz, K., P. Guillery, J. Howe, and J. Bowyer. 2005. A Beginners Guide to Green Building: What the
Forest Sector Needs to Know about USGBC and LEED. Dovetail Partners Inc. 10 pp.; www.dovetailinc.org
Fleck, R. 2005. Personal Communication. Mr. Fleck is the City Attorney for the community of Forks, WA. Flexible Energy Communities Initiative (FECI). 2007. Where Wood Works: strategies for heating with
woody biomass. U.S. Forest Service, Bureau of Land Management, and Colorado Wood Program. 14 pp. http://www.communitybiomass.com/index.php?option=com_docman&task=doc_view&g
Flores, D. 1997. The West that was and the West that can be. High Country News. 29:6-7.
160
Food and Agriculture Organization of the United Nations (FAO). 2001a. Global Forest Fire Assessment
1990-2000. Rome, Italy. 494 pp. http://www.fire.uni-freiburg.de/programmes/un/fao/fao_3.htm Floyd, D.W. 2002. Forest Sustainability: The History, the Challenge, the Promise. Forest History Society.
Durham, NC. 83 pp. Food and Agriculture Organization (FAO). 2001. State of the World’s Forests, 2001. Food and
Agriculture Organization, Rome, Italy. http://www.fao.org/docrep/003/Y0900E/y0900e00.htm Foreign Agriculture Service (FAS). 2005. Synthetic diesel may play a significant role as renewable fuel in
Germany. USDA Foreign Agriculture Services. Production Estimates and Crop Division. http://www.fas.usda.gov/pecad/imagery_archive/highlights/2005/01/btl0104/syntheticdiesel.htm
Forest Health Strategy Work Group. 2004. A Desirable Forest Health Program for Washington’s Forests:
Forest Health Strategy Work Group. Report to State Legislature. Department of Natural Resources. Olympia, WA. 63 pp.
Forest Products Laboratory (FPL). 2004. Wood Biomass for Energy. USDA Forest Products Laboratory
Tech Line Fact Sheet. Madison, WI. http://www.fpl.fs.fed.us/documnts/techline/wood-biomass-for-energy.pdf
Forest Sector Workgroup on Climate Change Mitigation. 2008. Final Report. Climate Action Team
convened by WA Depts of Natural Resources and Ecology. Olympia, WA. 44 pp. http://www.ecy.wa.gov/climatechange/2008FAdocs/11241008_forestreportversion2.pdf
Forest Service. 2004. Forest Inventory and Analysis Timber Product Output (TPO) Database Retrieval
System developed in support of the 1997 Resources Planning Act (RPA) Assessment. USDA Forest Service. http://www.ncrs2.fs.fed.us/4801/TimberProducts/
Forestweb. 2009. 2008 production down by 4.3%. Paper360° Jan/Feb 2009:36. Franklin, J.F. and J.K. Agee. 2003. Forging a Science-Based National Forest Fire Policy. Issues in
Science and Technology. Fall 2003:1-8. http://www.portlandonline.com/shared/cfm/image.cfm?id=173004
Franklin, J. et al. 2002. Disturbances and structural development of natural forest ecosystems with
silvicultural implications, using Douglas-fir forests as an example. Forest Ecology and Management 155: 399-423. http://www.fs.fed.us/pnw/pubs/journals/pnw_2002_franklin001.pdf
Frear, C., B. Zhao, G. Fu, M. Richardson, S. Chen, and M. Fuchs. 2005. Biomass Inventory and
Bioenergy Assessment; An Evaluation of Organic Material Resources for Bioenergy Production in Washington State. Publication No. 05-07-047. Washington Department of Ecology and Washington State University. 120 pp. http://www.ecy.wa.gov/pubs/0507047.pdf
Frear, C. 2008. Cellulosic Feedstock Availability by County in Washington State. Working Paper. Dept.
Biosystems Engineering, Washington State University. Pullman, WA. Fritschen, L., H. Bovee, K. Buettner, R. Charlson, L. Monteith, S. Pickford, J. Murphy. 1970. Slash fire
atmospheric pollution. Res. Pap. PNW-RP-097. USDA Forest Service, PNW Res. Sta. Portland, OR. 47 pp. http://www.treesearch.fs.fed.us/pubs/25884
Fuels for Schools. http://www.fuelsforschools.info/ Galbraith, K. 2008. Economy shifts and the ethanol industry reels. New York Times. November 5, 2008.
161
Gammel, T. and R. Bremer. Northwest Pulp Mills and Export Facilities 1989-2002. Forest Resources Association. Portland, OR.
Garber, A. 2006. Renewable Resources Focus of I-937. Seattle Times.
http://seattletimes.nwsource.com/html/localnews/2002981358_initiatives09m.html Garber, K. 2008. What do Wall Street’s woes mean for renewable energy? US News and World Report.
Oct. 3, 2008. Gardner, L.E. 2004. Fiber, Fuel, and Habitat. Forest Biomass Fuel Feasibility Study by Ferry County
Conservation District. Republic, WA. 26 pp. plus appendices. Gardner-Outlaw, T. and R. Engelman. 1999. Forest futures: population, consumption, and wood
resources. Population Action International. WA. D.C. 68 pp. http://www.populationaction.org/Publications/Reports/Forest_Futures/Summary.shtml
Garman, S.L., J.H. Cissel, and J.H. Mayo. 2003. Accelerating development of late-successional
conditions in young managed Douglas-fir stands: a simulation study. Gen. Tech. Rep. PNW-GTR-557. Portland, OR: U.S. Department of Agriculture, Forest Service, Pacific Northwest Research Station. 57 pp. http://www.treesearch.fs.fed.us/pubs/5300
Gedalof, Z., D. L. Peterson, et al. 2005. Atmospheric, climatic, and ecological controls on extreme wildfire
years in the northwestern United States. Ecological Applications 15(1): 154-174. Georgia Institute of Technology (Georgia Tech). 1984. The Industrial Wood Energy Handbook. Van
Nostrand Reinhold Co. NY, NY. Giesen, T.W., S.S. Perakis, and K. Cromack Jr. 2008. Four centuries of soil carbon and nitrogen change
after stand-replacing fire in a forest landscape in the western Cascade Range of Oregon. Can. J. For, Res. 38: 2455-2464.
Global Insights. 2008. U.S. Metro Economies – Current and Potential Green Jobs in the U.S. Economy.
Report prepared for the U.S. Conference of Mayors and the Mayors Climate Protection Center. Lexington, MA. 33 pp. http://usmayors.org/pressreleases/uploads/GreenJobsReport.pdf
Glover, J., D.O. White, and T.A.G. Langrish. 2002. Wood verses concrete and steel in house
construction: a life cycle assessment. Journal of Forestry. 100:34-41. Goettemoeller, J. and A. Goettemoeller. 2007. Sustainable Ethanol – Biofuels, Biorefineries, Cellulosic
Biomass, Flex-Fuel Vehicles, and Sustainable Farming for Energy Independence. Prairie Oak Publishing. Maryville, MO. 195 pp.
Goodstein, D. 2004. Out of Gas: The End of the Age of Oil. Norton. NY, NY. 139 pp. Goolsby, D.A. et al. 1999. Topic 3: Report for the Integrated Assessment on Hypoxia in the Gulf of
Mexico. USDOC NOAA Coastal Ocean Program. Dec. Anal. Series No. 17. Silver Spring, MD. 137 pp. http://oceanservice.noaa.gov/products/hypox_t3final.pdf
Gore, A. 2006. An Inconvenient Truth: The planetary emergency of global warming and what we can
do about it. Rodale Press. NY,NY. 328 pp. Gotz, H.A. et al. 1979. Equations for estimating biomass and leaf area of plants in the Pacific Northwest.
Forest Research lab Research paper 41. Oregon State University. Corvallis, OR. 39 pp. http://ir.library.oregonstate.edu/dspace/handle/1957/8239
162
Government Accountability Office (GAO). 2008a. International Climate Change Programs; Lessons learned from the European Union’s Emissions Trading Scheme and the Kyoto Protocol’s Clean Development Mechanism. WA. D.C. 64 pp. http://www.gao.gov/new.items/d09151.pdf
Government Accountability Office (GAO). 2008b. Advanced Energy Technologies: Budget Trends and
Challenges for DOE’s Energy R&D Program. WA. D.C. 16 pp. http://www.gao.gov/new.items/d08556t.pdf
Government Accountability Office (GAO). 2007a. Crude oil: Uncertainty about Future Oil Supply Makes
It Important to Develop a Strategy for Addressing a Peak and Decline in Oil Production. WA. D.C. 60 pp. http://www.gao.gov/new.items/d07283.pdf
Governmental Accountability Office (GAO). 2007b. Climate Change: Agencies Should Develop
Guidelines for Addressing the Effects on Federal Lands and Water Resources. GAO-07-863. WA. D.C. 151 pp. http://www.gao.gov/new.items/d07863.pdf
Governmental Accountability Office (GAO). 2007c. Biofuels: DOE lacks a strategic approach to
coordinate increasing production with infrastructure development and vehicle needs. Report to Congress. 51 pp. http://www.gao.gov/new.items/d07713.pdf
Government Accountability Office (GAO). 2006a. Key Challenges Remain for Developing and
Deploying Advanced Energy Technologies to Meet Future Needs. WA. D.C. 68 pp. http://www.gao.gov/new.items/d07106.pdf
Government Accountability Office (GAO). 2006b. International Energy; International Forums Contribute
to Energy Cooperation within Constraints. WA. D.C. 51 pp. plus appendices. http://www.gao.gov/new.items/d07170.pdf
Governmental Accountability Office (GAO). 2006c. Woody Biomass Users’ Experiences Provide
Insights for Ongoing Government Efforts to Promote Its Use. WA. D.C. 45 pp. http://www.gao.gov/new.items/d06336.pdf
Governmental Accountability Office (GAO). 2005a. Wildland Fire Management: Important Progress Has
Been Made, but Challenges Remain to Completing a Cohesive Strategy. WA.D.C. 32 pp. http://www.gao.gov/new.items/d05147.pdf
Governmental Accountability Office (GAO). 2005b. Natural Resources: Federal Agencies Are Engaged
in Various Efforts to Promote the Utilization of Woody Biomass, but Significant Obstacles to Its Use Remain. WA. D.C. 51 pp. http://www.gao.gov/new.items/d05373.pdf
Government Accountability Office (GAO). 2000. Petroleum and Ethanol Fuels: Tax Incentives and
Related GAO Work. WA. D.C. 25 pp. http://www.gao.gov/new.items/rc00301r.pdf Governmental Accountability Office (GAO). 1999. Western National Forests: A Cohesive Strategy Is
Needed to Address Catastrophic Wildfire Threats. WA. D.C. 64 pp. http://www.gao.gov/archive/1999/rc99065.pdf
Graf, A. and T. Koehler. 2000. Oregon Cellulosic-Ethanol Study. An evaluation of the potential for ethanol
production in Oregon using cellulose-based feedstocks. Oregon Office of Energy. 30 pp. plus appendices. http://www.oregon.gov/ENERGY/RENEW/Biomass/study.shtml
Graham, R.T., A.E. Harvey, T.B. Jain, J.R. Tonn. 1999. The effects of thinning and similar stand
treatments on fire behavior in western forests. Gen. Tech. Rep. PNW-GTR-463. USDA Forest Service, ONW Res. Sta. Portland, OR. 27 pp. http://www.treesearch.fs.fed.us/pubs/2979
Greeley, W.B. 1920. Piute [Paiute] forestry or the fallacy of light burning. Timberman. 21(March):38-39.
163
Greene, D.L. 2008. Fact #522: June 9, 2008 – Costs of oil dependence 2008. US DOE. Energy
Efficiency and Renewable Energy Vehicle Technologies Program. Oak Ridge National Laboratory. http://www1.eere.energy.gov/vehiclesandfuels/facts/2008_fotw522.html http://www1.eere.energy.gov/ba/pba/docs/oil_security_metrics_model.ppt
Greene, D.L. and S. Ahmad. 2005. Costs of U.S. oil dependence: 2005 update. Oak Ridge National
Laboratory. US DOE. Oak Ridge, TN. 50 pp. http://cta.ornl.gov/cta/Publications/Reports/ORNL_TM2005_45.pdf
GreenTechMedia. 2008. Venture Capital Investment in Renewable Energy Soars to $3.4 Billion in 2007.
http://www.technologypartners.com/press/Venture_Capital_Investment_in_Renewable_Energy_Soars_to__3.4_Billion_in_2007.pdf
GreenWood Resources. http://www.greenwoodresources.com/resources/bio-fuel-position-statement.pdf Gregoire, C. 2007. Executive Order 07-02. Washington Climate Change Challenge. Office of the
Governor, Olympia, WA. http://www.governor.wa.gov/execorders/eo_07-02.pdf http://www.governor.wa.gov/priorities/environment/climate_brief.pdf
Grêt-Regamey, A., E. Hendrick, S. Hetsch, K. Pingoud, and S. Rüter. 2008. Challenges and
Opportunities of Accounting for Harvested Wood Products. Swiss Federal Office for the Environment (FOEN). Geneva, Switzerland. 12 pp. http://www.unece.org/timber/workshops/2008/hwp/HWP_Background_Paper.pdf
Gross, D. 2006. Raise the Gasoline Tax? Funny it doesn’t sound Republican. NY Times. Oct. 8.
http://www.nytimes.com/2006/10/08/business/yourmoney/08view.html?partner=rssnyt&emc=rss Grove, A.S., R.A. Burgelman, and D. Schifrin. 2008. U.S. Dependence on Oil in 2008: Facts, Figures and
Context. Res Paper No. 1997. Stanford graduate School of Business. 62 pp. http://papers.ssrn.com/sol3/papers.cfm?abstract_id=1327152
Grunwald, M. 2008. The clean energy scam. Time Magazine. Apr.7, 2008: 40-45. Gustafson, R. 2009. Personal Communication. Dr. Gustafson is a Professor of pulp and paper
sciences at the University of Washington College of Forest Resources. Gustavsson, L. and R. Sathre, 2006. Variability in energy and carbon dioxide balances of wood and
concrete building materials. Building and Environment. 41: 940-951. Gustavsson, L., P. Börjesson, B. Johansson, and P. Svenningsson. 1995. Reducing CO2 emissions by
substituting biomass for fossil fuels. Energy, 20(11): 1097-1113. Hale, W.J. 1936. Prosperity Beckons: Dawn of the Alcohol Age. Rutan Publishing. Minneapolis, MN. 160
pp. Halloin, L. 2003a. Major Bark Beetles of the Intermountain West. WA. Dept of Nat’l Res.: Olympia. 18pp.
http://www.dnr.wa.gov/htdocs/rp/forhealth/wadnrbarkbeetle.pdf Halloin, L. 2003b. Major Defoliating Insects of the Intermountain West. WA. Dept of Nat’l Res.: Olympia.
13pp. http://www.dnr.wa.gov/htdocs/rp/forhealth/wadnrdefoliators.pdf Hamann, M., G. Hicks, S. Gooch, J. Pinzon, and R. Taylor. No Date. Cellulosic Ethanol Feasibility Study,
Franklin County, WA. 54 pp.
164
Hamelinck, C.N., G. van Hooijdonk, A. PC Faaij. 2005. Ethanol from lignocellulosic biomass: techno-economic performance in short-, middle-, and long-term. Biomass and Bioenergy. 28: 384-410.
Hamelinck, C. N., and A. P. C. Faaij. 2002. Future prospects for production of methanol and hydrogen
from biomass. Journal of Power Sources 111:1-22. Hammerschlag, R. 2006. Ethanol’s Energy Return on Investment: A Survey of the Literature 1990-
Present. Environ. Sci. Technol. 20(6). 1744-1750. http://pubs.acs.org/doi/pdf/10.1021/es052024h Han, H., J. Halbrook, F. Pan, L. Salazar, and N. Curran. 2008. Economic evaluation of a roll-off trucking
system removing forest biomass resulting from shaded fuelbreak treatments. USDA Forest Service. Eureka, CA. 28pp.
Hannah, L., T.E. Lovejoy, and S.H. Schneider. 2005. Biodiversity and Climate Change in Context. 1-14.
In: Climate Change and Biodiversity (Lovejoy and Hannah. eds). Yale University Press. New Haven and London. 418 pp.
Hardin, J.W. et al. 2000. The role of fire in the boreal carbon budget. Global Climate Change. 6: 174-184. Hardy, C.C. and D.E. Ward. 1986. Emission factors for particulate matter by phase of combustion from
prescribed burning. In proceedings: Annual Meeting of the Air Pollution Control Association pacific Northwest International Section. Eugene, OR.
Harmon, M.E. W.K. Ferrel, and J.F. Franklin.1990. Effects on carbon storage of conversion of old-growth
forests to young forests. Science 247:699-702. Harr, R.D. 1983. The potential for water yield augmentation from forest management in the Rocky
Mountain Region. Water Resour. Bull. 19:383-393. Harvey, A.E., M.F. Harrington, and R.T. Graham. 1989. Fire-soil interactions governing site productivity in
Northern Rocky Mountains. In: (Baumgartner, D. ed) Prescribed fire in the intermountain region: forest site preparation and range improvement. Washington State University. Pullman WA. 9-18
Haynes, R. (Tech. Coord.). 2003. An Analysis of the Timber Situation in the United States: 1952-2050. A
technical document supporting the 2000 USDA Forest Service RPA Assessment. Gen. Tech. Rep. PNW-GTR-560. USDA Forest Service PNW Res. Sta. Portalnd, OR. 254 pp. plus appendices. http://www.fs.fed.us/pnw/pubs/gtr560/
Healey, S.P. et al. 2008. The relative impact of harvest and fire upon landscape-level dynamics of older
forests: Lessons from the Northwest Forest Plan. Ecosystems. 11:1106-1119. Heiken, D. 2003. A synthesis of published articles on young stand management. Oregon Natural
Resource Council: Eugene, OR. http://www.efn.org/~onrcdoug/THINNING_SCIENCE.htm Heilman, P.E., R.F. Stettler, D.P. Hanley, and R.W. Carkner. 1995. High Yield Hybrid Poplar Plantations
in the Pacific Northwest. Pacific Northwest Regional Extension Bulletin. WA, OR, ID. 41 pp. Helms, J.A. 2004. Old-Growth; What is it? Journal of Forestry. 102(3):8-12. Helms, J.A. 1998. The Dictionary of Forestry. University of California at Berkeley. Berkeley, CA. 224 pp. Hendrickson, O.Q. and J. Gulland. 1993. Residential Wood Heating: the forest, the atmosphere, and the
public consciousness. Air and Waste Management Conference. Forestry Canada and Gulland Associates Inc.
165
Hessburg, P.F., J.K. Agee, and J.F. Franklin. 2005. Dry forests and wildland fires of the inland Northwest USA: Contrasting the landscape ecology of the pre-settlement and modern eras. For. Ecol. and Mgmt. 211(1-2):117-139.
Hikkila, P.1989. Utilization of Residual Forest Biomass. Springer-Verlag. Berlin, Heidelberg, New York,
London, Paris, Tokyo, Hong Kong. 568 pp. Hill, J. et al. 2009. Climate change and health costs of air emissions from biofuels and gasoline.
University of Minnesota Initiative for Renewable Energy and the Environment. Proceedings of the National Academy of Sciences. 106(6):2077-2082.
Hill, G.K. and S. Learn. 2007a. Growing our own biodiesel – The future or false hope? The Oregonian.
Oct. 20 2007. Hill, G.K. and S. Learn. 2007b. The drive for biofuels. The Oregonian. Oct. 7., 2007. Hill, J., E. Nelson, D. Tilman, S. Polasky, and D. Tiffany. 2006. Environmental, economic, and
energetic costs and benefits of biodiesel and ethanol biofuels. Proceedings of the National Academy of Sciences. 103(30): 11206-11210.
Hirsch, R.L., R. Bezdek, and R. Wendling. 2005. Peaking of world oil production: Impacts, mitigation, and
risk management. US DOE NETL. 91 pp. http://www.netl.doe.gov/publications/others/pdf/Oil_Peaking_NETL.pdf
HistoryLink.org. Longview – Thumbnail History. Essay No. 8560. http://www.historylink.org/index.cfm HistoryLink.org. The Old Lowell Paper Mill. Essay No. 8564. http://www.historylink.org/index.cfm Hjärta. 2008. Hjärta – Change your rhythm. Green Living – Green Facts.
http://www.hjartaballard.com/gre_liv.html Houghton, J., S. Weatherwax, and J. Ferrell. 2006. Breaking the Biological Barriers to Cellulosic Ethanol:
A Joint Research Agenda. US DOE. Rockville, MD. 206 pp. http://www.energy.gov/news/3804.htm Houghton et al. 1985. Carbon dioxide exchange between the atmosphere and terrestrial ecosystems.
In: Atmospheric Carbon Dioxide and the Global Carbon Cycle. US DOE. WA D.C. Houghton, R.A., J.E. Hobbie, J.M. Melillo, and others. 1983. Changes in the carbon content of terrestrial
biota and soils between 1860 and 1980: A net release of CO2 to the atmosphere. Ecol. Monogr. 53:235-262.
Howard, J.L. 2003. US timber production, trade, consumption, and price statistics 1965-2002. USDA
FS. For. Prod. Lab. Res. Pap. FPL-RP-615. Madison, WI. 90 pp. http://www.fpl.fs.fed.us/documnts/fplrp/fplrp615/fplrp615.pdf
Howard, J.O. 1988. Energy values for whole trees and crowns of selected species. Res. Note. PNW-RN-
480. USDA Forest Service, PNW Res. Sta. Portland, OR. 8 pp. http://www.fs.fed.us/pnw/pubs/pnw_rn480.pdf
Howard, J.O. 1981. Logging residue in the Pacific Northwest: characteristics affecting utilization. Res.
Pap. PNW-RP-289. USDA, Forest Service, PNW Forest and Range Experiment Station. Portland, OR. 41 pp. http://www.treesearch.fs.fed.us/pubs/21377
Howard, J.O. 1981. Ratios for Estimating Logging Residue in the Pacific Northwest. USDA Forest
Service. Res Paper PNW-288. Portland, OR. 26 pp. http://www.treesearch.fs.fed.us/pubs/21376
166
Huggett, R. 1995. The Global Impact of Biomass Burning. Environmental Science and Technology: March.
Hunter, D. 2009. Testimony before the US House of Representatives Committee on Science and
Technology. Field Hearing: April 20, 2009. Vancouver, WA. Huntington, H.G. 2005 The Economic Consequences of Higher Crude Oil Prices. Final Report EMF SR 9.
US DOE. Stanford University, CA. 53 pp. http://www.stanford.edu/group/EMF/publications/doc/EMFSR9.pdf
Hurteau M.D., G.W. Koch, and B.A. Hungate. 2008. Carbon protection and fire risk reduction: toward a
full accounting of forest carbon offsets. Front Ecol Environ 6(9):493-498. Ice, G.G., D.G. Neary, and P.W. Adams. 2004. Effects of wildfire on soils and watershed processes.
Journal of Forestry. 102(6):16-20. ICF Consulting. 2008. Economic Analysis and Modeling Support to the Western Climate Initiative. Energy
2020 Model Inputs and Assumptions. Toronto, ON. 80 pp. http://www.westernclimateinitiative.org/ewebeditpro/items/O104F18738.pdf
Ince, P.J., X. Li, M. Zhou, J. Buongiorno, and M.R. Reuter. 2001. United States paper, paperboard, and
market pulp capacity trends by process and location, 1970–2000. Res. Pap. FPL-RP-602. Madison, WI: U.S. Department of Agriculture, Forest Service, Forest Products Laboratory. 36 pp. http://www.fpl.fs.fed.us/documnts/fplrp/fplrp602.pdf
Ince, P. 1979. How to Estimate Recoverable Heat Energy in Wood or Bark Fuels. Gen. Tech. Rep. FPL
29. Madison, WI. USDA For. Serv. For. Prod. Lab. Indermühle, A. et al. 1999. Holocene carbon-cycle dynamics based on CO2 trapped in ice at Taylor
Dome, Antarctica. Nature. 398: 121–126. Ingerson, A.L. 2007. U.S. Forest Carbon and Climate Change. The Wilderness Society. WA. D.C. 18 pp.
http://wilderness.org/content/forest-carbon-report Initiative 937. Chapter 194-37 WAC. Energy Independence.
http://www.cted.wa.gov/site/1001/default.aspx Innovative Natural Resource Solutions LLC (INRS). 2004. New Hampshire Bio-oil Opportunity Analysis.
New Hampshire Office of Energy & Planning. 55 pp. http://www.nh.gov/oep/programs/energy/documents/nhbio-oilopportunityanalysis.pdf
Institute for Agriculture and Trade Policy (IATP). 2006. Water use by ethanol plants potential challenges.
Minneapolis, MN. www.agrobservatory.org/library.cfm?refid=89449 Intergovernmental Panel on Climate Change (IPCC). IPCC Assessment Reports.
http://www.ipcc.ch/ipccreports/assessments-reports.htm Intergovernmental Panel on Climate Change (IPCC). 2007a. Climate Change 2007: The Physical Science
Basis. Contribution of Working Group I to the Fourth Assessment Report of the Intergovernmental Panel on Climate Change. S. Soloman, D. Qin, M. Manning, Z. Chen, M. Marquis, K.B. Averyt, M. Tignor, and H.L. Miller (eds.). Cambridge University Press. Cambridge, UK. NY, NY, USA. 996 pp. http://www.ipcc.ch
167
Intergovernmental Panel on Climate Change (IPCC). 2007b. Climate Change 2007: Impacts, Adaptation and Vulnerability. Contribution of Working Group II to the Fourth Assessment Report of the Intergovernmental Panel on Climate Change. M.L. Parry, O.F. Canziani, J.P. Palutikof, P.J. van der Linden and C.E. Hanson, Eds., Cambridge University Press, Cambridge, UK. 976 pp. http://www.ipcc.ch
Intergovernmental Panel on Climate Change (IPCC) 2007c. Climate Change 2007: Mitigation.
Contribution of Working Group III to the Fourth Assessment Report of the Intergovernmental Panel on Climate Change. [B. Metz, O.R. Davidson, P.R. Bosch, R. Dave, L.A. Meyer (eds)], Cambridge University Press, Cambridge, United Kingdom and New York, NY, USA. 851 pp. http://www.ipcc.ch
Intergovernmental Panel on Climate Change (IPCC). 2007d. Climate Change 2007 Synthesis Report:
Summary for Policy Makers. 22 pp. http://www.ipcc.ch Intergovernmental Panel on Climate Change (IPCC). 2006. 2006 IPCC Guidelines for National
Greenhouse Gas Inventories. The National Greenhouse Gas Inventories Programme, H.S. Eggleston, L. Buenida, K. Miwa, T Ngara, and K. Tanabe, eds.; Institute for Global Environmental Strategies (IGES). Hayama, Kanagawa, JP. http://www.ipcc-nggip.iges.or.jp/
Intergovernmental Panel on Climate Change (IPCC). 2001. Climate Change 2001: The Scientific Basis.
J.T. Houghton, Y. Ding, D.J. Griggs, M. Noguer, P.J. van der Linden, X. Dai, C.A. Johnson, and K. Maskell (eds.). Cambridge University Press. Cambridge, UK. 944 pp. http://www.ipcc.ch/ipccreports/tar/wg1/index.htm
Intergovernmental Panel on Climate Change (IPCC). 1996a. Climate Change 1995: The Science of
Climate Change. Intergovernmental Panel on Climate Change, J.T. Houghton, L.G. Meira Filho, B.A. Callander, N. Harris, A. Kattenberg, and K. Maskell. (eds.). Cambridge University Press. Cambridge, UK. 572 pp. http://www.ipcc.ch/ipccreports/assessments-reports.htm
Intergovernmental Panel on Climate Change (IPCC). 1996b. Climate Change 1995 — Impacts,
Adaptations and Mitigation of Climate Change: Scientific-Technical Analyses. Cambridge University Press, Cambridge, UK. 878 pp. http://www.ipcc.ch/ipccreports/assessments-reports.htm
Intergovernmental Panel on Climate Change (IPCC). 1991. Climate Change: The IPCC Response
Strategies. Island Press, Washington D.C. 270pp. http://www.ipcc.ch/ipccreports/assessments-reports.htm
International Energy Administration (IEA). 2008. From 1st to 2nd Generation Biofuel Technologies; An
overview of current industry and RD&D activities. The Extended Executive Summary. Paris, FR. 12 pp. http://www.iea.org/textbase/papers/2008/2nd_Biofuel_Gen_Exec_Sum.pdf
International Energy Agency (IEA). 2007a. Findings of recent IEA work 2007. 76 pp.
http://www.iea.org/textbase/nppdf/free/2007/findings.pdf International Energy Agency (IEA). 2007b. Potential contribution of bioenergy to the world’s future energy
demand. 12 pp. www.ieabioenergy.com International Energy Agency (IEA). 2007c. Renewables in Global Energy Supply- An IEA Fact Sheet.
Paris, FR. 29 pp. http://www.iea.org/textbase/papers/2006/renewable_factsheet.pdf International Energy Agency (IEA). 2005a. Answers to ten frequently asked questions about bioenergy,
carbon sinks, and their role in global climate change. Mathews, R. and K. Robertson (eds.). IEA Bioenergy Task 38. Joanneum Research. Graz, Austria. 8 pp. http://www.ieabioenergy-task38.org/publications/faq/
168
International Energy Agency (IEA). 2005b. Resources to Reserves: Oil and Gas Technologies for the Energy Markets of the Future. Paris, FR. 130 pp. http://www.iea.org/textbase/publications/free_new_Desc.asp?PUBS_ID=1568
International Energy Agency (IEA). 2004. Biofuels for Transport; An International Perspective. 210pp.
http://www.iea.org/textbase/nppdf/free/2004/biofuels2004.pdf International Energy Agency (IEA). 1998. Benign Energy? The Implications of Renewables. OECD/IEA.
Paris, FR. 122 pp. http://www.iea.org/textbase/nppdf/free/1990/benign1998.pdf International Organization for Standardization (ISO). 2006. ISO 14044:2006 Environmental Management:
Life Cycle Assessment—Requirements and Guidelines. ISO, Geneva. International Organization for Standardization (ISO). 2000a. ISO 14042: Environmental Management –
Life Cycle Assessment – Life Cycle Impact Assessment International Organization for Standardization, Geneva. Switzerland.
International Organization for Standardization (ISO). 2000b. ISO 14043: Environmental Management –
Life Cycle Assessment – Life Cycle Interpretation. International Organization for Standardization, Geneva. Switzerland.
International Organization for Standardization (ISO). 1998. ISO 14041: Environmental Management – Life
Cycle Assessment – Goal and Scope Definition and Inventory Analysis. International Organization for Standardization, Geneva. Switzerland.
International Organization for Standardization (ISO). 1997. ISO 14040: Environmental Management – Life
Cycle Assessment – Principles and Framework. International Organization for Standardization, Geneva. Switzerland.
IQ Learning Systems. Racing Fuel Characteristics. www.iqlearningsystems.com Irving, J.M. 2006. McNeil Power Generating Station. Presentation to the Bioenergy and Wood Products
Conference. Denver, CO. http://www.nationalbiomassconference.org/presentations/JohnIrving.pdf Jackson, J.K. 2006. US Trade Deficit and the Impact of Rising Oil Prices. Congressional Research
Service (CRS) Report for Congress. 6 pp. http://fpc.state.gov/documents/organization/68823.pdf Jaffe, A. 2008. Corn prices threaten ethanol. Washington Times. July 17, 2008.
http://www.washingtontimes.com/news/2008/jul/17/corn-prices-threaten-ethanol/ Jaffe, D. et al. 2008. Influence of fires on O3 concentrations in the western United States. Envir. Sci.
Tech. 2008(42):5885-5891. Joint Legislative Audit and Review Committee (JLARC). 2008. 2008 Full tax Preference Performance
Reviews. Olympia, WA. 251pp. http://www.leg.wa.gov/reports/Preliminary_ProposedFinals/2008%20Full%20Tax%20Pref%20Preliminary.pdf
Joint Legislative Audit and Review Committee (JLARC). 2005. Department of Natural Resources Fire
Suppression Study. Report 05-11. 64 pp. http://www1.leg.wa.gov/reports/05-11.pdf Jolley, S. 2001. A California Biomass-to-Energy Retrospective: We’re over the learning curve. In
proceedings: 4th Biennial Residue Wood Conference. Richmond, BC. 5 pp.
169
Jowit, J. and P. Wintour. 2008. Cost of tackling global climate change has doubled, warns Stern. The Guardian. UK. http://www.guardian.co.uk/environment/2008/jun/26/climatechange.scienceofclimatechange
Kadam, K.L., R.J. Wooley, A. Aden, Q.A. Nguyen, and F.M. Ferraro. 2000. Softwood forest thinnings as a
biomass source for ethanol: a feasibility study for California. Biotechnol. Prog. 16:947–957. Kalabokidis, K.D., P.N. Omi. 1998. Reduction of fire hazard through thinning/residue disposal in the urban
interface. International Journal of Wildland Fire 8: 29-35. Kasler, D. 2009. Pacific Ethanol could run out of cash by April 30. The Sacramento Bee. Apr. 1, 2009.
http://www.sacbee.com/business/story/1744938.html Kates, R.W., T.M. Parris, and A.A. Leiserowitz. 2005. What is sustainable development? Goals,
Indicators, and Practice. Environment: Science and Policy for Sustainable Development. 47(3):8-21. Kay, C.E. and R.T. Simmons (eds). Wilderness and Political Ecology: Aboriginal Influences and the
Original State of Nature. Univ. of Utah Press. Salt Lake City, UT. 342 pp. Keeling, C.D., R.B. Bacastow, A.E. Bainbridge, C.A. Ekdahl, P.R. Guenther, and L.S. Waterman. 1976.
Atmospheric carbon dioxide variations at Mauna Loa Observatory, Hawaii, Tellus. 28: 538-551. Kelly, R.A. 2007. Energy Supply and Renewable Resources. Facts On File Books. NY. 406 pp. Kelly, S.S. 2006. Forest Biorefineries: Reality, Hype, or Something in Between? PaperAge (March/Apr
2006):46-48. Kenworthy, T. 2006. US has most destructive expensive wildfire season in 50 years. USA Today.
http://www.usatoday.com/weather/news/2006-10-04-fires-cost_x.htm Kerr, R.A. 1998. The next oil crisis looms large and perhaps close. Science. 281(5380): 1128 – 1131. Kerstetter, J.D. and J.K. Lyons. 2001. Logging and Agricultural Residue Supply Curves for the Pacific
Northwest. Washington State University Energy Program. Report for the US DOE. Pullman, WA. 45 pp. http://www.energy.wsu.edu/documents/renewables/SupplyCurveReport.pdf
Kerstetter, J.D., L. Lynd, K. Lyford, and C. South. 1997. Assessment of Potential for Conversion of Pulp
and Paper Sludge to Ethanol Fuel in the Pacific Northwest. Washington State University Energy Program. Report for the US NREL. Pullman, WA. 20 pp. http://www.energy.wsu.edu/documents/renewables/PulpPaperToEthanol.pdf
Keyes, C.R., K.L. O’Hara. 2002. Quantifying stand targets for silvicultural prevention of crown fires.
Western Journal of Applied Forestry 17: 101-109. Kibert, C.J. 2003. Deconstruction: the start of a sustainable materials strategy for the built environment. UNEP Industry and Environment, 26(2-3): 84-88. Kiehl, J., and K. Trenberth, 1997: Earth’s annual global mean energy budget. Bull. Am. Meteorol. Soc. 78:
197–206. King County. 2008. Sustainable building: envision then build.
http://www.kingcounty.gov/environment/stewardship/sustainable-building/transfer-development-rights/definitions.aspx
Kinstrey, R. 2004. Invest to improve: North America struggles to maintain its global cost competitiveness.
Pulp and Paper. (Jan. 2004). www.paperloop.com
170
Kinver, M. 2008. EU industry sees emissions rise. BBC. Apr. 2, 2008.
http://news.bbc.co.uk/2/hi/science/nature/7326834.stm Kiplinger. 2009a. Looking ahead: Chu eyes fourth generation biofuels. Kiplinger Biofuels Market Alert.
3(2):4. Kiplinger. 2009b. Aldous: Greener grass on the other side. Interview with David Aldous, CEO of Range
Fuels. Kiplinger Biofuels Market Alert. 3(3):4. Kiplinger. 2009c. Ford supports boosting ethanol blend up to E15.. Kiplinger Biofuels Market Alert. 3(5):1-2. Kiplinger. 2009d. Valero: New ethanol biggie. Kiplinger Biofuels Market Alert. 3(6):2. Kiplinger. 2008a. On the horizon – emerging biobutanol. Kiplinger Biofuels Market Alert. 2(22): 4. Kiplinger. 2008b. Creating cellulosic capacity sure to be pricey. Kiplinger Biofuels Market Alert. 2(23):1-2. Kiplinger. 2008c. Banks cast a cold eye on biofuels financing. Kiplinger Biofuels Market Alert. 2(7):1-2. Kirby, A. 2008. Kick the Habit: A UN Guide to Climate Neutrality. United Nations Environment
Programme, Grid-Arendal, Environment Management Group. Malta. 200 pp. http://www.grida.no/publications/vg/kick/
Kirkland, L.A., H.P. Steinhagen, A.G. Campbell. 1991. The University of Idaho wood-fired boiler: a case
study. Forest Products Journal. 41(6): 54-56. Klare, M.T. 2004. Blood and Oil. The Dangers and Consequences of America’s Growing Petroleum
Dependency. Metropolitan Books. Henry Holt and Company. NY, NY. 265 pp. Klass, D.L. 1998. Biomass for Renewable Energy, Fuels, and Chemicals. Academic Press. San Diego,
CA. 651 pp. Knobel, M. 2008. Personal Communication. Mr. Knobel is the owner of West Oregon Wood Products, a
pellet manufacturing company. Kohlmaier, G.H.,M. Weber and R.A. Houghton. 1998. Carbon Dioxide Mitigation in Forestry and the
Wood Industry. Springer-Verlag, Berlin, Germany. 412 pp. Kozak, R. and C. Gaston. 2004. Life cycle analysis: a wood products perspective. In: Climate Change,
Carbon, and Forestry in Northwestern North America: Proceedings of a Workshop November 14-15, 2001 Orcas Island, WA. USDA Forest Service PNW Research Station. GTR -614. 120 pp. http://www.fs.fed.us/pnw/pubs/pnw_gtr614.pdf
Kurz, W.A. et al. 2008. Mountain pine beetle and forest carbon feedback to climate change. Nature 452:
987-990. Larson, E., S. Consonni, R. Katofsky, K. Iisa, and W.J. Frederick. 2006. A Cost-Benefit Assessment of
Gasification-Based Biorefining in the Kraft Pulp and Paper Industry. Vol. 1 Main Report. Princeton University. 164 pp. http://www.princeton.edu/pei/energy/publications/texts/Princeton-Biorefinery-Study-Final-Report-Vol.-1.pdf
Larson, E., S. Consonni, and R. Katofsky. 2003. A Cost-Benefit Assessment of Biomass Gasification
Power Generation in the Pulp and Paper Industry. Princeton University. Navigant Consulting Inc. Politecnico di Milano. 4 volumes. http://www.princeton.edu/pei/energy/publications/

171
Larson, K.R., and R.C. Sidle. 1980. Erosion and sedimentation data catalog of the Pacific Northwest:
USDA Forest Service, Unpublished Technical Report, R6-WM-050-1981: PNW Research Lab, Portland, Oregon, 58 pp.
Lee, C.M. 2007. Evaluating the forest stand and Washington state level feasibility of methanol production
from woody biomass. M.S. Thesis. University of Washington. Seattle, WA. 100 pp. Leffler, K. 2007. Washington Gas Price Study. Testimony to the Technology, Energy, and
Communications Committee of the Washington State House of Representatives. Nov. 27, 2007. Dr. Leffler is an Economics Professor at the University of Washington.
Leggett, J.A. 2009. Climate Change: Current Issues and Policy Tools. Congressional Research Service
(CRS) Report for Congress. RL34513. 28 pp. http://ncseonline.org/nle/crs/abstract.cfm?NLEid=2118 Leiby, P.N. 2007. Estimating the Energy Security Benefits of Reduced U.S. Oil Imports. ORNL/TM-
2007/028. Oak Ridge National Laboratory. Oak Ridge, TN. 35 pp. http://www.epa.gov/OTAQ/renewablefuels/ornl-tm-2007-028.pdf
Le Quéré, C. et al. 2008. Global Carbon Project: Carbon Budget and Trends 2007.
www.globalcarbonproject.org Le Treut, H., R. Somerville, U. Cubasch, Y. Ding, C. Mauritzen, A. Mokssit, T. Peterson and M. Prather,
2007. Historical Overview of Climate Change. In: Climate Change 2007: The Physical Science Basis. Contribution of Working Group I to the Fourth Assessment Report of the Intergovernmental Panel on Climate Change [Solomon, S., D. Qin, M. Manning, Z. Chen, M. Marquis, K.B. Averyt, M. Tignor and H.L. Miller (eds.)]. Cambridge University Press. Cambridge, UK. and NY, NY, USA. 129 pp.
LeVan, S.L. 1995. Life Cycle Assessment: Measuring Environmental Impact. In proceedings: 49th Annual
Meeting of the Forest Products Society. Portland, OR. 7-13. Levy, W.J. 1982. Oil Strategy and Politics, 1941 – 1981. Westview Press. Boulder, CO. 345 pp. Lewis, N.S. 2007. Powering the Planet. Engineering and Sci. 2: 12-23. Lieberz, S.M. 2004. Biofuels in Germany – prospects and limitations. USDA Foreign Agriculture Services.
Global Agriculture Information Network. 23 pp. http://www.fas.usda.gov/gainfiles/200411/146118126.pdf
Lignol. 2009. Lignol suspends Colorado Project due to market uncertainty.
http://www.lignol.ca/news/2009-feb9.html Lippke, B. and J. Perez-Garcia. 2008. Will either cap and trade or a carbon emissions tax be effective in
monetizing carbon as an ecosystem service. Forest Ecology and Mgmt. 256(12):2160-2165. Lippke, B.R., K.W. Zobrist, and C.L. Mason. 2007. Template for Forest Sustainability on the Olympic
Experimental State Forest. Working Paper 7. Rural Technology Initiative, College of Forest Resources, University of Washington. Seattle, WA. 49 pp. http://www.ruraltech.org/pubs/working/07/working_paper_07.pdf
Lippke, B., J. Comnick, C.L. Mason. 2006. Alternative Landscape Fuel Removal Scenarios: Impacts of
Treatment Thinning Intensity and Implementation Schedules on Fire, Fire Hazard Reduction Effectiveness, Carbon Storage, and Economics. Working Paper 6. Rural Technology Initiative, College of Forest Resources, University of Washington. Seattle, WA. 36 pp. http://www.ruraltech.org/pubs/working/06/working_paper_06.pdf
172
Lippke, B. and L. Edmonds. 2006. Environmental performance and improvement in residential construction: The impacts of products, biofuels, and process. For. Prod. Jour. 56(10):58-63.
Lippke, B., J. Wilson. J. Bowyer, J. Perez-Garcia, J. Meil, 2004. CORRIM: Life Cycle Environmental
Performance of Renewable Building Materials. For. Prod. Jour. 54(6): 8-19. Littell, J.S., E.E. Oniel, D. McKenzie, and others. 2009. Forest ecosystems, disturbance, and climatic
change in Washington State, USA. 60 pp. In proceedings: The Washington Climate Change Impacts Assessment; Evaluating Washington’s Future in a Changing Climate. A Report by the Climate Impacts Group. University of Washington. Seattle, WA. http://cses.washington.edu/cig/outreach/waccia/
Locke, G. 2002. Gov. Locke signs executive order for sustainable environmental practices by State
agencies. http://www.digitalarchives.wa.gov/GovernorLocke/press/press-view.asp?pressRelease=1190&newsType=1
Lockwood-Post. 2003 and 1988. Directory of the Pulp, Paper, and Allied Trades. Vance Pub. Corp. NY,
NY. Los Angeles Times. 2002. State deficit may close biomass power plants.
http://articles.latimes.com/2002/dec/24/local/me-sbriefs24.3 Lovejoy, T.E. and L. Hannah (eds). 2005. Climate Change and Biodiversity. Yale University Press. New
Haven, CN. and London, UK. 440 pp. Lynch, D.J. 2006. Brazil hopes to build on its ethanol success. USATODAY. March 28, 2006.
http://www.usatoday.com/money/world/2006-03-28-brazil-ethanol-cover_x.htm Lynch, D.L. 2004. What do forest fires really cost? Journal of Forestry 102(6):42-49. Lynd, L.R. 1996. Overview and evaluation of fuel ethanol from cellulosic biomass: technology, economics,
the environment, and policy. Annu. Rev. Energy Environ. 21: 403-465. Lyons,K. 2008. Personal Communication. Dr. Lyons is a scientist with the WSU Energy Office. Lyons, K. 2007. "Biofuel Development in Washington." Bioenergy Washington. WSU Extension Energy
Program. http://www.bioenergy.wa.gov/documents/biofuelactivities.pdf MacDonald, L.H. 2002. Effects of changes in Colorado’s forests on water yields and water quality.
Colorado Water. 18(5):6-8. MacLean, C.D. and C.L. Bolsinger. 1997. Urban Expansion in the Forests of the Puget Sound Region.
Res. Bull. PNW-RB-225. USDA Forest Service. PNW Res. Sta. Portland, OR. 17pp. http://www.treesearch.fs.fed.us/pubs/5116
Maker, T.M. 2004. Wood-Chip Heating Systems: a guide for institutional and commercial biomass
installations. Biomass Energy Resource Center. Montpelier, Vt. 91 pp. http://www.biomasscenter.org/pdfs/Wood-Chip-Heating-Guide.pdf
Mankiw, N.G. 2006. Raise the Gas Tax. Wall Street Journal. Oct. 20. Mann, C.C. 2005. 1491: New Revelations of the Americas before Columbus. Vintage. NY,NY. 541 pp. Mari, W. 2008. Waste Wood to Heat Downtown Buildings. Seattle Times. Oct. 8, 2008.
173
Marsh, G.P. 1864. Man and Nature: Or, Physical Geography as Modified by Human Action. C. Scribner & Co. NY, NY. Revised in 1874 and 1885. Reprinted many times.
Marshal Institute. 2006. Transportation fuels from biomass: an interesting, but limited, option. 159 pp.
http://www.marshall.org/pdf/materials/423.pdf Mason, C.L., K.L. Casavant, B.R. Lippke, D.K. Nguyen, and E. Jessup. 2008. The Washington Log Truck
Industry: Costs and Safety Analysis. University of Washington and Washington State University Report to the State Legislature. 109 pp. http://www.ruraltech.org/pubs/reports/2008/log_trucks/log_truck_report.pdf
Mason, C.L. and B.R. Lippke. 2007. Jobs, Revenues, and Taxes from Timber Harvest; An Examination of
the Forest Industry Contribution to the Washington State Economy. Working Paper 9. Rural Technology Initiative, College of Forest Resources, University of Washington. Seattle, WA. 58 pp. http://www.ruraltech.org/pubs/working/09/working_paper_09.pdf
Mason, C.L et al. 2006. Investments in Fuel Removals to Avoid Forest Fires Result in Substantial Benefit.
Journal of Forestry 104(1):27‐31. Mason, C.L. 2005. An Examination of the Washington Department of Natural Resources Timber Sale
Program Against a Backdrop of Changing Regional Infrastructure and a Growing Forest Health Crisis. Working Paper 2. Rural Technology Initiative, College of Forest Resources, University of Washington. Seattle, WA. 69 pp plus appendices. http://www.ruraltech.org/pubs/working/dnr_markets/dnr_markets.pdf
Mason, C.L., J. Calhoun, and B. Lippke. 2005. Options for Cedar Mill Waste Utilization and Disposal in
Western Clallam and Jefferson Countries. Working Paper 3. Rural Technology Initiative, College of Forest Resources, University of Washington. Seattle, WA. 41 pp. http://www.ruraltech.org/pubs/working/cedar_mill/cedar_mill.pdf
Mason, C.L., K. Ceder, H. Rogers, T. Bloxton, J. Comnick, B.Lippke, J. McCarter, and K. Zobrist. 2003.
Investigation of Alternative Strategies for Design, Layout and Administration of Fuel Removal Projects. Rural Technology Initiative, College of Forest Resources, University of Washington. Seattle, WA. 78 pp. plus appendices. http://www.ruraltech.org/pubs/reports/fuel_removal/fuel_removal.pdf
Mason, C.L. 2002. Will low prices for large logs mean shorter rotations on private forestlands? RTI Fact
Sheet # 7. Rural Technology Initiative, College of Forest Resources, University of Washington. Seattle, WA. http://www.ruraltech.org/pubs/fact_sheets/fs007/index.asp
Massachusetts Division of Energy Resources (MDER). 2007. Wood Pellet Heating Guidebook. 26 pp.
http://www.mass.gov/Eoca/docs/doer/pub_info/doer_pellet_guidebook.pdf Massachusetts Sustainable Forest Bioenergy Intiative. Executive Office of Energy and Environmental
Affairs. http://www.mass.gov/?pageID=eoeeahomepage&L=1&L0=Home&sid=Eoeea Maunder, E. and B. Holman. 1975. Paul R. Smith views the western red cedar industry, 1910 to the
present. Forest Historical Society. Santa Cruz, CA. 106 pp. McElroy, M. 2006. The ethanol illusion – can we move beyond an energy policy running on hype and hot
air? Harvard Magazine. Nov-Dec:33-35,107. McKeever, D.B. 2002. Inventories of Woody Residues and Solid Wood Waste in the United States, 2002.
USDA Forest Service. Forest Products Laboratory. Madison, WI. 16 pp. http://www.fpl.fs.fed.us/documnts/pdf2004/fpl_2004_mckeever002.pdf
174
McKellar, R. 2009. Personal Communication. Mr.McKellar is a Forester with the Washington Department of Natural Resources.
McKenzie, D., Z. Gedalof, D. Peterson, and P. Mote. 2004. Climate Change, Wildfire, and Conservation.
Conservation Biology.18(4). 890-902. McKitrick, R., J. D’Aleo, M. Khanekar, W. Kininmonth, C. Essex, W. Karlen, O. Karnier, I. Clark, T. Murty,
J.J. O’Brien. 2007. Independent Summary for Policymakers: IPCC Fourth Assessment Report. Fraser Institute. Vancouver, BC. 64 pp. http://www.uoguelph.ca/~rmckitri/research/ISPM.pdf
McNabb, D.H. and F.J. Swanson. 1990. Chapter 14. Effects of fire on soil erosion. In: (Walstad et al. eds)
Natural and prescribed fire in Pacific Northwest forests. Oregon University Press. Corvallis, OR. 159-176.
McNeil Technologies. 2005. Jefferson County Biomass Facility Feasibility Study. Lakewood, CO. 94 pp.
plus appendices. McNeil Technologies. 2003. Biomass Resource Assessment and Utilization Options for Three Counties in
Eastern Oregon. Oregon Dept. Energy. Salem, OR. 104 pp. plus appendices. http://www.oregon.gov/ENERGY/RENEW/Biomass/assessment.shtml
Mendelsohn,R.O. 2006. A Critique of the Stern Report. Regulation (Winter 2006-2007): 42-46.
http://www.cato.org/pubs/regulation/regv29n4/v29n4-5.pdf Methanol Institute and International Fuel Quality Center (MIIFQC). 2006. Biodiesel Primer: Market & Public Policy Developments, Quality, Standards & Handling.
http://www.methanol.org/pdfFrame.cfm?pdf=MIwpFIN.pdf Metz, L.J. and C.G. Wells. 1965. Weight and nutrient content of the aboveground parts of some loblolly
pines. Res. Pa SE-17, USDA Forest Service, Southeastern Forest Experiment Station, Ashville, NC, 21 pp. http://www.treesearch.fs.fed.us/pubs/5418
Micales, J.A. and Skog, K.E. 1997. The decomposition of forest products in landfills. International
Biodeterioration and Biodegradation, 39(2-3): 145-158. Michigan (Upper Peninsula) Resource Conservation and Development Council. 2009. Woody Biomass
Harvesting Guidelines. http://www.upwoodybiomass.org/guidelines_2.asp Millennium Ecosystem Assessment. 2005. Ecosystems and Human Well-Being: Synthesis. Island Press.
WA. D.C. 127 pp. http://www.millenniumassessment.org/en/synthesis.aspx Miller, N. 2008. Personal Communication. Mr. Miller is the Director of the Log Truckers Conference of the
Washington Trucking Association. Milstein, M. 2002. Northwest logging heads south. The Oregonian. Dec. 22, 2002. Ministry of Small Business and Revenue. 2008. British Columbia Carbon Tax Update.
http://www.sbr.gov.bc.ca/documents_library/notices/BC_Carbon_Tax_Update.pdf Minnesota Forest Resource Council (MFRC). 2009. Sustaining Minnesota Forest Resources: Voluntary
Site-Level Forest Management Guidelines for Landowners, Loggers and Resource Managers. http://www.frc.state.mn.us/FMgdline/Guidebook.html http://www.frc.state.mn.us/Info/MFRCdocs/forest%20biomass%20harvesting.pdf
175
Minnesota Forest Resources Council. 2007. Draft biomass harvesting on forest management sites in Minnesota. 28 pp. http://www.frc.state.mn.us/FMgdline/Final_Draft_for_MFRC_Approval_Forest_BiomassHarvest_Guidelines.pdf
Minore, D., A.W. Smart, and M.E. Dubrasich. 1979. Huckeberry Ecology and Management Research in
the Pacific Northwest. USDA Forest Service. PNW Forest and Range Experimental Station. Gen. Tech. Rep. PNW-93. 26 pp. http://www.fs.fed.us/pnw/publications/gtrs.shtml
The Missoulian. 2005. Thar’s BTUs in them thar hills. Jan. 17, 2005.
http://missoulian.com/articles/2005/01/17/opinion/opinion2.txt Moeur, M. et al. 2005. Northwest Forest Plan–The first 10 years (1994-2003): status and trend of late-
successional and old-growth forest. Gen. Tech. Rep. PNW-GTR-646. USDA Forest Service. PNW Res. Sta. Portland, OR. 142 pp. http://www.fs.fed.us/pnw/publications/pnw_gtr646/
Morgan, T.A. 2009. An assessment of forest-based woody biomass supply and use in Montana. Report
prepared for the Montana Department of Natural Resources and Conservation. Missoula. MT. 22 pp. http://dnrc.mt.gov/forestry/Assistance/Biomass/Documents/MT_WoodyBiomassAssessment.pdf
Morgan, M.S. 1989. Health Risks from Slash Fire Smoke. Chapter 15 in: (D.P. Hanley, J.J. Kammenga,
and C.D. Oliver eds) The Burning Question: Regional Perspectives on Slash. College of Forest Resources. University of Washington. Seattle, WA. 374 pp.
Morris, G. 2003. Status of biomass power generation in California, 2003. Subcontractor report to the
National Renewable Energy Laboratory. Golden, CO. 29 pp. http://www.nrel.gov/docs/fy04osti/35114.pdf
Morris, G. 1999. The Value of the Benefits of U.S. Biomass Power. NREL. Golden, CO. 24pp.
http://www.nrel.gov/docs/fy00osti/27541.pdf Morriss, A.P., W.T. Bogart, A. Dorchak, and R.E. Meiners. 2009. 7 Myths About Green Jobs. PERC
Policy Series No. 44. Bozeman, MT. 40 pp. http://www.perc.org/files/ps44.pdf Mote, P.W. 2004. How and why is Northwest climate changing? In: Climate Change, Carbon, and
Forestry in Northwestern North America: Proceedings of a Workshop November 14-15, 2001 Orcas Island, WA. USDA Forest Service. PNW Research Station. GTR -614. 120 pp. http://www.fs.fed.us/pnw/pubs/pnw_gtr614.pdf
Mote, P. W., E. A. Parson, A. F. Hamlet, K. N. Ideker, W. S. Keeton, D. P. Lettenmaier, N. J. Mantua, E.
L. Miles, D. W. Peterson, D. L. Peterson, R. Slaughter, and A. K. Snover. 2003. Preparing for climatic change: The water, salmon, and forests of the Pacific Northwest. Climatic Change. 61: 545-88.
Muir, P.S., R.L. Mattingly, J.C. Tappeiner II, J.D. Bailey, W.E. Elliott, J.C. Hagar, J.C. Miller, E.B.
Peterson, and E.E. Starkey. 2002. Managing for biodiversity in young Douglas-fir forests of western Oregon. U.S. Geological Survey, Biological Resources Division, Biological Science Report USGS/BRD/BSR–2002-0006. 76 pp. http://fresc.usgs.gov/products/papers/mang_bio.pdf
Mulholland et al. 2008. Stream denitrification across biomes and its response to anthropogenic nitrate
loading. Nature. 452(March 2008):202-206. Nabuurs, G.J., A.V. Dolman, E. Verkaik, P.J. Kuikman, C.A. van Diepen, A. Whitmore, W. Daamen, O.
Oenema, P. Kabat, and G.M.J. Mohren. 2000. Article 3.3 and 3.4. of the Kyoto Protocol – consequences for industrialized countries’ commitment, the monitoring needs and possible side effect. Environmental Science and Policy, 3(2/3) 123-134.
176
Naik, V. et al. 2007. On the sensitivity of radiative forcing from biomass burning aerosols and ozone to emission location. Geophys. Res. Lett. 34.
National Agricultural Census Service (NASS). 2002. 2002 Census of Agriculture. USDA Report.
http://www.nass.usda.gov/census/census02/volume1/wa/index2.htm National Alcohol Fuels Commission (NATC). 1981. Fuel Alcohol: an energy alternative for the 1980’s.
Transportation Research Board of the National Academies. WA D.C. 146 pp. National Association of Conservation Districts. 2006. Exploring the raging cost of catastrophic wildfire. 4 pp.
http://www.nacdnet.org/news/publications/forestrynotes/reports/ForestryNotes_Report_December06.pdf National Biodiesel Board. 2008a. Production Estimate Graph. http://www.biodiesel.org/ National Biodiesel Board. 2008b. RFS – Renewable Fuels Standard. http://www.biodiesel.org/ National Council for Air and Stream Improvement (NCASI). 2008. Greenhouse gas emissions from CHP-
produced electricity. Analysis provided by Reid Miner. National Fire Plan. http://www.forestsandrangelands.gov/NFP/index.shtml National Renewable Energy Laboratory (NRELa). Learning about renewable energy; bioproducts. US
DOE. http://www.nrel.gov/learning/re_bioproducts.html National Renewable Energy Laboratory (NRELb). Biomass Research; what is a biorefinery? US DOE.
http://www.nrel.gov/biomass/biorefinery.html National Renewable Energy Laboratory (NREL). 2007. Research advances – cellulosic ethanol. US DOE.
8 pp. http://www.nrel.gov/biomass/pdfs/40742.pdf National Renewable Energy Laboratory (NREL). 2006. From Biomass to Biofuels.
http://www.nrel.gov/biomass/pdfs/39436.pdf National Renewable Energy Laboratory (NREL). 2002. Fuel from the sky: Solar power’s potential for
western energy supply. 185 pp. http://www.nrel.gov/csp/pdfs/32160.pdf National Renewable Energy Laboratory (NREL). 2000. Biomass Co-firing: A Renewable Alternative for
Utilities. US DOE. 2 pp. http://www.nrel.gov/docs/fy00osti/28009.pdf National Renewable Energy Laboratory (NREL). 1999. Ethanol for sustainable transportation.
http://www.afdc.energy.gov/afdc/pdfs/factfict.pdf National Research Council (NRC). 2007. Water Implications of Biofuels Production in the United States.
WA D.C. 58 pp. http://books.nap.edu/openbook.php?record_id=12039 National Research Council. 1976. Renewable Resources for Industrial Materials. National Research
Council Board on Agriculture and Renewable Resources. Committee on Renewable Resources for Industrial Materials. WA. D.C. 267 pp.
Natural Resources Canada. 2007. Is Canada’s forest a carbon sink or source.
http://cfs.nrcan.gc.ca/news/544 National Council for Air and Stream Improvement (NCASI). 2002. Calculation tools for estimating
greenhouse gas emissions from pulp and paper mills. Version 1. Raliegh,NC. 140 pp. http://www.wbcsd.org/web/projects/forestry/Pulp-and-Paper-Tool-Guidance.pdf
177
Neumayer, E. 2007. A missed opportunity: the Stern review on climate change fails to tackle the issue of non-substitutable loss of natural capital. Global Environmental Change. 17(3/4): 1-14. http://eprints.lse.ac.uk/3059/1/A_missed_opportunity_(LSERO).pdf
Nicholls, D.L., R.A. Monserud, D.P. Dykstra. 2008. A synthesis of biomass utilization for bioenergy
production in the western United States. USDA Forest Service. Pacific NW Research Station. Gen. Tech. Rpt. PNW-GTR-753. 48 pp. http://www.fs.fed.us/pnw/pubs/pnw_gtr753.pdf
Nordhaus, W. 2006. Opposite ends of the globe; The Stern Review on the Economics of Climate Change.
21pp. http://qed.econ.queensu.ca/pub/faculty/milne/872/SternReviewD2.pdf Northern Institute of Applied Carbon Science (NIACS). No date. Sustainability Considerations in Biomass
Harvesting. http://www.nrs.fs.fed.us/niacs/local-resources/docs/NIACS_BioenergySustainability_WebVersion.pdf
Northwest Environmental Forum. 2007. Retaining Threatened Working Forest Lands and Enhancing
Biodiversity. Major Findings and Proposals. Seattle, WA. http://www.nwenvironmentalforum.org/documents/forumreportsept2007.pdf
Northwest Power and Conservation Council (NWPCC). 2008. Seventh Annual Report to the Northwest
Governors On Expenditures of the Bonneville Power Administration to Implement the Columbia River Basin Fish and Wildlife Program of the Northwest Power and Conservation Council, 1978-2007. 39 pp. http://www.nwcouncil.org/Library/2008/2008-03.htm
Northwest Power and Conservation Council (NWPCC). 2005. The Fifth Northwest Power and
Conservation Plan. http://www.nwcouncil.org/energy/powerplan/5/Default.htm Nothstein, G. 2007. Overview of Washington’s Oil Supplies and Transportation Fuel Market. Testimony to
the Technology, Energy, and Communications Committee of the Washington State House of Representatives. Nov. 27, 2007. Mr. Nothstein is an Energy Policy Specialist with the WA. Dept. Community, Trade, and Economic Development.
Oak Ridge National Laboratory (ORNL). http://www.ornl.gov/ Oasmaa, A., E. Kuoppala, S. Gust, Y. Solantausta. 2003. Fast pyrolysis of forestry residue. 1. Effect of
extractives on phase separation of pyrolysis liquids. Energy and Fuels. 17(1): 1-12. Obama for America. 2008. Barack Obama and Joe Biden: New Energy for America. 8 pp.
http://www.barackobama.com/pdf/factsheet_energy_speech_080308.pdf Office of Science. Systems Biology for Energy and Environment. US DOE.
http://genomicsgtl.energy.gov/biofuels/transportation.shtml Office of Technology Assessment (OTA). 1979. Gasol – A technical memorandum. Congress of the
United States. WA D.C. 80 pp. Okanogan-Wenatchee National Forest. 2008. Tonasket RD fall prescribed burning.
http://www.fs.fed.us/r6/wenatchee/news/2008/09/02/index.shtml
Oliver , C.D., L.L. Irwin, and W.H. Knapp. 1994. Eastside forest management practices: historical overview, extent of their application, and their effects on sustainability of ecosystems. Gen. Tech. Rep. PNW-GTR-324. USDA Forest Service. PNW Res. Sta. Portland, OR. 73 pp. (Everett, Richard L., assessment team leader; Eastside forest ecosystem health assessment; Hessburg, Paul F., science team leader and tech. ed., Volume III: assessment.) http://www.treesearch.fs.fed.us/pubs/6294
178
Omi, P.N., & E.J. Martinson. 2002. Effect of fuels treatment on wildfire severity. Joint Fire Sciences Program Report. http://www.warnercnr.colostate.edu/frws/research/westfire/FinalReport.pdf
Oneil, E. 2007. Changes in landscape level carbon polls over time: Appendix 2. Final report review draft.
In: (Johnson, L., B. Lippke, and E. Oneil eds) CORRIM: Phase II final report module A: Forest Resources Inland West. Seattle WA.
Oneil, E. 2006. Developing Stand Density Thresholds to Address Mountain Pine Beetle Susceptibility in
Eastern Washington Forests, PhD Dissertation, University of Washington, Seattle, 99pp. http://www.ruraltech.org/pubs/theses/oneil/phd/oneil_dissertation.pdf
Oregon. 2007. Oregon Biomass Energy Program. Oregon’s Biomass Energy Resources.
http://www.oregon.gov/ENERGY/RENEW/Biomass/resource.shtml Oregon Forest Resources Institute (OFRI). http://www.oregonforests.org/ Oregon Forest Resources Institute (OFRI). 2006. Biomass Energy and Biofuels from Oregon’s Forests.
20 pp. www.oregonforests.org/media/pdf/Biomass_highlights.pdf Organization for Economic Co-operation and Development (OECD)/ International Energy Agency (IEA).
2005. Resources to Reserves: Oil & gas technologies for the energy markets of the future. Paris, FR. 125 pp. http://www.iea.org/textbase/publications/free_new_Desc.asp?PUBS_ID=1568
Organization for Economic Co-operation and Development (OECD). 2001. Strategies for Sustainable
Development. The Development Assistance Committee (DAC) Guidelines. Paris, FR. 75 pp. http://www.oecd.org/document/40/0,3343,en_2649_34421_2670312_1_1_1_1,00.html
Orth, J. 2008. Personal Communication. Mr. Orth is the Substation, Planning, and Automation Supervisor
for Grays Harbor Public Utility District #1. Pacala, SW, et al. 2001. Consistent Land- and Atmosphere-Based U.S. Carbon Sink Estimates. Science
292:2316-2320. Paltsev, S., J.M. Reilly, H.D. Jacoby, A.C. Gurgel, and others. 2007. Assessment of U.S. Cap-and-Trade
Proposals. Massachusetts Institute of Technology Joint Program on the Science and Policy of Global Change. Report 146. Cambridge, MA. 66 pp. http://web.mit.edu/globalchange/www/MITJPSPGC_Rpt146.pdf
Parker, L. 2006. Climate Change: The European Union’s Emissions Trading System (EU-ETS).
Congressional Research Service (CRS) Report for Congress. 23 pp. http://fpc.state.gov/documents/organization/70317.pdf
Parson, E.A., P.W. Mote, A. Hamlet, N. Mantua, A. Snover, W. Keeton, E. Miles, D. Canning and K. Gray
Ideker. 2001. Potential Consequences of Climate Variability and Change for the Pacific Northwest. Climate Change Impacts on the United States: The Potential Consequences of Climate Variability and Change. Ch. 9, pp 247-280. Report for the US Global Change Research Program. Cambridge University Press, Cambridge, UK. http://www.usgcrp.gov/usgcrp/nacc/pnw-mega-region.htm
Partridge, C. and S. Bernath. 2008. Forest Sector Workgroup on Climate Change Mitigation – Final
Report. 44 pp. http://www.ecy.wa.gov/climatechange/2008FAdocs/11241008_forestreportversion2.pdf
Pate, R. M. Hightower, C. Cameron, and W. Einfeld. 2007. Overview of Energy-Water Interdependencies
and Emerging Energy Demands on Water Resources. Sandia National Lab. Report SAND 2007-1349C. Los Alamos, NM.
179
Peelle, E. 2000. Biomass Stakeholder Views and Concerns: Environmental Groups and Some Trade
Associations. US DOE Oak Ridge National Laboratory. Oak Ridge, TN. 55 pp. http://bioenergy.ornl.gov/reports/misc/stakeholder.html
Pellet Fuels Institute. Pellet Fuel: The wider world of pellet fuel.
http://www.pelletheat.org/3/commercial/commercialBrochure3.pdf Pennsylvania Department of Conservation and Natural Resources (PDCNR). 2008. Guidance on
Harvesting Wood for Energy in Pennsylvania. 50 pp. http://www.dcnr.state.pa.us/PA_Biomass_guidance_final.pdf
Perez-Garcia, J. 2007. Forest Products Use of Roadways and Transload Facilities in Washington. Report
prepared for the WA Dept. of Trans. Olympia, WA. 21 pp. Perez-Garcia, J., B. Lippke, J. Comnick, and C. Manriquez. 2005. An Assessment of Carbon Pools,
Storage, and Wood Products Market Substitution Using Life-Cycle Analysis Results. Wood Fiber Sci. 37 (Dec. 2005): 140-148.
Perez-Garcia, J. 2005. Resource Inventory, Market Assessment and Analysis for Forest Products in
Clallam and Jefferson Counties. Report to Clallam County Economic Development Council. Center for International Trade in Forest Products. University of Washington. Seattle, WA. 28 pp.
Perlack, R.D. et al. 2005. Biomass as Feedstock for a Bioenergy and Bioproducts Industry: The Technical
Feasibility of a Billion-Ton Annual Supply. DOE/GO-102005-2135. Oak Ridge National Laboratory, Oak Ridge, TN. 60 pp. http://feedstockreview.ornl.gov/pdf/billion_ton_vision.pdf
Peterson, D., M. Johnson, D. McKenzie, J. Agee, T. Jain, E. Reinhardt. 2005. Forest structure and fire
hazard in dry forests of the western United States. Gen. Tech. Rep. GTR-PNW-628. USDA Forest Service, PNW Research Station. 30 pp. http://www.earthscape.org/r1/ES16488/usda_forest%20structure.pdf
Pethokoukis, J. 2009. Do we need an energy “Manhattan Project”? US News and World Report. Feb. 8,
2009. http://www.usnews.com/blogs/capital-commerce/2008/05/30/do-we-need-an-energy-manhattan-project.html
Pfilf, R.J., J.F. Marker and R.D. Averill. 2002. Forest health and fire: An overview and evaluation. National
Association of Forest Service Retirees. Chantilly, VA. 40pp. http://www.fsx.org/files/NAFSRforesthealth.pdf
Phillips, S., A. Aden, J. Jechura, D. Dayton, and T. Eggeman. 2007. Thermochemical Ethanol via Indirect
Gasification and Mixed Alcohol Synthesis of Lignocellulosic Biomass. NREL Tech Rep. NREL/TP-510-41168. Golden, CO. 125 pp. http://www.nrel.gov/docs/fy07osti/41168.pdf
Phuleria, H.C., P.M. Fine, Y. Zhu, and C. Sioutas. 2005. Air impacts of the October 2003 Southern
California wildfires. Journal of Geophys. Res. 110. Pidwirny, M. 2006. The Greenhouse Effect. In: Fundamentals of Physical Geography, 2nd Edition.
University of British Columbia. http://www.physicalgeography.net/fundamentals/contents.html Pintér, L., P. Hardi and P. Bartelmus. 2005. Indicators of Sustainable Development: Proposals for a Way
Forward. Discussion Paper Prepared under a Consulting Agreement on behalf of the UN Division for Sustainable Development. United Nations Division for Sustainable Development. NY, NY. 42 pp. http://www.iisd.org/pdf/2005/measure_indicators_sd_way_forward.pdf
Point Carbon. http://www.pointcarbon.com/
180
Polagye, B.L., K.T. Hodgson, and P.C. Malte. 2007. An economic analysis of bio-energy options using
thinning from overstocked forests. Biomass and Bioenergy 31(2007):105-125. Pollet, J., P.N. Omi. 2002. Effect of thinning and prescribed burning on crown fire severity in ponderosa
pine forests. International Journal of Wildland Fire 11:1-10. Prescott, J. 2009. Market Outlook for Renewable Energy. Presentation to: The Business of Renewable
Energy Conference. Portland, OR. Apr. 16, 2009. http://www.nebc.org/content.aspx?pageid=43 Preston, J. 1907. Alcohol engines to replace gasoline engines. Scientific American. 396. Prins, M.J., K.J. Ptasinski, F.J.J.G. Jansen. 2006. Torrefaction of wood – Part I. Weight loss kinetics. J.
Anal. Appl. Pyrolysis. 77: 28-34. Prins, M.J., K.J. Ptasinski, F.J.J.G. Jansen. 2006. Torrefaction of wood – Part II. Analysis of products. J.
Anal. Appl. Pyrolysis. 77: 35-40. Profita, C. 2009. Economy falls like timber. The Daily Astorian. Feb. 25, 2009.
http://www.dailyastorian.com/main.asp?SectionID=2&SubSectionID=398&ArticleID=58595&TM=69307.48
Pyne, S.J. 1997. America's Fires: Management on Wildlands and Forests. Forest History Society.
Durham, NC. 54 pp. Pyne, S.J. 1983. Indian Fires: The fire practices of North American Indians transformed large areas from
forest to grassland. Natural History. 92(2). Pyne, S.J. 1982. Fire in America; A Cultural History of Wildland and Rural Fire. Princeton Univ. Press.
654 pp. Quick, G.R. 1989. In: Oil Crops of the World. G. Robbelen, R.K. Downey, A. Ashri (eds). McGraw-Hill
Publishing Co. NY,NY. 533 pp. Quigg, B. 2009. Personal Communication. Mr. Quigg is the CEO of Grays Harbor Paper Company. Quiggin, J. 2006. Stern and the critics on discounting. School of Economics and School of Political
Science and International Studies. University of Queensland, AU. 18 pp. http://johnquiggin.com/wp-content/uploads/2006/12/sternreviewed06121.pdf
Quincy Library Group, CA Energy Commission, National Renewable Energy Lab. and others. 1997.
Northeast California Ethanol Manufacturing Feasibility Study. 38pp. http://www.p2pays.org/ref/38/37732.pdf
Radke, L.F. et al. 1990. Airborne monitoring and smoke characterization of prescribed fires on forest lands in western Washington and Oregon. Gen. Tech. Rep. PNW-GTR-251.USDA Forest Service, PNW Res. Sta. Portland, OR. 81 pp. http://www.treesearch.fs.fed.us/pubs/5623
Ramm, G. 2007. Washington Gas and Diesel Distributors. Testimony to the Technology, Energy, and Communications Committee of the Washington State House of Representatives. Nov. 27, 2007. Mr. Ramm is the President of the Inland Oil Company and a board member of the Petroleum Marketers Association of America.
181
Randle, D. 2007. Personal Communication. Mr. Randle is the Forest Manager for the San Carlos Apache Tribe. The San Carlos manage 840,000 acres of tribal forestlands and operate a tribally-owned saw mill in San Carlos, AZ.
Range Fuels. 2007. US Department of Energy awards Range Fuels up to $76 million.
http://www.rangefuels.com/US-Department-of-Energy-Awards-Range-Fuels-up-to-76-million-Grant Rauch, J. 2002. A higher gas tax is the answer. Who will ask the question? Natl. Jour. 34(6) 371-372. Raymer, A.K.P. 2006. A comparison of avoided greenhouse gas emissions when using different kinds of
wood energy. Biomass and Bioenergy. 30(7): 605-617. Raymond, C.L. and D.L. Peterson. 2005. Fuel treatments alter the effects of wildfire in a mixed-evergreen
forest. Can. Journal of For. Res. 35(12):2981-2995. Reed, S. 2006. Initiative Measure 937. http://vote.wa.gov/Elections/Measure.aspx?a=937&c=1 Reidy, S. 2008. Credit crisis hits biofuels industry. Biofuels Business. Nov/Dec 2008:54-57. Renewable Energy World (REW). 2008. Time for stability: an update on international wood pellet
markets. http://www.renewable-energy-world.com Renewable Energy World (REW). 2006. Why pellets are packing the power.
http://www.renewable-energy-world.com Renewable Fuels Association (RFA). Ethanol Facts: Environment.
http://www.ethanolrfa.org/resource/facts/environment/ Renewable Fuels Association (RFA). 2008. Changing the Climate; Ethanol Industry Outlook 2008. 17 pp.
http://www.ethanolrfa.org/objects/pdf/outlook/RFA_Outlook_2008.pdf Renewable Natural Resources Foundation (RNRF). 2003-4. Federal natural resource agencies confront
an aging workforce and challenges to their future roles. Renewable Resources Journal. 2 (14). www.rnrf.org
Research and Innovative Technology Administration (RITA). 2008. Overview of US petroleum
production, imports, exports, and consumption. US DOT. http://www.bts.gov/publications/national_transportation_statistics/
Resource Innovations. No Date. Wood Heat Solutions: A community Guide to Biomass Thermal Projects.
University of Oregon. Eugene, OR. 31 pp. http://ri.uoregon.edu/documents/biomass_lowres.pdf Retsina, T. and V. Pylkkanen. 2008. Evaluation of wood-based biorefinery options for pulp and paper
mills. Tappi Journal. (March 2008):10-22. Richards, B. 2008. Seattle’s recycling program runs into plunging prices. Crosscut. Nov. 26, 2008.
http://crosscut.com/2008/11/26/energy-utilities/18663/ Richards,D.J. and G. Pearson. 1998. The Ecology of Industry. National Academy of Engineering. National
Academy Press. WA. D.C. 160 pp. Richter, K. 1998. Life cycle assessment of wood products. In: (Kohlmaier, G.H.,M. Weber and R.A.
Houghton eds) Carbon dioxide in forestry and the wood industry. Springer-verlag, Berlin, Germany. 219-248.
182
Riener, L. 2009. Personal Communication. Ms. Riener is the Environmental Protection Manager for the Quinault Indian Nation.
Rigdon, P. 2008. Personal Communication. Mr. Rigdon is the Director of Natural Resources for the
Yakama Nation. RISI. 2008a. Wood Biomass Market Report. Sept. 2008 1(0). www.risiinfo.com RISI. 2008b. The Emerging Biomass Industry: Impact on Wood Fiber Markets. www.risiinfo.com Rittmaster, R., W.L. Adamowicz, B. Amiro, and R.T. Pelletier. Economic Analysis of health effects from
forest fires. Can. Jour. For. Res. 36: 868-877. Robbins, A and J. Perez-Garcia 2004. Consumer willingness to pay for renewable building materials: an
experimental choice analysis and survey. Working Paper 96. Center for International Trade in Forest Products (CINTRAFOR). College of Forest Resources, University of Washington, Seattle, WA. 56 pp. http://www.cintrafor.org/RESEARCH_TAB/links/WP/WP96.htm
Roberts, P. 2004. The End of Oil: On the Edge of a Perilous New World. Houghton Mifflin Company.
Boston, MA and NY, NY. 418 pp. Robichaud, P.R. and T.A. Waltrop. 1994. A comparison of surface runoff and sediment yields from low-
and high-severity site preparation burns. Water Res. Bull. 30(1):27-34. Rogers, L.W. and A. Cooke. 2009. The Washington State Forestland Database (2007 Version,
Release1). Digital Data. Feb. 2009. University of Washington. Seattle, WA. http://www.ruraltech.org/projects/wrl/fldb/pdf/The_2007_Washington_State_Forestland_Database.pdf
Rosillo-Calle, F., P. de Groot, S. L. Hemstock, J. Woods. 2007. The Biomass Assessment Handbook;
Bioenergy for a Sustainable Environment. Earthscan. Sterling, VA. 269 pp. Rubin, O.D., M. Carriquiry, and D.J. hayes. 2008. Implied Objectives of U.S. Biofuels Subsidies. Working
Paper 08-WP 459. Center for Agricultural and Rural Development. Iowa State University. Ames, Iowa. 31 pp. http://www.econ.iastate.edu/research/webpapers/paper_12866.pdf
Rummer, B. a. Options for Transporting Biomass. USDA Forest Service.
http://www.srs.fs.fed.us/forestops/presentations/biomasstransport.pdf Rummer, B. 2007a. Biomass Harvesting and Transportation. USDA Forest Service.
www.eng.auburn.edu/altenergy/ppt/Rummer-forest.ppt Rummer, B. 2007b. Biomass Harvesting and Transportation. USDA Forest Service.
www.fpl.fs.fed.us/tmu/2007safconvention/2007safconvention--rummer.ppt Rummer, B. et al. 2003. A Strategic Assessment of Forest Biomass and Fuel Reduction Treatments in
Western States. USDA Forest Service, Research and Development and the Western Forestry Leadership Coalition. 18pp. http://www.fs.fed.us/research/pdf/Western_final.pdf
Ruth, M., D. Coelho, and D. Karetniko. 2007. The US Economic Impacts of Climate Change and the
Costs of Inaction. A Review and Assessment by the Center for Integrative Environmental Research (CIER). University of Maryland. College Park, MD. 48 pp. http://www.cier.umd.edu/climateadaptation/
Ruth, R.H. and A.S. Harris. 1975. Forest Residues in Hemlock-Spruce Forests of the Pacific Northwest
and Alaska – A State-of-Knowledge Review with Recommendations for Residue Management. USDA Forest Service. Gen. Tech. Rep. PNW-39. PNW Forest and Range Experiment Sta. Portalnd, OR. 52 pp. http://www.treesearch.fs.fed.us/pubs/25372
183
Ryan, J. 2002. Developing and Deploying Renewable Energy and Combined Heat & Power Technologies
– A Role for Washington Industry. Technology and Policy Recommendations. WSU Cooperative Extension Energy Program. Olympia, WA. 10 pp. plus appendices.
Saarinen, V. 2006. The effects of slash and stump removal on productivity and quality of forest
regeneration operations—preliminary results. Biomass and Bioenergy 30(4):359-356. Saddler, J. and W. Mabee. 2007. Choosing biorefining platforms for the commercialization of the
biomass-to-ethanol process. IEA Bioenergy Update 26. Technology Report task 39. Biomass and Bioenergy 31(4):1-5.
Sample, V. A. 2007. Ensuring Forest Sustainability in the Development of Wood-based Bioenergy: A
National Dialogue. Pinchot Institute for Conservation. 10pp. http://pinchot.org/current_projects/national_dialogue/
Sampson, R.N., M. Smith, and S. Gann. 2001. Western Forest Health and Biomass Energy Potential. A
Report to the Oregon Office of Energy. 53pp. http://www.oregon.gov/ENERGY/RENEW/Biomass/forest.shtml
Sampson, N. and D.Adams, eds. 1994. Assessing Forest Ecosystem Health in the Inland West. Journal
of Sustainable Forestry, Vol.2 No 1-4. Samuelson, R.J. 2005. Why Cheap Gas is a Bad Habit. Newsweek. Sept. 19. Sandberg, D.V., R.D. Ottmar, J.L. Peterson, and J. Core. 2002. Wildland fire on ecosystems: effects of
fire on air. Gen. Tech. Rep. RMRS-GTR-42-vol. 5. USDA Forest Service, Rocky Mountain Res. Sta. Ogden, UT. 79 pp. http://www.fs.fed.us/rm/pubs/rmrs_gtr042_5.pdf
Sandberg, D.V., R.D. Ottmar, G.H. Cushon. 2001. Characterizing fuels in the 21st century. International
Journal of Wildland Fire 10: 381-387. Sandia National Laboratory and General Motors’ Research and Development Center. 2009. 90-Billion
Gallon Biofuel Deployment Study. US DOE. Livermore, CA. http://hitectransportation.org/news/2009/Exec_Summary02-2009.pdf http://www.sandia.gov/news/resources/releases/2009/biofuels_study.html
Sapkota et al. 2005. Impact of the 2002 Canadian forest fires on particulate matter air quality in Baltimore
City. Env. Sci. & Tech. 39(1):24-32. Sathre, R. and J. O’Connor. 2008. A Synthesis of Research on Wood Products and Greenhouse gas
Impacts. FORINTEK Tech. Rep. TR-19. Vancouver and Quebec City, Canada. 74 pp. Sathre, R. 2007. Life Cycle Energy and Carbon Implications of Wood-based Products and Construction.
Doctoral Thesis. Mid Sweden University. Östersund, Sweden. 115 pp. Scahill, J. 2003. Biomass to Energy: Present Commercial Strategies and Future Options. US DOE
National Bioenergy Center. Schackenbach, J., R. Vollaro, and R. Forte. 2006. Fundamentals of Successful Monitoring, Reporting,
and Verification under a Cap-and-Trade Program. Air & Waste Manage. Assoc. 56:1576–1583. http://www.epa.gov/airmarkt/cap-trade/docs/fundamentals.pdf
Scheely, R. 2005. Personal Communication. Mr. Scheely is the Maintenance Supervisor for the Darby,
Montana School District.
184
Schlamadinger B. and G. Marland. 1996. The role of forest and bioenergy strategies in the global carbon cycle. Biomass and Bioenergy. 10(5/6): 275-300.
Schneider, S.A. 1983. The Oil Price Revolution. Johns Hopkins University Press. Baltimore, MD.
London, UK. 631 pp. Schreiber, J. et al. 2005. Smoke gets in your eyes; outdoor wood boilers in New York State. New York
Environmental Protection Bureau. Albany, NY. 32 pp. http://www.woodheat.org/technology/NYSOBreport.pdf
Scientific Applications International Corporation (SAIC). 2006. Life Cycle Assessment: Principles and
Practice. EPA/600/R-06/060. Reston, VA. 80 pp. http://www.epa.gov/nrmrl/lcaccess/pdfs/600r06060.pdf
Searchinger, T. et al. 2008. Use of US croplands for biofuels increases greenhouse gasses through
emissions from land-use change. Science. 319(5867): 1238-1240. http://www.sciencemag.org/cgi/content/full/319/5867/1238
Seattle Times. 2008. Development credits preserve green future. Dec. 12,2008.
http://seattletimes.nwsource.com/html/editorialsopinion/2008505202_edit14plum.html Shapouri, H. and P. Gallagher. 2005. USDA’s 2002 Ethanol Cost-of-Production Survey. USDA. Ag Econ
Rep No. 841. 19 pp. http://www.usda.gov/oce/reports/energy/USDA_2002_ETHANOL.pdf Shapouri, H. and A. McAloon. 2004. The 2001 net energy balance of corn ethanol. UDSA. WA. D.C. 6 pp.
http://www.ethanol-gec.org/net-bal-corn-eth-2001.pdf Sheehan et al. 1998. Life Cycle Inventory of Biodiesel and Petroleum Diesel. USDA and USDOE. 286 pp.
http://www.nrel.gov/docs/legosti/fy98/24089.pdf Shelly, J.R., F.C. Beall, D.E. Mocjus Lubin. 2000. Utilization Options for Woody Biomass. University of
California Forest Products Laboratory. Richmond, CA. 73 pp. Shenandoah, J. and R. Kimmerer. 2007. A University /Tribal partnership for education outreach and
research in plant restoration. In proceedings: Sharing Indigenous Knowledge; An international dialogue on sustainable development. College of Menominee Nation, Sustainable Development Institute. Keshena, WI. http://www.sharingindigenouswisdom.org/presentations/default.asp
Shepard, J.P. 2006. Water quality protection in bioenergy production: The US system of forestry Best
Management Practices. Biomass and Bioenergy. 30:378-384. Shifley, S.R. 2006. Sustainable forestry in the balance. Jour. of For. 104(4): 187-195. Silveira, S. (ed) 2005. Bioenergy: Realizing the Potential. Elsevier. Swedish Energy Agency,
Eskilstuna, Sweden. 245 pp. Simmons, T. 2007. New life for paper mills: Ethanol plants. The News & Observer. Raleigh, NC. Sept 27,
2007. http://www.newsobserver.com/business/story/717702.html Simmons, M.R. 2005. Twilight in the Desert: The Coming Saudi Oil Shock and the World Economy. John
Wiley and Sons, Inc. Hoboken, NJ. 422 pp. Singer, C.N. (ed) 2008. Nature, not human activity, rules the climate: Summary for Policymakers of the
Report of the Nongovernmental International Panel on Climate Change. Heartland Institute. Chicago. IL. 40 pp. http://www.heartland.org/custom/semod_policybot/pdf/22835.pdf
185
Sissine, F. 2007. Energy Independence and Security Act of 2007: A Summary of Major Provisions. Congressional Research Service Report for Congress. 27 pp. http://energy.senate.gov/public/_files/RL342941.pdf
Siveira, S. (ed). 2005. Bioenergy – Realizing the Potential. Swedish Energy Agency. Eskilstuna, Sweden.
300 pp. Smith et al. 2007. 25X’25; Charting America’s Energy Future. 64 pp. http://www.25x25.org/ Smith, K. 2007. The Carbon Neutral Myth; Offset Indulgences for Your Climate Sins. The Carbon Trade
Watch. Transnational Institute. The Nertherlands. 79 pp. http://www.tni.org/detail_pub.phtml?&know_id=56
Smith, T.M., M. Fischlein, S. Suh, and P. Huelman. 2006. Green Building Rating Systems: A Comparison
of the LEED and Green Globes Systems in the US. University of Minnesota. St. Paul, MN. 61 pp. http://www.thegbi.org/gbi/Green_Building_Rating_UofM.pdf
Smith, W.B., P.D. Miles, J.S. Vissage, and S.A. Pugh. 2003. Forest Resources of the United States,
2002. USDA FS Gen. Tech. Rep. NC-241. North Central Res. Sta. St Paul, MN. 47 pp. http://www.ncrs.fs.fed.us/pubs/viewpub.asp?key=1987
Snell, J.A.K. and J.K. Brown. 1980. Handbook for predicting residue weights of Pacific Northwest
conifers. Gen. Tech. Rep. PNW-GTR-103.USDA Forest Service, PNW Res. Sta. Portland, OR. 51 pp. http://www.treesearch.fs.fed.us/pubs/7525
Snider, G., P. Daugherty, and D. Wood. 2006. The irrationality of continued fire suppression: An avoided
cost analysis of fire hazard reduction treatments verses no treatment. Journal of Forestry. 104:8. 431-437.
Soloman, B.D., J.R. Barnes, K.E. Halvorsen. 2007. Grain and cellulosic ethanol: history, economics, and
energy policy. Biomass and Bioenergy 31: 416-425. Spartz, J. 2009. From forest to fuel: converting woody biomass to energy. USDA Forest Products
Laboratory. Newsline 8(1):1/3. Spath, P.L. and D.C. Dayton. 2003. Preliminary screening- technical and economic assessment of
synthesis gas to fuels and chemicals with an emphasis on the potential for biomass-derived syngas. National Renewable Energy Laboratory. Golden, CO. 142 pp. http://www.nrel.gov/docs/fy04osti/34929.pdf
Spies. T.A. et al. 2002. Summary of: Workshop on development of old-growth Douglas-fir forests along
the Pacific Coast of North America: A Regional Perspective. Nov. 7-9, 2001. H.J. Andrews Experimental Forest: Blue River, OR.
Standish, J.T., G.H. Manning, J.P. Demaerschalk. 1985. Development of biomass equations for British
Columbia tree species. Can. For. Serv. Pac. For. Res. Cent. Inf. Rep. BC-X-264. 47 pp. Stanton, B., J. Eaton, J. Johnson, D. Rice, B. Schuette, B. Moser. 2002. Hybrid poplar in the Pacific
Northwest: the effects of market-driven management. Journal of Forestry 100 (4):28-33 Stanton, B. et al. 2002. Hybrid Poplar in the Pacific Northwest: The Effects of Market-Driven
Management,” Journal of Forestry. 100(4):28-33. State Energy Conservation Office of Texas (SECO). MTBE and Ethanol.
http://www.seco.cpa.state.tx.us/re_ethanol_mtbe.htm
186
Stein, S.M., R.E. McRoberts, R.J. Alig, and others. 2005. Forests on the Edge: Housing Development on America’s Private Forests. USDA Forest Service. PNW Res. Sta. PNW-GTR-636. Portland,OR. 16 pp. http://www.fs.fed.us/openspace/fote/fote-6-9-05.pdf
Stern, N. 2006. Stern Review: The Economics of Climate Change. HM Treasury. Cambridge University
Press. Cambridge, UK. 575 pp. plus appendices. http://www.hm-treasury.gov.uk/sternreview_index.htm
Sterner, T. and U.M. Persson. 2007. An Even Sterner Review: Introducing relative prices into the
discounting debate. RFF DP 07-37. Resources for the Future. 21 pp. http://www.rff.org/Documents/RFF-DP-07-37.pdf
Stewart, O.C. 2002: The effects of burning of grasslands and forests by aborigines the world over. In:
Lewis, H.T. and Anderson, M.K. (eds). Forgotten Fires: Native Americans and the transient wilderness. University of Oklahoma Press, 67–338.
Stiles, D., S. Jones, R. Orth, B. Saffell, D. Stevens, and Y. Zhu. 2008. Biofuels in Oregon and
Washington: A Business Case Analysis of Opportunities and Challenges. Pacific Northwest National Laboratory. Batelle. US DOE Office of Energy Efficiency and Renewable Energy (EFRE). 101 pp. http://www.pnl.gov/biobased/docs/biomass_business_case.pdf
Stine, D.D. 2008. The Manhattan Project, the Apollo Program, and Federal Energy Technology R&D
Programs: Comparative Analysis. Congressional Research Service (CRS) Report to Congress. WA. D.C. 11 pp. http://www.fas.org/sgp/crs/misc/RL34645.pdf
Stokes, B.J. 1992. Harvesting small trees and forest residues. Biomass and Bioenergy 2(1):131–47. Stokes, M.A. and J.H. Dieterich (tech. coord.). 1980. Proceedings of the fires history workshop. Oct. 20-
24, 1980. Tucson, AZ. USDA Forest Service. Gen. Tech. Rep. RM-81. Rocky Mtn. For. And Range Exp. Sta. Fort Collins, CO. 142 pp.
Stoltzfus, E.K. 2006. Biomass Electricity in California. University of California. Berkeley, CA. 42 pp.
http://erg.berkeley.edu/erg/people/Stolzfus%20masters%20project%202.pdf Streck, C., R. O’Sullivan, T. Janson-Smith, and R. Tarasofsky (eds). 2008. Climate Change and Forests –
Emerging Policy and Market Opportunities. Chatham House. London. Brookings Institution Press. WA. D.C. 346 pp.
Stupak, I. et al. 2007. Sustainable utilization of forest biomass for energy-Possibilities and problems:
policy, legislation, certification, and recommendations and guidelines in the Nordic, Baltic, and other European countries. Biomass and Bioenergy 31(2007): 666-684.
Suttles, W. and K. Ames. 1997. Pre-European History. In: The Rainforests of Home: Profile of a North
American Bioregion. (Schoonmaker, B., B. von Hagen, and E.C. Wolf eds). Island Press. WA. D.C. 431 pp.
Swann, J. 2008. Personal communication. Mr. Swan is the Director of the Wood Pellet Association of
Canada. www.pellet.org Swann, J. and S. Melin. 2008. Wood Pellet Export: History, Opportunities, Challenges. Presentation to
the Small Wood Conference. 2008. http://www.forestprod.org/smallwood08swaan.pdf Swanson, M.E. 2008. Comparison of the impacts of forest practices regulations on carbon storage in
Washington, Oregon, California, and British Columbia. Report to the WA Dept of Ecology. College of Forest Resources. University of Washington. Seattle, WA. 29 pp. http://www.ecy.wa.gov/climatechange/2008CTdocs/10102008_forestpractices_carbonstorage.pdf
187
Swanson, R.H. 1987. Applying hydrological principles to the management of sub-alpine forests for water
supply. In: management of sub-alpine forests building upon 50 years of research. Gen. Tech. Rep. GTR-RM-119. USDA Forest Service. Rocky Mtn. For. & Range Sta. Fort Collins, CO.
Tans, P. NOAA/ESRL. www.esrl.noaa.gov/gmd/cgg/trends Tappeiner, J.C., D. Huffman, D. Marshall, T.A. Spies, and J.D. Bailey. 1997. Density, ages, and growth
rates in old-growth and young-growth forests in coastal Oregon. Canadian Journal of Forest Research 27: 638-648.
Tattersall, J.N. 1960. The Economic Development of the Pacific Northwest to 1920. PhD Thesis.
University of Washington. Seattle, WA. 303 pp. Taylor, R. 2000. Wood markets – the solid wood products outlook, 2000 to 2004. Vancouver, BC:
R.E.Taylor and Associates: 385 p. Tellus Institute. 2002. Clean Electricity Options for the Pacific Northwest. A Report to the NW Energy
Coalition. 52pp. plus appendices. http://www.nwenergy.org/outreach/docs/Tellus_PNW_Oct15.pdf
Tennery, M. 2006. University of Idaho heats with wood. 5 pp.
http://www.fuelsforschools.info/pdf/FFS-U_of_I_Wood_Chip_Story.pdf The President’s Council on Sustainable Development. 1999. Towards a Sustainable America:
Advancing prosperity, opportunity and a healthy environment in the 21st century. 170 pp. http://clinton2.nara.gov/PCSD/Publications/tsa.pdf
The White House. 2008. President Bush attends the Washington International Renewable Energy
Conference 2008. The President’s address to delegates. http://www.whitehouse.gov/news/releases/2008/03/print/20080305.html
The White House. 2006. President Bush delivers the State of the Union Address.
http://www.whitehouse.gov/news/releases/2006/01/20060131-10.html Thorp, B.A. and M. Akhtar. 2009. The best use of wood. Paper360° Jan/Feb 2009:26-29. Thorp, B. 2005. Transition of mills to biorefinery model creates new profit stream. Pulp and Paper 79(11):
35. Tijmensen M.J.A., A.P.C. Faaij, C.N. Hamelinck, M.R.M. van Hardeveld. 2002. Exploration of the
possibilities for production of Fischer Tropsch liquids and power via biomass gasification. Biomass & Bioenergy 23:129–52.
Tillman, D., J. Hill, and C. Lehman. 2006. Carbon-negative biofuels from low-input high-diversity
grassland biomass. Science. 314 (5805):1598-1600. http://www.sciencemag.org/cgi/content/full/314/5805/1598
Tillman, D.A. 2000. Co-firing benefits for coal and biomass. Biomass and Bioenergy. 19(6): 363-364. Tol, R.S. and G.W. Yohe. 2006. A review of the Stern Review. World Economics. 7(4): 233-250. Toman, M., J. Griffin, and R.J. Lembert. 2008. Impacts on US Energy Expenditures and Greenhouse
gas Emissions of Increasing Renewable Energy Use. Rand Corporation - Environment, Energy, and Economic Development. 54 pp. http://www.rand.org/pubs/technical_reports/2008/RAND_TR384-1.pdf
188
Träbyggnadskansi, S. 2008. Wood Construction Program in Sweden. Regeringskansliet.
http://www.puuinfo.fi/fi/?__EVIA_WYSIWYG_FILE=11443&name=file Troendle, C.A. 1983. The potential for water yield augmentation from forest management in the Rocky
Mountain Region. Water Resour. Bull. 19:359-373. Trusty, W. 2006. Integrating LCA into LEED Working Group A (Goal and Scope) Interim Report #1.
Athena Institute. 16 pp. http://www.usgbc.org/ShowFile.aspx?DocumentID=2241 Trusty, W. 2006. Integrating LCA into LEED Working Group A (Goal and Scope) Interim Report #1 . WA.,
DC : U.S. Green Building Council. 8 pp. http://www.usgbc.org/ShowFile.aspx?DocumentID=2241 TSS Consultants. 2002. Prineville, Oregon Market Area Fuel Availability Assessment. Central Oregon
Intergovernmental Council. Redmond, OR. 15 pp. Turare, C. 1997. Biomass gasification; technology and utilization. University of Flensberg. Flensberg,
Germany. http://members.tripod.com/~cturare/bio.htm Union of Concerned Scientists (UCS). 2006. How Biomass Energy Works. 6 pp.
www.ucsusa.org/assets/documents/clean_energy/how_biomass_energy_works_factsheet.pdf United Nations Framework Convention on Climate Change (UNFCCC).
http://unfccc.int/essential_background/items/2877.php United Nations Framework Convention on Climate Change (UNFCCC). 2008. CDM Statistics.
http://cdm.unfccc.int/Statistics/index.html United Nations (UN). 2007. Sustainable bioenergy: a framework for decision makers. UN-Energy. 64 pp.
ftp://ftp.fao.org/docrep/fao/010/a1094e/a1094e00.pdf United Nations (UN). 1992. Report of the United Nations Conference on Environment and
Development. Rio Declaration on Environment and Development. Rio de Janiero, Brazil. http://www.un.org/esa/sustdev/documents/agenda21/index.htm
United Nations (UN). 1983. Process of preparation of the Environmental Perspective to the Year 2000
and Beyond. http://www.un.org/documents/ga/res/38/a38r161.htm United States Census Bureau. Foreign Trade Statistics: US International Trade in Goods and Services-
Annual Revision for 2007. http://www.census.gov/foreign-trade/Press-Release/2007pr/final.revisions/
United States Department of Agriculture (USDA). 2008. Draft National Report on Sustainable Forests –
2010. Report to fulfill US commitment to the Montréal Process Working Group on Criteria and Indicators for the Conservation and Sustainable Management of Temperate and Boreal Forests. USDA Forest Service. Arlington, VA. http://www.fs.fed.us/research/sustain/2010SustainabilityReport/documents/draft2010sustainabilityreport.pdf
United States Department of Agriculture Economic Research Council (USDA ERC). 2008. Estimated U.S.
plant nutrient use by selected crops. http://www.ers.usda.gov/Data/FertilizerUse/ United States Department of Agriculture Soil Conservation Service (USDA SCS). 1993. Water Quality
Indicators Guide: Surface Waters. Report by C. Terreland P. Bytnar. WA D.C. 137 pp.
189
United States Department of Energy and the Environmental Protection Agency (DOE/EPA). How can a gallon of gas produce 20 pounds of CO2? http://www.fueleconomy.gov/Feg/co2.shtml
United States Department of Energy (DOE). 2008a. Fact sheet: gas prices and oil consumption would
increase without biofuels. http://www.energy.gov/media/FactSheet__Biofuels_Lower_Gas_Prices.pdf
United States Department of Energy (DOE). 2008b. DOE Selects 3 Small-Scale Biorefinery Projects for
up to $86 Million of Federal Funding in Maine, Tennessee and Kentucky. http://www.energy.gov/6164.htm
United States Department of Energy (DOE). 2008c. 20% Wind Energy by 2030: Increasing Wind Energy’s
Contribution to U.S. Electrical Supply. DOE/GO-102008-2567. 226 pp. http://www1.eere.energy.gov/windandhydro/pdfs/41869.pdf
United States Department of Energy (DOE). 2007a. Technical Guidelines for the Voluntary Reporting
of Greenhouse gas Emissions (1605b). Office of Policy and International Affairs. WA. D.C. 318 pp. and Forestry Appendix 280 pp. http://www.pi.energy.gov/enhancingGHGregistry/
United States Department of Energy (DOE). 2007b. DOE Selects Six Cellulosic Ethanol Plants for Up to
$385 Million in Federal Funding. http://www.energy.gov/news/4827.htm United States Department of Energy (DOE). 2004. Biomass Co-firing in Coal-fired Boilers. 40pp.
http://www1.eere.energy.gov/femp/pdfs/fta_biomass_cofiring.pdf United States Department of Energy (DOE). 2000. Biomass Co-firing: A Renewable Alternative for
Utilities. http://www.nrel.gov/docs/fy00osti/28009.pdf University of Michigan. 2008. Record-setting dead zones predicted for Gulf of Mexico, Chesapeake Bay.
Science Daily. July 1, 2008. http://www.sciencedaily.com/releases/2008/07/080714160000.htm University of Oregon. 2002. Northwest Forest Plan: Authoritative Documents.
http://libweb.uoregon.edu/govdocs/forestpl.html University of Washington. 2009. House of Knowledge. http://www.washington.edu/diversity/hok/ University of Washington (UW). 1996. Hybrid cottonwoods and poplars: Faster than fir.
http://www.washington.edu/research/pathbreakers/1960i.html US Congress. 2008. H.R. 2419. Food, Conservation, and Energy Act 2008.
http://www.govtrack.us/congress/billtext.xpd?bill=h110-2419 US Congress. 2007. H.R. 6. Energy Independence and Security Act 2007.
http://www.govtrack.us/congress/bill.xpd?bill=h110-6 US Congress. 2003. H.R. 1904. The Healthy Forests Restoration Act of 2003.
http://www.govtrack.us/congress/bill.xpd?bill=h108-1904 Van Mantgem, P.J. et al. 2009. Widespread increase of tree mortality rates in the western United States.
Science. 323:521-524. Vattenfall. 2007. The Climate Threat: Can Humanity Rise to the Greatest Challenge of our Times?
Conclusions from Vattenfall’s Climate Survey. Stockholm, Sweden. 31 pp. http://www.vattenfall.com/www/ccc/ccc/Gemeinsame_Inhalte/DOCUMENT/567263vattenfall/P0273929.pdf
190
Viak, A. et al. 2000. Wood Pellets in Europe. http://www.energyagency.at/publ/pdf/pellets_net_en.pdf
Victor, D.G., J. Deutch, and J.R. Schlesinger. 2006. National Security Consequences of US Oil
Dependency. Independent task Force Report No. 58. Council on Foreign Relations. 80 pp. http://www.cfr.org/publication/11683/
VIEWLS. 2005. Shift Gear to Biofuels: results and recommendations from the VIEWLS project. Clear
Views on Clean Fuels (VIEWLS). The European Commission. Netherlands. 60 pp. http://www.risoe.dk/rispubl/NEI/nei-dk-4615.pdf
Virgin, B. 2006. Seattle Steam Switching from Gas to Wood Fuel. Seattle PI. March 31, 2006. Virgin, B and T. Bishop. 2003. Recent lay-offs at area companies. Seattle PI. Jan. 10, 2003.
http://seattlepi.nwsource.com/business/layoff.asp?id=570 Vuorinen, A. 2007. Planning of Optimal Power Systems. Ekoenergo Oy. Espoo, Finland. 309 pp. Wald, M.L. 2007. Costs surge for building power plants. New York Times. World Business. July 10, 2007. Wall, A. and J. Nurmi. 2003. Effects of logging residue removal for bioenergy on soil fertility and nutrient
leaching from the organic soil layer. Unpublished paper. Kannus, Finland: Finish Forest Research Institute. http://www.brdisolutions.com/pdfs/bcota/abstracts/6/401.pdf
Walsh, B. 2008a. Solving the biofuels vs food problem. Time Magazine. Jan. 07, 2008. Walsh, B. 2008b. The trouble with biofuels. Time Magazine. Feb. 14, 2008. Walsh, B. 2008c. Another problem with biofuels? Time Magazine. Mar. 12,2008. Wang, L., C.L. Weller, D.D. Jones, M.A. Hanna. 2008. Contemporary issues in thermal gasification of
biomass and its application to electricity and fuel production. Biomass and Bioenergy 32: 573-581. Wang, S. and L. Baxter. 2007. Comprehensive Investigation of Biomass Fly Ash in Concrete. Presented
at ACERC Annual Conference, Brigham Young University. Washington Agricultural Statistics Service (WASS). 2004. The 2004 Washington Annual Bulletin. Washington Department of Community, Trade, and Economic Development (CTED). 2009. The Green
Economy Jobs Initiative. Olympia, WA. 22 pp. http://www.cted.wa.gov/DesktopModules/CTEDPublications/CTEDPublicationsView.aspx?tabID=0&ItemID=6844&MId=863&wversion=Staging
Washington Department of Community, Trade, and Economic Development (CTED). 2008. Fuel Mix
Disclosure. 2007 Washington State Electric Utility Fuel Mix & 2008 Electric Utility Fuel Mix Reports (2007 Actual Electricity Production Data). http://www.cted.wa.gov/site/539/default.aspx
Washington Department of Community, Trade, and Economic Development (CTED). 2007. Energy
Supply – TWG Teleconference Meeting. http://www.ecy.wa.gov/climatechange/TWGdocs/ene/050307ENEpresentation.pdf
Washington Department of Community, Trade, and Economic Development (CTED). 2005. Renewable
Energy, Energy Efficiency, and Smart Energy Industries. C. Sutter. Olympia, WA. 27 pp. http://www.cted.wa.gov/_CTED/documents/ID_3543_Publications.pdf
191
Washington Department of Ecology (WDOE). 2005. Air Emissions Inventory. http://www.ecy.wa.gov/programs/air/EmissionInventory/AirEmissionInventory.htm
Washington Department of Ecology (WDOE). 1997. Health Effects of Wood Smoke. 28 pp.
http://www.ecy.wa.gov/pubs/92046.pdf Washington Department of Natural Resources (DNR). 2009a. State Trust Habitat Conservation Plan.
Olympia, WA. http://www.dnr.wa.gov/ResearchScience/Topics/TrustLandsHCP/Pages/trust_lands_hcp.aspx
Washington Department of Natural Resources (DNR). 2009b. Forest Practices. Olympia, WA.
http://www.dnr.wa.gov/BusinessPermits/ForestPractices/Pages/Home.aspx Washington Department of Natural Resources (DNR). 2004a. A Desirable Forest Health Program for
Washington’s Forests. Forest Health Strategy Work Group Report. 28pp. plus appendices. http://www.stage.dnr.wa.gov/htdocs/rp/forhealth/fhswgc/pdf/foresthealthreport.pdf
Washington Department of Natural Resources (DNR). 2004b. Habitat Conservation Plan Amendment No.
1. Administrative Amendment to the Northern Spotted Owl Conservation Strategy for the Klickitat HCP Planning Unit. Ellensburg, WA. www.dnr.wa.gov
Washington Department of Natural Resources (DNR). 1998. Our Changing Nature: Natural Resource
Trends in Washington State. Olympia, WA. Washington Department of Transportation (WDOT). 2008. Annual Traffic Reports. Olympia, WA.
http://www.wsdot.wa.gov/mapsdata/tdo/annualtrafficreport.htm Washington International Renewable Energy Conference (WIREC). 2008. President Bush Addresses
WIREC 2008. http://www.wirec2008.gov/wps/portal/wirec2008 Washington State Biofuels Advisory Committee (WSBAC). 2007. Implementing the Minimum Renewable
Fuel Content Requirements. Olympia,WA. 22pp. http://www.bioenergy.wa.gov/BiofuelIncentives.aspx Washington State Legislature. http://www.leg.wa.gov/legislature Washington State Office of Financial Management (WOFM). 2008a. 2007 Data Book.
http://www.ofm.wa.gov/databook/population/pt04.asp Washington State Office of Financial Management (WOFM). 2008b. Transportation Revenue Forecast
Council November 2008 Forecasts. Detailed Schedule Volume 2. http://www.ofm.wa.gov/budget/info/transportationrevenue.asp
Washington State Office of Financial Management (WOFM). 2007. 2007 population Trends. WOFM
Forecasting Division. Olympia, WA. http://www.ofm.wa.gov/pop/poptrends/default.asp Washington State University (WSU). 2007. Forest Health Issues. Washington State University
Cooperative Extension. http://ext.nrs.wsu.edu/forestryext/foresthealth/ Waterman-Hoey, S. and G. Nothstein. 2007. Washington’s Greenhouse Gas Emissions: Sources and
Trends - 2006. WA Dept. of Community, Trade and Economic Development. Olympia, WA. 18 pp. http://www.cted.wa.gov/site/853/default.aspx
Watkins et al. 2007. Human Development Report 2007/2008 - Fighting Climate Change: Human
Solidarity in a Divided World. United Nations Development Program. Palgrave MacMillian. NY,NY. 384 pp. http://hdr.undp.org/en/media/HDR_20072008_EN_Complete.pdf
192
Weitzman, M.L. 2007. A review of the Stern Review on the Economics of Climate Change. Journal of Economic Literature. XLV(Sept): 703-724.
Westerling, A.L., H.G. Hidalgo, et al. 2006. Warming and earlier spring increase western US forest wildfire
activity. Science 313(5789): 940-943. Western Climate Initiative (WCI). http://www.westernclimateinitiative.org/ Western Climate Initiative (WCI). 2009. Overview: The Western Climate Initiative’s Cap-and-Trade
Program Design Recommendations. Overview/Fact Sheet. 2 pp. http://www.westernclimateinitiative.org/WCI_Documents.cfm
Western Climate Initiative (WCI). 2008. Design Recommendation for the WCI Regional Cap-and-Trade
Program. 62 pp. plus appendices. http://www.westernclimateinitiative.org/ewebeditpro/items/O104F21252.pdf
Western Forestry Leadership Coalition (WFLC). 2009. A Framework for Forests and Climate Change:
Western Region Policy Themes, Principles, and Key Approaches. Lakewood, CO. 7 pp. http://www.wflcweb.org/pressandpolicy/policy_statements_resolutions.php
Western Governors Association (WGA). http://www.westgov.org/ Western Governors Association (WGA). 2008a. Transportation Fuels for the Future. 32pp.
http://www.westgov.org/wga/publicat/TransFuels08.pdf Western Governors Association (WGA). 2008b. Strategic Assessment of Bioenergy Development in
the West- Spatial Analysis and Supply Curve Development. University of California. Davis, CA. 86 pp. http://www.westgov.org/wga/initiatives/transfuels/Task%203.pdf
Western Governors Association (WGA). 2008c. Strategic Assessment of Bioenergy Development in the
West- Analysis of Deployment Scenarios and Policy Interactions. WGA and Antares Group Inc. 25 pp. http://www.westgov.org/wga/initiatives/transfuels/Task%204.pdf
Western Governors Association (WGA). 2006. Clean and Diversified Energy Initiative: Biomass Task
Force Report. 65pp. http://www.westgov.org/wga/initiatives/cdeac/Biomass-full.pdf Western Governors Association (WGA). 2001. Conceptual Plans for Electricity Transmission in the West.
59pp. http://www.westgov.org/wga/initiatives/energy/transmission_rpt.pdf Western Regional Climate Center. http://www.wrcc.dri.edu Whitlock, C. and M.A. Knox. 2002. Prehistoric burning in the Pacific Northwest. In: Vale, T.R. ed. Fire,
native peoples, and the natural landscape. Washington, DC: Island Press. 40 pp. Wiedinmyer, C. and J.C. Neff. 2007. Estimates of CO2 from fires in the United States: implications for
carbon management. Carbon Balance and Management 2(10). 12 pp. http://www.cbmjournal.com/content/pdf/1750-0680-2-10.pdf
Wiedinmyer, C. et al. 2006. Estimating emissions from fires in North America for air quality monitoring.
Atmospheric Environment 40(2006):3419–3432 Wikipedia. Cellulosic ethanol history. http://www.thecesite.com/History.html Wikipedia. Wood gas. http://en.wikipedia.org/wiki/Woodgas
193
Wilderness Society. 2003. Cascade Crest Forests: Forest Loss, Habitat Fragmentation, and Wildness. 46 pp. http://www.b-sustainable.org/natural-environment/habitat-fragmentation/Cascade-Crest-Forests.pdf
Wilkerson, J. 2008. Creating a Regional Transfer of Development Rights Program for Central Puget
Sound. CTED. Olympia, WA. 54 pp. http://www.cted.wa.gov/DesktopModules/CTEDPublications/CTEDPublicationsView.aspx?tabID=0&ItemID=6714&MId=944&wversion=Staging
Williams, G.W. 2000. Early fire use in Oregon. Fire Management Today. 60:13-20. Williams, R.H., E.D. Larson, R.E. Katofsky, and J. Chen. 1995. Methanol and hydrogen from biomass for
transportation. Energy for Sustainable Development. 1:152. Wilson, J.S., and C.D. Oliver. 2000. Stability and density management in Douglas-fir plantations.
Canadian Journal of Forest Research 30: 910-920. Wiltsee, G. 2000. Lessons learned from existing biomass power plants. National Renewable Energy
Laboratory. Golden, CO. 143 pp. http://www.nrel.gov/docs/fy00osti/26946.pdf Winistorfer, P., Z. Chen, B. Lippke, N. Stevens. 2005. Energy Consumption and Greenhouse Gas
Emissions Related to the Use, Maintenance, and Disposal of a Residential Structure. In: Special Issue: CORRIM Reports on Environmental Performance of Wood Building Materials. Wood and Fiber Science 37 Dec 2005 (ISSN 0735-6161).
Winter, G. and J.S. Fried. 2000. Homeowner perspectives on fire hazard, responsibility, and management
strategies at the wildland-urban interface. Society & Natural Resources. 13:33-49. Winteringham, F.P.W. 1992. Energy Use and the Environment. CRC Press. Bristol, UK. 192 pp. Wirth, T.E., C.B. Gray, and J.D. Podesta. 2003. The future of energy policy. Foreign Affairs 82(4): 132-
155. Wisconsin Council on Forestry (WCF). 2009. Use of Woody Biomass.
http://council.wisconsinforestry.org/biomass/ http://council.wisconsinforestry.org/biomass/Biomass_Scope_Document_32508.pdf
Wiser, R., S. Pickle, and C. Goldman. 2002. Renewable energy and restructuring: policy solutions for the
financing dilemma. The Electricity Journal. 10(10):65-75. Wolford, T. 2007. Personal Communication. Mr. Wolford is the Director of The Washington Pulp and
Paper Foundation. Wood, J.H, G.R. Long, and D.F. Morehouse. 2004. Long-Term World Oil Supply Scenarios: The Future
Is Neither as Bleak or Rosy as Some Assert. US DOE EIA. http://www.eia.doe.gov/pub/oil_gas/petroleum/feature_articles/2004/worldoilsupply/oilsupply04.html
Woodwell, G.M. and E.V. Pecan (eds). 1972. Carbon and the Biosphere. Brookhaven National
Laboratory Symposium No. 24. Oak Ridge, TN. 392 pp. World Commission on Environment and Development (WCED). 1987. Our Common Future. Oxford
University Press NY,NY. 400 pp. World Growth. 2008. Winners All: How forestry can reduce both climate change emissions and poverty.
55 pp. http://www.worldgrowth.org/assets/File/WG_Forestry_Report_FINAL.pdf
194
Wotawa, G. and M. Trainer. 2000. The influence of Canadian forest fires on pollutant concentrations in
the United States. Science. 288(5464):324-328. Wright, M. and R.C. Brown. 2007. Establishing the optimal sizes of different kinds of biorefineries.
Biofuels, Bioprod. Bioref. 1(3): 191-200. Wright, L., B. Boundy, B. Perlack, S. Davis, and B. Saulsbury. 2006. Biomass Energy Data Book: Edition
1. Energy Efficiency and Renewable Energy US DOE. Oak Ridge National Laboratory. Oak Ridge, TN. 168 pp. http://cta.ornl.gov/bedb/pdf/Biomass_Energy_Data_Book.pdf
Wynsma, B. et al. 2007. Woody Biomass Utilization Desk Guide. USDA Forest Service. National
Technology & Development Program. WA. D.C. 84 pp. http://www.forestsandrangelands.gov/Woody_Biomass/documents/biomass_deskguide.pdf
Xu, W., B.R. Lippke, and J. Perez-Garcia. 2003. Valuing biodiversity, aesthetics, and job losses
associated with ecosystem management using stated preferences. Forest Science. 49(2):247-257. Yacobucci, B.D. 2008. Biofuels Incentives: A Summary of Federal Programs. Congressional Research
Service (CRS) Report for Congress. RL33572. 15 pp. http://ncseonline.org/NLE/CRSreports/08Aug/RL33572.pdf
Yang, C. and M.Oppenheimer. 2007. A “Manhattan Project” for climate change? Climate Change. 80:199-
204. Yergin, D. 1991. The Prize – The Epic Quest for Oil, Money, and Power. Simon and Schuster. NY,NY.
877 pp. Yoder, J., P. Wandschneider, and others. 2008. Biofuel Economics and Policy for Washington State.
Report to the Legislature. School of Economic Sciences, WA State Univ. Pullman, WA. 175 pp. http://www.ses.wsu.edu/research/EnergyEcon.htm.
Zerbe, J. and R. Bergman. 2004. Basic Wood Energy Information. USDA Forest Service, State and
Private Forestry Technology Marketing Unit. Forest Products Laboratory. Madison, WI. 6 pp. http://www.fpl.fs.fed.us/tmu/wood_for_energy/basicenergyinformation.html
Zerbe, J. 2006. Thermal Energy, Electricity, and Transportation Fuels from Wood. Forest Products
Journal. 56(1): 6-14 Zerbe, J.I. 1991. Liquid fuels from wood – ethanol, methanol, diesel. World Res. Review. 3(4): 406-414.
http://www.fpl.fs.fed.us/documnts/pdf1991/zerbe91a.pdf Ziegler and Rankin Families Photographs and Papers. 1900. Museum of History & Industry. Seattle, WA. Zwart, R.W.R., H. Boerrigter, and A. van der Drift. 2006. The impact of biomass pretreatment on the
feasibility of overseas biomass conversion to Fischer-Tropsch products. Energy and Fuels 20: 2192-2197.

195
Appendix
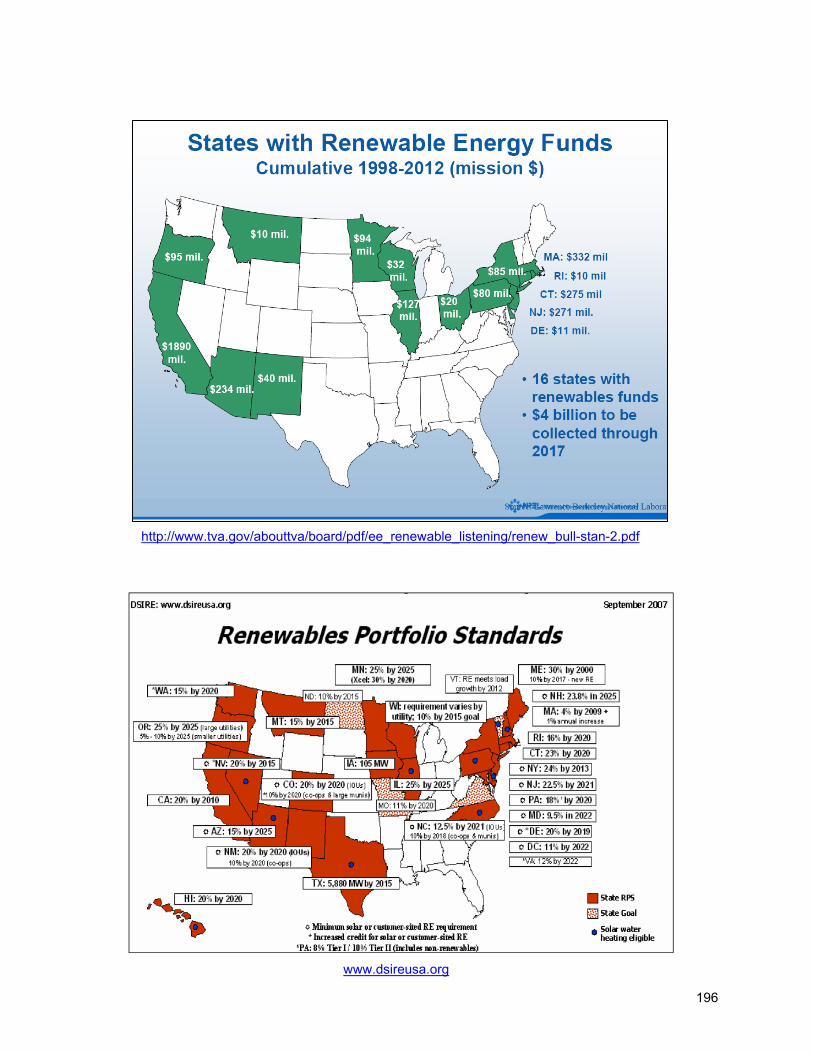
196
http://www.tva.gov/abouttva/board/pdf/ee_renewable_listening/renew_bull-stan-2.pdf
www.dsireusa.org
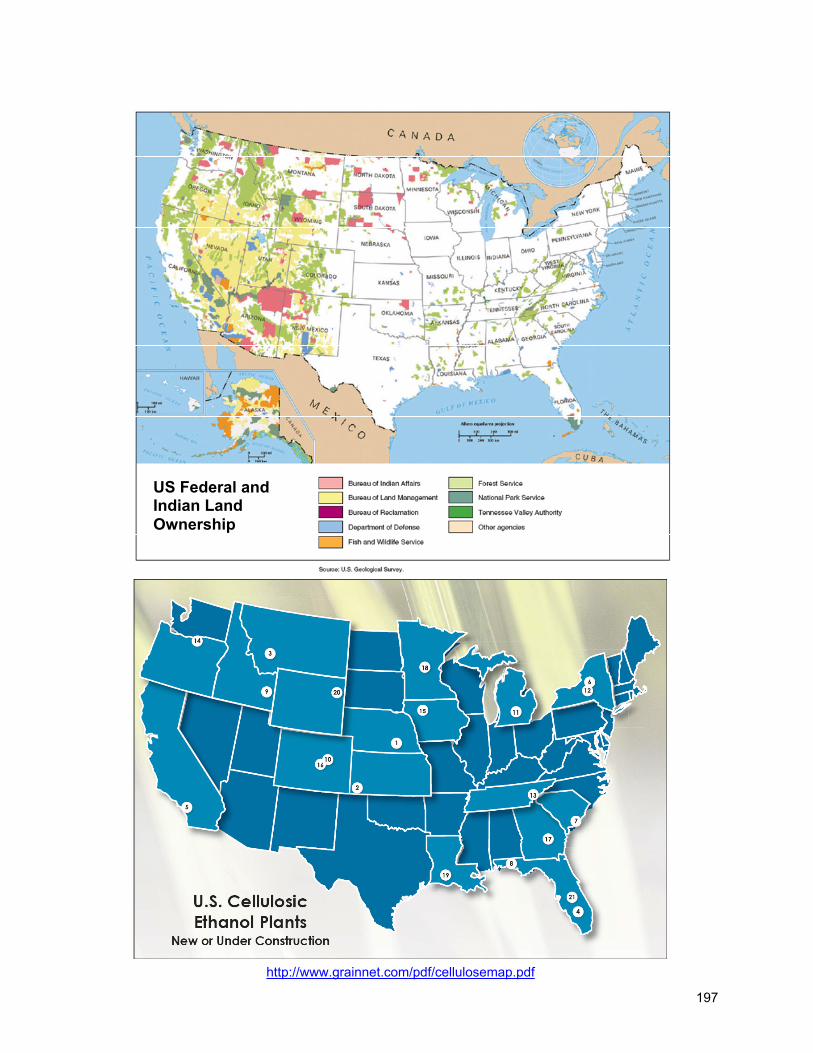
197
US Federal and Indian Land Ownership
http://www.grainnet.com/pdf/cellulosemap.pdf
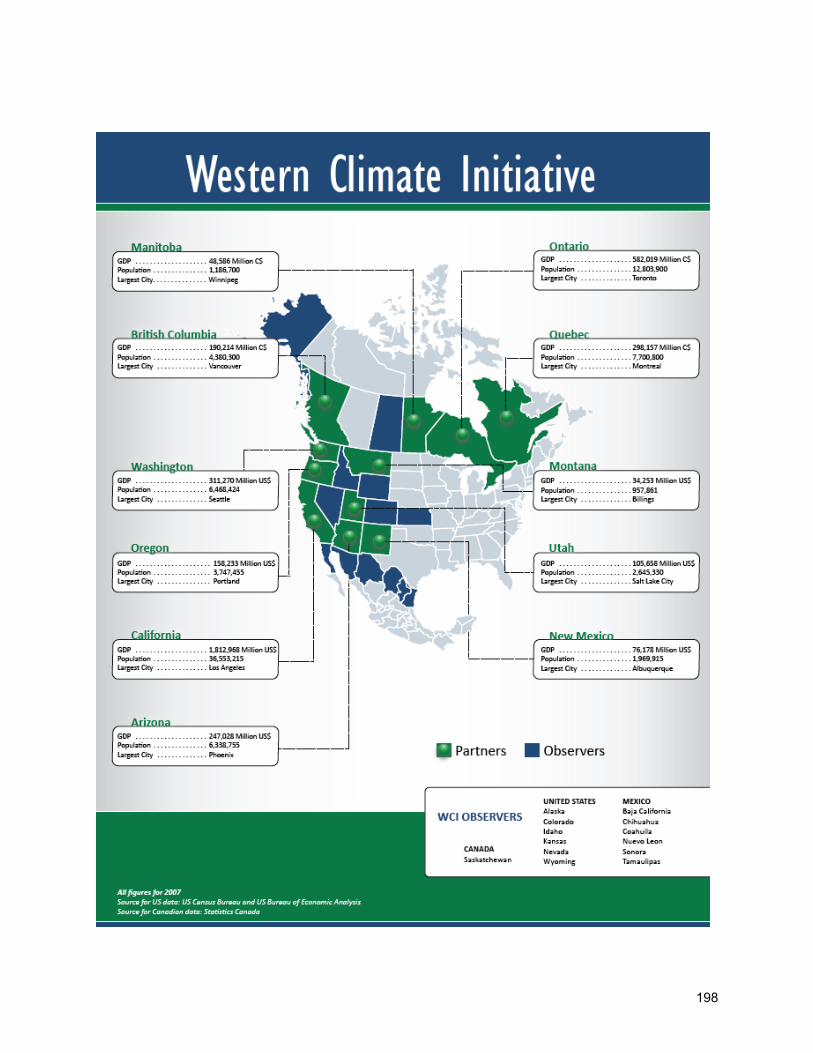
198
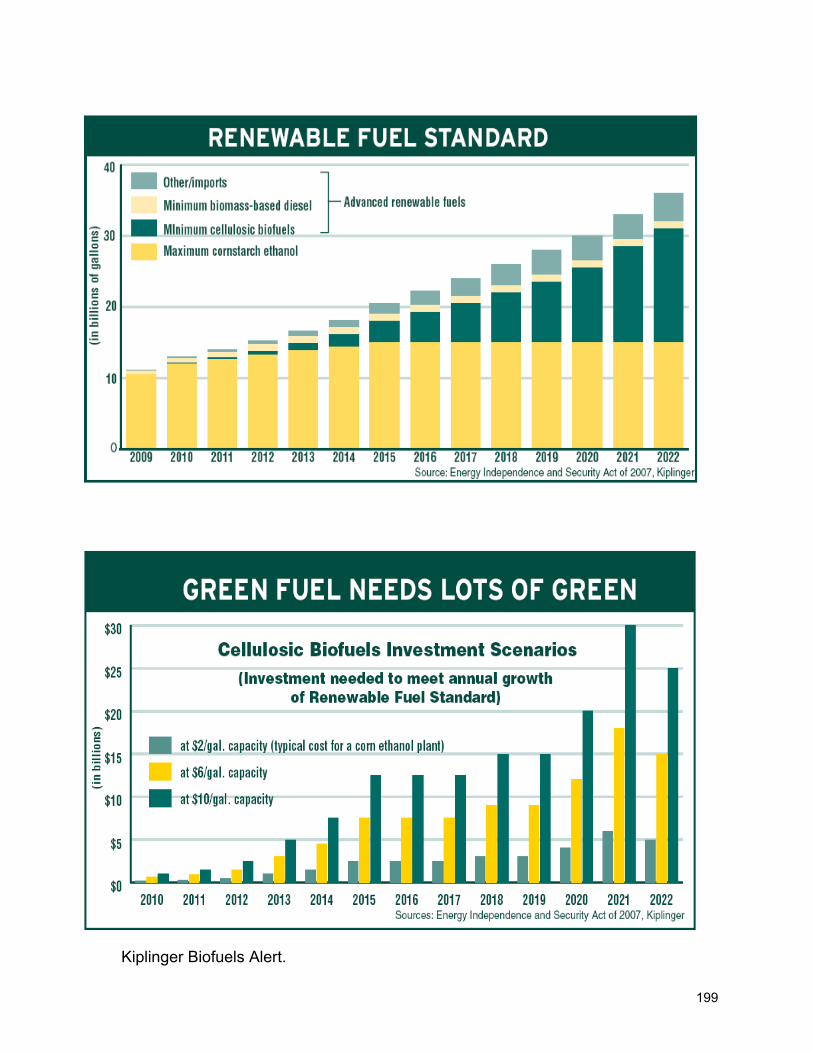
199
Kiplinger Biofuels Alert.
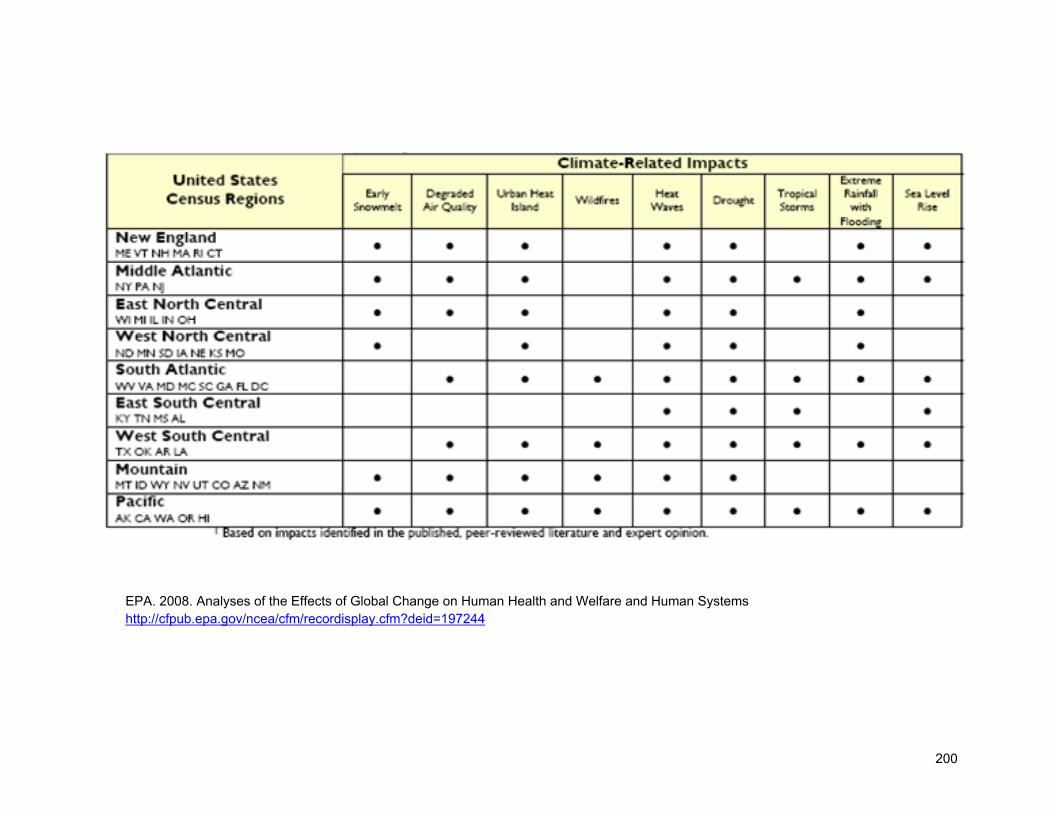
200
EPA. 2008. Analyses of the Effects of Global Change on Human Health and Welfare and Human Systems http://cfpub.epa.gov/ncea/cfm/recordisplay.cfm?deid=197244
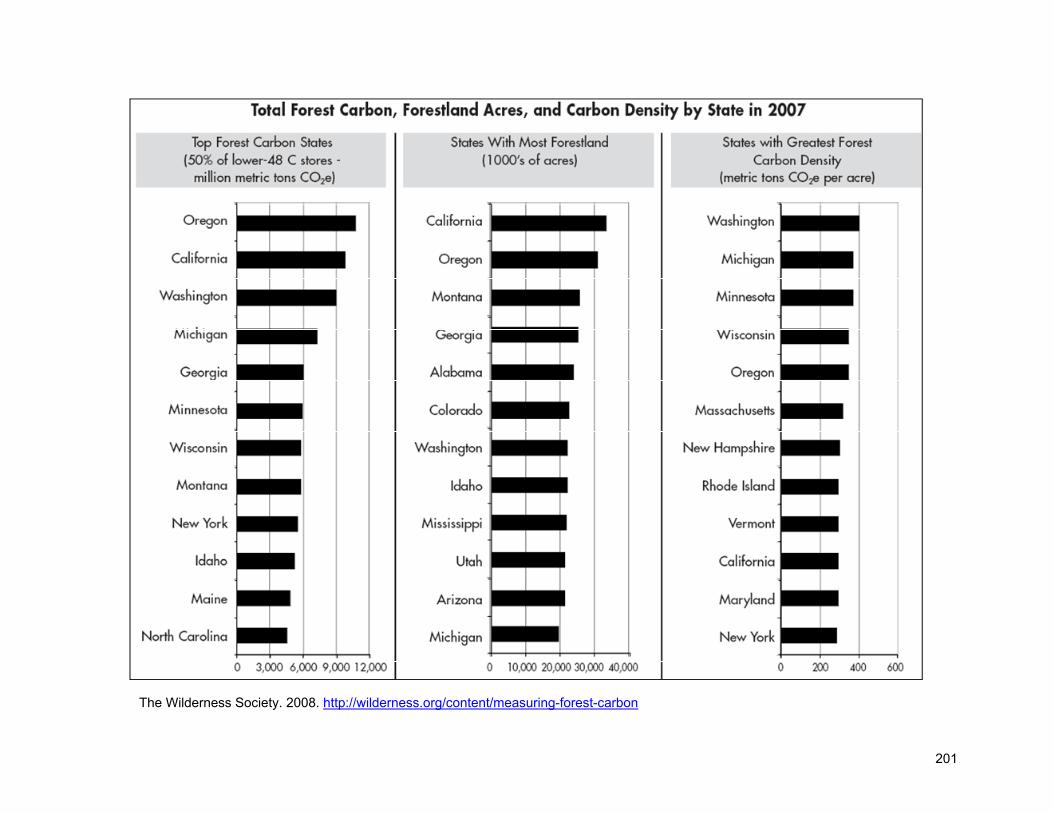
201
The Wilderness Society. 2008. http://wilderness.org/content/measuring-forest-carbon
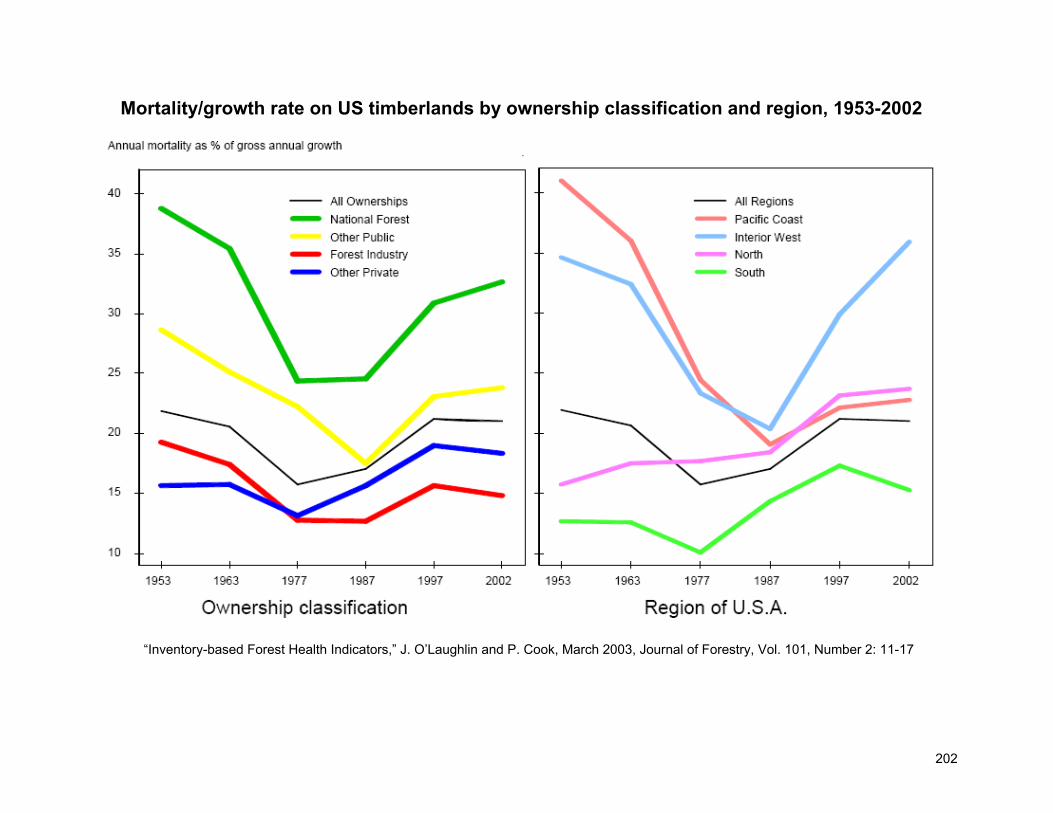
202
Mortality/growth rate on US timberlands by ownership classification and region, 1953-2002
“Inventory-based Forest Health Indicators,” J. O’Laughlin and P. Cook, March 2003, Journal of Forestry, Vol. 101, Number 2: 11-17
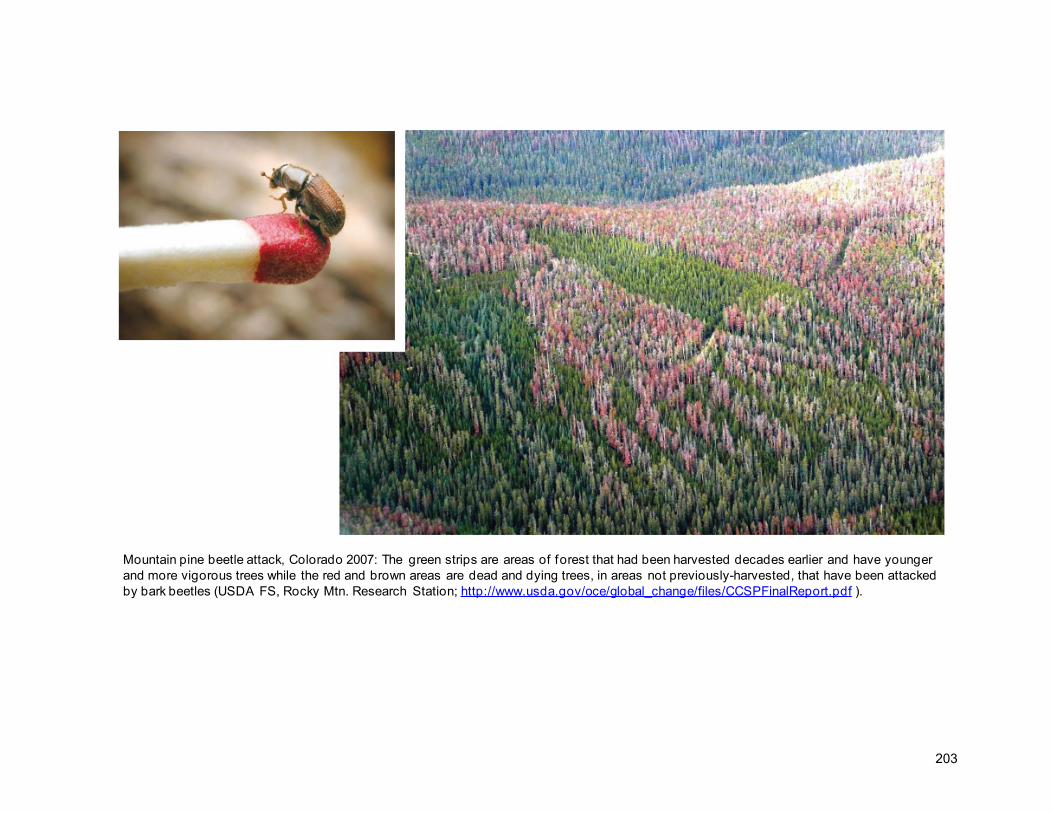
203
Mountain pine beetle attack, Colorado 2007: The green strips are areas of forest that had been harvested decades earlier and have younger and more vigorous trees while the red and brown areas are dead and dying trees, in areas not previously-harvested, that have been attacked by bark beetles (USDA FS, Rocky Mtn. Research Station; http://www.usda.gov/oce/global_change/files/CCSPFinalReport.pdf ).
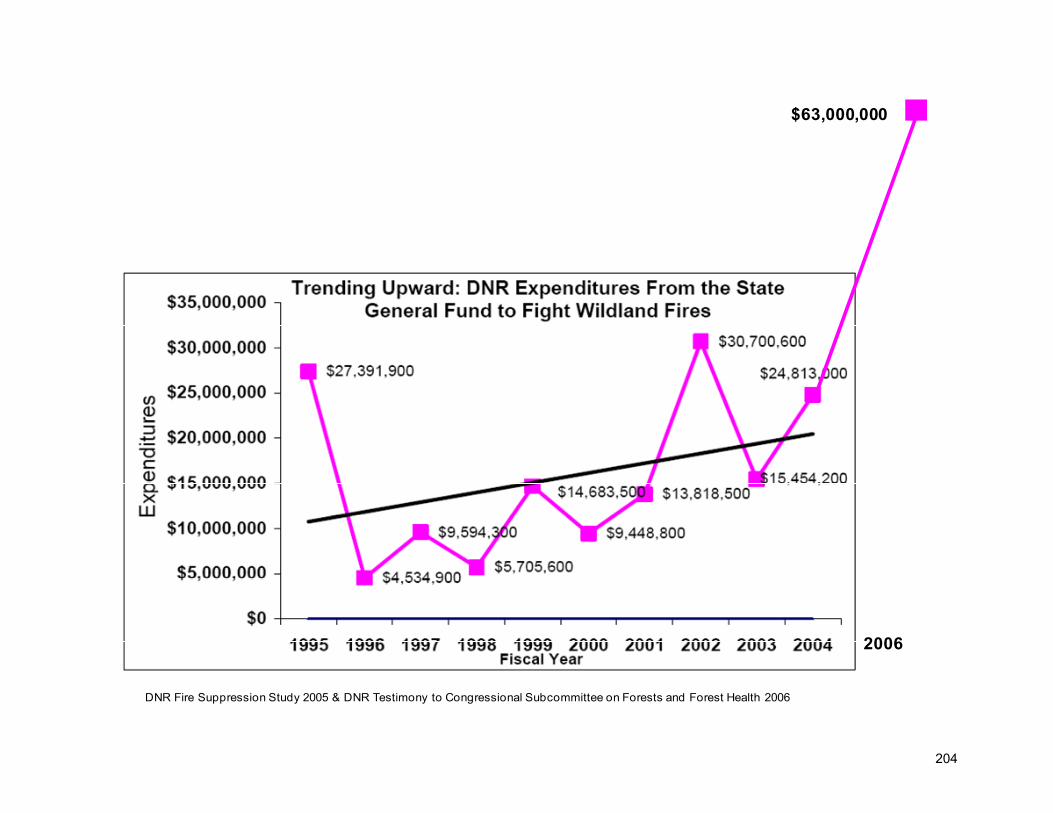
204
2006
$63,000,000
DNR Fire Suppression Study 2005 & DNR Testimony to Congressional Subcommittee on Forests and Forest Health 2006
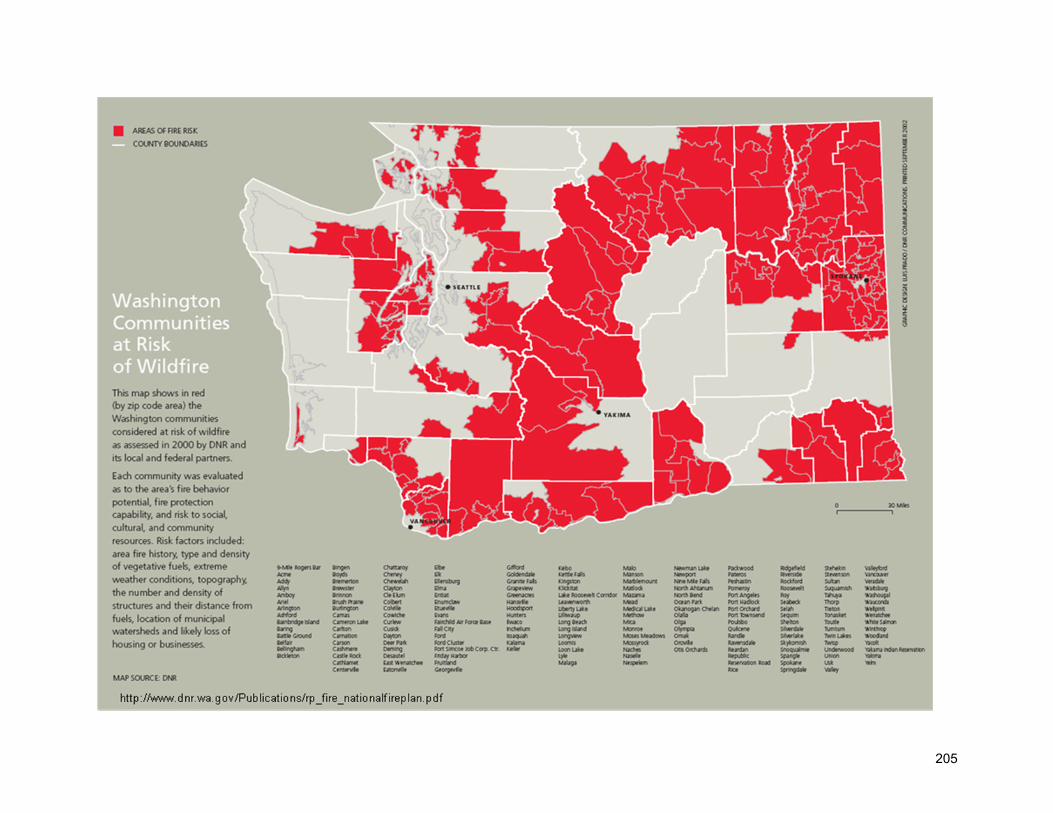
205
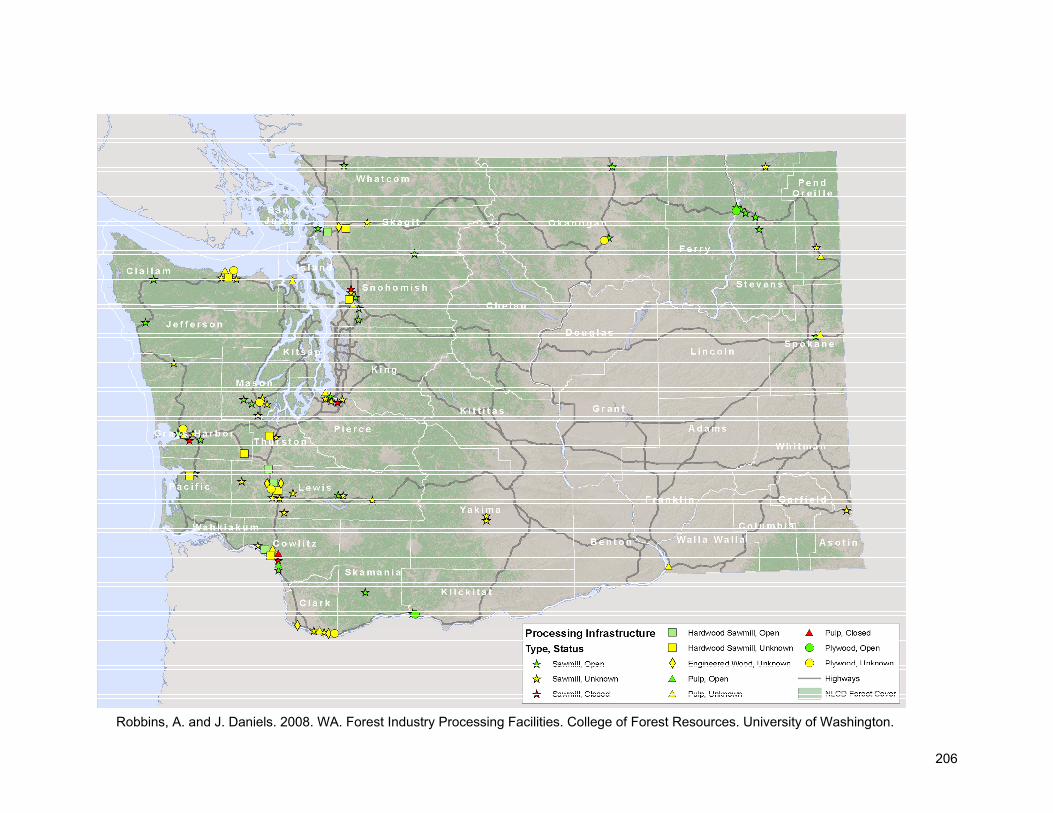
206
Robbins, A. and J. Daniels. 2008. WA. Forest Industry Processing Facilities. College of Forest Resources. University of Washington.
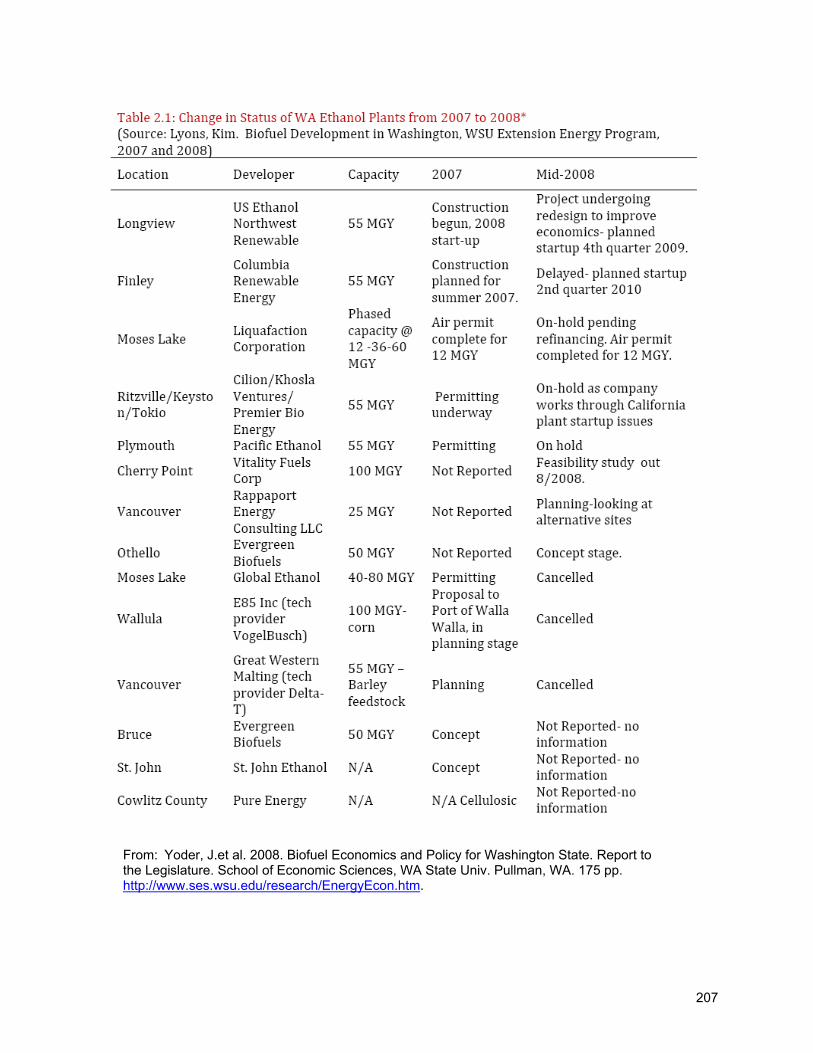
207
From: Yoder, J.et al. 2008. Biofuel Economics and Policy for Washington State. Report to the Legislature. School of Economic Sciences, WA State Univ. Pullman, WA. 175 pp. http://www.ses.wsu.edu/research/EnergyEcon.htm.